the Creative Commons Attribution 4.0 License.
the Creative Commons Attribution 4.0 License.
 | 30 Sep 2022
LUCAS cover photos 2006–2018 over the EU: 874 646 spatially distributed geo-tagged close-up photos with land cover and plant species label
Raphaël d'Andrimont
Momchil Yordanov
Laura Martinez-Sanchez
Peter Haub
Oliver Buck
Carsten Haub
Beatrice Eiselt
Marijn van der Velde
In the European Union, since 2006, a tri-annual survey has sampled land cover and land use information under the Land Use/Cover Area frame Survey (LUCAS). A total of 1 351 293 observations from 651 780 unique locations for 106 variables were collected during the five LUCAS surveys, including a total of 5.4 million landscape photos representing the observer view in the four cardinal directions as well as point photos showing the actual surveyed point. In addition to these previously published photos, additional LUCAS cover photos were recorded, showing a close-up view and thus more detail of the sampled tree, crop and plant species. Between 2006 and 2018, 875 661 LUCAS cover close-up photos were collected, showing the relevant land cover and plant species on the entire photo with the absence of any other elements of the landscape in the frame. Photos containing potential privacy content were identified following a two-stage deep learning anonymisation process, resulting in the removal of 346 photos before publication. This paper summarises the collection of LUCAS cover photos and the filtering for mandatory privacy issues and also provides links to download the data along with the photo metadata and cross-links to the corresponding LUCAS-harmonised survey data. Moreover, after presenting the final public and open dataset consisting of 874 646 photos, potential applications relying on recent advances in geo-spatial analysis and statistical learning, such as large-scale biodiversity monitoring, are discussed. The data are available on the JRC Open Data Catalogue: http://data.europa.eu/89h/c83906d7-1817-495f-b4ba-f2e4b8859d48 (European Commission, Joint Research Centre, 2022).
- Article
(6406 KB) - Full-text XML
- BibTeX
- EndNote


In the European Union (EU), a tri-annually surveyed sample of land cover and land use has been collected since 2006 under the Land Use/Cover Area frame Survey (LUCAS) (Gallego and Delincé, 2010). LUCAS was carried out in 2006, 2009, 2012, 2015, and 2018 and is planned for 2022. During the five campaigns already carried out, a total of 1 351 293 point surveys at 651 780 unique locations were performed along with 5.4 million landscape photos. On each of these surveyed points, depending on the year, observations of up to 109 variables were recorded. The combination of the information collected in the five LUCAS surveys has resulted in the most comprehensive in situ database on land cover and land use in the EU (d’Andrimont et al., 2020).
In addition to the landscape and point photos already published (d’Andrimont et al., 2020), other specific photos were taken, including the LUCAS cover photos, which offer a close-up view of the land cover on which plant species should be identifiable. These photos were not taken to be published but to support simultaneous visual quality control alongside the field survey. Between 2006 and 2018, 875 661 of such LUCAS cover photos were collected. However, as this specific LUCAS cover photo dataset was not designed as an output of the survey, it has not been published yet.
The objective of this paper is to make this rich dataset available in analysis-ready form to the research community for various use cases. The prerequisite for using the LUCAS cover data and photos in other applications (e.g. biodiversity monitoring or machine readable calibration sources for EO) requires organising, curating, documenting and publishing the photos following FAIR (findability, accessibility, interoperability, and reuse) principles (Wilkinson et al., 2016). This paper summarises the collection of LUCAS cover photos and the filtering for mandatory privacy issues and also provides links to download the data along with the photo metadata and cross-links to the corresponding LUCAS-harmonised survey data.
LUCAS is a two-phase sample survey. The first sample is a systematic selection of points on a grid with a 2 km spacing in eastings and northings, covering the whole EU territory (Gallego and Bamps, 2008). Currently, it includes around 1.1 million points (Fig. 1) and is referred to as the master sample. Each point of the first-phase sample is classified into one of 10 land‐cover classes via visual interpretation of ortho-photos or satellite images (ESTAT, 2018). Then a stratified sample is selected to obtain the desired statistically representative spatial distribution of sampled land cover classes according to the first-phase visual interpretation (European Commission et al., 2018).
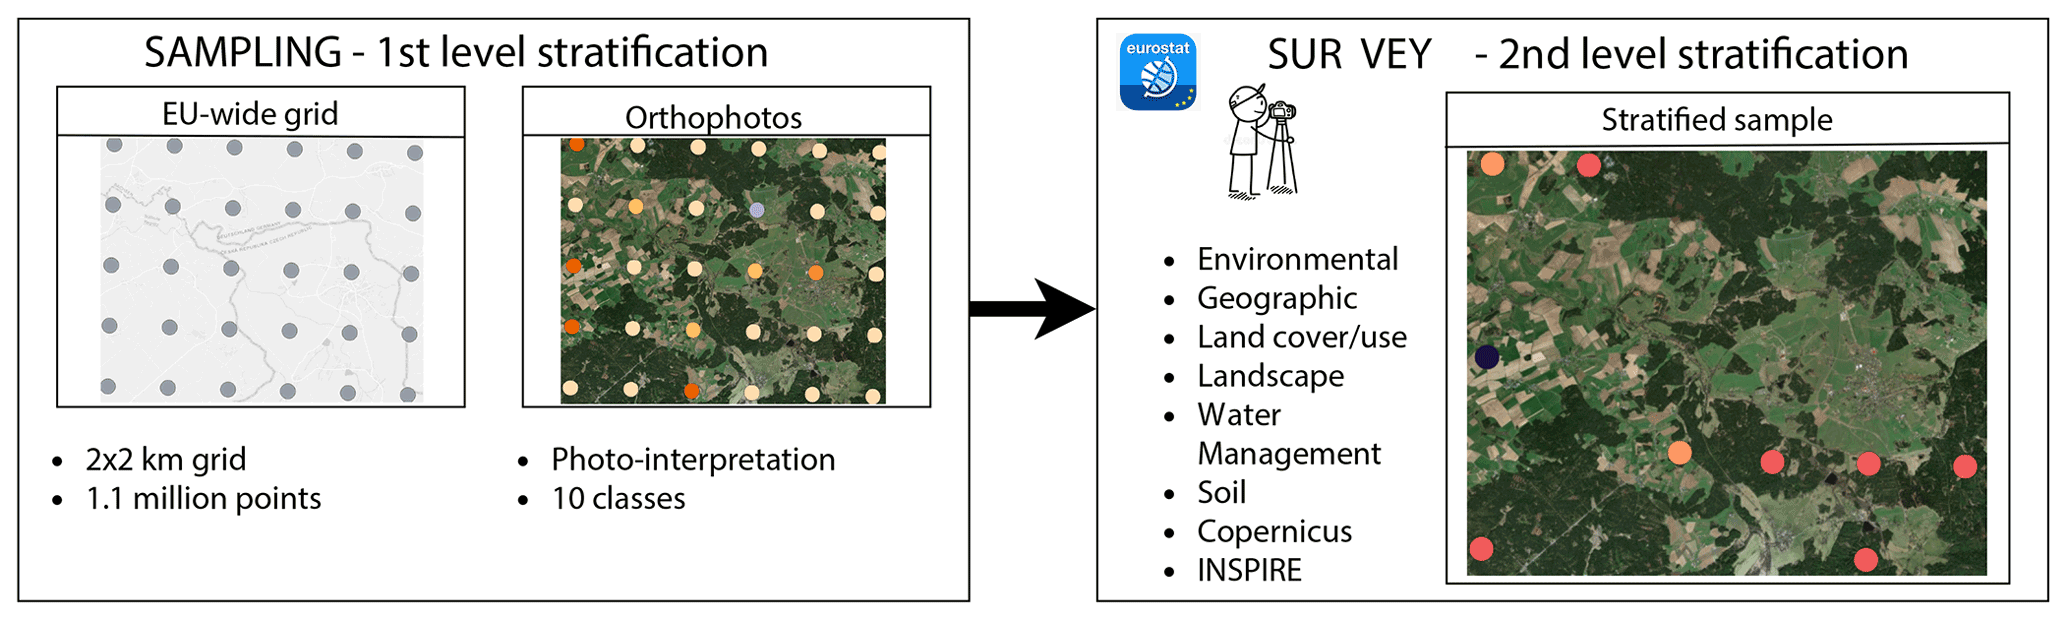
Figure 1Schematic overview of the LUCAS and harmonisation methodologies. This illustrates the sampling at the basis of the production of the LUCAS primary data. LUCAS cover photos are close-up photos originally collected to support the surveyors' interpretation and control.
As described in Eurostat (2018), LUCAS surveyors document their observations in several sets of photos. The type of photo to be taken depends on the type of observation, the land cover, the presence or absence of water management, the need to collect a soil sample, and the need to document conflicting cases. Photos are taken for each observed in situ point covering the actual point (P) and the four cardinal direction views of north, east, south, and west (N, E, S, W) (examples of these are the five first photos from left to right in Fig. 2). This P, N, E, S, W photo dataset corresponds to 5 440 459 photos for the five surveys. These photos are publicly available for download along with an EXIF database in d’Andrimont et al. (2020), containing image metadata and an explanation as to the difference between landscape and point photos. The background image is from Map data © Google 2020.
However, as described in Eurostat (2018), other non-publicly available photos were taken. Among these photos, the LUCAS cover (C) photos were collected mainly from croplands (class B), woodlands (class C), shrublands (class D), and grasslands (class E). The aim of these cover photos is to enable the identification of the recorded crops and plants during simultaneous quality controls in the office by means of the photo on screen (Eurostat, 2018). The cover photo should be taken at a close distance, so that the structure of, for example, leaves, barks, flowers or fruits can be clearly seen. See an example in Fig. 2 on the right.
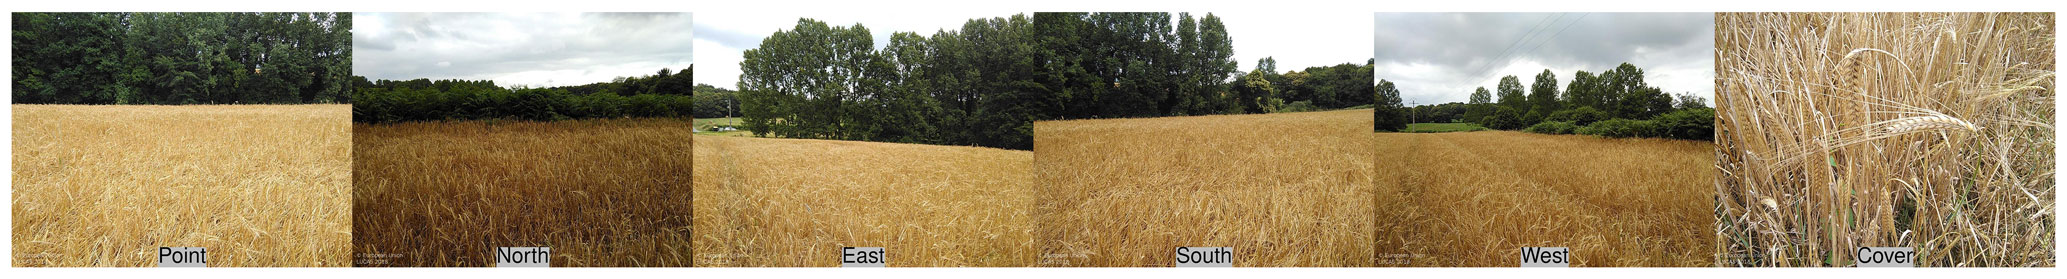
Figure 2Example of LUCAS photos collected on a LUCAS point located in France in a barley field (lat: 48.1645, long: −2.4970). For each LUCAS point, photos are collected for north, east, south, west, point, and cover.
The LUCAS cover photos were obtained from the Eurostat archive via portable hard drives. The photos' metadata were then extracted with the ExifTool (v 12.10) (Harvey and Körtner, 2016), resulting in a database of photos that was compared for completeness with the survey data records. The EXIF metadata were extracted for 82 fields (Table 1). Finally, the LUCAS cover EXIF table was joined to the LUCAS-harmonised database to provide all survey information into one unique table.
Table 1The LUCAS cover data set is provided with two tables: the EXIF table, with 82 metadata attributes extracted from the photos, and the LUCAS-harmonised table containing 121 attributes.
5.1 Check for the presence of privacy content and manual anonymisation
According to the guidelines of the LUCAS project, it must be ensured that no private content is included in the published images. This applies in particular to vehicle registration plates and recognisable persons and faces, which have to be blurred or removed in the photos. Since this anonymisation requirement applies equally to the previously unpublished cover photos, all cover photos must be checked for the presence of private content.
In order to fulfil this essential quality requirement for the image data, the checking of the images was carried out in a purely manual capacity in previous LUCAS campaigns via a visual inspection of the photos. To reduce the manual effort and to improve the anonymisation quality, an automated procedure was used for the first time to support the image anonymisation process in the 2018 LUCAS campaign.
The method developed during the 2018 survey is based on the highly efficient convolution neural network (CNN) YOLO (Redmon and Farhadi, 2018). This neural network enables the recognition of a large number of different object classes as well as multiple objects per image at a very high speed.
In parallel to the established manual control procedure, the CNN approach was independently tested. It confirmed that YOLO ideally fulfils the basic requirements for the task of pre-classification and can be used as a binary classifier with the classes (1) anonymisation potentially necessary and (2) anonymisation not necessary.
Essential for such an approach is the guarantee of a low false negative rate for the automated binary pre-classification by the CNN, i.e. the acceptance of a low specificity during the first step of this two-step procedure. This was achieved by a suitable choice of object classes from the pool of all available classes and the use of a suitable detection threshold (0.1). The subsequent manual control in the second step ensures an almost vanishing false positive rate and thus a high sensitivity (true positive rate, recall or hit rate).
Thus, this two-step approach maximises specificity and sensitivity and achieves a very high overall accuracy of image anonymisation. The cover photos analysed in this study do not differ technically from the previously anonymised LUCAS images, and thus the described procedure could be applied directly to the cover photos without modification.
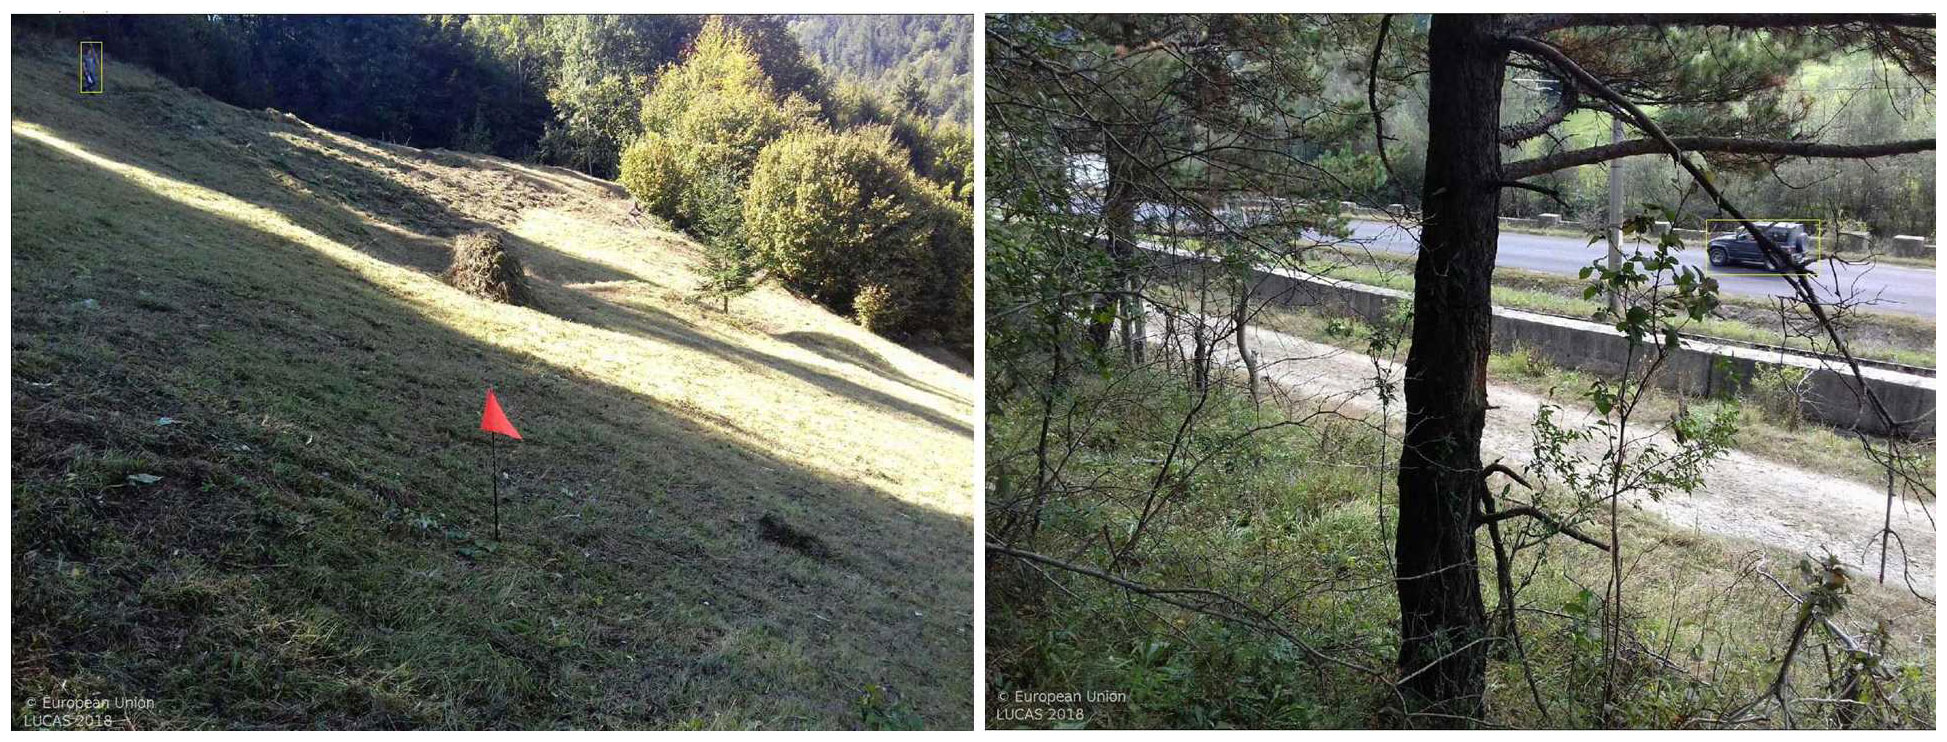
Figure 3Examples showing correct identification of potential anonymisation elements (human person left and car right) that needed no anonymisation due to lacking face or number plate recognition.
5.2 Results of the anonymisation check
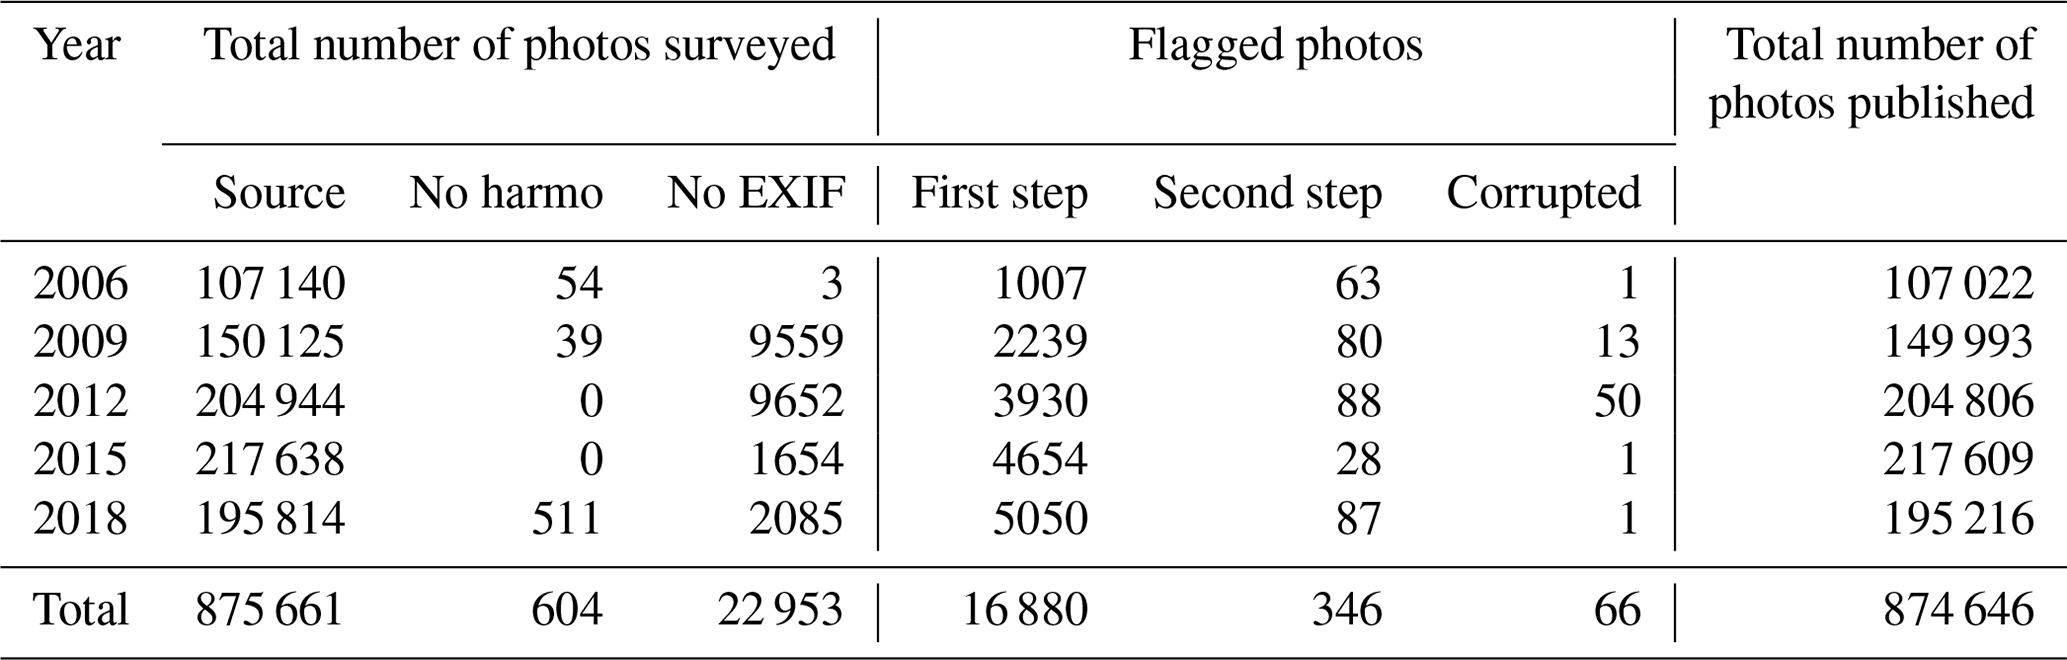
This two-step anonymisation approach from the 2018 campaign was also applied to the LUCAS cover photos from the 2006–2018 campaigns. Table 2 provides an overview of the photo anonymisation checks for all LUCAS campaigns. In total, 875 661 were processed, out of which 66 were corrupted, meaning they failed to ingest. In turn, 16 880 photos or 1.92 % were flagged by the CNN as containing elements with potential anonymisation need. Finally, a total of 346 from the previously flagged set were manually short-listed as actually containing elements worth anonymising for. Added to these are the 604 that did not have a match within the LUCAS-harmonised product (d’Andrimont et al., 2020). The difference between columns 5 (i.e. first step) and 6 (i.e. second step) of Table 2 shows that the number of photos containing potential non-anonymised elements was reduced by ca. 97.5–99 % for each campaign, i.e. roughly only 1–2.5 % of the photos have to be checked visually. Still, within this reduced amount, most photos will not contain elements that need to be anonymised. The main known reasons why photos are marked as containing potential non-anonymised elements while not containing any are listed below:
-
Photo is already anonymised. During the LUCAS campaigns, strict anonymisation procedures were in place to cover persons and car plates with white bars. Despite this, the neural network will detect a car as a car, even if its car plate is already correctly anonymised, i.e. covered with a white bar.
-
Photo shows only very small elements. Very small elements – i.e. cars or persons in the background of an image – that are not recognisable do not have to be anonymised. Nevertheless, the neural network will detect these small cars, trucks, persons, etc. and thus mark the photos as containing potential non-anonymised elements.
-
Photo shows only a non-recognisable part of a car or person. The neural network detects objects even if they are only partially visible. It therefore marks photos as containing potential non-anonymised objects even if only a hand, an arm or a car door, which does not have to be anonymised, is visible.
-
Wrongly classified objects. The neural network wrongly classified images as containing a certain element that they did not, e.g. an animal or plant, classified as a person. The priority of the classification process was to miss no (or as few as possible) non-anonymised objects. Therefore, the object threshold score was set to a very low value of 0.1 to avoid missing any non-anonymised elements. Albeit ensuring this, the very low threshold score also delivers wrongly classified objects.
In total, 1016 images were removed from the original source set, including the ones from columns “no harmo”, “second step”, and “corrupted”.
Table 2Results of the photo screening with potential anonymisation issues. The total number of LUCAS cover images on disk is specified by the term source; no harmo indicates LUCAS cover images on disk that do not have a corresponding row in the LUCAS-harmonised product (d’Andrimont et al., 2020); no EXIF is for images on disk that do not have any EXIF information encoded; first step are images flagged by the YOLO network; second step are images flagged manually from the YOLO set as having some element that is subject to anonymisation; corrupted are the images that have a visual distortion that makes the image unusable; the final column shows the images per year that are part of the published set.
A number of changes had to be done to the filename and directory tree in order to harmonise both between the survey years. Namely, certain years had listed countries with a different country code (e.g. “GR” instead of “EL” or “GB” instead of “UK”), filenames had used an upper or a lowercase for either the “c” to indicate the “cover” status of the LUCAS image, or there were differences in the “.jpg” extension. To coherently catalogue this, all images were renamed to fit the convention “LUCASYYYY_PointID_Cover.jpg”, where YYYY is a placeholder for the year of the survey. Additionally, watermarks were added to the 2009 and 2012 images in cases where these were lacking.
The distribution of LUCAS cover photos per land cover and per year is shown in Fig. 5. The distribution per country is presented in Table 3. For each survey year, a number ranging from 107 022 (in 2006) to 217 609 (in 2015) were collected, totalling 874 666 for the five surveys. The sampling of LUCAS aims to revisit some of the points in successive surveys, resulting thus in point revisits for each point surveyed ranging from 1 to 5, as shown in Fig. 4. In Fig. 6, one random photo example is shown for each land cover class.
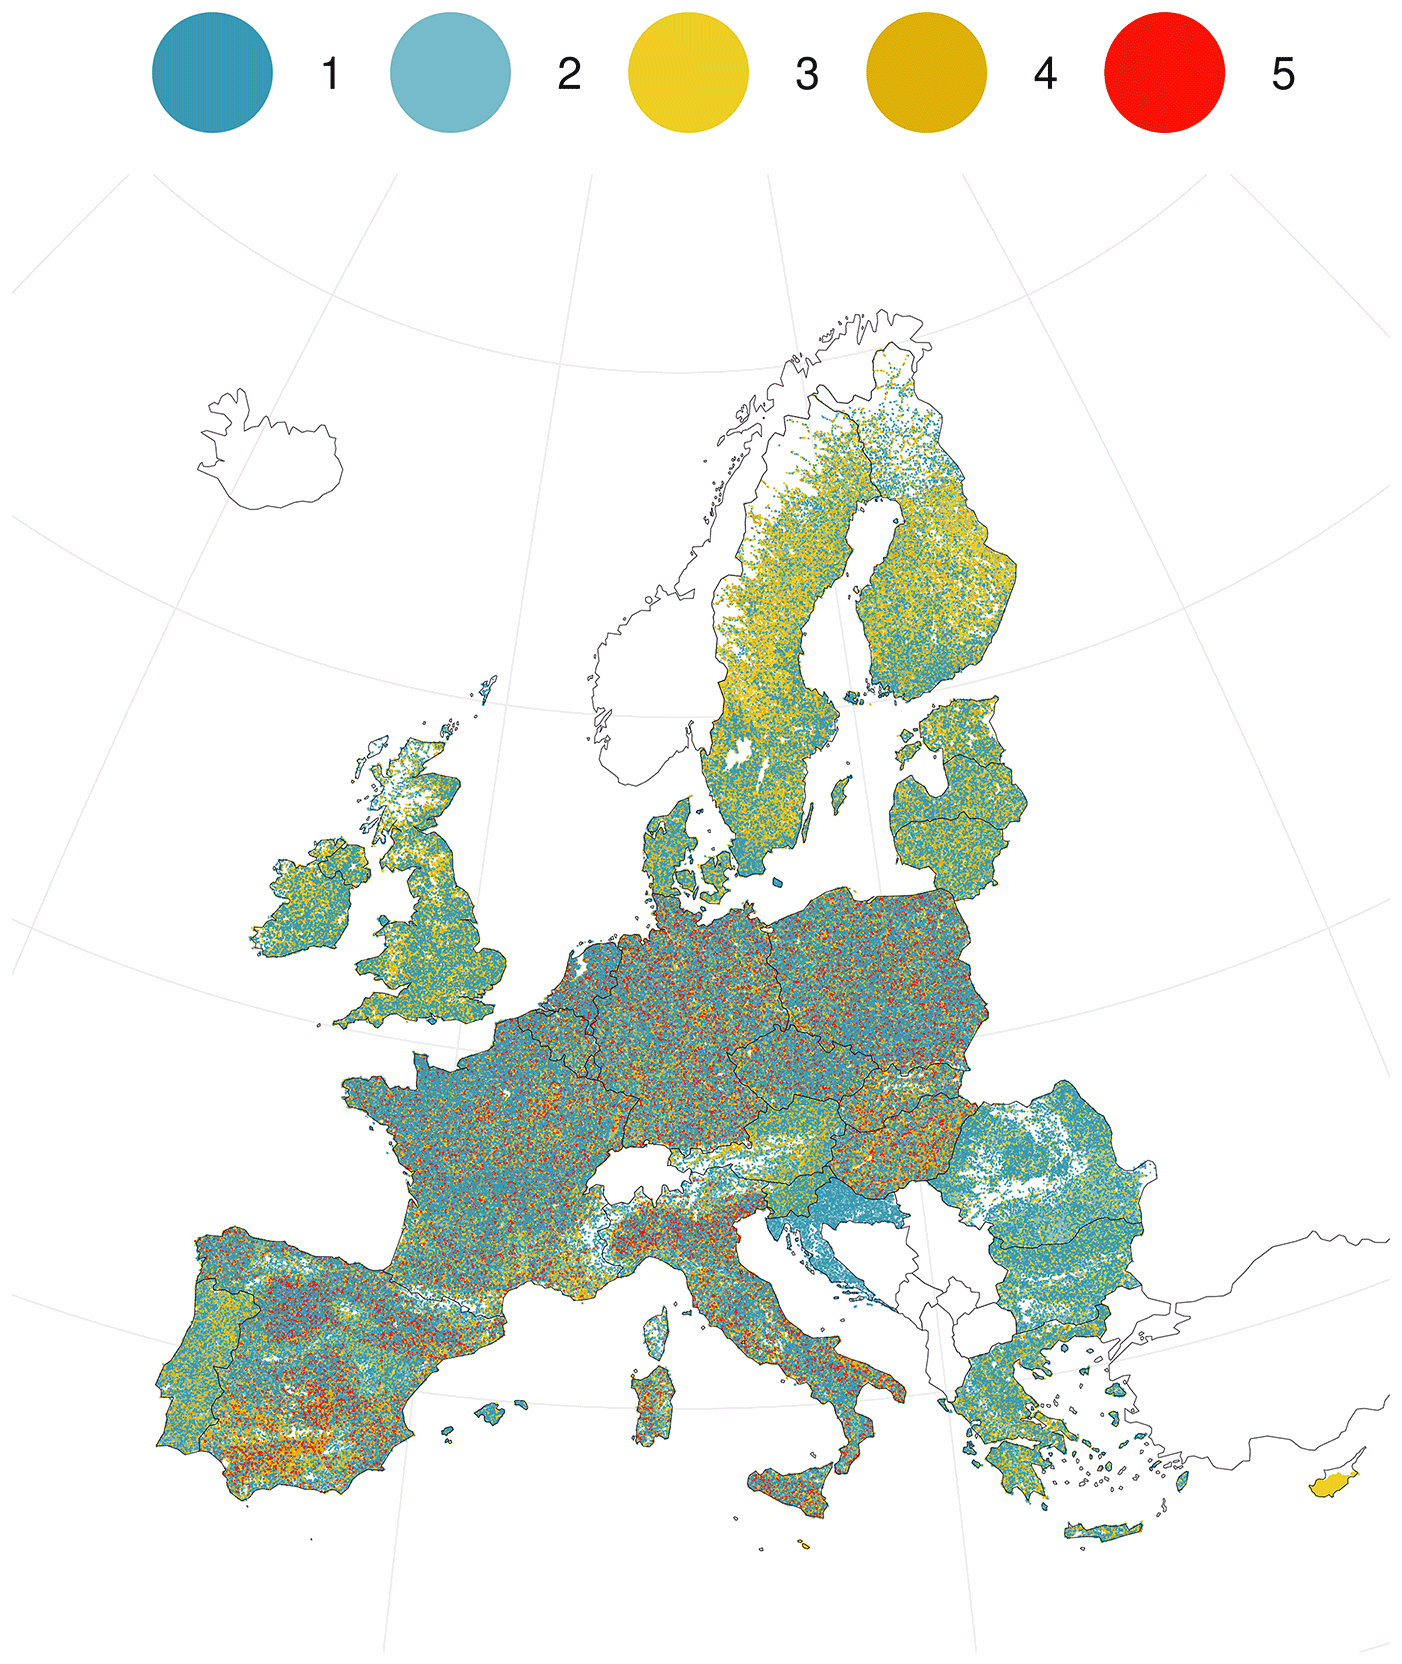
Figure 4LUCAS cover photos' geographical distribution and number of (re)visits to each survey over the five surveys between 2006 and 2018. Visits range from 1 to 5. Map projection: EPSG 3035.
Table 3Number of LUCAS cover photos per country and per year.
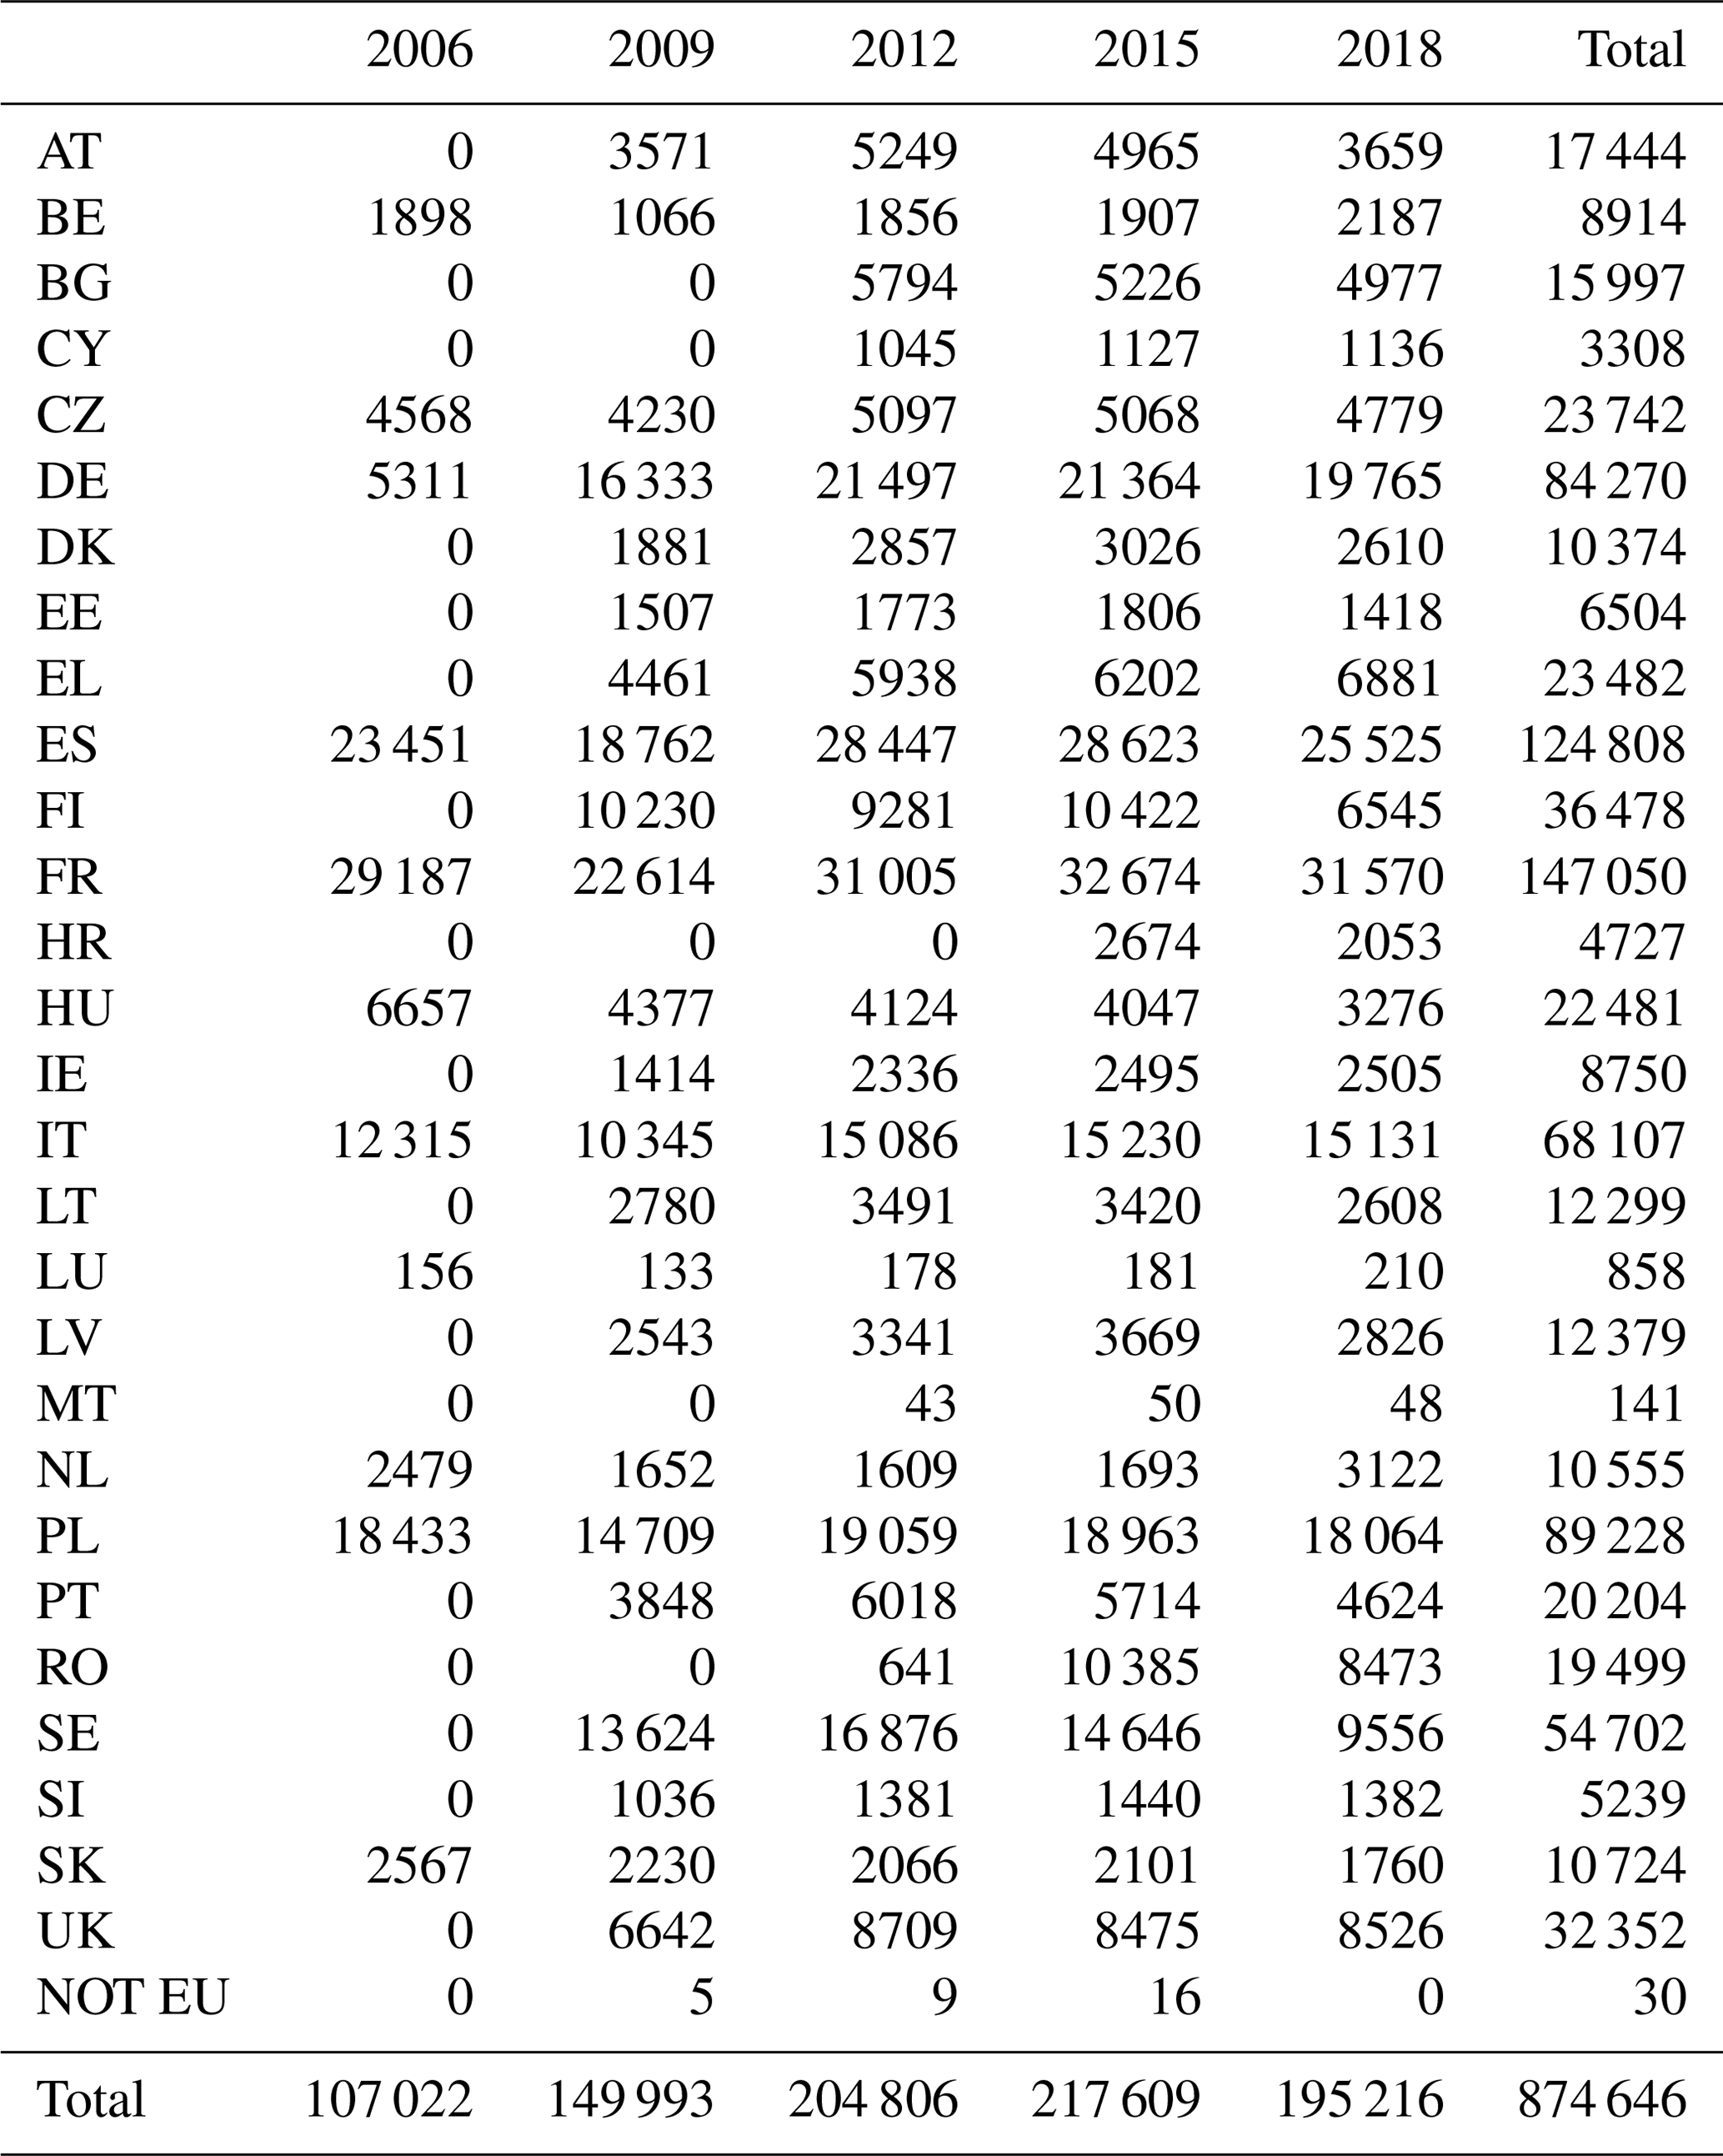
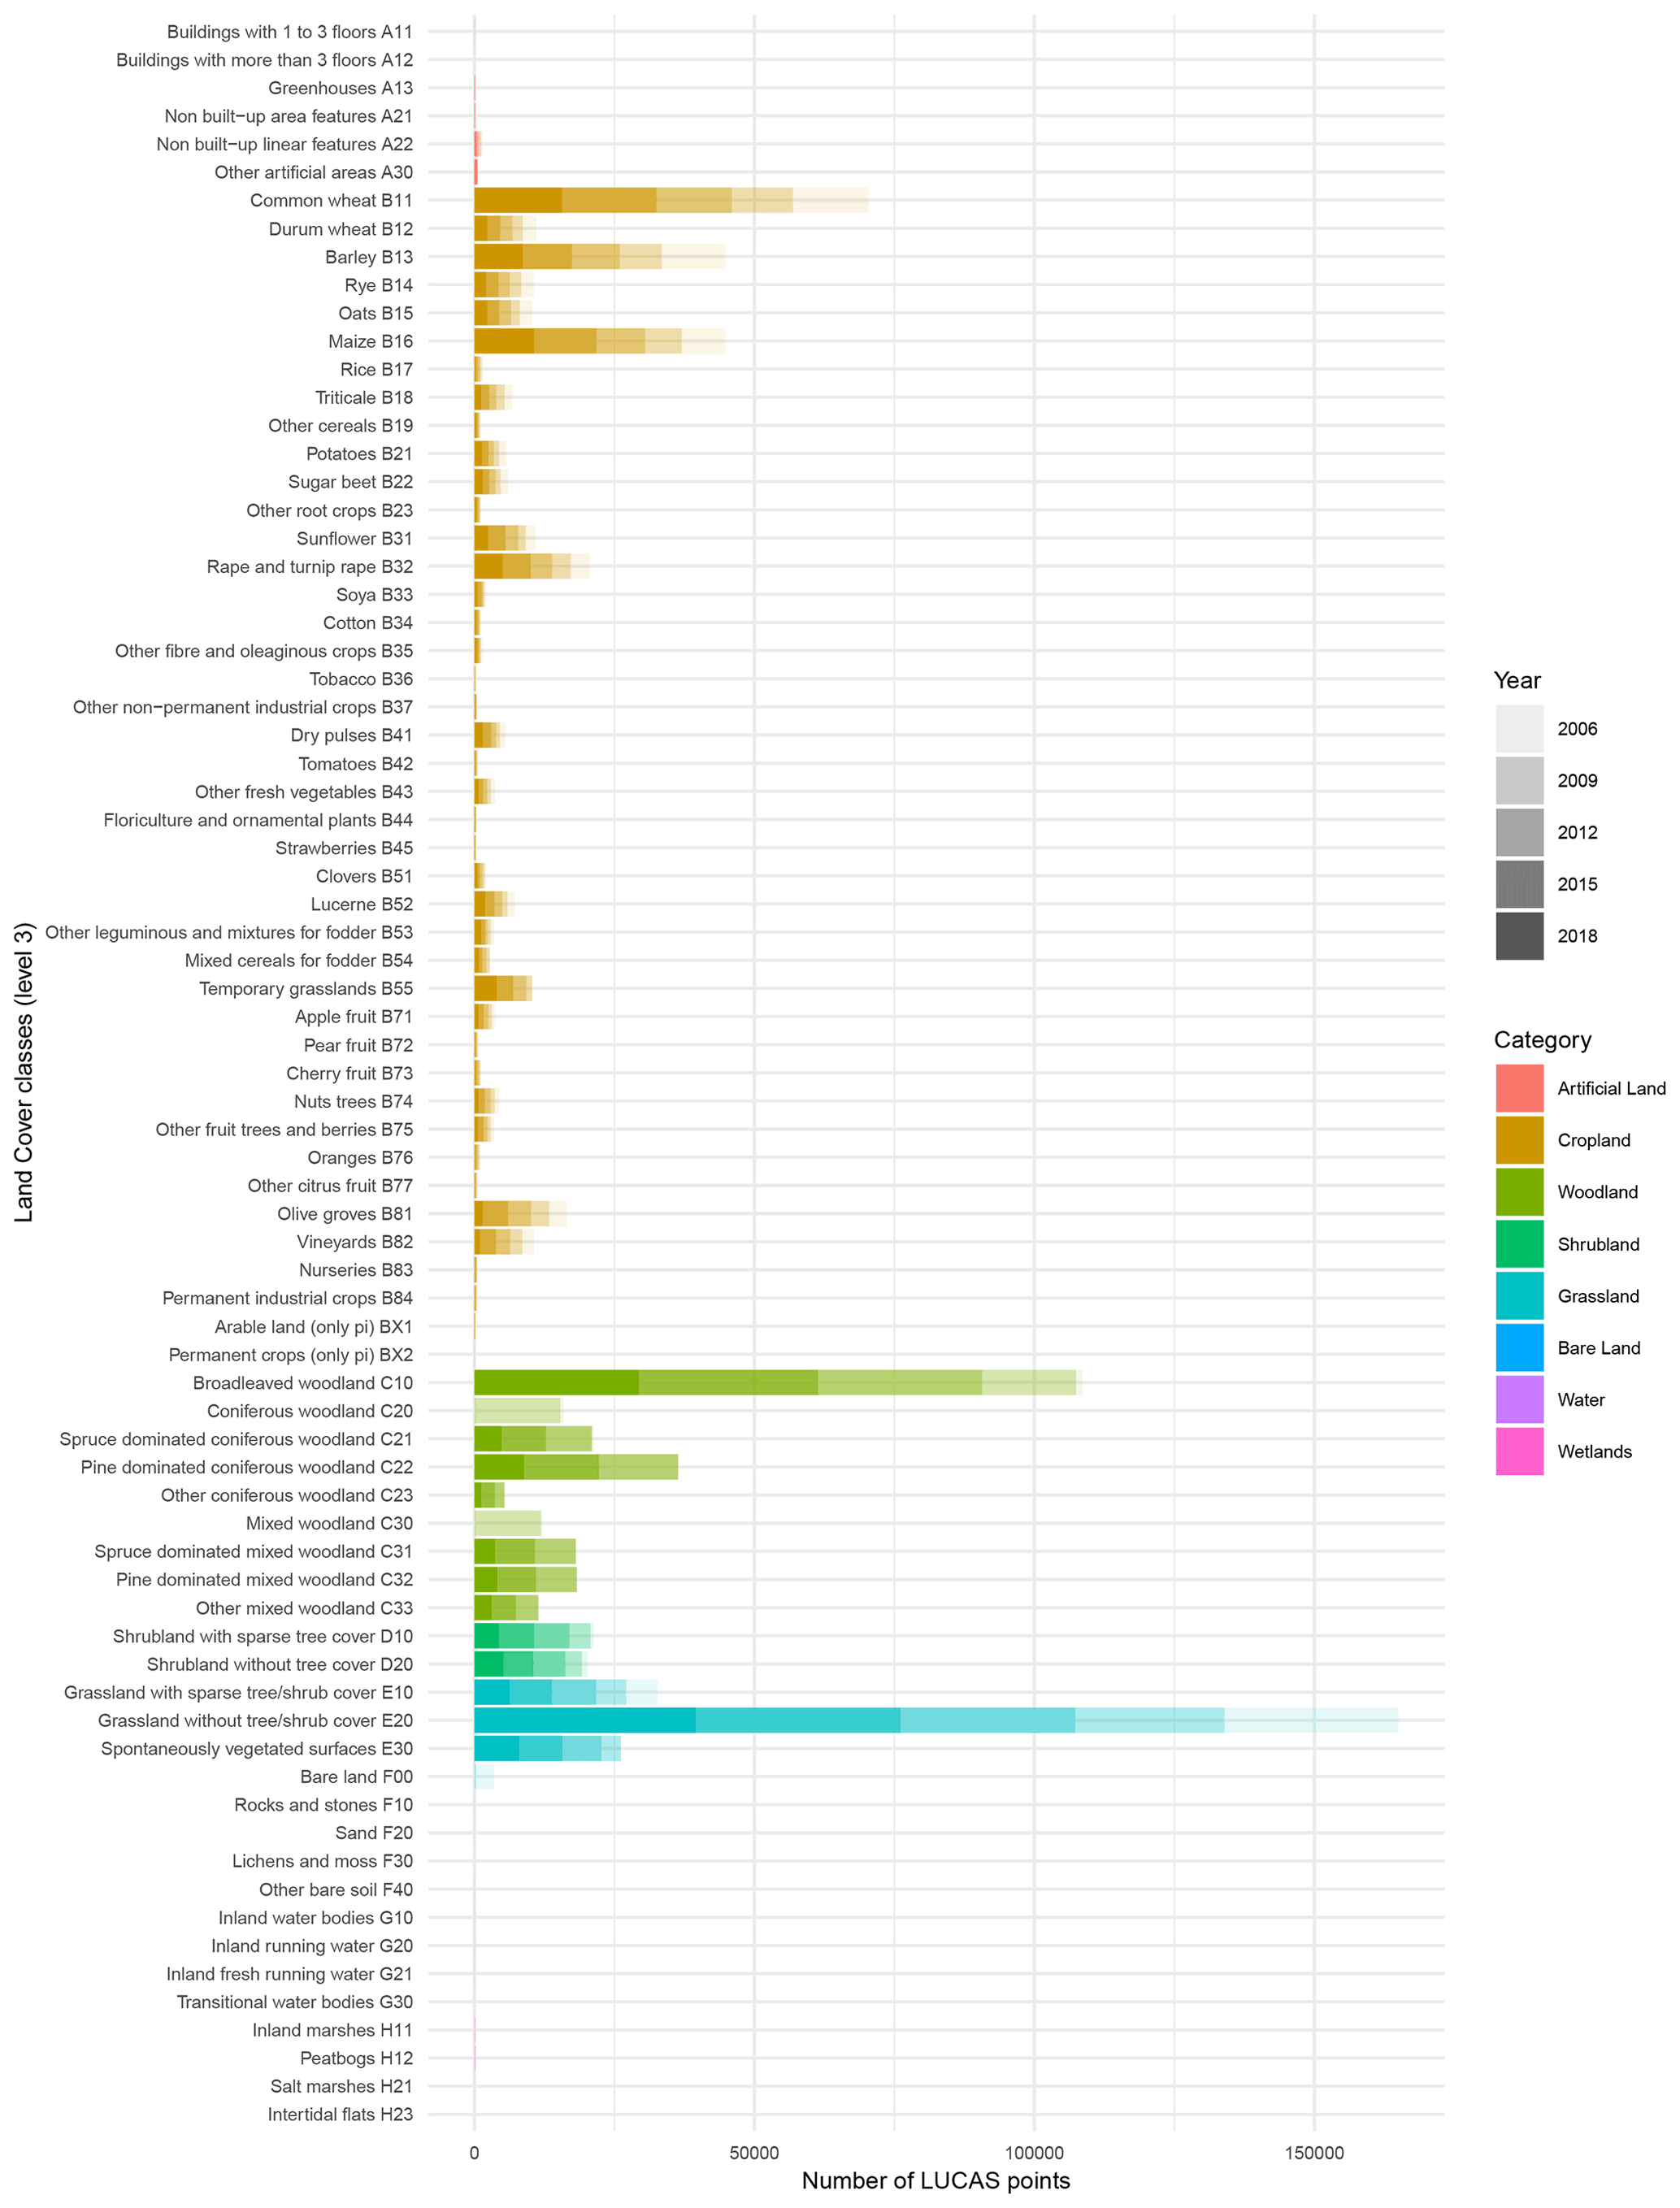
Figure 5Distribution of LUCAS cover photos in land cover classes in the multi-year harmonised LUCAS database. In cases where survey years are not present, please orientate oneself with reference to adjacent classes of the same colour. Counting for the distribution of each class begins at 2018 and ends with 2006 due to the relative abundance of 2018 in terms of classes compared to other years.
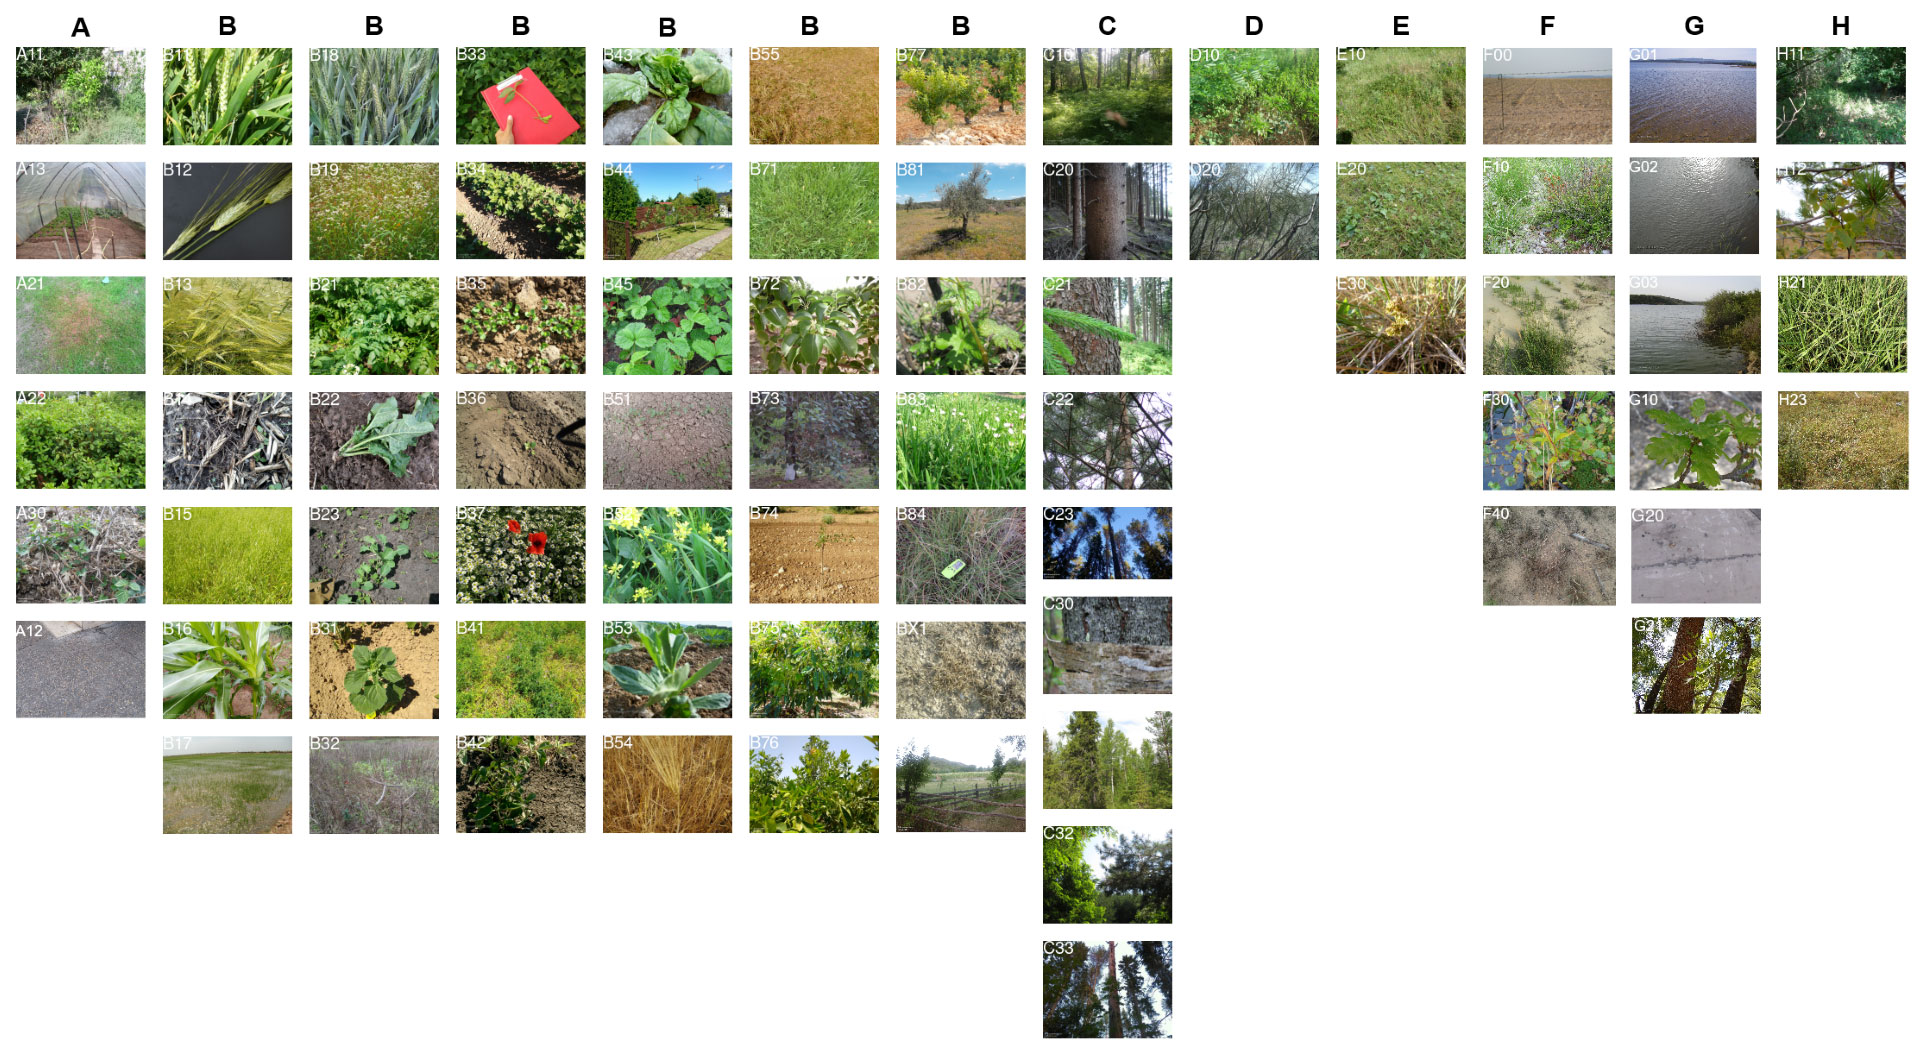
Several limitations inherent to the dataset are briefly discussed. The first limitation is linked to the survey protocol, which does not detail the field of view required to take the photos. Indeed, the instruction to the surveyor is to make sure the plant can be recognised on the picture, which is subjective to the surveyor. As illustrated in Fig. 6, the photos could be taken with a diversity of views: whole plant views, landscape views (sometimes with sky), plants with artificial background (red support), or plants with bare soil. Also, sometimes, the surveyor takes the plant from the soil, and the pictures thus contain the root system and vegetative organs. Future surveys could consider specifically collecting information on the view type. Applications that are dedicated to recognising plant species (e.g. Pl@ntNet) ask the surveyor to select the type of view as leaf, flower, fruit, bark, whole plant, or other (Goëau et al., 2013).
Another limitation is the lack of EXIF information for some photos, as highlighted in Table 2. Also, the quality of the EXIF data collected, when available, depends on the quality of the sensors and its calibration. Standardising the type of sensors used to collect the images would greatly facilitate this routine and the uptake of the data. Another option would be to hardcode some variables, such as looking direction from time of day and year and the angle of shadows when sunny, when possible.
The LUCAS cover dataset with systematically sampled geo-located observations and photos of crops, trees, shrubs, grasses, and other plants can be the source for different uses and drive the development of various applications. The specific advantages are (1) the sample design, where the regular systematic 2 km LUCAS grid ensures an exhaustive EU-wide coverage; (2) the observations were done over a period of 15 years, with several of the points having been revisited up to 5 times, providing a unique historical perspective; (3) the photos are annotated with a label following the LUCAS legend; and (4) while this label may not be precise enough for various applications, computer-vision-based methods could extract information from the image and enrich the label. Indeed, LUCAS has been designed to collect statistics about land use and land cover, and specific applications will have different needs. The precision of the legend is, for example, not sufficient for botanical applications that need species-level information on observed plants. However, the dataset could provide training data to build deep learning convolutional neural networks to recognise and classify trees, plants, and crop types along with their phenological stages on photos, such as in d’Andrimont et al. (2022b).
Indeed, recent advances in combining photo sources from citizens and with those from experts in combination with computer vision are simultaneously enabling species identification and the gathering of occurrence data (e.g. Pl@ntNet (Goëau et al., 2018), iNaturalist (Nugent, 2018), or Flora Incognita (Mäder et al., 2021)). The collection of such geo-located plant species occurrences contributes to collaborative data platforms such as the Global Biodiversity Information Facility (GBIF). This can be complementary to long-term and high-quality but resource-intensive biodiversity assessments by professional botanists (Miller-Rushing et al., 2012). The photos in this new LUCAS cover photo dataset could be ingested in such applications. In fact, the LUCAS cover photos of crops (letter group “B”) are currently used to generate a specific application within Pl@ntNet to recognise crops.
This section describes the dataset provided along with this article, including the tables and photos. The data are available at https://jeodpp.jrc.ec.europa.eu/ftp/jrc-opendata/LUCAS/LUCAS_COVER/, (d’Andrimont et al., 2022a).
- 1.
Photos. The 874 646 LUCAS cover photos are available on the FTP, downloadable here: https://jeodpp.jrc.ec.europa.eu/ftp/jrc-opendata/LUCAS/LUCAS_COVER/ (d’Andrimont et al., 2022a). The directory tree for the photo database follows the standard of the original EUROSTAT data. It is thereby organised by starting from the folder shown in the provided link, descending into a folder specifying the year of the survey (“LUCASYYYY”), followed by folders of each respective NUTS0 code that the point is located in, in turn proceeded by folders of the first three digits and the second three digits of the point ID. The JPG files that constitute the LUCAS cover photos are to be found in the folder named after the second three digits of the point ID according to the convention described in Sect. 6.
- 2.
Tables. (EXIF and LUCAS-harmonised) https://jeodpp.jrc.ec.europa.eu/ftp/jrc-opendata/LUCAS/LUCAS_COVER/tables
In addition to photos' availability on this FTP, the photos are available on the GISCO platform (https://gisco-services.ec.europa.eu/lucas/photos/*/*/*/*C.jpg (last access: 29 September 2022), where “*” is variable and represents the subdirectory and name of the photos).
The LUCAS surveys have resulted in the most comprehensive in situ database on land cover and land use in the EU. While close-up photos of the land cover had been collected for most of the in situ points, they had never been published. This data paper represents an effort to organise, document, curate, and publish this dataset following FAIR principles. This resulted in 874 646 geo-located photos along with surveyed information on land cover and land use following LUCAS legend level 2, inherited from the attribute information of the LUCAS-harmonised product. The LUCAS cover photos and dataset can feed various applications and developments relying on recent advances in geo-spatial analysis and statistical learning.
All the authors processed and analysed the data, wrote the paper, and provided comments and suggestions on the manuscript. ESTAT designed the survey methodology. EFTAS and Imaging Consulting carried out the anonymisation process of the LUCAS cover photos. Rd'A, MY, LMS, and MvdV processed and analysed the data and wrote the paper. All authors provided suggestions to the manuscript. BE and colleagues at ESTAT designed the survey methodology. PH, OB, and CH carried out the anonymisation process of the LUCAS cover photos.
The contact author has declared that none of the authors has any competing interests.
Publisher’s note: Copernicus Publications remains neutral with regard to jurisdictional claims in published maps and institutional affiliations.
The authors would like to express their appreciation to all that have been involved in the LUCAS surveys and especially to the LUCAS surveyors for their careful observations that underpin the value of the resulting LUCAS datasets.
This paper was edited by Francesco N. Tubiello and reviewed by two anonymous referees.
d’Andrimont, R., Yordanov, M., Martinez-Sanchez, L., Eiselt, B., Palmieri, A., Dominici, P., Gallego, J., Reuter, H. I., Joebges, C., Lemoine, G., and van der Velde, M.: Harmonised LUCAS in-situ land cover and use database for field surveys from 2006 to 2018 in the European Union, Sci. Data, 7, 1–15, https://doi.org/10.1038/s41597-020-00675-z, 2020. a, b, c, d, e
d’Andrimont, R., Yordanov, M., Martinez Sanchez, L., Haub, P., Buck, O., Haub, C., Eiselt, B., and Van Der Velde, M.: LUCAS Cover 2006–2018, European Commission [data set], http://data.europa.eu/89h/c83906d7-1817-495f-b4ba-f2e4b8859d48 (last access: 27 September 2022), 2022a. a, b
d’Andrimont, R., Yordanov, M., Martinez-Sanchez, L., and van der Velde, M.: Monitoring crop phenology with street-level imagery using computer vision, Comput. Electron. Agr., 196, 106866, https://doi.org/10.1016/j.compag.2022.106866, 2022b. a
ESTAT: Technical reference document S1: Stratification Guidelines, https://ec.europa.eu/eurostat/documents/205002/7329820/LUCAS2018_S1-StratificationGuidelines_20160523.pdf (last access: 27 September 2022), 2018. a
European Commission, Joint Research Centre (JRC): LUCAS Cover 2006–2018, European Commission, Joint Research Centre (JRC) [data set], http://data.europa.eu/89h/c83906d7-1817-495f-b4ba-f2e4b8859d48 (last access: 29 September 2022), 2022. a
European Commission, Eurostat, Ballin, M., Barcaroli, G., Masselli, M., and Scarno, M.: Redesign sample for Land Use/Cover Area frame Survey (LUCAS) 2018, 2018 edition, Publications Office, https://doi.org/10.2785/132365, 2018. a
Eurostat: Technical reference document C-1: Instructions for surveyors, https://jeodpp.jrc.ec.europa.eu/ftp/jrc-opendata/LUCAS/LUCAS_harmonised/3_supporting/LUCAS2018-C1-Instructions.pdf (last access: 29 September 2022), 2018. a, b, c
Gallego, J. and Bamps, C.: Using CORINE land cover and the point survey LUCAS for area estimation, Int. J. Appl. Earth Obs., 10, 467–475, 2008. a
Gallego, J. and Delincé, J.: The European land use and cover area-frame statistical survey, Agricultural survey methods, 149–168, https://doi.org/10.1002/9780470665480.ch10, 2010. a
Goëau, H., Bonnet, P., Joly, A., Baki´c, V., Barbe, J., Yahiaoui, I., Selmi, S., Carré, J., Barthélémy, D., Boujemaa, N., Molino, J.-F., Duché, G., and Péronnet, A.: Pl@ntNet mobile app, in: Proceedings of the 21st ACM international conference on Multimedia, Barcelona, Spain, 21–25 October 2013, 423–424, https://doi.org/10.1145/2502081.2502251, 2013. a
Goëau, H., Joly, A., Bonnet, P., Lasseck, M., Šulc, M., and Hang, S. T.: Deep learning for plant identification: how the web can compete with human experts, Biodiversity Information Science and Standards, 2, e25637, https://doi.org/10.3897/biss.2.25637, 2018. a
Harvey, P. and Körtner, G.: ExifTool, Kingston, Ontario, Canada [code], http://owl.phy.queensu.ca/~phil/exiftool/ (last access: 27 September 2022), 2016. a
Mäder, P., Boho, D., Rzanny, M., Seeland, M., Wittich, H. C., Deggelmann, A., and Wäldchen, J.: The Flora Incognita app–interactive plant species identification, Methods Ecol. Evol., 12, 1335–1342, 2021. a
Miller-Rushing, A., Primack, R., and Bonney, R.: The history of public participation in ecological research, Front. Ecol. Environ., 10, 285–290, 2012. a
Nugent, J.: INaturalist, Science Scope, 41, 12–13, 2018. a
Redmon, J. and Farhadi, A.: YOLOv3: An Incremental Improvement, arXiv [preprint], https://doi.org/10.48550/arxiv.1804.02767, 8 April 2018. a
Wilkinson, M. D., Dumontier, M., Aalbersberg, I. J., Appleton, G., Axton, M., Baak, A., Blomberg, N., Boiten, J.-W., da Silva Santos, L. B., Bourne, P. E., Bouwman, J., Brookes, A. J., Clark, T., Crosas , M., Dillo, I., Dumon, O., Edmunds, S., Evelo, C. T., Finkers, R., Gonzalez-Beltran, A., Gray, A. J. G., Groth P., Goble, C., Grethe, J. S., Heringa, J., Hoen, P.A. C.'t, Hooft, R., Kuhn, T., Kok, R., Kok, J., Lusher, S. J., Martone, M. E., Mons, A., Packer, A. L., Persson, B., Rocca-Serra, P., Roos, M., van Schaik, R., Sansone, S. A., Schultes, E., Sengstag, T., Slater, T., Strawn, G., Swertz, M. A., Thompson, M., van der Lei, J., van Mulligen, E., Velterop, J., Waagmeester, A., Wittenburg, P., Wolstencroft, K., Zhao, J., and Mons, B.: The FAIR Guiding Principles for scientific data management and stewardship, Sci. Data, 3, 1–9, https://doi.org/10.1038/sdata.2016.18, 2016. a
- Abstract
- Introduction
- In-situ LUCAS survey protocol
- LUCAS cover photo collection protocol
- Photo metadata extraction
- Automated identification of photos with potential privacy content
- Harmonisation of the filename and watermark
- Final data overview
- Limitations
- Potential use of the data and perspectives
- Data availability
- Conclusions
- Author contributions
- Competing interests
- Disclaimer
- Acknowledgements
- Review statement
- References