the Creative Commons Attribution 4.0 License.
the Creative Commons Attribution 4.0 License.
 | 08 Sep 2022
A benchmark dataset of diurnal- and seasonal-scale radiation, heat, and CO2 fluxes in a typical East Asian monsoon region
Zexia Duan
Zhiqiu Gao
Qing Xu
Shaohui Zhou
Yuanjian Yang
A benchmark dataset of radiation, heat, and CO2 fluxes is crucial to land–atmosphere interaction research. Due to rapid urbanization and the development of agriculture, the land–atmosphere interaction processes over the Yangtze River Delta (YRD) of China, which is a typical East Asian monsoon region, are becoming various and complex. To understand the effects of various land cover changes on land–atmosphere interactions in this region, a comprehensive long-term (2011–2019) in situ observation campaign, including 30 min resolution meteorological variables (air temperature, humidity, pressure, wind speed, and wind direction), surface radiative flux, turbulent heat flux, and CO2 flux, was conducted at four sites with two typical surface types (i.e., croplands and suburbs) in the YRD. Analysis of the dataset showed that all four radiation components, latent heat flux, sensible heat flux, soil heat flux, and CO2 flux varied seasonally and diurnally at the four sites. Surface energy fluxes exhibited great differences among the four sites. On an annual basis, for the two cropland sites, the dominant consumer of net radiation was latent heat flux. For the two suburban sites, in contrast, latent heating dominated from April to November, whereas sensible heating dominated during the other months. Our present work provides convincing evidence that the dataset has potential for multiple research fields, including studying land–atmosphere interactions, improving boundary layer parameterization schemes, evaluating remote sensing algorithms, validating carbon flux modeling and inversion, and developing climate models for typical East Asian monsoon regions. The dataset is publicly available at https://doi.org/10.5281/zenodo.6552301 (Duan et al., 2022).
- Article
(8785 KB) - Full-text XML
- BibTeX
- EndNote


Land–atmosphere interaction processes, which control the surface–atmosphere exchanges of water, energy, and atmospheric carbon dioxide (CO2) across the atmospheric boundary layer, play a key role in ecosystem processes, hydrologic and biogeochemical cycles, and even in weather and climate (You et al., 2017; Yang et al., 2019). Previous studies have shown that climate simulations are especially sensitive to seasonal and diurnal variations in the surface energy partitioning of available energy into sensible heat (H) and latent heat (λE) fluxes in numerical models (Gao et al., 2004), where considerable uncertainties still remain in the land–surface parameters (Sun et al., 2013). To date, the representation of these parameters has not been optimal, as indicated by validation against in situ observations (Cuntz et al., 2016). Thus, comprehensive and accurate in situ eddy covariance (EC) flux measurement is essential to deepen the understanding of land–atmosphere dynamics (Rao and Reddy, 2019).
The EC technique can derive direct observations of land–atmosphere carbon, water, and energy flux exchanges, and it is regarded as the best and the most trustworthy measurement of turbulent fluxes (Baldocchi, 2003). With the development of the EC tool, more than 500 flux towers have been distributed throughout various climate zones (Lee et al., 2020; Kang and Cho, 2021). In the same climate regions, the radiation budget and energy partitioning are mainly modulated by the surface properties (e.g., albedo and roughness length) and subsequently influence air/surface temperature, humidity, and precipitation (Feddema et al., 2005; Jin and Roy, 2005; Li and Wang, 2019). For example, aerodynamically rougher and optically darker oak savanna absorbs more radiation and has a higher H and air temperature than the aerodynamically smoother and optically brighter annual grassland, although both of them coexist in semiarid regions (Baldocchi and Ma, 2013). In the monsoon region of China, the land cover shifts from vegetation to bare soil on the Tibetan Plateau and in the Inner Mongolia Autonomous Region, which not only modifies the local thermal and hydrological behavior but also weakens the East Asian summer monsoon circulation and precipitation (Li and Xue, 2010). Although some researchers have explored the roles of land surface processes in the monsoon system (Xue et al., 2004), studies of field observations remain uncertain in the East Asian monsoon region (Bi et al., 2007), especially in the Yangtze River Delta (YRD) in eastern China.
The YRD (26–34∘ N, 114–122∘ E), located in a typical East Asian monsoon region, is one of the most developed areas in China (Yang et al., 2020a; Zhang et al., 2021; Chen et al., 2022). The region occupies only 2.2 % of the area of China, but it is home to about 16 % of China's total population (Huang et al., 2021) and contributed approximately 18.5 % of China's gross domestic product in 2014 (Hu et al., 2018). Land cover types in the YRD are diverse and are dominated by cropland, built-up areas, and mountainous areas (mostly forests and grasslands) across the northern, central, and southern parts of the region, respectively (Fig. 1). Recently, due to rapid urbanization, industrialization, and agricultural development, the land cover in this area has become more complex (Guo et al., 2016). Extensive urbanization has increased H and CO2 emissions, weakened the net surface longwave radiation, and enhanced surface thermal heating to the atmosphere in this region (Chen and Zhang, 2013; H. Chen et al., 2016). These alterations have modified the urban surface energy budget and the boundary layer structure (Wang et al., 2020; Yang et al., 2020b), resulting in distinct urban climate effects (e.g., urban heat island, enhanced heat waves, and flooding; Yang and Wang, 2014; Li et al., 2015). Meanwhile, large-scale vegetation degradation and agricultural activities (e.g., the frequent rotation of crop production with several dry–wet cycles in the northern of YRD) have modulated hydrological processes and subsequently affected the regional climate and East Asian monsoon circulation (H. Chen et al., 2016). Thus, it is important to clarify the land–atmosphere interactions over the typical surface types present in the YRD.
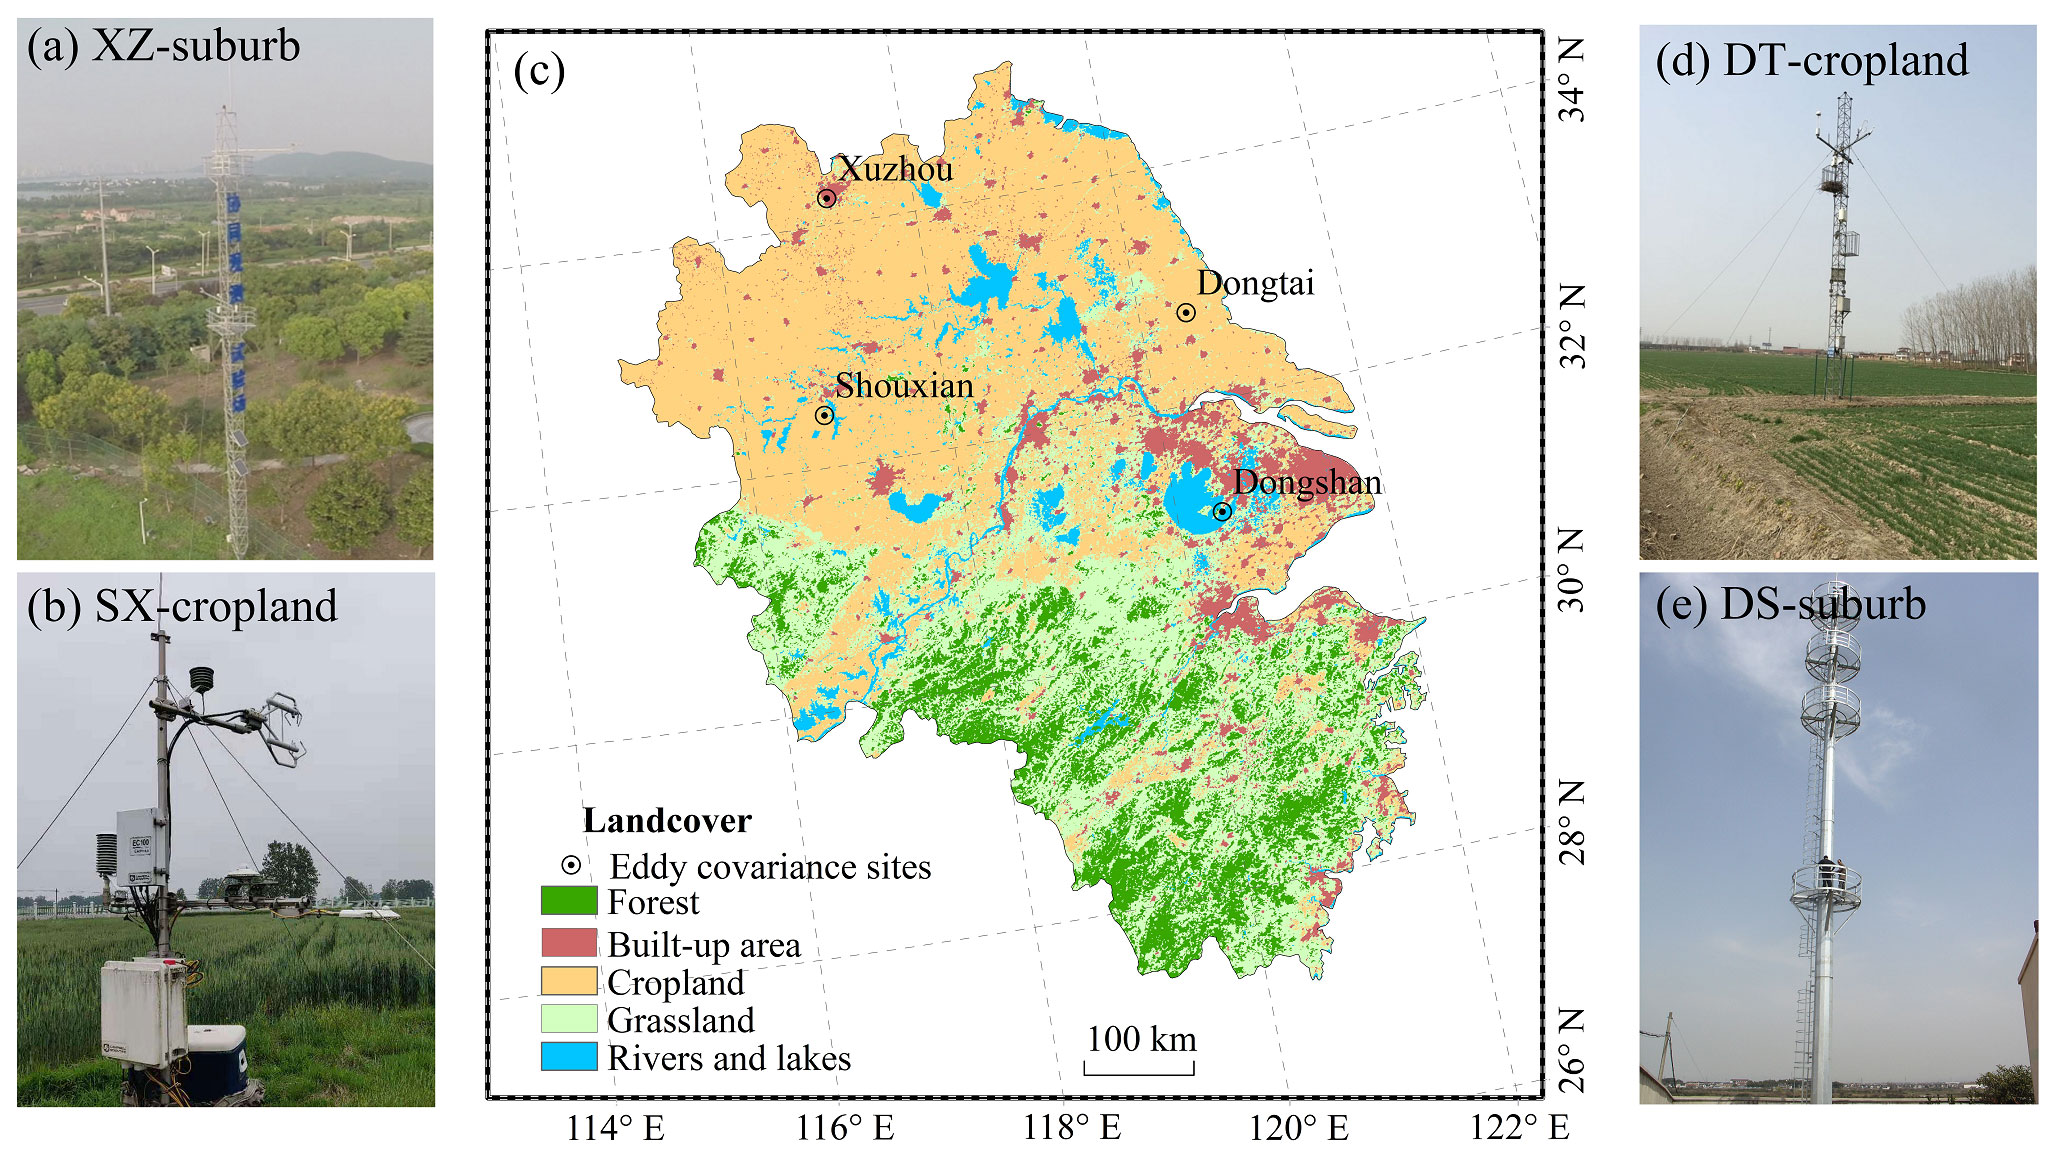
Figure 1Surface types of the four field sites, (a) XZ-suburb, (b) SX-cropland, (d) DT-cropland, and (e) DS-suburb, and (c) their relative positions in the Yangtze River Delta in eastern China. The land cover map for 2016, shown in panel (c), was available at the 500 m spatial resolution of the MODIS MCD12Q1 product (https://ladsweb.modaps.eosdis.nasa.gov/search/, last access: 17 August 2022). The flux tower photos in panels (a), (b), (d), and (e) were taken at the sites by the authors.
Over the past few years, some atmospheric field experiments have been conducted over various land surface types, such as croplands (Ge et al., 2018; Dai et al., 2019; Duan et al., 2021a) and urban areas (Ao et al., 2016; Wei et al., 2020), in order to examine the temporal and spatial characteristics of the energy balance and greenhouse gases in the YRD. Nevertheless, integrated measurements from field stations in the YRD are still either not openly shared or only very limited data during a specified observation period can be accessed. Although the China Meteorological Data Service Center (http://data.cma.cn/en, last access: 30 April 2022) has provided some meteorological data in recent years, EC sensors have not been commonly equipped at those meteorological stations, making it difficult to obtain heat and CO2 flux data at some specific locations or for specific periods (Flerchinger et al., 2009). To improve the knowledge of energy partitioning and CO2 exchange over the typical land surfaces present in the YRD and to pinpoint the strongest climate signals from surface energy components, a long-term (2011–2019) and continuous integrated observational dataset of land–atmosphere interactions with a high temporal resolution is now released. The underlying observation network is composed of four sites over the two typical surface types present in the YRD. At each site, meteorological conditions, four radiation components, EC measurements, and soil hydrothermal properties are examined. This dataset is provided in an XLSX format, which can be easily accessed and used by the atmosphere, hydrology, ecology, and cryosphere communities, aiming to facilitate coherence and continuity in the scientific understanding of the interactions among the multi-sphere coupled systems in the YRD. These data will be valuable for validating remote sensing data products, evaluating meteorological and air quality models (Tsai et al., 2007), and improving boundary layer parameterization schemes (Bian et al., 2002; Zhang et al., 2020).
In the present work, we provide a long-term (2011–2019) 30 min resolution dataset of the integrated land–atmosphere interactions observations over the two typical landscapes (i.e., cropland and suburban) present in the YRD and make this dataset available to the public. The paper is organized as follows: Sect. 2 describes the sites, instruments, and data processing methods; Sect. 3 quantifies the meteorological, solar radiation, heat, and CO2 fluxes at diurnal and seasonal scales at the four sites; the availability of the dataset is introduced in Sect. 4; and a conclusion is given in Sect. 5.
2.1 Sites
The integrated land–atmosphere interaction observation data shown in the present work were collected at four experimental sites, including two cropland (i.e., Shouxian and Dongtai stations) and two suburban (Xuzhou and Dongshan stations) areas of the YRD (Fig. 1), which are hereinafter referred to as SX-cropland, DT-cropland, XZ-suburb, and DS-suburb, respectively.
The XZ-suburb site (34.22∘ N, 117.14∘ E; 44 m a.s.l., meters above sea level; Fig. 1a) is located in the northwestern corner of the Nanhu Campus of the China University of Mining and Technology, Tongshan District, Jiangsu Province, China. A road that experiences a huge traffic volume is located approximately 100 m north of the flux tower. To the north of the road is a park that is dominantly covered by vegetation and lakes. To the south of the observatory are school buildings (mean height 4.5 m), and this particular area has a high population density, low traffic flow, and high vegetation coverage. Easterly and southeasterly winds prevailed at this site (Fig. 2).
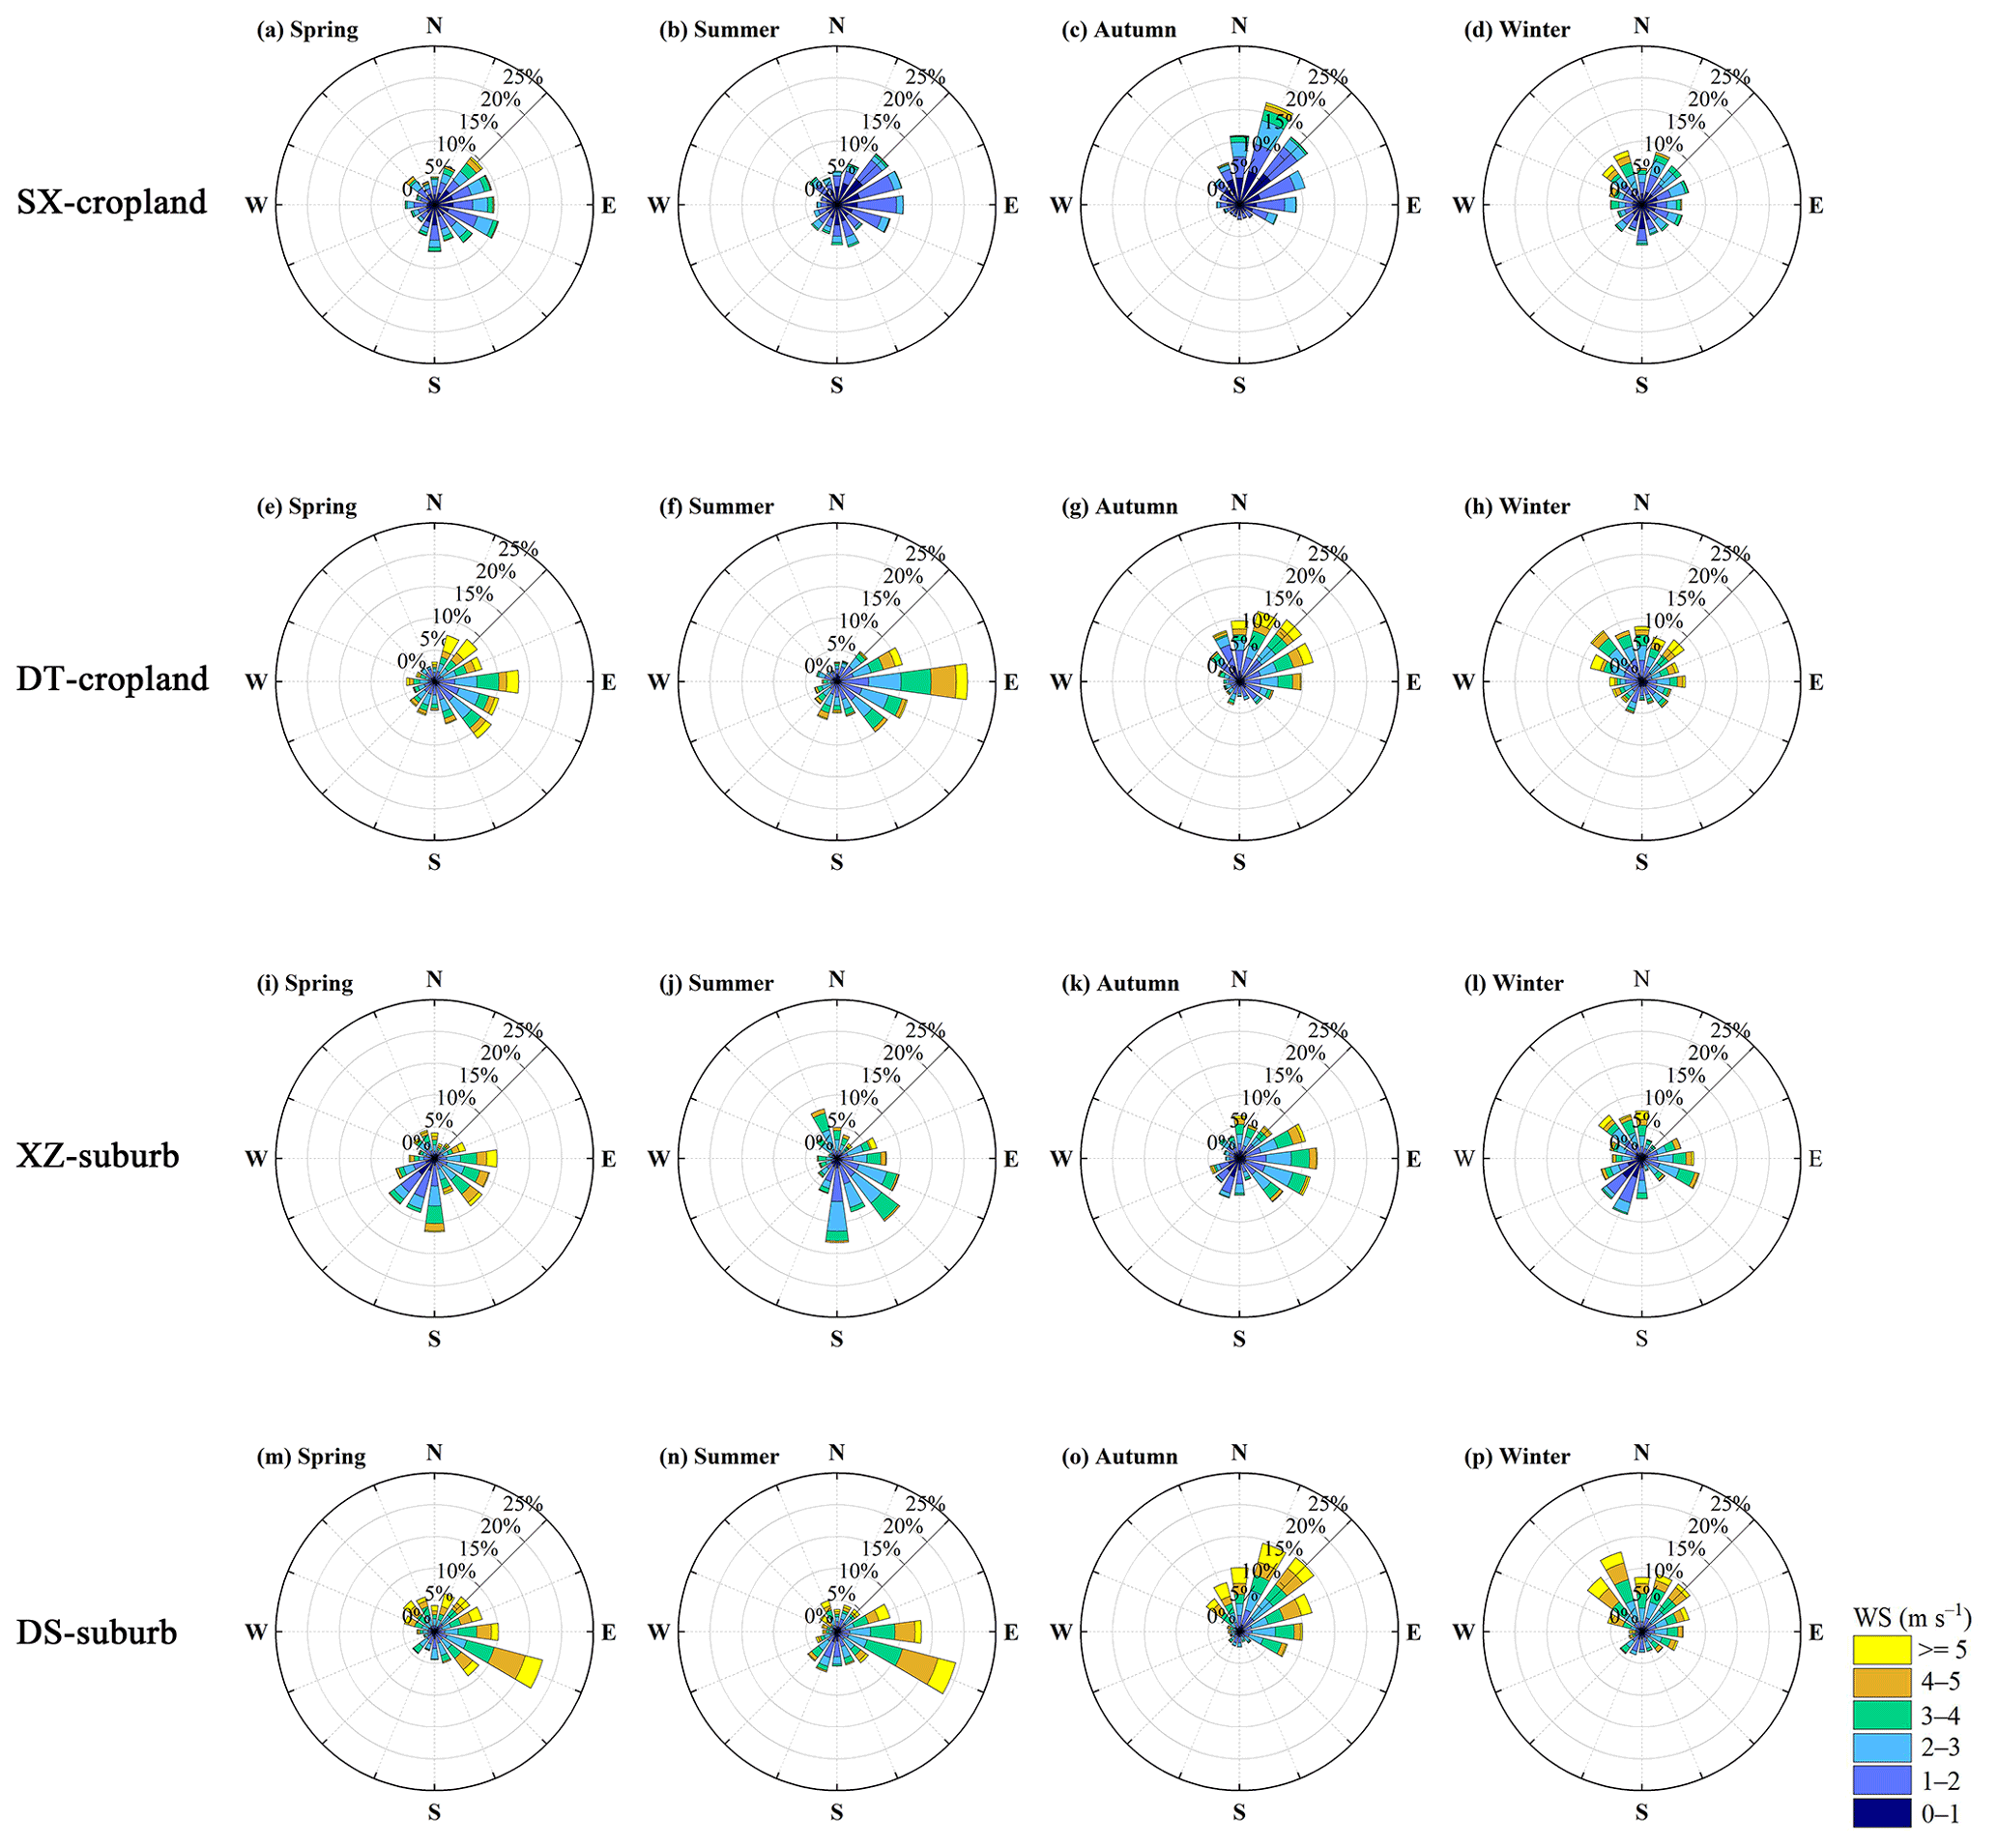
Figure 2Wind roses showing the seasonal (spring, March–May; summer, June–August; autumn, September–November; and winter, December–February) dynamics of wind (22.5∘ bins, 30 min data) stratified by wind speed frequency for the (a–d) SX-cropland, (e–h) DT-cropland, (i–l) XZ-suburb, and (m–p) DS-suburb sites.
The SX-cropland site (32.44∘ N, 116.79∘ E; 27 m a.s.l.; Fig. 1b) is situated at the Shouxian Agro-Ecosystem Station in Anhui Province, China. The site is characterized by flat terrain and is covered with silty clay loam soil. The nearest village is over 500 m from the observation site. A rice–wheat rotation system is practiced around the EC flux tower: winter wheat is grown from October to June, whereas summer rice is grown from June to September every year (Chen et al., 2015). The dominant wind direction ranged from the southeast in spring to the northwest in winter (Fig. 2).
The DT-cropland site (32.76∘ N, 120.47∘ E; 4 m a.s.l.; Fig. 1d) is about 45 km west of the East China Sea in Jiangsu Province, China. The soil at the site is predominantly clay. The site is homogeneous, and a rotation of summer rice and winter wheat is cultivated in the field (Li et al., 2017; Duan et al., 2021a). Here, winter wheat grows from December to May, whereas summer rice grows from June to November every year. The dominant wind direction ranged from the southeast in spring to the northwest in winter (Fig. 2).
The DS-suburb site (31.08∘ N, 120.43∘ E; 13 m a.s.l.; Fig. 1e) is on the southeastern shore of Lake Taihu in Jiangsu Province, China (Wang et al., 2014). The observation site is surrounded by water, cropland, and rural houses. The prevailing wind in this area is from the southeast in summer and from the northeast in winter (Fig. 2).
For the four sites, the aerodynamic roughness length (z0, method of Martano, 2000) showed significant seasonal patterns, with monthly median values of 0.01–0.09 m for SX-cropland, 0.09–0.38 m for DT-cropland, 0.74–1.32 m for XZ-suburb, and 0.44–1.14 m for DS-suburb (Fig. 3).
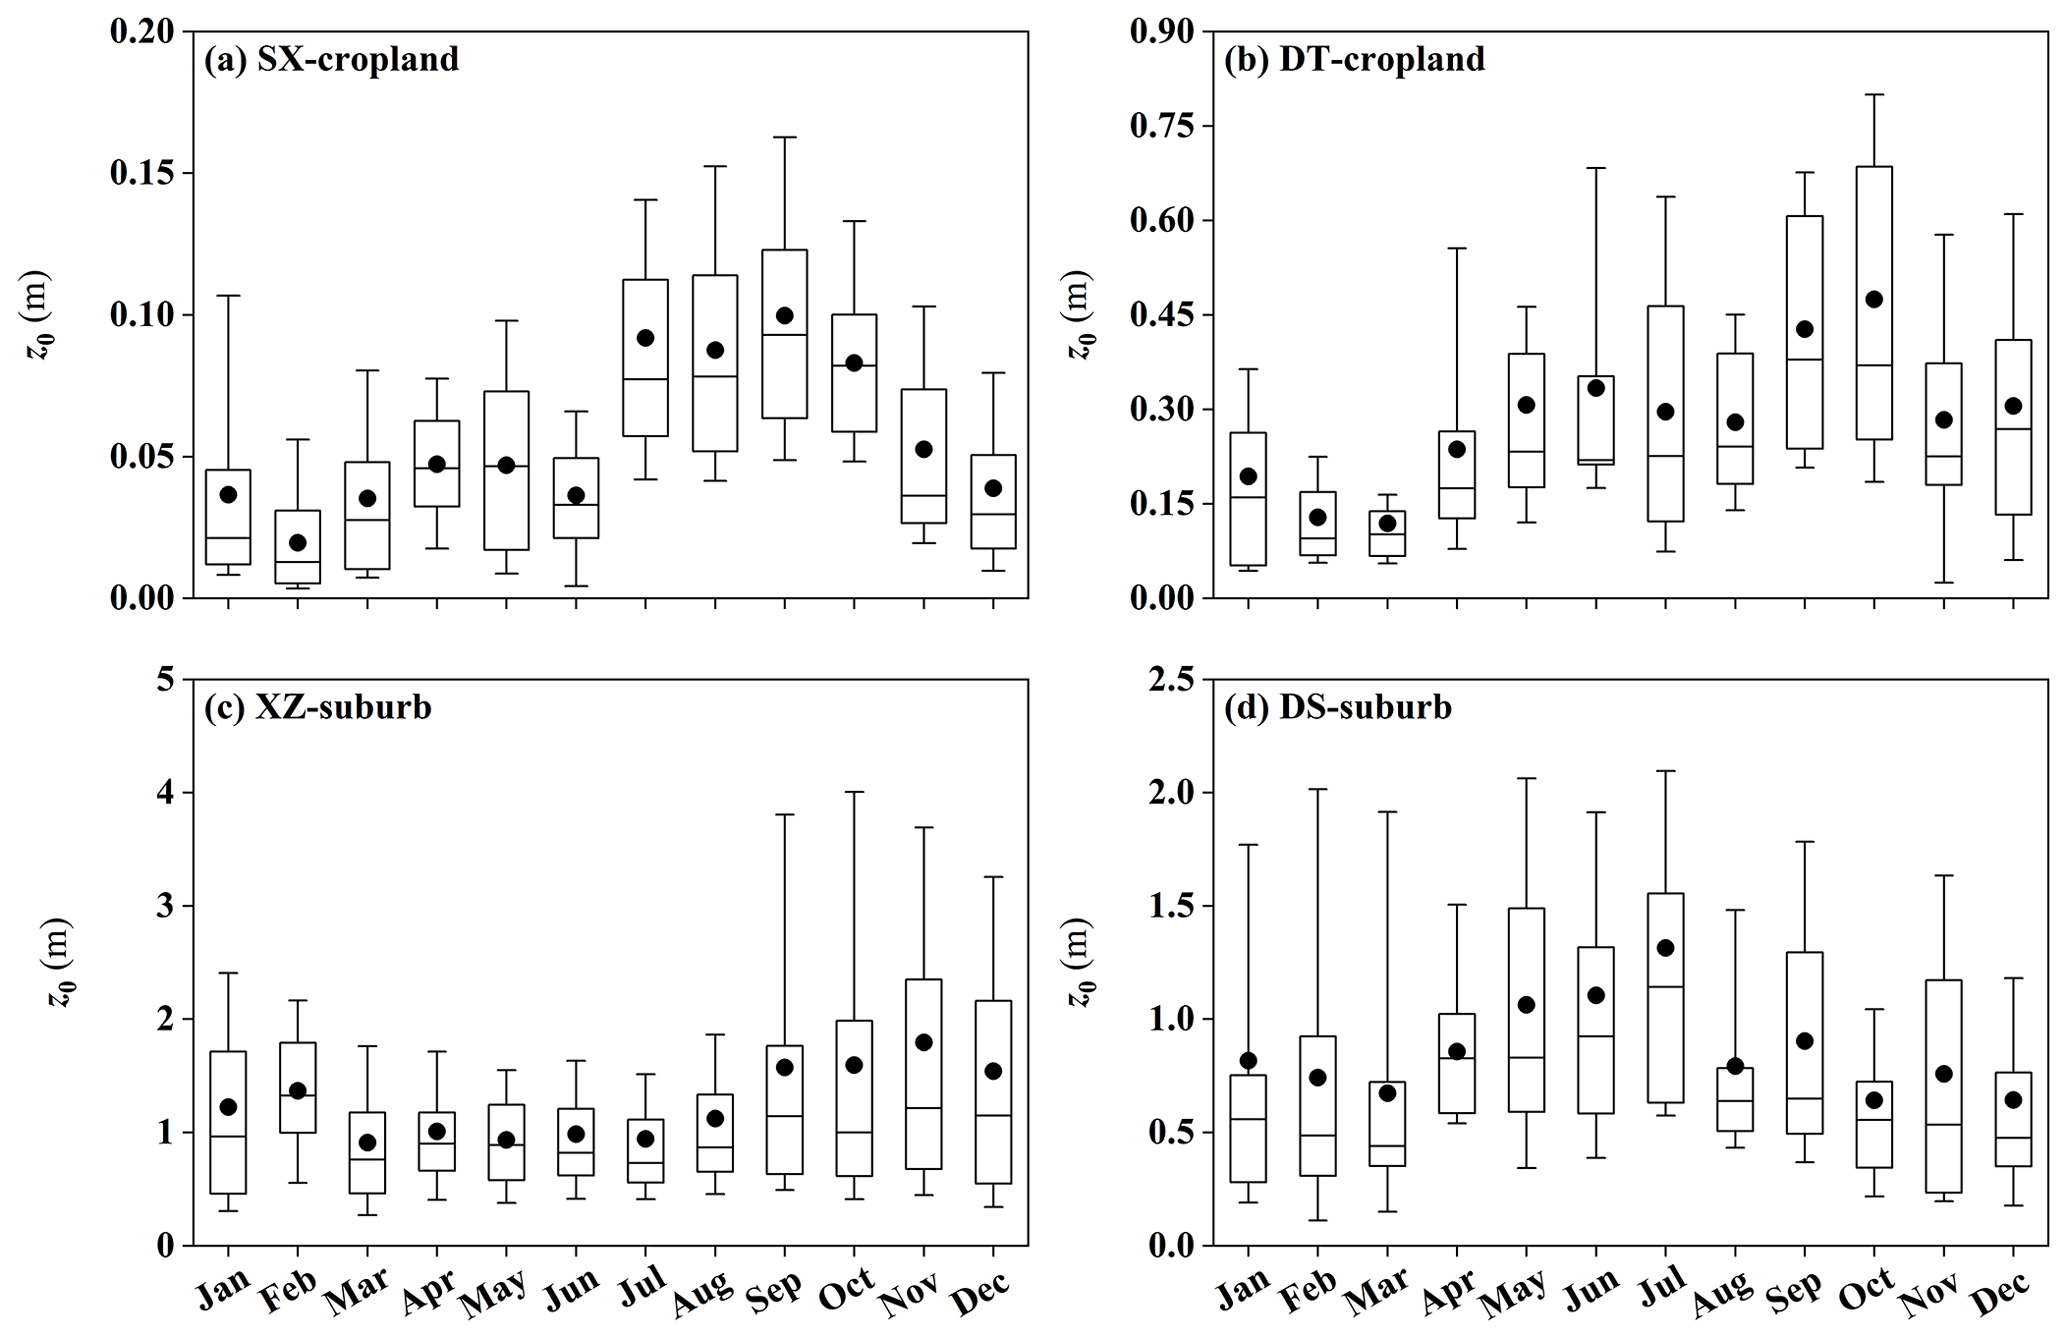
Figure 3Variations in the monthly aerodynamic roughness length (z0) at the (a) SX-cropland, (b) DT-cropland, (c) XZ-suburb, and (d) DS-suburb sites. Box plots show the mean (black dot); the 25, 50, and 75th percentiles (box); and the 10 and 90th percentiles (whiskers).
2.2 Instruments
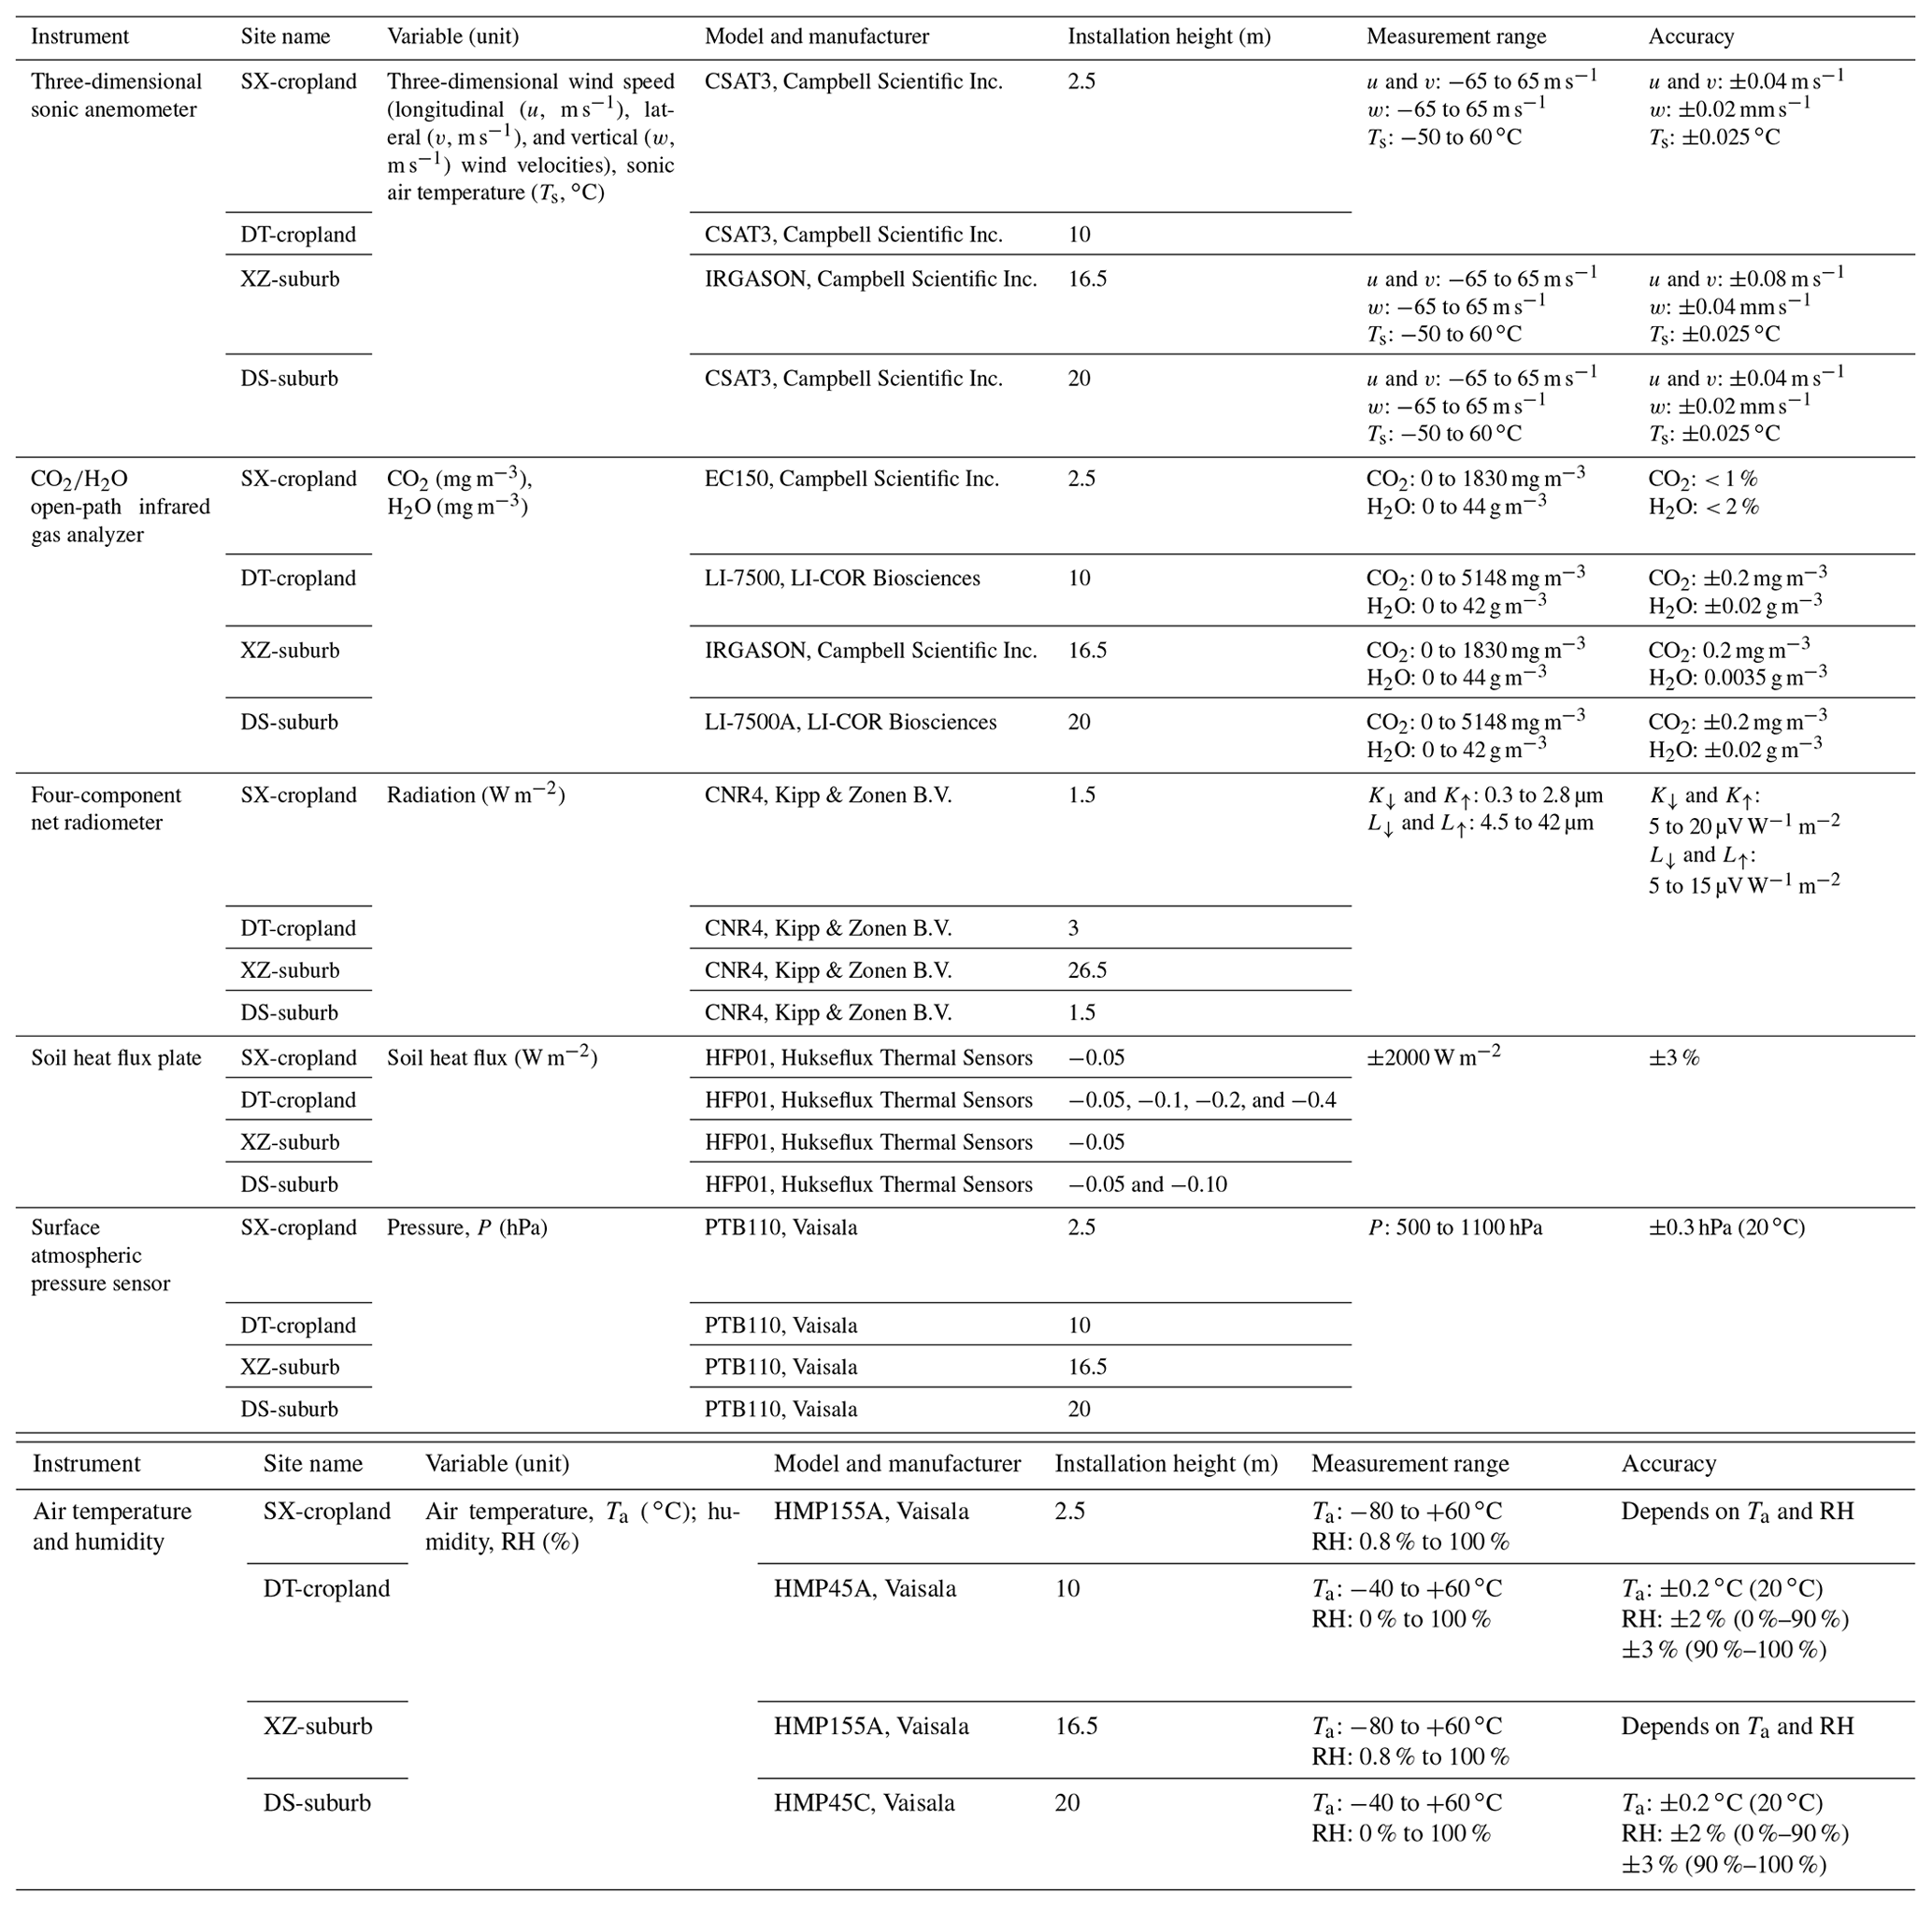
All four sites are equipped with an EC system for long-term continuous monitoring of the surface radiation, H, λE, and CO2 fluxes. Table 1 shows the details of instruments at all four sites. The EC system consists of a three-dimensional sonic anemometer (IRGASON, Campbell Scientific Inc., USA, at the XZ-suburb site; CSAT3, Campbell Scientific Inc., USA, at the other three sites) and a open-path infrared gas analyzer (EC 150, Campbell Scientific Inc., USA, at the SX-cropland site; LI-7500, LI-COR Biosciences, Inc., USA, at the DT-cropland and DS-suburb sites; IRGASON, Campbell Scientific Inc., USA, at the XZ-suburb site). The EC measurement height was 2.5 m a.g.l. (meters above ground level) at the SX-cropland site, 10 m a.g.l. at the DT-cropland site, 16.5 m a.g.l. at the XZ-suburb site, and 20 m a.g.l. at the DS-suburb site. The four-component net radiometers (CNR-4, Kipp & Zonen B.V., Delft, the Netherlands) were mounted at 1.5 m a.g.l. for the SX-cropland and DS-suburb sites, 3 m a.g.l. for the DT-cropland site, and 26.5 m a.g.l. for the XZ-suburb site. Additionally, the soil heat flux (G) was measured (using HFP01 heat flux plates, Hukseflux Thermal Sensors) at 0.05 m b.s (meters below the ground surface) for the SX-cropland site; 0.05, 0.1, 0.2, and 0.4 m b.s for the DT-cropland site; 0.05 m b.s for the XZ-suburb site; and 0.05 and 0.10 m b.s for the DS-suburb site. Other measurements, including air humidity and air temperature (HMP155A, Vaisala, Inc, Helsinki, Finland at the SX-cropland and XZ-suburb sites; HMP45A, Vaisala, Inc, Helsinki, Finland at the DT-cropland site; and HMP45C, Vaisala, Inc, Helsinki, Finland at the DS-suburb site) and surface air pressure (PTB110, Vaisala, Inc, Helsinki, Finland), were made at a height of 2.5 m at the SX-cropland site, 10 m at the DT-cropland site, 16.5 m at the XZ-suburb site, and 20 m at the DS-suburb site. All instruments were calibrated by professional engineers. For example, the calibration steps of the open-path infrared gas analyzer mainly included (a) determining the calibration coefficients and (b) setting zero and span. The three-dimensional sonic anemometer required a factory calibration (i.e., test for wind offset and check for diagnostic flags) every 2 years, while the four-component net radiometer was calibrated every year to guarantee the radiation data quality. More detailed information about the instruments is available in Lee et al. (2014) and Duan et al. (2021a, b).
2.3 Data processing
Each site was visited biweekly to monthly in order to maintain instruments and download EC data. To gain the high-quality 30 min resolution EC data, a series of post-processing steps were performed as follows (see Fig. 4):
-
The raw 10 Hz EC data, including longitudinal (u), lateral (v), and vertical (w) wind velocities; sonic temperature (Ts); and water vapor (H2O) density were sampled by a data logger (model CR3000, Campbell Scientific Inc., USA) and then transformed into 30 min binaries with the Campbell Scientific Inc. LoggerNet 4.2.1 software.
-
The LI-COR EddyPro 6.2.1 software was used to calculate and correct 30 min turbulent fluxes of H, λE, and CO2. The data processing included (a) spike removal based on the algorithm of Vickers and Mahrt (1997), i.e., statistical outliers beyond ±3.5 standard deviation in a running window of 10 values were rejected, except if more than three values in a row met this criterion (Schmidt et al., 2012); (b) time delay compensation; (c) double coordinate rotation for the sonic anemometer tilt correction; (d) spectral correction; (e) virtual temperature correction for H (Lee et al., 2004); and (f) Webb–Pearman–Leuning density fluctuations for λE and CO2 fluxes (Webb et al., 1980).
-
The quality control of eddy covariance measurements includes a stationarity test, an integrated turbulence characteristics test, and footprint analysis. The EddyPro quality flags based on those steps include “high quality” (flag 0), “suitable for budget analysis” (flag 1), and “discard” (flag 2). Note that EC data collected under unfavorable weather conditions (e.g., rainy and foggy days) or during periods of instrument malfunctions were excluded. However, there was no interpolation in the measurement, which can keep initial information from observations.

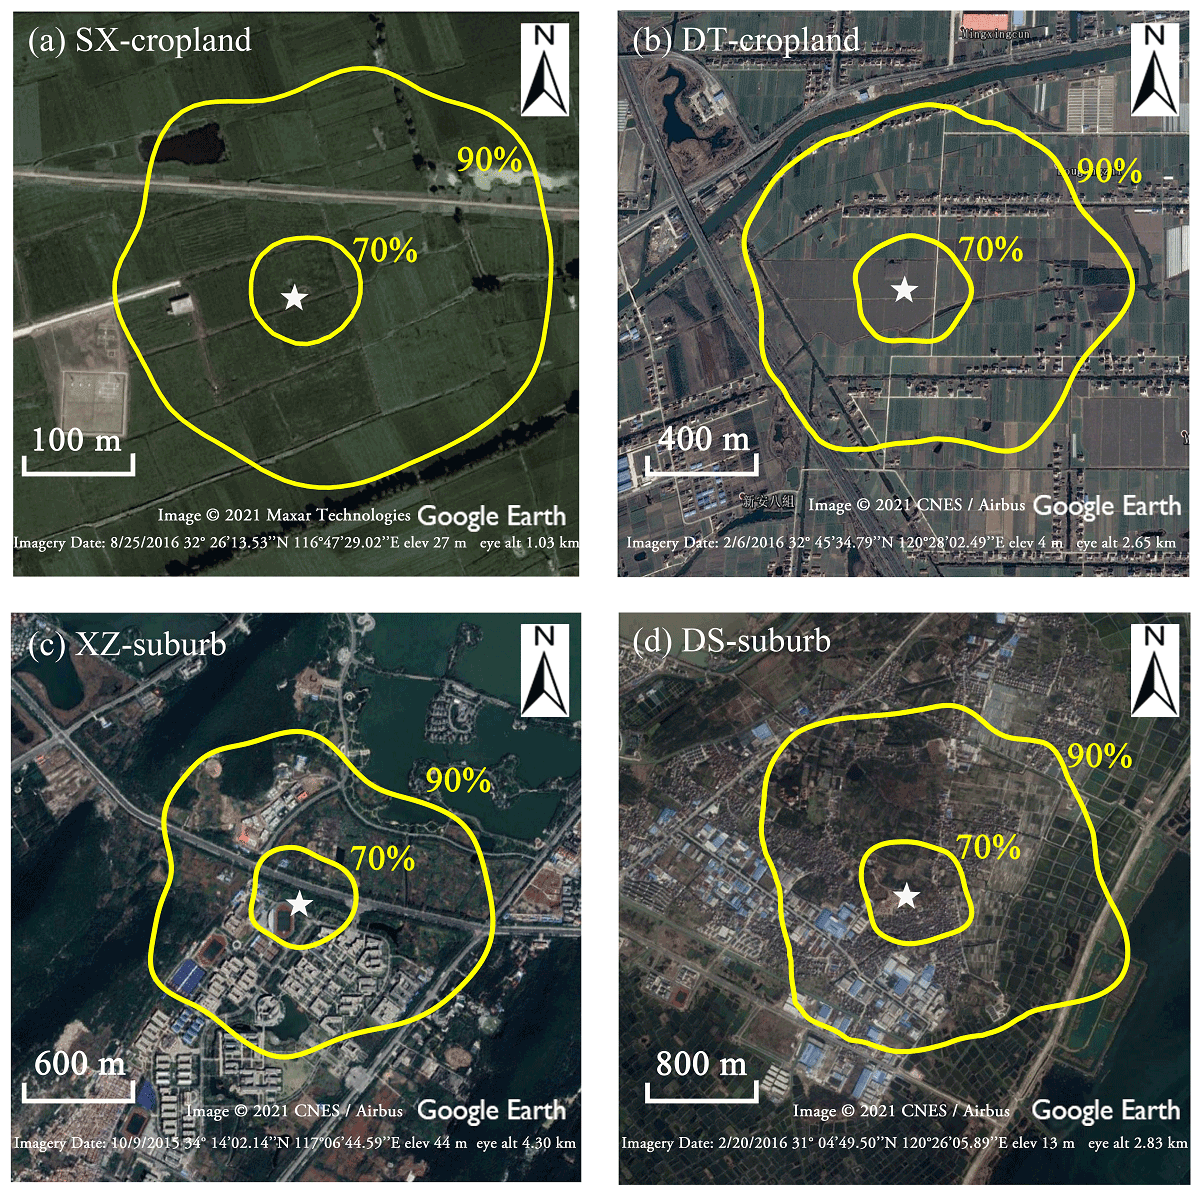
Figure 5Probable eddy covariance flux source areas (70 % and 90 %, yellow lines from inside to outside) based on the Kljun et al. (2015) footprint model for the (a) SX-cropland, (b) DT-cropland, (c) XZ-suburb, and (d) DS-suburb sites. The white star represents the flux tower location.
Table 2Land cover fractions within the 90 % footprints at the four sites.
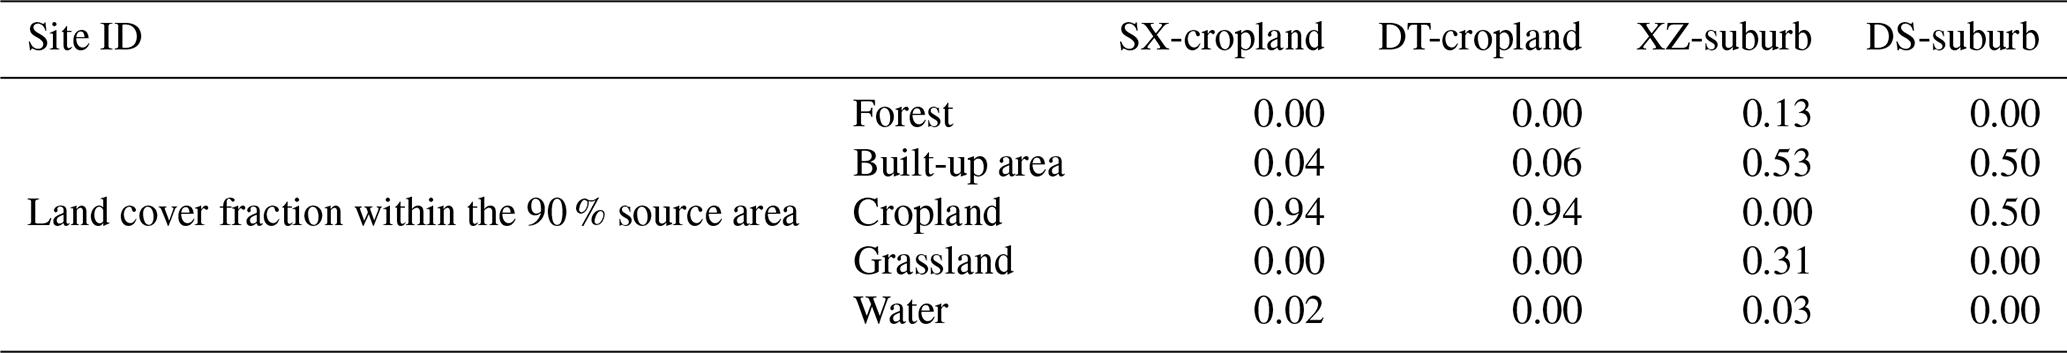
In this paper, the footprint model proposed by Kljun et al. (2015) was used to examine the spatial representativeness of the EC fluxes at the four sites (Fig. 5). The average fetch length of the 90 % source area was estimated as 225, 800, 1035, and 1558 m for the SX-cropland, DT-cropland, XZ-suburb, and DS-suburb flux towers, respectively. Based on the results in Fig. 5, the land cover fractions were retrieved from a Google Earth image. The compositions of 30 min EC 90 % probable footprints of the flux tower were separated into five categories: forest, built-up area, cropland, grassland, and water. As shown in Table 2, cropland was the dominant land cover type at the SX-cropland and DT-cropland sites, with a fraction of 94 % at both sites. From the analysis of the 30 min 90 % footprints during the measurement periods, the XZ-suburb site consisted of 53 % built-up area, 31 % grassland, 13 % forest, and 3 % water. For DS-suburb site, in contrast, the 30 min EC 90 % probable footprint (Kljun et al., 2015) climatology consisted of equal shares of built-up area and cropland (Table 2).
Radiative fluxes and meteorological variables were sampled at 1 Hz by the CR3000 data logger; the 30 min means were then estimated from these measurements. The radiative fluxes were limited to physically plausible thresholds, with nocturnal shortwave radiation forced to 0 W m−2 (Michel et al., 2008). The meteorological data quality control checks involved reasonable range, internal consistency, and temporal and spatial consistency based on the methods in Ren et al. (2015). The coverage rates of meteorological, radiative, heat, and CO2 flux data as well as their proportions of the 30 min high-quality measurements are summarized in Table 3.
Table 3The proportion of data availability. The percentage represents the proportion of 30 min high-quality EC data.
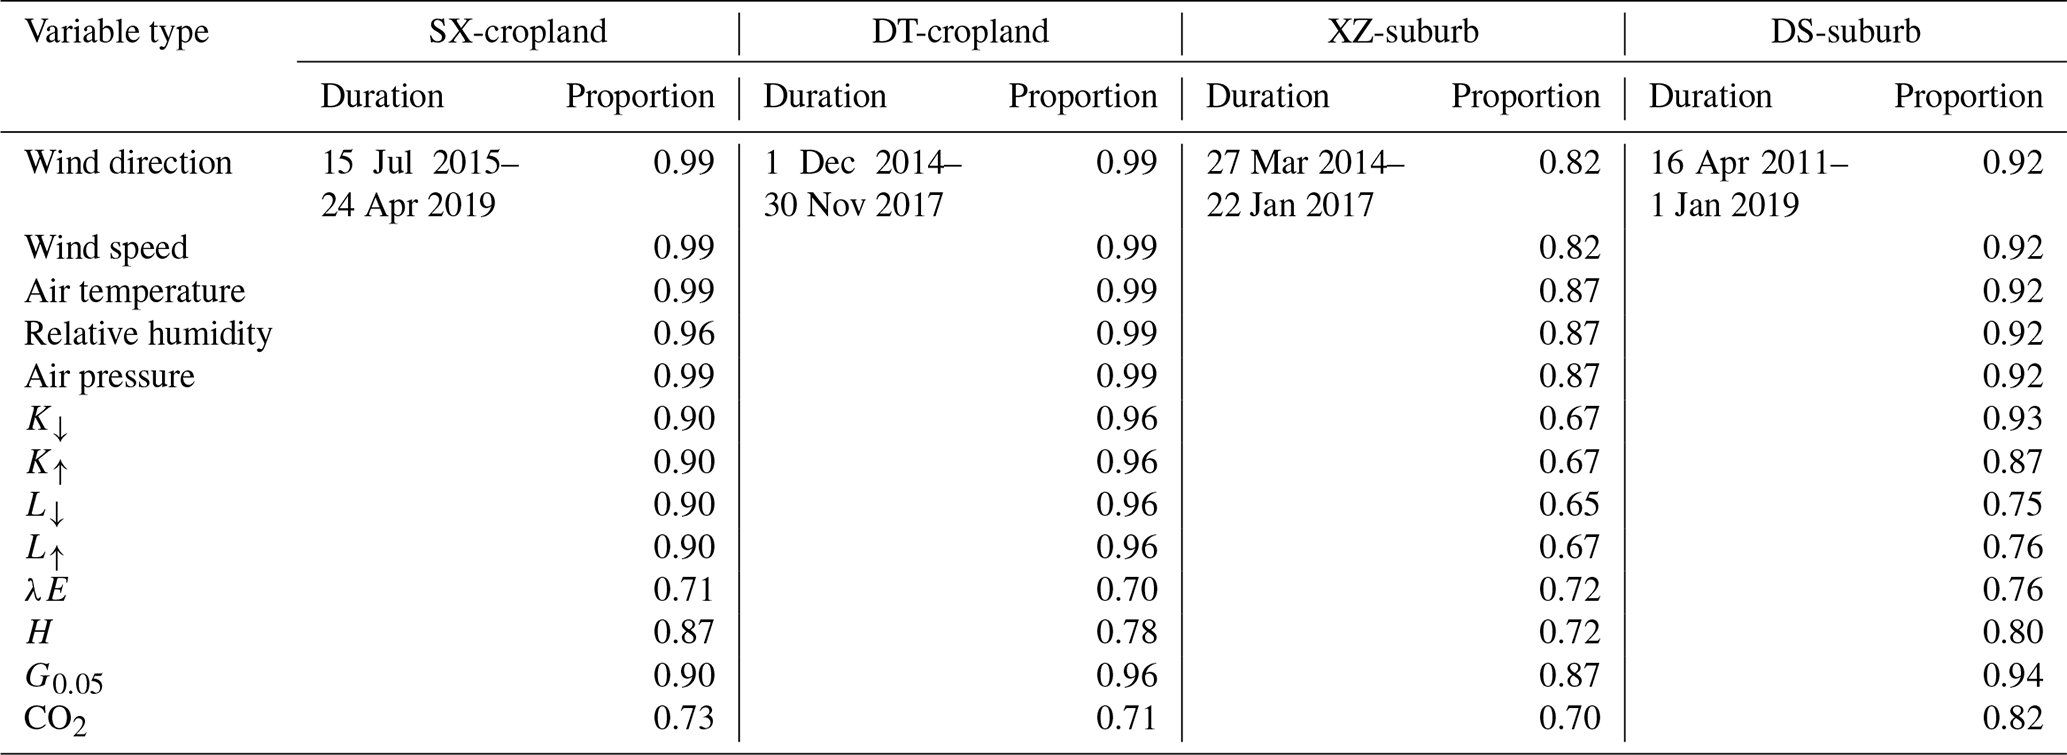
The abbreviated variables listed in the table are as follows: incoming shortwave radiation
(K↓), outgoing shortwave radiation (K↑), incoming longwave radiation (L↓), outgoing
longwave radiation
(L↑), positive flux away from the surface (λE), sensible heat flux (H), CO2 flux (CO2), and soil heat flux at a depth
of 0.05 m (positive flux into the soil, G0.05).
2.4 Methods
Rn (positive radiation toward the surface) is derived from the incoming (↓, downward) and outgoing (↑, upward) components of shortwave radiation (K) and longwave radiation (L):
H and λE (positive flux away from the surface) are estimated using EC methods (Kaimal and Finnigan, 1994):
Here, w′, and e′ are the turbulent fluctuations from the mean of the vertical wind velocity (m s−1), air temperature (K), and water vapor pressure (hPa), respectively; ρ is the air density (kg m−3); cp is the specific heat capacity of air at constant pressure (J kg−1 K−1); λ is the latent heat of vaporization (J kg−1); Mw and Ma are the respective water and air molar mass (g mol−1); and P is the air pressure (hPa).
Fc (positive CO2 flux away from the surface) is calculated as follows (Ohtaki and Matsui, 1982):
where c′ is the fluctuation in the concentration of CO2 (µmol m−3).
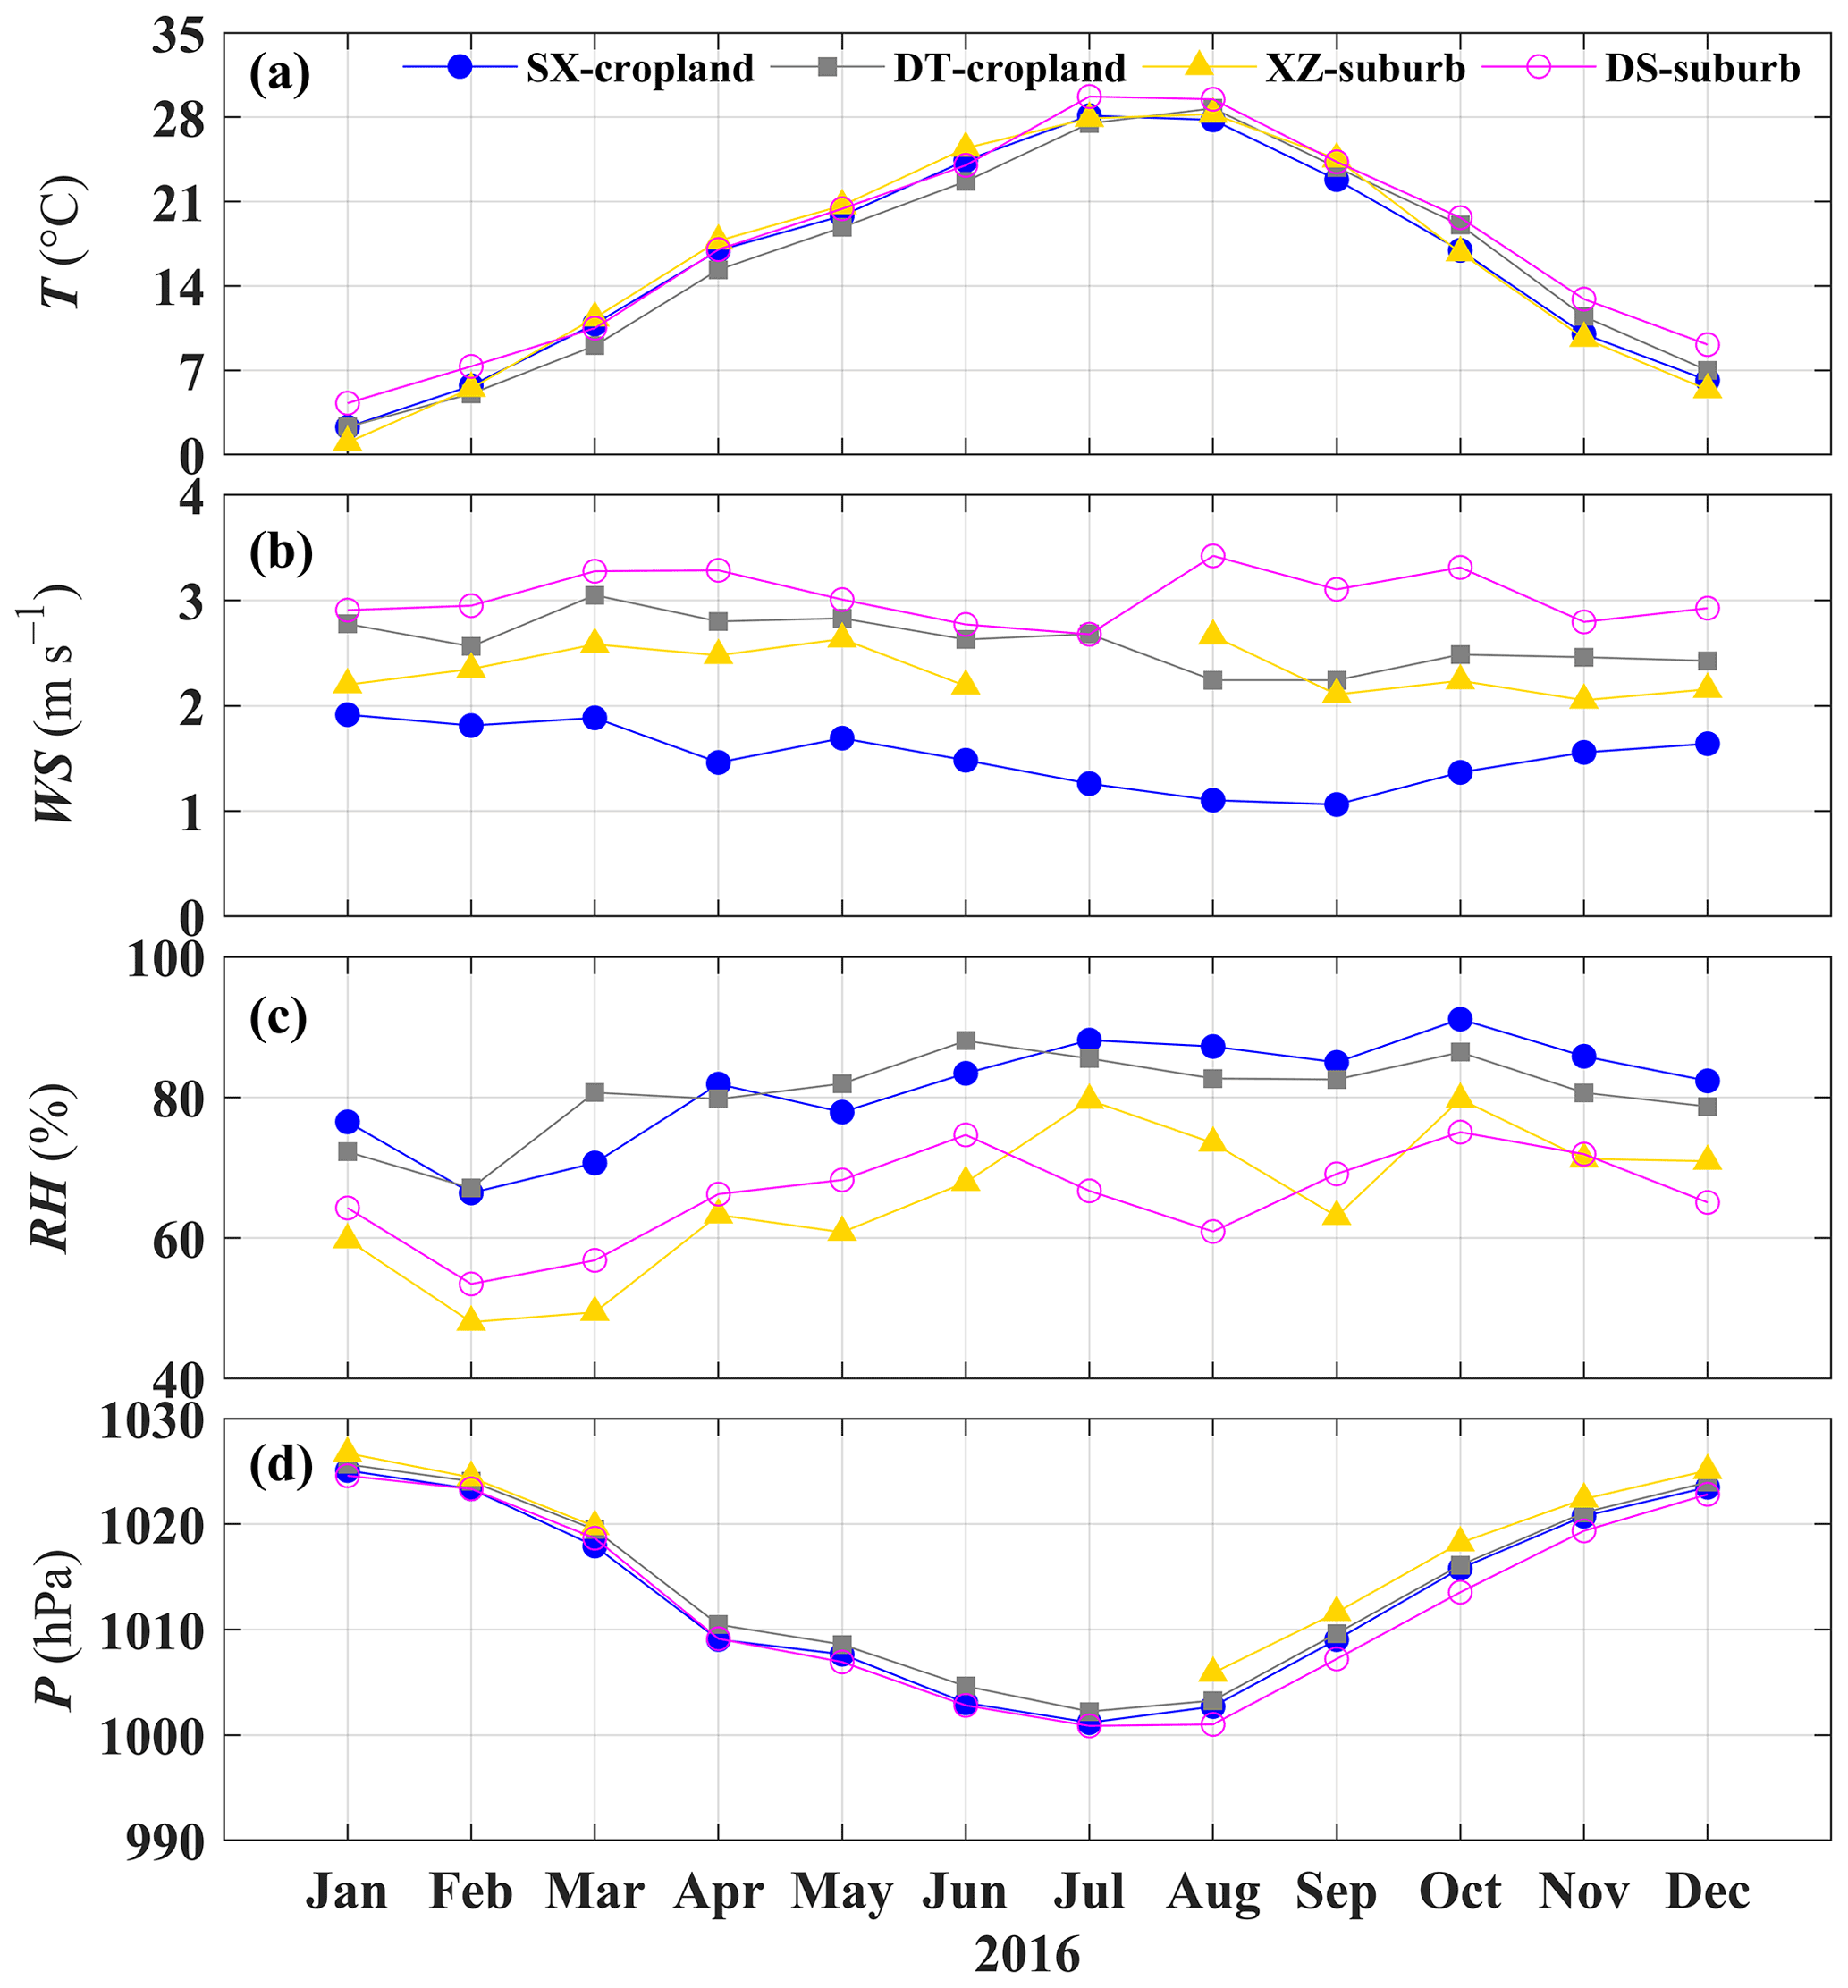
Figure 6Monthly mean (a) air temperature (T), (b) wind speed (WS), (c) relative humidity (RH), and (d) air pressure (P).
To advance the knowledge of land–atmosphere interactions in the YRD and facilitate the examination of the similarities and differences between the two typical land surface types, the analyses in 2016 are selected as an example in this section, due to the availability of measurements at all four sites.
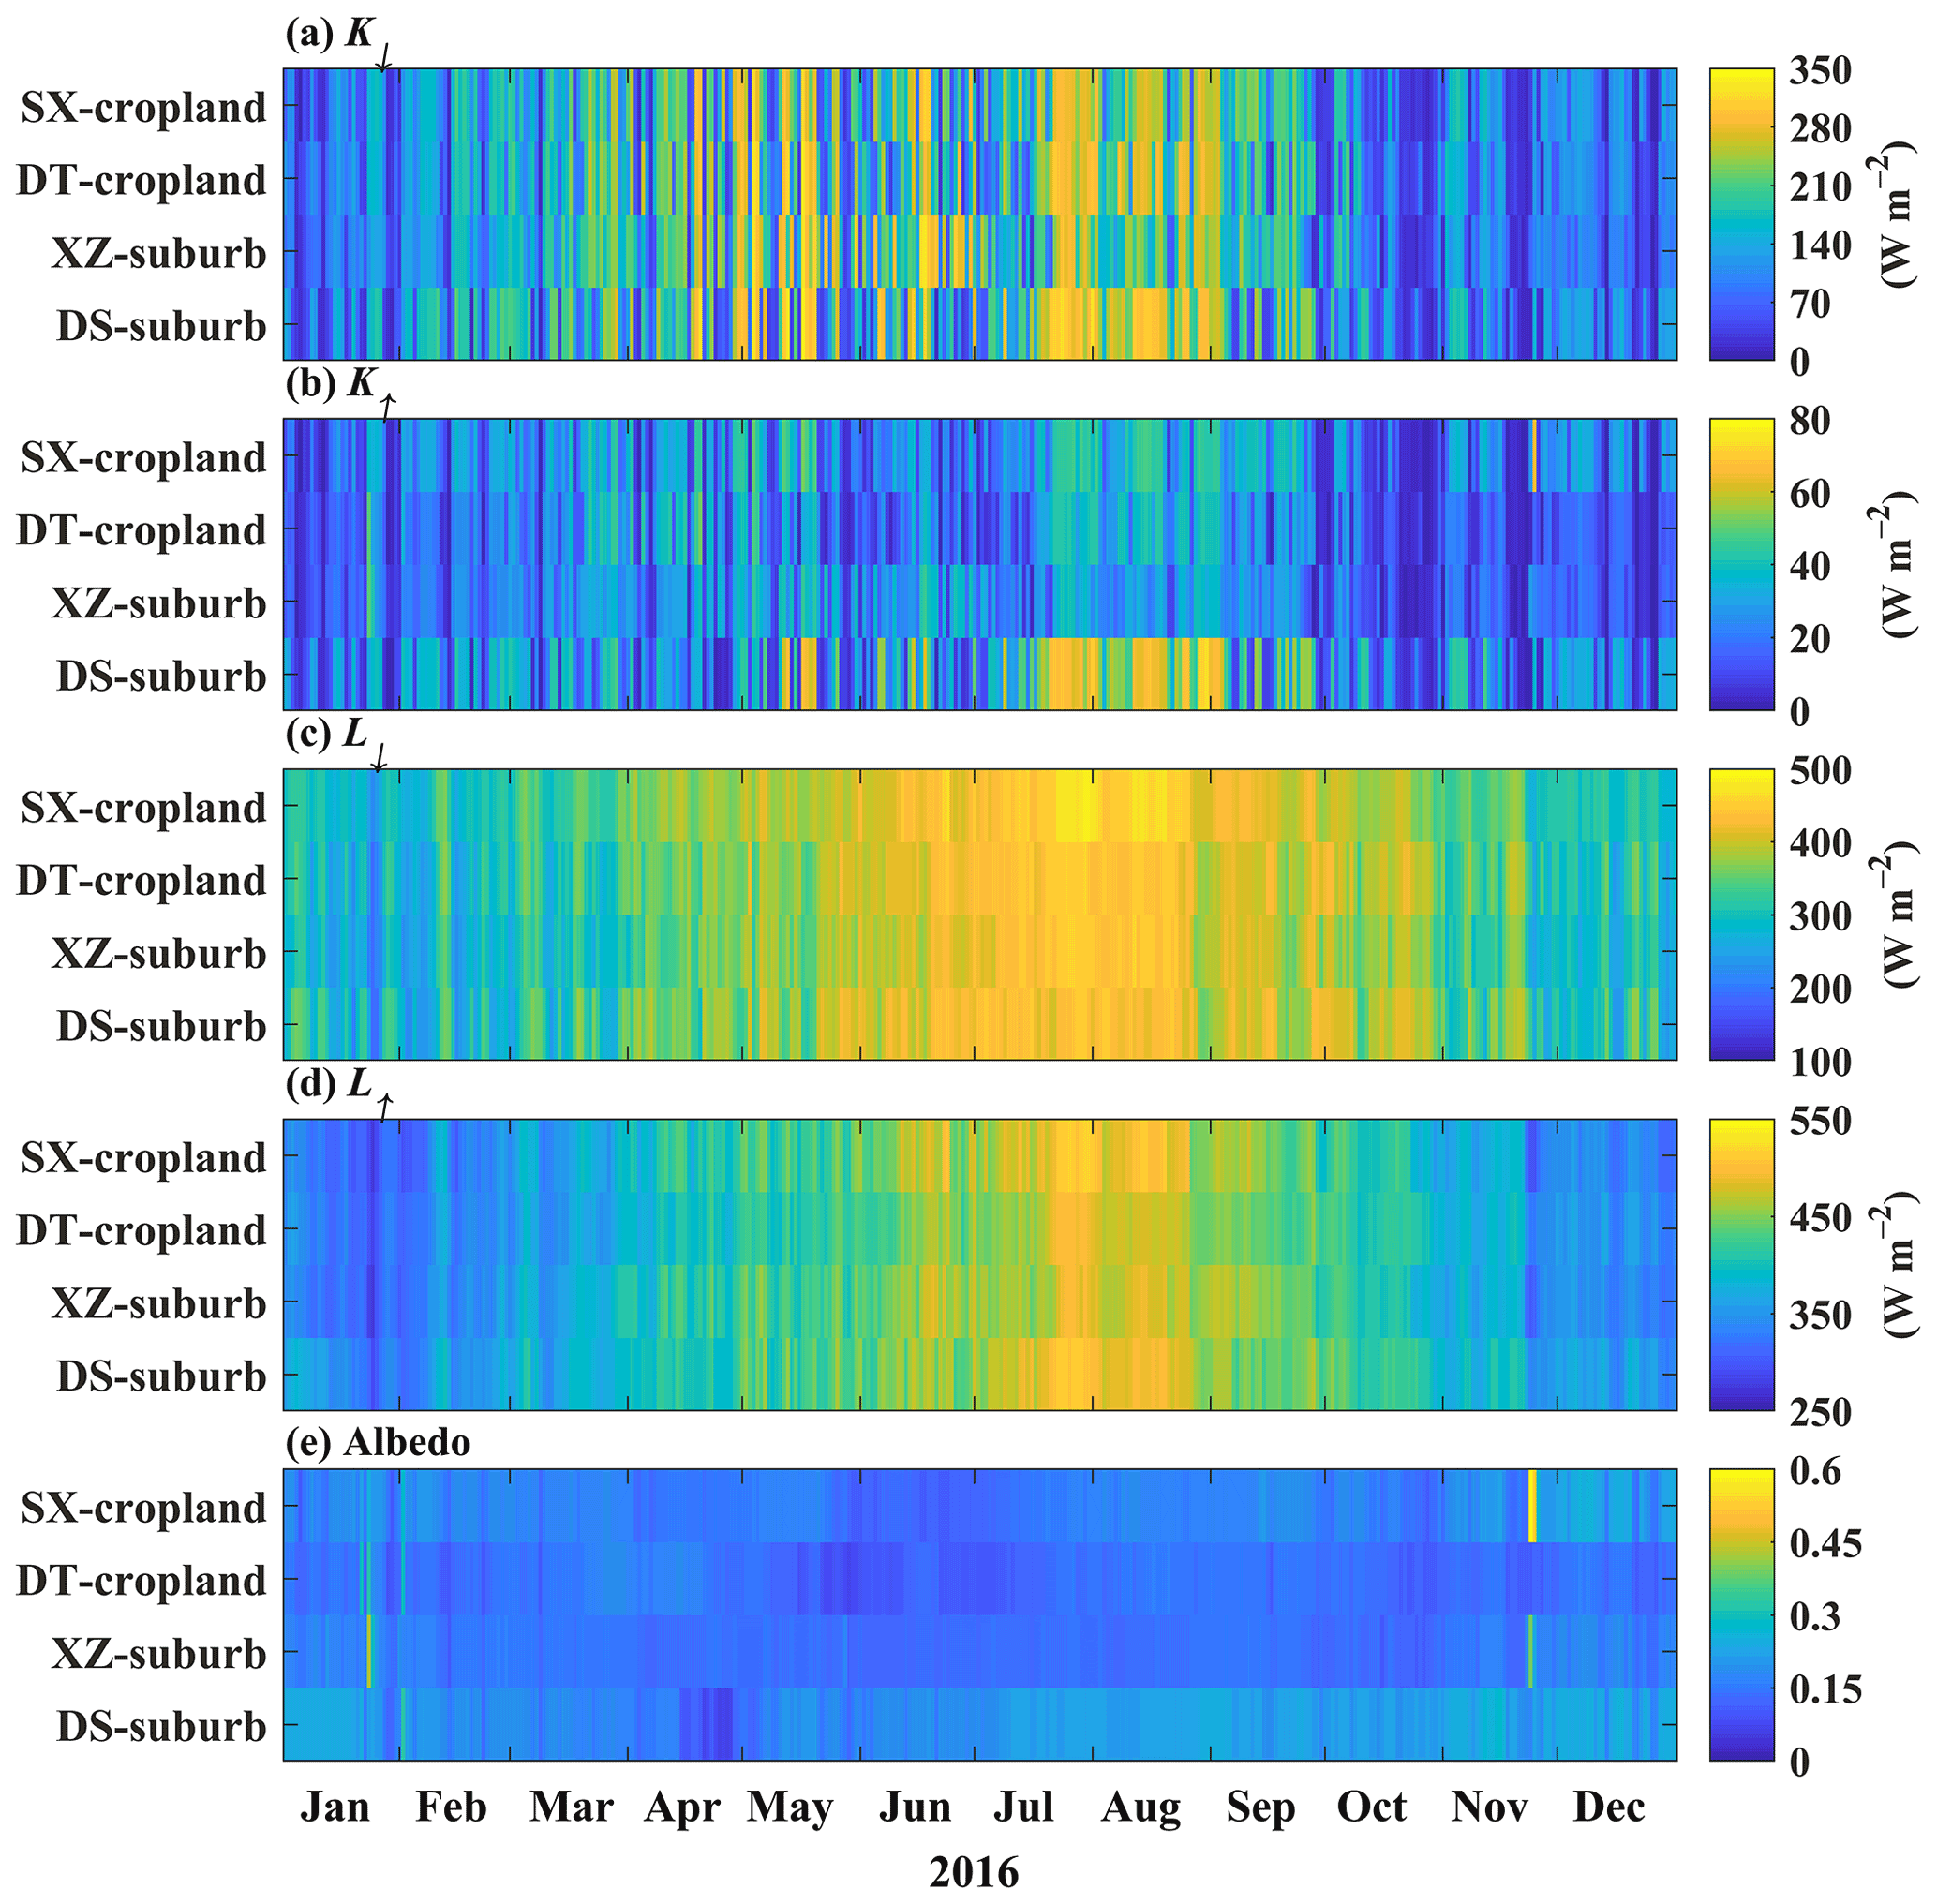
Figure 7Seasonal variations in daily mean (a) incoming shortwave radiation (K↓), (b) outgoing shortwave radiation (K↑), (c) incoming longwave radiation (L↓), (d) outgoing longwave radiation (L↑), and (e) surface albedo.
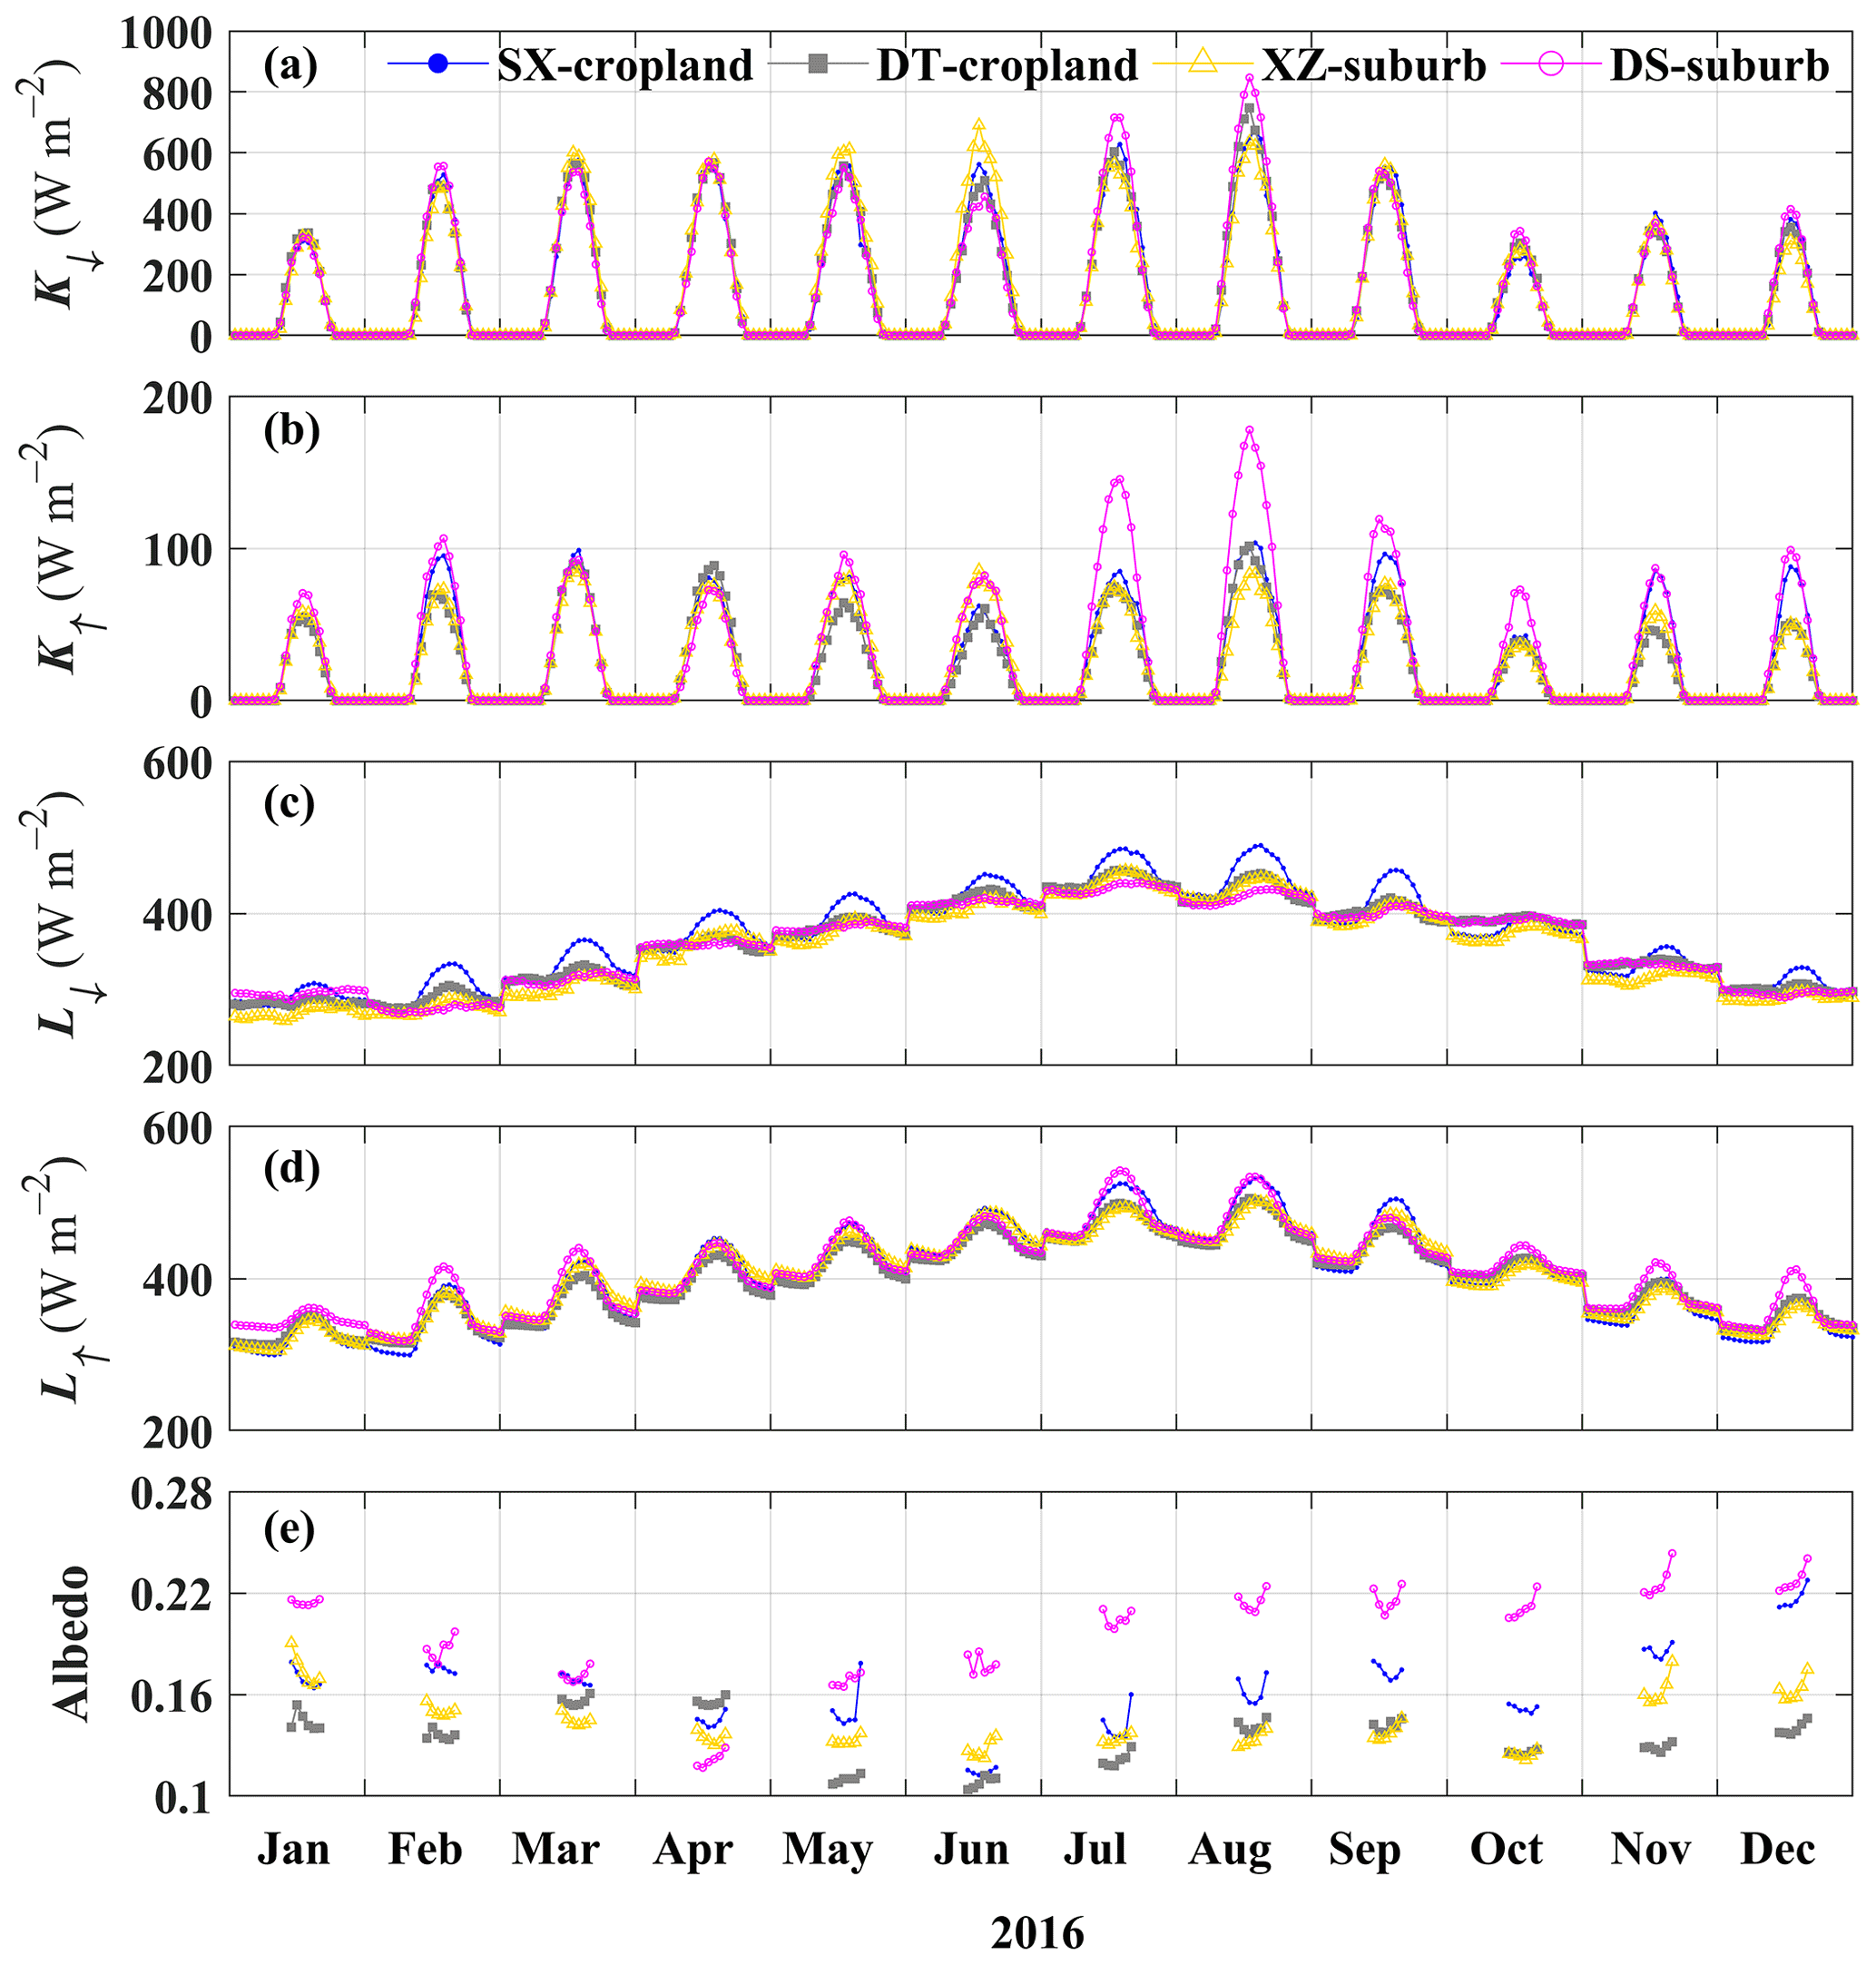
Figure 8Diurnal cycle of the monthly mean (a) incoming shortwave radiation (K↓), (b) outgoing shortwave radiation (K↑), (c) incoming longwave radiation (L↓), (d) outgoing longwave radiation (L↑), and (e) surface albedo.
3.1 Meteorological variables
The seasonal (spring, March–May; summer, June–August; autumn, September–November; and winter, December–February) dynamics of air temperature (T) were obvious across all four sites, with an annual mean that varied between 16 and 17.5 ∘C (Fig. 6a). The average monthly T was relatively high in summer (26–27 ∘C) but low in winter (4–7 ∘C) among the four sites. The differences in the T between the four sites were minimal. During the observation period, the annual mean wind speed (WS) was the highest at the DS-suburb site (∼ 3 m s−1), as it was measured at the highest observation height (20 m a.g.l.; Fig. 6b). The annual mean relative humidities at the two cropland sites (i.e., 74 % for the SX-cropland site and 80 % for the DT-cropland site) were larger than those at the two suburban sites (i.e., 66 % for both the XZ-suburb and DS-suburb sites; Fig. 6c). The seasonal variations in air pressure (P) were the inverse of those in air temperature at all four sites (Fig. 6a, d). P was high in winter (1023–1025 hPa) but low in summer (1002–1005 hPa) across all four sites (Fig. 6d).
3.2 Surface radiation budget
At the four sites, four surface radiative fluxes (incoming shortwave radiation, K↓; outgoing shortwave radiation, K↑; incoming longwave radiation, L↓; and outgoing longwave radiation, L↑) and the surface albedo varied seasonally (Fig. 7) and diurnally (Fig. 8) with the solar altitude (You et al., 2017). In addition, the seasonal variations in K↓ received at the surface were also greatly affected by weather and cloud conditions (X. Chen et al., 2016; Duan et al., 2021a). For instance, the highest daily mean K↓ was 317 W m−2 for the SX-cropland site, 329 W m−2 for the DT-cropland site, and 336 W m−2 for the DS-suburb site in May 2016, and it was 332 W m−2 for the XZ-suburb site in June 2016 (Fig. 7a). From May to June, the weather was sunny with fewer clouds, resulting in a higher daily mean K↓ despite the lower solar altitudes. The daily mean peak values of K↑ were 67 W m−2 for the SX-cropland site, 51 W m−2 for the DT-cropland site, 50 W m−2 for the XZ-suburb site, and 73 W m−2 for the DS-suburb site (Fig. 7b). The phenomenon of K↑ varying with both K↓ and surface albedo, as shown by Guo et al. (2016), was also similar to our present findings. For example, the highest daily mean K↑ at the SX-cropland site, which occurred on 29 November 2016, was mainly due to the high snow albedo (Fig. 7e). On the other hand, L↓ largely relied on air temperature, cloud properties, and water vapor (Flerchinger et al., 2009), which explains the daily mean L↓ being lowest during cold winter but highest during warm and wet summer, with peak daily means of 484, 459, 458, and 450 W m−2 for the SX-cropland, DT-cropland, XZ-suburb, and DS-suburb sites, respectively (Fig. 7c). L↑ is closely related to the surface temperature and emissivity (X. Chen et al., 2016); this is consistent with the observed daily mean L↑ showing maximum values in summer: 521 W m−2 for the SX-cropland site, 501 W m−2 for the DT-cropland site, 501 W m−2 for the XZ-suburb site, and 516 W m−2 for the DS-suburb site (Fig. 7d).

Figure 9As in Fig. 7 but for the (a) monthly mean net radiation (Rn), (b) latent heat flux (λE), (c) sensible heat flux (H), and (d) soil heat flux at a depth of 0.05 m (G0.05).
Figure 10Diurnal cycle of the monthly mean net radiation (Rn), latent heat flux (λE), sensible heat flux (H), and soil heat flux at a depth of 0.05 m (G0.05) at the (a) SX-cropland, (b) DT-cropland, (c) XZ-suburb, and (d) DS-suburb sites.
The diurnal cycles of the four radiation components for different months are shown in Fig. 8. As expected, K↓ exhibits the strongest amplitude of the diurnal cycle among all four of the radiation components, reaching up to 675 W m−2 for the SX-cropland site, 747 W m−2 for the DT-cropland site, 691 W m−2 for the XZ-suburb site, and 847 W m−2 for the DS-suburb site (Fig. 8a). K↑ shows similar diurnal variation trends to K↓. The monthly mean diurnal maxima of K↑ were 104 W m−2 for the SX-cropland site, 101 W m−2 for the DT-cropland site, 86 W m−2 for the XZ-suburb site, and 178 W m−2 for the DS-suburb site (Fig. 8b). Both L↓ and L↑ present a smaller diurnal cycle amplitude, with slightly higher values in the afternoon (around 14:00–15:00 LT, local time). Surface albedo () directly modulates the energy absorbed by the surface, which is mainly influenced by surface conditions, solar angle, and weather conditions (Zhang et al., 2014). The midday (10:00–15:00 LT) albedo varied diurnally between 0.1 and 0.26. The annual mean albedo was 0.163, 0.133, 0.143, and 0.195 for the SX-cropland, DT-cropland, XZ-suburb, and DS-suburb sites, respectively (Fig. 8e).
3.3 Surface energy fluxes
The surface energy balance fluxes play a key role in regulating the ground thermal regime (Hoelzle et al., 2022). Figure 9 shows the remarkable seasonal variations in daily mean Rn, λE, H, and G0.05 (G at a depth of 0.05 m). Both Rn and G0.05 were high in spring and summer but low in autumn and winter at the four sites in the YRD (Fig. 9a, d). Although the sites are in the same climate monsoon area, large differences existed in λE and H over different surface types. Seasonal variations in λE at the two cropland sites had doublet peaks, which were closely related to the crop phenology and agricultural activities (Duan et al., 2021a). For example, daily mean λE firstly increased from 3 W m−2 (5 W m−2) in January to a peak value of 110 W m−2 (182 W m−2) in April and then gradually decreased when wheat was harvested at the SX-cropland site (DT-cropland site). In mid-June, the rice seedlings were transplanted, and daily mean λE attained a second peak of 155 W m−2 (224 W m−2) in August at the SX-cropland site (DT-cropland site). The extensively irrigated cropland enhanced the available energy to support evaporation and resulted in lower H (Dou et al., 2019). Thus, the daily mean H at the two cropland sites was almost lower than 35 W m−2. However, λE had a unimodal distribution at the DS-suburb site in 2016, with daily mean peaks of 165 W m−2 in July (Fig. 9b). The daily mean H at XZ-suburb and DS-suburb varied from −21 to 70 and from −39 to 81 W m−2, respectively.
Figure 10 shows the significant diurnal dynamics of Rn, λE, H, and G0.05 in all months. As expected, Rn peaked at ∼ 13:00 LT during the daytime due to the strong heating of the surface by the sun, whereas it was negative (, with ; Fig. 8) at night when surface radiative cooling dominated (Nelli et al., 2020). The diurnal dynamics of Rn varied from −38 to 528, from −38 to 590, from −61 to 513, and from −64 to 562 W m−2 for the SX-cropland, DT-cropland, XZ-suburb, and DS-suburb sites, respectively. At the two cropland sites, λE was the largest consumer of Rn year-round, with an annual mean midday of 35 % and 58 % at the SX-cropland and DT-cropland sites, respectively. At XZ-suburb and DS-suburb, the two suburban sites, the midday ranged between 4 % and 55 % and between 16 % and 70 %, respectively, while ranged between 4 % and 49 % and between 29 % and 93 %, respectively; the largest consumer of Rn at these sites shifted between λE and H. These seasonal fluctuations in λE and H in the two suburban areas were mainly due to the seasonal cycles in vegetation cover and intensive human activities (Duan et al., 2021a). The G0.05 was small and varied between −20 and 40 W m−2 diurnally. Generally, radiation and heat fluxes showed distinct differences for the typical surface types in the monsoon area of the YRD, China.
3.4 Carbon flux
Figure 11a shows the seasonal variations in the daily mean CO2 flux. At the two rice–wheat rotation cropland sites, the CO2 flux measured the photosynthesis and respiration of the crops. At the beginning of the rice growing period (June), the CO2 emission was high at the two cropland sites, with a peak daily mean CO2 flux value of 2.4 µmol m−2 s−1 for the SX-cropland site and 5.5 µmol m−2 s−1 for the DT-cropland site. This was mainly caused by the CO2 released from aquatic weeds and algae on the paddy water surface (Nishimura et al., 2015). The daily mean CO2 flux reached its minima in August (−11 µmol m−2 s−1 for the SX-cropland site and −10 µmol m−2 s−1 for the DT-cropland site) when the rice photosynthetic rates were quite strong. Afterwards, the rice leaves gradually turned yellow and tended to mature. The wheat field had similar patterns to the rice paddy. At the XZ-suburb site, the daily mean CO2 flux was almost positive in spring, autumn, and winter, and the maximum daily mean value reached 6.5 µmol m−2 s−1, indicating the dominance of human activities (e.g., greater residential heating). At the DS-suburb site, the daily mean CO2 flux varied between −4 and 3 µmol m−2 s−1, with high values in May and low values in September.
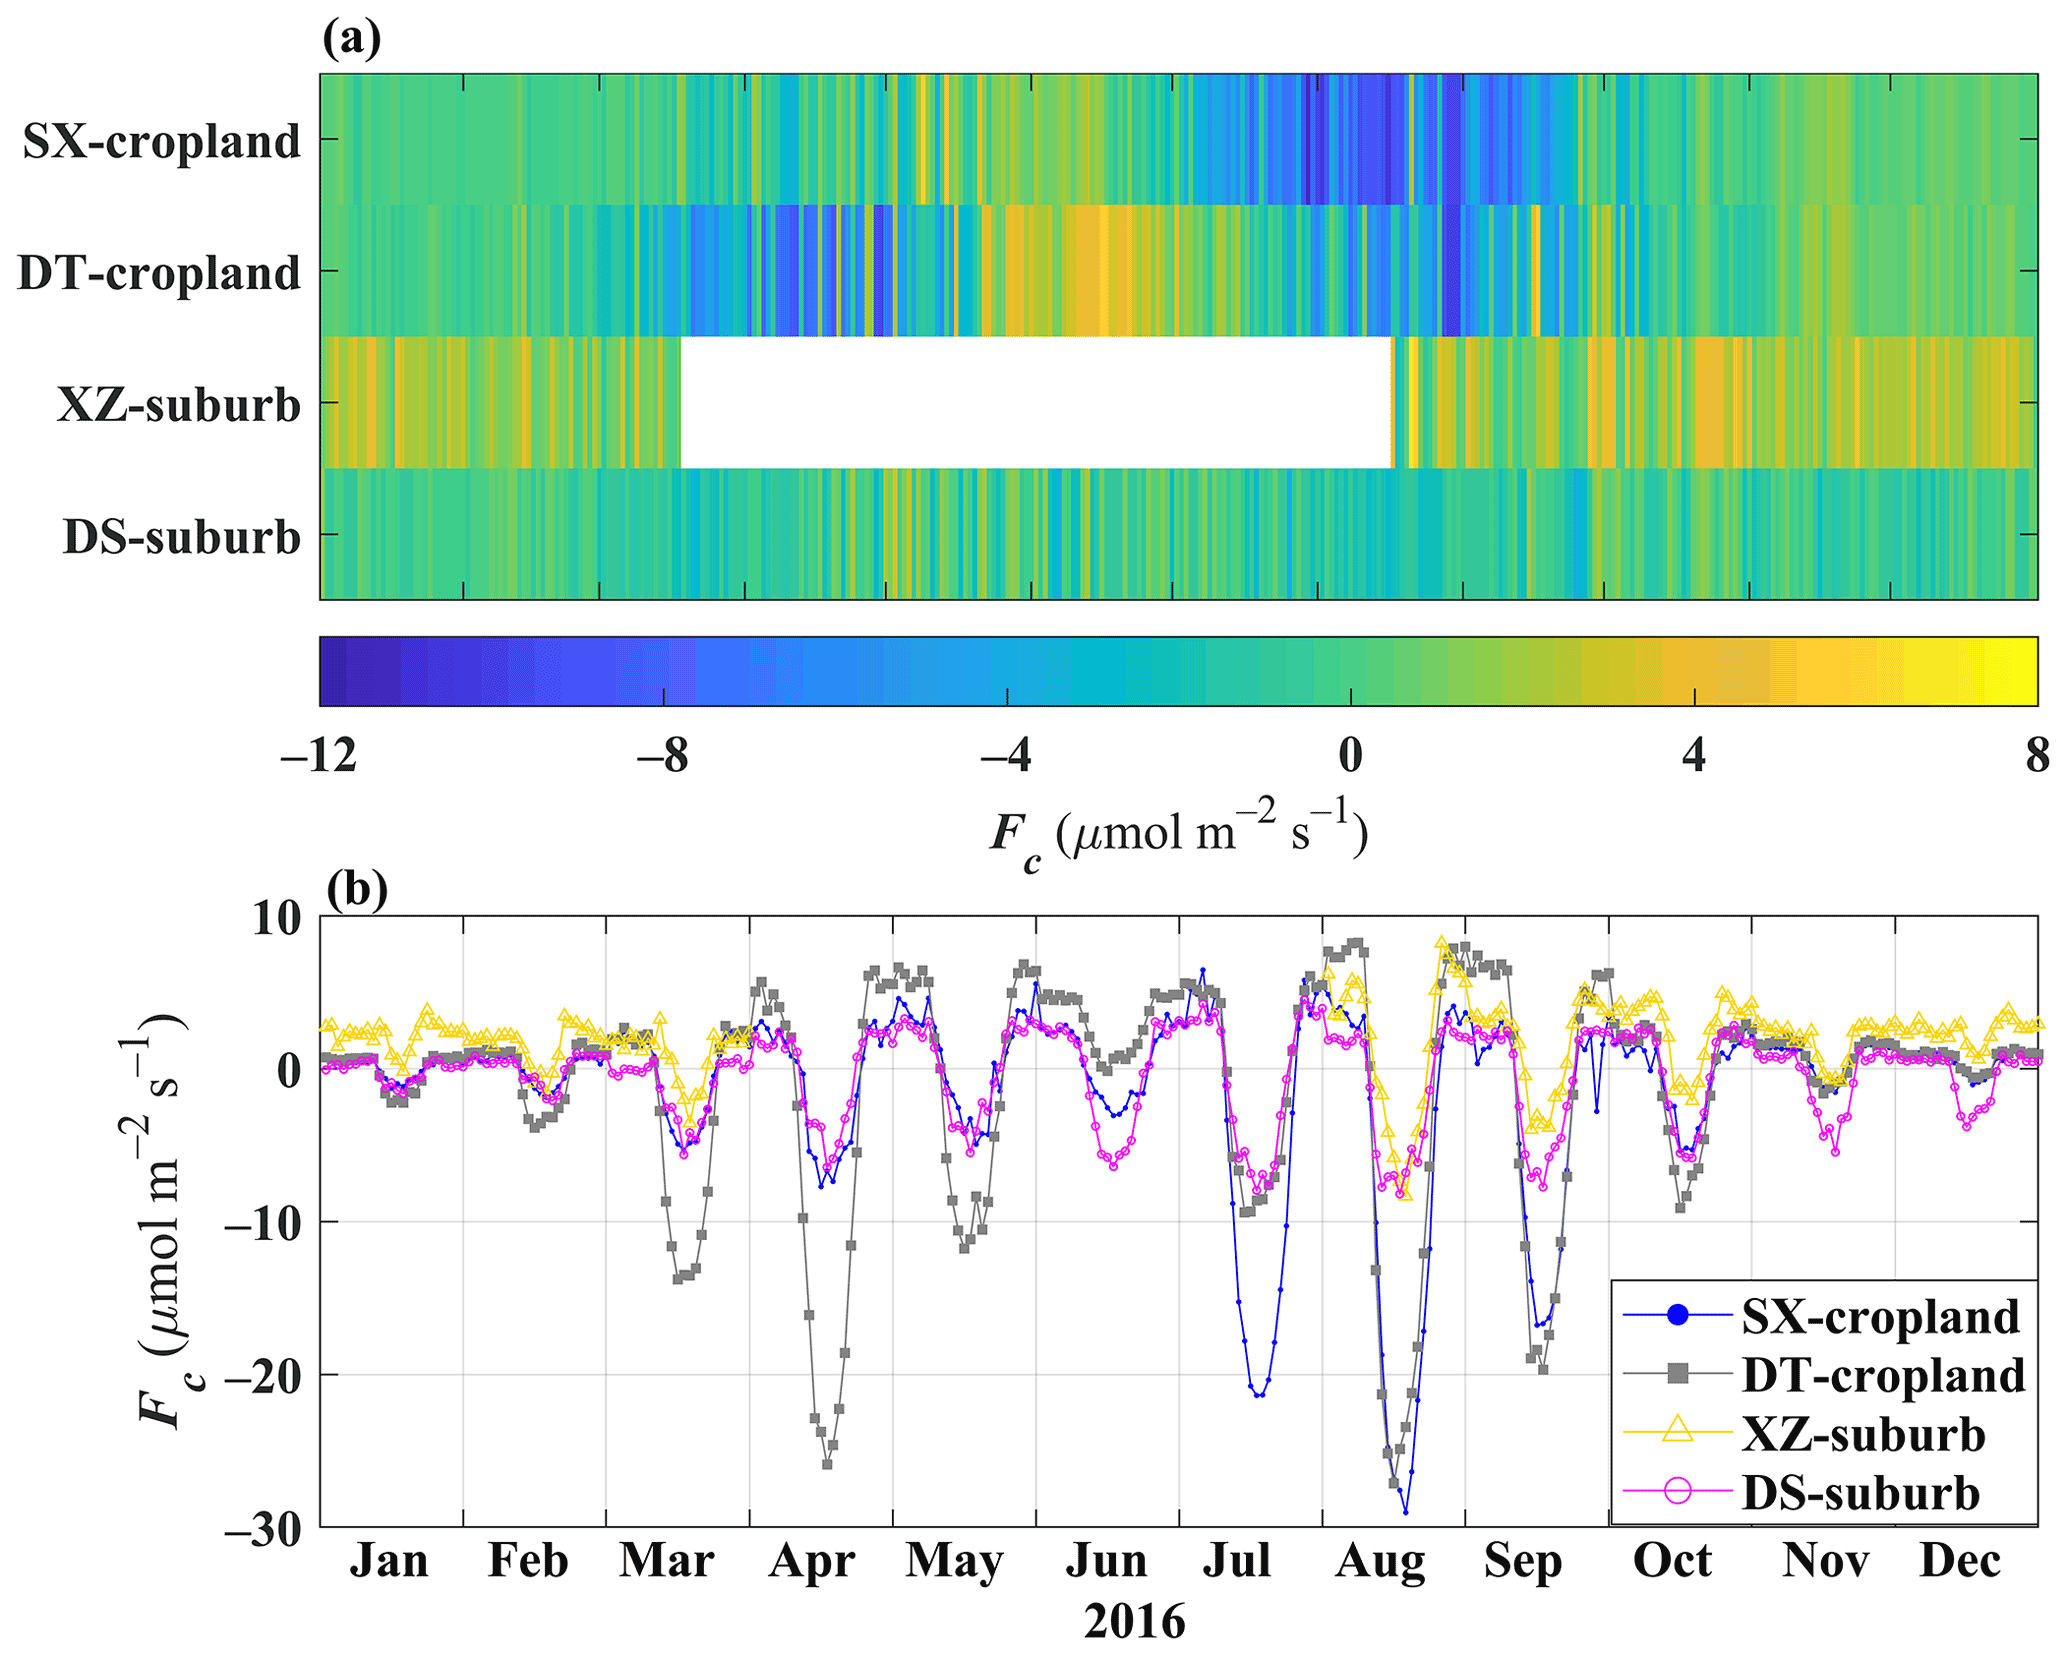
Figure 11(a) Seasonal and (b) monthly diurnal patterns of CO2 exchange at the four sites in 2016.
A marked and significant diurnal cycle of CO2 flux is shown in Fig. 11b. Positive nocturnal values, reaching 6.4, 8.2, 8.2, and 4.5 µmol m−2 s−1 for the SX-cropland, DT-cropland, XZ-suburb, and DS-suburb sites, respectively, were mainly related to the poor nighttime atmospheric mixing (Cheng et al., 2018), a lower boundary layer height (Hassan, 2015), plant respiration (Mai et al., 2020), and anthropogenic sources (Hu et al., 2018). The mid-afternoon negative CO2 fluxes (about −8–29 µmol m−2 s−1, where negative values refer to the fact that the ecosystem absorbs CO2 from the atmosphere) at the SX-cropland, DT-cropland, XZ-suburb, and DS-suburb sites were due to the active biospheric photosynthesis and favorable dispersion conditions (Grimmond et al., 2002). However, the CO2 flux almost remained positive in January and December (i.e., the suburban surface was a net CO2 source). The vegetation at the XZ-suburb site had a clear effect during the daytime, but it was not enough to offset the strong anthropogenic emissions, which are significant during the morning and afternoon rush hours (Fig. 11b).
All datasets presented in this paper are freely available at https://doi.org/10.5281/zenodo.6552301 (Duan et al., 2022). The local time (UTC+8) was used at the four sites.
The turbulent flux parameters in current numerical models suffer from poor representation in the monsoon region, especially in the YRD, as this region is experiencing rapid land use changes. Thus, continuous (2011–2019) and high-quality land–atmosphere interaction observations are needed in order to understand the land surface processes in the YRD. In this paper, field measurements over two typical underlying surfaces (i.e., cropland and suburb surface) were presented at four different sites in the monsoonal YRD region. Our findings show that the individual radiation components and the H, λE, G, and CO2 fluxes exhibited diurnal and seasonal variations, which also depended on the local underlying surface conditions. Using the year 2016 as an example, it was found that λE dominated the land–atmosphere heat flux exchange at the two cropland sites (SX-cropland and DT-cropland); however, the dominant consumer of Rn fluctuated between λE and H at the two suburban sites (XZ-suburb and DS-suburb), which could subsequently modulate the local climate.
Generally, this dataset provides comprehensive, high-temporal-resolution and high-quality in situ flux observations in the YRD that can be used to study land–atmosphere interactions and their impacts on weather change research. In addition, this dataset could provide accurate parameters and calibrations for reanalysis data, remote sensing products, carbon flux modeling and inversion, and climate models.
GZ, QK, and YY designed the experiments and carried them out. DZ, XQ, and ZS performed data processing, organization, and figure generation. DZ and YY wrote the manuscript, and all authors participated in the revision of the paper.
The contact author has declared that none of the authors has any competing interests.
Publisher's note: Copernicus Publications remains neutral with regard to jurisdictional claims in published maps and institutional affiliations.
The authors sincerely thank all of the scientists, engineers, and students who participated in the field campaigns, maintained the measurement instruments, and processed the observations. We are grateful to the anonymous reviewers for their useful comments and suggestions. The authors also wish to acknowledge the Level-1 and Atmosphere Archive & Distribution System Distributed Active Archive Center for the MODIS MCD12Q1 data (https://ladsweb.modaps.eosdis.nasa.gov/search/, last access: 17 August 2022).
This work was funded by the National Natural Science Foundation of China (grant no. 41875013) and the Postgraduate Research and Practice Innovation Program of Jiangsu Province (grant no. KYCX21_0950).
This paper was edited by Qingxiang Li and reviewed by two anonymous referees.
Ao, X., Grimmond, C. S. B., Chang, Y., Liu, D., Tang, Y., Hu, P., Wang, Y., Zou, J., and Tan, J.: Heat, water and carbon exchanges in the tall megacity of Shanghai: challenges and results, Int. J. Climatol., 36, 4608–4624, https://doi.org/10.1002/joc.4657, 2016.
Baldocchi, D. and Ma, S.: How will land use affect air temperature in the surface boundary layer? Lessons learned from a comparative study on the energy balance of an oak savanna and annual grassland in California, USA, Tellus Ser. B, 65, 19994, https://doi.org/10.3402/tellusb.v65i0.19994, 2013.
Baldocchi, D. D.: Assessing the eddy covariance technique for evaluating carbon dioxide exchange rates of ecosystems: past, present and future, Glob. Change Biol., 9, 479–492, https://doi.org/10.1046/j.1365-2486.2003.00629.x, 2003.
Bi, X., Gao, Z., Deng, X., Wu, D., Liang, J., Zhang, H., Sparrow, M., Du, J., Li, F., and Tan, H.: Seasonal and diurnal variations in moisture, heat, and CO2 fluxes over grassland in the tropical monsoon region of southern China, J. Geophys. Res.-Atmos., 112, D10106, https://doi.org/10.1029/2006JD007889, 2007.
Bian, L., Gao, Z., Xu, Q., Lu, L., and Cheng, Y.: Measurements of turbulence transfer in the near-surface layer over the southeastern Tibetan Plateau, Bound.-Lay. Meteorol., 102, 281–300, https://doi.org/10.1023/A:1013177629245, 2002.
Chen, C., Li, D., Gao, Z., Tang, J., Guo, X., Wang, L., and Wan, B.: Seasonal and Interannual Variations of Carbon Exchange over a Rice-Wheat Rotation System on the North China Plain, Adv. Atmos. Sci., 32, 1365–1380, https://doi.org/10.1007/s00376-015-4253-1, 2015.
Chen, H., Zhang, Y., Yu, M., Hua, W., Sun, S., Li, X., and Gao, C.: Large-scale urbanization effects on eastern Asian summer monsooncirculation and climate, Clim. Dynam., 47, 117–136, https://doi.org/10.1007/s00382-015-2827-3, 2016.
Chen, H. S. and Zhang, Y.: Sensitivity experiments of impacts of large-scale urbanization in East China on East Asian winter monsoon, Chinese Sci. Bull., 58, 809–815, https://doi.org/10.1007/s11434-012-5579-z, 2013.
Chen, S., Yang, Y., Deng, F., Zhang, Y., Liu, D., Liu, C., and Gao, Z.: A high-resolution monitoring approach of canopy urban heat island using a random forest model and multi-platform observations, Atmos. Meas. Tech., 15, 735–756, https://doi.org/10.5194/amt-15-735-2022, 2022.
Chen, X., Yu, Y., Chen, J., Zhang, T., and Li, Z.: Seasonal and interannual variation of radiation and energy fluxes over a rain-fed cropland in the semi-arid area of Loess Plateau, northwestern China, Atmos. Res., 176–177, 240–253, https://doi.org/10.1016/j.atmosres.2016.03.003, 2016.
Cheng, X. L., Liu, X. M., Liu, Y. J., and Hu, F.: Characteristics of CO2 Concentration and Flux in the Beijing Urban Area, J. Geophys. Res.-Atmos., 123, 1785–1801, https://doi.org/10.1002/2017JD027409, 2018.
Cuntz, M., Mai, J., Samaniego, L., Clark, M., Wulfmeyer, V., Branch, O., Attinger, S., and Thober, S.: The impact of standard and hard-coded parameters on the hydrologic fluxes in the Noah-MP land surface model, J. Geophys. Res.-Atmos., 121, 10676–10700, https://doi.org/10.1002/2016JD025097, 2016.
Dai, S., Ju, W., Zhang, Y., He, Q., Song, L., and Li, J.: Variations and drivers of methane fluxes from a rice-wheat rotation agroecosystem in eastern China at seasonal and diurnal scales, Sci. Total Environ., 690, 973–990, https://doi.org/10.1016/j.scitotenv.2019.07.012, 2019.
Dou, J., Grimmond, S., Cheng, Z., Miao, S., Feng, D., and Liao, M.: Summertime surface energy balance fluxes at two Beijing sites, International J. Climatol., 39, 2793–2810, https://doi.org/10.1002/joc.5989, 2019.
Duan, Z., Grimmond, C. S. B., Gao, C. Y., Sun, T., Liu, C., Wang, L., Li, Y., and Gao, Z.: Seasonal and Interannual Variations in the Surface Energy Fluxes of a Rice–Wheat Rotation in Eastern China, J. Appl. Meteorol. Clim., 60, 877–891, https://doi.org/10.1175/jamc-d-20-0233.1, 2021a.
Duan, Z., Yang, Y., Wang, L., Liu, C., Fan, S., Chen, C., Tong, Y., Lin, X., and Gao, Z.: Temporal characteristics of carbon dioxide and ozone over a rural-cropland area in the Yangtze River Delta of eastern China, Sci. Total Environ., 757, 143750, https://doi.org/10.1016/j.scitotenv.2020.143750, 2021b.
Duan, Z., Gao, Z., Xu, Q., Zhou, S., Qin, K., and Yang, Y.: A benchmark dataset of diurnal- and seasonal-scale radiation, heat and CO2 fluxes in a typical East Asian monsoon region, Zenodo [data set], https://doi.org/10.5281/zenodo.6552301, 2022.
Feddema, J. J., Oleson, K. W., Bonan, G. B., Mearns, L. O., Buja, L. E., Meehl, G. A., and Washington, W. M.: The importance of land-cover change in simulating future climates, Science, 310, 1674–1678, https://doi.org/10.1126/science.1118160, 2005.
Flerchinger, G. N., Xaio, W., Marks, D., Sauer, T. J., and Yu, Q.: Comparison of algorithms for incoming atmospheric long-wave radiation, Water Resour. Res., 45, W03423, https://doi.org/10.1029/2008WR007394, 2009.
Gao, Z., Chae, N., Kim, J., Hong, J., Choi, T., and Lee, H.: Modeling of surface energy partitioning, surface temperature, and soil wetness in the Tibetan prairie using the Simple Biosphere Model 2 (SiB2), J. Geophys. Res.-Atmos., 109, D06102, https://doi.org/10.1029/2003JD004089, 2004.
Ge, H., Zhang, H., Zhang, H., Cai, X., Song, Y., and Kang, L.: The characteristics of methane flux from an irrigated rice farm in East China measured using the eddy covariance method, Agr. Forest Meteorol., 249, 228–238, https://doi.org/10.1016/j.agrformet.2017.11.010, 2018.
Grimmond, C. S. B., King, T. S., Cropley, F. D., Nowak, D. J., and Souch, C.: Local-scale fluxes of carbon dioxide in urban environments: methodological challenges and results from Chicago, Environ. Pollut., 116, S243–S254, https://doi.org/10.1016/S0269-7491(01)00256-1, 2002.
Guo, W., Wang, X., Sun, J., Ding, A., and Zou, J.: Comparison of land–atmosphere interaction at different surface types in the mid- to lower reaches of the Yangtze River valley, Atmos. Chem. Phys., 16, 9875–9890, https://doi.org/10.5194/acp-16-9875-2016, 2016.
Hassan, A. A.: Diurnal and Monthly Variations in Atmospheric CO2 Level in Qena, Upper Egypt, Resour. Environ., 5, 59–65, 2015.
Hoelzle, M., Hauck, C., Mathys, T., Noetzli, J., Pellet, C., and Scherler, M.: Long-term energy balance measurements at three different mountain permafrost sites in the Swiss Alps, Earth Syst. Sci. Data, 14, 1531–1547, https://doi.org/10.5194/essd-14-1531-2022, 2022.
Hu, C., Liu, S. D., Wang, Y. W., Zhang, M., Xiao, W., Wang, W., and Xu, J. P.: Anthropogenic CO2 emissions from a megacity in the Yangtze River Delta of China, Environ. Sci. Pollut. Res., 25, 23157–23169, https://doi.org/10.1007/s11356-018-2325-3, 2018.
Huang, W., Griffis, T. J., Hu, C., Xiao, W., and Lee, X.: Seasonal Variations of CH4 Emissions in the Yangtze River Delta Region of China Are Driven by Agricultural Activities, Adv. Atmos. Sci., 38, 1537–1551, https://doi.org/10.1007/s00376-021-0383-9, 2021.
Jin, Y. and Roy, D. P.: Fire-induced albedo change and its radiative forcing at the surface in northern Australia, Geophys. Res. Lett., 32, L13401, https://doi.org/10.1029/2005GL022822, 2005.
Kaimal, J. C. and Finnigan, J. J.: Atmospheric Boundary Layer Flows: Their Structure and Measurement, Oxford University Press, New York, 302 pp., https://doi.org/10.1093/oso/9780195062397.001.0001, 1994.
Kang, M. and Cho, S.: Progress in water and energy flux studies in Asia: A review focused on eddy covariance measurements, J. Agr. Meteorol., 77, 2–23, https://doi.org/10.2480/agrmet.D-20-00036, 2021.
Kljun, N., Calanca, P., Rotach, M. W., and Schmid, H. P.: A simple two-dimensional parameterisation for Flux Footprint Prediction (FFP), Geosci. Model Dev., 8, 3695–3713, https://doi.org/10.5194/gmd-8-3695-2015, 2015.
Lee, B., Kim, N., Kim, E., Jang, K., Kang, M., Lim, J., Cho, J., and Lee, Y.: An Artificial Intelligence Approach to Predict Gross Primary Productivity in the Forests of South Korea Using Satellite Remote Sensing Data, Forests, 11, 1000, https://doi.org/10.3390/f11091000, 2020.
Lee, X., Massman, W., and Law, B.: Handbook of micrometeorology: a guide for surface flux measurement and analysis, Springer Dordrecht, https://doi.org/10.1007/1-4020-2265-4, 2004.
Lee, X., Liu, S., Xiao, W., Wang, W., Gao, Z., Cao, C., Hu, C., Hu, Z., Shen, S., Wang, Y., Wen, X., Xiao, Q., Xu, J., Yang, J., and Zhang, M.: The Taihu Eddy Flux Network: An Observational Program on Energy, Water, and Greenhouse Gas Fluxes of a Large Freshwater Lake, B. Am. Meteorol. Soc., 95, 1583–1594, https://doi.org/10.1175/BAMS-D-13-00136.1, 2014.
Li, D. and Wang, L.: Sensitivity of Surface Temperature to Land Use and Land Cover Change-Induced Biophysical Changes: The Scale Issue, Geophys. Res. Lett., 46, 9678–9689, https://doi.org/10.1029/2019GL084861, 2019.
Li, D., Sun, T., Liu, M. F., Yang, L., Wang, L. L., and Gao, Z. Q.: Contrasting responses of urban and rural surface energy budgets to heat waves explain synergies between urban heat islands and heat waves, Environ. Res. Lett., 10, 054009, https://doi.org/10.1088/1748-9326/10/5/054009, 2015.
Li, Q. and Xue, Y. K.: Simulated impacts of land cover change on summer climate in the Tibetan Plateau, Environ. Res. Lett., 5, 015102, https://doi.org/10.1088/1748-9326/5/1/015102, 2010.
Li, X., Gao, Z., Li, Y., and Tong, B.: Comparison of Sensible Heat Fluxes Measured by a Large Aperture Scintillometer and Eddy Covariance System over a Heterogeneous Farmland in East China, Atmosphere, 8, 101, https://doi.org/10.3390/atmos8060101, 2017.
Mai, B., Deng, X., Zhang, F., He, H., Luan, T., Li, F., and Liu, X.: Background Characteristics of Atmospheric CO2 and the Potential Source Regions in the Pearl River Delta Region of China, Adv. Atmos. Sci., 37, 557–568, https://doi.org/10.1007/s00376-020-9238-z, 2020.
Martano, P.: Estimation of Surface Roughness Length and Displacement Height from Single-Level Sonic Anemometer Data, J. Appl. Meteorol., 39, 708–715, https://doi.org/10.1175/1520-0450(2000)039<0708:eosrla>2.0.co;2, 2000.
Michel, D., Philipona, R., Ruckstuhl, C., Vogt, R., and Vuilleumier, L.: Performance and Uncertainty of CNR1 Net Radiometers during a One-Year Field Comparison, J. Atmos. Ocean. Tech., 25, 442–451, https://doi.org/10.1175/2007JTECHA973.1, 2008.
Nelli, N. R., Temimi, M., Fonseca, R. M., Weston, M. J., Thota, M. S., Valappil, V. K., Branch, O., Wizemann, H.-D., Wulfmeyer, V., and Wehbe, Y.: Micrometeorological measurements in an arid environment: Diurnal characteristics and surface energy balance closure, Atmos. Res., 234, 104745, https://doi.org/10.1016/j.atmosres.2019.104745, 2020.
Nishimura, S., Yonemura, S., Minamikawa, K., and Yagi, K.: Seasonal and diurnal variations in net carbon dioxide flux throughout the year from soil in paddy field, J. Geophys. Res.-Biogeo., 120, 63–76, https://doi.org/10.1002/2014JG002746, 2015.
Ohtaki, E. and Matsui, T.: Infrared device for simultaneous measurement of fluctuations of atmospheric carbon dioxide and water vapor, Bound.-Lay. Meteorol., 24, 109–119, https://doi.org/10.1007/BF00121803, 1982.
Rao, K. G. and Reddy, N. N.: On Moisture Flux of the Indian Summer Monsoon: A New Perspective, Geophys. Res. Lett., 46, 1794–1804, https://doi.org/10.1029/2018GL080392, 2019.
Ren, Z., Zhang, Z., Sun, C., Liu, Y., Li, J., Ju, X., Zhao, Y., Li, Z., Zhang, W., Li, H., Zeng, X., Re, X., Liu, Y., and Wang, H.: Development of three-step quality control system of real-time observation data from AWS in China, Meteorol. Monthly, 41, 1268–1277, https://doi.org/10.7519/j.issn.1000-0526.2015.10.010, 2015 (in Chinese).
Schmidt, M., Reichenau, T. G., Fiener, P., and Schneider, K.: The carbon budget of a winter wheat field: An eddy covariance analysis of seasonal and inter-annual variability, Agr. Forest Meteorol., 165, 114–126, https://doi.org/10.1016/j.agrformet.2012.05.012, 2012.
Sun, T., Wang, Z. H., and Ni, G. H.: Revisiting the hysteresis effect in surface energy budgets, Geophys. Res. Lett., 40, 1741–1747, https://doi.org/10.1002/grl.50385, 2013.
Tsai, J., Tsuang, B., Lu, P., Yao, M., and Shen, Y.: Surface Energy Components and Land Characteristics of a Rice Paddy, J. Appl. Meteorol. Clim., 46, 1879–1900, https://doi.org/10.1175/2007jamc1568.1, 2007.
Vickers, D. and Mahrt, L.: Quality Control and Flux Sampling Problems for Tower and Aircraft Data, J. Atmos. Ocean. Tech., 14, 512–526, https://doi.org/10.1175/1520-0426(1997)014<0512:qcafsp>2.0.co;2, 1997.
Wang, L., Fan, S., Hu, F., Miao, S., Yang, A., Li, Y., Liu, J., Liu, C., Chen, S., Ho, H. C., Duan, Z., Gao, Z., and Yang, Y.: Vertical Gradient Variations in Radiation Budget and Heat Fluxes in the Urban Boundary Layer: A Comparison Study Between Polluted and Clean Air Episodes in Beijing During Winter, J. Geophys. Res.-Atmos., 125, e2020JD032478, https://doi.org/10.1029/2020JD032478, 2020.
Wang, W., Xiao, W., Cao, C., Gao, Z., Hu, Z., Liu, S., Shen, S., Wang, L., Xiao, Q., Xu, J., Yang, D., and Lee, X.: Temporal and spatial variations in radiation and energy balance across a large freshwater lake in China, J. Hydrol., 511, 811–824, https://doi.org/10.1016/j.jhydrol.2014.02.012, 2014.
Webb, E. K., Pearman, G. I., and Leuning, R.: Correction of flux measurements for density effects due to heat and water vapour transfer, Q. J. Roy. Meteor. Soc., 106, 85–100, https://doi.org/10.1002/qj.49710644707, 1980.
Wei, C., Wang, M., Fu, Q., Dai, C., Huang, R., and Bao, Q.: Temporal characteristics of greenhouse gases (CO2 and CH4) in the megacity Shanghai, China: Association with air pollutants and meteorological conditions, Atmos. Res., 235, 104759, https://doi.org/10.1016/j.atmosres.2019.104759, 2020.
Xue, Y., Juang, H. M. H., Li, W. P., Prince, S., DeFries, R., Jiao, Y., and Vasic, R.: Role of land surface processes in monsoon development: East Asia and West Africa, J. Geophys. Res.-Atmos., 109, D03105, https://doi.org/10.1029/2003JD003556, 2004.
Yang, J. and Wang, Z.: Physical parameterization and sensitivity of urban hydrological models: Application to green roof systems, Build. Environ., 75, 250–263, https://doi.org/10.1016/j.buildenv.2014.02.006, 2014.
Yang, J., Wang, Z., and Huang, H.: Intercomparison of the Surface Energy Partitioning in CMIP5 Simulations, Atmosphere, 10, 602, https://doi.org/10.3390/atmos10100602, 2019.
Yang, Y., Zhang, M., Li, Q., Chen, B., Gao, Z., Ning, G., Liu, C., Li, Y., and Luo, M.: Modulations of surface thermal environment and agricultural activity on intraseasonal variations of summer diurnal temperature range in the Yangtze River Delta of China, Sci. Total Environ., 736, 139445, https://doi.org/10.1016/j.scitotenv.2020.139445, 2020a.
Yang, Y., Fan, S., Wang, L., Gao, Z., Zhang, Y., Zou, H., Miao, S., Li, Y., Huang, M., Yim, S. H. L., and Lolli, S.: Diurnal Evolution of the Wintertime Boundary Layer in Urban Beijing, China: Insights from Doppler Lidar and a 325-m Meteorological Tower, Remote Sensing, 12, 3935, https://doi.org/10.3390/rs12233935, 2020b.
You, Q., Xue, X., Peng, F., Dong, S., and Gao, Y.: Surface water and heat exchange comparison between alpine meadow and bare land in a permafrost region of the Tibetan Plateau, Agr. Forest Meteorol., 232, 48–65, https://doi.org/10.1016/j.agrformet.2016.08.004, 2017.
Zhang, Y., Wang, X., Hu, R., Pan, Y., and Zhang, H.: Variation of albedo to soil moisture for sand dunes and biological soil crusts in arid desert ecosystems, Environ. Earth Sci., 71, 1281–1288, https://doi.org/10.1007/s12665-013-2532-7, 2014.
Zhang, Y., Ning, G., Chen, S., and Yang, Y.: Impact of Rapid Urban Sprawl on the Local Meteorological Observational Environment Based on Remote Sensing Images and GIS Technology, Remote Sensing, 13, 2624, https://doi.org/10.3390/rs13132624, 2021.
Zhang, Z., Zhang, M., Cao, C., Wang, W., Xiao, W., Xie, C., Chu, H., Wang, J., Zhao, J., Jia, L., Liu, Q., Huang, W., Zhang, W., Lu, Y., Xie, Y., Wang, Y., Pu, Y., Hu, Y., Chen, Z., Qin, Z., and Lee, X.: A dataset of microclimate and radiation and energy fluxes from the Lake Taihu eddy flux network, Earth Syst. Sci. Data, 12, 2635–2645, https://doi.org/10.5194/essd-12-2635-2020, 2020.