the Creative Commons Attribution 4.0 License.
the Creative Commons Attribution 4.0 License.
 | 07 Sep 2022
A high spatial resolution soil carbon and nitrogen dataset for the northern permafrost region based on circumpolar land cover upscaling
Jaroslav Obu
Peter Kuhry
Andreas Richter
Matthias B. Siewert
Niels Weiss
Sebastian Westermann
Gustaf Hugelius
Soils in the northern high latitudes are a key component in the global carbon cycle; the northern permafrost region covers 22 % of the Northern Hemisphere land surface area and holds almost twice as much carbon as the atmosphere. Permafrost soil organic matter stocks represent an enormous long-term carbon sink which is in risk of switching to a net source in the future. Detailed knowledge about the quantity and the mechanisms controlling organic carbon storage is of utmost importance for our understanding of potential impacts of and feedbacks on climate change. Here we present a geospatial dataset of physical and chemical soil properties calculated from 651 soil pedons encompassing more than 6500 samples from 16 different study areas across the northern permafrost region. The aim of our dataset is to provide a basis to describe spatial patterns in soil properties, including quantifying carbon and nitrogen stocks. There is a particular need for spatially distributed datasets of soil properties, including vertical and horizontal distribution patterns, for modeling at local, regional, or global scales. This paper presents this dataset, describes in detail soil sampling; laboratory analysis, and derived soil geochemical parameters; calculations; and data clustering. Moreover, we use this dataset to estimate soil organic carbon and total nitrogen storage estimates in soils in the northern circumpolar permafrost region (17.9×10⁶ km2) using the European Space Agency's (ESA's) Climate Change Initiative (CCI) global land cover dataset at 300 m pixel resolution. We estimate organic carbon and total nitrogen stocks on a circumpolar scale (excluding Tibet) for the 0–100 and 0–300 cm soil depth to be 380 and 813 Pg for carbon, and 21 and 55 Pg for nitrogen, respectively. Our organic carbon estimates agree with previous studies, with most recent estimates of 1000 Pg (−170 to +186 Pg) to 300 cm depth. Two separate datasets are freely available on the Bolin Centre Database repository (https://doi.org/10.17043/palmtag-2022-pedon-1, Palmtag et al., 2022a; and https://doi.org/10.17043/palmtag-2022-spatial-1, Palmtag et al., 2002b).
- Article
(16418 KB) - Full-text XML
-
Supplement
(483 KB) - BibTeX
- EndNote


Permafrost soils represent a large part of the terrestrial carbon reservoir and form a significant and climate-sensitive component of the global carbon cycle (Hugelius et al., 2014). High-latitude ecosystems are experiencing rapid climate change causing warming of the soil, thawing of permafrost, and fluvial and coastal erosion (Biskaborn et al., 2019; Fritz et al., 2017). Warming enhances the decomposition of organic matter (OM) by microorganisms, which produces carbon dioxide, methane, and nitrous oxide. The release of these greenhouse gases to the atmosphere would in turn generate further climate change, resulting in a positive feedback on global warming (Turetsky et al., 2019). To better predict the magnitude and effect of environmental changes in the permafrost region, improved data on the properties and quantities of carbon and nitrogen stored in these climate vulnerable soils are needed.
In many cases, a lack of observational data for parameterization or evaluation can limit model development or accurate model projections (Flato, 2011). Soil properties such as OM content, soil texture, and soil moisture or their derivatives are commonly used to parametrize, train, or validate models (e.g., Oleson et al., 2010). Yet, the representation of northern soil profiles in global datasets remains limited (Köchy et al., 2015; Batjes, 2016); the northern circumpolar permafrost region (20.6×10⁶ km2) in which permafrost can occur accounts for 22 % of the Northern Hemisphere exposed land area (Obu et al., 2019).
Many previous studies have shown a robust relationship between land cover and soil organic carbon (SOC) distribution, making land cover datasets useful for upscaling estimates from soil profiles to full landscape coverage (e.g., Kuhry et al., 2002; Hugelius, 2012; Palmtag et al., 2015; Siewert et al., 2015; Wojcik et al., 2019). Here we describe the compilation of a harmonized soil dataset for permafrost-affected landscapes derived from 15 different high latitude sites and one high alpine study site in Canada, Greenland, Svalbard, Sweden, and Russia (Fig. 1; Table 1). In total, 651 soil pedons contain information from up to 6529 samples on carbon and nitrogen content, carbon to nitrogen () ratio, isotopic composition, texture (sand, silt + clay) and coarse fraction content, land cover type, wet and dry bulk density, calculated volumetric contents for ice/water, and volumetric content of organic soil material, mineral soil material, and air. Site data were upscaled to the northern circumpolar permafrost region using the European Space Agency (ESA) Climate Change Initiative (CCI) global land cover dataset at 300 m pixel resolution, which is the very first long-term global land cover time series product.
This study has two main aims. Firstly, the primary aim of this dataset is to provide a harmonized, high resolution, quality controlled, and contextualized soil pedon dataset with a focus on SOC, nitrogen, and other parameters essential to determine the role of northern permafrost region soils in the climate system. Particularly, the extensive metadata on soil properties included for many samples when available (texture, volumetric densities, active layer depth, ice content, isotopic composition, etc.) are of great importance, and can be used to identify and model the processes responsible for the current and future carbon balance. Secondly, we used this soil dataset and an existing spatial product for upscaling to provide a new and independent estimate of the SOC and total nitrogen (TN) storage estimates within the northern circumpolar permafrost region.
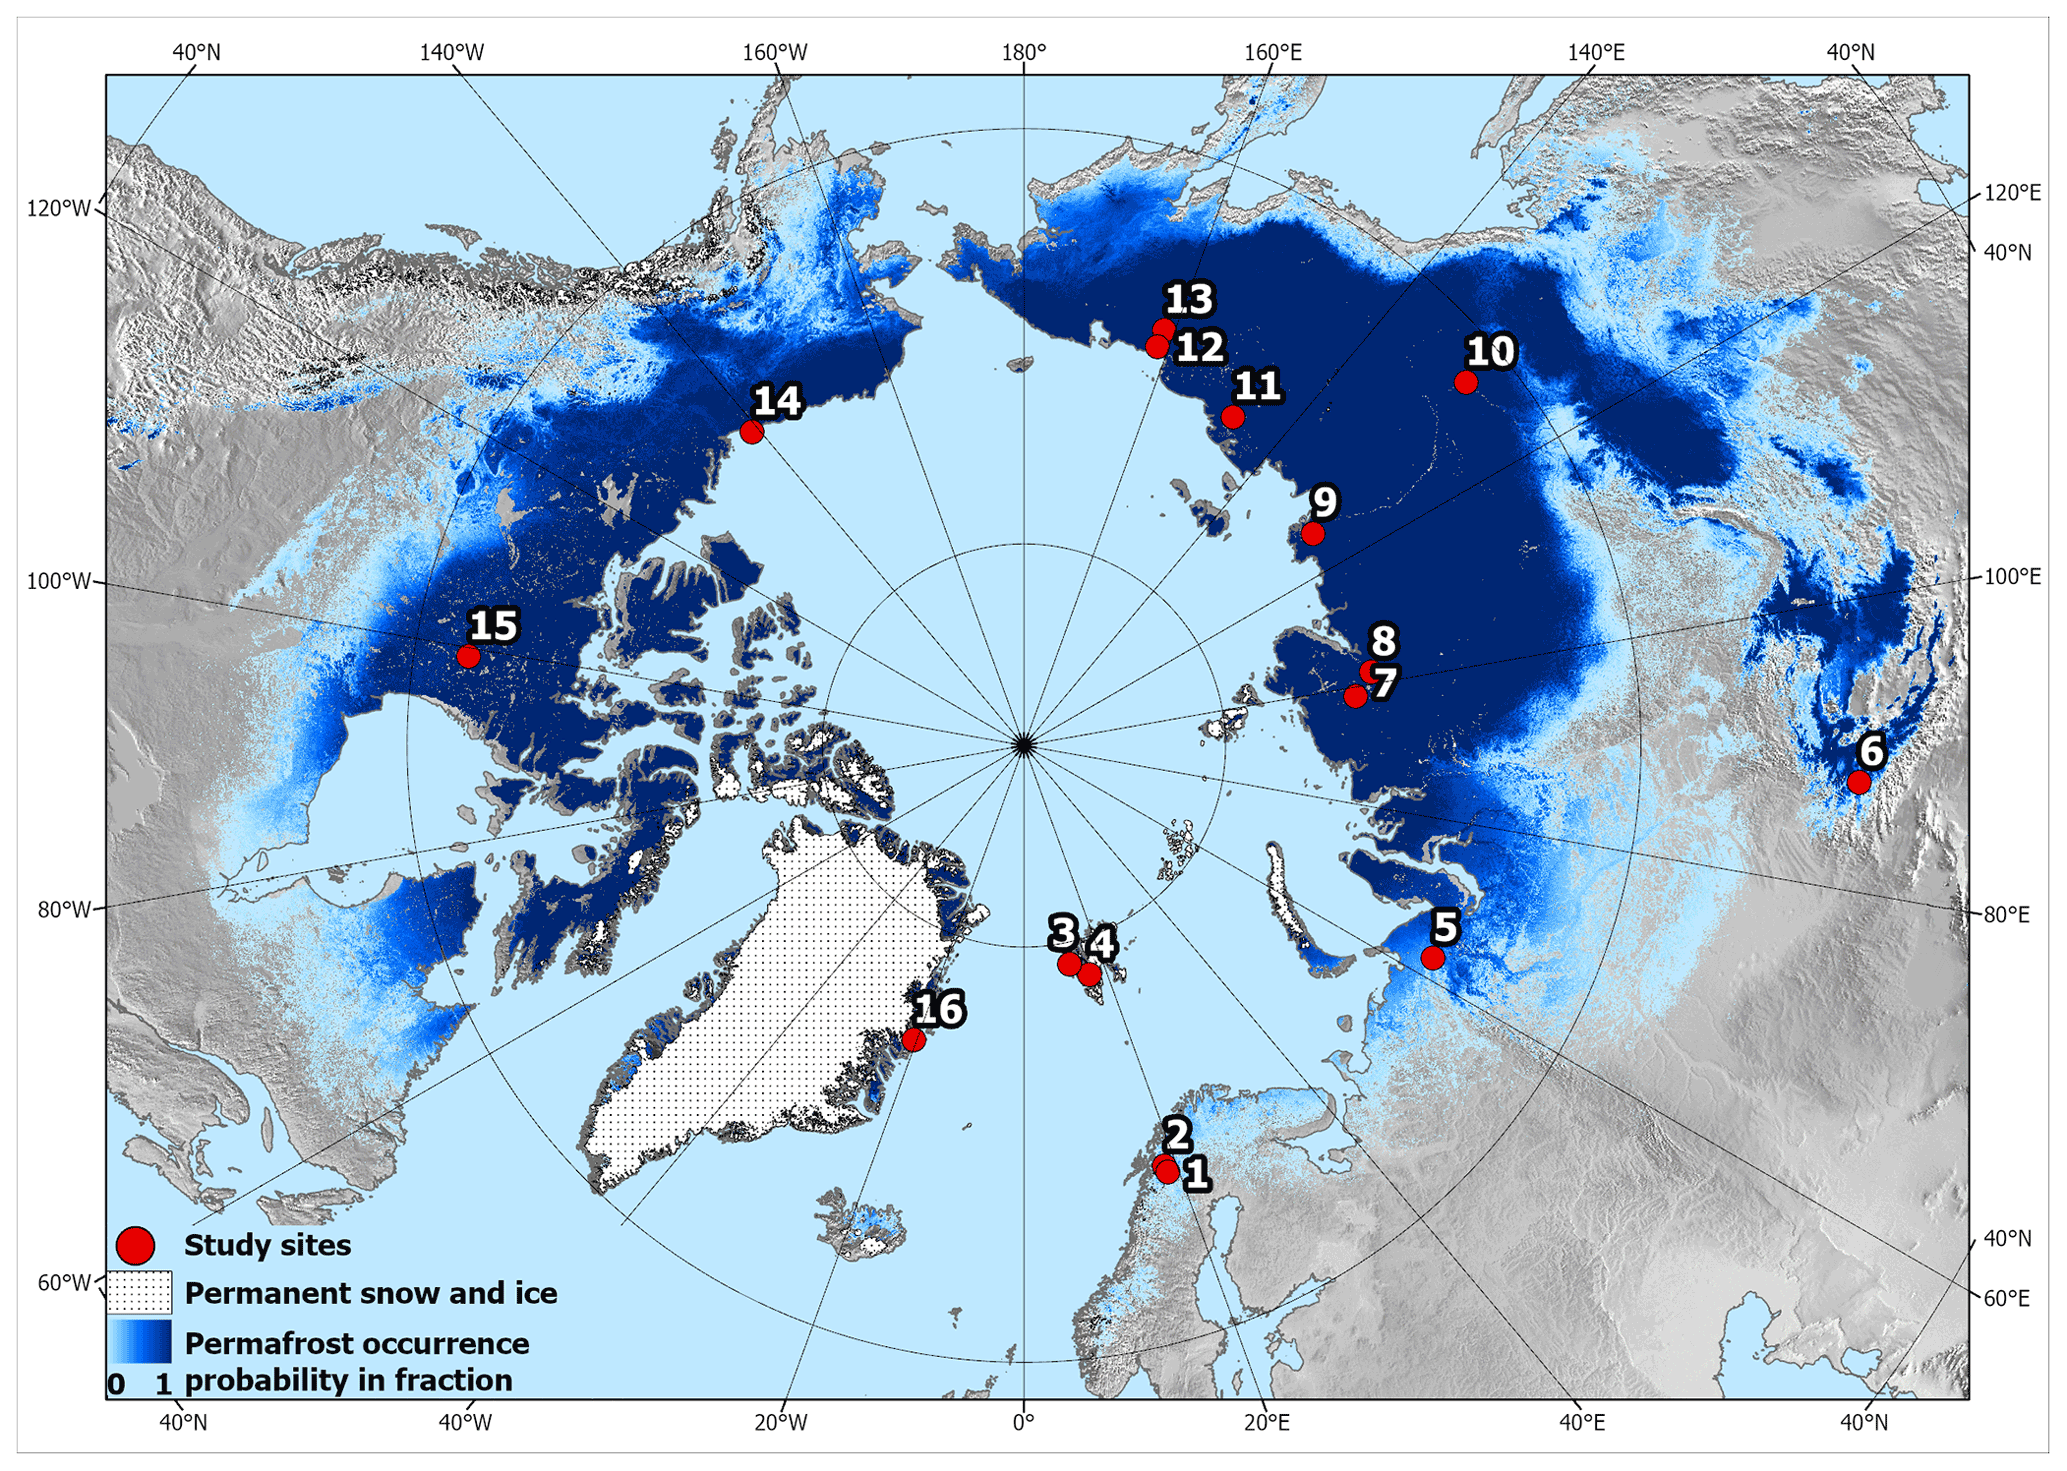
Figure 1Overview map with location of the 16 sampling sites (see Table 1). Blue shading indicates permafrost probability (dark hues showing higher permafrost occurrence probability), based on an equilibrium state model for the temperature at the top of the permafrost (TTOP) for the 2000–2016 period (Obu et al., 2019). North Pole Lambert azimuthal equal area projection (datum: WGS 84). Base map: made with Natural Earth.
2.1 Dataset structure
The dataset contains 6529 analyzed samples from 651 soil pedons in 16 different sampling locations across the northern permafrost region (Fig. 1; Table 1) (Palmtag et al., 2022a, b). Each sampled pedon was described and classified according to land cover type. Land cover is defined as the biophysical cover of the Earth's terrestrial surface such as different vegetation types, water, and bare ground.
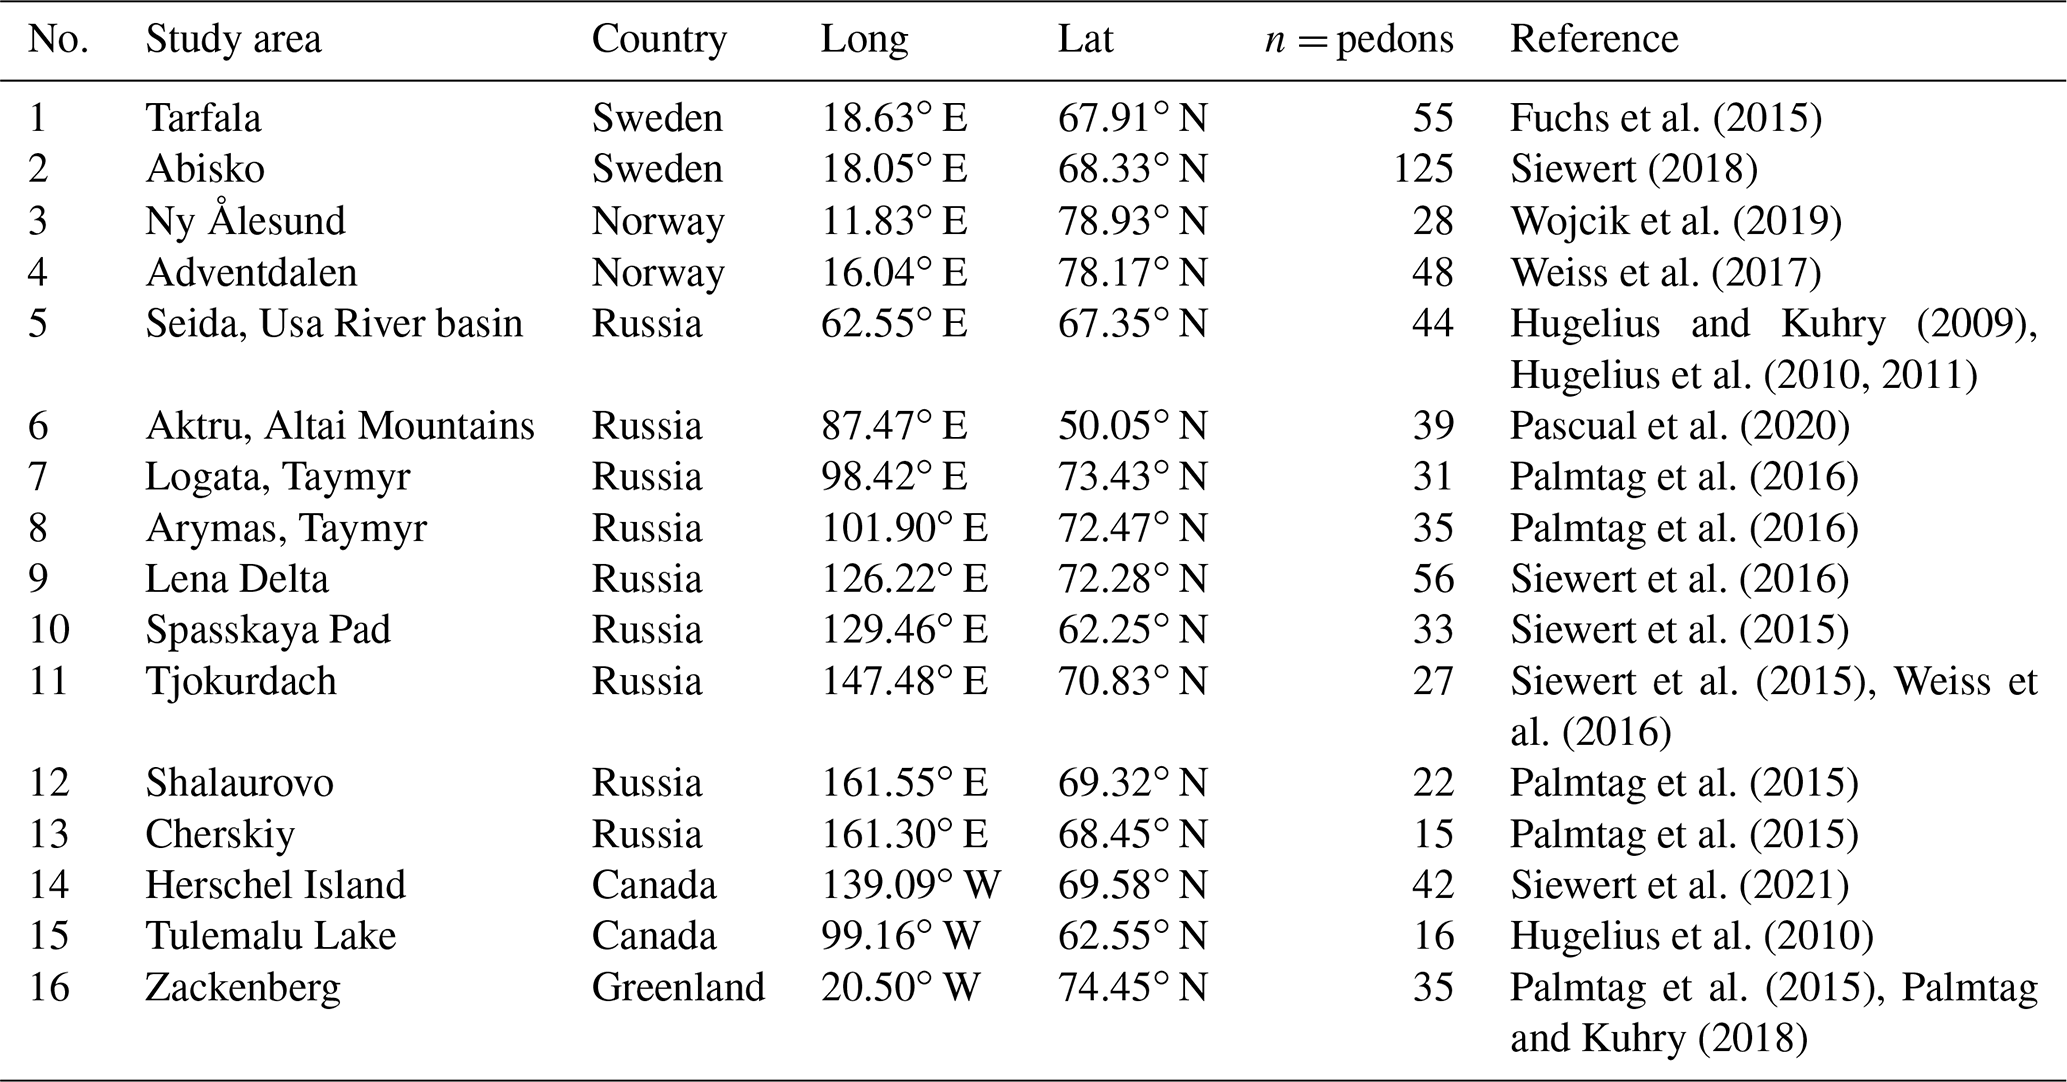
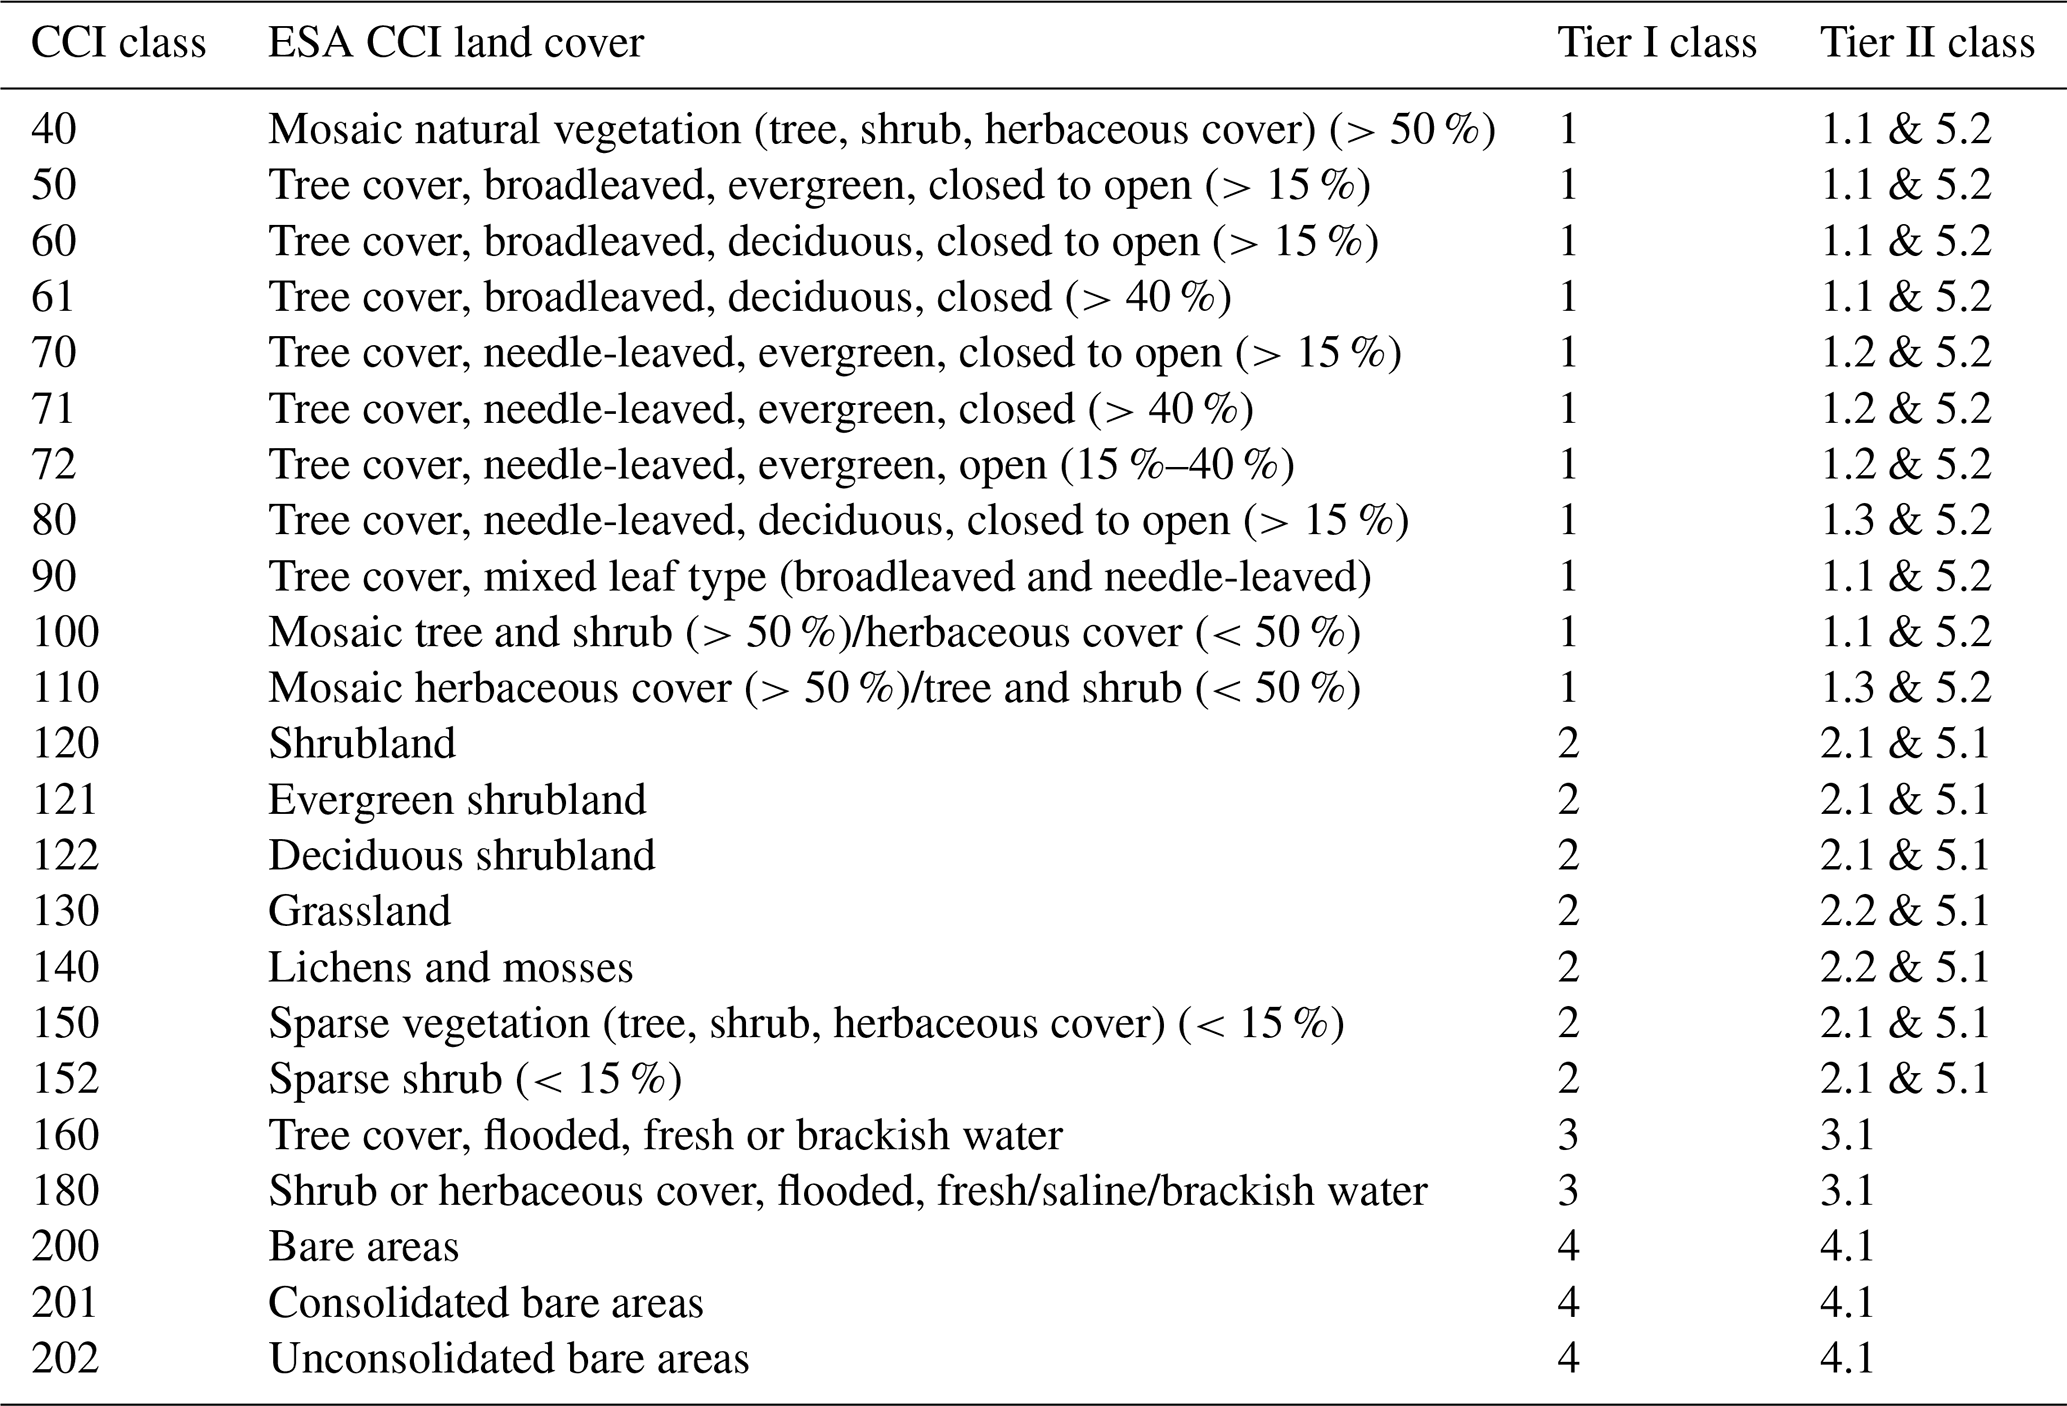
Land cover products are commonly satellite derived and sometimes globally available. We opted for a two-tier approach, where more classes can be used in products with higher thematic or spatial resolution (Table 2). First, we differentiated land cover into five primary tier classes (Tier I) which represent the major land cover types: forest, tundra, wetland, barren, and Yedoma. Although Yedoma is a sedimentary deposit and not a typical land cover class, it was added due to its large areal extent, special soil organic matter (SOM), and ground ice properties, as well as soil characteristics (Strauss et al., 2017; Weiss et al., 2016). Subsequently, Tier I classes were subdivided into 10 Tier II subclasses (Table 2).
Table 2Hierarchical structure of the two-tier land cover class system applied to the pedons based on field observations.
Class definitions of soil pedons to land cover types
All sampling sites were classified with Tier I descriptions using field descriptions and, where possible, assigned a more detailed (Tier II) description. The forest class was used for sparse to dense forests, further separated into three different Tier II classes: deciduous broadleaf, evergreen needleleaf, and deciduous needleleaf forest. Tundra is separated in Tier II to shrub tundra (dominated by erect shrubs >50 cm height) and graminoid/forb tundra (with low growth heath vegetation or graminoid dominated). Wetland includes terrain that is saturated with water for sufficient time of the year to promote aquatic soil processes with low oxygen conditions and occurrence of vegetation fully adapted to these conditions, as well as all types of peatlands. Areas that met the National Wetlands Working Group (1997) definition of a wetland were classified as such. The permafrost status within the top 2 m of a site was used to distinguish in Tier II the permafrost wetlands and the non-permafrost wetlands. Although a substantial part of the northern circumpolar permafrost region is classified as water (0.98×10⁶ km2) or permanent snow/ice (0.06×10⁶ km2), no soil sample or pedon data from these classes are included in the database. The Tibetan permafrost region was also excluded from our estimates as none of the sampling sites originated from that area. The class barren includes land cover types, such as exposed bedrock, boulder fields, talus slopes, debris cones, and rock glaciers, where soil is either almost completely absent, or occurs only in minor patches (<10 % area) or in between boulders. The land cover class Yedoma is defined as areas in Siberia, Alaska, and Yukon underlain by late Pleistocene ice-rich syngenetic permafrost deposits. We used the spatial extent for the Yedoma domain from Strauss et al. (2017) which occupied an area of 570 000 km2 from the used ESA CCI land cover product. Tier II divides the Yedoma domain into Yedoma tundra and Yedoma forest.
2.2 Soil sampling
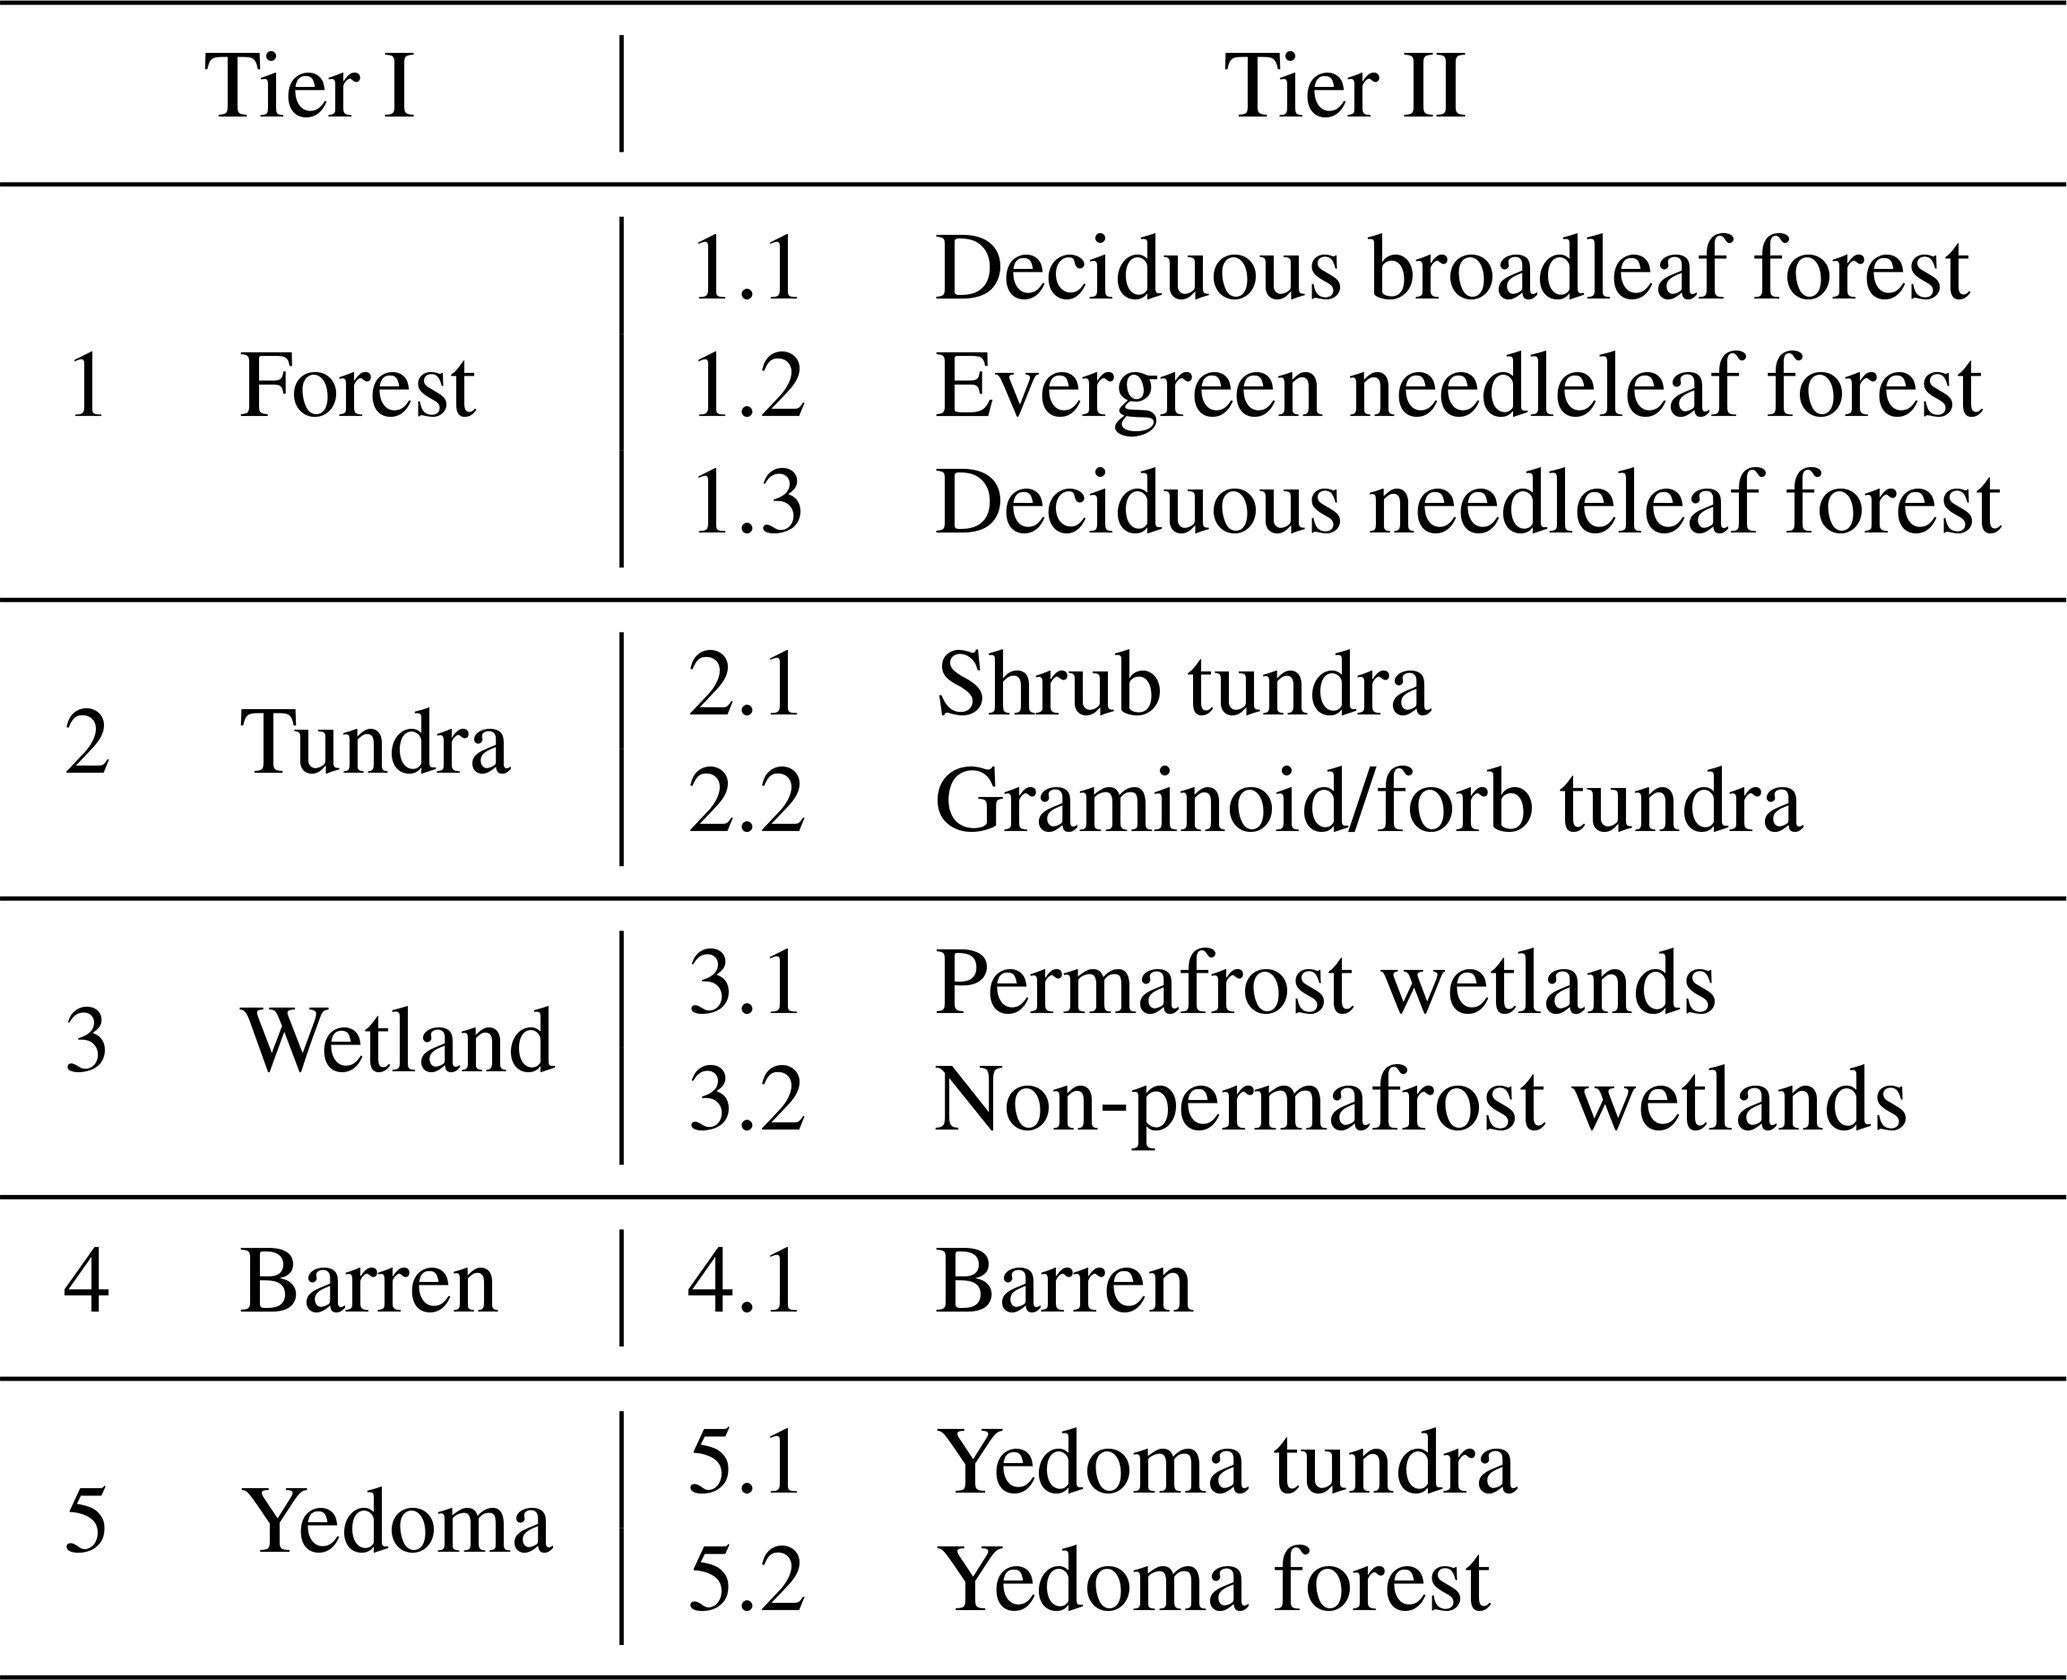
Field soil sampling took place in summer months (late June to early September) between 2006 and 2019, most frequently in August or September in order to capture the maximum seasonal thaw (active layer) depth at each site. Active layer thickness was measured at each location using a graduated steel probe or measuring tape in excavated soil pits. A stratified sampling scheme consisting of linear transects with predefined equidistant intervals of typically 100 to 200 m across all major landscape elements was used to retrieve soil pedons (n=582), with on average 37 sampling sites per study area. To ensure that this sampling scheme covered all representative landscape units and types, maps (including vegetation, surficial geology) and remote sensing products (including air photos, satellite imagery, and elevation models) were assessed prior to fieldwork. Detailed field reconnaissance involving visual observation of the manageable study area was conducted before establishing transects. Sampling sites were located and marked at the exact position based on distance to the first sampling point and compass bearing using a handheld GPS device. This ensured an unbiased location of individual sampling sites. When sufficient time was available in the field, additional sampling (n=69) using a random or stratified random distribution of sampling points was used. Following the field sampling protocol (Fig. S1 in the Supplement), a site description, soil, and, in several cases, phytomass sampling was conducted at each sampling point.
For each pedon, the organic layer and the active layer was sampled from an open soil pit excavated to the bottom of the active layer to the bedrock, or, when this was not possible, to a depth of at least 50 cm (Fig. 2). Deeper unfrozen soil layers were sampled using a steel pipe (see permafrost sampling below). The organic layer sample was cut out as a block using a pair of scissors or a knife (removing living vegetation), and the block volume was measured in the field. The active layer samples were collected using 100 cm3 soil sampling rings inserted horizontally into the soil profile. Sampling of the active layer was performed in fixed depth intervals (5–10 cm) or along soil horizon boundaries. For non-permafrost wetland sites, a Russian peat corer with a 50 cm long chamber was used. After extraction, the core was subdivided into smaller increments (generally 5 cm) which resulted typically in about 5–15 samples per sampling site depending on the reached depth.
The permafrost section of the soil profile and very deep unfrozen soil layers were sampled using a steel pipe that was hammered into the ground in short (5 to 10 cm) depth increments. The pipe was pulled out after each sampled increment using large pipe wrenches, and the sample was pushed out of the pipe using a steel rod. At several locations (n=18), permafrost samples were also collected from exposures along lake shores or river valleys where the steel pipe was hammered in horizontally. These steel pipes are industry standardized with an outer diameter of 42.2 mm (1.25 inches), affordable and widely available even in remote locations. At several locations (n=5), soil cores were collected using a handheld motorized rotational Earth auger (Stihl BT 121) with a 50 cm core barrel and 52 mm outside diameter. Samples were split lengthwise into two halves: one half was analyzed to determine sediment characteristics, volumetric ice content, and gravimetric water content. Disturbance material was removed from the core surface by repeated scraping with a razor blade. The other half of each core was kept as a frozen archive to be used in the event of laboratory error. Since the accurate determination of soil bulk density (BD) is crucial when calculating SOC, special attention was paid to accurate soil volume estimation during field sampling. The target depth for soil cores was 100 cm, or until bedrock or massive ground ice (e.g., ice wedges) was reached. Pedons were often extended beyond 100 cm depth (n=313), in particular to assess full peat depth and organic/mineral transition in organic soils.
Wet or frozen samples were described and placed in double bags to assure no soil water was lost in transport. For each sampled soil profile, pictures and notes were taken to describe land cover type, landform, elevation, slope and aspect, surface moisture, and surface features. Specific observations regarding the collected sample depths, such as excess ground ice (visual estimate, %), occurrence of large stones (visual estimate, %), color (general description or using a Munsell scale), and soil structure including signs of cryoturbation, roots, and rooting depth were noted. Samples with cryoturbated soil material were marked or rated on a scale from 1 to 3 according to the relative amount of cryoturbated soil material. Soil texture, which refers to particle size and relative content of mineral components (sand, silt + clay), is of importance as it affects the physical and chemical properties of a soil, including cryoturbation (Palmtag and Kuhry, 2018). Soil texture was estimated for most samples using manipulation tests and assessment by hand in the field under varying weather conditions. To avoid misinterpretation, we decided to combine silt and clay, and refer to them as one fine-grained soil texture class. In case of permafrost samples, subsamples were thawed, analyzed, and returned back to the sample bag. The land cover and vegetation community were described at all sites. For many sites, vegetation cover was described in terms of relative plant functional type coverage per square meter. Beyond assigning the profiles to land cover, vegetation data are not included in this database and not further discussed.
Figure 2A three-dimensional field sampling protocol with typical soil layers in permafrost ground (reprinted from Weiss, 2017, p. 12). The orange shapes represent the different sampling techniques for organic surface layer (block), active layer sample from an excavated pit (fixed volume cylinder), and permafrost sampling (steel pipe).
2.3 Laboratory analysis
In the laboratory, soil samples (n=5315) were weighed before and after oven-drying at 60–70 ∘C for at least 24 h (or until no further weight change was observed) to determine field-moist mass (mws) and the oven-dried mass (md), thus permitting the calculation of wet bulk density (BDw) and dry bulk density (BD, g cm−3) using the known sample volume. To ensure that there was no remaining water in the organic rich and/or fine grained samples (n=3684), subsamples of ∼10 g were dried again at 105 ∘C to verify the oven-dried weights. After drying, samples were homogenized and sieved to determine the concentration of coarse mineral fragments (CF, >2 mm, %). For a subset of samples, particle size analysis was performed using a Malvern Mastersizer 3000 laser particle size analyzer (Malvern Instruments Ltd, Malvern, UK), which can analyze particles in the range of 0.01–3500 µm in diameter. It measures the intensity of light scattered as a laser beam passes through a dispersed particulate sample. A detailed description of these samples is given in Palmtag et al. (2018). Out of 5331 samples where OC % data are available, subsamples from 4471 samples were heated to 550 ∘C for 5 h to obtain organic matter content through loss on ignition (LOI; Heiri et al., 2001), and about half of the samples (n=2960) were heated to 950 ∘C for 2 h to determine carbonate content (for details, see Palmtag et al., 2015, 2016). To determine the elemental content of carbon and nitrogen (TOC and TN) and their isotopic composition, 2674 samples were analyzed using an elemental analyzer (EA). If LOI950 following Heiri et al. (2001) indicated presence of inorganic carbon >1 %, samples were acid treated (Abisko, Sweden; Ny Ålesund, Norway; Aktru, Altai Mountains, Russia) with hydrochloric acid prior to determination of TOC. To estimate the organic carbon % (OC %) for samples where only LOI was available (44 %), a polynomial regression model (R2=95 %) was performed between LOI550 and OC % from EA on samples for which both analyses were available at study-area level.
2.4 SOC/TN stock calculations and upscaling
Dry and wet bulk density (g cm−3), sample volume (cm3), and % carbon was used to calculate the volumetric contents of water, organic soil material, mineral soil material, and air for each sample. The soil organic carbon content (kg C m−2) was calculated for each sample separately based on dry bulk density (BD, g cm−3), percentage organic C in the sample (OC %), sample thickness T (cm), and coarse fraction correction (CF) (Eq. 1). Equation (1) was also used to calculate the TN content, in which OC % was replaced with N %.
SOC content for each pedon was calculated by summing up individual samples on 1 cm resolution until the maximum sampling depth was reached. The pedons were assigned to a specific land cover class and the SOC content averaged for different depth intervals (0–30, 30–50, 50–100, 100–200, 200–300 cm, and summed to 0–100 and 0–300 cm). In areas with large stones in the soil column (e.g., alpine areas) or areas with massive ice bodies (e.g., Yedoma deposits), it is also important to deduct the volume of stones or massive ice from the calculations. These additional variables are not included in Eq. (1), but were accounted for in the SOC calculations at the pedon level. If bedrock was encountered at any point, a SOC content of 0 kg C m−2 was assigned for the remaining part down to 300 cm depth at that specific sampling site. In pedons where some increments were missing or the full sampling depth was not reached, the nearest samples from the same pedon for BD and OC % were interpolated or extrapolated. To avoid overestimation of the SOC storage, such extrapolations were only used where field notes showed that the deposits were homogeneous and bedrock was not reached.
Masses of soil components (water (mw, g), organic matter (mOM, g), and mineral component (mmin, g)) were calculated based on the laboratory analysis for all the individual samples. The mass of water was calculated as a difference between field-moist mass and oven-dried mass. Organic matter mass was calculated from the OC % and dry sample weight and multiplied by 2, which is a standard conversion factor between SOC and SOM (Pribyl, 2010). The mass of the mineral fraction was calculated as a difference between dry sample mass and organic matter mass.
Volumetric fractions of soil components were calculated by dividing the volume of the component with the total sample volume (V). We calculated component volumes from mass by assuming the following densities: 1 g cm−3 for water, 0.91 g cm−3 for ice, 1.3 g cm−3 for organic matter (Farouki, 1981), and 2.65 g cm−3 mineral component. The volumetric fraction of air was calculated as 1 minus the sum of the other fractions.
All profiles were assigned to land cover class based on field descriptions. Dry bulk density, SOC density, TN density, and the volumetric contents of mineral and organic matter and water and air were averaged according to land cover classes for depths until 3 m using Python scripting language and pandas library (McKinney, 2011). Soil parameters were assigned to pedon sample depth ranges and these were grouped according to land cover classes yielding means and standard deviations for each centimeter of depth. Fractions of soil texture classes (sand and silt + clay) were created using the same procedure by counting occurrences of texture classes within pedons. Typical soil stratigraphies were generated for each class which can be used as input for permafrost modeling and mapping (e.g., Westermann et al., 2013, 2017; Czekirda et al., 2019).
For the upscaling, we used the land cover map from the global ESA land cover Climate Change Initiative (CCI) (2017) project at 300 m spatial resolution (http://maps.elie.ucl.ac.be/CCI/viewer/index.php, last access: 2 September 2022). The overall classification accuracy, based on 3167 random sampling cases, is stated as 73 % (Defourny et al., 2008). The land cover class dataset for upscaling was generated from ESA CCI land cover yearly products from period 2006 to 2015 (corresponding to the sampling period) by identifying prevailing land cover classes within this period. The extent of the Yedoma land cover classes was defined from shapefiles of the Yedoma database by Strauss et al. (2017), where all the layers were used except for QG2500k, which shows the lowest probability of Yedoma occurrence.
Since the ESA land cover product uses a different nomenclature for land cover types with different sub-categories, similar classes were amalgamated to fit our tiered land cover system (Table 2). Several minor classes consisting of single pixels spread over the map were generalized and merged with the class surrounding the pixel. We defined Tier II Yedoma classes (Yedoma tundra and Yedoma forest) according to the ESA CCI land cover classes coinciding with Yedoma deposits (Table 3).
The spatial land cover extent was constrained to the Northern Hemisphere permafrost region indicating probability of permafrost occurrence but not the actual area underlain by permafrost (Obu, 2021). This dataset stretches over 17.9×10⁶ km2 of the Northern Hemisphere, and is based on equilibrium-state model for the temperature at the top of the permafrost (TTOP) for the 2000–2016 period (Obu et al., 2019).
Table 3Amalgamation of ESA's CCI land cover classes with the Tier class system above the Yedoma deposits.
The upscaling to estimate the total carbon storage in the northern circumpolar permafrost region was performed in ArcGIS Pro (ESRI, Redlands, CA, USA) by multiplying the mean SOC storage for each Tier I and Tier II class with the spatial extent of the corresponding CCI land cover class. To determine reasonable error estimates for carbon stocks within the permafrost region, we used a spatially weighed 95 % confidence interval (CI) as described by Thompson (1993) assuming that our residuals are normally distributed (Hugelius, 2012).
The CI accounts for the relative spatial extent, carbon stock variations in pedons, and number of replicates in each upscaling class. Replicates were only considered for pedons reaching the full sampling depth, resulting in fewer replicates available with increasing sampling depth. In Eq. (2): t is the upper of a normal distribution (t≈1.96), a the % of the area, SD is the standard deviation, n is the number of replicates, and i refers to the specific Tier class.
3.1 SOC estimates
Using our pedon-based dataset, we obtain SOC stock estimates within the northern circumpolar permafrost region of 379.7 and 812.6 Pg for 0–100 and 0–300 cm depth, respectively. Table 4 shows mean SOC storage (kg C m−2) and total SOC stock for all depth increments, including 95 % confidence intervals. The upscaling using these new pedon data shows that almost half of SOC in the northern circumpolar permafrost region is stored in the top meter. The three most abundant classes together (deciduous needleleaf forest, shrub tundra, and graminoid/forb tundra) occupy 67 % of the permafrost region (Table 5) and store most of terrestrial SOC in the northern circumpolar region (74 %). The permafrost wetland class has the largest SOC content to 300 cm with 112.2 kg C m−2, but has only a small areal coverage in the ESA LCC product (1.4 %) which results in a total SOC storage contribution of 3.5 % within the permafrost region. Figure 3 illustrates the spatial distribution of total SOC storage (kg C m−2) to a depth of 0–100 and 0–300 cm for the circumpolar permafrost region. Spatially, the SOC distribution in Fig. 3 follows the same pattern and highlights the largest SOC content predominantly in permafrost peatlands in Western Siberia, Russia, and the Nunavut territory in Canada. Despite that, more than 77 % of the area has a SOC storage to a depth of 300 cm higher than 50 kg m−2.
Table 4Landscape mean and total SOC storage with 95 % CI for the different depth increments for the northern circumpolar permafrost region, excluding water bodies and permanent snow and ice.
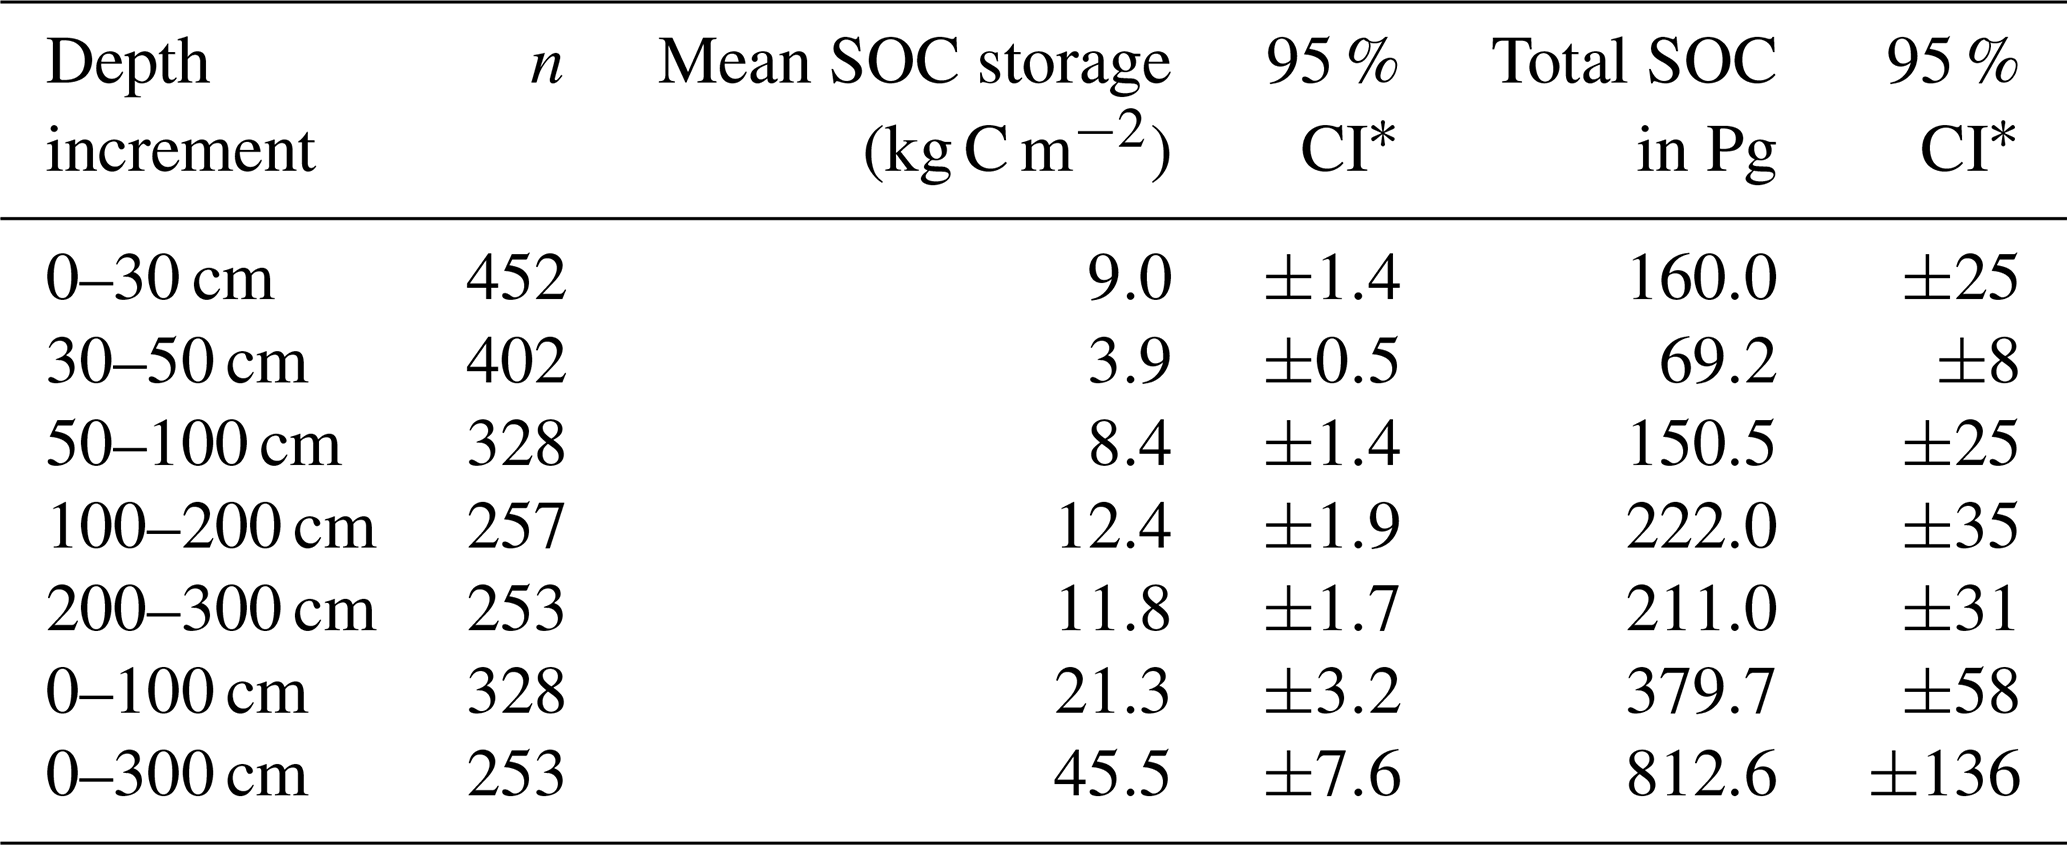
∗ The 95 % confidence interval refers to landscape mean SOC storage and total SOC storage.
Table 5Mean and total SOC storage for (a) 0–100 cm and (b) 0–300 cm soil depth separated for the different Tier classes in the northern circumpolar permafrost region, excluding water bodies and permanent snow and ice.
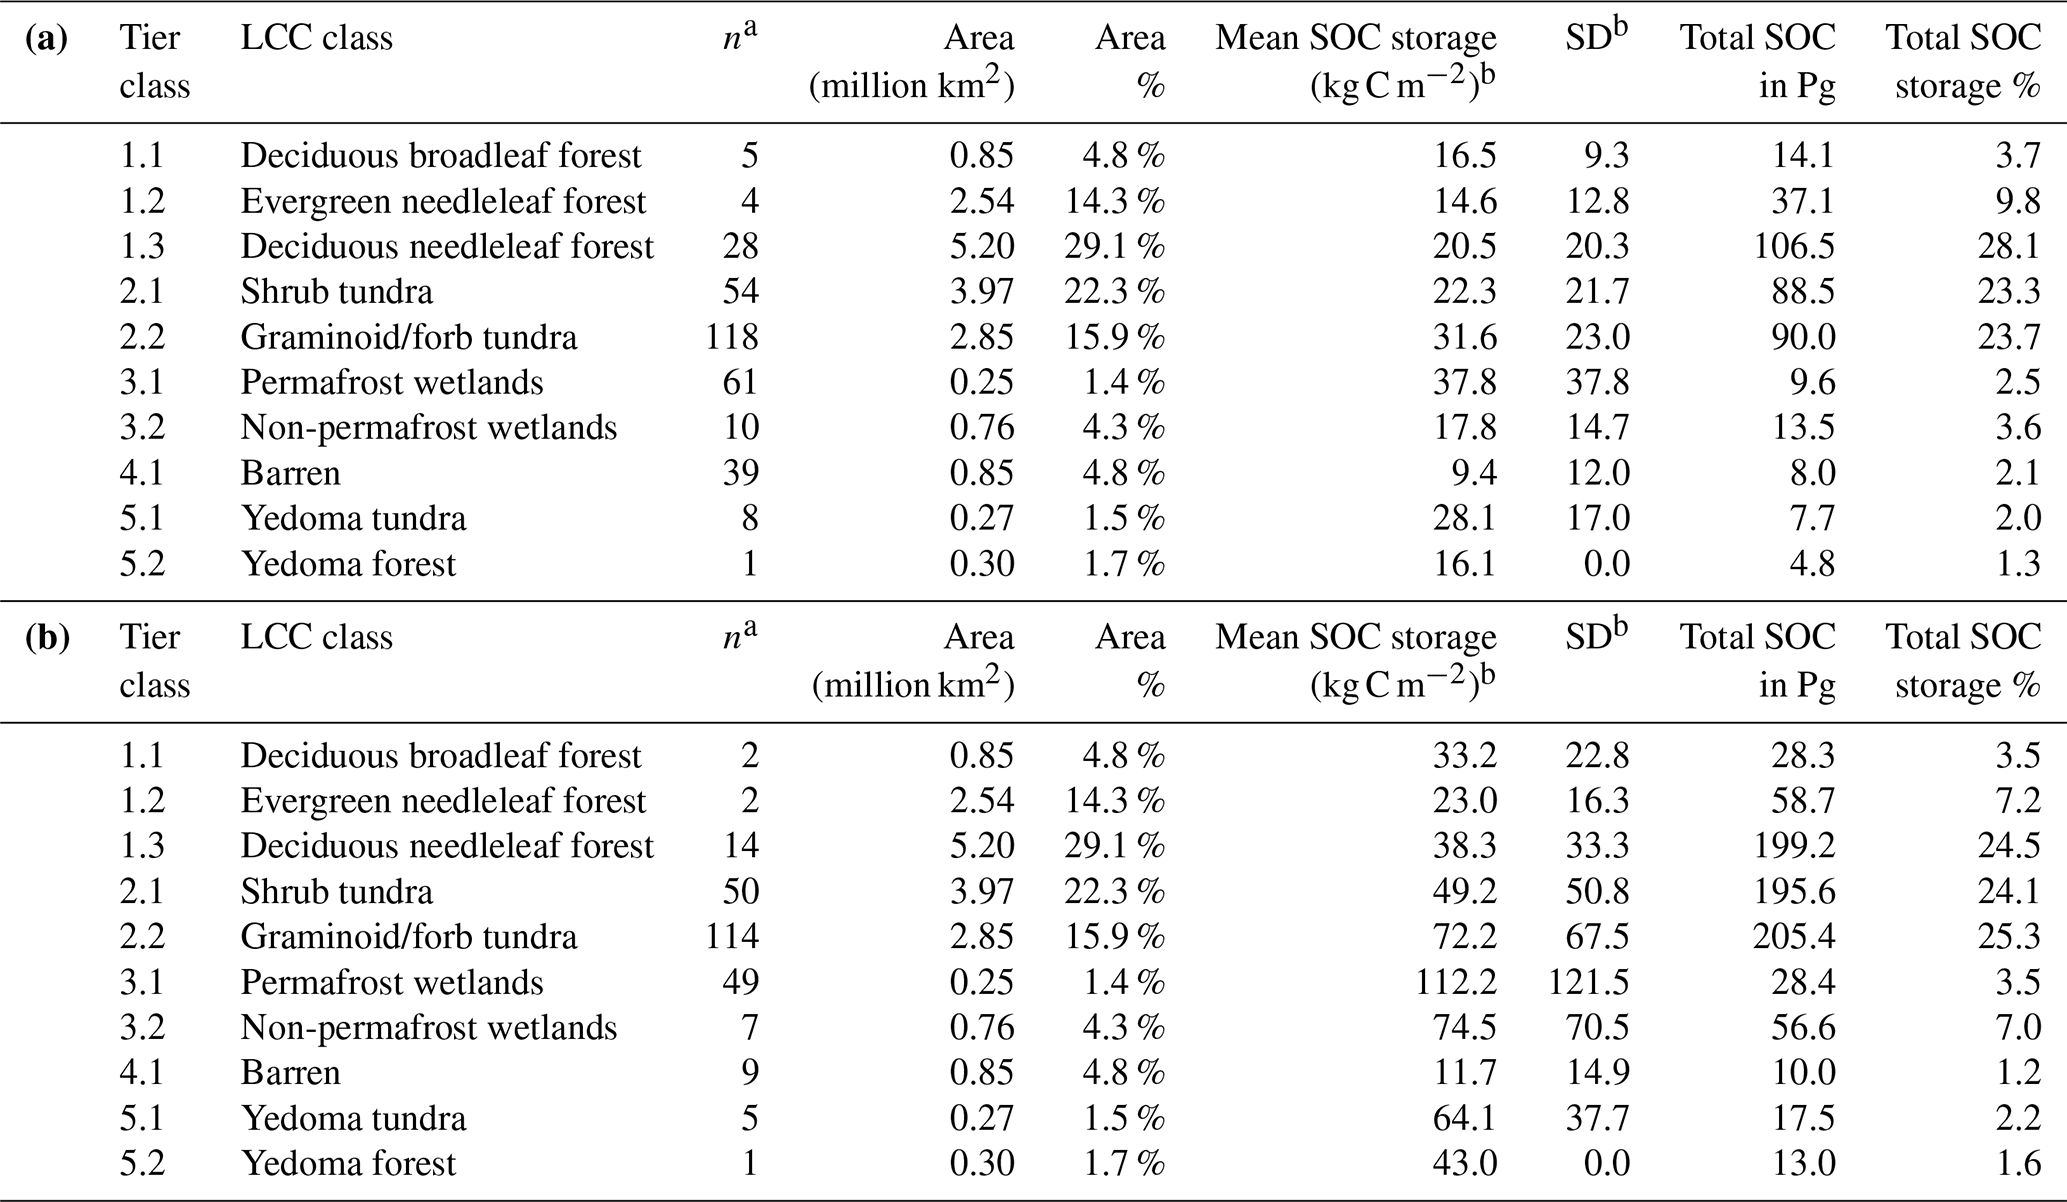
a The number of sampled pedons reaching a full depth of 100 or 300 cm, respectively. b Mean SOC storage and SD calculations include pedons which do not reach the full section depth.
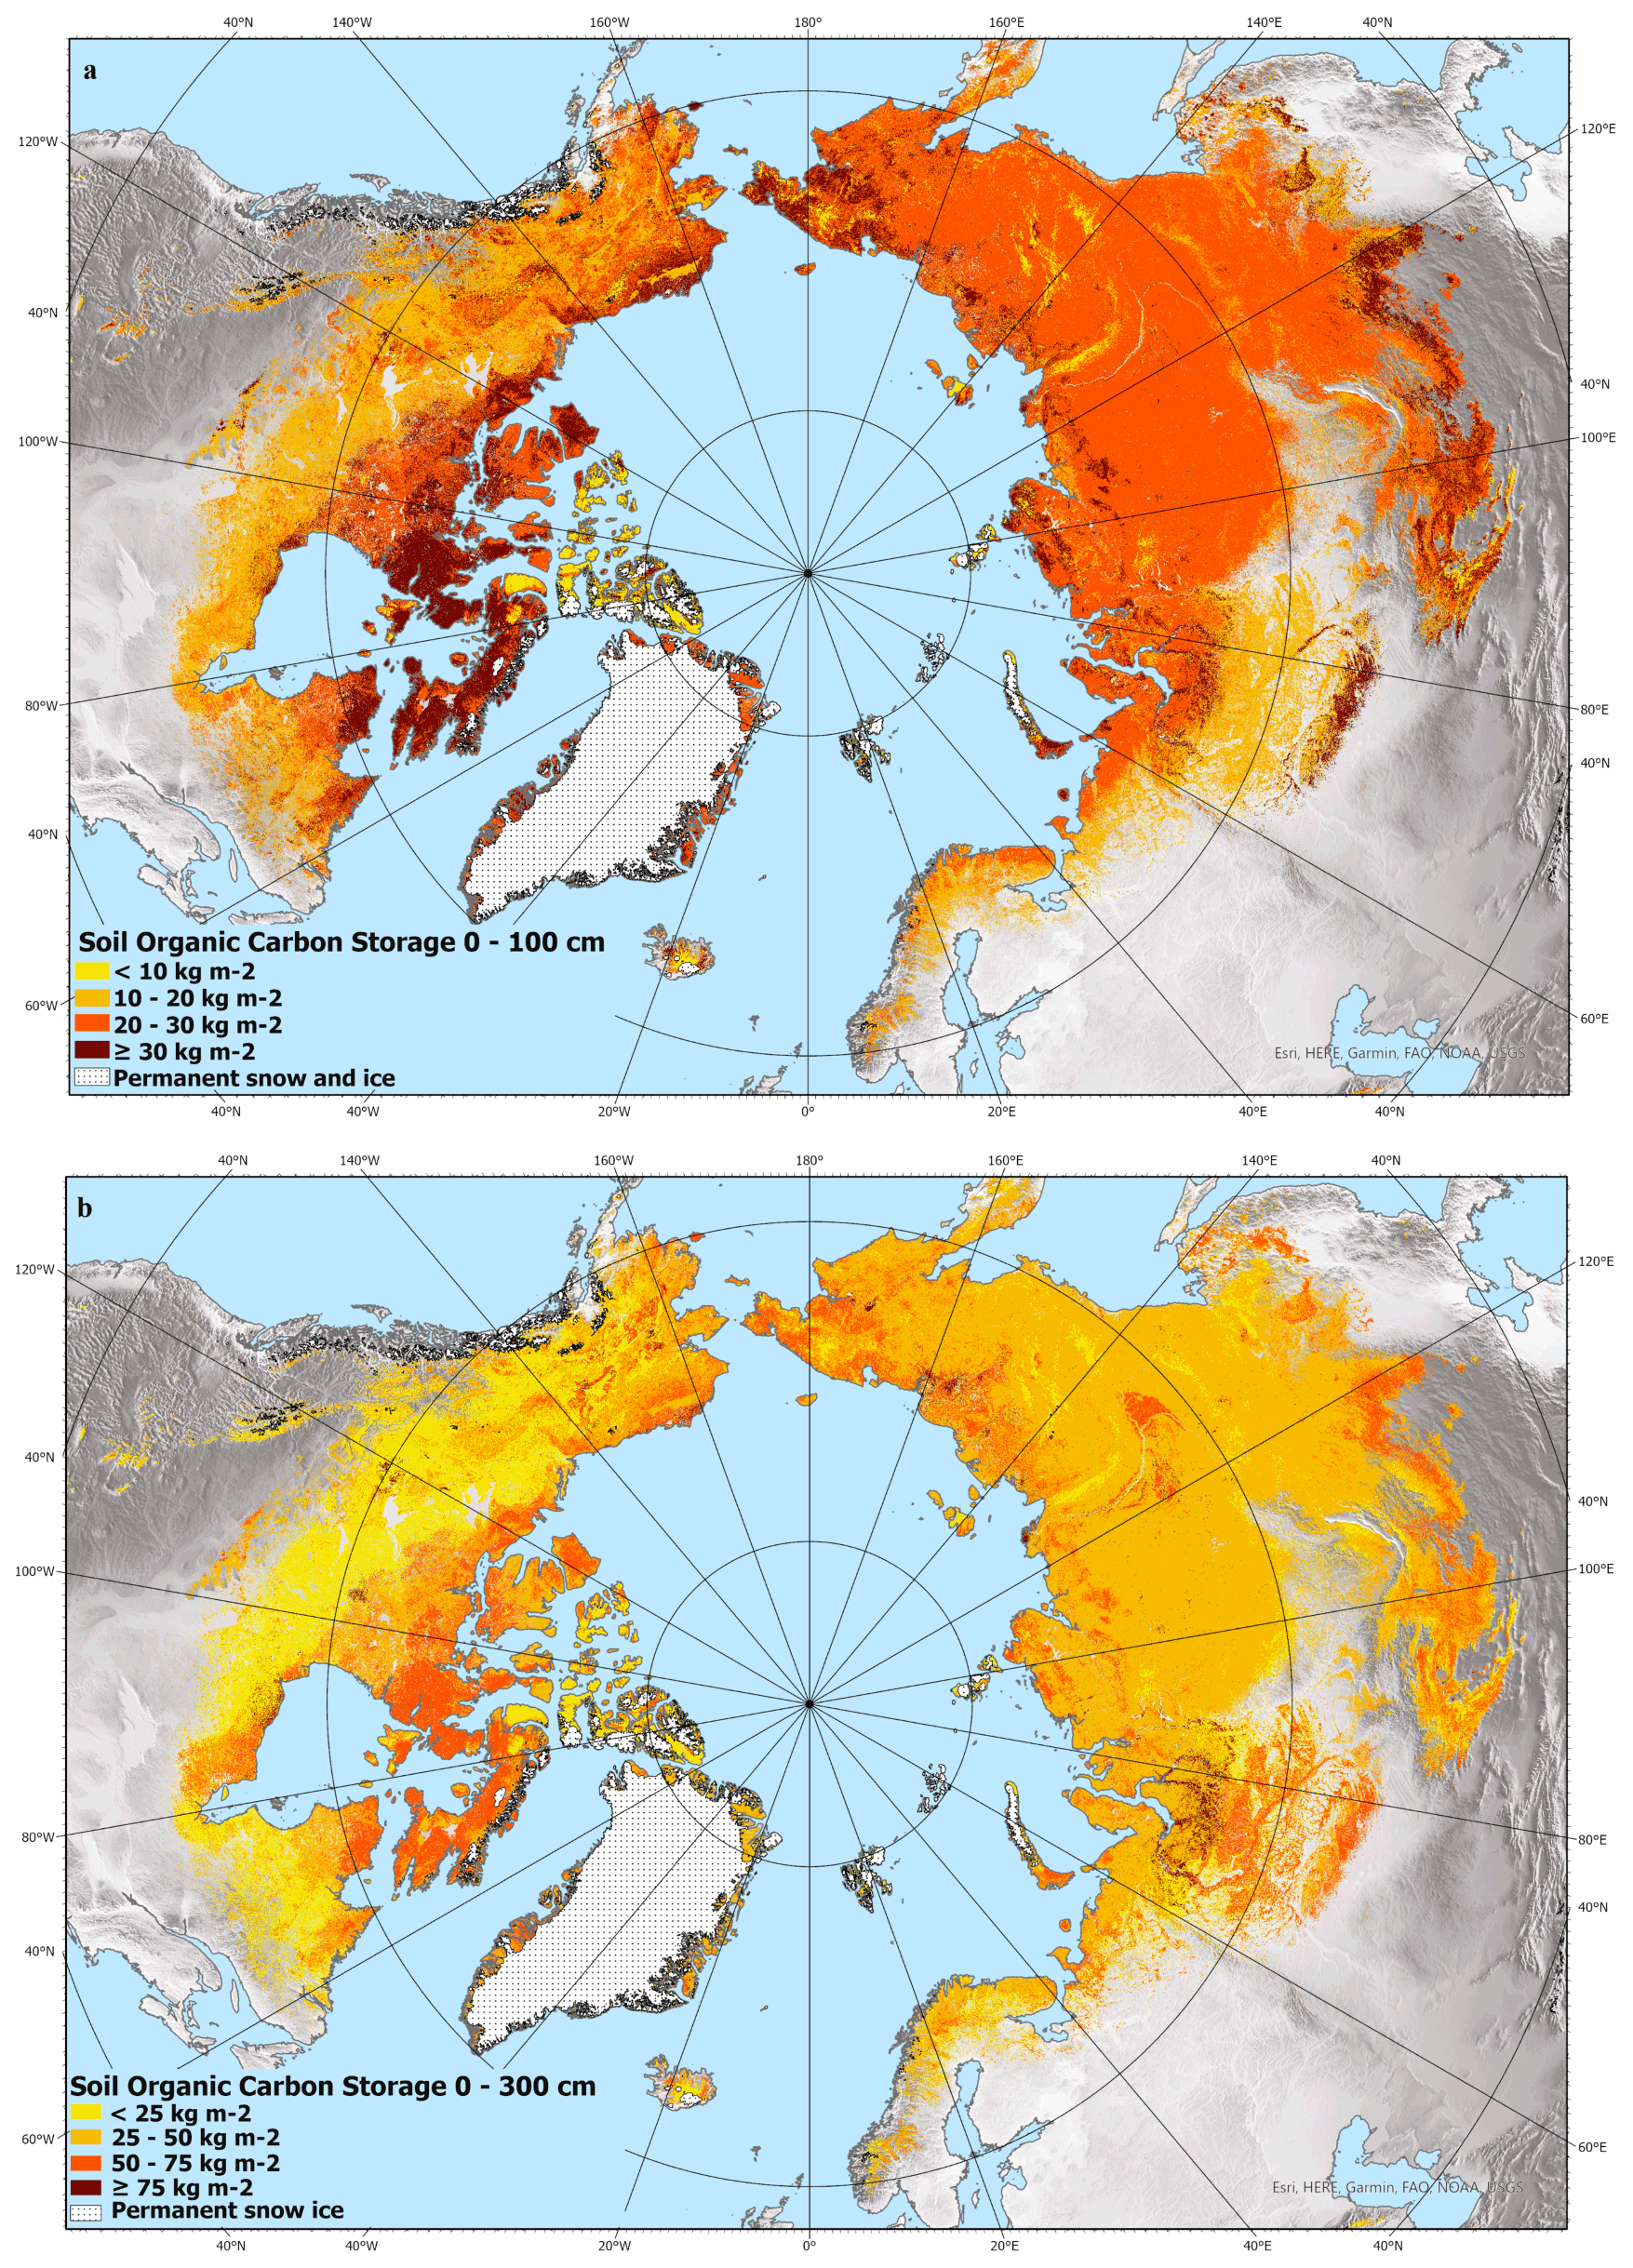
Figure 3Estimated total SOC storage (kg C m−2) to a depth of 0–100 cm (a) and 0–300 cm (b) in northern circumpolar permafrost region. North Pole Lambert azimuthal equal area projection (datum: WGS 84). Base map: made with Natural Earth.
3.2 TN estimates
Our estimates show that the TN stocks down to 100 and 300 cm depth in the northern circumpolar permafrost region are 21.1 and 55.0 Pg, respectively. Table 6 presents the mean and total TN storage for different depth increments with their 95 % confidence interval. As with SOC storage, the most abundant land cover classes (deciduous needleleaf forest, shrub tundra, and graminoid/forb tundra) store most (68 %) of the total TN in the permafrost region. The land cover classes permafrost and non-permafrost wetlands have the largest TN storage with a mean of up to 7 kg N m−2 for the 0–300 cm soil depth (Table 7). Figure 4 illustrates the spatial distribution of total TN storage (kg N m−2) for the circumpolar permafrost region for two depth intervals, 0–100 and 0–300 cm. The spatial distribution of TN has a similar pattern to SOC and highlights the permafrost peatlands in Western Siberia, Russia, and the Nunavut territory in Canada.
Table 6Mean and total TN storage with 95 % CI for the different depth increments for the northern circumpolar permafrost region, excluding water bodies and permanent snow and ice.
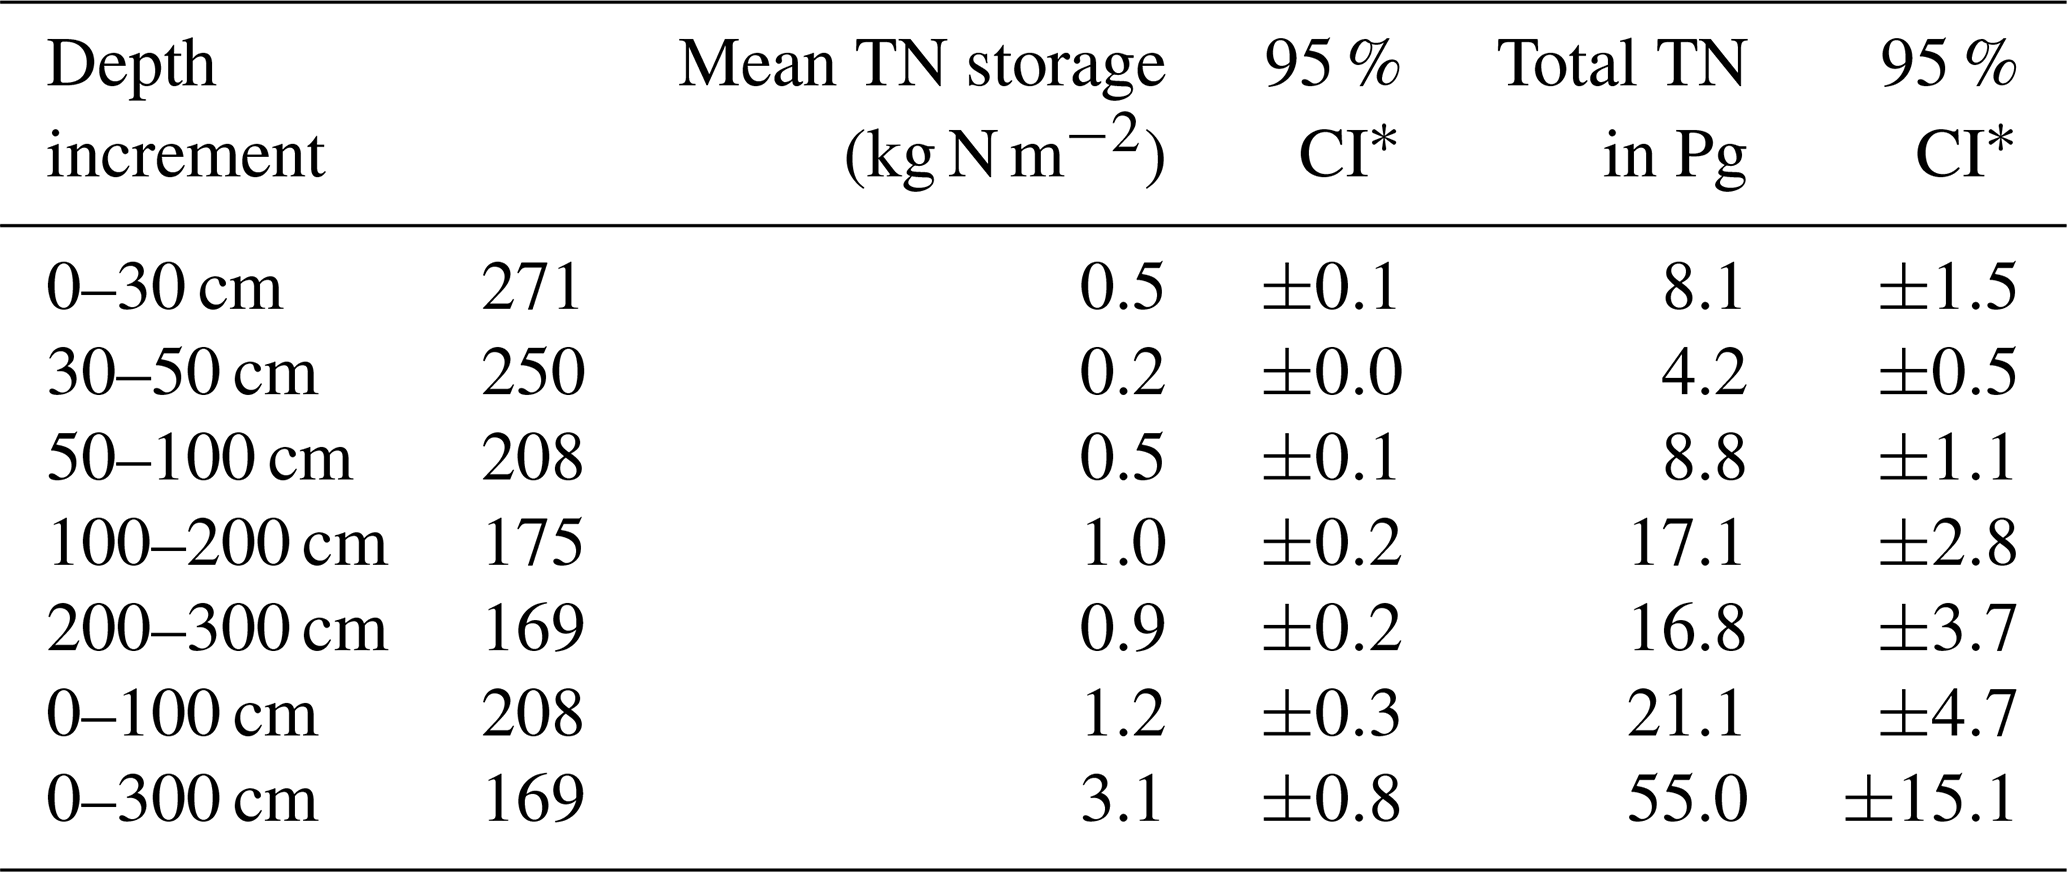
∗ The 95 % confidence interval refers to landscape mean TN storage and total TN storage.
Table 7Mean and total TN storage for (a) 0–100 cm and (b) 0–300 cm soil depth separated for the different Tier classes within the northern circumpolar permafrost region, excluding water bodies and permanent snow and ice.
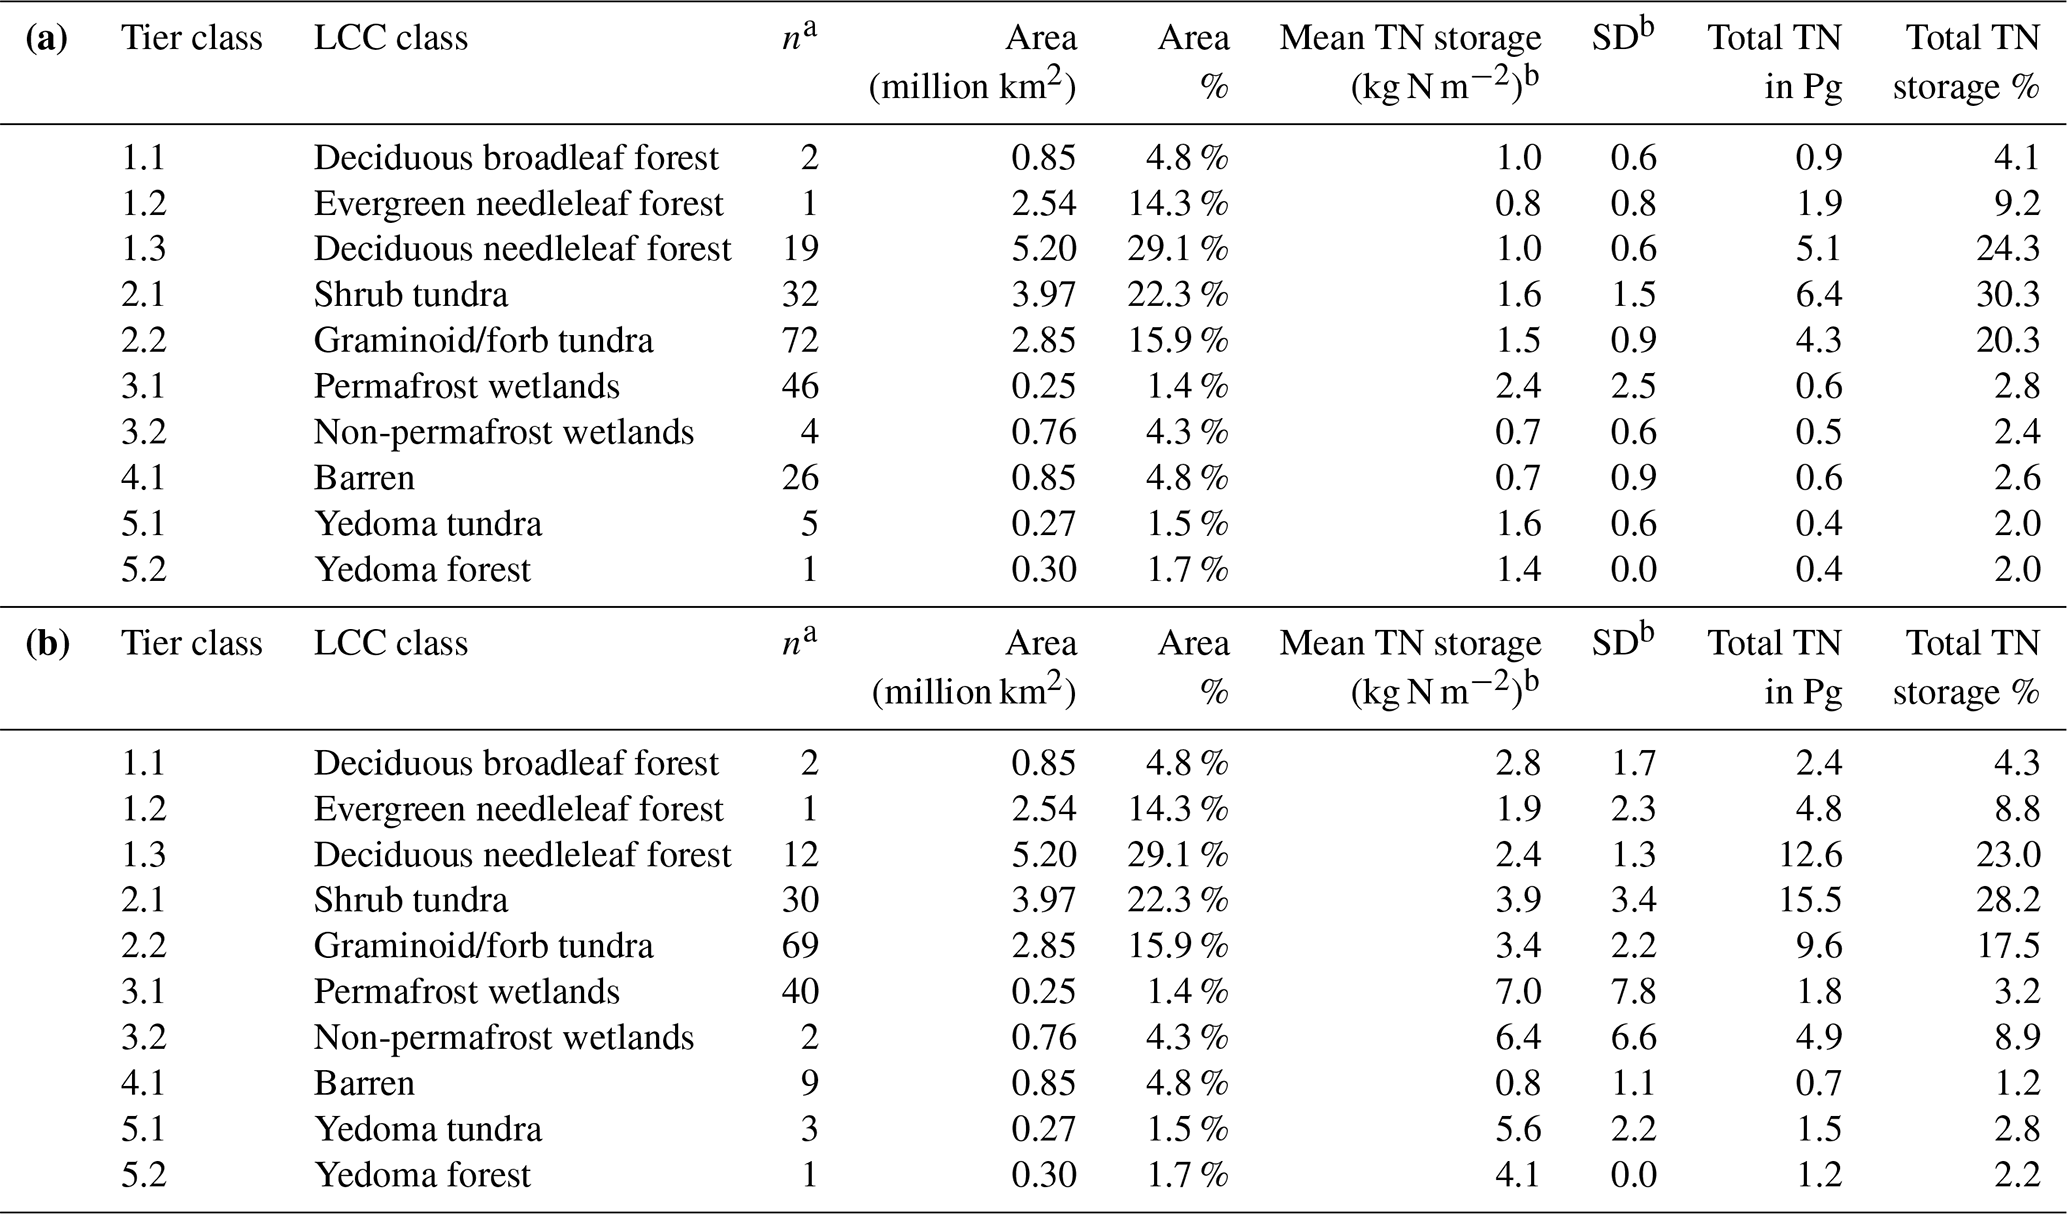
a The number of sampled pedons reaching a full depth of 100 or 300 cm, respectively. b Mean TN storage and SD calculations include pedons which do not reach the full section depth.
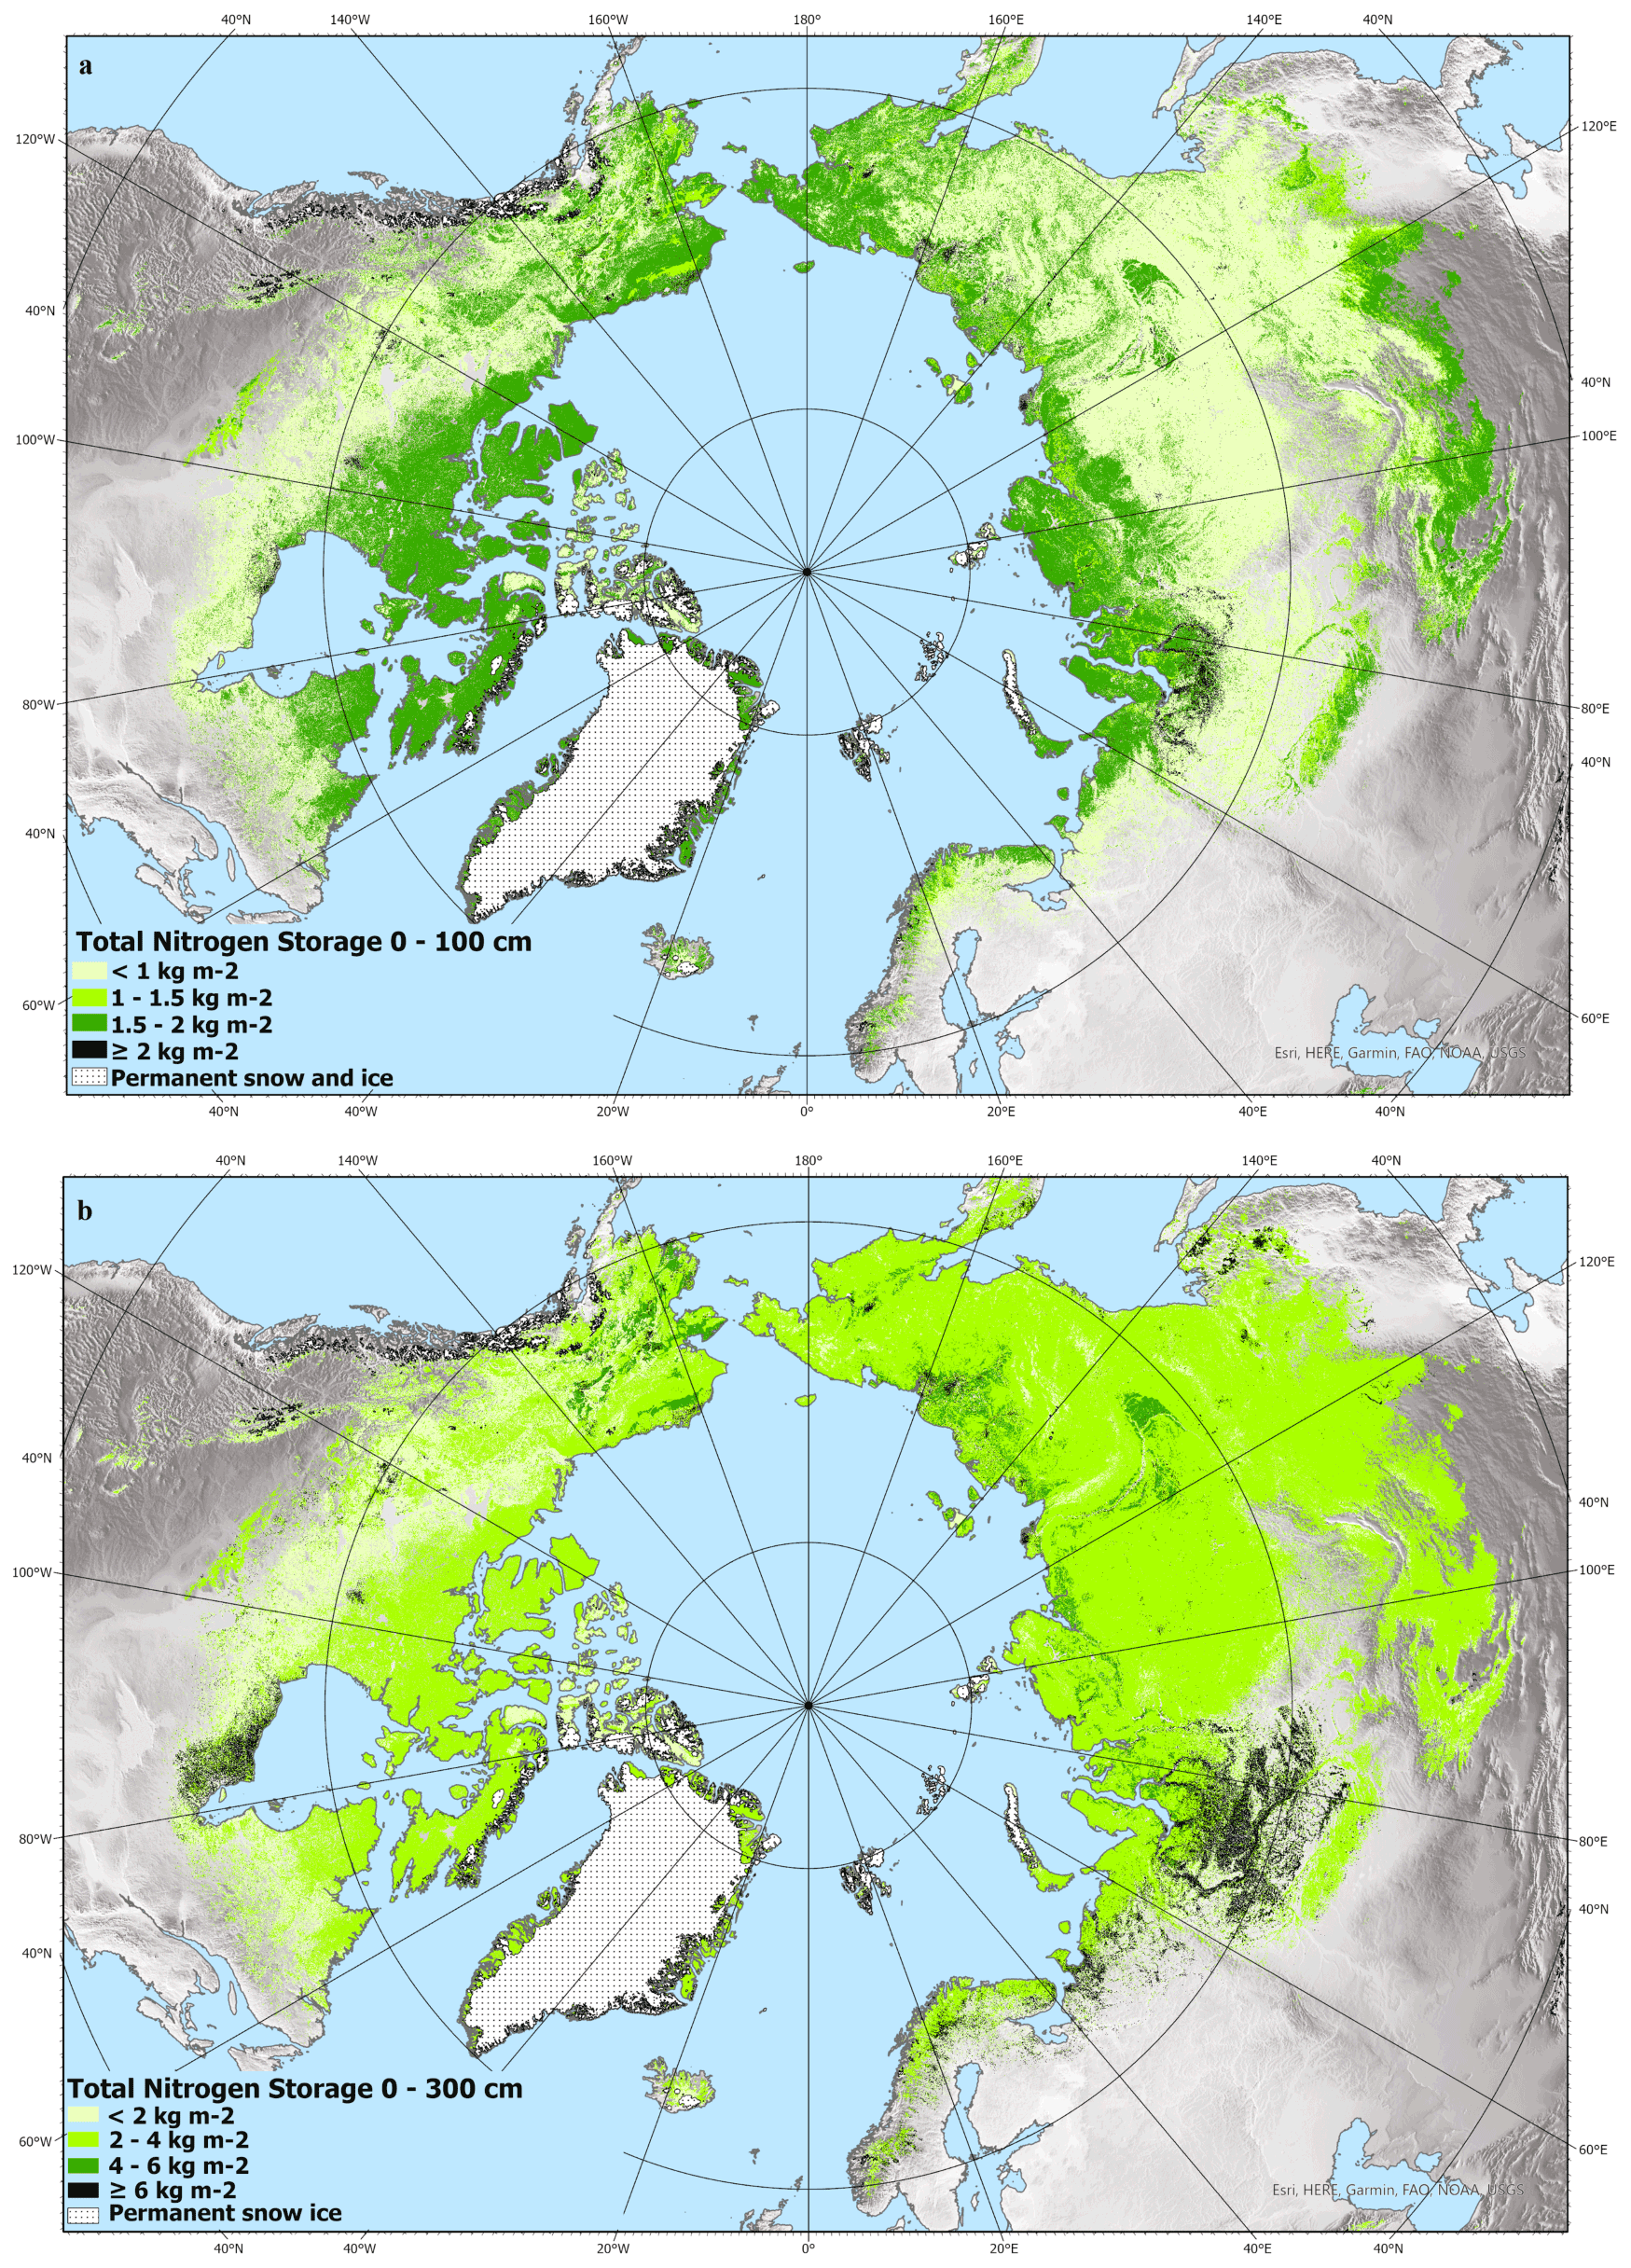
Figure 4Estimated total nitrogen storage (kg N m−2) to a depth of 0–100 and 0–300 cm in northern circumpolar permafrost region. North Pole Lambert azimuthal equal area projection (datum: WGS 84). Base map: made with Natural Earth.
3.3 ratio and δ13C
Carbon to nitrogen ratios are often used as an indicator for SOM decomposition because the ratio decreases with a higher degree of humification as more carbon than nitrogen is released during metabolic activity by microorganisms. This is why ratios usually decrease with depth, as deeper layers are typically older and more decomposed (Kuhry and Vitt, 1996). Our data confirm this pattern of fast-decreasing ratio with depth in all land cover classes to about 50 cm of depth followed by weak decline throughout the full pedon depth (Fig. 5a). The values of SOC-rich top soil organic and peat samples are significantly higher than in the mineral samples (p<0.05). The ratios together with stable carbon isotopes (δ13C) can be used to gain insight into the biochemical processes of SOM, botanical origin with depth, and the degradation state (Kracht and Gleixner, 2000). The lowest δ13C values, predominantly in the upper 50 cm, indicate that this SOM is more easily available for microbial utilization with lowest values in peatlands connected to differences in hydrology.
3.4 Soil stratigraphies
Figure 5 illustrates averaged vertical soil stratigraphies for SOC and TN density, ratio with δ13C, dry bulk density, volumetric fractions for water/ice, organic, mineral, air, and texture (sand, silt + clay fraction) separated by land cover class to 300 cm depth. The data show clear differences occurring in the more variable top meter in comparison to the rather stable second and third meter, with the exception in non-permafrost wetlands where the TN and SOC density is more variable below 100 cm depth, which results from only two stratigraphically different available pedons where TN data are available (Table 7). The permafrost wetland class shows the highest and most consistent stratigraphy for SOC and TN density, which is due to the high organic fraction of these soils. In comparison, the barren has the lowest SOC and TN, as these soils are dominated by the coarse mineral fraction, and from ca. 140 cm depth, even our deepest barren sample reached bedrock. While the stratigraphy for the Yedoma classes proves that the Yedoma typical ice-rich silt sediments are noticeable in the high silt + clay and high water/ice fraction, with a strong dependence between the DBD stratigraphy and the mineral fraction stratigraphy.

Figure 5Typical vertical soil stratigraphies for all the land cover classes to 300 cm depth separated for SOC density, TN density, ratio, and delta 13C/12C (a); DBD density, ice/water fraction, organic fraction, and mineral fraction (b); and clay + silt fraction, sand fraction, and air fraction (c).
The goal of the field studies in collecting this dataset has mainly been to improve the knowledge base for studies of climate feedbacks resulting from permafrost thaw. This new open-access database provides georeferenced and quality-assessed soil profile data to serve different scientific communities. While there are multiple databases available containing data on soil carbon storage (Hugelius et al., 2013; Michaelson et al., 2013; Mishra et al., 2021), there is still a lack of soil field data covering a wider range of properties within the hard-to-access northern circumpolar permafrost region.
To test and exemplify the usage of the soil profile database, we used our field-based metadata to classify soil profiles according to a coherent land cover scheme, and combined it with ESA's land cover product to provide a new estimate of soil organic carbon storage in the northern circumpolar permafrost region. Our estimate for SOC is 380±58 Pg to 100 cm soil depth, and 813±136 Pg to 300 cm soil depth for the permafrost region occupying an area of 17.9×10⁶ km2 (excluding area of Tibetan permafrost region, permanent snow, and ice and water bodies). In comparison, Hugelius et al. (2014) estimated SOC stocks in the northern circumpolar permafrost region (17.8×10⁶ km2 excluding exposed bedrock, glaciers and ice sheets, and water bodies) to be 472±27 and 1035±150 to 100 and 300 cm for soils, respectively. A recent publication by Mishra et al. (2021) based on >2700 soil profiles with environmental variables in a geostatistical mapping framework estimated a total SOC stock of 510 Pg (−78 to +79 Pg) and 1000 (−170 to +186 Pg) to 100 and 300 cm, respectively. Although our values are a bit lower than their estimates, they are within each other's ranges. Usage of a different land cover based upscaling approach could be the cause of some of these differences.
Despite the importance of nitrogen for microbial decomposition and plant productivity processes, few large-scale datasets are available on TN storage. Our TN estimate for the northern circumpolar permafrost region is 21±5 Pg to 100 cm soil depth and 55±15 Pg to 300 cm soil depth. This is in line with the only other circumpolar estimate of 66 Pg (±35 Pg) by Harden et al. (2012).
According to Kuhry and Vitt (1996), ratios of peat deposits decrease over time due to cumulative anaerobic degradation, whereas aerobic decomposition and release of CO2 is lowering the ratios in organic and mineral soil horizons (Ping et al., 1998). Our data show that the ratios in organic soil horizons and peat layers were significantly higher than from mineral subsoil horizons. Based on this, we can use the ratio data to assess the relative degree of SOM decomposition on circumpolar scale. However, ratios and stable carbon isotopes are also affected by the original plant type and the climate which can in addition contribute to changes over time.
A key element to this upscaling exercise is the accuracy of the land cover dataset. Despite the relatively high spatial resolution of 300 m, many Arctic landscape features cannot be represented at this scale. However, ESA's land cover map has a good overall accuracy of 73 %, but this means that 27 % of the land cover is possibly mismatched and in need of improvement. Moreover, the accuracy for natural and semi-natural aquatic vegetation, which corresponds to our wetland class, is unfortunately as low as 19 %. According to Hugelius et al. (2020), the areal extent of peatlands for the northern permafrost region (3.7×10⁶ km2) is almost four times the ESA's land cover product estimated areal extent (1.0×10⁶ km2). Therefore, wrongly classified areas would partly explain our lower estimate for SOC and TN on a circumpolar scale since the wetland classes have the largest SOC and TN contents, particularly at greater depths (100–300 cm). This is evident on maps (Figs. 3 and 4) where areas classified as peatlands clearly stand out with their high SOC and TN contents. If we exchange the ESA wetland areal coverage for the values from Hugelius et al. (2020) to 3.7×10⁶ km2 (2.0×10⁶ km2 in permafrost-free peatlands and 1.7×10⁶ km2 permafrost-affected peatlands) and deduct this in proportion from the other classes, our updated SOC and TN stock to 300 cm soil depth increases from 813±136 to 954±162 Pg and from 55±15 to 66±22 Pg, respectively.
Even though the current estimates are based on 651 soil pedons from 16 different study areas, there are uncertainties and data gaps for several regions and ecosystems. With e.g., only one high alpine site and one Yedoma forest site, several areas are highly underrepresented. Also, the study areas are concentrated in European and Russian locations which additionally increases the uncertainties in current estimates. Therefore, combining these data with other datasets especially from North America, Tibet, Yedoma sites, and a different wetland extent would substantially reduce potential error sources and create a more complete picture of SOC and TN storage estimates from land cover based upscaling. To our knowledge, this is the first product which presents a more complete dataset in regard to variables on a circumpolar scale that are commonly used to parameterize earth system models. With this database, we aim to provide georeferenced point data that can easily be implemented and used for geospatial analysis at a circumpolar scale. This upscaling approach was chosen because this database can be easily extended with additional sampling sites and higher resolution land cover maps that will further increase the resolution on a circumpolar scale. These data can also be used for upscaling in a particular area of interest. This will assist in quantifying and modeling ongoing pedological and ecological processes relevant to climate change. Furthermore, this may help identify regions that are more vulnerable to permafrost degradation and greenhouse gas release due to knowledge on texture, water/ice content, or SOC storage.
Two separated datasets are freely available on the Bolin Centre dataset repository (https://bolin.su.se/data/, last access: 2 September 2022). The dataset (detailed pedon data on soil carbon and nitrogen for the northern permafrost region, https://doi.org/10.17043/palmtag-2022-pedon-1) (Palmtag et al., 2022a) is a geospatial dataset of physical and chemical soil properties from 651 soil pedons and the second dataset (a high spatial resolution soil carbon and nitrogen dataset for the northern permafrost region, https://doi.org/10.17043/palmtag-2022-spatial-1) (Palmtag et al., 2022b) contains GIS grids of the northern circumpolar permafrost region for SOC, TN, and ratios for the different depth increments.
This dataset represents a substantial contribution of high-quality soil pedon data and metadata across the northern permafrost region. Our land cover based estimates of total SOC to 100 and 300 cm soil depth are 380±58 and 813±136 Pg, respectively. In addition, we contribute with novel TN estimates for the different land cover classes and depth increments. Our TN estimate to 100 and 300 cm soil depth are 21.1±4.7 and 55±15 Pg which is in line with the only other product available on that scale for TN. Despite a different methodology, they are similar but on the lower edge compared to other recent numbers. We provide data for a wide range of environments and geographical regions across the permafrost region, including georeferencing and metadata. This serves as a base that can be easily combined and extended with data from other sources, as several regions are underrepresented (Alaska, Canada, Tibet). This dataset offers high scientific value as it also contains data on chemical and physical soil properties across the northern circumpolar permafrost region. These additional data can be used to develop or parametrize broad-scale models and to help better understand different aspects of the permafrost–carbon climate feedback.
The supplement related to this article is available online at: https://doi.org/10.5194/essd-14-4095-2022-supplement.
GH, PK, SW, and JP designed the concept of the study. JO wrote the script in Python. JP wrote the initial draft of the article. All authors contributed to the writing and editing of the article.
The contact author has declared that none of the authors has any competing interests.
Publisher's note: Copernicus Publications remains neutral with regard to jurisdictional claims in published maps and institutional affiliations.
We thank the ESA CCI Land Cover project for providing the data, which was used for upscaling our product to circumpolar scale.
This research has been supported by the European Space Agency (grant no. 4000123681/18/I-NB), the Horizon 2020 (Nunataryuk (grant no. 773421)), the UK Research and Innovation (CACOON (grant no. NE/R012806/1)), and the Vetenskapsrådet (grant no. 2018-04516).
This paper was edited by Kirsten Elger and reviewed by Loeka Jongejans and Kristen Manies.
Batjes, N. H.: Harmonized soil property values for broad-scale modelling (WISE30sec) with estimates of global soil carbon stocks, Geoderma, 269, 61–68, https://doi.org/10.1016/j.geoderma.2016.01.034, 2016.
Biskaborn, B. K., Smith, S. L., Noetzli, J., Matthes, H., Vieira, G., Streletskiy, D. A., Schoeneich, P., Romanovsky, V. E., Lewkowicz, A. G., Abramov, A., Allard, M., Boike, J., Cable, W. L., Christiansen, H. H., Delaloye, R., Diekmann, B., Drozdov, D., Etzelmüller, B., Grosse, G., Guglielmin, M., Thomas Ingeman-Nielsen, T., Ketil Isaksen, K., Ishikawa, M., Johansson, M., Johannsson, H., Joo, A., Kaverin, D., Kholodov, A., Konstantinov, P., Kröger, T., Lambiel, C., Lanckman, J.-P., Luo, D., Malkova, G., Meiklejohn, I., Moskalenko, N., Oliva, M., Phillips, M., Ramos, M., Sannel, A. B. K., Sergeev, D., Seybold, C., Skryabin, P., Vasiliev, A., Wu, Q., Yoshikawa, K., Zheleznyak, M., and Lantuit, H.: Permafrost is warming at a global scale, Nat. Commun., 10, 264, https://doi.org/10.1038/s41467-018-08240-4, 2019.
Czekirda, J., Westermann, S., Etzelmüller, B., and Johanneson, T.: Transient modelling of permafrost distribution in Iceland, Front. Earth Sci., 7, 130, https://doi.org/10.3389/feart.2019.00130, 2019.
Defourny, P., Schouten, L., Bartalev, S. A., Bontemps, S., Caccetta, P., de Wit, A. J. W., Di Bella, C., Gerard, B., Giri, C., Gong, V., Hazeu, G. W., Heinimann, A., Herold, M., Knoops, J., Jaffrain, G., Latifovic, R., Lin, H., Mayaux, P., Måcher, C. A., Nonguierma, A., Stibig, H. J., Van Bogaert, E., Vancutsem, C., Bicheron, P., Leroy, M., and Arino, O.: Accuracy assessment of a 300 m global land cover map: The GlobCover experience, http://www.un-spider.org/space-application/space-application-matrix/accuracy-assessment-300-m-global-land-cover-map-globcover (last access: 7 January 2022), 2008.
ESA Climate Change Initiative: Landcover visualization interface, http://maps.elie.ucl.ac.be/CCI/viewer/index.php (last access: 7 January 2022), 2017.
Farouki, O. T.: Thermal Properties of Soils, Cold regions research and engineering lab Hanover NH, https://apps.dtic.mil/docs/citations/ADA111734 (last access: 7 January 2022), 1981.
Flato, G. M.: Earth system models: an overview, WIREs Clim. Change, 2, 783–800, https://doi.org/10.1002/wcc.148, 2011.
Fritz, M., Vonk, J. E., and Lantuit, H.: Collapsing Arctic coastlines, Nat. Clim. Change, 7, 6–7, https://doi.org/10.1038/nclimate3188, 2017.
Fuchs, M., Kuhry, P., and Hugelius, G.: Low below-ground organic carbon storage in a subarctic Alpine permafrost environment, The Cryosphere, 9, 427–438, https://doi.org/10.5194/tc-9-427-2015, 2015.
Harden, J. W., Koven, C. D., Ping, C.-L., Hugelius, G., McGuire, A. D., Camill, P., Jorgenson, T., Kuhry, P., Michaelson, G. J., O'Donnell, J. A., Schuur, E. A. G., Tarnocai, C., Johnson, K., and Grosse, G.: Field information links permafrost carbon to physical vulnerabilities of thawing, Geophys. Res. Lett., 39, L15704, https://doi.org/10.1029/2012GL051958, 2012.
Heiri, O., Lotter, A. F., and Lemcke, G.: Loss on ignition as a method for estimating organic carbon and carbonate content in sediments: reproduction and comparability of results, J. Paleolimnol., 25, 101–110, https://doi.org/10.1023/a:1008119611481, 2001.
Hugelius, G.: Spatial upscaling using thematic maps: An analysis of uncertainties in permafrost soil carbon estimates, Global Biogeochem. Cycles, 26, GB2026, https://doi.org/10.1029/2011GB004154, 2012.
Hugelius, G. and Kuhry, P.: Landscape partitioning and environmental gradient analyses of soil organic carbon in a permafrost environment, Global Biogeochem. Cycles, 23, GB3006, https://doi.org/10.1029/2008GB003419, 2009.
Hugelius G., Kuhry, P., Tarnocai, C., and Virtanen, T.: Soil organic carbon pools in a periglacial landscape: a case study from the central Canadian Arctic, Permafrost Periglac. Process., 21, 16–29, https://doi.org/10.1002/ppp.677, 2010.
Hugelius, G., Virtanen, T., Kaverin, D., Pastukhov, A., Rivkin, F., Marchenko, S., Romanovsky, V., and Kuhry, P.: High-resolution mapping of ecosystem carbon storage and potential effects of permafrost thaw in periglacial terrain, European Russian Arctic, J. Geophys. Res., 116, G03024, https://doi.org/10.1029/2010JG001606, 2011.
Hugelius, G., Bockheim, J. G., Camill, P., Elberling, B., Grosse, G., Harden, J. W., Johnson, K., Jorgenson, T., Koven, C. D., Kuhry, P., Michaelson, G., Mishra, U., Palmtag, J., Ping, C.-L., O'Donnell, J., Schirrmeister, L., Schuur, E. A. G., Sheng, Y., Smith, L. C., Strauss, J., and Yu, Z.: A new data set for estimating organic carbon storage to 3 m depth in soils of the northern circumpolar permafrost region, Earth Syst. Sci. Data, 5, 393–402, https://doi.org/10.5194/essd-5-393-2013, 2013.
Hugelius, G., Strauss, J., Zubrzycki, S., Harden, J. W., Schuur, E. A. G., Ping, C.-L., Schirrmeister, L., Grosse, G., Michaelson, G. J., Koven, C. D., O'Donnell, J. A., Elberling, B., Mishra, U., Camill, P., Yu, Z., Palmtag, J., and Kuhry, P.: Estimated stocks of circumpolar permafrost carbon with quantified uncertainty ranges and identified data gaps, Biogeosciences, 11, 6573–6593, https://doi.org/10.5194/bg-11-6573-2014, 2014.
Hugelius, G., Loisel, J., Chadburn, S., Jackson, R. B., Jones, M., MacDonald, G., Marushchak, M., Olefeldt, D., Packalen, M., Siewert, M. B., Treat, C., Turetsky, M., Voigt, C., and Yu, Z.: Large stocks of peatland carbon and nitrogen are vulnerable to permafrost thaw, P. Natl. Acad. Sci. USA, 117, 34, https://doi.org/10.1073/pnas.1916387117, 2020.
Köchy, M., Hiederer, R., and Freibauer, A.: Global distribution of soil organic carbon – Part 1: Masses and frequency distributions of SOC stocks for the tropics, permafrost regions, wetlands, and the world, SOIL, 1, 351–365, https://doi.org/10.5194/soil-1-351-2015, 2015.
Kracht, O. and Gleixner, G.: Isotope analysis of pyrolysis products from Sphagnum peat and dissolved organic matter from bog water, Org. Geochem., 31, 645–654, https://doi.org/10.1016/S0146-6380(00)00041-3, 2000.
Kuhry, P. and Vitt, D. H.: Fossil Carbon/Nitrogen Ratios as a Measure of Peat Decomposition, Ecology, 77, 271–275. https://doi.org/10.2307/2265676, 1996.
Kuhry, P., Mazhitova, G. G., Forest, P.-A., Deneva, S. V., Virtanen, T., and Kultti, S.: Upscaling soil organic carbon estimates for the Usa Basin (Northeast European Russia) using GIS-based land cover and soil classification schemes, Geografisk Tidsskrift – Danish Journal of Geography, 102, 11–25, https://doi.org/10.1080/00167223.2002.10649462, 2002.
McKinney, W.: pandas: a foundational Python library for data analysis and statistics, Python for high performance and scientific computing 14.9, 1–9, 2011.
Michaelson, G. J., Ping, C.-L., and Clark, M.: Soil Pedon Carbon and Nitrogen Data for Alaska: An Analysis and Update, Open J. Soil Sci., 3, 132–142, https://doi.org/10.4236/ojss.2013.32015, 2013.
Mishra, U., Hugelius, G., Shelef, E., Yang, Y., Strauss, J., Lupachev, A., Harden, J. W., Jastrow, J. D., Ping, C.-L., Riley, W. J., Schuur, E. A. G., Matamala, R., Siewert, M., Nave, L. E., Koven, C. D., Fuchs, M., Palmtag, J., Kuhry, P., Treat, C. C., Zubrzycki, S., Hoffman, F. M., Elberling, B., Camill, P., Veremeeva, A., and Orr, A.: Spatial heterogeneity and environmental predictors of permafrost region soil organic carbon stocks, Sci. Adv., 7, 9, https://doi.org/10.1126/sciadv.aaz5236, 2021.
National Wetlands Working Group: The Canadian Wetland Classification System, 2nd edn., edited by: Warner, B. G. and Rubec, C. D. A., Wetlands Research Centre, University of Waterloo, Waterloo, ON, Canada, 68 pp., 1997.
Obu, J.: How much of the Earth's surface is underlain by permafrost?, J. Geophys. Res.-Earth Surf., 126, e2021JF006123, https://doi.org/10.1029/2021JF006123, 2021
Obu, J., Westermann, S., Bartsch, A., Berdnikov, N., Christiansen, H. H., Dashtseren, A., Delaloye, R., Elberling, B., Etzelmuller, B., Kholodov, A., Khomutov, A., Kääb, A., Leibman, M. O., Lewkowicz, A. G., Panda, S. K., Romanovsky, V., Way, R. G., Westergaard-Nielsen, A., Wu, T., Yamkhin, J., and Zou, D.: Northern Hemisphere permafrost map based on TTOP modelling for 2000–2016 at 1 km2 scale, Earth-Sci. Rev., 193, 299–316, https://doi.org/10.1016/j.earscirev.2019.04.023, 2019.
Oleson, K. W., Lawrence, D. M., Bonan, G. B., Flanner, M. G., Kluzek, E., Lawrence, P. J., Levis, S., Swenson, S. C., Thornton, P. E., Dai, A., Decker, M., Dickinson, R., Feddema, J., Heald, C. L., Hoffman, F., Lamarque, J.-F., Mahowald, N., Niu, G.-Y., Qian, T., Randerson, J., Running, S., Sakaguchi, K., Slater, A., Stockli, R., Wang, A., Yang, Z.-L., Zeng, X., and Zeng, X.: Technical description of version 4.0 of the Community Land Model (CLM), (No. NCAR/TN-478+STR), University Corporation for Atmospheric Research, https://doi.org/10.5065/D6FB50WZ, 2010.
Palmtag, J. and Kuhry, P.: Grain size controls on cryoturbation and soil organic carbon density in permafrost-affected soils, Permafrost Periglac. Process., 29, 112–120, https://doi.org/10.1002/ppp.1975, 2018.
Palmtag, J., Hugelius, G., Lashchinskiy, N., Tarmstorf, M. P., Richter, A., Elberling, B., and Kuhry, P.: Storage, landscape distribution and burial history of soil organic matter in contrasting areas of continuous permafrost, Arct. Antarct. Alp. Res., 47, 71–88, https://doi.org/10.1657/AAAR0014-027, 2015.
Palmtag, J., Ramage, J., Hugelius, G., Gentsch, N., Lashchinskiy, N., Richter, A., and Kuhry, P.: Controls on the storage of organic carbon in permafrost soils in northern Siberia, Eur. J. Soil Sci., 67, 478–491, https://doi.org/10.1111/ejss.12357, 2016.
Palmtag, J., Obu, J., Kuhry, P., Siewert, M., Weiss, N., and Hugelius, G.: Detailed pedon data on soil carbon and nitrogen for the northern permafrost region. Dataset version 1, Bolin Centre Database [data set], https://doi.org/10.17043/palmtag-2022-pedon-1, 2022a.
Palmtag, J., Obu, J., Kuhry, P., Siewert, M., Weiss, N., and Hugelius, G.: A high spatial resolution soil carbon and nitrogen dataset for the northern permafrost region. Dataset version 1, Bolin Centre Database [data set], https://doi.org/10.17043/palmtag-2022-spatial-1, 2022b.
Pascual, D., Kuhry, P., and Raudina, T.: Soil organic carbon storage in a mountain permafrost area of Central Asia (High Altai, Russia), Ambio, 2022–2037, https://doi.org/10.1007/s13280-020-01433-6, 2020.
Ping, C. L., Bockheim, J. G., Kimble, J. M., Michaelson J. J., and Walker, D. A.: Characteristics of cryogenic soils along a latitudinal transect in arctic Alaska, J. Geophys. Res.-Atmos., 103, 917–928, https://doi.org/10.1029/98JD02024, 1998.
Pribyl, D. W.: A critical review of the conventional SOC to SOM conversion factor, Geoderma, 156, 75–83, https://doi.org/10.1016/j.geoderma.2010.02.003, 2010.
Siewert, M. B.: High-resolution digital mapping of soil organic carbon in permafrost terrain using machine learning: a case study in a sub-Arctic peatland environment, Biogeosciences, 15, 1663–1682, https://doi.org/10.5194/bg-15-1663-2018, 2018.
Siewert, M. B., Hanisch, J., Weiss, N., Kuhry, P., Maximov, T. C., and Hugelius, G.: Comparing carbon storage of Siberian tundra and taiga permafrost ecosystems at very high spatial resolution, J. Geophys. Res.-Biogeo., 120, 1973–1994, https://doi.org/10.1002/2015JG002999, 2015.
Siewert, M. B., Hugelius, G., Heim, B., and Faucherre, S.: Landscape controls and vertical variability of soil organic carbon storage in permafrost-affected soils of the Lena River Delta, CATENA, 147, 725–741, https://doi.org/10.1016/j.catena.2016.07.048, 2016.
Siewert, M. B., Lantuit, H., Richter, A., and Hugelius, G.: Permafrost Causes Unique Fine-Scale Spatial Variability Across Tundra Soils, Global Biogeochem. Cycles, 35, e2020GB006659, https://doi.org/10.1029/2020GB006659, 2021.
Strauss, J., Schirrmeister, L., Grosse, G., Fortier, D., Hugelius, G., Knoblauch, C., Romanovsky, V., Schädel, C., Schneider von Deimling, T., Schuur, T. A. G., Shmelev, D., Ulrich, M., and Veremeeva, A.: Deep Yedoma permafrost: A synthesis of depositional characteristics and carbon vulnerability, Earth-Sci. Rev., 172, 75–86, https://doi.org/10.1016/j.earscirev.2017.07.007, 2017.
Thompson, S. K.: Sampling, John Wiley & Sons, Inc., New York–Chichester–Brisbane–Toronto–Singapore 1992, 343 pp., Biom. J., 35, 848, https://doi.org/10.1002/bimj.4710350713, 1993.
Turetsky, M. R., Abbott, B. W., Jones, M. C., Anthony, K. W., Olefeldt, D., Schuur, T. A. G., Koven, C., McGuire, A. D., Grosse, G., Kuhry, P., Hugelius, G., Lawrence, D. M., Gibson, C., and Sannel, A. B. K.: Permafrost collapse is accelerating carbon release, Nature, 569, 32–34, https://doi.org/10.1038/d41586-019-01313-4, 2019.
Weiss, N.: Permafrost carbon in a changing Arctic: On periglacial landscape dynamics, organic matter characteristics, and the stability of a globally significant carbon pool, PhD thesis, Department of Physical Geography, Stockholm University, 43 pp., URN: urn:nbn:se:su:diva-142586, 2017.
Weiss, N., Blok, D., Elberling, B., Hugelius, G., Jörgensen, C. J., Siewert, M. B., and Kuhry, P.: Thermokarst dynamics and soil organic matter characteristics controlling initial carbon release from permafrost soils in the Siberian Yedoma region, Sediment. Geol., 340, 38–48, https://doi.org/10.1016/j.sedgeo.2015.12.004, 2016.
Weiss, N., Faucherre, S., Lampiris, N., and Wojcik, R.: Elevation-based upscaling of organic carbon stocks in High-Arctic permafrost terrain: a storage and distribution assessment for Spitsbergen, Svalbard, Polar Res., 36, 1400363, https://doi.org/10.1080/17518369.2017.1400363, 2017.
Westermann, S., Schuler, T. V., Gisnås, K., and Etzelmüller, B.: Transient thermal modeling of permafrost conditions in Southern Norway, The Cryosphere, 7, 719–739, https://doi.org/10.5194/tc-7-719-2013, 2013.
Westermann, S., Peter, M., Langer, M., Schwamborn, G., Schirrmeister, L., Etzelmüller, B., and Boike, J.: Transient modeling of the ground thermal conditions using satellite data in the Lena River delta, Siberia, The Cryosphere, 11, 1441–1463, https://doi.org/10.5194/tc-11-1441-2017, 2017.
Wojcik, R., Palmtag, J., Hugelius, G., Weiss, N., and Kuhry, P.: Landcover and landform-based upscaling of soil organic carbon stocks on the Brøgger Peninsula, Svalbard, Arct. Antarct. Alp. Res., 51, 40–57, https://doi.org/10.1080/15230430.2019.1570784, 2019.