the Creative Commons Attribution 4.0 License.
the Creative Commons Attribution 4.0 License.
 | 07 Sep 2022
Global datasets of leaf photosynthetic capacity for ecological and earth system research
Jing M. Chen
Rong Wang
Yihong Liu
Liming He
Holly Croft
Xiangzhong Luo
Han Wang
Nicholas G. Smith
Trevor F. Keenan
I. Colin Prentice
Yongguang Zhang
Weimin Ju
Ning Dong
The maximum rate of Rubisco carboxylation (Vcmax) determines leaf photosynthetic capacity and is a key parameter for estimating the terrestrial carbon cycle, but its spatial information is lacking, hindering global ecological research. Here, we convert leaf chlorophyll content (LCC) retrieved from satellite data to Vcmax, based on plants' optimal distribution of nitrogen between light harvesting and carboxylation pathways. We also derive Vcmax from satellite (GOME-2) observations of sun-induced chlorophyll fluorescence (SIF) as a proxy of leaf photosynthesis using a data assimilation technique. These two independent global Vcmax products agree well (mol m−2 s−1, P<0.001) and compare well with 3672 ground-based measurements (mol m−2 s−1 and P<0.001 for SIF; mol m−2 s−1 and P<0.001 for LCC). The LCC-derived Vcmax product is also used to constrain the retrieval of Vcmax from TROPical Ozone Mission (TROPOMI) SIF data to produce an optimized Vcmax product using both SIF and LCC information. The global distributions of these products are compatible with Vcmax computed from an ecological optimality theory using meteorological variables, but importantly reveal additional information on the influence of land cover, irrigation, soil pH, and leaf nitrogen on leaf photosynthetic capacity. These satellite-based approaches and spatial Vcmax products are primed to play a major role in global ecosystem research. The three remote sensing Vcmax products based on SIF, LCC, and SIF+LCC are available at https://doi.org/10.5281/zenodo.6466968 (Chen et al., 2022), and the code for implementing the ecological optimality theory is available at https://github.com/SmithEcophysLab/optimal_vcmax_R and https://doi.org/10.5281/zenodo.5899564 (last access: 31 August 2022) (Smith et al., 2022).
- Article
(6289 KB) - Full-text XML
- BibTeX
- EndNote


The Farquhar-von Caemmerer–Berry (FvCB) leaf photochemistry model (Farquhar et al., 1980) is widely used for simulating vegetation photosynthesis in ecological studies. The maximum carboxylation rate (Vcmax) that determines leaf photosynthetic capacity is an essential parameter in the FvCB model. The current state of the art (Rogers 2014, Rogers et al., 2017) in regional and global ecosystem modeling is to assign Vcmax at 25 ∘C (Vcmax25) as a fixed parameter that varies by plant functional type (PFT), and is typically estimated from a ground-based database (Kattge et al., 2009, 2020), even though observations show 2–3-fold variation in Vcmax25 for the same PFT. As the total simulated photosynthesis of a canopy is highly sensitive to Vcmax, this simple approach causes considerable distortion in modeled spatial distributions of the terrestrial carbon cycle (Bonan et al., 2011; Walker et al., 2017; Luo et al., 2017; Chen et al., 2019), hindering advancement in global ecological and Earth system research.
In recent studies, two independent satellite remote sensing approaches have been developed to estimate Vcmax at the global scale. Since the first demonstration of sun-induced chlorophyll fluorescence (SIF) as a proxy of gross primary productivity (GPP) at the global scale (Frankenberg et al., 2011), the use of SIF for global carbon cycle estimation has been a highly active research field (Mohammed et al., 2019). He et al. (2019) attempted the first global mapping of Vcmax from SIF after converting SIF observations into GPP that is related to Vcmax. A time series of daily Vcmax maps was derived using SIF measured by the Global Ozone Monitoring Experiment-2 (GOME-2) sensor from 2007 to 2017 at 36 km resolution (see Methods). The second space-based approach to deriving Vcmax is via leaf chlorophyll content (LCC). Chlorophyll harvests light that provides energy for the reactions in the Calvin–Benson–Bassham (CBB) cycle of photosynthesis, and therefore is likely coordinated with leaf carboxylation capacity (Vcmax) as plants optimize their photosynthetic nitrogen resources (Croft et al., 2017). The retrieval of LCC from satellite imagery offers the means of reliable and accurate LCC estimation over different spatiotemporal scales. Data from the medium resolution imaging spectrometer (MERIS) in red, near infrared, and red-edge bands at 300 m resolution at 7 d intervals have been used to produce a global LCC map series from 2003 to 2012 (Croft et al., 2020). In a temperate broadleaf forest, it was found that LCC is better correlated with Vcmax than leaf nitrogen content (LNC) over a growing season (Croft et al., 2017), and similar correlations between Vcmax and LCC were established from empirical data for various PFTs (Luo et al., 2019; Lu et al., 2020). In this study, we use this new LCC time series with existing empirical LCC-Vcmax relationships to derive another independent source of information for global Vcmax assessment.
The Vcmax products derived from SIF and LCC have different strengths and weaknesses. SIF contains strong signals for Vcmax because it is directly related to the vegetation photosynthesis rate, but the spatial and temporal resolutions of existing satellite SIF observations are low. LCC can be derived reliably from multispectral satellite data at much higher spatial and temporal resolutions than those of SIF. Chlorophyll pigments have broad absorption features in the visible range and also affect the fine positioning of red-edge wavelengths. However, the derivation of LCC from remote sensing data is influenced by errors in vegetation structural parameters used in the derivation. The conversion from LCC to Vcmax depends on empirical relationships for different PFTs, which have considerable uncertainties (Luo et al., 2019). In order to make the best use of available satellite data for mapping Vcmax, we combined SIF and LCC data to produce a single global Vcmax time series. We derived a global Vcmax time series using SIF data from the TROPical Ozone Mission (TROPOMI) at 0.1∘ resolution in daily intervals for 2019 with LCC-derived Vcmax as a constraint in the derivation using a parameter optimization technique (He et al., 2019; see also Methods). The constraint is made with LCC-derived Vcmax aggregated to each 0.1∘ grid every 7 d as the initial value, which is then replaced when good quality TROPOMI SIF data are available. In this way, the best information on Vcmax from both SIF and LCC is combined. The combined global Vcmax product is highly correlated with that produced from LCC (mol m−2 s−1, P<0.001), suggesting that much of the LCC information is transferred to this product by filling in its data gaps.
The global distribution of Vcmax has also been derived theoretically. Based on a new ecological optimality theory (Wang et al., 2017), Smith et al. (2019) calculated a global Vcmax map from meteorological variables of radiation, air temperature, and vapor pressure deficit using a monthly climate dataset (Harris et al., 2014). The theory proposes that leaves optimize the use of available resources so that the photosynthetic rate limited by Vcmax equals that limited by the electron transport to generate ribulose-1,5,-bisphosphate (RuBP) needed in photosynthesis under average daytime conditions. In this theory, the electron transport rate is computed from meteorological conditions, and is independent of soil nutrient and water conditions. Evaluation against 3672 ground observations shows that the model can capture about of the variance in the observed Vcmax (mol m−2 s−1, P<0.001), while the model bias is most significantly correlated to leaf nitrogen content among several leaf and soil parameters (Smith et al., 2019). The validity and reliability of Vcmax information derived from the theory are yet to be evaluated outside of the limited amount of ground data.
Here we provide assessment of the reliability of these products for global ecological and Earth system studies. The specific objectives of this study are (1) to derive new global Vcmax products using satellite data; (2) to assess the accuracy of these products against a ground-based dataset; (3) to mutually assess these products; and (4) to evaluate the Vcmax product-derived ecological optimality theory using satellite-derived Vcmax products, as the theory would be useful for estimating Vcmax in prognostic terrestrial ecosystem models (TEMs) which are often used in Earth system models.
2.1 Deriving Vcmax from SIF
During photosynthesis, plant leaves dissipate part of the excess light energy that is not used in photochemistry in the form of chlorophyll fluorescence (Porcar-Castell et al., 2014). Under conditions without strong moisture and/or thermal stress, the SIF emission from a leaf increases with its instantaneous photosynthetic rate (Frankenberg et al., 2011; Guanter et al., 2014; Sun et al., 2017; Li et al., 2018; Wang et al., 2020), although SIF signals are small (1 %–5 % of reflected radiation at near infrared wavelengths, Colombo et al., 2016) and contain noise from various sources including the variations in solar illumination angle and sensor viewing angle (Dechant et al., 2020). In a plant canopy, sunlit leaves are the predominant sources of SIF (Pinto et al., 2016). For the purpose of deriving leaf-level information, the total SIF measured from a canopy was first separated into sunlit and shaded leaf components according to sun-target-sensor observation geometry and canopy architectural parameters. The observation geometry was determined by satellite and solar zenith and azimuthal angles. The main canopy architectural parameters were leaf area index (LAI), which quantifies the amount of leaf area in the canopy per unit ground surface area, and the clumping index (CI), which characterizes the non-random spatial distribution of leaves in the canopy. Both LAI and CI were used to separate sunlit and shaded leaf fractions in the canopy, and the observation geometry determined the proportion of sunlit leaves observed by a satellite sensor (Chen et al., 1999). Leaf reflectance at the SIF wavelength was used to estimate the strength of multiple scattering of emitted SIF in the canopy that enhances SIF observed from sunlit leaves (He et al., 2019). The sunlit SIF component derived in this way was then converted into the average sunlit leaf photosynthetic rate, from which Vcmax is derived using a data assimilation technique (He et al., 2019). An ensemble Kalman filer (EnKF) was developed using an ecosystem model (Chen et al., 2012) and used in the data assimilation technique to optimize Vcmax based on the difference between SIF-derived and modeled average sunlit leaf photosynthetic rates. In the optimization, it was assumed that the error in modeling the photosynthetic rate was caused by both inaccuracy in the initial Vcmax input (constants by PFT or estimated based on LCC) and the collective errors in other parameters, including environmental conditions (meteorology and soil) used in the model. An error matrix was therefore developed to determine the amount of adjustment to the initial Vcmax value (He et al., 2019). Optimized Vcmax values often differed considerably from the initialized values beyond their error ranges, suggesting that SIF observations provided reliable and strong signals for its optimization, even though other model errors are also present.
The data assimilation methodology was first applied to GOME-2 SIF data and generated a global daily Vcmax map series from 2007 to 2017 at 36 km resolution (He et al., 2019). In this study, this methodology was refined and applied to TROPOMI SIF data to produce global daily Vcmax maps in 2019 at 0.1∘ resolution (≈10 km). The refinements included the conversion from SIF to GPP using non-linear relationships (Liu et al., 2022) rather than linear relationships used in He et al. (2019) and the initialization of Vcmax using the LCC product (Croft et al., 2020) rather than constant Vcmax by PFT. Although the Vcmax map series produced using TROPOMI SIF + LCC data is available for only one year, it has a much higher spatial resolution than that produced from GOME-2, and therefore has broader applications in global ecological research.
2.2 Deriving Vcmax from LCC
LCC is responsible for light harvesting and providing excitation energy to drive photosynthesis in leaves, while Vcmax defines the capacity of leaves to utilize the excitation energy for photosynthesis. These two leaf traits are dynamically optimized to local environmental conditions to achieve an optimal use of nitrogen resources (Xu et al., 2012). LCC is a relatively stable trait without much day-to-day and diurnal variations, while Vcmax is sensitive to temperature. Empirical data show close relationships between LCC and Vcmax25 (Houborg et al., 2017; Croft et al., 2017; Lu et a., 2020), which is Vcmax normalized to its value at 25 ∘C using a temperature function (Smith et al., 2019, see also Sect. 2.4 below). A two-step radiative transfer model inversion method was developed for retrieving LCC from multispectral satellite data (Zhang et al., 2008; Croft et al., 2020). In step 1, the canopy-level reflectance was inverted to leaf-level reflectance with a lookup table (LUT) constructed using canopy radiative transfer model for canopies with turbid media (Verhoef, 1984) and a geometrical optical model for clumped canopies (Chen and Leblanc, 1997, 2001) that computed observed sunlit leaf fraction according to canopy structure and sun-target-view geometry. In step 2, the leaf-level PROSPECT model (Feret et al., 2008) was inverted to obtain LCC from the inverted multi-spectral leaf reflectance. This two-step model inversion algorithm avoids issues with empirical methods that directly link LCC to canopy-level remote sensing data, which lack generality because of variable canopy structure and sun-target-view geometry. The first time-series of global LCC maps were retrieved using MERIS data from 2003 to 2011 at 300 m resolution and 7 d intervals (Croft et al., 2020). A validation using 248 ground sites in 5 PFTs suggests that this product is reliable (g cm−2 or mean error 23 %). Using empirical relationships between LCC and Vcmax25 for various PFTs (Luo et al., 2019), this global LCC time series was converted into Vcmax25.
2.3 Ground-based Vcmax dataset
In this study, we use the same ground-based Vcmax dataset as that used by Smith et al. (2019). It consisted of 3672 entries for 1474 plant species that are grouped into seven PFTs in this study. Each entry consisted of Vcmax measured from one or more leaves with companion data of air temperature, humidity, incoming PAR, longitude, and latitude. Vcmax was derived from several pairs of photosynthesis (A) and intercellular CO2 concentration (Ci) (to construct an curve) (56 %) or from a single pair of A and Ci using the method of De Kauwe et al. (2016) (44 %).
To match with Vcmax maps derived from SIF, LCC, and EOT, the ground-based data were aggregated in two ways: (1) the data points of the same PFT as that in the PFT map (Fig. 4b) used for LCC and SIF processing were grouped to form an average Vcmax for a grid, while mismatched data points within the grid were ignored; and (2) all existing data points within each grid were averaged and labeled as the dominant PFT. We found that the second way resulted in better correlation with all three types of Vcmax maps. After the aggregation to 0.5∘ resolution, there were 180 data points for all PFTs used in the final analysis of all Vcmax products.
2.4 Temperature normalization
For the same leaf, Vcmax varies exponentially with leaf temperature, and hence it is more meaningful to compare Vcmax25 between leaves or different estimates. In this study, all global Vcmax products are derived at the growth temperature. To facilitate their comparisons with ground databases and their future use in models, Vcmax is converted to Vcmax25 using a common temperature function (Eq. 22 in Smith et al., 2019).
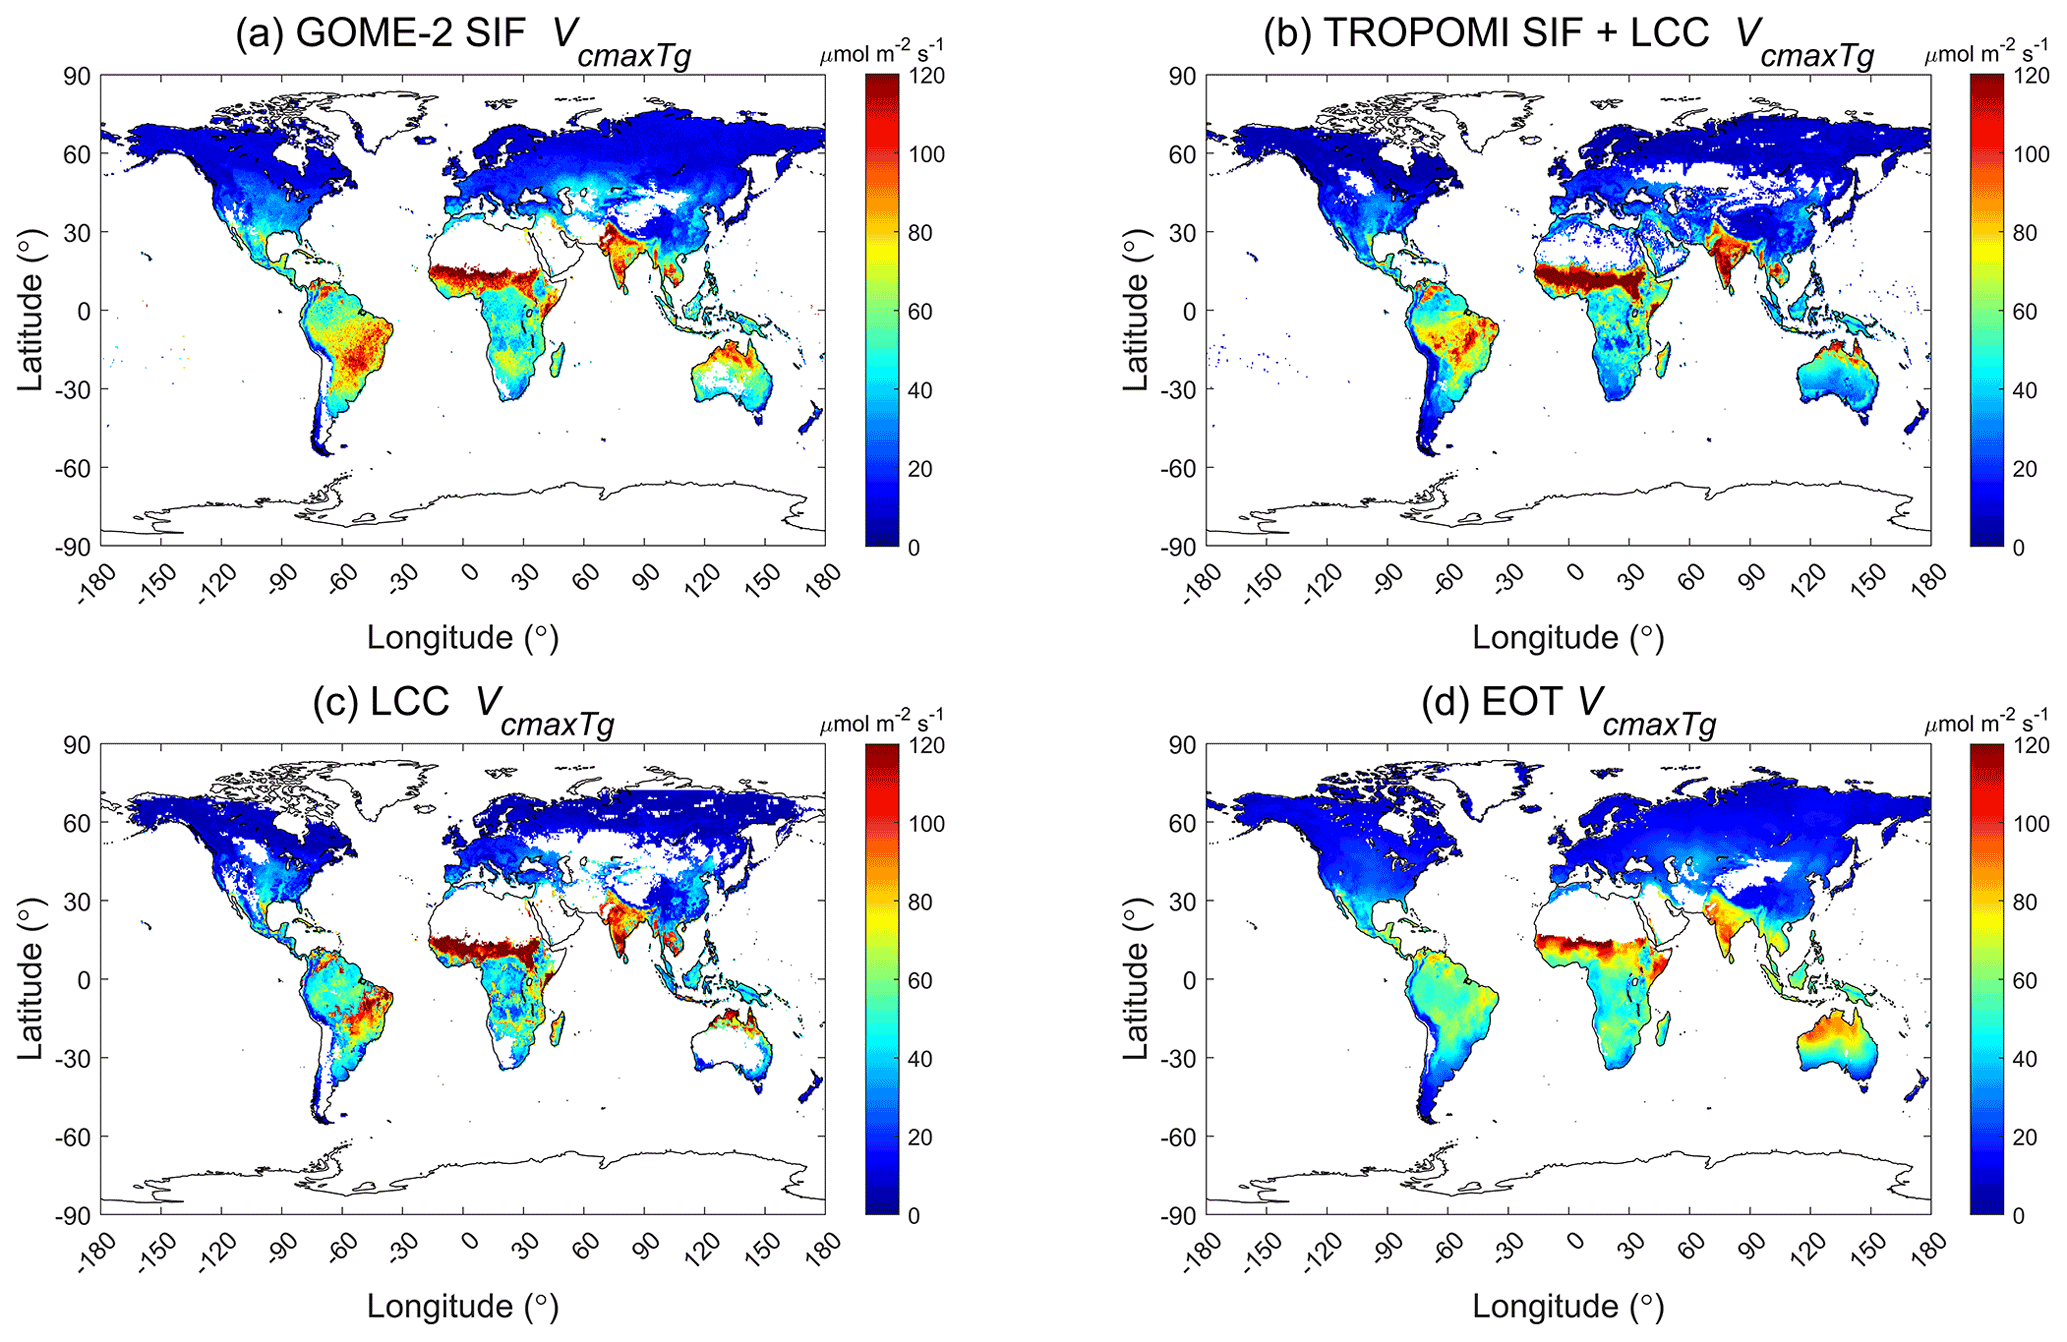
Figure 1Global distributions of at the mean growing season temperature derived using (a) GOME-2 SIF (2007–2011), (b) TROPOMI SIF+LCC (2019) constrained by leaf chlorophyll content (LCC), (c) LCC (2017), and (d) ecological optimality theory (1901–2015). White areas are missing data.
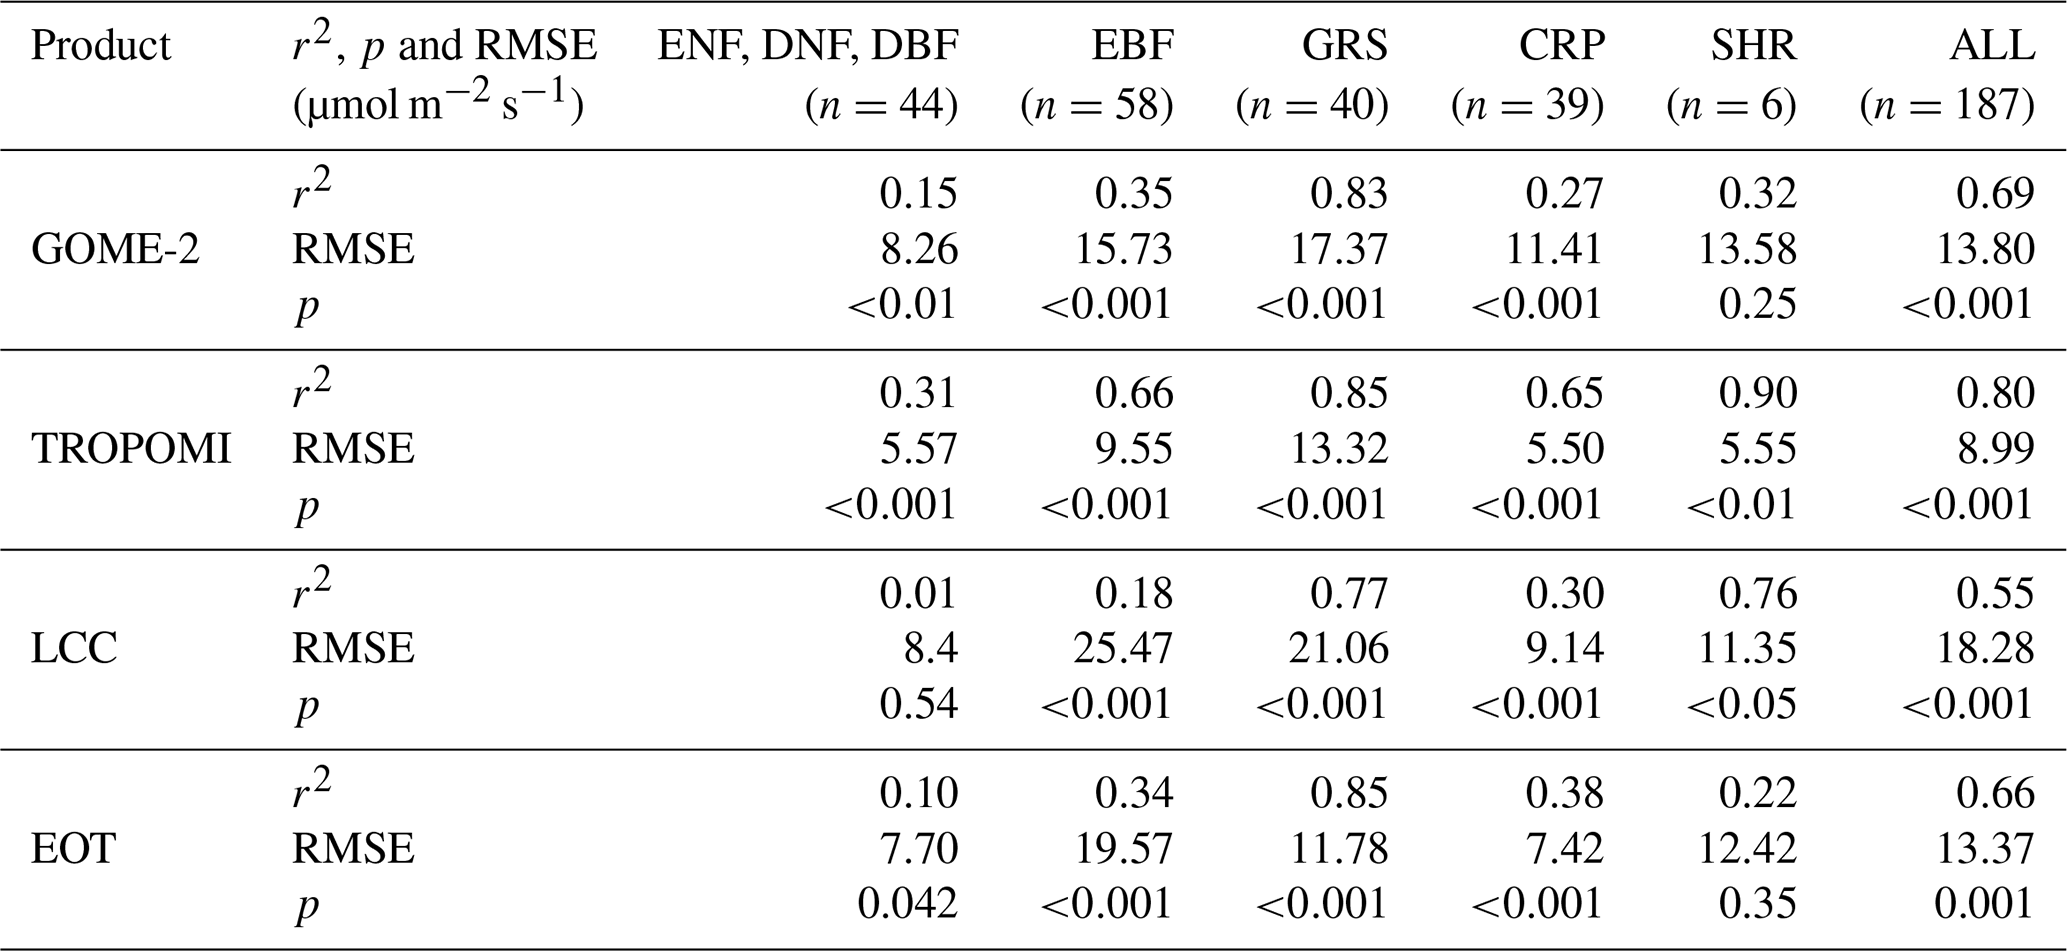
Table 1Correlations by plant function type between Vcmax at growing season mean temperature (Tg) in four products (GOME-2 SIF, TROPOMI SIF, LCC, and EOT) and a ground database with 3672 individual data points aggregated to 180 grids of 0.5∘ resolution. ENF signifies evergreen needleleaf forest, DNF deciduous needleleaf forest, DBF deciduous broadleaf forest, EBF evergreen broadleaf forest, GRS grassland, CRP cropland, SHR shrub, and RMSE root mean square error.
3.1 Evaluation of four global Vcmax products
The global distributions of the growing season mean Vcmax obtained from GOME-2 SIF, MERIS LCC, and TROPOMI SIF are shown in Fig. 1 in comparison with Vcmax calculated from the ecological optimality theory (EOT) at the growing season mean temperature. For this comparison, Vcmax25 derived from LCC is converted to Vcmax at the mean growing temperature. The growing season is defined as the period when monthly mean air temperature is above 0 ∘C. These four global Vcmax distributions derived at different spatial resolutions at 36 km, 300 m, 0.1, and 0.5∘ from GOME-2 SIF, LCC, TROPOMI SIF, and EOT, respectively, and aggregated to 0.5∘ resolution in Fig. 1, are highly correlated spatially, although their details differ to some extent. The distribution derived from the optimality theory appears to be spatially smooth, reflecting the fact that meteorological variables used for Vcmax prediction do not vary abruptly in space. The three remote sensing products show mutually-consistent patchy patterns, suggesting that they have all captured some realistic variability on the ground associated with PFT distribution patterns. However, all four products show remarkable similarities in the overall geographic patterns and mutually well correlated with each other (, p<0.001). Among three remote sensing products, SIF-derived products correlate best with the product based on the ecological optimality theory (EOT) (mol m−2 s−1, P<0.001 for GOME-2; mol m−2 s−1, P<0.001 for TROPOMI). We further evaluate these products below.
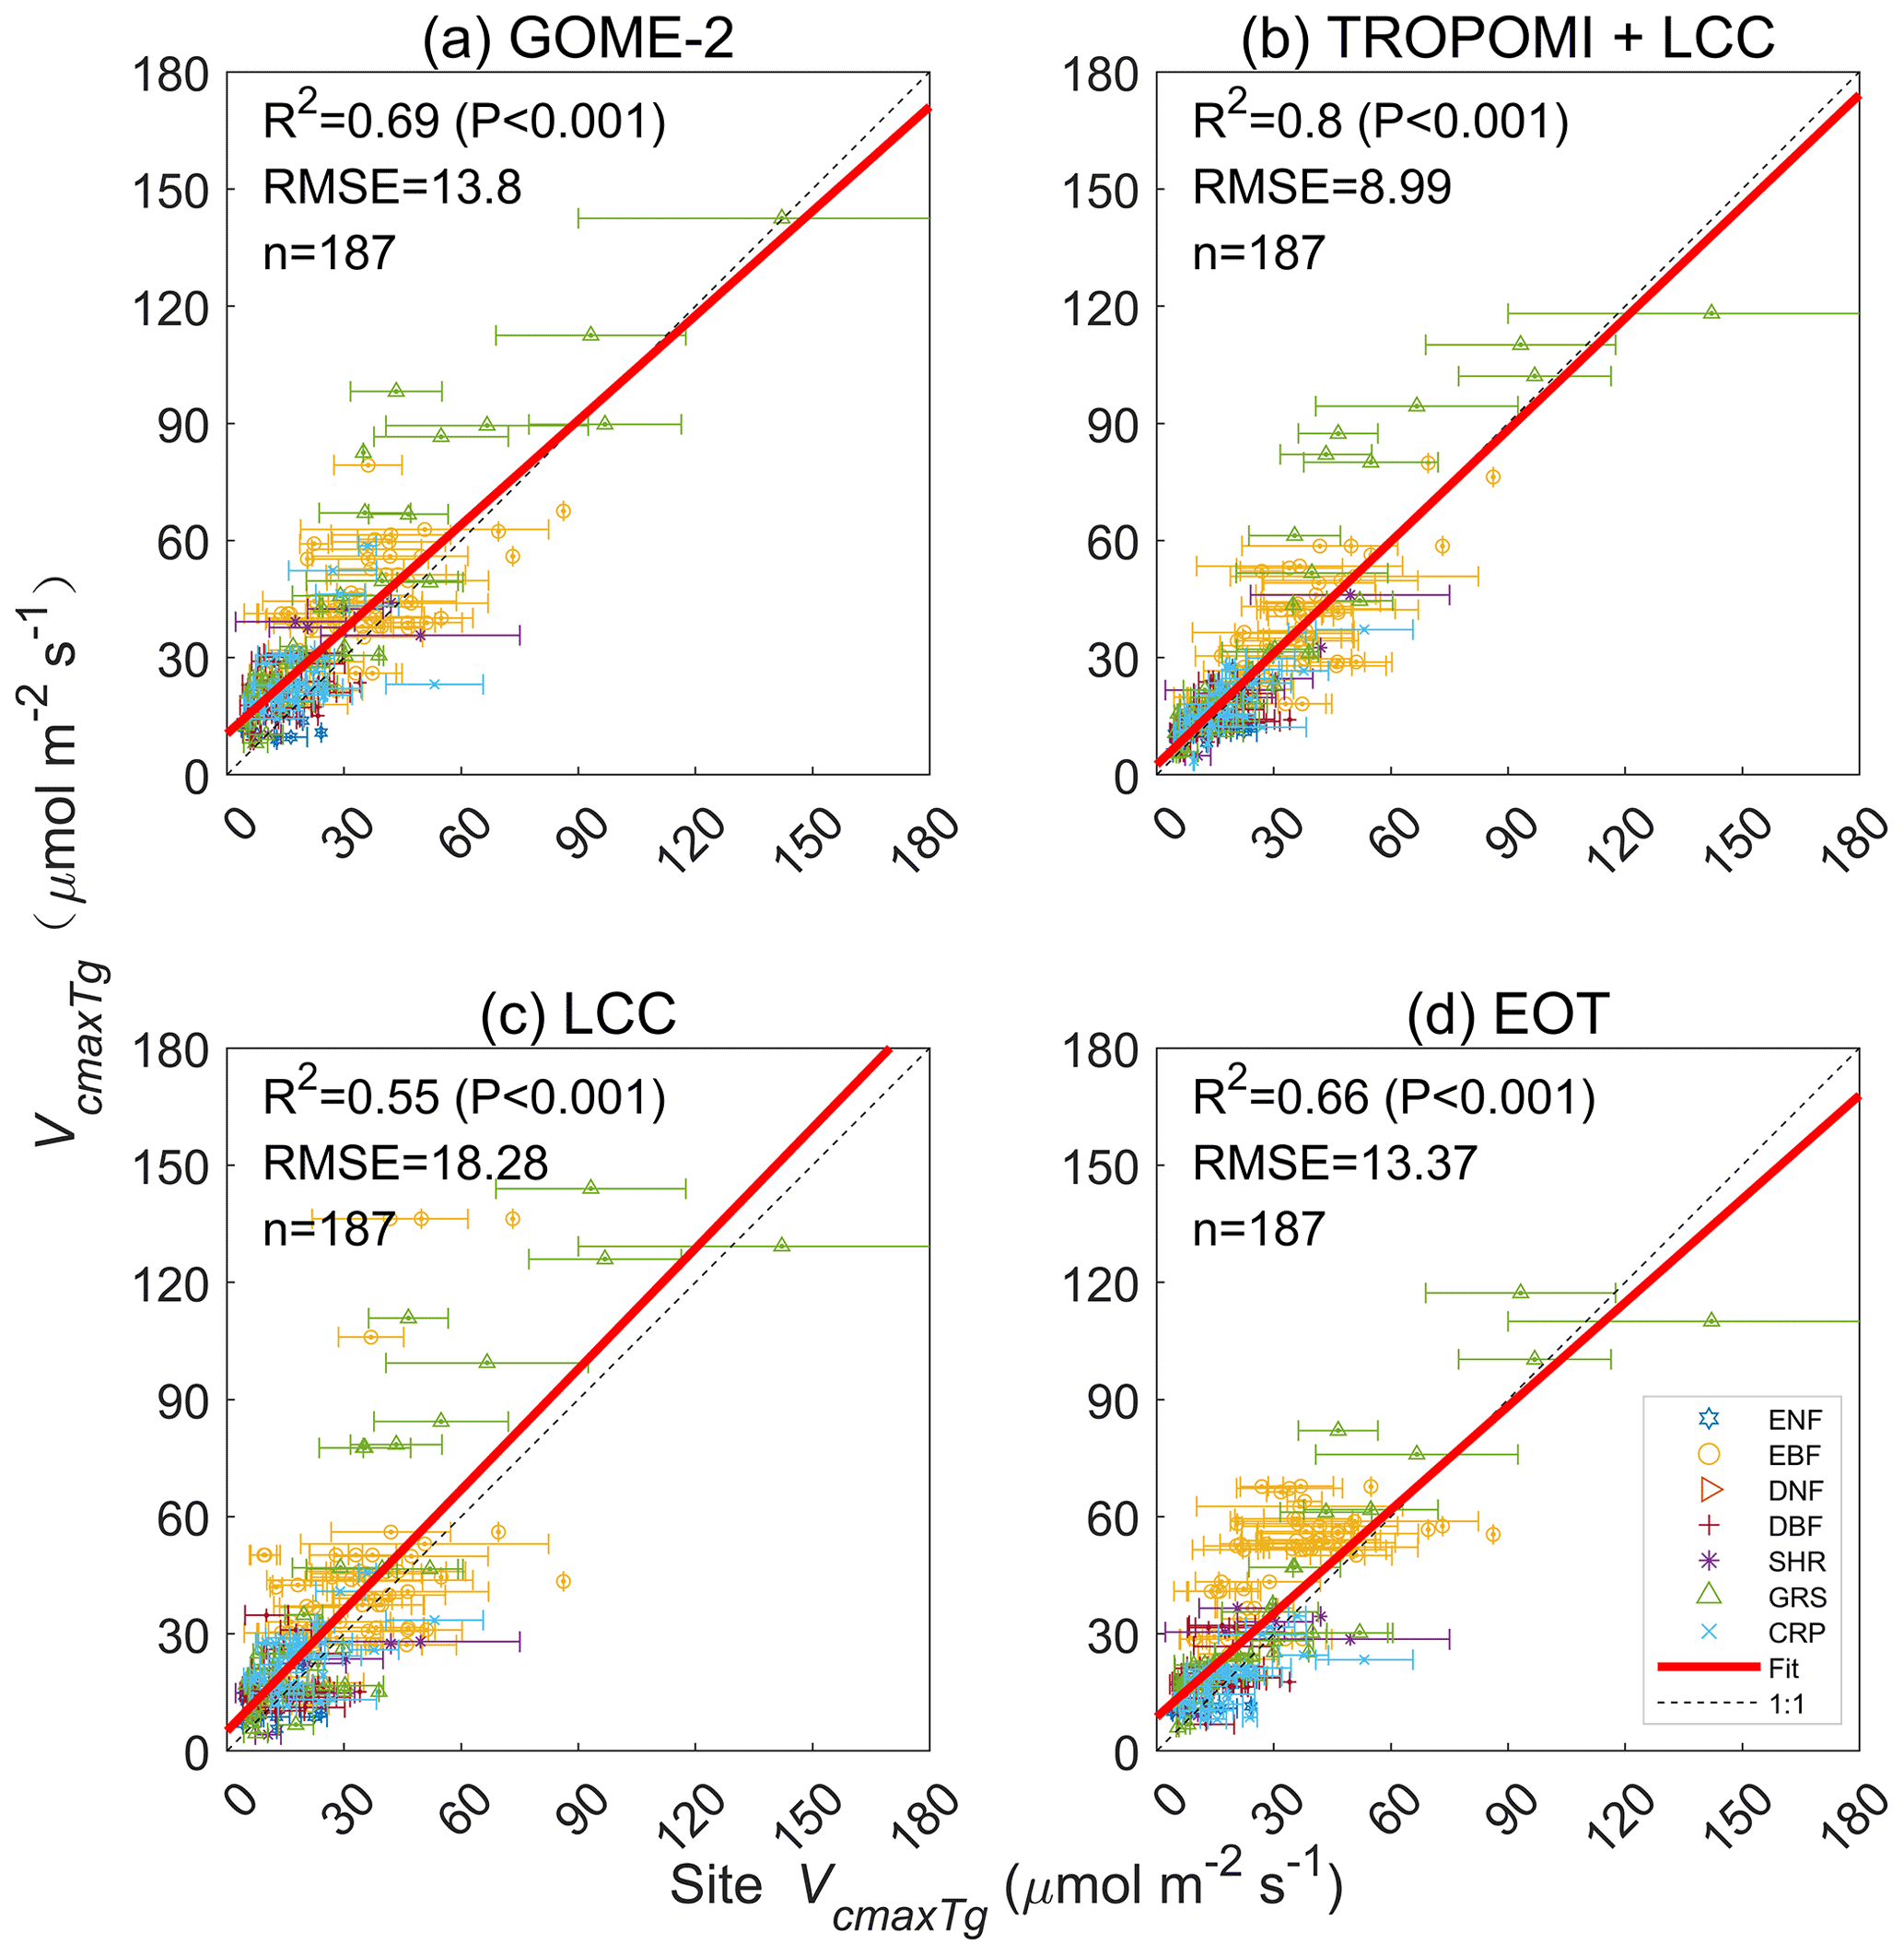
Figure 2Comparisons of Vcmax at growing season mean temperature (Tg) derived from GOME-2 SIF, TROPOMI SIF+LCC, LCC, and optimality theory (EOT) against a ground database with 3672 individual data points aggregated to 180 grids of 0.5∘ resolution. The root mean square error (RMSE) is in unit of µmol m−2 s−1.
All four Vcmax products compare well with ground-based measurements (Fig. 2) after they are aggregated to the corresponding 0.5∘ grids (see Methods). The correlation of optimality-based Vcmax with the ground measurements is similar to that shown in Smith et al. (2019) (mol m−2 s−1, P<0.001), and correlations of other three Vcmax products with the same ground measurements are similar (mol m−2 s−1, P<0.001 for GOME-2; mol m−2 s−1, P<0.001 for TROPOMI; mol m−2 s−1, P<0.001 for LCC). It is encouraging to see that three of the four products captured about of the variance in the ground data, despite the large-scale mismatch between the grids of these products and the ground data points. Some errors would also be expected from temporal mismatches as the differences in the years of ground and remote sensing data acquisitions are not considered (in order to have as many data points as possible in the comparisons), although data outside of the growing season are excluded. While Vcmax for individual leaves may vary greatly among plant species within the same functional type and with environmental conditions over the landscape, their locally averaged values would be expected to display a consistent spatial pattern at large scales that are determined more or less by meteorological conditions – permitting the success of the optimality theory for predicting Vcmax based on meteorological variables alone. Coarse-resolution remote sensing data, such as GOME-2 SIF data at 36 km resolution and TROPOMI at 0.1∘ resolution, can also capture the spatial variability in Vcmax at large scales.
The correlation statistics of the four products shown in Fig. 2 with the ground database by plant function type are given in Table 1. Forest PFTs of ENF, DNF, and DBF are combined in order to have a sufficient number of data points for the statistical analysis. Correlations for most PFTs are highly significant for all products (p<0.001), but for forest PFTs and SHR, the correlations are weak for most products except for TROPOMI. The TROPOMI Vcmax product (https://doi.org/10.5281/zenodo.6466968) compares best with the ground database in terms of the Pearson correlation coefficient (r2), RMSE, and the p value from two-tailed paired t tests, suggesting that the combination of SIF and LCC information is effective in capturing the spatial variability of Vcmax for the various PFTs. It is therefore most ready for global ecological studies among the four products.
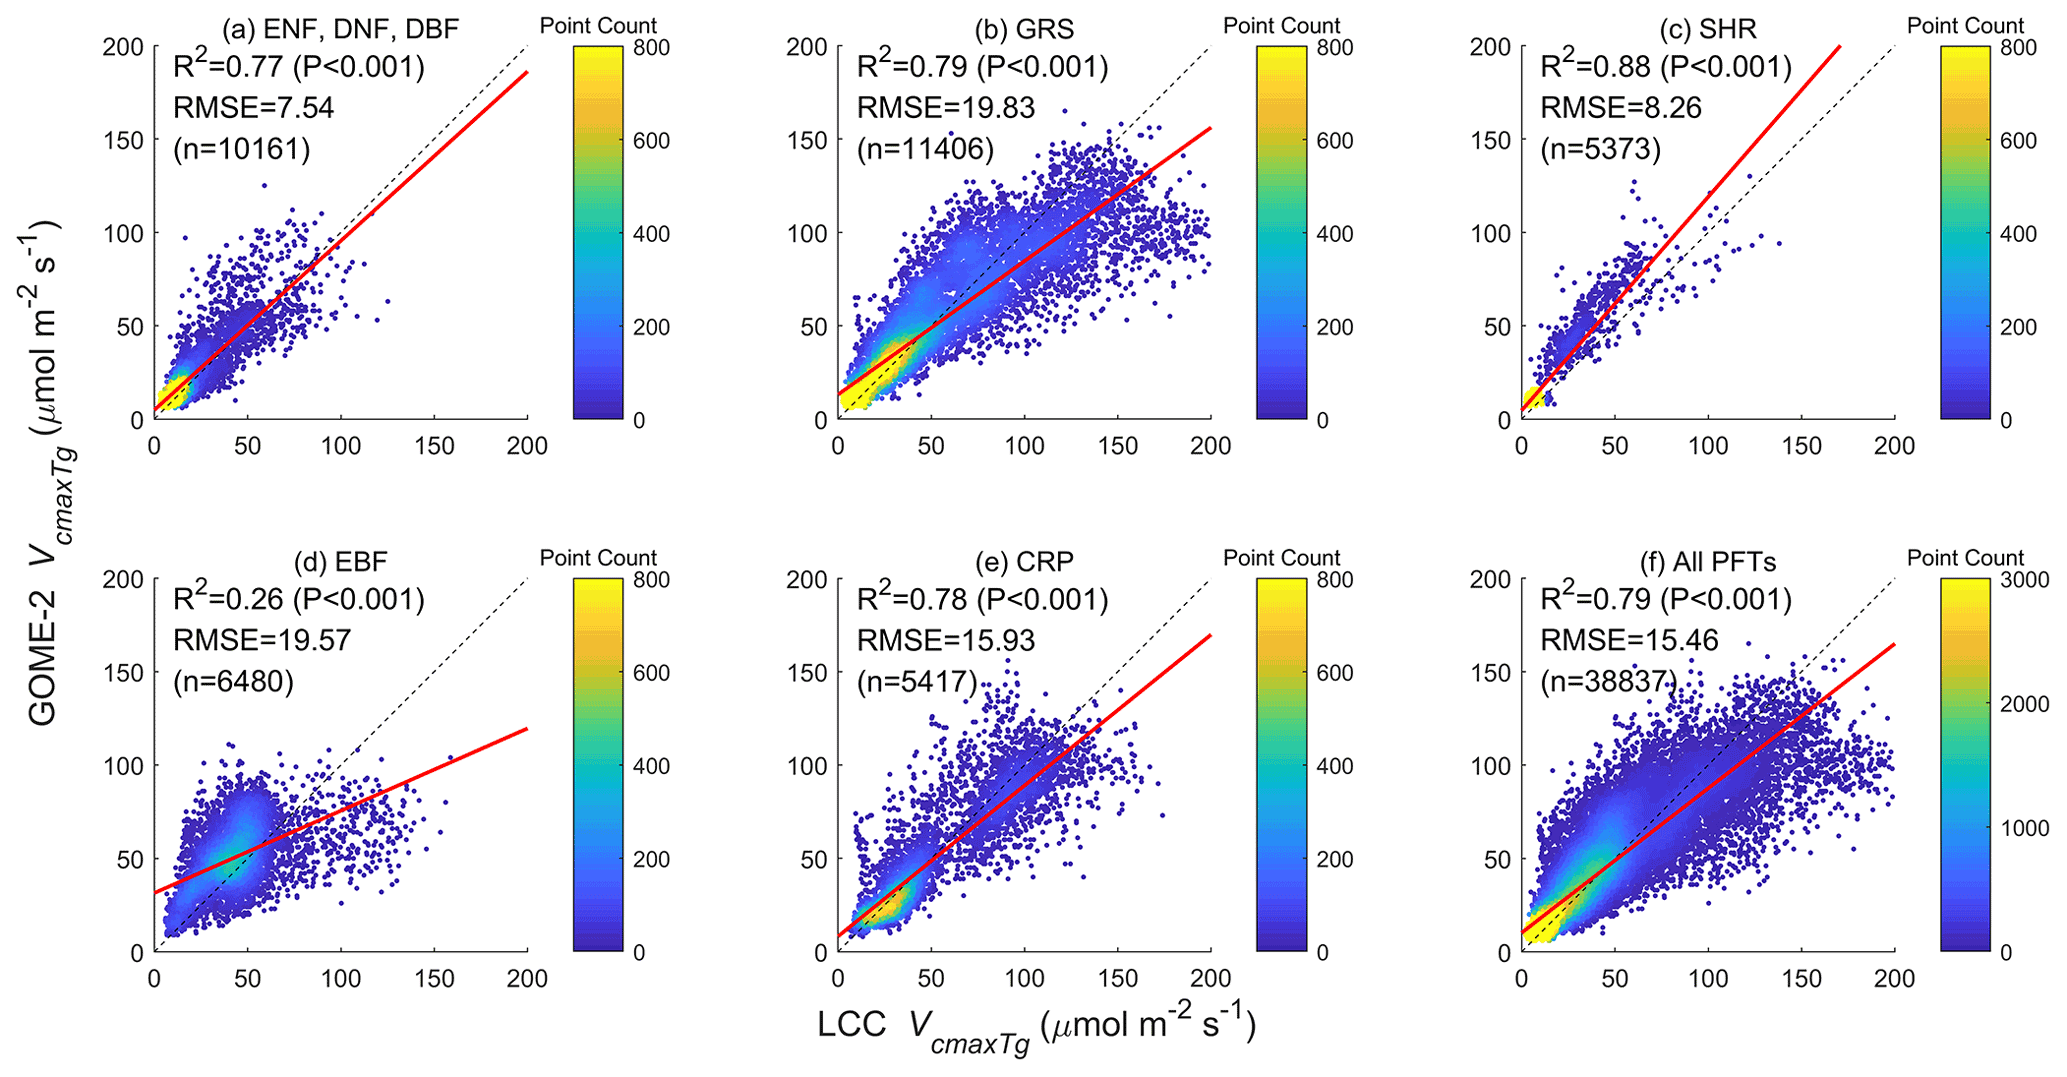
Figure 3Comparisons of SIF-derived and LCC-derived Vcmax values for a group of three PFTs and four individual PFTs, and all PFTs combined. These two sets of Vcmax derived independently using two different remote sensing techniques are very well correlated for all PFTs except for the evergreen broadleaf forests (EBFs) in tropical areas where frequent clouds degrade the quality of both SIF and LCC datasets.
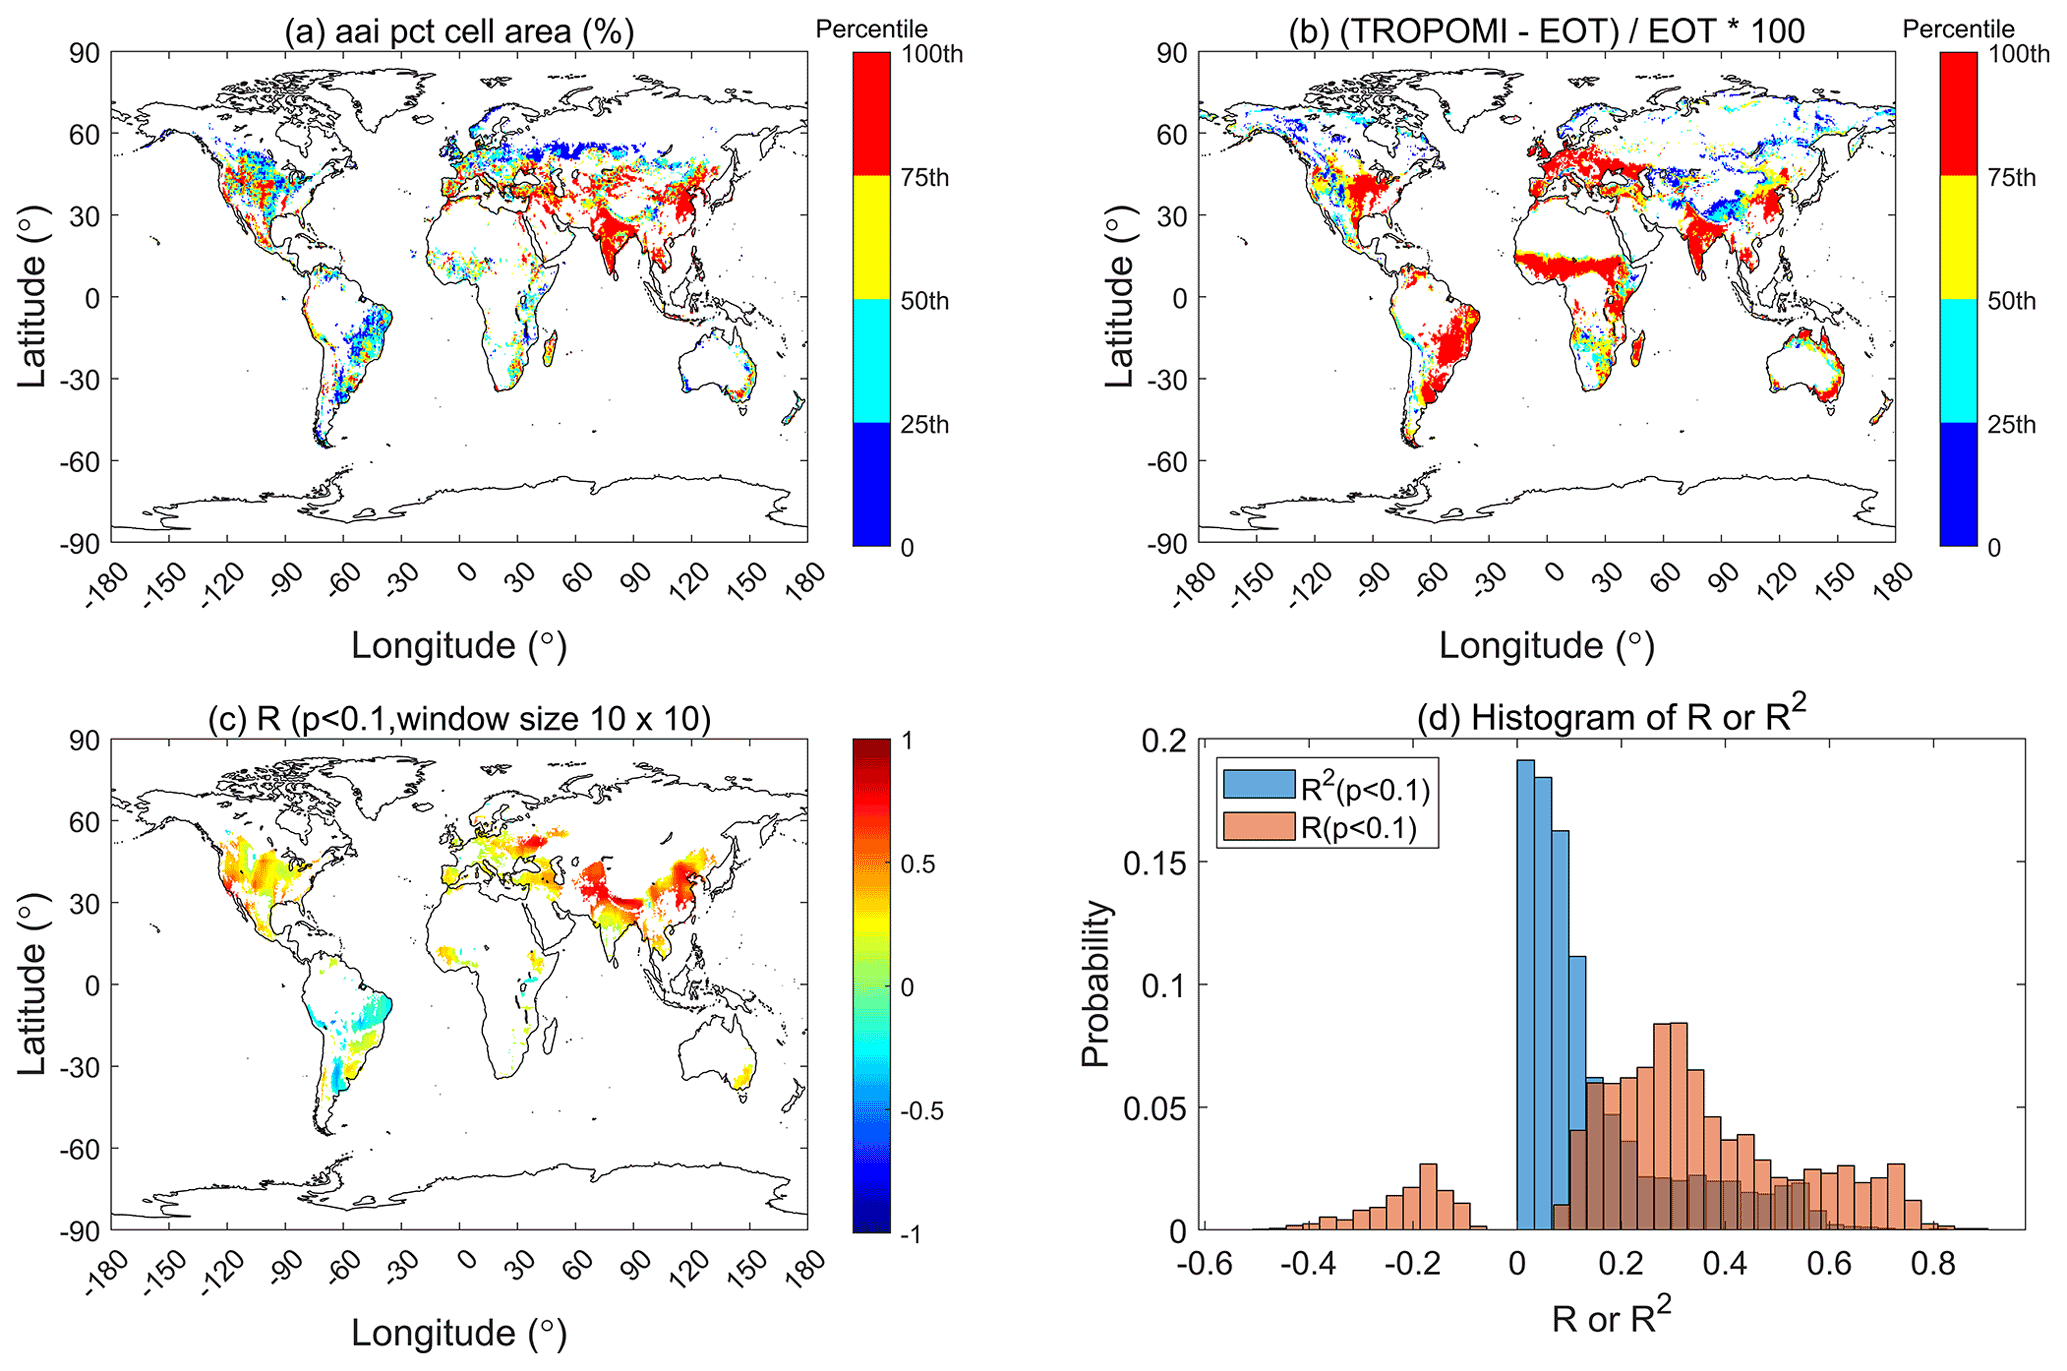
Figure 4The influence of irrigation on Vcmax over cropland and grassland, detected by TROPOMI SIF+LCC at 0.5∘ resolution, where (a) is the actual area irrigated in percent of cell area (aai pct cell area) in recent decades, (b) the relative difference in Vcmax (ΔVcmax) between TROPOMI and ecological optimality theory (EOT), i.e., ΔVcmax=(TROPOMI-EOT)/EOT, (c) the correlation coefficient (r) between actual irrigated area percentage and ΔVcmax within sliding windows of 10×10 pixels, and (d) the histograms of r and R2 values in (c) for cropland and grassland. ΔVcmax is significantly correlated with percent area irrigated in both cropland (r=0.32, p<0.001) and grassland (r=0.30, p<0.001) at the global scale.
The Vcmax values derived independently from GOME-2 SIF and MERIS LCC at the mean growing season temperature are well correlated overall (r2=0.79) and for individual PFTs () except for EBF (r2=0.26) (Fig. 3). These high correlations suggest that the signals contained in both SIF and multi-spectral reflectance data used for LCC retrieval are strong and useful for deriving Vcmax. This is particularly encouraging because both types of remote sensing data are increasingly available with existing and forthcoming satellite sensors providing improved SIF (Mohammed et al., 2019) and multi-spectral data (such as the Sentinel sensor series, https://sentinel.esa.int/web/, last access: 31 August 2022). The differences between these two independent retrievals of Vcmax are still considerable, especially for EBF in the tropics due to frequent cloud cover, and there is room for improvement not only in the retrieval algorithms but also in providing improved SIF and spectral data at higher spatial and temporal resolutions. Much more ground-based data of Vcmax, LCC, and associated structural parameters (leaf area index and clumping index) are still needed for refining and validating the retrieved Vcmax. However, these existing products are already a large step forward from the current state of the art and can be employed immediately for parameterizing and benchmarking TEMs. In other words, these products may have already overcome the Vcmax bottleneck in accurate modeling of the spatio-temporal patterns of the terrestrial productivity and carbon cycle.
3.2 Influence of environmental factors on Vcmax
Vcmax values derived from all three remote sensing products shown in Fig. 1 are most obviously larger than those produced by EOT over croplands and grasslands in the Americas, India, and China. Cropland and grassland management, including fertilization and irrigation, may explain part of this divergence. To explore the possible influences of cropland and grassland irrigation on Vcmax, we used a global irrigation map (https://www.fao.org/aquastat/en/geospatial-information/global-maps-irrigated-areas/latest-version/, last access: 31 August 2022) at 0.5∘ resolution to compare with the relative difference (ΔVcmax) between TROPOMI SIF+LCC Vcmax and EOT-based Vcmax, i.e., (TROPOMI-EOT)/EOT (Fig. 4). Globally, ΔVcmax increases with irrigated area percentage. The regression coefficient (R) between the actual values of percent irrigated area and ΔVcmax for the areas of irrigation greater than 5 % at the global scale is +0.32 (p<0.01) and +0.3 (p<0.01) for croplands and grasslands, respectively. In some regions, including China, India, and the Middle East, the correlation coefficient is considerably higher (). Irrigation in cropland and grassland would reduce water stress and increase leaf photosynthetic capacity (Reed and Loik, 2016; Chen et al., 2019; Song et al., 2021), giving rise to the positive correlation between ΔVcmax and percent of irrigation area in a pixel. For crops, fertilization would generally co-occur with irrigation (Sela, 2021), so this positive correlation could also include the effect of fertilization on Vcmax.
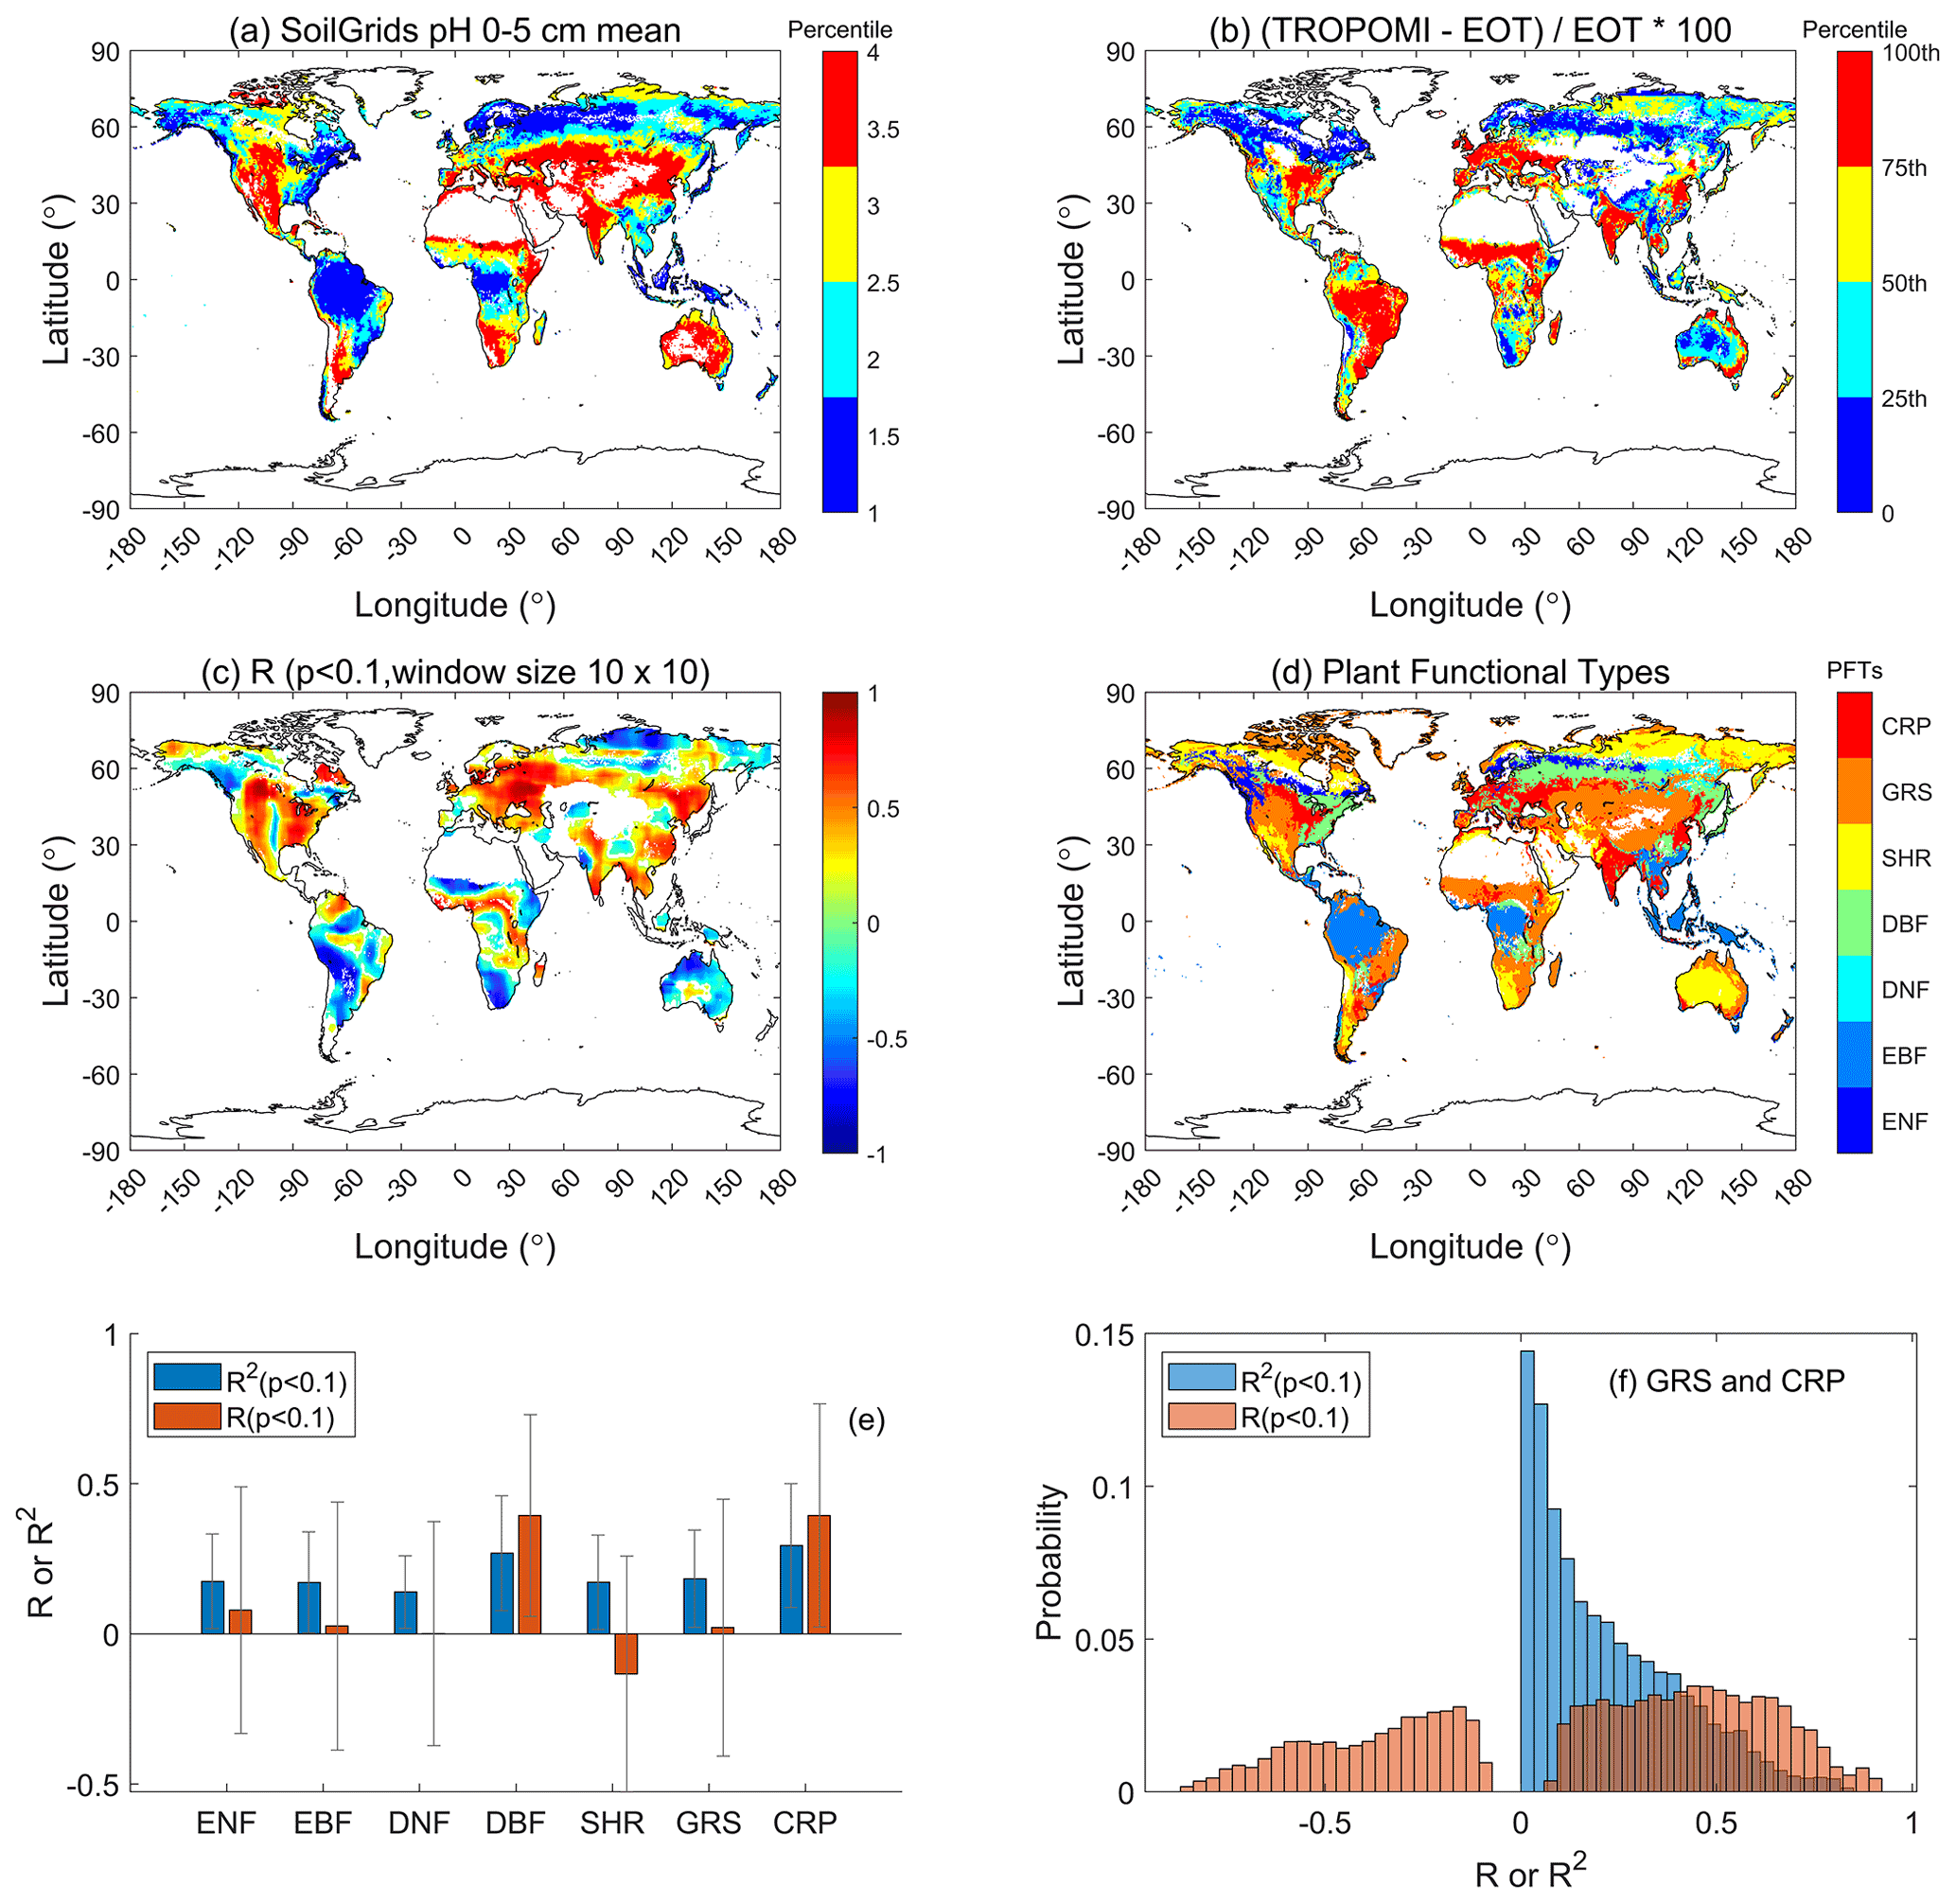
Figure 5Soil pH has significant influence on Vcmax detected by TROPOMI SIF+LCC at 0.5∘ resolution. (a) Soil pH in the top 0–5 cm layer, (b) relative difference in Vcmax (ΔVcmax) between TROPOMI and ecological optimality theory (EOT), i.e., ΔVcmax= (TROPOMI-EOT)/EOT, (c) correlation coefficient (r) between soil pH and ΔVcmax within sliding windows of 10×10 pixels, (d) PFT distribution, (e) summary of mean correlation coefficient r and R2 values in (c) by PFTs, and (f) histograms of r and R2 values in (c) for grassland (GRS) and cropland (CRP). In 40.3 % of GRS and CRP pixels, ΔVcmax is positively and significantly (p<0.1) correlated with soil pH.
Soil properties may also influence Vcmax (Reich et al., 2007, Maire et al., 2015; Ali et al., 2015, Smith and Dukes, 2018). Among soil properties available in the global SoilGrids database (Hengl et al., 2017), we found that soil pH best correlates with ΔVcmax. Soil pH is spatially variable (Fig. 5a), and we found that ΔVcmax is positively and significantly correlated to soil pH in most regions, with 40.3 % (11 163 out of 27 681 pixels) of cropland and grassland areas having r>0.1 and p<0.1 (Fig. 5). Similar statistics are found for other PFTs, suggesting that soil pH has similar effects on Vcmax across PFTs. However, ΔVcmax is not significantly correlated with other soil properties, including soil carbon content, nitrogen content, and cation exchange capacity. Soil pH is a key control on soil biochemical reactions affecting nutrient uptake (Hall et al., 1998; Gentili et al., 2018), and has an optimum range for plant growth from 5.5 to 7.5 (Islam, 1980). As soil pH varies in a wide range (4 to 8, Fig. 5), its effect on Vcmax is therefore detectable from remote sensing signals. Plants on acidic soils tend to have higher ratios of leaf-internal to ambient CO2 (Wang et al., 2017; Dong et al., 2020; Pailassa et al. 2020), and therefore would be expected to have lower Vcmax. These results suggest that Vcmax derived from SIF has captured much of the spatial variability in Vcmax due to irrigation and soil properties that are not captured by optimality theory. Remote sensing products can therefore provide more nuanced information on plant responses to non-meteorological environmental drivers, and can therefore provide more accurate Vcmax estimates and additional information on its spatial variability.
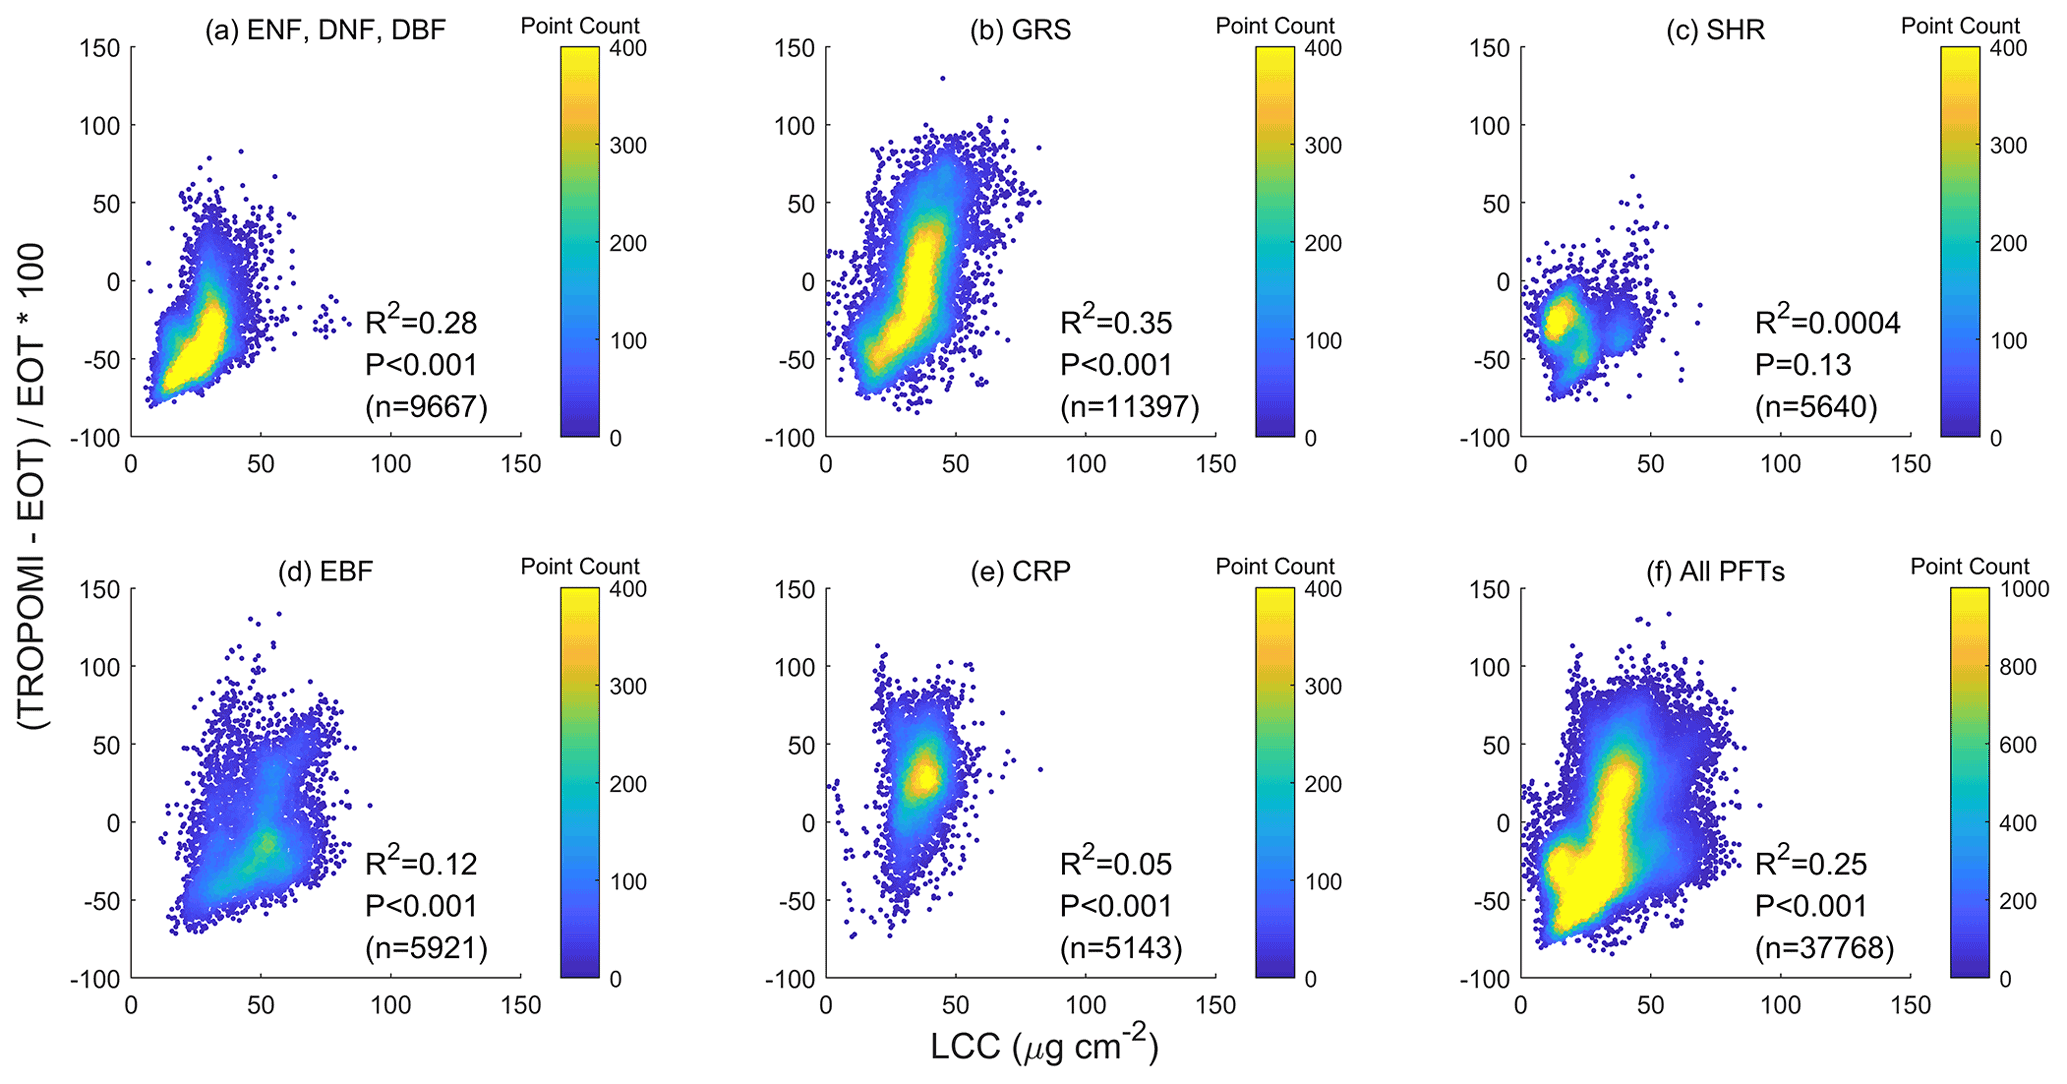
Figure 6The relative difference in (ΔVcmax) between TROPOMI and ecological optimality theory (EOT), i.e., ΔVcmax= (TROPOMI-EOT)/EOT, is significantly correlated to leaf chlorophyll content (LCC) as a proxy of the leaf nutrient condition. All PFTs are included. The correlation is statistically highly significant with p<0.001 for individual PFTs and for all PFTs combined.
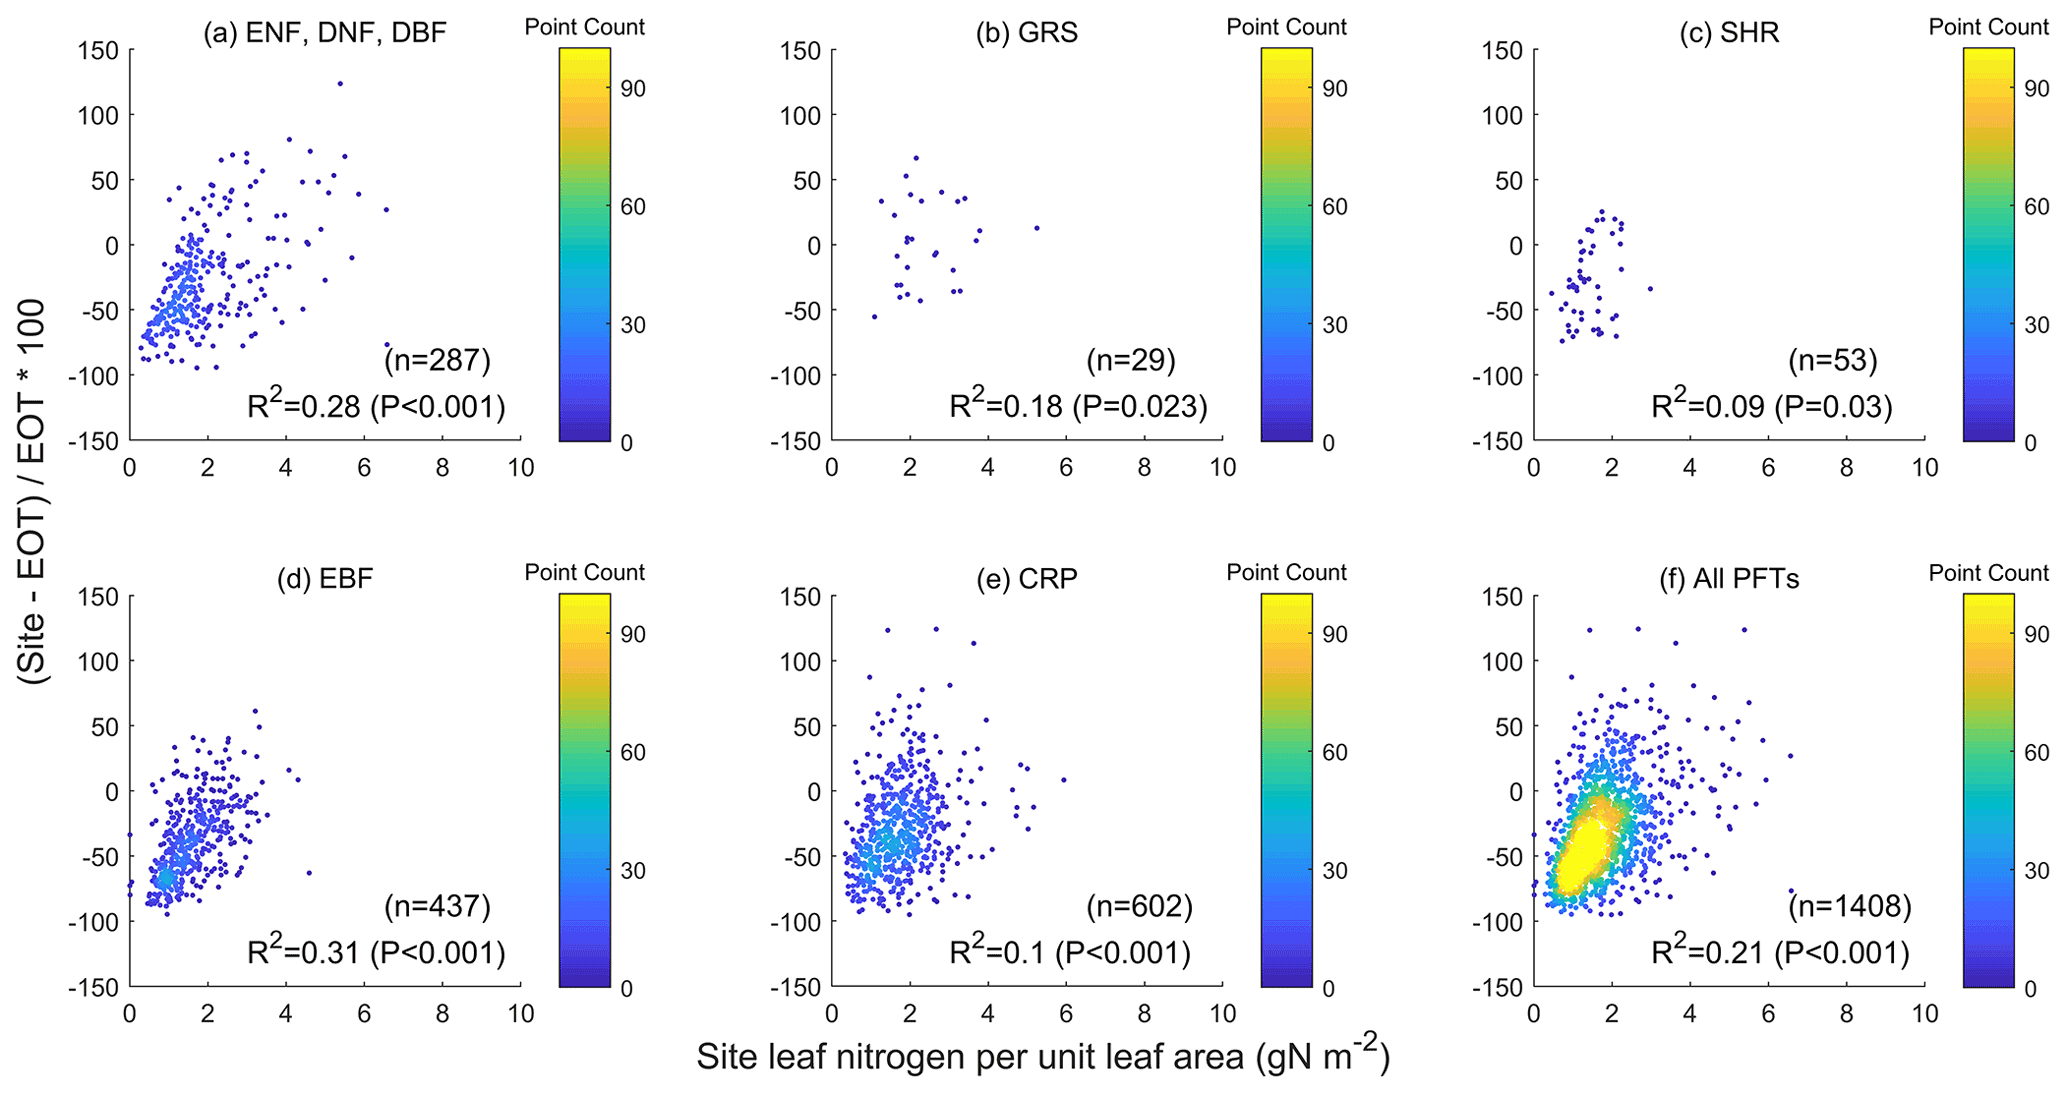
Figure 7Influence of leaf nitrogen content on the relative difference between values measured at ground sites and derived from an ecological optimality theory (EOT) using the available database (Smith et al., 2019). The influence is highly significant for all plant functional types (i.e., p<0.001). The slopes of the regressions of the relative difference in Vcmax against LCC or ground leaf nitrogen data are similar, in agreement with the global modeling results that levels of nutrient limitation to plant growth are similar among different PFTs (Fisher et al., 2012).
In addition to soil properties, leaf traits are expected to be more directly related to Vcmax. We use LCC, which contains part of the leaf photosynthetic nitrogen pool (Xu et al., 2012), as an indicator of the effect of leaf traits on Vcmax. We found that ΔVcmax is significantly and positively correlated to LCC for individual PFTs ( for TROPOMI) and for all PFTs combined () (Fig. 6). Similarly, the relative difference in EOT-derived Vcmax and ground measurements is also significantly correlated with leaf nitrogen content (, Fig. 7), in agreement with the finding of Smith et al. (2019). These positive relationships suggest that LCC as a proxy of the photosynthetic nitrogen content in leaves can explain part of the spatial variability in Vcmax due to the variations in environmental conditions that are not captured by the optimality theory. The added information from LCC due to plants' optimal allocation of nutrient resources would be useful to improve optimality-based modeling of Vcmax.
The global distribution patterns of growing season Vcmax shown by the four products (Fig. 1) have common latitudinal gradients, i.e., Vcmax is generally largest near the Equator and decreases away from the Equator. This latitudinal dependence is simulated in EOT through considering radiation, i.e., stronger radiation leading to larger Vcmax. This influence of radiation on Vcmax is well captured by the three remote sensing products. According to analyses of the leaf economics spectrum (Wright et al., 2004; Sack et al., 2013; Osnas et al., 2013; Reich, 2014), leaf photosynthetic capacity increases with mean annual rainfall, and therefore Vcmax in dry areas is expected to be smaller than that in wet areas. However, several semi-arid regions, such as India, the Middle East, Southeast Brazil, and areas near the southern border of the Sahara desert, have large Vcmax values. We found that these are mostly irrigated agricultural areas (Fig. 4), and the high Vcmax values there are due to crop management and are not in contradiction to existing leaf economics spectrum data. The Vcmax distribution pattern in Australia is compatible with the rainfall distribution, i.e., the lowest Vcmax is found in central Australia where rainfall is lowest and the highest Vcmax is located in northern Australia where rainfall is largest. The EOT product can also capture this pattern to some extent through meteorological variables (e.g., radiation and temperature). There are many spatial details in these Vcmax products that are of great interest to leaf economic studies.
Table 2Mean and standard deviation (SD) of Vcmax at the growing temperature () and normalized to 25 ∘C (Vcmax25) for different plant functional types (PFTs) calculated from the TROPOMI and ecological optimality theory (EOT) products in comparison with two ground-based databases (Smith et al., 2019; Kattge et al., 2009).
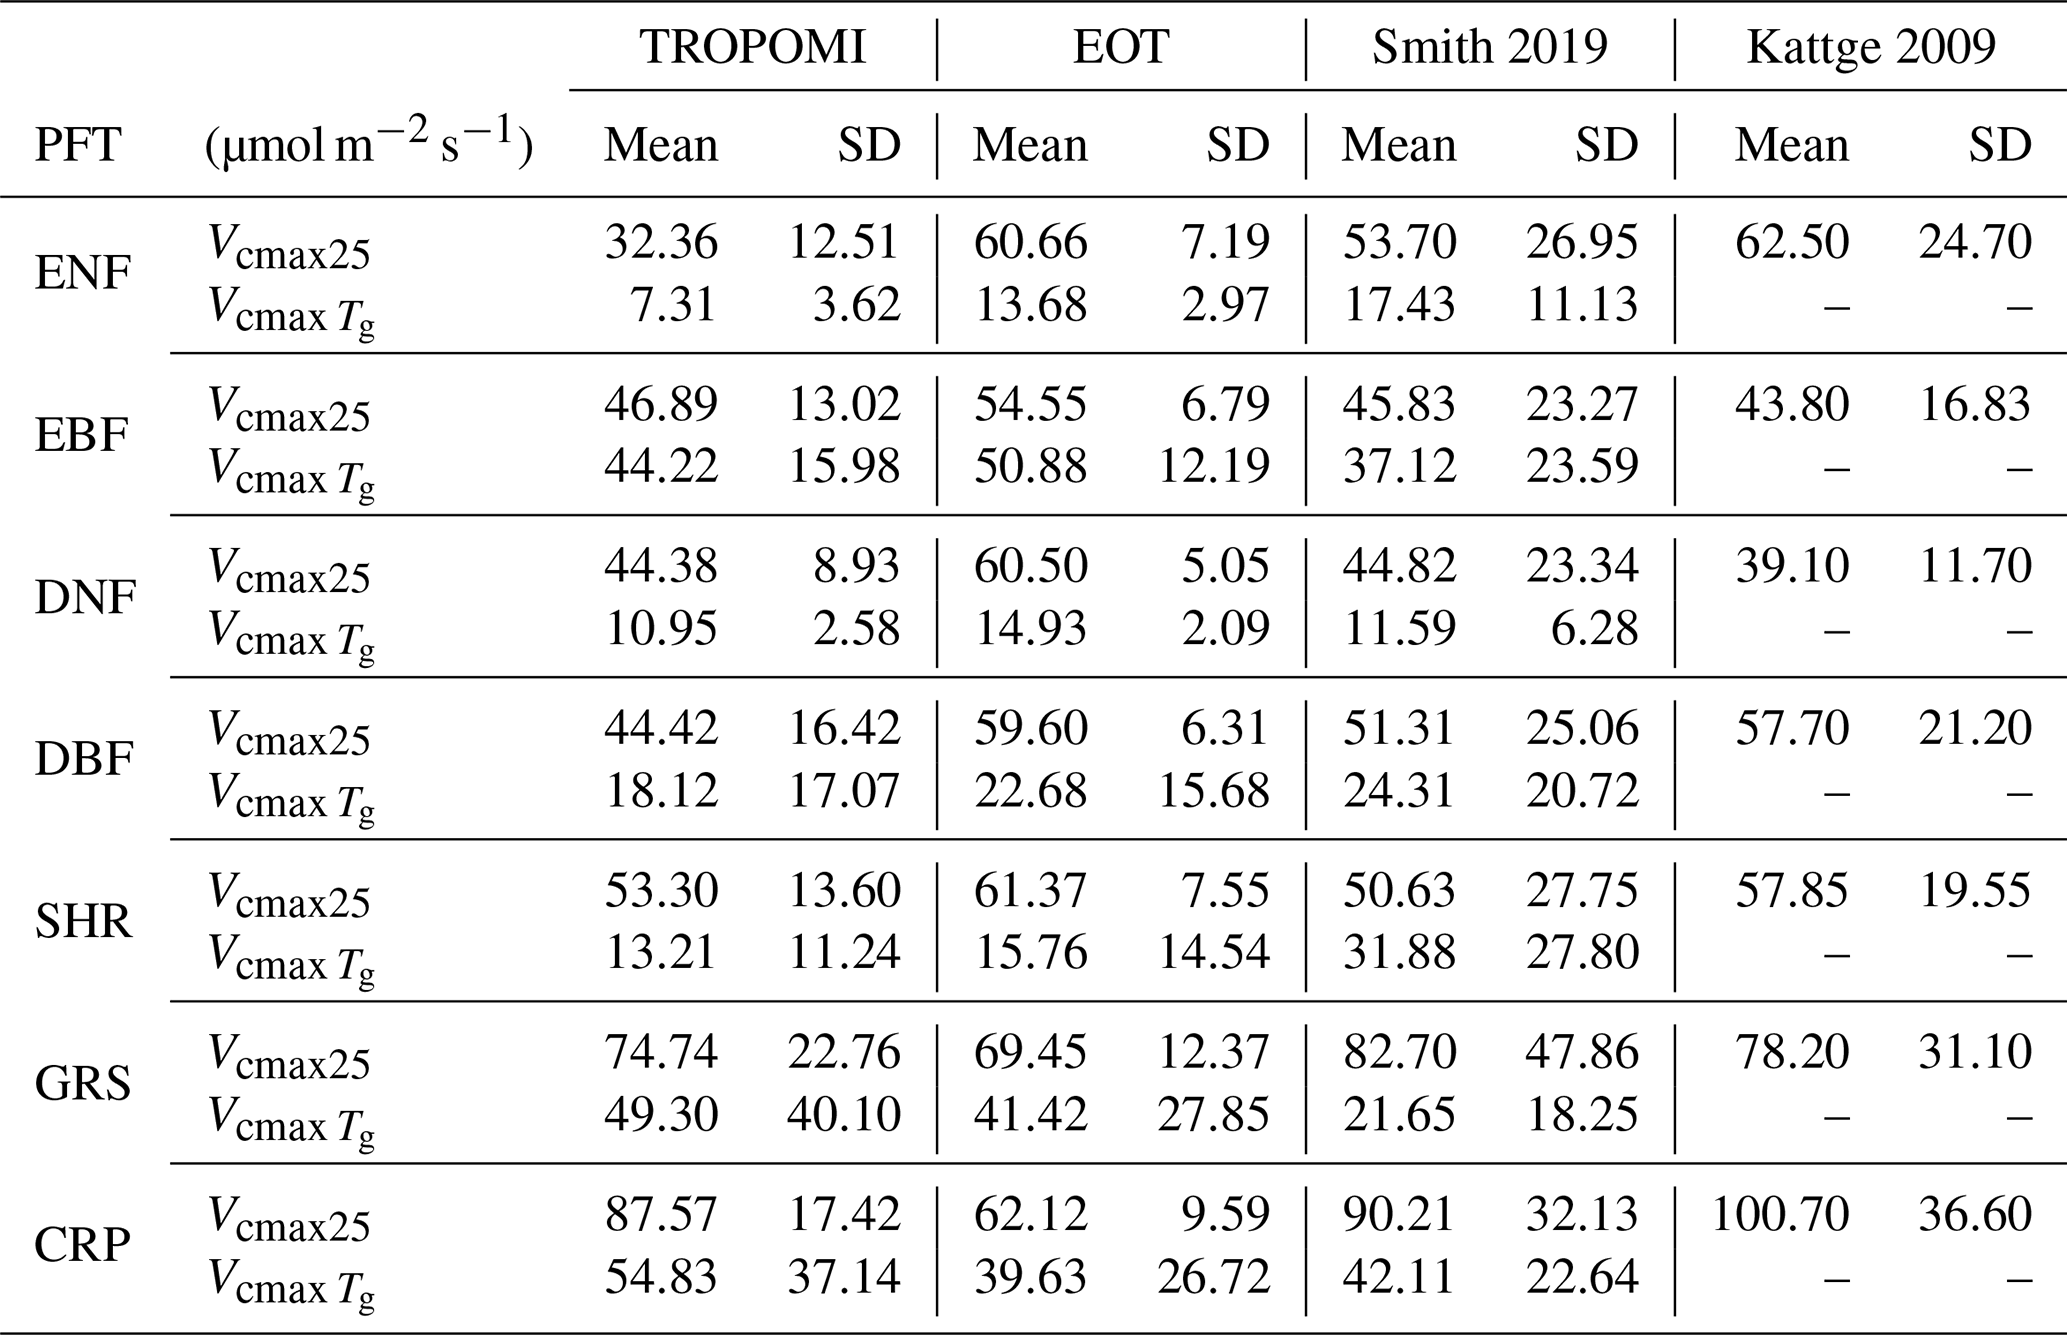
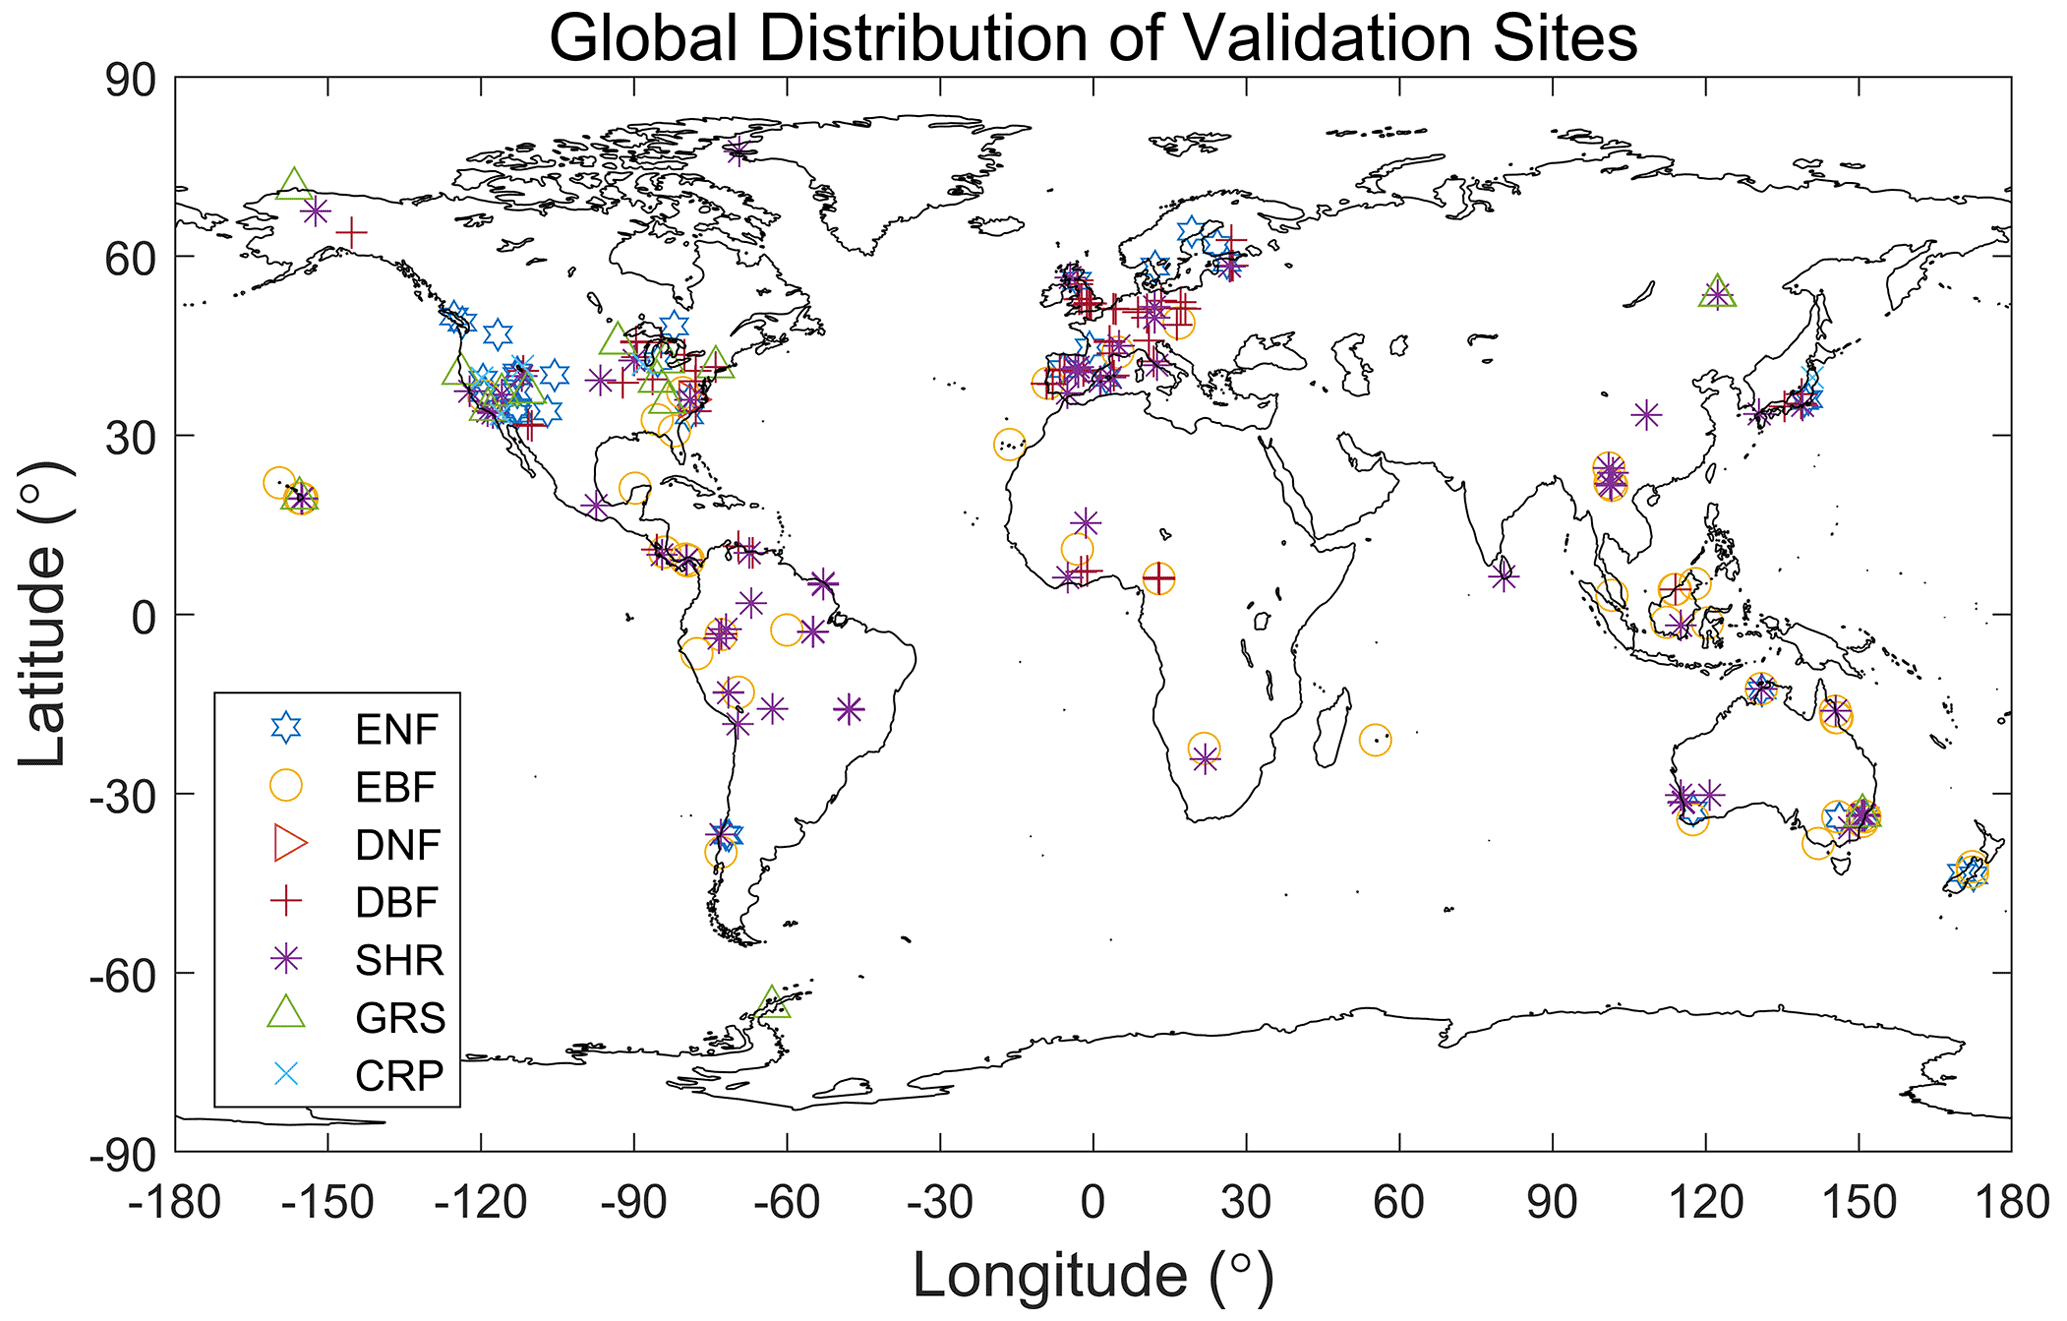
Figure 8Distribution of ground sites of the database of Smith et al. (2019) after aggregation to 0.5 grids for the different plant functional types.
3.3 Global mean values of Vcmax for different biomes
We compared the mean Vcmax values of the TROPOMI SIF+LCC product, denoted by , representing the three remote sensing products, and the EOT product over the growing season grouped by PFT with ground-based datasets at the mean growth temperature and at 25 ∘C after temperature normalization using the same scheme of Smith et al. (2019) (Table 2). The agreement between TROPOMI and EOT is best for EBF, DBF, SHR, and GRS, for which the difference between the two products is smaller than their mean standard deviation. For ENF, DNF, and CRP, the difference between the two products exceeded their mean standard deviation. TROPOMI is also considerably smaller than the ground datasets because of the large contributions of high-latitude conifer forests with low that are underrepresented in the ground datasets (Fig. 8). Since the TROPOMI product compares well with the ground database (Fig. 1 and Table 1) and has complete coverage for each PFT, it provides more reliable global averages than the ground database shown in Table 2. Ground data for DNF are too few (Fig. 8) to make sound evaluation for this PFT. TROPOMI is considerably larger than EOT for CRP, and GRS to a less extent, mostly because of the positive impact of irrigation on as demonstrated in Fig. 4. Although the same temperature function is used in the normalization for all products, the relative changes from to Vcmax25 for the various PFTs differed slightly among the four global products (Table 2) as the differences in among the products vary spatially with different growth temperatures, creating different weights in the calculation of the global averages of Vcmax25.
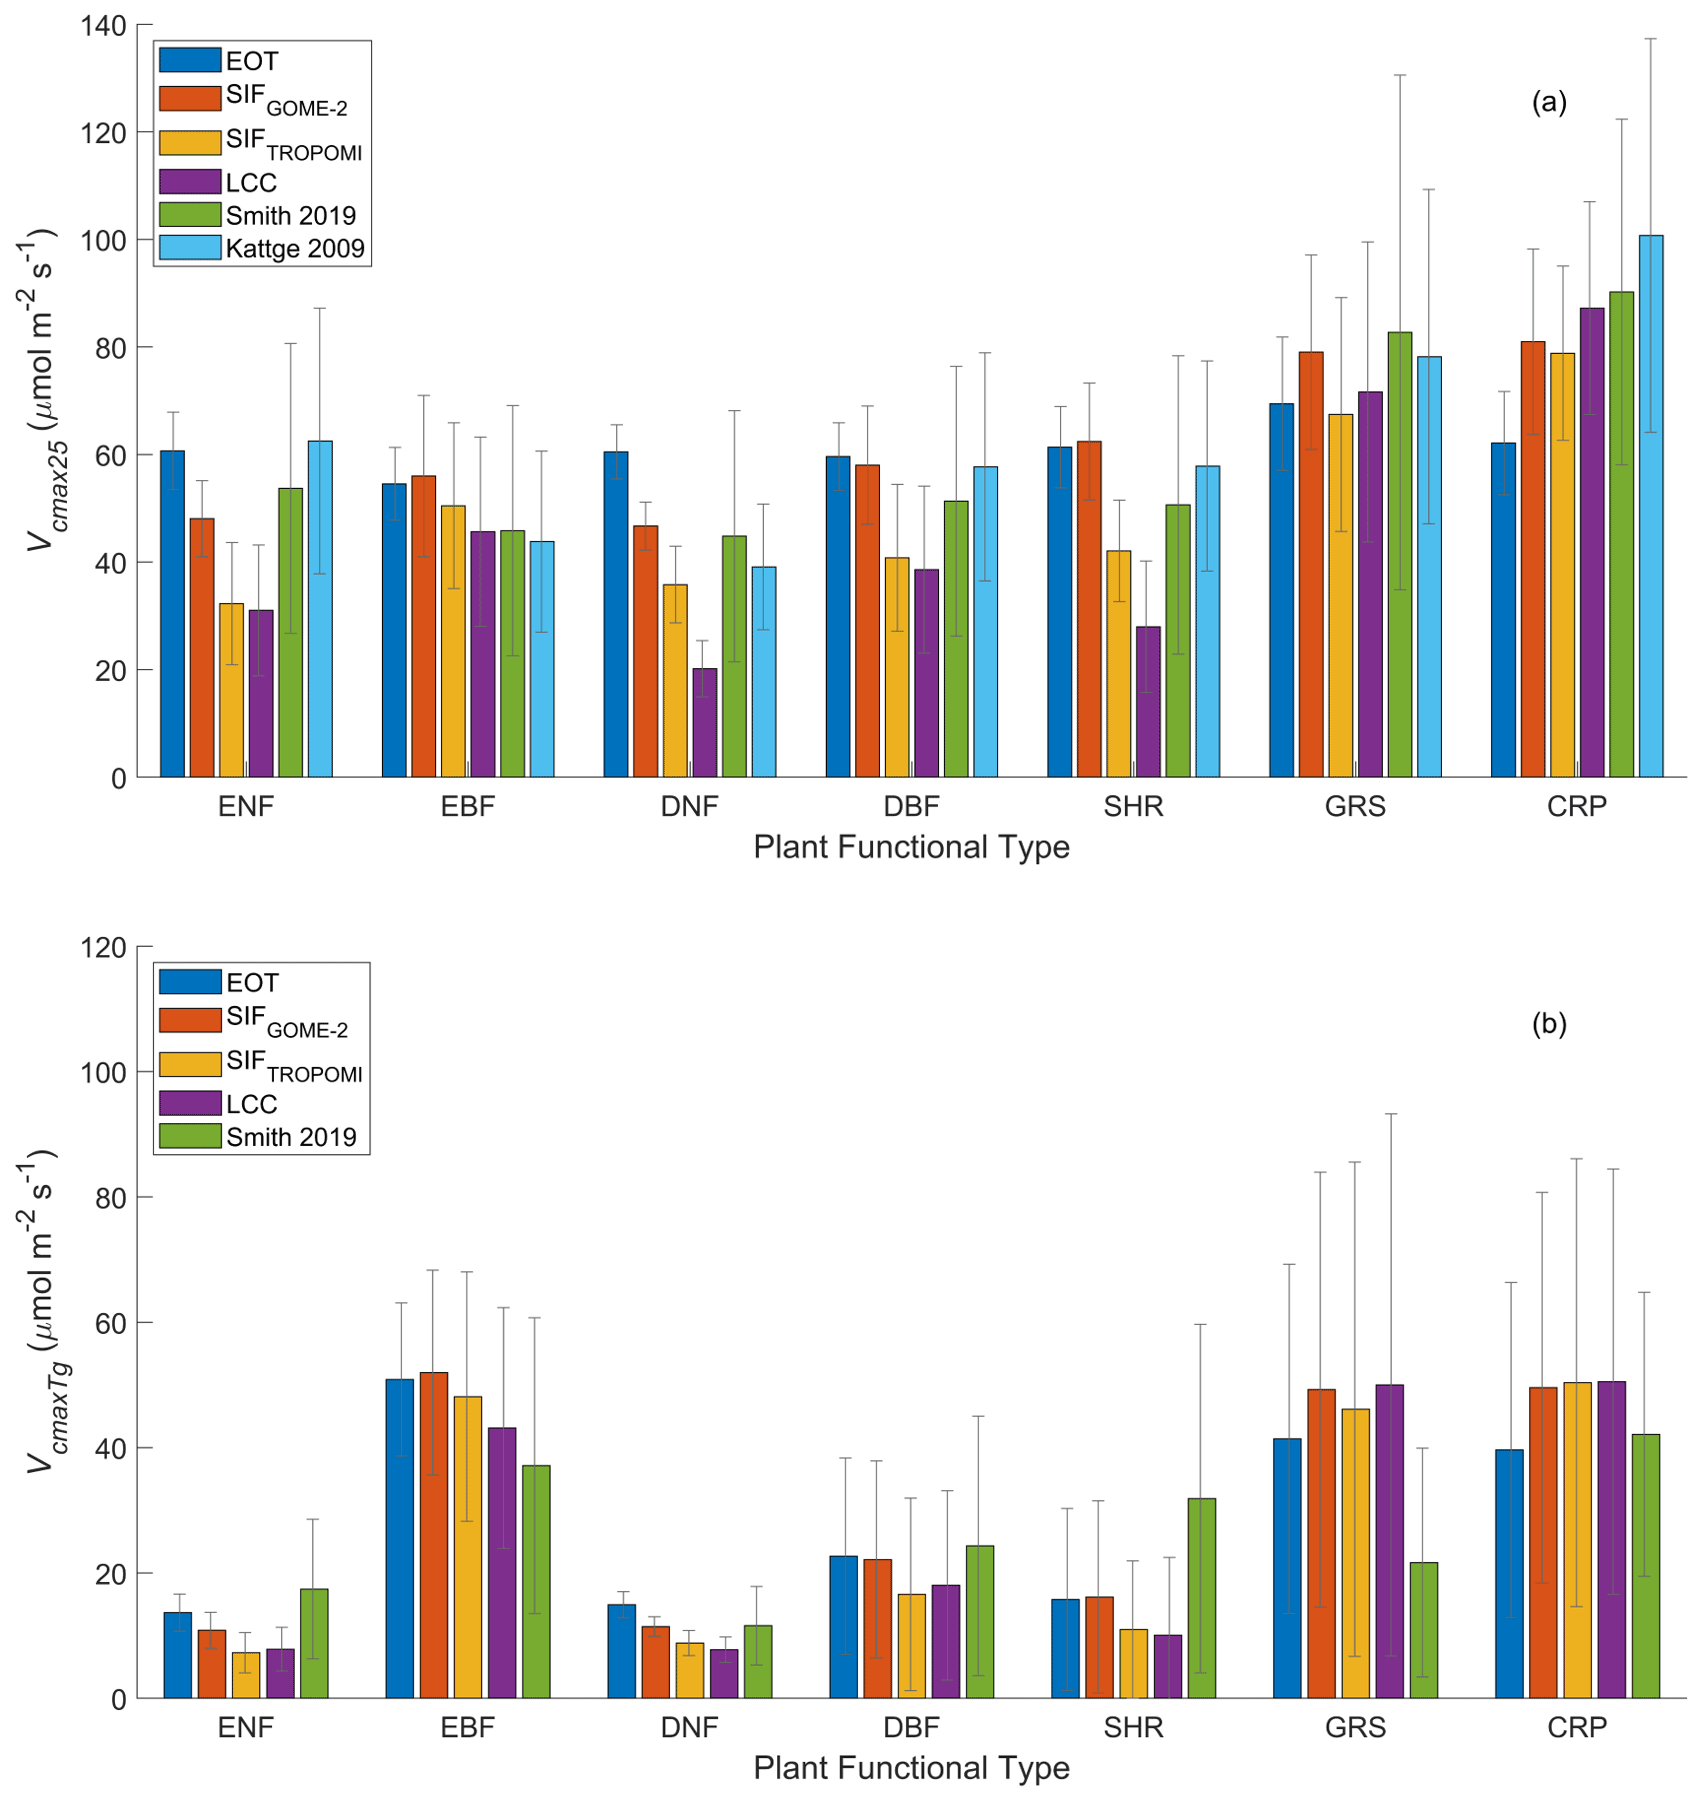
Figure 9Mean and standard deviation of at growth temperature and Vcmax25 (normalized to 25 ∘C) derived from GOME-2 SIF, TROPOMI SIF+LCC, LCC, and ecological optimality theory (EOT) in comparison with two ground databases (Smith, 2019; Kattge, 2009) for the main PFTs at growth temperature. Kattge (2009) contains more Vcmax25 than , so only Vcmax25 is included in (a). The EOT product has considerably smaller in grassland (GRS) and crops (CRP) than the three remote sensing products. All four products have considerably higher than the ground site measurements in grassland mostly because the number of site measurements are too small to be representative of the global average. After the temperature normalization, the differences among the products become much smaller.
In addition to the TROPOMI Vcmax product, the other two remote sensing products are also compared in Fig. 9. The magnitude of Vcmax25 in the TROPOMI product is generally in between those from GOME-2 SIF and LCC for the various PFTs (Fig. 9a) because it uses information of LCC which tends to be converted to lower values of Vcmax using existing empirical relationships. For forest PFTs, both Vcmax25 and of the EOT product is generally larger than those of remote sensing products. This is likely due to the fact that EOT considers only meteorological variables while soil nutrients and other variables could impose limitations on plant growth and hence leaf traits, while remote sensing techniques could be responsive to these soil effects on plants. For the same reason, Vcmax25 and values of the EOT product for CRP are smaller than those of remote sensing products because crop irrigation and soil pH could have positive effects on leaf Vcmax that are captured by the remote sensing products but not by EOT (Figs. 3 and 4). The mean values of Vcmax25 and from the ground databases (Smith et al., 2019; Kattge et al., 2009) are given in Fig. 9 for comparison purposes, but they do not represent the true global averages for the various PFTs because of their limited spatial distributions (Fig. 8 for Smith et al., 2019). We therefore do not yet have true ground averages to determine which product provides the most reliable global averages for the various PFTs. However, based on the point-to-point comparisons (Fig. 1 and Table 1), we believe that the TROPOMI product is most reliable in providing the global averages of Vcmax25 and for the various PFTs.
The Vcmax datasets derived from SIF and LCC represent the in situ leaf-level Vcmax that is the collective outcome of meteorological conditions and other environmental properties. These datasets can therefore be used directly in TEMs without further adjustment. The TRY database (Kattge et al., 2009) contains both Vcmax normalized to 25 ∘C (Vcmax25) and total LNC, and they are well correlated. Empirical studies have also shown this correlation (Ryan, 1995; Medlyn et al., 1999; Walker et al., 2017; Prentice et al., 2014). LNC has therefore been used to adjust Vcmax25 within the same PFT in some TEMs. However, such an adjustment can only recover part of the spatio-temporal variability in Vcmax25 because only a small part of LNC is closely linked to carboxylation capacity. LNC can be separated into four components: photosynthetic, structural, storage, and respiratory nitrogen pools (Xu et al., 2012; Ali et al., 2016). The photosynthetic nitrogen pool can be further divided into sub-pools for light harvesting, electronic transport, and carboxylation, and its fraction to the total LNC is variable depending on meteorological and soil conditions and possibly also atmospheric CO2 concentration (Ali et al., 2016). For fully grown leaves in balance with environmental conditions, these sub-pools are naturally optimized so that the investment of resources in light-harvesting optimally satisfies the need for electron transport or carboxylation (Xu et al., 2012). In other words, photosynthetic sub-pools are highly correlated, giving rise to the experimental evidence that LCC containing the light-harvesting nitrogen is highly correlated to Vcmax and Jmax (Croft et al., 2017). The daunting and complex task of mapping the spatio-temporal distributions of leaf photosynthetic capacity could therefore be accomplished by mapping LCC that contains nitrogen in balance with carboxylation nitrogen in Rubisco, and multispectral or hyperspectral remote sensing data that are highly sensitive to light absorption by the chlorophyll pigments would be a reliable way to obtain such highly desirable information. The LCC product shown in this study could therefore be used in conjunction with Vcmax products derived from SIF and optimality theory to parameterize Vcmax models with consideration of the nitrogen cycle.
Our remote sensing algorithms derive Vcmax from SIF and LCC from multi-spectral data from sunlit leaves after considering the sun-target-view geometry (He et al., 2019; Croft et al., 2020), and hence the remote sensing Vcmax products represent sunlit leaves observed by the sensors. The observed sunlit leaves are mostly located near the top of the canopy, and hence these Vcmax products could be considered to represent the average condition of leaves near the top of the canopy. In applying a Vcmax value to a canopy, it would be necessary to consider the vertical variation of Vcmax in the canopy. A mathematical scheme to integrate the vertical variation for average sunlit and shaded leaves at different LAI values and solar zenith angles is available from Chen et al. (2012).
The growing season mean Vcmax products are available at https://doi.org/10.5281/zenodo.6466968, but seasonal variation of Vcmax is not yet ready for distribution. Reliable seasonal variation of Vcmax is not yet produced at the global scale due to several reasons: (1) SIF data are often not reliable over non-growing seasons and near the beginning and end of the growing season; (2) LCC derivation is considerably affected by the inaccuracy in the input LAI data outside of the growing season, and near the beginning and end of the growing season the separation of LCC and LAI signals in remote sensing data is still an issue; (3) the ecological optimality theory that provides the basis for evaluating remote sensing Vcmax products can so far be used for calculating growing season mean Vcmax and is not yet ready for calculating its seasonal variation; and (4) few ground-based data with seasonal variation of Vcmax are available for validation. While efforts are being made to overcome these issues, it will take a while to accumulate sufficient ground-based datasets and to improve remote sensing algorithms and the optimality theory before reliable seasonal variation of Vcmax can be derived at the global scale.
The Vcmax datasets presented in this paper are available at https://doi.org/10.5281/zenodo.6466968 (Chen et al., 2022). It includes the following three global 0.5 ∘ Vcmax datasets at growth temperature:
-
Vcmax from GOME-2 SIF: GOME2_Vcmax_Tg_05deg.tif
-
Vcmax from TROPOMI SIF+LCC: TROPOMI_Vmax_ Tg_ mean.mat
-
Vcmax from global leaf chlorophyll content map (Croft et al., 2020, RSE): LCC_Vcmax_Tg_mean.mat.
The geographic reference is the same for all three datasets, conforming to that in the geotiff file.
For any questions on the dataset, please contact Jing M. Chen, jing.chen@utoronto.ca.
The functions written in R for calculating Vcmax using the ecological optimality theory are available at https://github.com/SmithEcophysLab/optimal_vcmax_R (Smith et al., 2019) and https://doi.org/10.5281/zenodo.5899564 (Smith et al., 2022).
The two RSVcmax products used in this research were derived independently from separate satellite observations of SIF and LCC, and yet show close agreement in their magnitudes and spatial patterns of modeled Vcmax. These remotely sensed Vcmax products (https://doi.org/10.5281/zenodo.6466968) also closely agree in large-scale spatial patterns with those calculated from the ecological optimality theory using meteorological variables, providing support for the use of the theory for prognostic modeling of terrestrial ecosystem function under future climate scenarios. However, the optimality-based Vcmax product does not show the local-scale spatial distribution patterns that are consistently found in all three remote sensing products because of patchy land cover distributions, implying that meteorological variables alone do not capture all spatial variability. Importantly, the relative difference in Vcmax (ΔVcmax) between SIF and optimality-based products is found to be significantly correlated to the fraction of irrigation area in a pixel, soil pH, and leaf nitrogen content, highlighting the impacts of environmental conditions on Vcmax that are not captured within optimality theory. From these results, we conclude: (1) the remote sensing products shown in this study have reliably captured the spatial variability in Vcmax and therefore are directly useful for diagnostic ecological modeling at the global scale; and (2) in comparison to the optimality-based product, the remote sensing products provide additional information on how Vcmax varies according to local environmental conditions, which is useful for prognostic modeling purposes. Furthermore, understanding the dynamic in situ response of plant photosynthetic capacity to soil water and nutrient availability, independent of meteorological drivers, is important to monitoring plant photosynthetic potential. The LCC product shown in this study could be used in conjunction with Vcmax products derived from SIF and optimality theory to parameterize Vcmax models with consideration of the nitrogen cycle. This work demonstrates the power of global-scale satellite-based and ecological optimality approaches to reveal crucial spatial information on Vcmax, thereby removing a barrier in global ecological and Earth system research.
JMC, TFK, and ICP devised the conceptual ideas. RW, YL, HC, and NGS provided and processed the data. JMC, RW, and YL conducted the investigation and performed formal analysis. JMC, NS, TFK, and ICP acquired the funding. YL, LH, HC, XL, and HW developed the methodology. RW, LH, and YL contributed to the software. JMC supervised the findings of this work. RW, NGS, and TK verified the results. RW and YL created the figures. JMC drafted the original manuscript. HC, RW, NGS, TK, ICP, HW, WJ, YZ, and ND reviewed and commented on the manuscript.
The contact author has declared that none of the authors has any competing interests.
Publisher’s note: Copernicus Publications remains neutral with regard to jurisdictional claims in published maps and institutional affiliations.
JMC and RW acknowledge support of Chinese National Global Change Key Research Program (2020YFA0608701) and Natural Science and Engineering Council of Canada (RGPIN-2020-05163) for this research. NGS acknowledges support from the National Science Foundation (DEB-2045968). TFK acknowledges support from a NASA Carbon Cycle Science Award 80NSSC21K1705, and the RUBISCO SFA, which is sponsored by the Regional and Global Model Analysis (RGMA) Program in the Climate and Environmental Sciences Division (CESD) of the Office of Biological and Environmental Research (BER) in the U.S. Department of Energy (DOE) Office of Science. TFK, ICP, NS, and WH acknowledge the LEMONTREE (Land Ecosystem Models based On New Theory, obseRvations and ExperimEnts) project, funded through the generosity of Eric and Wendy Schmidt by recommendation of the Schmidt Futures program. ICP acknowledges support from the European Research Council (ERC) under the European Union's Horizon 2020 research and innovation program (grant agreement no. 787203 REALM) and the LEMONTREE (Land Ecosystem Models based On New Theory, obseRvation and ExperimEnts) project, funded through the generosity of Eric and Wendy Schmidt by recommendation of the Schmidt Futures program. ND is supported by the European Research Council (ERC) under the European Union's Horizon 2020 research and innovation program (grant agreement no. 787203 REALM).
This research has been supported by the Canadian Network for Research and Innovation in Machining Technology, Natural Sciences and Engineering Research Council of Canada (grant no. RGPIN-2020-05163).
This paper was edited by Yuyu Zhou and reviewed by Dennis Baldocchi and Yao Zhang.
Ali, A. A., Xu, C., Rogers, A., McDowell, N. G., Medlyn, B. E., Fisher, R. A., Wullschleger, S. D., Reich, P. B., Vrugt, J. A., Bauerle, W. L., Santiago, L. S., and Wilson, C. J.: Global-scale environmental control of plant photosynthetic capacity, Ecol. Appl., 25, 2349–2365, 2015.
Ali, A. A., Xu, C., Rogers, A., Fisher, R. A., Wullschleger, S. D., Massoud, E. C., Vrugt, J. A., Muss, J. D., McDowell, N. G., Fisher, J. B., Reich, P. B., and Wilson, C. J.: A global scale mechanistic model of photosynthetic capacity (LUNA V1.0), Geosci. Model Dev., 9, 587–606, https://doi.org/10.5194/gmd-9-587-2016, 2016.
Bonan, G. B., Lawrence, P. J., Oleson, K. W., Levis, S., Jung, M., Reichstein, M., Lawrence, D. M., and Swenson, S. C.: Improving canopy processes in the Community Land Model version 4 (CLM4) using global flux fields empirically inferred from FLUXNET data, J. Geophys. Res.-Biogeosci., 116, G02014, https://doi.org/10.1029/2010JG001593, 2011.
Chen, B., Chen, J. M., Baldocchi, D. D., Liu, Y., Zheng, T., Black, T. A. and Croft, H.: A new way to include soil water stress in terrestrial ecosystem models, Agr. Forest Meteorol., 276, 107649, https://doi.org/10.1016/j.agrformet.2019.107649, 2019.
Chen, J. M. and Leblanc, S. G.: A 4-scale bidirectional reflection model based on canopy architecture, IEEE T. Geosci. Remote, 35, 1316–1337, 1997.
Chen, J. M. and Leblanc, S. G.: Multiple-scattering scheme useful for hyperspectral geometrical optical modelling, IEEE T. Geosci. Remote, 39, 1061–1071, 2001.
Chen, J. M., Mo, G., Pisek, J., Deng, F., Ishozawa, M., and Chan, D.: Effects of foliage clumping on global terrestrial gross primary productivity, Global Biogeochem. Cy., 26, GB1019, https://doi.org/10.1029/2010GB003996, 2012.
Chen, J. M., Liu, J., Cihlar, J., and Goulden, M. L.: Daily canopy photosynthesis model through temporal and spatial scaling for remote sensing applications. Ecol. Model., 124, 99–119, 1999.
Chen, J. M., Ju, W., Ciais, P., Viovy, N., Liu, R., and Liu, Y.: Vegetation structural change since 1981 significantly enhanced the terrestrial carbon sink, Nat. Commun., 10, 4259, https://doi.org/10.1038/s41467-019-12257-8, 2019.
Chen, J. M., Wang, R., Liu, Y., He, L., Croft, H., Luo, X., Wang, H., Smith, N. G., Keenan, T. F., Prentice, I. C., Zhang, Y., Ju, W., and Dong, N.: Three global products of leaf photosynthetic capacity derived from satellite observations, Zenodo [data set], https://doi.org/10.5281/zenodo.6466968, 2022.
Colombo, R., Meroni, M., and Rossini, M.: Development of fluorescence indices to minimize the effects of canopy structural parameters, Annali Di Botonica, 6, 93–99, 2016.
Croft, H., Chen, J. M., Luo, X. Z., Bartlett, P., Chen, B., and Staebler, R. M.: Leaf Chlorophyll Content as a Proxy for Leaf Photosynthetic Capacity, Glob. Change Biol., 23, 3513–3524, https://doi.org/10.1111/gcb.13599, 2017.
Croft, H., Chen, J. M., Wang, R., Mo, G., Luo, S., Luo, X., He, L., Gonsamo, A., Arabian, J., Zhang, Y., Simic-Milas, A., Noland, T. L., He, Y., Homolová, L., Malenovský, Z., Yi, Q., Beringer, J., Amiri, R., Hutley, L., Arellano, P., Stahl, C., and Bonal, D.: Global distribution of leaf chlorophyll content, Remote Sens. Environ., 236, 111479, https://doi.org/10.1016/j.rse.2019.111479, 2020.
Dechant, B., Ryu, Y., Badgley, G., Zeng, Y., Berry, J. A., Zhang, Y., Goulas, T., Li, Z., Zhang, Q., Kang, M., Li, J., and Moya, I.: Canopy structure explains the relationship between photosynthesis and sun-induced chlorophyll fluorescence in crops, Remote Sens. Environ., 241, 111733, https://doi.org/10.1016/j.rse.2020.111733, 2020.
De Kauwe, M. G., Lin, Y.-S., Wright, I. J., Medlyn, B. E., Crous, K. Y., Ellsworth, D. S., Maire, V., Prentice, I. C., Atkin, O. K., Rogers, A., Niinemets, Ü., Serbin, S. P., Meir, P., Uddling, J., Togashi, H. F., Tarvainen, L., Weerasinghe, L. K., Evans, B. J., Ishida, F. Y., and Domingues, T. F.: A test of the “one-point method” for estimating maximum carboxylation capacity from field-measured, light saturated photosynthesis, New Phytol., 210, 1130–1144, 2016.
Dong, N., Prentice, I. C., Wright, I. J., Evans, B. J., Togashi, H. F., Caddy-Retalic, S., McInerney, F. A., Sparrow, B., Leitch, E., and Lowe, A. J.: Components of leaf-trait variation along environmental gradients, New Phytol., 228, 82–94, https://doi.org/10.1111/nph.16558, 2020.
Farquhar, G. D., von Caemmerer, S., and Berry, J. A.: A biochemical model of photosynthetic CO2 assimilation in leaves of C3 species, Planta, 149, 78–90,1980.
Feret, J.-B., François, C., Asner, G. P., Gitelson, A. A., Martin, R. E., Bidel, L. P. R., Ustin, S. L., le Maire, G., and Jacquemoud, S.: PROSPECT-4 and 5: Advances in the leaf optical properties model separating photosynthetic pigments, Remote Sens. Environ., 112, 3030–3043, 2008.
Fisher, J. B., Badgley, G., and Blyth, E.: Global nutrient limitation in terrestrial vegetation, Global Biogeochem. Cy., 26, GB3007, https://doi.org//10.1029/2011GB004252, 2012.
Frankenberg, C., Fisher, J. B., Worden, J., Badgley, G., Saatchi, S. S., Lee, J. E., and Kuze, A.: New global observations of the terrestrial carbon cycle from GOSAT: Patterns of plant fluorescence with gross primary productivity, Geophys. Res. Lett., 38, L17706, https://doi.org/10.1029/2011GL048738, 2011.
Gentili, R., Ambroshin, R., Montagnani, C., Caronni, S., and Citterio, S.: Effect of Soil pH on the Growth, Reproductive Investment and Pollen Allergenicity of Ambrosia artemisiifolia L., Frontiers of Plant Science, 9, 1335, https://doi.org/10.3389/fpls.2018.01335, 2018.
Guanter, L., Zhang, Y., Jung, M., Joiner, J., Voigt, M., Berry, J. A., Frankenberg, C., Huete, A. R., Zarco-Tejada, P., Lee, J.-E., Moran, M. S., Ponce-Campos, G., Beer, C., Camps-Valls, G., Buchmann, N., Gianelle, D., Klumpp, K., Cescatti, A., Baker, J. M., and Griffis, T. J.: Global and time-resolved monitoring of crop photosynthesis with chlorophyll fluorescence, Proc. Natl. Acad. Sci., 111, E1327–E1333, 2014.
Hall, J.M., Paterson E. and Killham, K.: The effect of elevated CO2 concentration and soil pH on the relationship between plant growth and rhizosphere denitrification potential, Glob. Change Biol., 4, 209–216, 1998.
Harris, I., Jones, P. D., Osborn, T. J., and Lister, D. H.: Updated high resolution grids of monthly climatic observations – the CRU TS3.10 data set, Int. J. Climatol., 34, 623–642, 2014.
He, L., Chen, J. M., Liu, J., Zheng, T., Wang, R., Joiner, J., Chou, S., Chen, B., Liu, Y., and Liu, R.: Diverse photosynthetic capacity of global ecosystems mapped by satellite chlorophyll fluorescence measurements, Remote Sens. Environ., 232, 111344, https://doi.org/10.1016/j.rse.2019.111344, 2019.
Hengl, T., Mendes de Jesus, J., Heuvelink, G. B. M., Ruiperez Gonzalez, M., Kilibarda, M., Blagotić, A., Shangguan, W., Wright, M. N., Geng, X., Bauer-Marschallinger, B., Guevara, M. A., Vargas, R., MacMillan, R. A., Batjes, N. H., Leenaars, J. G. B., Ribeiro, E., Wheeler, I., Mantel, S., and Kempen, B.: SoilGrids250m: Global gridded soil information based on machine learning, PLoS ONE, 12, e0169748, https://doi.org/10.1371/journal.pone.0169748, 2017.
Houborg, R., Cescatti, A., Migliavacca, M., and Kustas, W. P.: Satellite retrievals of leaf chlorophyll and photosynthetic capacity for improved modeling of GPP, Agr. Forest Meteorol., 177, 10–23, 2017.
Islam, A. K. M. S., Edwards D. G., and Asher, C. J.: pH optima for crop growth: results of a flowing solution culture experiment with six species, Plant Soil, 54, 339–357, 1980.
Kattge, J., Knorr, W., Raddatz, T., and Wirth, C.: Quantifying Photosynthetic Capacity and Its Relationship to Leaf Nitrogen Content for Global-Scale Terrestrial Biosphere Models, Glob. Change Biol., 15, 976–991, 2009.
Kattge, J., Bönisch, G., Díaz, S., et al.: TRY plant trait database – enhanced coverage and open access, Glob. Change Biol. 26, 119–188, 2020.
Li, X., Xiao, J., He, B., Altaf Arain, M., Beringer, J., Desai, A. R., Emmel, C., Hollinger, D. Y., Krasnova, A., Mammarella, I., Noe, S. M., Ortiz, P. S., Rey-Sanchez, A. C., Rocha, A. V., and Varlagin, A.: Solar-induced chlorophyll fluorescence is strongly correlated with terrestrial photosynthesis for a wide variety of biomes: first global analysis based on OCO2 and flux tower observations, Glob. Change Biol., 24, 3990–4008, 2018.
Liu, Y., Chen, J. M., He, L., Zhang, Z., Wang, R., Rogers, C., Fan, F., de Oliveira, G., and Xie, X.: Non-linearity between gross primary production and far-red solar-induced chlorophyll fluorescence emitted from major biomes, Remote Sens. Environ. 271, 112896, https://doi.org/10.1016/j.rse.2022.112896, 2022.
Lu, X., Ju, W., Li, J., Croft, H., Chen, J. M., and Luo, Y.: Maximum carboxylation rate estimation with chlorophyll content as a proxy of RuBisCo, J. Geophys. Res.-Biogeosci. 125, e2020JG005748, https://doi.org/10.1029/2020JG005748, 2020.
Luo, X., Croft, H., Chen, J. M., Bartlett, P., Staebler, R., and Froelich, N.: Incorporating leaf chlorophyll content into a terrestrial biosphere model for estimating carbon and water fluxes at a forest site, Agr. Forest Meteorol., 248, 156–168, 2017.
Luo, X., Croft, H., Chen, J. M., He, L., and Keenan, T. F.: Improved estimation of global photosynthesis using information on leaf chlorophyll content, Glob. Change Biol., 25, GCB14624, https://doi.org/10.1111/gcb.14624, 2019.
Maire, V., Wright, I. J., Prentice, I. C., Batjes, N. H., Bhaskar, R., van Bodegom, P. M., Cornwell, W. K., Ellsworth, D., Niinemets, Ü., Ordonez, A., Reich, P. B., and Santiago, L. S.: Global effects of soil and climate on leaf photosynthetic traits and rates, Global Ecology and Biogeography, 24, GEB12296, https://doi.org/10.1111/geb.12296, 2015.
Medlyn, B. E., Badeck, F.-W., De Pury, D. G. G., Barton, C. V. M., Broadmeadow, M., Ceulemans, R., De Angelis, P., Forstreuter, M., Jach, M. E., Kellomäki, S., Laitat, E., Marek, M., Philippot, S., Rey, A., Strassemeyer, J., Laitinen, K., Liozon, R., Portier, B., Roberntz, P., Wang, K., and Jstbid, P. G.: Effects of elevated [CO2] on photosynthesis in European forest species: a meta analysis of model parameters, Plant Cell Environ., 22, 1475–1495, 1999.
Mohammed, G. H., Colombo, R., Middleton, E. M., Rascher, U., van der Tol, C., Nedbal, L., Goulas, Y., Pérez-Priego, O., Damm, A., Meroni, M., Joiner, J., Cogliati, S., Verhoef, W., Malenovský, Z., Gastellu-Etchegorry, J.-P., Miller, J. R., Guanter, L., Moreno, J., Moya, I., Berry, J. A., Frankenberg, C., and Zarco-Tejada, P. J.: Remote sensing of solar-induced chlorophyll fluorescence (SIF) in vegetation: 50 years of progress, Remote Sens. Environ., 231, 111177, https://doi.org/10.1016/j.rse.2019.04.030, 2019.
Osnas, J. L. D., Lichstein, J. W., Reich, P. B., and Pacala, S. W.: Global leaf trait relationships: mass, area, and the leaf economics spectrum, Science, 340, 741–744, 2013.
Paillassa J., Wright, I. J., Prentice, I. C., Pepin, S., and Smith, N. G.: When and where soil is important to modify the carbon and water economy of leaves, New Phytol., 15, NPH16702, 2020.
Pinto, F., Damm, A., Schickling, A., Panigada, C., Cogliati, S., Müller-Linow, M., Ballvora, A., and Rascher, U.: Sun-induced chlorophyll fluorescence from high-resolution imaging spectroscopy data to quantify spatio-temporal patterns of photosynthetic function in crop canopies, Plant Cell Environ., 39, 1500–1512, 2016.
Porcar-Castell, A., Tyystjärvi, E., Atherton, J., van der Tol, C., Flexas, J., Pfündel, E. E., Moreno, J., Frankenberg, C., and Berry, J. A.: Linking chlorophyll a fluorescence to photosynthesis for remote sensing applications: Mechanisms and challenges, J. Exp. Bot., 65, 4065–4095, 2014.
Prentice, I. C., Dong, N., Gleason, S. M., Maire, V., and Wright, I. J.: Balancing the costs of carbon gain and water transport: testing a new theoretical framework for plant functional ecology, Ecol. Lett., 17, 82–91, 2014.
Reed, C. C. and Loik, M. E.: Water relations and photosynthesis along an elevation gradient for Artemisia tridentata during and historic drought, Oecologia, 181, 65–76, https://doi.org/10.1007/s00442-015-3528-7, 2016.
Reich, P. B.: The world-wide “fast-slow” plant economics spectrum: a traits manifesto, J. Ecol., 102, 275–301, 2014.
Reich, P. B., Wright, I. J., and Lusk, C. H.: Predicting leaf physiology from simple plant and climate attributes: a global GLOPNET analysis, Ecol. Appl., 17, 1982–1988, 2007.
Rogers, A.: The use and misuse of Vc, max in Earth System Models, Photosynth. Res., 119, 15–29, 2014.
Rogers, A., Medlyn, B. E., Dukes, J. S., Bonan, G., von Caemmerer, S., Dietze, M. C., Kattge, J., Leakey, A. D. B., Mercado, L. M., Niinemets, Ü., Prentice, I. C., Serbin, S. P., Sitch, S., Way, D. A., and Zaehle, S.: A roadmap for improving the representation of photosynthesis in Earth system models, New Phytol., 213, 22–42, 2017.
Ryan, M. G.: Foliar maintenance respiration of subalpine and boreal trees and shrubs in relation to nitrogen concentration, Plant Cell Environ., 18, 765–772, 1995.
Sack, L., Scoffoni, C., John, G. P., Poorter, H., Mason, C. M., Mendez-Alonzo, R., and Donovan, L. A.: How do leaf veins influence the worldwide leaf economic spectrum? Review and synthesis, J. Exp. Bot., 64, 4053–4080, 2013.
Sela, G.: Fertilization and irrigation: theory and best practices, Independently Published, 261 pp., ISBN 9798793313865, 2021.
Smith, N. G. and Dukes, J. S.: Drivers of leaf carbon exchange capacity across biomes at the continental scale, Ecology, 99, 1610–1620, 2018.
Smith, N. G., Keenan, T. F., Colin Prentice, I., Wang, H., Wright, I. J., Niinemets, Ü., Crous, K. Y., Domingues, T. F., Guerrieri, R., Yoko Ishida, F., Kattge, J., Kruger, E. L., Maire, V., Rogers, A., Serbin, S. P., Tarvainen, L., Togashi, H. F., Townsend, P. A., Wang, M., Weerasinghe, L. K., and Zhou, S.-X.: Global photosynthetic capacity is optimized to the environment, Ecol. Lett., 22, 506–517, https://doi.org/10.1111/ele.13210, 2019.
Smith, N., McNellis, R., and Keenan, T.: SmithEcophysLab/optimal_vcmax_R: Optimal Vcmax version 3.0 (v3.0), Zenodo [code], https://doi.org/10.5281/zenodo.5899564, 2022.
Song, X., Zhou, G., He, Q., and Zhou, H.: Quantitative response of maize Vcmax25 to persistent drought stress at different growth stages, Water, 13, 1971, https://doi.org/10.3390/w13141971, 2021.
Sun, Y., Frankenberg, C., Wood, J. D., Schimel, D. S., Jung, M., Guanter, L., Drewry, D. T., Verma, M., Porcar-Castell, A., Griffis, T. J., Gu, L., Magney, T. S., Köhler, P., Evans, B., and Yuen, K.: OCO2 advances photosynthesis observation from space via solar-induced chlorophyll fluorescence, Science, 358, eaam5747, https://doi.org/10.1126/science.aam5747, 2017.
Verhoef, W.: Light scattering by leaf layers with application to canopy reflectance modeling: The SAIL model, Remote Sens. Environ., 16, 125–141, 1984.
Wang, H., Prentice, I. C., Keenan, T. F., Davis, T. W., Wright, I. J., Cornwell, W. K., Evans, B. J., and Peng, C.: Towards a universal model for carbon dioxide uptake by plants, Nat. Plants, 3, 734–741, 2017.
Wang, X., Chen, J. M., and Ju, W.: Photochemical Reflectance Index (PRI) can be used to improve the relationship between gross primary productivity (GPP) and sun-induced chlorophyll fluorescence (SIF), Remote Sens. Environ., 246, 111888, https://doi.org/10.1016/j.rse.2020.111888, 2020.
Walker, A. P., Quaife, T., van Bodegom, P. M., De Kauwe, M. G., Keenan, T. F., Joiner, J., Lomas, M. R., MacBean, N., Xu, C., Yang, X., and Woodward, F. I.: The impact of alternative trait-scaling hypotheses for the maximum photosynthetic carboxylation rate (Vcmax) on global gross primary production, New Phytol., 215, 1370–1386, 2017.
Wright, I. J., Reich, P. B., Westoby, M., Ackerly, D. D., Baruch, Z., Bongers, F., Cavender-Bares, J., Chapin, T., Cornelissen, J. H. C., Diemer, M., Flexas, J., Garnier, E., Groom, P. K., Gulias, J., Hikosaka, K., Lamont, B. B., Lee, T., Lee, W., Lusk, C., Midgley, J. J., Navas, M.-L., Niinemets, Ü., Oleksyn, J., Osada, N., Poorter, H., Poot, P., Prior, L., Pyankov, V. I., Roumet, C., Thomas, S. C., Tjoelker, M. G., Veneklaas, E. J., and Villar, R.: The worldwide leaf economics spectrum, Nature, 428, 821–827, 2004.
Xu, C., Fisher, R., Wullschleger, S. D., Wilson, C. J., Cai, M., and McDowell, N. G.: Toward a mechanistic modeling of nitrogen limitation on vegetation dynamics, PLoS ONE, 7, 1–11, 2012.
Zhang, Y., Chen, J. M., Miller, J. R., and Noland, T. L.: Leaf chlorophyll content retrieval from airborne hyperspectral remote sensing imagery, Remote Sensing of Environment, 112, 3234–3247, https://doi.org/10.1016/j.rse.2008.04.005, 2008.