the Creative Commons Attribution 4.0 License.
the Creative Commons Attribution 4.0 License.
 | 06 Sep 2022
A comprehensive geospatial database of nearly 100 000 reservoirs in China
Chenyu Fan
Jingying Zhu
Jida Wang
Yongwei Sheng
Kai Liu
Tan Chen
Pengfei Zhan
Shuangxiao Luo
Chunyu Yuan
Linghong Ke
With rapid population growth and socioeconomic development over the last century, a great number of dams/reservoirs have been constructed globally to meet various needs. China has strong economical and societal demands for constructing dams and reservoirs. The official statistics reported more than 98 000 dams/reservoirs in China, including nearly 40 % of the world's largest dams. Despite the availability of several global-scale dam/reservoir databases (e.g., the Global Reservoir and Dam database (GRanD), the GlObal geOreferenced Database of Dams (GOODD), and the Georeferenced global Dams And Reservoirs (GeoDAR)), these databases have insufficient coverage of the reservoirs in China, especially for small or newly constructed ones. The lack of reservoir information impedes the estimation of water budgets and the evaluation of dam impacts on hydrologic and nutrient fluxes for China and its downstream countries. Therefore, we presented the China Reservoir Dataset (CRD), which contains 97 435 reservoir polygons and fundamental attribute information (e.g., name and storage capacity) based on existing dam/reservoir products, national basic geographic datasets, multi-source open map data, and multi-level governmental yearbooks and databases. The reservoirs compiled in the CRD have a total maximum water inundation area of 50 085.21 km2 and a total storage capacity of about 979.62 km3 (924.96–1060.59 km3). The quantity of reservoirs decreases from the southeast to the northwest, and the density hotspots mainly occur in hilly regions and large plains, with the Yangtze River basin dominating in reservoir count, area, and storage capacity. We found that these spatial accumulations of reservoirs are closely related to China's socioeconomic development and the implementation of major policies. Finally, we presented the comparison of the CRD with GOODD, GeoDAR, and GRanD databases. The CRD has significantly increased the reservoir count, area, and storage capacity in China, especially for reservoirs smaller than 1 km2. The CRD database provides more comprehensive reservoir spatial and attribute information and is expected to benefit water resources managements and the understanding of ecological and environmental impacts of dams across China and its affected transboundary basins. The CRD database is publicly available at https://doi.org/10.5281/zenodo.6984619 (Song et al., 2022).
- Article
(16928 KB) - Full-text XML
- BibTeX
- EndNote


Reservoirs and their dams play a crucial role in green energy generation and water resources management. Since the mid-20th century, the ever-growing human demands for water use and hydropower have driven an unprecedented boom in reservoir construction worldwide (Chao et al., 2008; Wada et al., 2017). Dam construction and reservoir impoundment can lead to many potential environmental and socioeconomic impacts (Jiang et al., 2018; Zarfl et al., 2019). These consequences mainly include the threat to biodiversity and ecosystems (Winemiller et al., 2016), a change in the hydrological regime (Zhang et al., 2019; Vörösmarty et al., 2003), the degradation of water quality (Zarfl et al., 2019; Barbarossa et al., 2020), the modification of the geochemical cycle (Maavara et al., 2020), an alternation of the river morphology (Bednarek, 2001; Nilsson and Berggren, 2000; Winemiller et al., 2016; Grill et al., 2019; Latrubesse et al., 2017; Bond and Cottingham, 2008; Nilsson et al., 2005; J. Wang et al., 2017; Wang et al., 2013), a disturbance in climate regimes (Pekel et al., 2016; Degu et al., 2011; W. Wang et al., 2017; Van Manh et al., 2015), migration of human settlement (Tilt et al., 2009), and changes in the land use patterns (Stoate et al., 2009; Carpenter et al., 2011).
Despite these controversial effects, artificial reservoirs have been constructed widely across many basins of the world, serving a variety of purposes such as hydropower generation, water supply, irrigation, navigation, flood control, and recreation (Belletti et al., 2020; Biemans et al., 2011; Döll et al., 2009; Grill et al., 2019; Boulange et al., 2021). In addition, reservoirs assist water managers in converting natural flow conditions into flow conditions that meet human demands, which is especially important in locations where water resources are restricted due to the hydrologic seasonality or the growing influences of climate change and variability (Richter et al., 2006). The solution to balance the benefits and consequences of reservoirs should not be a simple decision of whether or not to construct them. The significant benefits and the additional effects highlight the importance and necessity of a holistic picture of the reservoir distributions and continuous monitoring of them to understand the impacts better. Information and data regarding reservoirs are rather crucial for scientists, practitioners, and policymakers, owing to various purposes, for instance, estimation of water budgets and impacts on hydrologic and nutrient fluxes on regional or global scales (Chao et al., 2008; Bakken et al., 2013, 2016; Popescu et al., 2020; Postel, 2000), water availability projections or flood/drought risk mitigation (Di Baldassarre et al., 2017; Ehsani et al., 2017; Elmer et al., 2012; Veldkamp et al., 2017; Metin et al., 2018), assessment of hydropower station construction (Bertoni et al., 2019; Gernaat et al., 2017; Xu et al., 2013; Moran et al., 2018; Winemiller et al., 2016), and investigation of biotic disturbance (Latrubesse et al., 2017; Maavara et al., 2020; Dorber et al., 2020; Sabo et al., 2017). Considering reservoirs in physical models can significantly improve the modeling performance (Gutenson et al., 2020). The modeling requires a minimum set of the reservoir characteristics, including their spatial location, abundance, area, and storage capacity. Besides, the reservoirs are considered to be a key source of greenhouse gases (GHGs), partly offsetting the carbon sink of continents (St. Louis et al., 2000; Aufdenkampe et al., 2011; Barros et al., 2011; Raymond et al., 2013; Deemer et al., 2016). There is thus an increasing concern about the true GHG fluxes from reservoirs. Answering these questions requires a comprehensive database depicting reservoir distributions and properties, especially for hydropower boom regions in Asia, South America, and Africa.
China has a strong economical and societal demand for hydroelectric development, flood control, and agricultural irrigation. In 2007, China's Medium and Long-Term Plan for Renewable Energy Development projected constructing 300 GW of gross installed hydropower capacity by 2020, exceeding the doubled capacity in 2007. The installed hydropower capacity target has been reset to 420×106 kW by 2020, representing a 70 % increase in 2012. In China, more than 60 % of total water consumption is taken by the agricultural water sector, among which 90 % of the quota is shared by irrigation water use (Jiang et al., 2018). Therefore, reservoir construction in China has experienced drastic growth. The number of Chinese reservoirs increased slowly after the 1980s and soared to the count of 98 000 around 2015 (MWR, 2016). According to the register of the International Commission on Large Dams (ICOLD and CIGB, 2011), China possesses nearly 40 % of the global large dams (storage capacity greater than 0.1 km3). However, little is known about the spatial locations and related georeferenced information of these constructed reservoirs at the national level for China.
There have been multiple efforts made to produce a global reservoir inventory, including those of China. The most recognized and comprehensive database is the World Register of Dams (WRD), hosted and maintained by ICOLD, which reports 23 841 dams for China. However, as this database is not georeferenced, its utility is severely limited. The Global Reservoir and Dam database (GRanD; Lehner et al., 2011) was an initiative database that can provide global geospatial details about reservoirs and their attributes. Its latest version, v1.3, contains 7320 dams/reservoirs, with a cumulative capacity of 6881 km3, while only 921 Chinese reservoirs were included. Recently, the GlObal geOreferenced Database of Dams (GOODD; Mulligan et al., 2020) and the Georeferenced global Dams And Reservoirs dataset (GeoDAR; Wang et al., 2022) were published, containing more than 38 000 and 20 214 reservoirs on a global scale, respectively. GOODD was manually digitized from high-resolution Google Earth imagery, whereas GeoDAR was georeferenced from ICOLD WRD, with a full harmonization with GRanD. For the Chinese territory, the GOODD and GeoDAR databases contain 9238 and 4859 reservoirs, respectively, which still significantly below the scales of WRD and the Ministry of Water Resources (MWR). Given the lacking information, a comprehensive and spatially explicit database of reservoirs in China is required.
This study aims to share, as comprehensively as possible, fundamental open-access information on reservoirs in China. We have compiled the database based on a variety of data sources, including the national 1:250 000 public basic geographic database, the Almanac of China's Water Power, three global reservoir inventories (GeoDAR v1.1, GRanD v1.3, and GOODD v1.0), and other published documents and online maps (e.g., OpenStreetMap (OSM) and Tianditu Map). A comparison with GeoDAR, GRanD, and GOODD was conducted to assess the database. Our inventory contains significantly more reservoirs than the currently available databases. This database can provide researchers with basic information on reservoir locations, spatially explicit inundation areas, water storage, and related details in China, with the goal of advancing research on water resources, ecological and environmental consequences, and global change impacts and socioeconomic sector assessments on a national and worldwide scale.
2.1 Multi-source data for compiling national reservoir locations
2.1.1 Existing reservoir or dam databases
Before constructing the reservoir database in China, the data of the existing dams and reservoirs are preliminarily compiled as the basis for determining the location of reservoirs. Existing dam/reservoir databases containing geographical information are one of the key spatial data sources for reservoirs, including GRanD, GOODD, GeoDAR, and Future Hydropower Reservoirs and Dams Database (FHReD).
GRanD is a data product of the Global Water System Project and was first released in 2011 (Lehner et al., 2011). GOODD (Mulligan et al., 2020) is a comprehensive global dam database provided by manual inspection and is digitization based on multi-source remote sensing satellite observations and Google Earth images. FHReD database collects spatial locations of reservoirs that are currently being built or those that are planned for the future (Zarfl et al., 2015). GeoDAR is a global dam and reservoir geographic database based on the multi-source data fusion and online geocoding of the ICOLD reservoir records (Wang et al., 2022). The FHReD database provides information on 3700 planned and under construction reservoirs worldwide, of which 251 reservoirs are located in China, and 97 have been dammed by 2020.
In this study, these abovementioned databases were used to provide location information on part of China's reservoirs, particularly those of a large size. We integrated the spatial information of existing reservoirs in China and eliminated duplicate information. In this way, the China Reservoir Dataset (CRD) retains the spatial information of each unique Chinese reservoir in these three global databases.
2.1.2 National basic geographic databases
The national 1:250 000 public basic geographic database covers the whole land area of China and its major islands. Overall, the map elements represent the landscape situation around 2015. The database, which contains nine element layers such as waterbody (point, line, and surface layer), is treated with the security technology of spatial location accuracy and attribute content. Reservoir information is contained in the waterbody layer provided by the basic topographic map and the layers of natural place names (notes), most of which have name attributes and spatial positioning information. Although the national surveying authorities provide the basic terrain data, the spatial coordinates are biased due to the confidential processing of the map. Therefore, we carried out rigorous data correction and quality control by referring to the high-resolution Google Earth imagery. Finally, the database provided the spatial information references of 27 047 reservoirs for the CRD database.
The Tiandi Map is an online map system developed by the State Bureau of Surveying and Mapping of China (https://map.tianditu.gov.cn/ last access: 16 January 2022; only in Chinese), which provides geographic information services in two forms, i.e., portal and service interface. It integrates public geographic information resources from national-, provincial-, and prefecture- or county-level mapping and geographic information departments, relevant government departments, enterprises and institutions, social groups, and the public. In addition, users can use the service interface to call the authoritative, standard, and unified online geographic information comprehensive service of the Tiandi Map. In this study, the Tiandi Map was mainly used in two aspects. First, it is used as a base map for visual interpretation and supplementing the potentially missing reservoirs. In this process, we initially identified about 60 000 potential reservoirs. Second, the map was used to provide the reservoir name attribute. According to the locations of the reservoir checked by manual inspection based on the Tiandi Map, the name of the reservoir was queried by calling its reverse geocoding API.
2.1.3 Open-source map data
Open-source maps such as OSM were another key source of obtaining reservoir locations. OSM is a platform for users, organizations, or countries worldwide to organize and maintain multi-source geographic information data. Map vector data are available for download under an open database license. Due to OSM data's open-source and shared characteristics, the collected multi-source geographic information data can be used as a supplement to other time-limited databases. They can promptly reflect the changes in land surface information. OSM contains data such as water systems, road traffic, natural boundaries, land use, and construction. Water system data provide part of the reservoir polygon data with names, which are mainly compiled manually by OSM users. Finally, the spatial locations of 89 reservoirs were obtained from the OSM.
2.2 Data sources for reservoir inundation area mapping
The water inundation area is an important indicator of the reservoir and a variable for modeling reservoir storage capacity. Since the reservoir area is dynamically changing, we considered the maximum water area of the reservoir over the last several decades (1984–2020) in this study. Moreover, the maximum water area of the reservoir can indirectly reflect its water storage capacity. Therefore, we merged two water occurrence datasets, the Global Surface Water v1.0 (GSW) and Global Land Analysis and Discovery (GLAD), to obtain long-term historical maximum water areas of each of the compiled reservoirs.
GSW is a remote sensing big data computing platform developed by Pekel et al. (2016) using the Google Earth Engine (GEE). Based on all available Landsat 5, 6, 7, and 8 data acquired from 1984 to the present, Pekel et al. (2016) used the expert classification system to divide each available pixel into water bodies and non-water bodies and integrated the results into the data of monthly, annual, and decadal timescales. The maximum water boundary, water inundation frequency, water change intensity, water transition, water recurrence, seasonal water, monthly water range, monthly water recurrence, and annual water range are provided. GLAD is the global water body map from 1999 to 2019 obtained by Pickens et al. (2020) using the GEE remote sensing big data computing platform based on Landsat 5, 7, and 8 images. The surface water range changes during this period were highlighted, and the water was classified into several categories based on water probability, including permanent water area, seasonal water area, lost water area, new water area, temporary land area, temporary water area, and high change area.
Considering that both the GSW and GLAD datasets are at 30 m resolution, we also applied FROM-GLC10 (Finer Resolution Observation and Monitoring of Global Land Cover at 10 m resolution) based on Sentinel-2 data in 2017 (Gong et al., 2019) to handle the incomplete mapping of extremely narrow boundaries for a few reservoirs located in deep valleys. This database takes the existing land cover data as training samples. It combines the data of the Shuttle Radar Topography Mission (SRTM) on the GEE big data computing platform to classify the data by random forest method to obtain the maps of alpine and swamp areas with an overall accuracy loss rate of less than 1 %. The training samples were classified based on Landsat 8 original images and eight important indices commonly used in remote sensing monitoring, such as normalized difference vegetation index, modified water index, and normalized difference building index.
2.3 Data sources for reservoir storage capacity estimation
The reservoir storage capacity records were retrieved from various yearbooks and documents, including the Almanac of China's Water Power and other government documents. The Almanac of China's Water Power is a professional industry yearbook for hydropower in China, providing detailed information on China's mega-reservoirs, including the reservoir location, the dam purpose, the basin area, the storage capacity, and water level data of various types and the dam construction and impoundment time. Other government documents used in the study mainly include the “List of Persons responsible for the safety of Large reservoirs in China in 2020”, which is issued by the Ministry of Water Resources, the “List of persons responsible for the safety of large and medium-sized reservoirs”, which is issued by different provinces and prefectures in China, and the “List of Reservoirs in Hunan Province”, which is issued by the Water Resources Department of Hunan Province. These documents provide information on the type and location of the dam/reservoir and the storage capacity of reservoirs of different sizes. Finally, from the Almanac of China's Water Power and some other government documents, we collected authoritative information on the locations and storage capacities of 5143 reservoirs.
3.1 Reservoir location extraction
To build this database, we started with a preliminary compilation of the location information of Chinese dams and reservoirs from three types of data sources (see Fig. 1a). The first type of source is published georeferenced databases for dams and reservoirs, including GRanD, GOODD, FHReD, and GeoDAR. We combined China's reservoir location information with the four published dam/reservoir products. After removing duplicates by manual inspection, we obtained the names and locations of about 7400 unique reservoirs. The second type of sources is national basic geographic databases (including the national 1:250 000 public basic geographic database and Tiandi Map), the Almanac of China's Water Power, and other government documents. We checked the national 1:250 000 public basic geographic database, and its drainage layer data and natural place name layer contained the most reservoir information. Here, the Tiandi Map was used a base map for visual interpretation to supplement missing reservoirs in the national public basic geographic database. Moreover, we made a list of reservoirs from the Almanac of China's Water Power and documents from local governments, which only provided the county-level address for each reservoir. We then employed the Tiandi Map geocoding API to query the latitudes and longitudes of these reservoirs. Based on the second type of data sources, we obtained the location information of about 90 000 reservoirs. The third type of data sources is the open map database, OSM. From the OSM, we obtained the location information of 89 reservoirs. After harmonizing the three types of sources, we concluded with the locations of a total of 97 435 unique reservoirs in China.
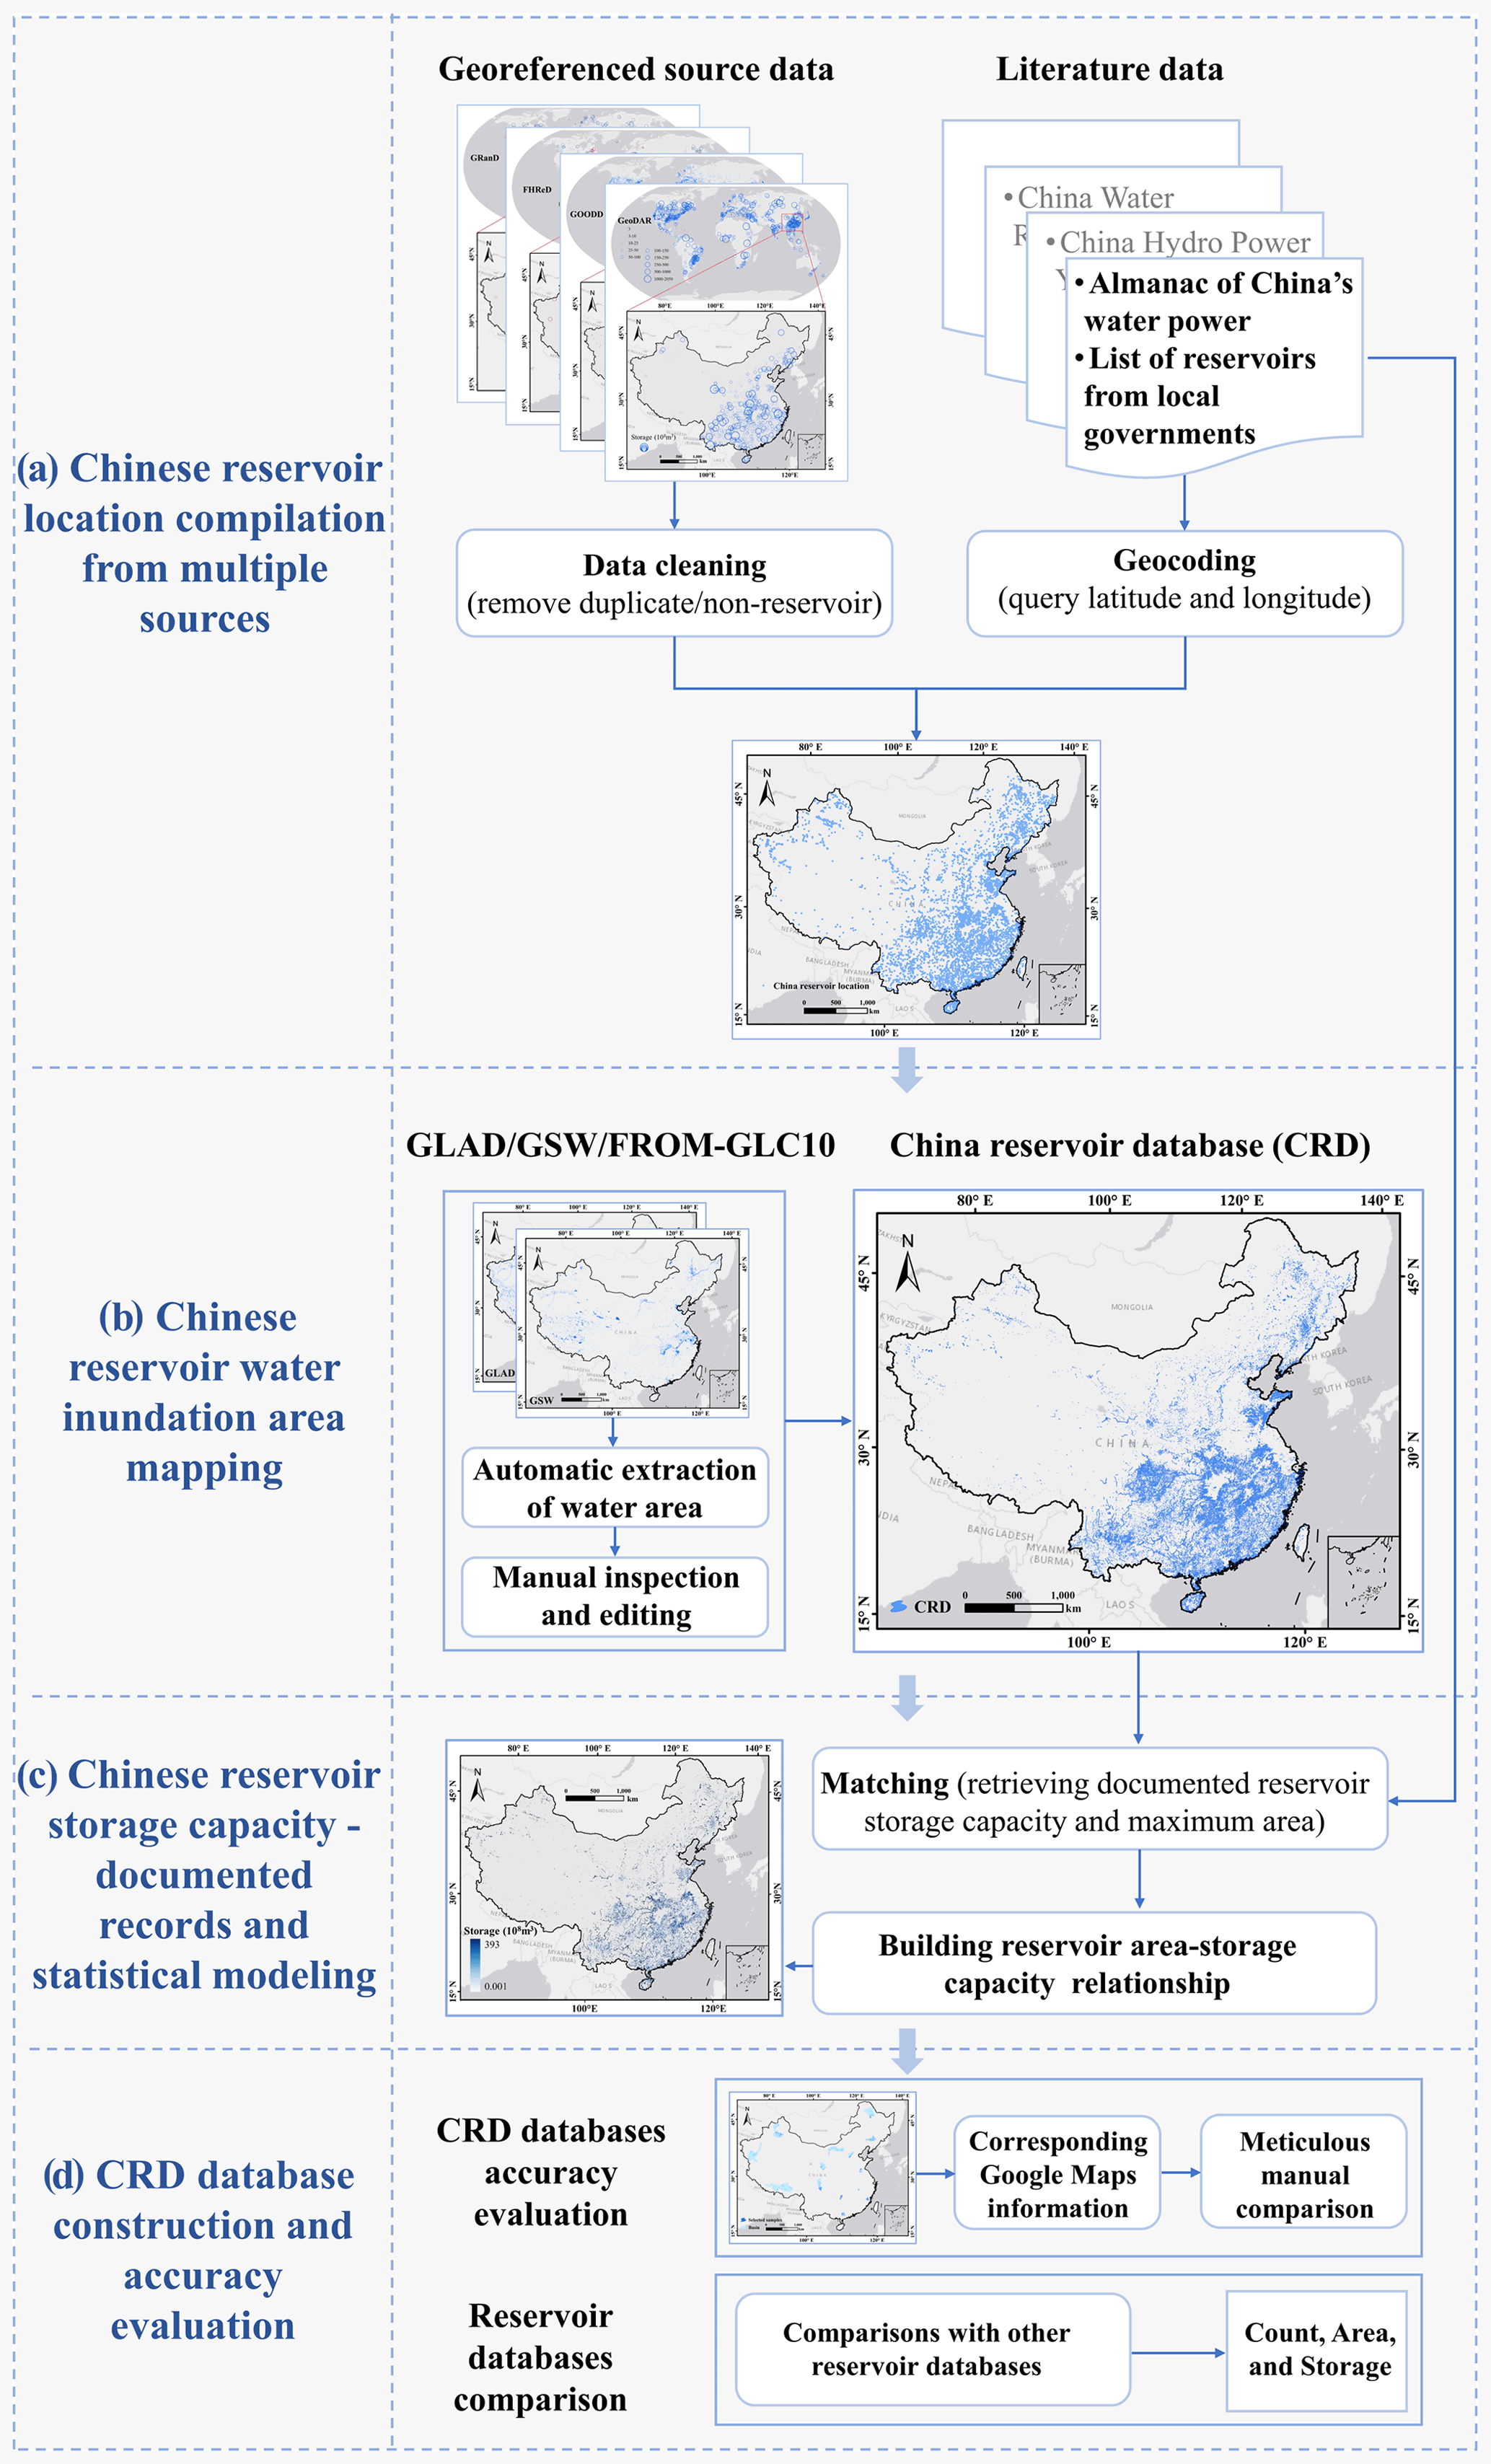
Figure 1Flowchart of the construction of the CRD.
3.2 Reservoir water inundation extent mapping
After determining the spatial location of all reservoirs, we extracted the historical maximum water inundation extent (from the mid-1980s to 2020) of the corresponding reservoirs based on GSW, GLAD, and FROM-GLC10 data (Fig. 1b). GSW data can provide the maximum water area of reservoirs with a long time series from 1984 to 2020. GLAD only maps images over the last 20 years, but it combines Landsat with Sentinel-1 and Sentinel-2 to provide a higher temporal resolution to describe ephemeral surface water better. Through comparative inspection, we found that GLAD could describe the water area details more completely for some reservoirs, especially narrow river channel reservoirs. Therefore, we merged GSW and GLAD datasets to obtain the maximum water area of all reservoirs. In addition, FROM-GLC10 is based on the Sentinel 10 m resolution imagery data, which can identify relatively small reservoirs (reservoir area smaller than 0.01 km2). Therefore, we also supplemented a few narrow river channel reservoirs, especially those in mountainous regions of Zhejiang, Fujian, Sichuan, Jiangxi, and Guangxi provinces. The automatically extracted water masks by intersecting with our compiled reservoir point locations were visually inspected and, if necessary, manually edited (e.g., to separate the reservoir from the river segment) to form quality-controlled reservoir boundaries. Up to now, there are still reservoirs that have not been collected, except for those identified in Sect. 3.1. So, all the remaining water bodies were manually checked by overlapping with the Google Maps high-resolution images to minimize the number of missed reservoirs. Finally, a total of 97 435 reservoir polygons were extracted.
For reservoirs without corresponding names, the reverse geocoding API of Tiandi Map was used to query the names of corresponding reservoirs. Here, the reverse geocoding API refers to entering the reservoir's coordinates and then returning the relevant name information of the corresponding reservoir. Eventually, 66 253 reservoirs were identified and supplemented with the name attribute.
3.3 Reservoir storage capacity and residence time estimation
Reservoir storage capacity is one of the most basic types of information about reservoirs. As shown in Fig. 1c, the source of reservoir storage capacity in the CRD database is mainly divided into two types, i.e., the recorded values obtained from the yearbook and government documents, as mentioned in Sect. 2.2, and statistical estimations by an empirical model.
According to the yearbook and other documents (Sect. 2.2), we collected the storage capacity records for 5143 reservoirs in various sizes, among which there are 162 Type-I super-large reservoirs (storage capacity greater than 1 km3), 580 Type-II large reservoirs (0.10–1 km3), and 4407 small and medium-sized reservoirs (smaller than 0.10 km3). As super-large reservoirs (mostly canyon-type reservoirs) tend to have different hypsometric (area–storage relationship) characteristics from small and medium-sized reservoirs (mostly in plain and hilly areas), we excluded the 742 large reservoirs from model calibration. In addition, we removed 84 reservoirs that do not conform to the small and medium-sized reservoir class (storage capacity smaller than 0.10 km3). The statistical relationship between the inundation area and storage of a total of 4323 reservoirs was established to estimate and supplement the capacity estimation of the remaining unrecorded small and medium-sized reservoirs. The empirical model was used to fit the storage capacity and area of the existing recorded reservoirs (Fig. 2). The fitting equation is as follows, and the R2 is 0.84.
where V represents the reservoir storage capacity in the unit of cubic meters (m3), and S represents the maximum reservoir area in the unit of square meters (m2). We calculated the SMAPE (symmetric mean absolute percentage error) of the estimated storage capacity, and it showed 32.62 %–32.64 % bias at the 95 % confidence interval based on the fitted model. Finally, the recorded values from yearbook and other documents are regarded as the storage capacity of 5143 reservoirs, totaling about 803.29 km3. The storage capacity of the other 92 292 reservoirs was estimated using their maximum inundation areas, as in Eq. (1), with a total of 176.33 km3, ranging from 121.67 to 257.30 km3. Therefore, the total storage capacity of Chinese reservoirs is 979.62 km3 (924.96–1060.59 km3).
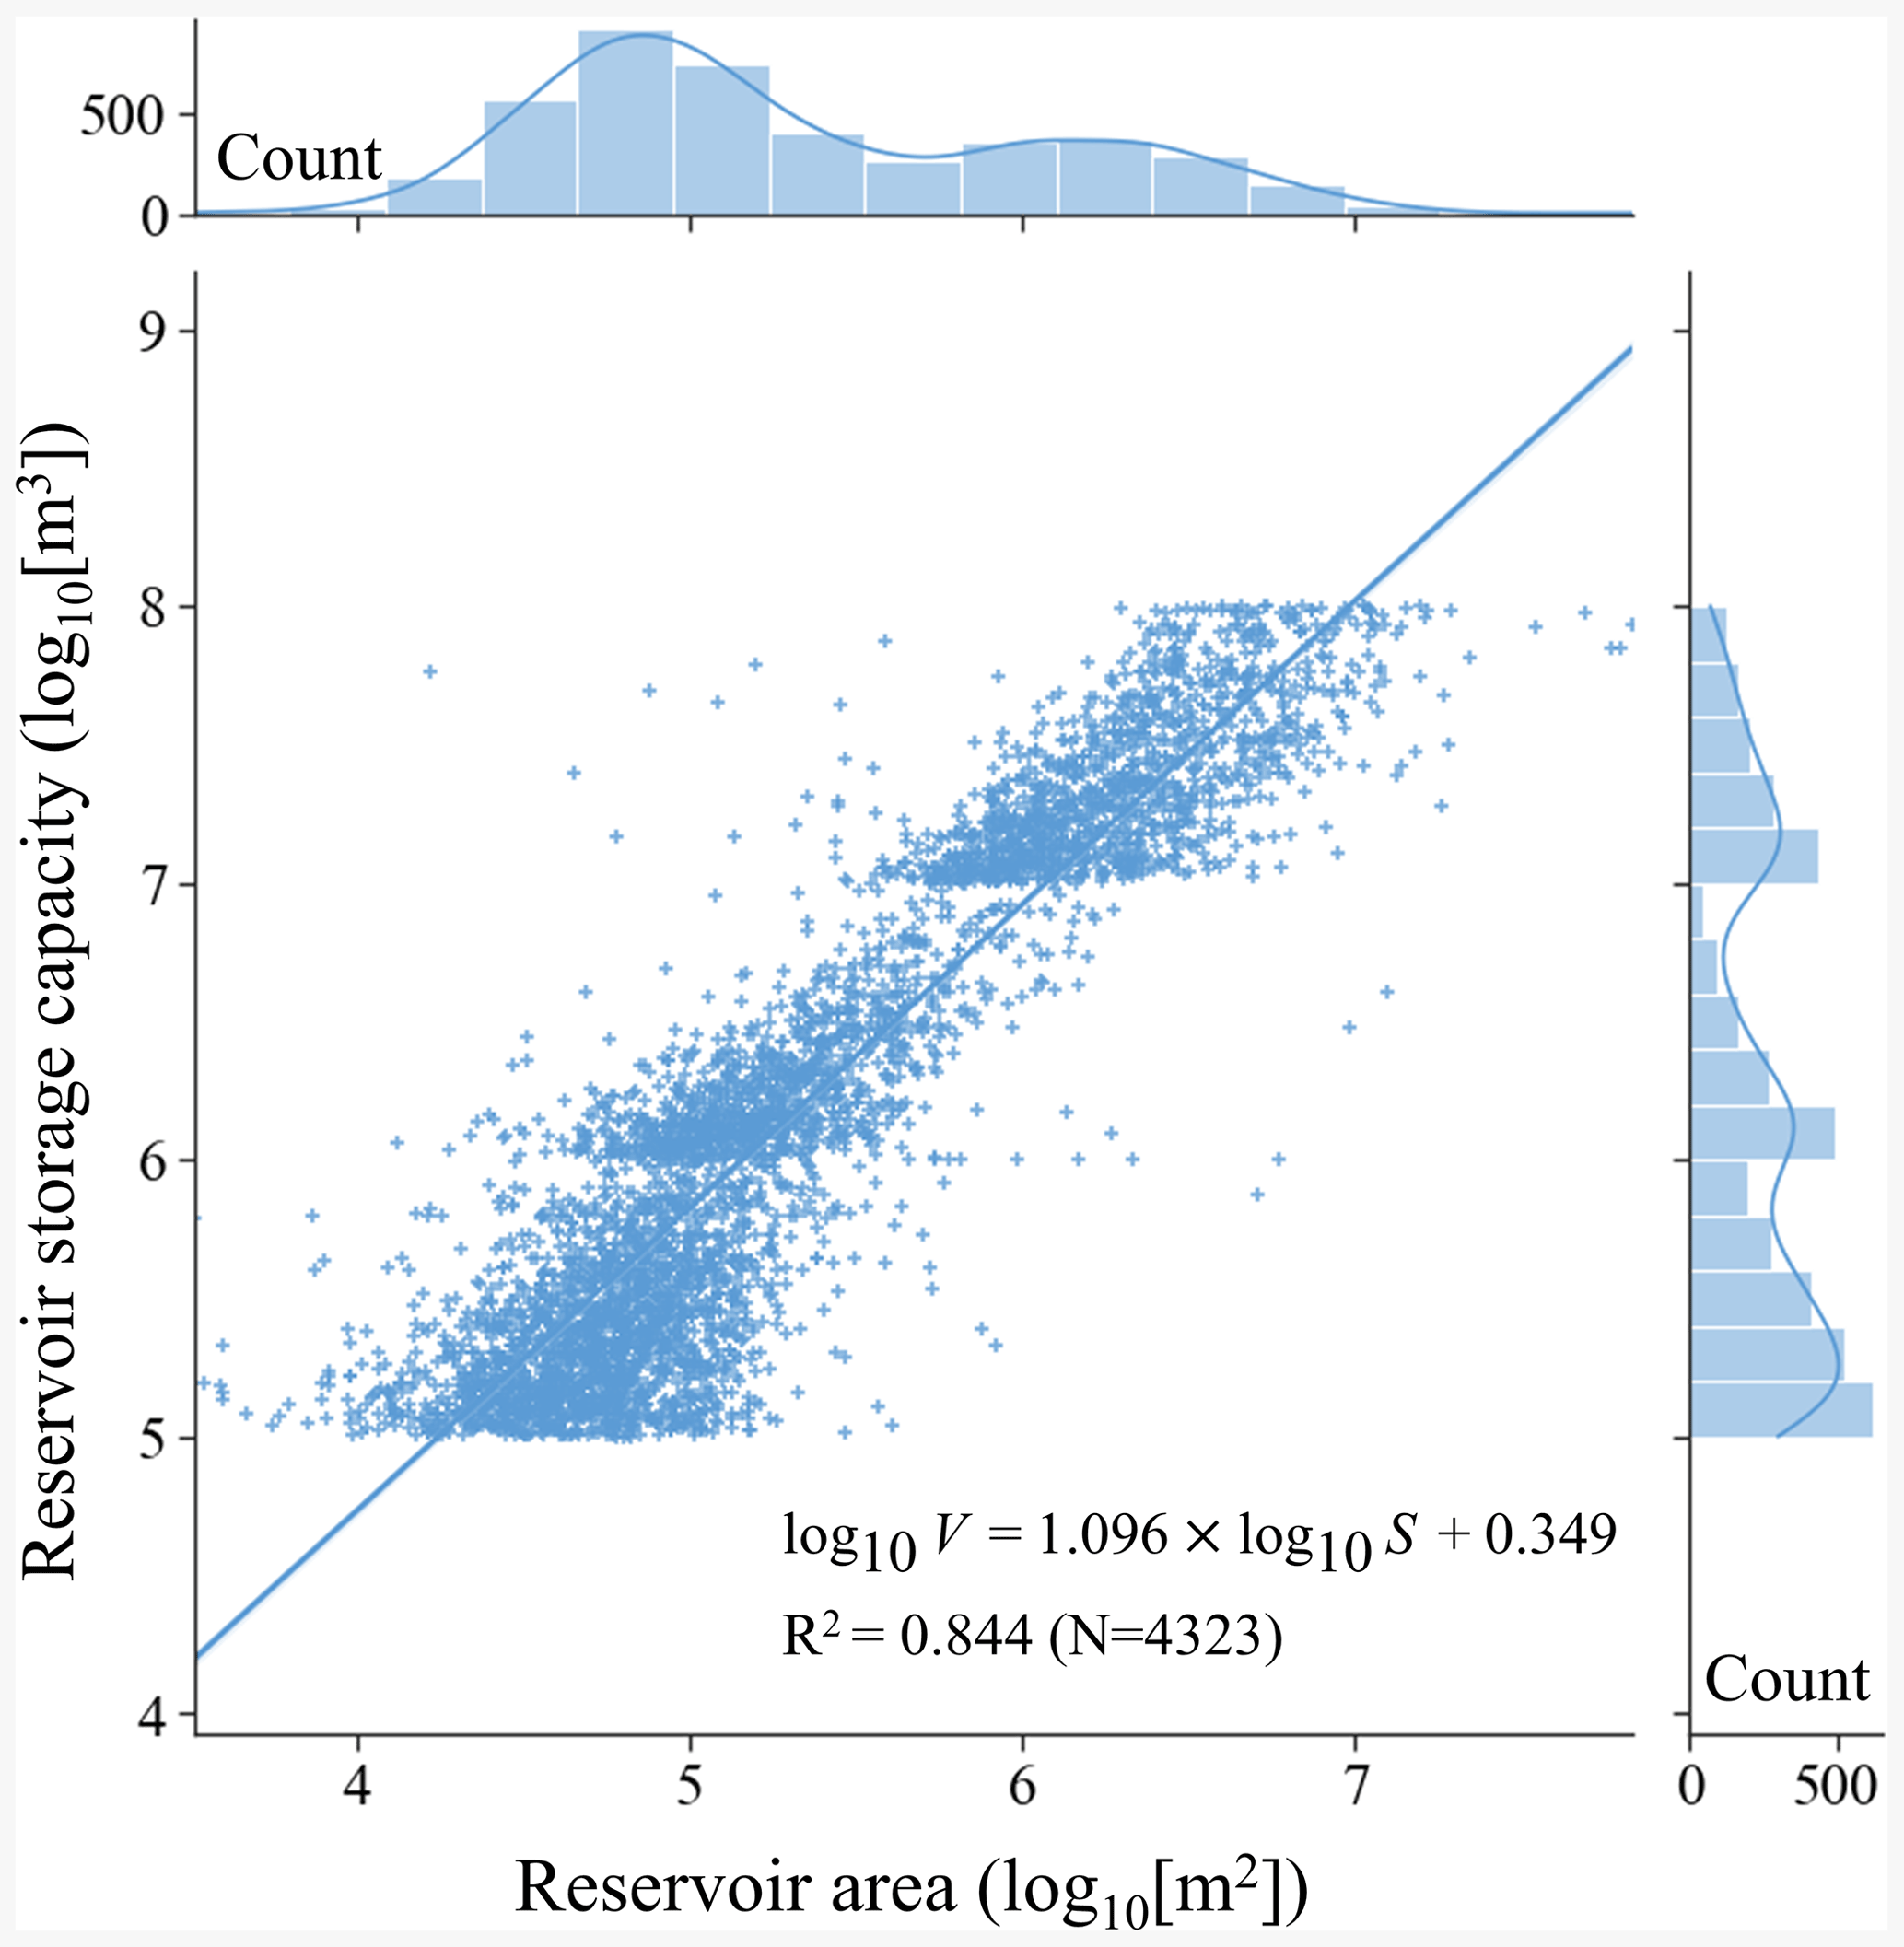
Figure 2Fitting relationship of area and storage capacity of small and medium-sized reservoirs. The bars and broken lines in the subgraph, respectively, represent the count of scattered points and kernel density in the corresponding interval. The upper and right subplots correspond to the count of reservoir area and storage capacity values, respectively.
HydroSHEDS (Hydrological data and maps based on SHuttle Elevation Derivatives at multiple Scales) provide hydrographic baseline information in a consistent and comprehensive format to support regional and global watershed analyses and hydrological modeling. It is currently considered the leading global product in terms of quality and resolution (Lehner and Grill, 2013). HydroBASINS and HydroRIVERS are extracted from HydroSHEDS at a 15 arcsec resolution. HydroRIVERS represents a vectorized line network of all global rivers with a catchment area of at least 10 km2, an average river flow of at least 0.10 m3 s−1, or both. HydroRIVERS covers all rivers in the Pfafstetter Level 12 sub-basins of HydroBASINS and contains the attribute information of each river, including an estimate of long-term average discharge. Here, we focused on reservoirs (17 185) located on HydroRIVERS rivers and extracted reservoir discharges based on HydroRIVERS. Moreover, these reservoirs cover 96 % of the CRD reservoirs larger than 1 km2. The remaining smaller reservoirs, on the one hand, are not on the HydroRIVERS rivers; on the other hand, it is difficult to obtain the discharge of smaller reservoirs. Therefore, they are generally not included in hydrological simulations. Notably, while the CRD database provided information about reservoir discharge and residence time, these data can be updated for specific hydrological modeling. The equation of average residence time is as follows:
where DIS_AV_CMS represents the reservoir discharge in the unit of cubic meters per second (m3 s−1), and RES_T represents the reservoir residence time in the unit of years. The R2 of the estimated reservoir residence times and the corresponding results of HydroLAKES reservoirs is 0.82.
4.1 Description of the CRD database
This database catalogs the location information of 97 435 reservoirs in China, with an aggregated area of 50 085.21 km2 and an estimated total storage capacity of 979.62 km3 (924.96–1060.59 km3). The 5143 reservoirs in the CRD database were directly derived from the yearbook and other documents data, accounting for 59 % and 82 % of the total reservoir area and storage capacity of the CRD database, respectively. This reservoir information was mainly obtained through manual compilation. The attributes of the recorded reservoirs include the longitude and latitude of the reservoir, name, province, prefecture, and county where the reservoir is located, water area, water level of normal storage capacity, storage capacity, reservoir class, main use, and regulation type (Table 1). The attributes of all the CRD reservoirs (in all cases) include location information (longitude, latitude, province, prefecture, and county), inundation area, estimated storage capacity, river order, discharge, and residence time of reservoirs, as shown in Table 2.
Table 1Attributes in the recorded (5143) reservoirs from the yearbook and document data.

Note that “normal storage capacity” means that the reservoir reaches the storage capacity that can actually be used to regulate runoff.
Table 2Attributes in all (97 435) reservoirs from CRD.

Note that missing or inapplicable values are flagged by “−999”.
The Pareto distribution can describe the global distribution abundance of artificial reservoirs and their inundation areas (sizes; Lehner et al., 2011; Downing et al., 2006). In Fig. 3, we applied such a statistical fitting distribution to the CRD database and inferred the count of smaller reservoirs and their total inundation area. Assuming that our data for reservoirs larger than 0.01 km2 are complete, trend lines can be fitted and extrapolated from the Pareto distribution to estimate smaller reservoirs not included in the CRD database. As a result, there is an overall good fitting in the Pareto model for the CRD reservoirs in the scale of 0.01–10 km2 (Fig. 3a). In addition, the Pareto distributions in each basin are similar to those on the national scale (Fig. 3b–k).
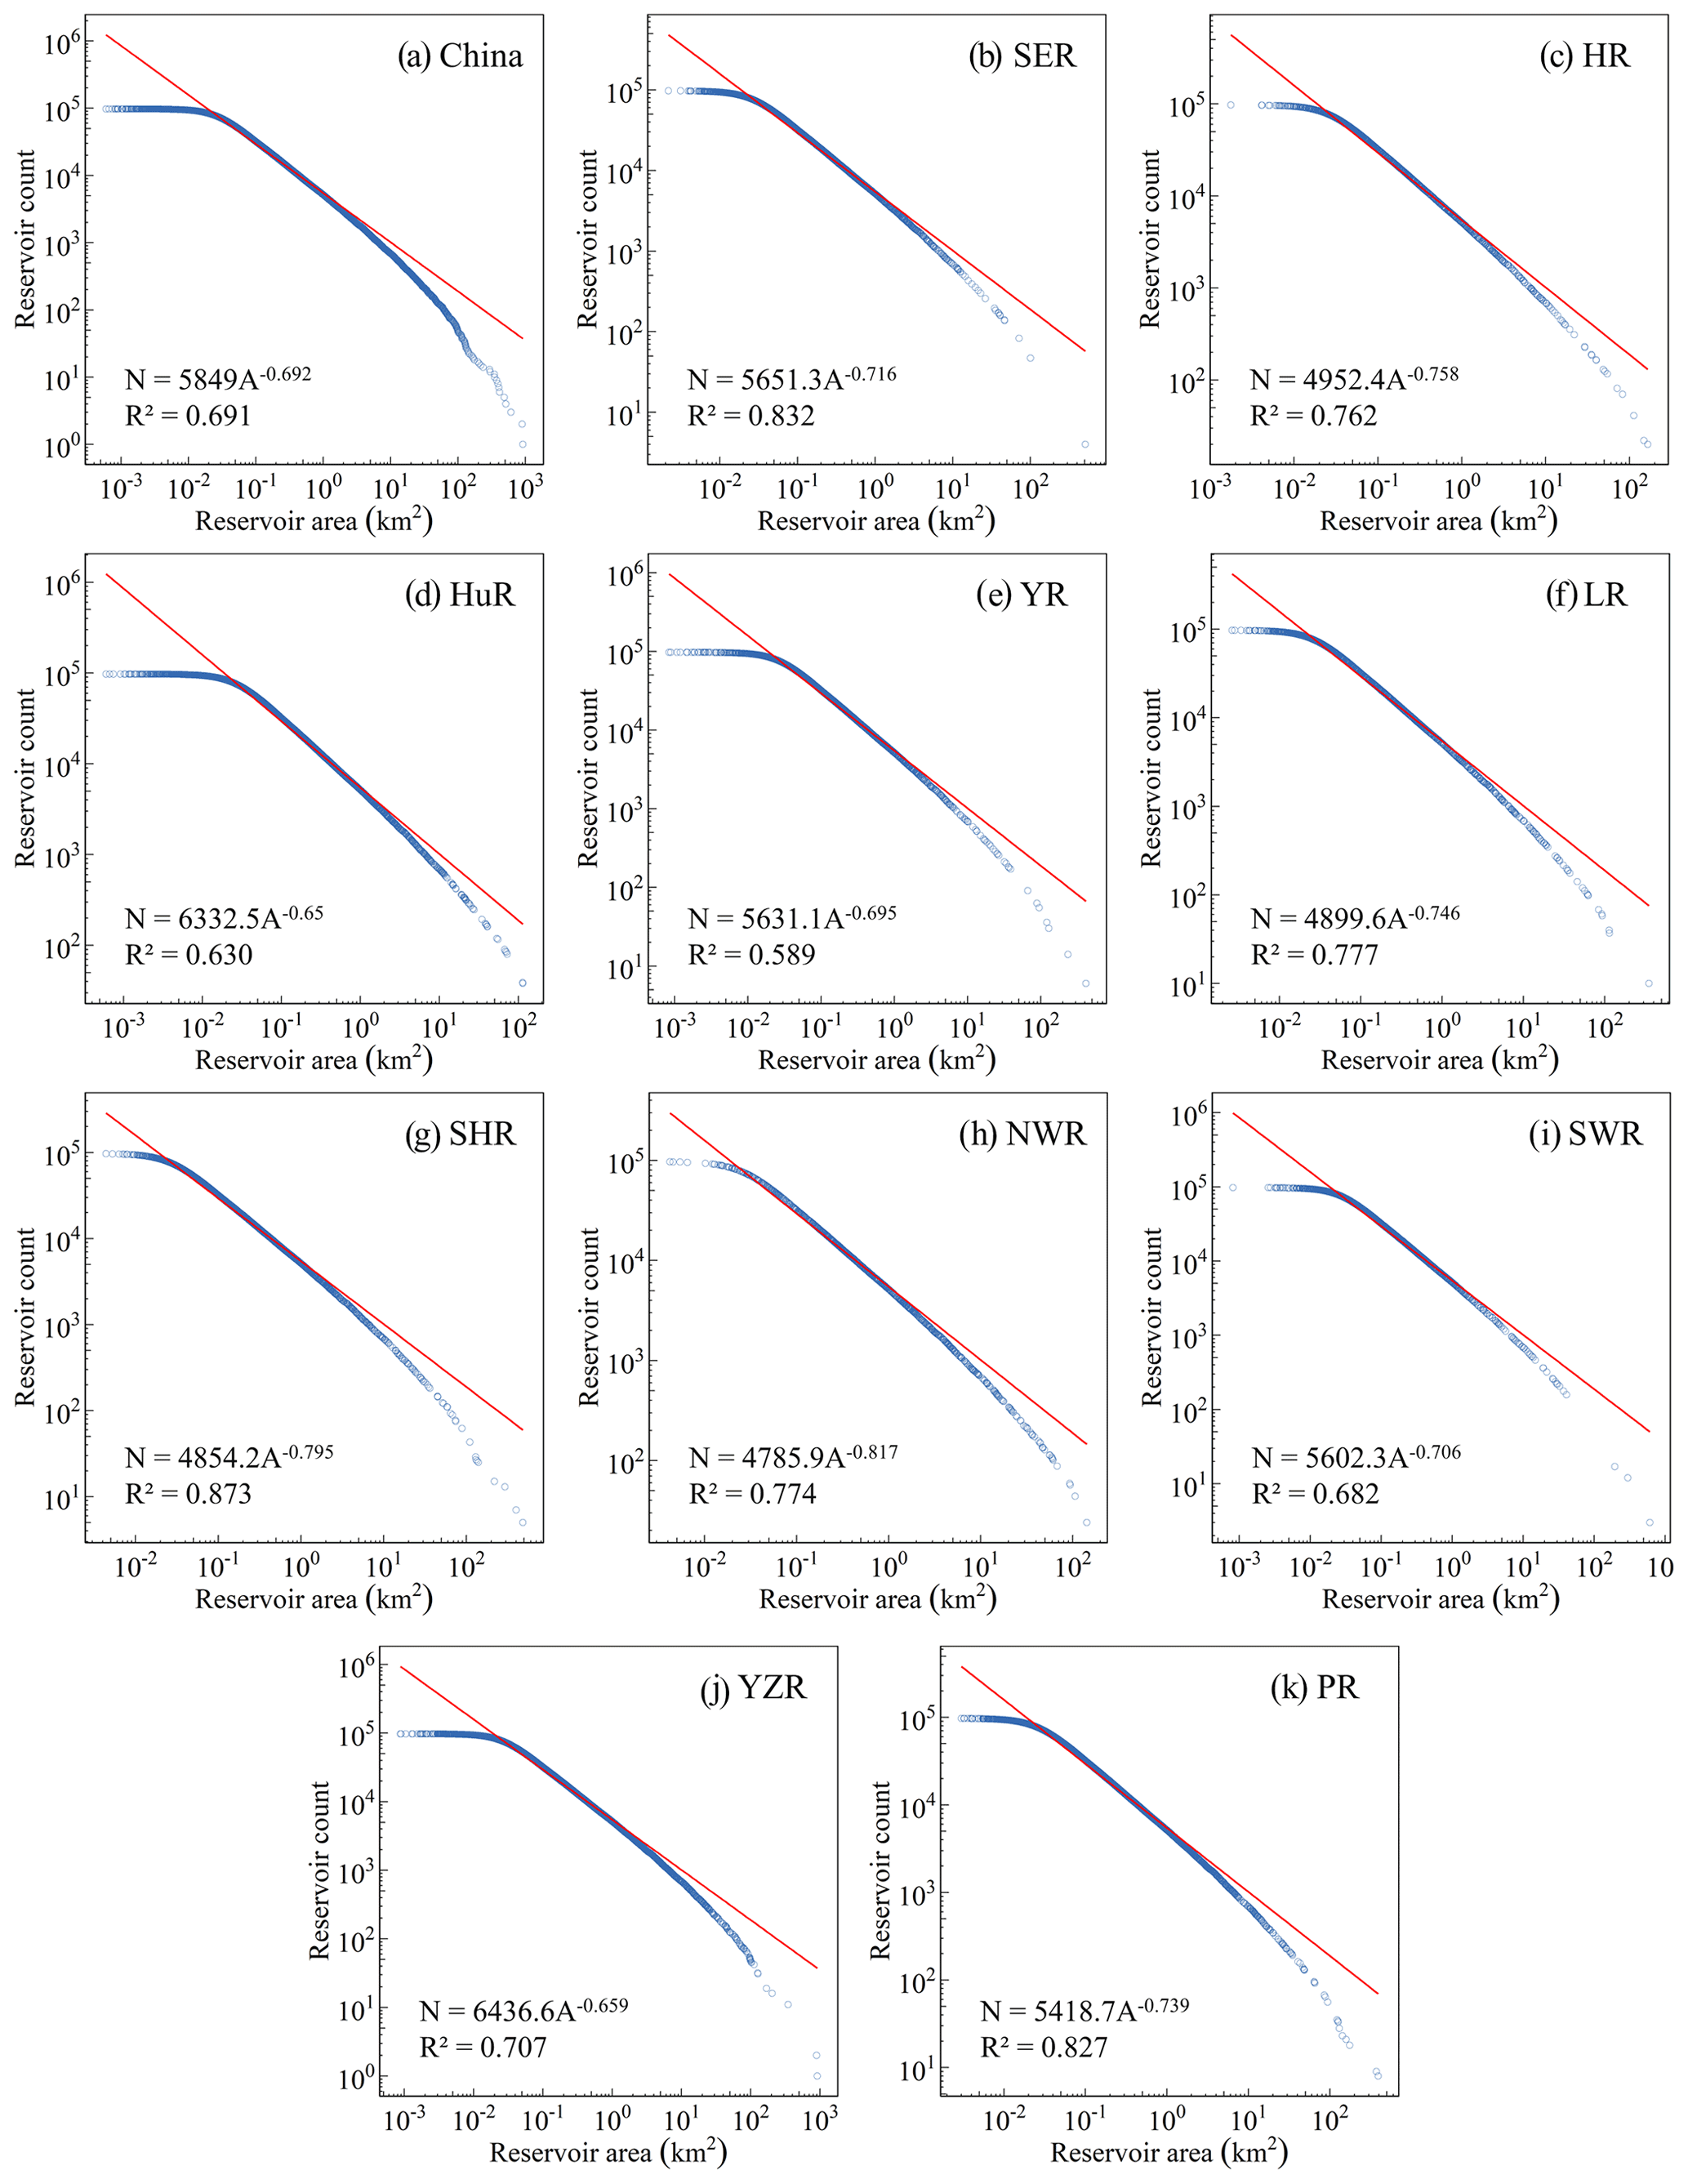
Figure 3China reservoir area and count using a Pareto model. Distributions are plotted as the total number of reservoirs larger than a given surface area in China (a) and 10 first-level water resource divisions (b–k). Blue circles intersecting the fitting lines represent the values used for model fitting. Note: SER – Southeastern River, HR – Haihe River, HuR – Huaihe River, YR – Yellow River, LR – Liaohe River, SHR – Songhua River, NWR – Northwest River, SWR – Southwest River, YZR – Yangtze River, and PR – Pearl River.
4.2 Accuracy evaluation of the CRD database
To evaluate the commission and omission accuracy of the CRD database, we randomly selected sub-basin areas in each first-level river basin across China and manually checked 3634 reservoirs (Fig. 4). The collection of the validation sub-basins followed the “create random sampling points” method. Most of them are third-level river basins. However, for the Yangtze River and the Yellow River basins with more reservoirs, four sub-basins were selected to evenly distribute the sampled reservoirs. For each sampled reservoir, we manually confirmed its relevant information with the record in the Tiandi Map. We overlapped 3634 selected samples with the Tiandi Map to validate the geo-matching accuracy of the CRD. Then, we manually checked whether the spatial coordinates of each sample were consistent with those recorded in the Tiandi Map. In addition, we conducted a second-round quality control to check if any reservoirs were missing.
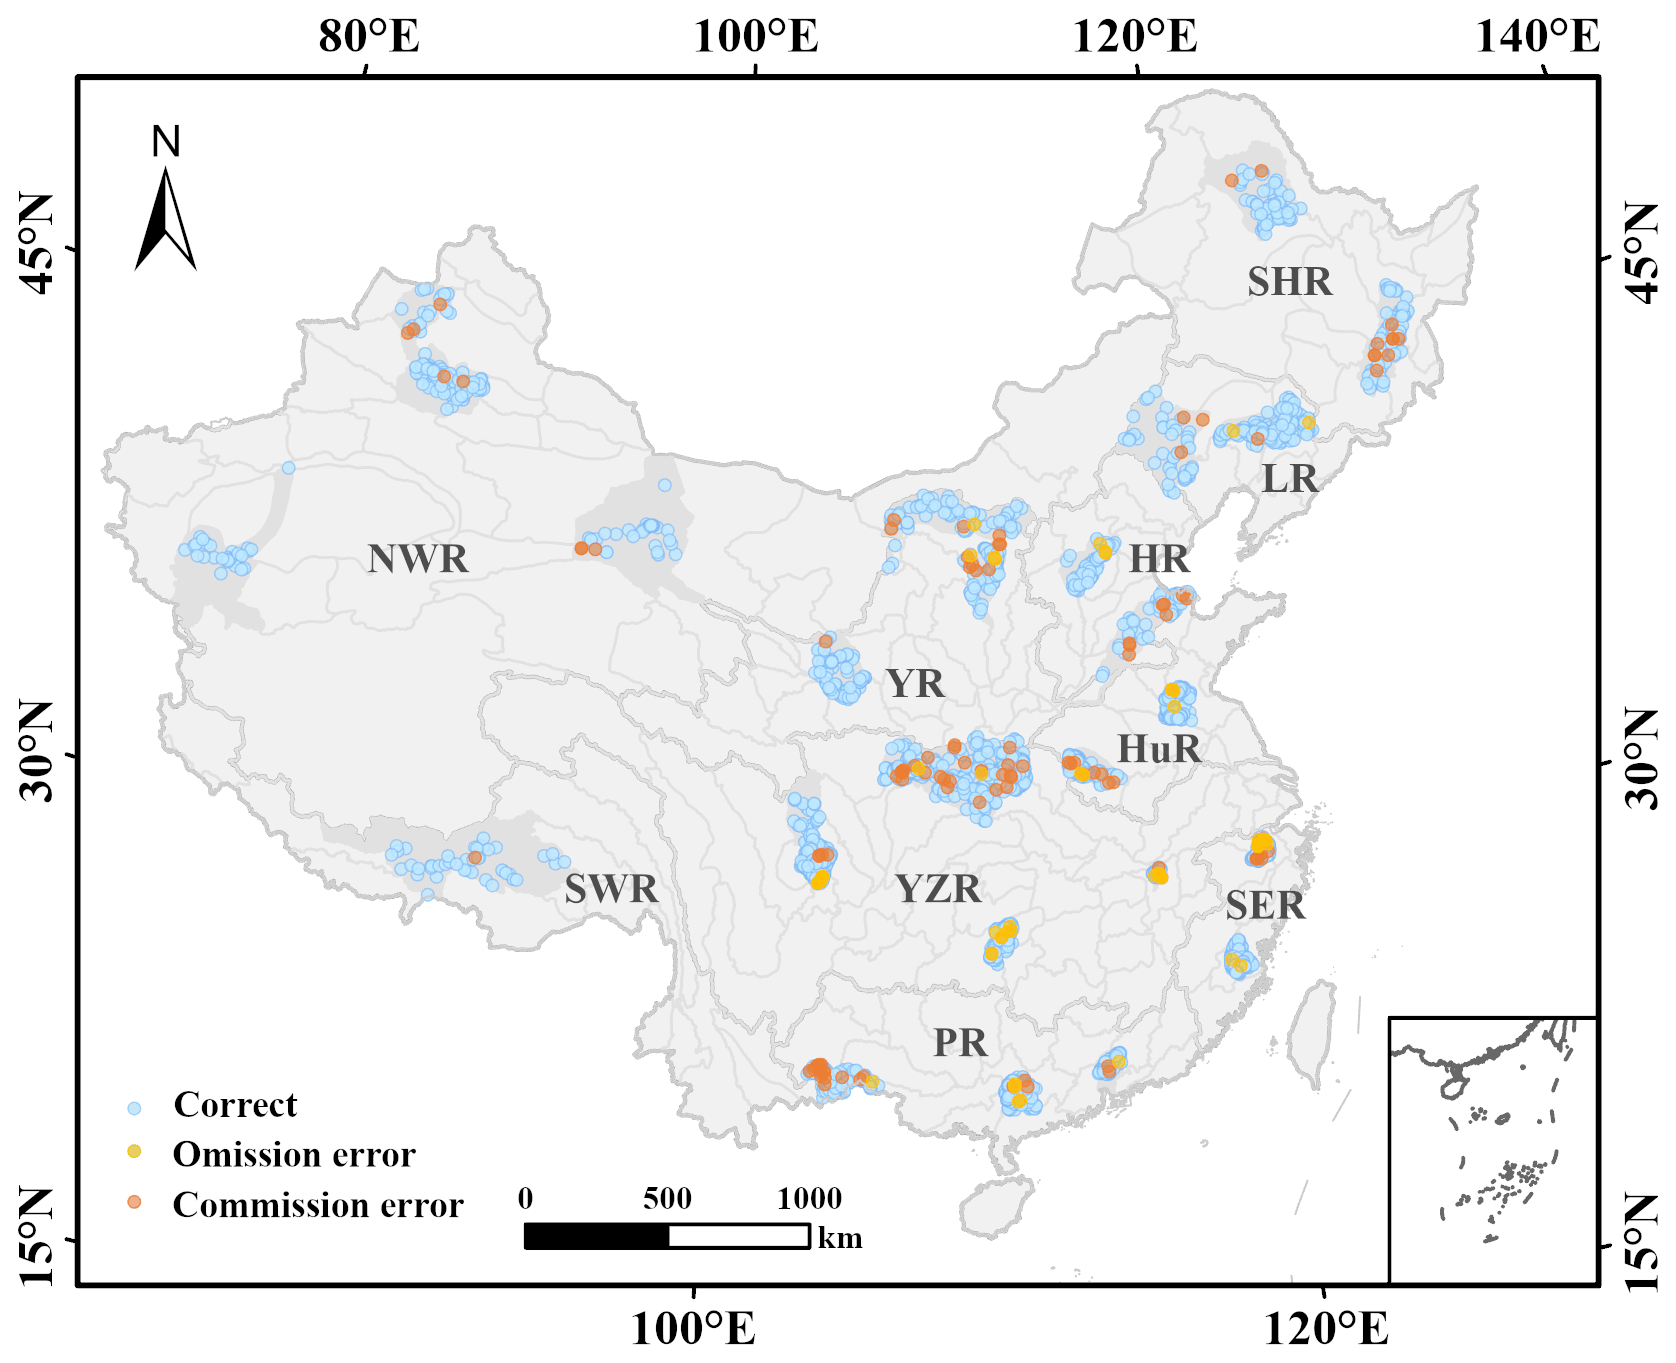
Figure 4The distribution of all sampled validation reservoirs.
As shown in Table 3, the overall evaluation accuracy for the CRD database is 95.13 %, ranging from 92.79 % to 97.17 % in different basins. The main cause of errors in most basins is the misclassification of false reservoirs (commission error), such as ponds and paddy fields. Also, these ponds and paddy fields are generally less than 0.10 km2. In comparison, the accuracy was lowest in the Southwest River basin due to the commission error.
Table 3Accuracy validation in each river basin.
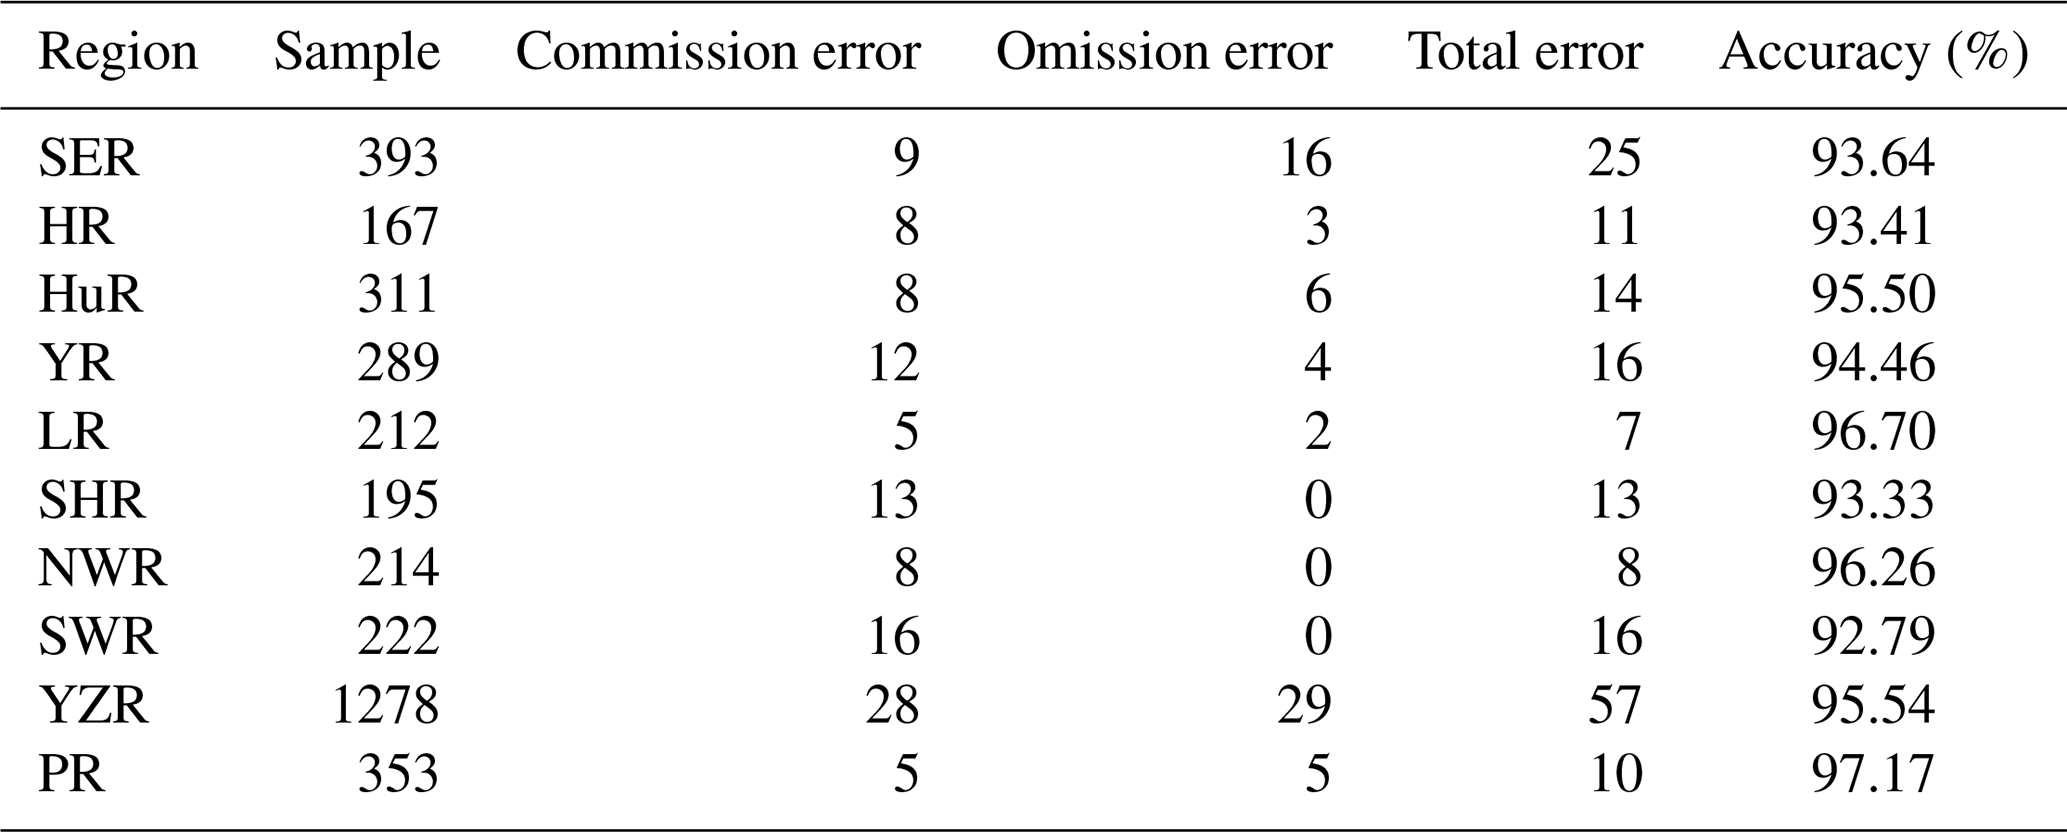
Note: SER – Southeastern River, HR – Haihe River, HuR – Huaihe River, YR – Yellow River, LR – Liaohe River, SHR – Songhua River, NWR – Northwest River, SWR – Southwest River, YZR – Yangtze River, and PR – Pearl River. “Commission error” represents geocoding errors where the CRD information is inconsistent with the validation reference. “Omission error” indicates the number of missing reservoirs in the samples.
4.3 Spatial distribution of reservoirs in China
The total area of reservoirs in China is 50 085.21 km2, and the total storage capacity is estimated to be 979.62 km3. The spatially divergent pattern is generally characterized by the topographic division of the Hengduan Mountains in the east–west direction and the Qinling mountains and the Huaihe River in the north–south direction. The overall distribution of the reservoirs is bounded by the Heihe–Tengchong Line that is widely recognized as a separating line for the contrasting pattern of population, industrial development, and landscape characteristics, decreasing from southeast to northwest. Latitudinally, reservoirs in China are dominantly distributed in the belt between 20–30∘ N, both in terms of count and area, whereas longitudinally, reservoirs in China are concentrated between 100–120∘ E.
Chinese reservoirs are widely distributed and have obvious agglomeration characteristics. Reservoirs are distributed not only from the hot and humid southern areas to the arid desert areas but also from the eastern coastal areas to the Qinghai–Tibet Plateau. From Fig. 5, reservoirs are mainly distributed in China's major commodity grain production bases that have a relatively great demand for agricultural irrigation, such as the Poyang Lake and Dongting Lake plain, Huaihe River basin, Songnen Plain, and Sanjiang Plain. Moreover, many large reservoirs are accumulated in areas with large elevation drops and abundant water resources. For example, reservoirs in Sichuan province are clustered along the main stems of Fujiang River, Jialing River, and Yangtze River. In addition, as a major water supply, many reservoirs are concentrated in urban areas such as the Shandong Peninsula urban agglomerations. In the Shandong Peninsula, reservoirs are mainly concentrated in the Yimeng Mountains and the Bohai Rim area.
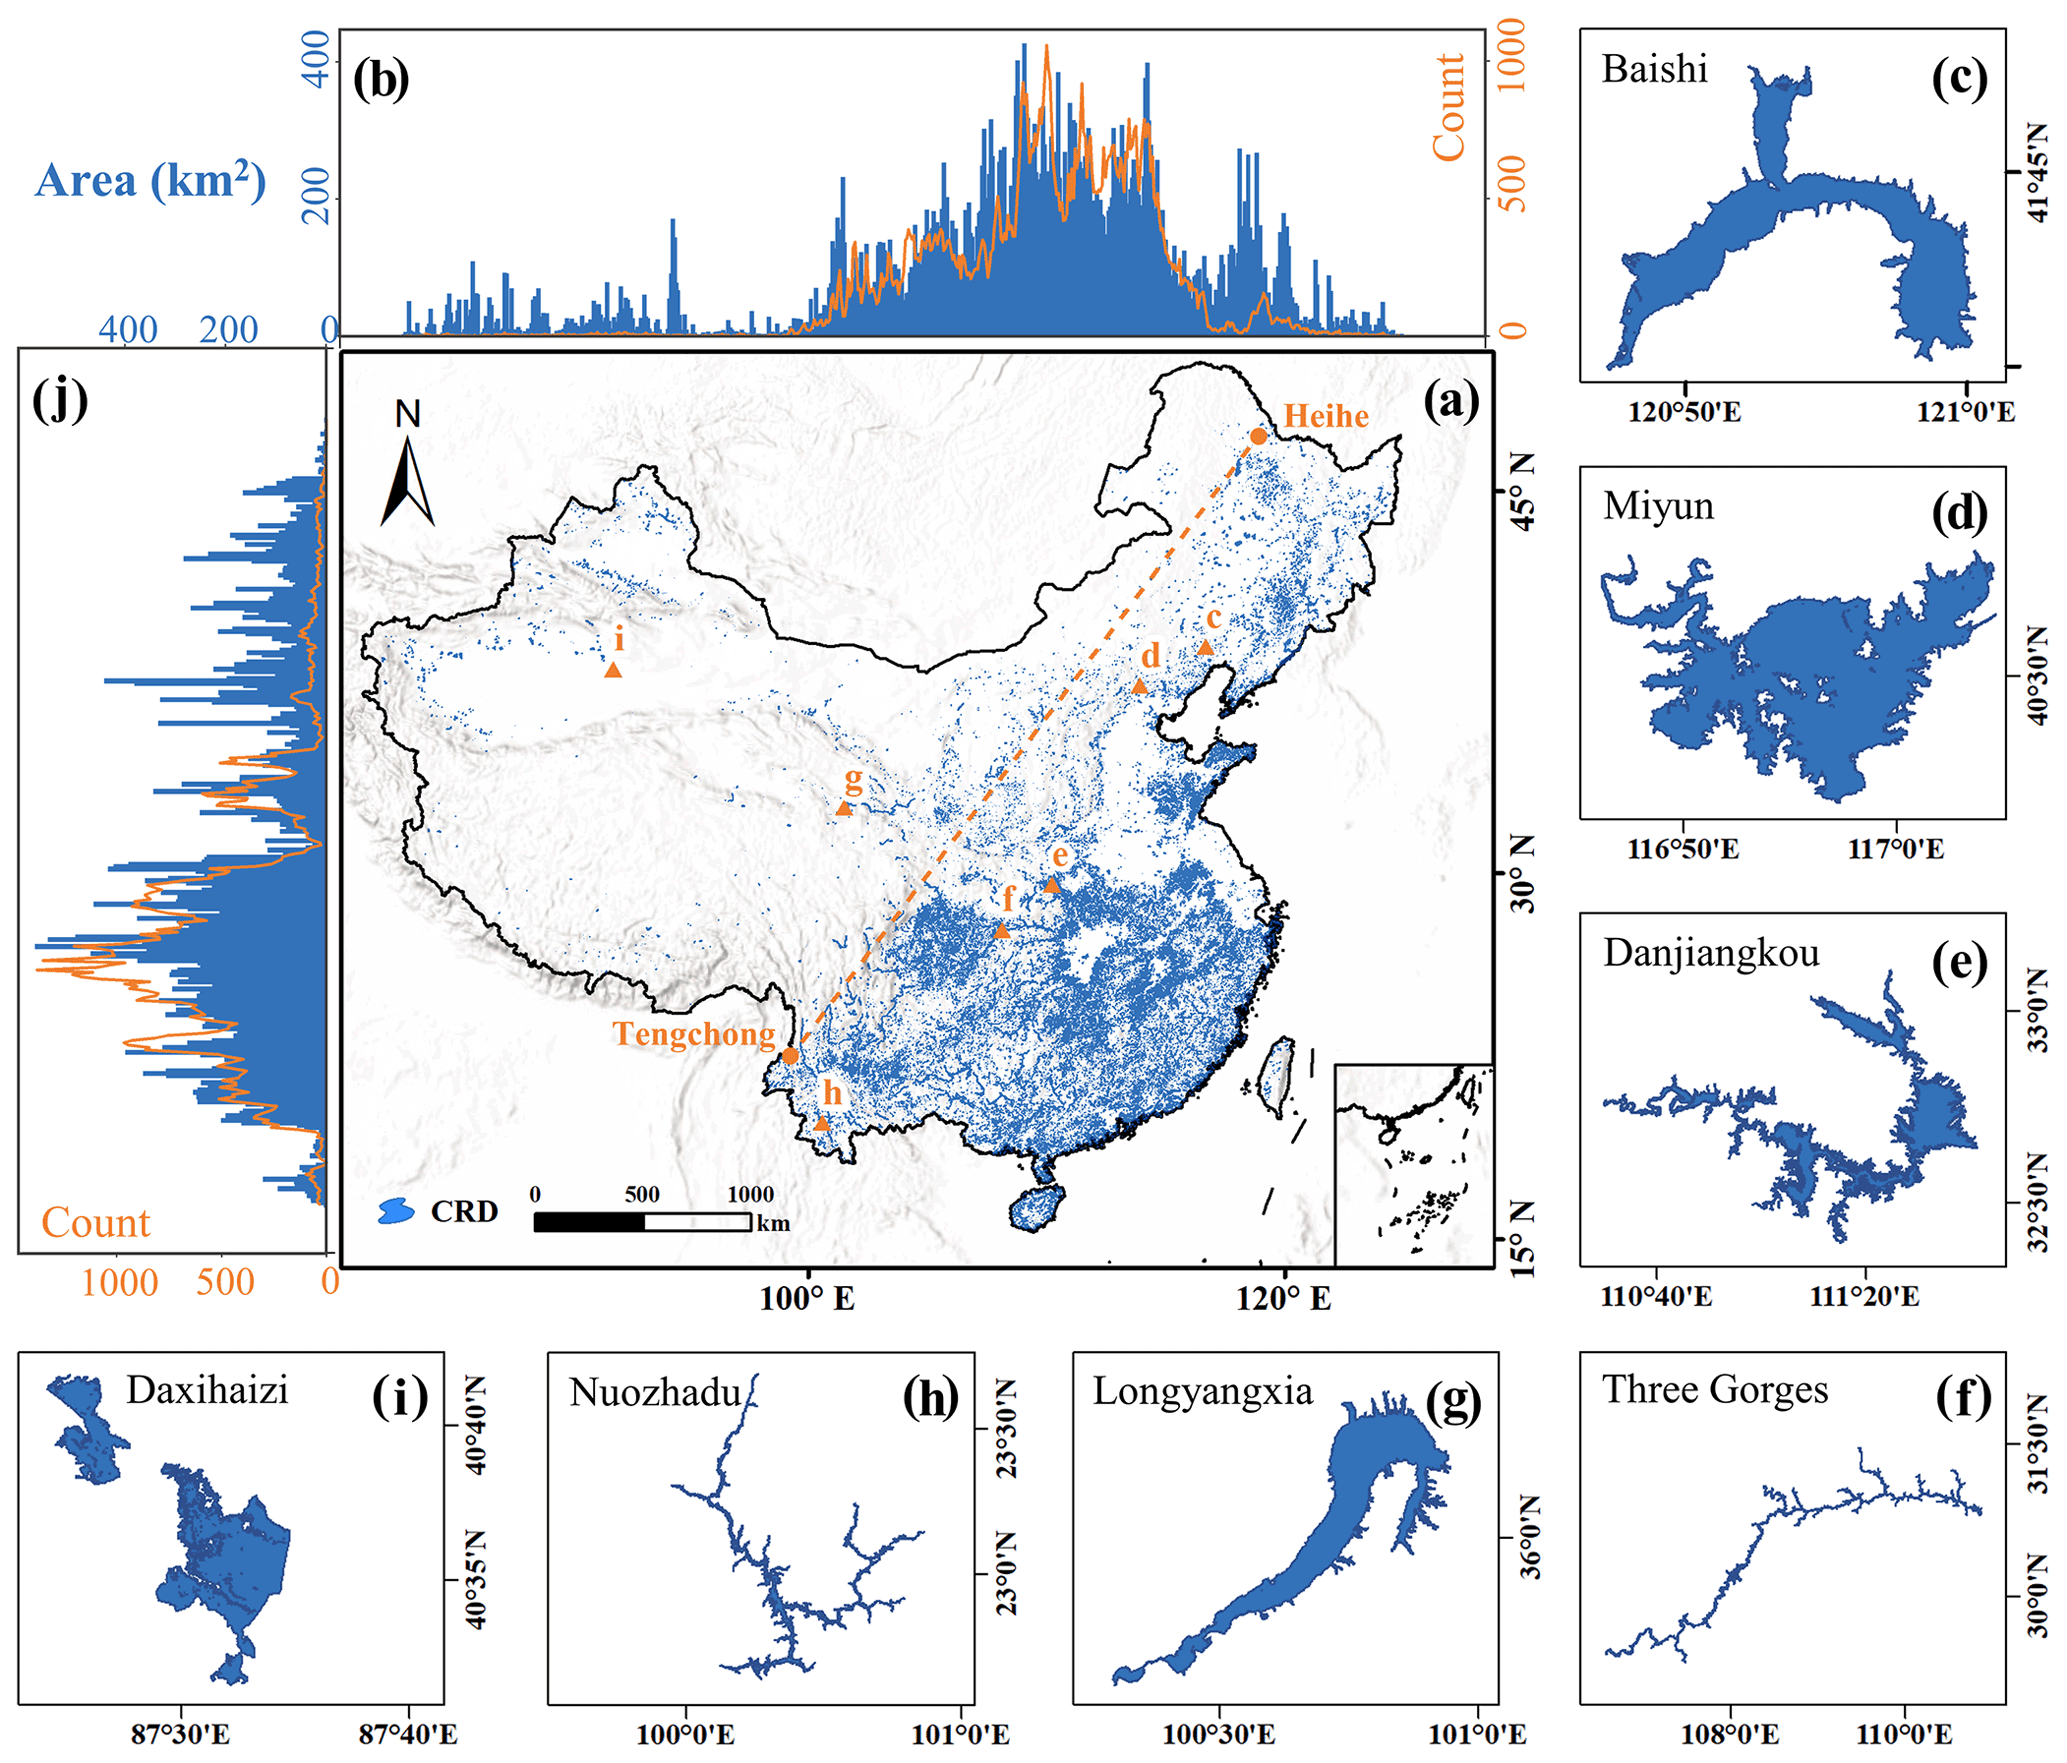
Figure 5Spatial distribution of reservoirs in China (a). The histogram and lines represent the area and count of reservoirs in China by 0.1∘ latitude (b) and longitude (j), respectively. The subgraphs in panels (c)–(i) show the details of Baishi, Miyun, Danjiangkou, Three Gorges, Longyangxia, Nuozhadu, and Daxihaizi reservoirs.
4.4 Distribution characteristics of reservoir storage capacity in China
In terms of storage capacity spatial distribution, reservoirs with substantial storage capacity are mostly found in the Yangtze River and the Pearl River. Many major reservoirs have been built in the Southwest River in recent years, primarily in the upper stages of the Lancang, Yuan, and Nujiang rivers. The Huaihe River and Haihe River basins, on the other hand, have several reservoirs, although their storage capabilities are limited, owing to the flat terrain's minimal elevation changes. While the Yellow River has no evident benefit in terms of count or storage capacity, it has the biggest reservoir regulation of any basin, and its total reservoir capacity has reached 3 times its annual runoff.
The distribution of reservoir storage capacity in China is shown in Fig. 6. There are 135 reservoirs with a storage capacity of above 1 km3 (see Fig. 6b), accounting for 60.81 % of the total. Among them, there are 15 reservoirs with a storage capacity of more than 10 km3 in China, accounting for 29.39 % of the total reservoir capacity. Also, the top 10 reservoirs (Three Gorges, Danjiangkou, Longtan, Longyangxia, Nouzhadu, Xin'anjiang, Xiaowan, Shuifeng, Xinfengjiang, and Xiluodu reservoirs) are mainly distributed in the Yangtze River, Pearl River, and Southwest River, which are rich in water resources. These 10 reservoirs alone account for 23.51 % of the total storage capacity of the CRD.
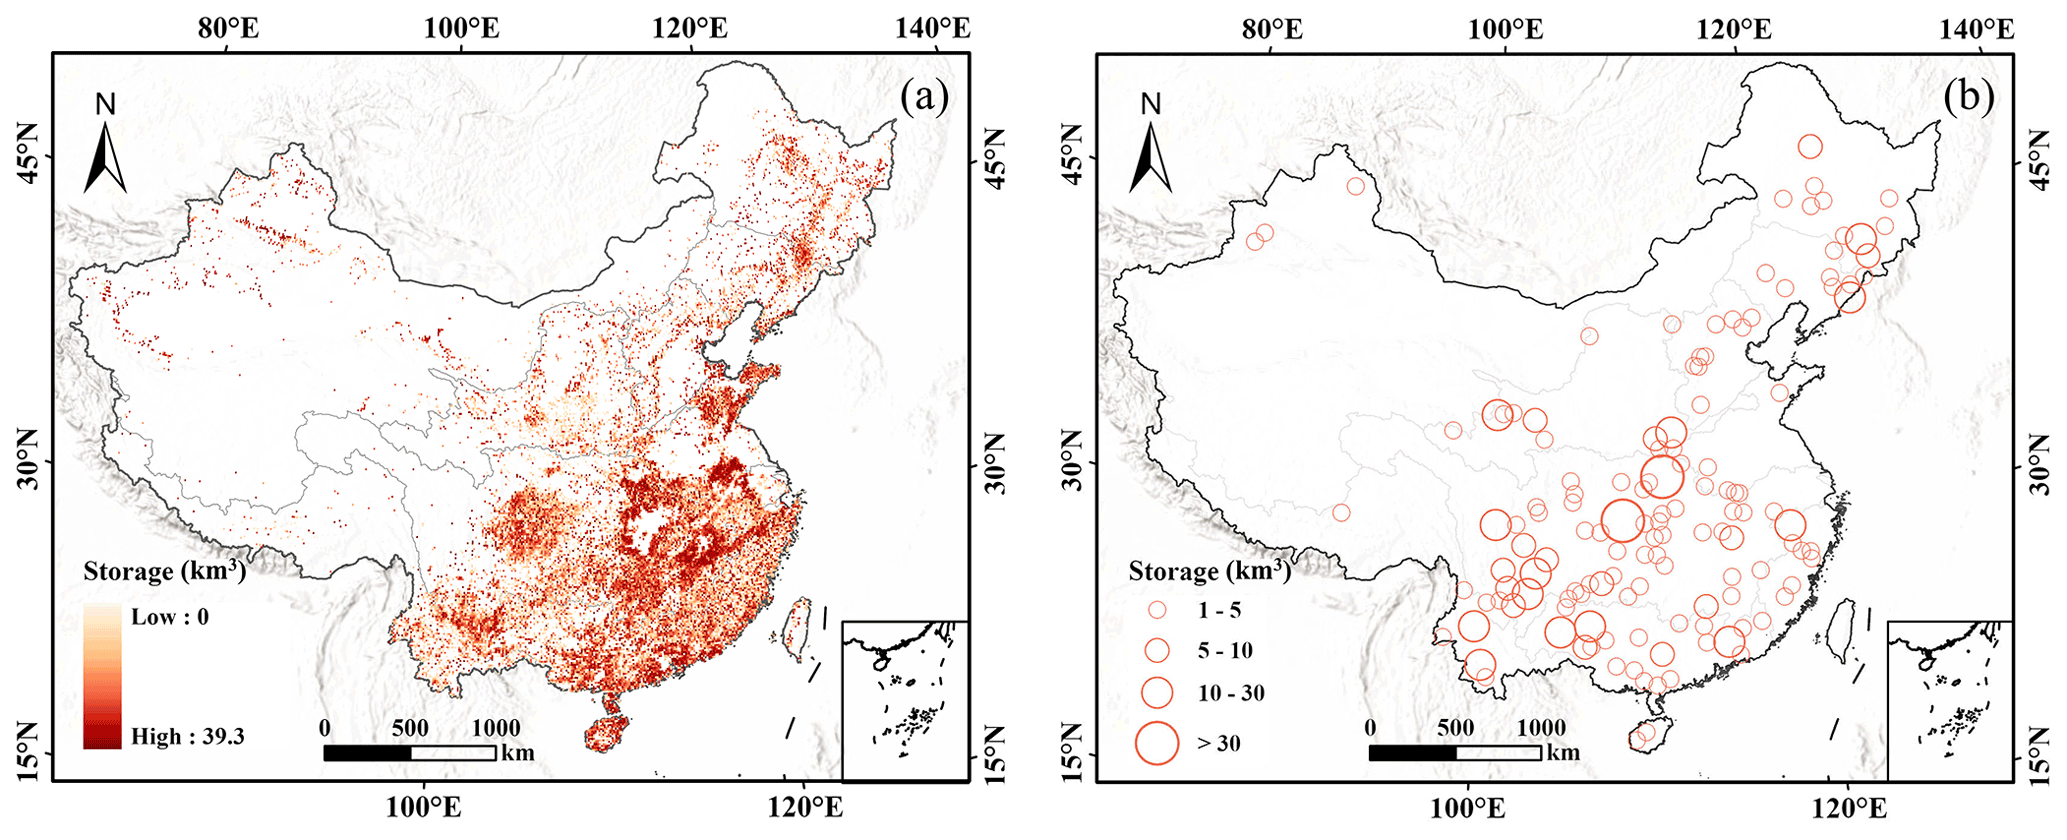
Figure 6Distribution of reservoir storage capacity in China. Panel (a) shows all 97 435 reservoirs in the CRD, which are displayed in gradient color according to the total storage capacity of reservoirs in the gridded statistics. Panel (b) shows the 135 reservoirs larger than 1 km3.
Furthermore, we analyzed the distribution characteristics of the reservoir number, area, and storage capacity in each primary and secondary watershed of the water resources division. The big bubbles illustrated in Fig. 7 represent basins with a large count, large area, and large storage capacity which belong to the Yangtze River. Almost all the second-level river basins with a relatively large storage capacity are distributed in the middle and upper reaches of the Yangtze River, including the Dongting Lake basin, Poyang Lake basin, the Jinsha River basin, and the Han River basin.
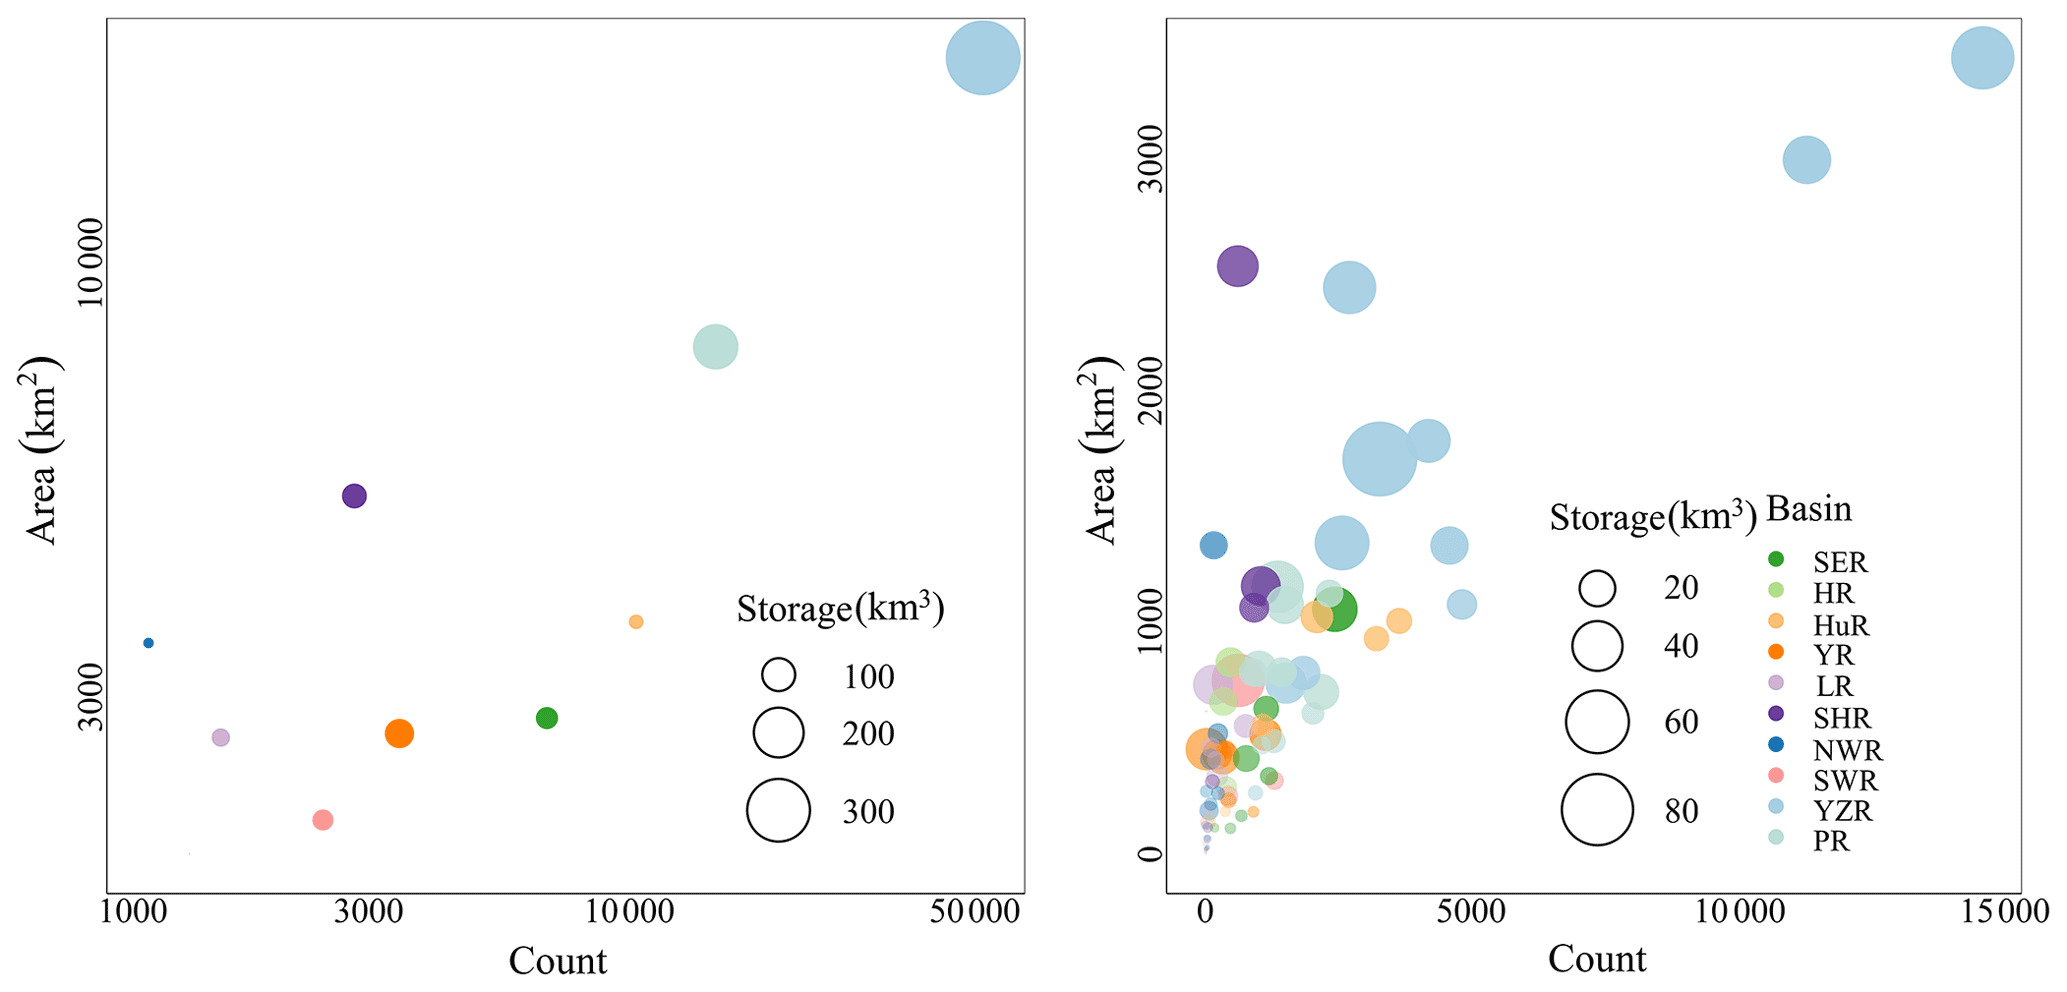
Figure 7Bubble chart of reservoir count, area, and storage capacity of each basin in the first-level (a) and second-level (b) hydrologic basins. Different colors represent the 10 first-level basin units. Bubble size represents the size of reservoir capacity. Note: SER – Southeastern River, HR – Haihe River, HuR – Huaihe River, YR – Yellow River, LR – Liaohe River, SHR – Songhua River, NWR – Northwest River, SWR – Southwest River, YZR – Yangtze River, and PR – Pearl River.
5.1 Comparisons with other reservoir databases
To better examine the supplemented reservoirs in the CRD database over Chinese territory, we compared the CRD reservoirs with the widely recognized and publicly available reservoir/dam databases, including GOODD, GeoDAR v1.1, and GRanD v1.3. Figure 8 shows the contrasts among these four databases in the count, area, and storage capacity. Since GOODD does not provide reservoir attribute information (except for locations and catchment areas), it is only compared with CRD with respect to the reservoir count. The quantity of reservoirs in the CRD (97 435) exceeds those of the Chinese subsets of the global databases (from 9238 in GOODD to 921 in GRanD) by 1–2 orders of magnitude. The CRD increased the total reservoir area by about 169 % and 194 % compared with GeoDAR and GRanD, respectively. In comparison, the total storage capacity of the CRD exceeds the GeoDAR and GRanD by 249.23 and 293.51 km3 in China, respectively. Notably, although GeoDAR still largely exceeds GRanD in dam count, their total storage capacity was comparable, with GeoDAR increasing its reservoir storage capacity by approximately 6 % (44 km3). This is because GRanD has included the largest reservoirs in China.
We also compared CRD with the three global databases at different levels of reservoir areas. As shown in Fig. 9a, the advantage of the CRD is most evident in the supplement of reservoirs with an area less than 1 km2, particularly for reservoirs smaller than 0.10 km2. Therefore, the total reservoir areas of the corresponding CRD database with an area smaller than 0.10 and 0.10–1 km2 are also higher than those of other databases. For larger reservoirs (1–9, 10–100, and larger than 100 km2), the counts of the CRD, GeoDAR, and GRanD have little difference, but the CRD area is slightly higher, mainly because the reservoir polygons applied in this study represent the maximum water extents. In addition, we found that the storage capacity of the CRD reservoirs increased at different area levels, with an average increase of 54.28 km3.
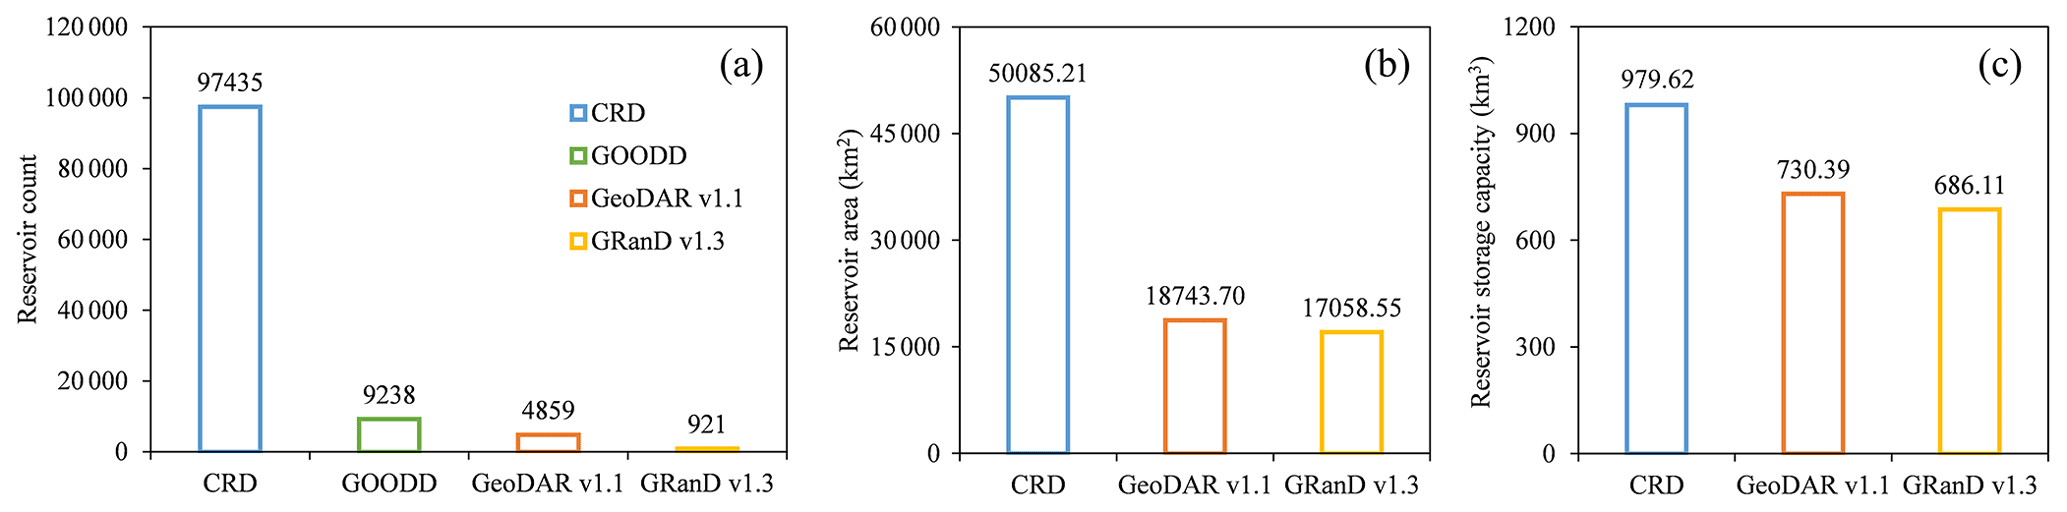
Figure 8Comparison of reservoirs in count (a), area (b), and storage capacity (c) between the CRD database, GOODD, GeoDAR v1.1, and GRanD v1.3 database.
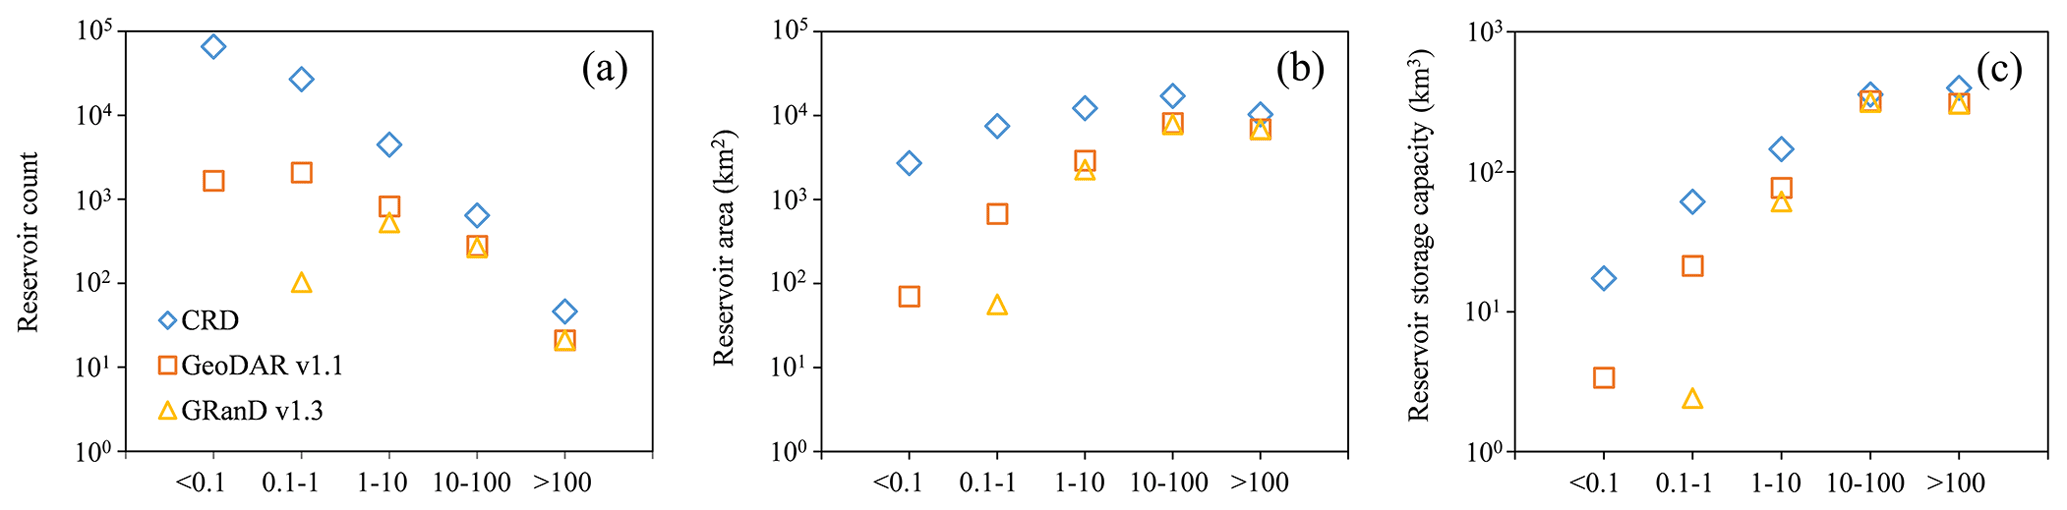
Figure 9Comparison of reservoirs in count (a), area (b), and storage capacity (c) between the CRD database, GeoDAR v1.1, and GRanD v1.3 database with different area levels.
Figure 10a shows the distribution of large reservoirs (storage capacity larger than 3 ×10⁶ m3) in the upper reaches of the Yangtze River in GRanD v1.3, GeoDAR v1.2, and the CRD. Because the GOODD dataset is limited by the basic property (reservoir storage capacity and dam height), it was not included in this comparison. GeoDAR v1.2 incorporates GRanD v1.3 so that the pattern of large reservoirs in the upper Yangtze River is generally comparable between the two databases. Compared with GRanD v1.3 and GeoDAR v1.2, CRD has added 16 large reservoirs in the upper reaches of the Yangtze River, with a total storage capacity of 52.60 km3, of which the total storage capacity of new reservoirs constructed in the past 5 years accounted for 77.00 % (40.50 km3). The large reservoirs dominate the total storage capacity in the basin. Therefore, the increase in new large reservoirs dammed in recent years is one of the major differences of the CRD in the storage capacity. As shown in Fig. 10b–c, GRanD v1.3, GeoDAR v1.2, GOODD, and the CRD can all digitize reservoirs on rivers with catchments of more than 10 km2. However, many smaller reservoirs were not compiled in GRanD v1.3, GeoDAR v1.2, and GOODD.
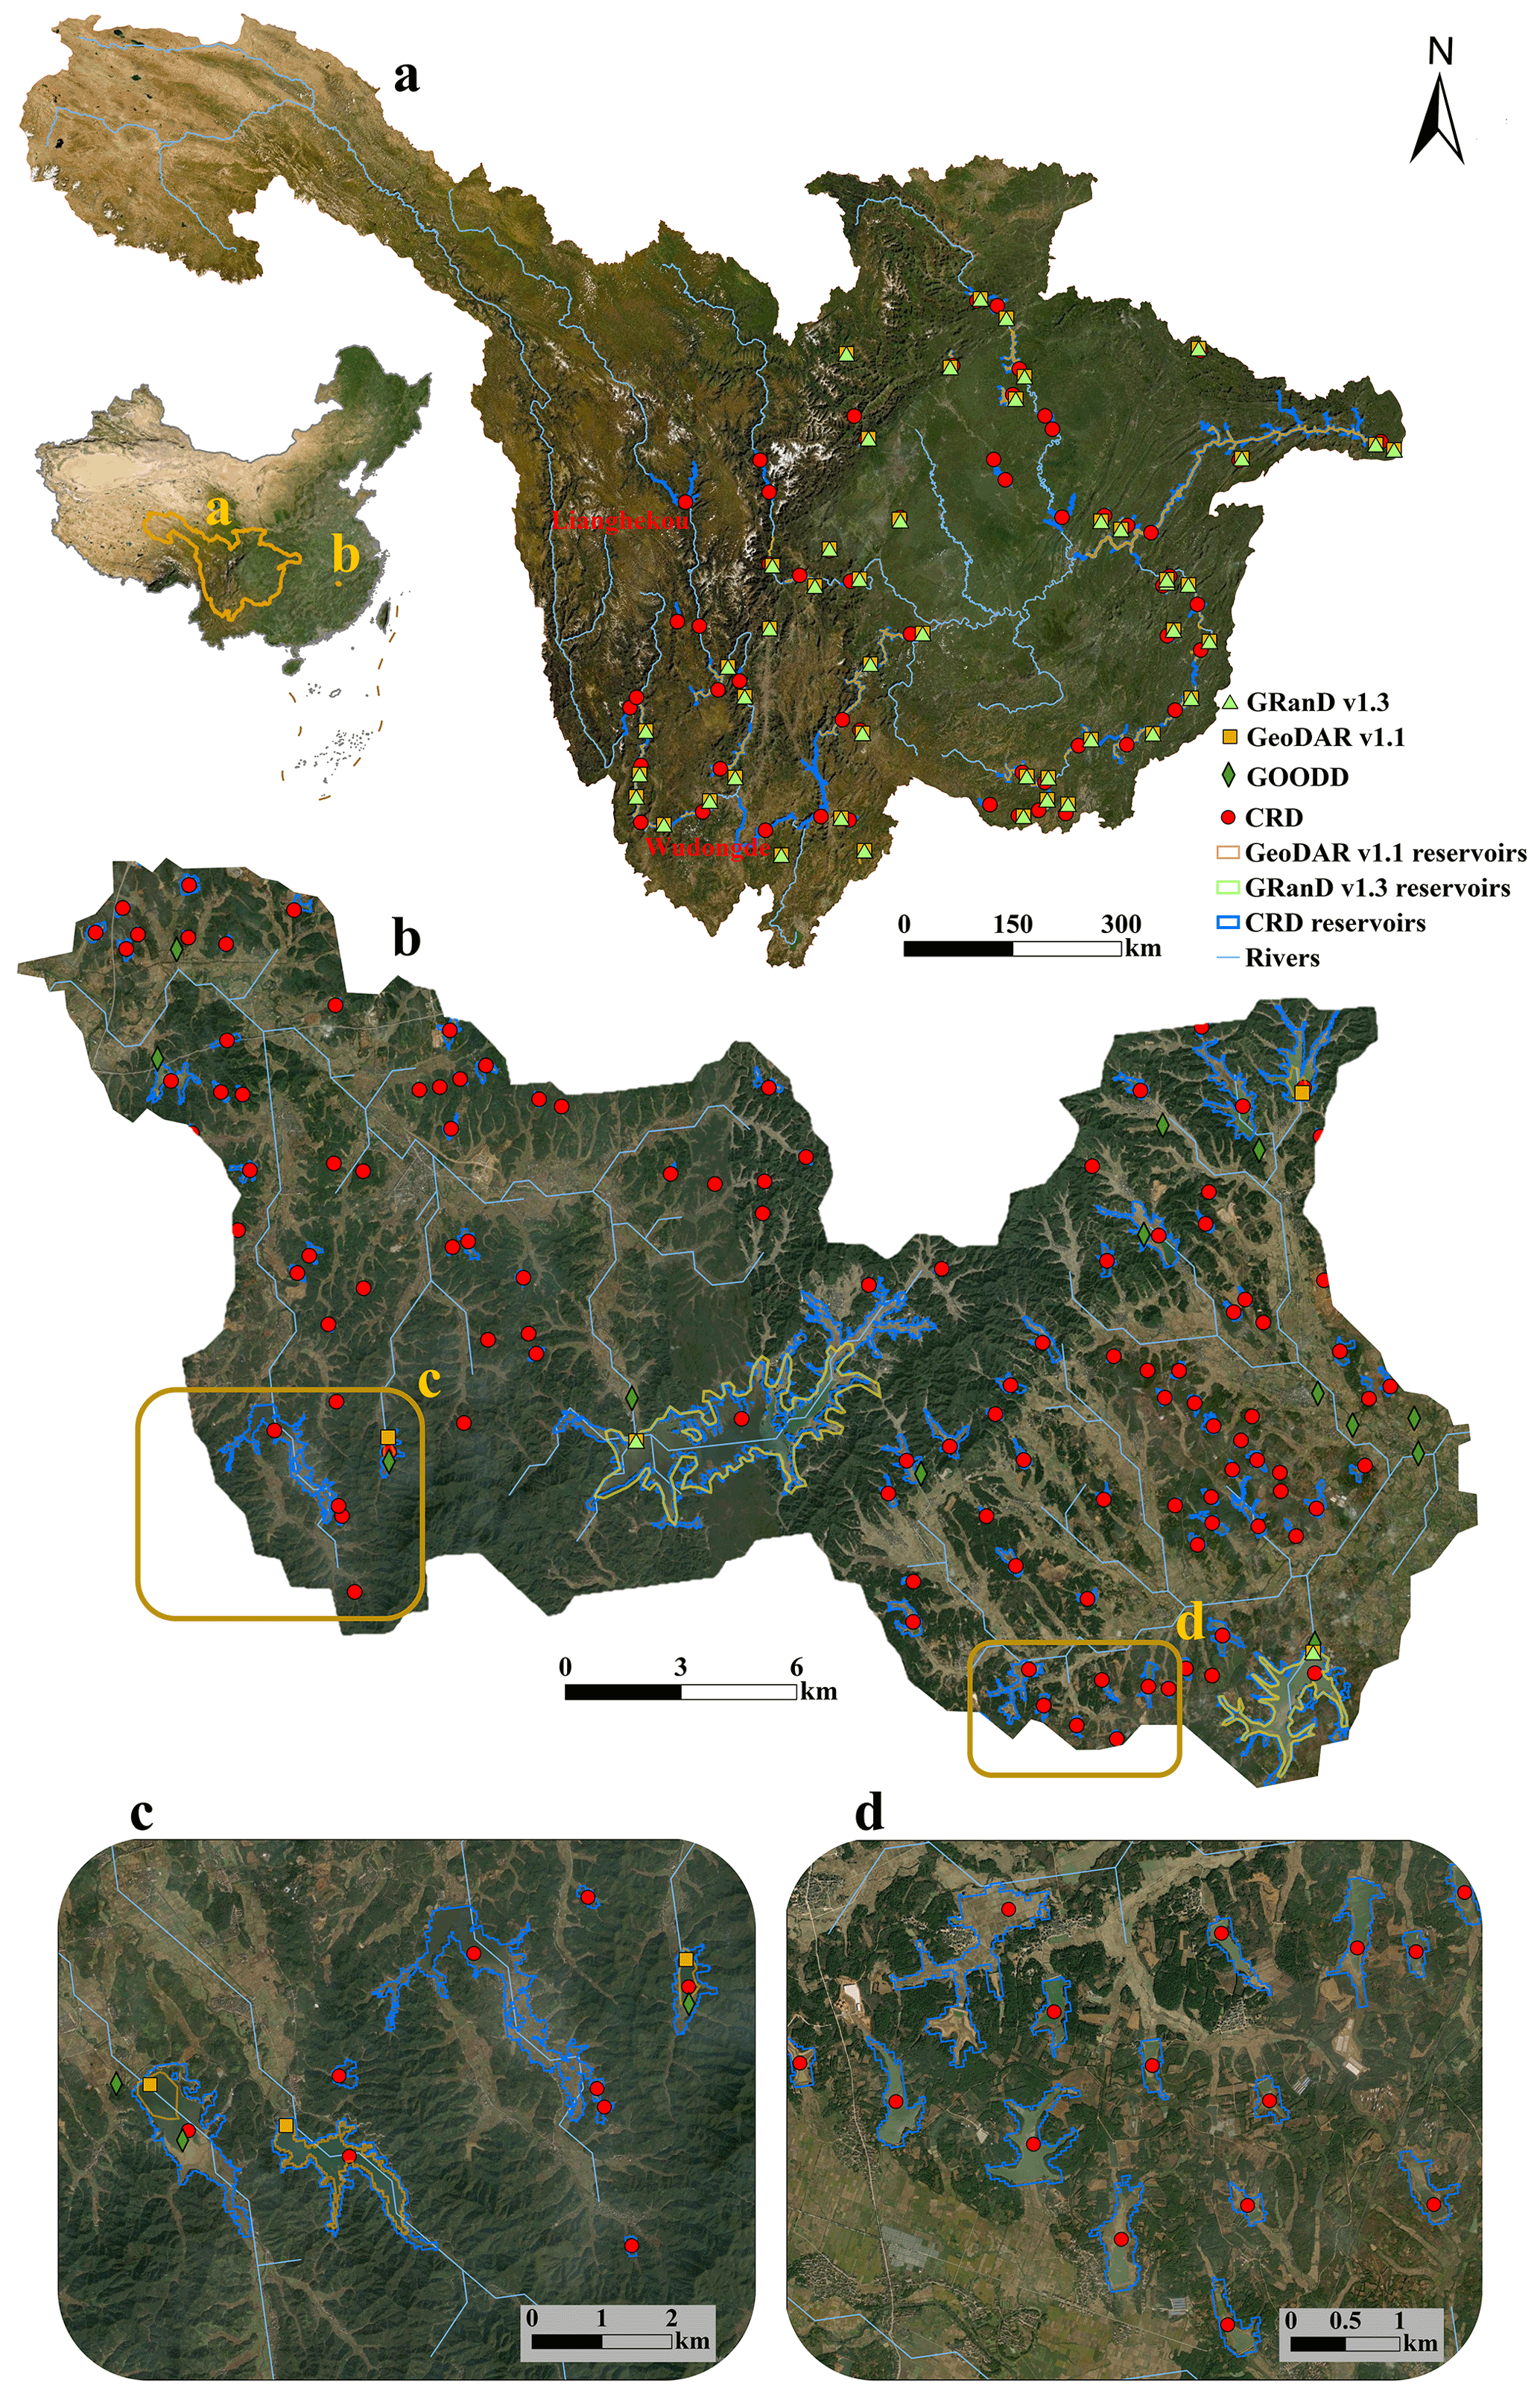
Figure 10Comparisons between GRanD v1.3, GeoDAR v1.2, GOODD, and the CRD in selected regions of China. Distribution of the large reservoirs (storage capacity larger than 3 ×10⁶ m3) in the upper reaches of Yangtze River (a). Distribution of reservoirs in GRanD v1.3, GeoDAR v1.2, GOODD, and the CRD in a 10-level sub-basin of Poyang Lake (b–d). Bright green triangles, orange squares, dark green diamonds, and red dots represent GRanD v1.3, GeoDAR v1.2, GOODD, and the CRD, respectively. Background image source: Esri imagery base map.
5.2 Analysis on the accumulation hotspots of the CRD reservoir distribution
The construction of hydropower stations alleviates the energy shortage in China, reduces the consumption of non-renewable coal energy, and makes a great contribution to the sustainable development of China's economy and society. To further understand the characteristics of reservoir accumulation distribution in China, we quantified the degree of reservoir accumulation from the dimensions of the count, area, and storage, respectively.
Figure 11 shows the reservoir accumulation degree in the count, area, and storage capacity of the CRD reservoirs. High reservoir density hotspots can be observed in the Yangtze River's middle and lower reaches, mainly in the Poyang Lake and Dongting Lake basins. These two lake basins have rugged terrains, which provide topographic convenience for constructing reservoirs. Besides, the basins are densely populated and are an important commodity grain base, so reservoirs are critical to meeting the agricultural irrigation water demand. The large labor force also facilitated reservoir construction. The construction of small and medium-sized reservoirs in China reached a peak under the impact of the new and old “three pillars” policy from the founding of the People's Republic of China in 1949 to the reform and openness in 1978.
Figure 11b shows that the hotspots in the reservoir area are mainly distributed in the Yangtze River, northeastern China, and the Huaihe River, where the terrain is relatively flat. Combined with the boom of building small reservoirs throughout the country during the Great Leap Forward period, the practice of “one piece of land for one piece of sky” even appeared in the Huaibei Plain, resulting in many reservoirs and a large total area in the Huaihe River. Compared with the storage accumulation hotspots shown in Fig. 8c, we found that large reservoirs are mostly localized in the upper reaches of the Yangtze River and the Pearl River. It is mainly because Chinese reservoir construction entered the era of a big hydropower project in the 21st century. With the construction of Xiaolangdi Reservoir, Three Gorges Reservoir, and other large hydropower stations as examples, China has built a series of large reservoirs in the southwest of China, where there are large elevation drops and abundant stream powers, such as the Jinsha River (the upper reaches of the Yangtze River), the upper reaches of the Pearl River, and the upper reaches of the Lancang River.
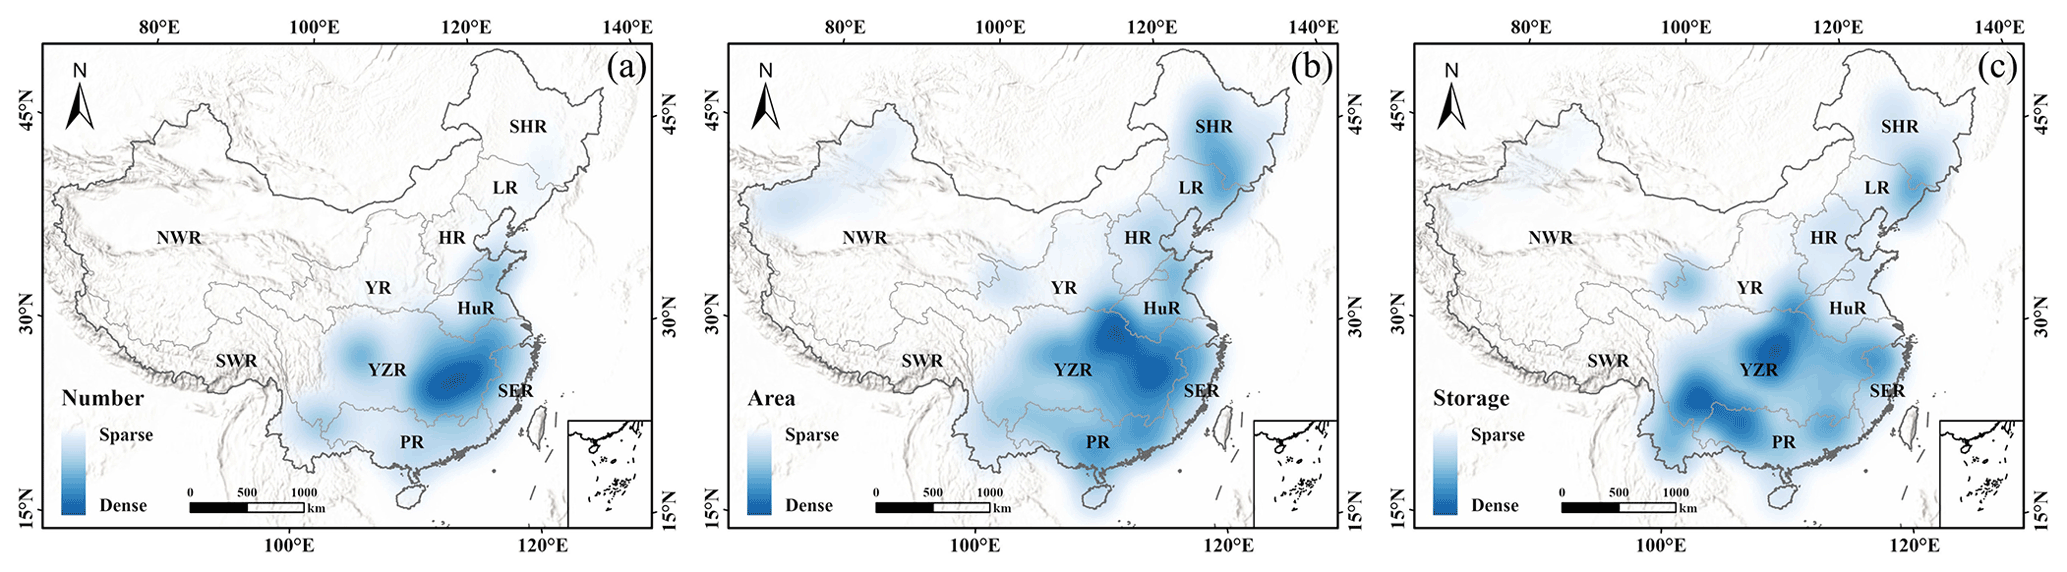
Figure 11Distribution map of the accumulation degree of the reservoir count (a), area (b), and storage capacity (c) in the CRD.
The China Reservoir Database (CRD) is publicly available for download from a Zenodo repository https://doi.org/10.5281/zenodo.6984619 (Song et al., 2022). The database is supplied in both shapefile format and the comma-separated values (csv) format.
In this study, the location information of a total of 97 435 reservoirs in China has been identified and collected in the China Reservoir Dataset (CRD) by compiling multiple existing dam/reservoir products, national basic geographic datasets, multi-source open map data, and multi-level government yearbooks and databases. Then, by merging three remote sensing waterbody products, the maximum water inundation area was extracted for each of the identified reservoirs. Based on a collection of 5143 reservoirs with official storage capacity records, an empirical model fitting the reservoir area–storage relationship was established to estimate the storage capacities of other unrecorded reservoirs in the CRD. The compiled reservoirs in the CRD have a total maximum inundation area of 50 085.21 km2 and a total storage capacity of about 979.62 km3 (924.96–1060.59 km3).
Based on the CRD database, the spatial distribution characteristics of reservoir count, area, and storage capacity were comprehensively analyzed and compared. In addition, we discussed the major updates of the CRD over Chinese territory compared with other commonly used global dam/reservoir databases and the potential causes of several hotspots of the reservoir concentration in the context of China's socioeconomic development and major policy implementations. The results show that reservoirs are widely distributed across China, yet there are strong spatial heterogeneities with several concentration hotspots. The Yangtze River basin has the most dominant distribution in terms of reservoir count, area, and storage capacity. Specifically, the reservoirs are mainly concentrated in the basins of Dongting Lake, Poyang Lake, and the Han River, the middle and lower reaches of the Huaihe River and the Yangtze River, the Shandong Peninsula, the Sichuan Basin, and the Yunnan–Guizhou Plateau. The CRD database has greatly improved the reservoir mapping in terms of count, area, and storage capacity compared with existing dam/reservoir products over the territorial area of China. The prominent advantage of the CRD could be a complete map of reservoirs smaller than 1 km2. The CRD database can be used for a wide range of reservoir impact assessments and is expected to benefit water resources management, river system investigation, hydrological modeling, and other aspects in scientific research and sector practices.
This work was conceptualized by CS and JZ. The data curation, formal analysis, and investigation were done by CS, CF, and JZ. The methodology was developed by CS, CF, JZ, and JW. The programming was done by CS, CF, and JZ. CS, JW, and YS supervised, and CS acquired the funding, administered the project, and assured the quality. The quality control was done by CS, CF, JZ, JW, YS, KL, TC, PZ, SL, CY, and LK, and the validation was done by CS, CF, JQ, KL, TC, PZ, SL, CY, and LK. CS and CF visualized the project and prepared the original draft. CS, CF, JZ, JW, YS, KL, TC, and LK wrote the paper. CS and LK reviewed and edited the paper, while CF, JZ, JW, YS, KL, and TC reviewed and revised the paper.
The contact author has declared that none of the authors has any competing interests.
Publisher's note: Copernicus Publications remains neutral with regard to jurisdictional claims in published maps and institutional affiliations.
The authors express their gratitude to the support from the GRanD, GOODD, GeoDAR, FHReD, and the national 1:250 000 public basic geographic datasets. The authors would like to acknowledge Tiandi Map, for providing a base map and the geocoding API (https://map.tianditu.gov.cn/, last access: 16 January 2022). The authors are also grateful to the GSW, GLAD, and FROM-GLC10 data, for providing reservoir water inundation extent, and the Almanac of China's Water Power and other Chinese government documents, for providing the reservoir storage capacity records. This work was partly funded by the National Key Research and Development Program of China (grant nos. 2018YFD0900804, 2019YFA0607101, and 2018YFD1100101), the Strategic Priority Research Program of the Chinese Academy of Sciences (grant no. XDA23100102), and the National Natural Science Foundation of China (grant no. 41971403).
This research has been supported by the National Key Research and Development Program of China (grant nos. 2018YFD0900804, 2019YFA0607101, and 2018YFD1100101).
This paper was edited by Hanqin Tian and reviewed by Dai Yamazaki and one anonymous referee.
Aufdenkampe, A. K., Mayorga, E., Raymond, P. A., Melack, J. M., Doney, S. C., Alin, S. R., Aalto, R. E., and Yoo, K.: Riverine coupling of biogeochemical cycles between land, oceans, and atmosphere, Front. Ecol. Environ., 9, 53-60, 2011.
Bakken, T. H., Killingtveit, Å., Engeland, K., Alfredsen, K., and Harby, A.: Water consumption from hydropower plants – review of published estimates and an assessment of the concept, Hydrol. Earth Syst. Sci., 17, 3983–4000, https://doi.org/10.5194/hess-17-3983-2013, 2013.
Bakken, T. H., Modahl, I. S., Raadal, H. L., Bustos, A. A., and Arnøy, S.: Allocation of water consumption in multipurpose reservoirs, Water Policy, 18, 932–947, 2016.
Barbarossa, V., Schmitt, R. J., Huijbregts, M. A., Zarfl, C., King, H., and Schipper, A. M.: Impacts of current and future large dams on the geographic range connectivity of freshwater fish worldwide, P. Natl. Acad. Sci. USA, 117, 3648–3655, 2020.
Barros, N., Cole, J. J., Tranvik, L. J., Prairie, Y. T., Bastviken, D., Huszar, V. L., Del Giorgio, P., and Roland, F.: Carbon emission from hydroelectric reservoirs linked to reservoir age and latitude, Nat. Geosci., 4, 593–596, 2011.
Bednarek, A. T.: Undamming rivers: a review of the ecological impacts of dam removal, Environ. Manage., 27, 803–814, 2001.
Belletti, B., Garcia de Leaniz, C., Jones, J., Bizzi, S., Börger, L., Segura, G., Castelletti, A., Van de Bund, W., Aarestrup, K., and Barry, J.: More than one million barriers fragment Europe's rivers, Nature, 588, 436–441, 2020.
Bertoni, F., Castelletti, A., Giuliani, M., and Reed, P.: Discovering dependencies, trade-offs, and robustness in joint dam design and operation: An ex-post assessment of the Kariba Dam, Earth's Future, 7, 1367–1390, 2019.
Biemans, H., Haddeland, I., Kabat, P., Ludwig, F., Hutjes, R., Heinke, J., von Bloh, W., and Gerten, D.: Impact of reservoirs on river discharge and irrigation water supply during the 20th century, Water Resour. Res., 47, https://doi.org/10.1029/2009WR008929, 2011.
Bond, N. and Cottingham, P.: Ecology and hydrology of temporary streams: implications for sustainable water management, Canberra (Australia), eWater Technical Report, 29, https://www.ewatercrc.com.au/ (last access: 1 May 2022), 2008.
Boulange, J., Hanasaki, N., Yamazaki, D., and Pokhrel, Y.: Role of dams in reducing global flood exposure under climate change, Nat. Commun., 12, 1–7, 2021.
Carpenter, S. R., Stanley, E. H., and Vander Zanden, M. J.: State of the world's freshwater ecosystems: physical, chemical, and biological changes, Annu. Rev. Env. Resour., 36, 75–99, 2011.
Chao, B. F., Wu, Y.-H., and Li, Y.: Impact of artificial reservoir water impoundment on global sea level, Science, 320, 212–214, 2008.
Deemer, B. R., Harrison, J. A., Li, S., Beaulieu, J. J., DelSontro, T., Barros, N., Bezerra-Neto, J. F., Powers, S. M., Dos Santos, M. A., and Vonk, J. A.: Greenhouse gas emissions from reservoir water surfaces: a new global synthesis, BioScience, 66, 949–964, 2016.
Degu, A. M., Hossain, F., Niyogi, D., Pielke Sr, R., Shepherd, J. M., Voisin, N., and Chronis, T.: The influence of large dams on surrounding climate and precipitation patterns, Geophys. Res. Lett., 38, https://doi.org/10.1029/2010GL046482, 2011.
Di Baldassarre, G., Martinez, F., Kalantari, Z., and Viglione, A.: Drought and flood in the Anthropocene: feedback mechanisms in reservoir operation, Earth Syst. Dynam., 8, 225–233, https://doi.org/10.5194/esd-8-225-2017, 2017.
Dorber, M., Arvesen, A., Gernaat, D., and Verones, F.: Controlling biodiversity impacts of future global hydropower reservoirs by strategic site selection, Sci. Rep.-UK, 10, 1–13, 2020.
Downing, J. A., Prairie, Y., Cole, J., Duarte, C., Tranvik, L., Striegl, R. G., McDowell, W., Kortelainen, P., Caraco, N., and Melack, J.: The global abundance and size distribution of lakes, ponds, and impoundments, Limnol. Oceanogr., 51, 2388–2397, 2006.
Döll, P., Fiedler, K., and Zhang, J.: Global-scale analysis of river flow alterations due to water withdrawals and reservoirs, Hydrol. Earth Syst. Sci., 13, 2413–2432, https://doi.org/10.5194/hess-13-2413-2009, 2009.
Ehsani, N., Vörösmarty, C. J., Fekete, B. M., and Stakhiv, E. Z.: Reservoir operations under climate change: Storage capacity options to mitigate risk, J. Hydrol., 555, 435–446, 2017.
Elmer, F., Hoymann, J., Düthmann, D., Vorogushyn, S., and Kreibich, H.: Drivers of flood risk change in residential areas, Nat. Hazards Earth Syst. Sci., 12, 1641–1657, https://doi.org/10.5194/nhess-12-1641-2012, 2012.
Gernaat, D. E., Bogaart, P. W., Vuuren, D. P. V., Biemans, H., and Niessink, R.: High-resolution assessment of global technical and economic hydropower potential, Nature Energy, 2, 821–828, 2017.
Gong, P., Liu, H., Zhang, M., Li, C., Wang, J., Huang, H., Clinton, N., Ji, L., Li, W., Bai, Y., Chen, B., Xu, B., Zhu, Z., Yuan, C., Ping Suen, H., Guo, J., Xu, N., Li, W., Zhao, Y., Yang, J., Yu, C., Wang, X., Fu, H., Yu, L., Dronova, I., Hui, F., Cheng, X., Shi, X., Xiao, F., Liu, Q., and Song, L.: Stable classification with limited sample: transferring a 30-m resolution sample set collected in 2015 to mapping 10-m resolution global land cover in 2017, Sci. Bull., 64, 370–373, 10.1016/j.scib.2019.03.002, 2019.
Grill, G., Lehner, B., Thieme, M., Geenen, B., Tickner, D., Antonelli, F., Babu, S., Borrelli, P., Cheng, L., and Crochetiere, H.: Mapping the world's free-flowing rivers, Nature, 569, 215–221, 2019.
Gutenson, J. L., Tavakoly, A. A., Wahl, M. D., and Follum, M. L.: Comparison of generalized non-data-driven lake and reservoir routing models for global-scale hydrologic forecasting of reservoir outflow at diurnal time steps, Hydrol. Earth Syst. Sci., 24, 2711–2729, https://doi.org/10.5194/hess-24-2711-2020, 2020.
ICOLD and CIGB: Commission Internationale des Grands Barrages-International Comission on Large Dams, Recuperado el, 17, https://www.icold-cigb.net (last access: 2 March 2022), 2011.
Jiang, W., Wang, H., Liu, Y., Lei, B., Xia, J., and Zuo, Q.: China's Agricultural Water Security, Hu Bei Science & Technology Press, ISBN 9787570602346, 2018.
Latrubesse, E. M., Arima, E. Y., Dunne, T., Park, E., Baker, V. R., d'Horta, F. M., Wight, C., Wittmann, F., Zuanon, J., and Baker, P. A.: Damming the rivers of the Amazon basin, Nature, 546, 363–369, 2017.
Lehner, B. and Grill, G.: Global river hydrography and network routing: baseline data and new approaches to study the world's large river systems, Hydrol. Process., 27, 2171–2186, 2013.
Lehner, B., Liermann, C. R., Revenga, C., Vörösmarty, C., Fekete, B., Crouzet, P., Döll, P., Endejan, M., Frenken, K., and Magome, J.: High-resolution mapping of the world's reservoirs and dams for sustainable river-flow management, Front. Ecol. Environ., 9, 494–502, 2011.
Maavara, T., Chen, Q., Van Meter, K., Brown, L. E., Zhang, J., Ni, J., and Zarfl, C.: River dam impacts on biogeochemical cycling, Nature Reviews Earth & Environment, 1, 103–116, 2020.
Metin, A. D., Dung, N. V., Schröter, K., Guse, B., Apel, H., Kreibich, H., Vorogushyn, S., and Merz, B.: How do changes along the risk chain affect flood risk?, Nat. Hazards Earth Syst. Sci., 18, 3089–3108, https://doi.org/10.5194/nhess-18-3089-2018, 2018.
Moran, E. F., Lopez, M. C., Moore, N., Müller, N., and Hyndman, D. W.: Sustainable hydropower in the 21st century, P. Natl. Acad. Sci. USA, 115, 11891–11898, 2018.
Mulligan, M., van Soesbergen, A., and Sáenz, L.: GOODD, a global dataset of more than 38,000 georeferenced dams, Scientific Data, 7, 1–8, 2020.
MWR: Hydrologic Data Yearbook, Ministry of Water Resources (MWR), ISBN 9771009737167, 2016.
Nilsson, C. and Berggren, K.: Alterations of riparian ecosystems caused by river regulation: Dam operations have caused global-scale ecological changes in riparian ecosystems. How to protect river environments and human needs of rivers remains one of the most important questions of our time, BioScience, 50, 783–792, 2000.
Nilsson, C., Reidy, C. A., Dynesius, M., and Revenga, C.: Fragmentation and flow regulation of the world's large river systems, Science, 308, 405–408, 2005.
Pekel, J.-F., Cottam, A., Gorelick, N., and Belward, A. S.: High-resolution mapping of global surface water and its long-term changes, Nature, 540, 418–422, 2016.
Pickens, A. H., Hansen, M. C., Hancher, M., Stehman, S. V., Tyukavina, A., Potapov, P., Marroquin, B., and Sherani, Z.: Mapping and sampling to characterize global inland water dynamics from 1999 to 2018 with full Landsat time-series, Remote Sens. Environ., 243, 111792, https://doi.org/10.1016/j.rse.2020.111792, 2020.
Popescu, V. D., Munshaw, R. G., Shackelford, N., Montesino Pouzols, F., Dubman, E., Gibeau, P., Horne, M., Moilanen, A., and Palen, W. J.: Quantifying biodiversity trade-offs in the face of widespread renewable and unconventional energy development, Sci. Rep.-UK, 10, 1–12, 2020.
Postel, S.: Human alterations of Earth's fresh water, in: Proceedings of a Conference on Sustainability of Wetlands and Water Resources, 23–25 May, Oxford, Mississippi, edited by: Holland, Ma. M., Warren, M. L., and Stanturf, J. A., https://www.fs.usda.gov/treesearch/pubs/20123 (last access: 2 March 2022), 1–3, 2000.
Raymond, P. A., Hartmann, J., Lauerwald, R., Sobek, S., McDonald, C., Hoover, M., Butman, D., Striegl, R., Mayorga, E., and Humborg, C.: Global carbon dioxide emissions from inland waters, Nature, 503, 355–359, 2013.
Richter, B. D., Warner, A. T., Meyer, J. L., and Lutz, K.: A collaborative and adaptive process for developing environmental flow recommendations, River Res. Appl., 22, 297–318, 2006.
Sabo, J. L., Ruhi, A., Holtgrieve, G. W., Elliott, V., Arias, M. E., Ngor, P. B., Räsänen, T. A., and Nam, S.: Designing river flows to improve food security futures in the Lower Mekong Basin, Science, 358, eaao1053, https://doi.org/10.1126/science.aao1053, 2017.
St. Louis, V. L., Kelly, C. A., Duchemin, É., Rudd, J. W., and Rosenberg, D. M.: Reservoir Surfaces as Sources of Greenhouse Gases to the Atmosphere: A Global Estimate: Reservoirs are sources of greenhouse gases to the atmosphere, and their surface areas have increased to the point where they should be included in global inventories of anthropogenic emissions of greenhouse gases, BioScience, 50, 766–775, 2000.
Stoate, C., Baldi, A., Beja, P., Boatman, N., Herzon, I., Van Doorn, A., De Snoo, G., Rakosy, L., and Ramwell, C.: Ecological impacts of early 21st century agricultural change in Europe–a review, J. Environ. Manage., 91, 22–46, 2009.
Song, C., Fan, C., Zhu, J., Wang, J., Sheng, Y., Liu, K., Chen, T., Zhan, P., Luo, S., and Ke, L.: A comprehensive geospatial database of nearly 100,000 reservoirs in China, Zenodo [data set], https://doi.org/10.5281/zenodo.6984619, 2022.
Tilt, B., Braun, Y., and He, D.: Social impacts of large dam projects: A comparison of international case studies and implications for best practice, J. Environ. Manage., 90, S249–S257, 2009.
Van Manh, N., Dung, N. V., Hung, N. N., Kummu, M., Merz, B., and Apel, H.: Future sediment dynamics in the Mekong Delta floodplains: Impacts of hydropower development, climate change and sea level rise, Global Planet. Change, 127, 22–33, 2015.
Veldkamp, T., Wada, Y., Aerts, J., Döll, P., Gosling, S. N., Liu, J., Masaki, Y., Oki, T., Ostberg, S., and Pokhrel, Y.: Water scarcity hotspots travel downstream due to human interventions in the 20th and 21st century, Nat. Commun., 8, 1–12, 2017.
Vörösmarty, C. J., Meybeck, M., Fekete, B., Sharma, K., Green, P., and Syvitski, J. P.: Anthropogenic sediment retention: major global impact from registered river impoundments, Global Planet. Change, 39, 169–190, 2003.
Wada, Y., Reager, J. T., Chao, B. F., Wang, J., Lo, M.-H., Song, C., Li, Y., and Gardner, A. S.: Recent changes in land water storage and its contribution to sea level variations, Surv. Geophys., 38, 131–152, 2017.
Wang, J., Sheng, Y., Gleason, C. J., and Wada, Y.: Downstream Yangtze River levels impacted by Three Gorges Dam, Environ. Res. Lett., 8, 4, https://doi.org/10.1088/1748-9326/8/4/044012, 2013.
Wang, J., Sheng, Y., and Wada, Y.: Little impact of Three Gorges Dam on recent decadal lake decline across China's Yangtze Plain, Water Resour. Res., 53, 3854–3877, https://doi.org/10.1002/2016WR019817, 2017.
Wang, J., Walter, B. A., Yao, F., Song, C., Ding, M., Maroof, A. S., Zhu, J., Fan, C., McAlister, J. M., Sikder, S., Sheng, Y., Allen, G. H., Crétaux, J.-F., and Wada, Y.: GeoDAR: georeferenced global dams and reservoirs dataset for bridging attributes and geolocations, Earth Syst. Sci. Data, 14, 1869–1899, https://doi.org/10.5194/essd-14-1869-2022, 2022.
Wang, W., Lu, H., Ruby Leung, L., Li, H. Y., Zhao, J., Tian, F., Yang, K., and Sothea, K.: Dam construction in Lancang-Mekong River Basin could mitigate future flood risk from warming-induced intensified rainfall, Geophys. Res. Lett., 44, 10378–10386, 2017.
Winemiller, K. O., McIntyre, P. B., Castello, L., Fluet-Chouinard, E., Giarrizzo, T., Nam, S., Baird, I., Darwall, W., Lujan, N., and Harrison, I.: Balancing hydropower and biodiversity in the Amazon, Congo, and Mekong, Science, 351, 128–129, 2016.
Xu, X., Tan, Y., and Yang, G.: Environmental impact assessments of the Three Gorges Project in China: Issues and interventions, Earth-Sci. Rev., 124, 115–125, 2013.
Zarfl, C., Lumsdon, A. E., Berlekamp, J., Tydecks, L., and Tockner, K.: A global boom in hydropower dam construction, Aquat. Sci., 77, 161–170, https://doi.org/10.1007/s00027-014-0377-0, 2015.
Zarfl, C., Berlekamp, J., He, F., Jähnig, S. C., Darwall, W., and Tockner, K.: Future large hydropower dams impact global freshwater megafauna, Sci. Rep.-UK, 9, 1–10, 2019.
Zhang, L., Xiao, T., He, J., and Chen, C.: Erosion-based analysis of breaching of Baige landslide dams on the Jinsha River, China, in 2018, Landslides, 16, 1965–1979, 2019.