the Creative Commons Attribution 4.0 License.
the Creative Commons Attribution 4.0 License.
 | 31 Jan 2022
High-resolution inventory of atmospheric emissions from transport, industrial, energy, mining and residential activities in Chile
Nicolás Álamos
Nicolás Huneeus
Mariel Opazo
Mauricio Osses
Sebastián Puja
Nicolás Pantoja
Hugo Denier van der Gon
Alejandra Schueftan
René Reyes
Rubén Calvo
This study presents the first high-resolution national inventory of anthropogenic emissions for Chile (Inventario Nacional de Emisiones Antropogénicas, INEMA). Emissions for the vehicular, industrial, energy, mining and residential sectors are estimated for the period 2015–2017 and spatially distributed onto a high-resolution grid (approximately 1 km×1 km). The pollutants included are CO2, NOx, SO2, CO, VOCs (volatile organic compounds), NH3 and particulate matter (PM10 and PM2.5) for all sectors. CH4 and black carbon are included for transport and residential sources, while arsenic, benzene, mercury, lead, toluene, and polychlorinated dibenzo-p-dioxins and furan (PCDD/F) are estimated for energy, mining and industrial sources. New activity data and emissions factors are compiled to estimate emissions, which are subsequently spatially distributed using census data and Chile's road network information.
The estimated annual average total national emissions of PM10 and PM2.5 during the study period are 191 and 173kt a−1 (kilotons per year), respectively. The residential sector is responsible for over 90 % of these emissions. This sector also emits 81 % and 87 % of total CO and VOC, respectively. On the other hand, the energy and industry sectors contribute significantly to NH3, SO2 and CO2 emissions, while the transport sector dominates NOx and CO2 emissions, and the mining sector dominates SO2 emissions. In general, emissions of anthropogenic air pollutants and CO2 in northern Chile are dominated by mining activities as well as thermoelectric power plants, while in central Chile the dominant sources are transport and residential emissions. The latter also mostly dominates emissions in southern Chile, which has a much colder climate. Preliminary analysis revealed the dominant role of the emission factors in the final emission uncertainty. Nevertheless, uncertainty in activity data also contributes as suggested by the difference in CO2 emissions between INEMA and EDGAR (Emission Database for Global Atmospheric Research). A comparison between these two inventories also revealed considerable differences for all pollutants in terms of magnitude and sectoral contribution, especially for the residential sector. EDGAR presents larger emissions for most of the pollutants except for CH4 and PM2.5. The differences between both inventories can partly be explained by the use of different emission factors, in particular for the residential sector, where emission factors incorporate information on firewood and local operation conditions. Although both inventories use similar emission factors, differences in CO2 emissions between both inventories indicate biases in the quantification of the activity.
This inventory (available at https://doi.org/10.5281/zenodo.4784286, Alamos et al., 2021) will support the design of policies that seek to mitigate climate change and improve air quality by providing policymakers, stakeholders and scientists with qualified scientific spatially explicit emission information.
- Article
(7275 KB) - Full-text XML
- BibTeX
- EndNote


Air pollution is one of the main environmental challenges in Chile; in 2018 more than 9 million of its people (out of a population of 17 million) were exposed to concentrations of fine particulate matter (PM2.5) above the national air quality standard (50 and 20 µg m−3 for annual and 24 h standards, respectively), and around 3640 cases of premature mortality were estimated due to cardiopulmonary diseases (MMA, 2019a). Urban areas of central and southern Chile are among the most polluted in Latin America with serious consequences for human health (Romero-Lankao et al., 2013) including an increase in hospital admissions and mortality associated with cardiovascular and respiratory diseases (WHO, 2016).
The current air pollution and climate change problems are directly related to atmospheric emissions of criteria pollutants – which affect air quality – and greenhouse gases (GHGs). Identifying the origin and estimating the emissions of these pollutants by source type is a prerequisite for quantifying the impact of anthropogenic activity on air quality and climate and thus developing effective mitigation strategies. Additionally, having GHG emissions and criteria pollutants consistent with each other is key in the design of policies that allow for addressing climate change and air quality in an integrated manner (Melamed et al., 2016).
Currently, emission inventories of GHG in Chile are produced within the framework of their nationally determined contributions (NDCs) as part of the commitments of the parties to the United Nations Framework Convention on Climate Change (UNFCCC). Emission inventories of criteria pollutants are developed for the most polluted cities within the framework of the decontamination plans to develop mitigation strategies to improve urban air quality. The national GHG emissions are prepared by a team of professionals from the Ministry of the Environment (MMA from Spanish for Ministerio del Medio Ambiente) responsible for the development and updating of the GHG emission inventories, whereas the decontamination plans are prepared by consultants hired on a case-by-case basis. Furthermore, while GHG inventories are performed consistently over the years, urban emission inventories of criteria pollutants are not necessarily consistent with previous versions and/or emission inventories of other cities. Additionally, the Pollutant Release and Transfer Register (RETC from Spanish for Registro de Emisiones y Transferencia de Contaminantes) from the MMA gathers the emission declaration from the industrial sector and combines it with emission estimates from the residential and transport sectors from different state agencies to build a national emission inventory. This information is available to the public through a dedicated web platform (http://www.retc.cl, last access: 12 March 2021).
While the national GHG inventory provides annual emissions at a national and regional scale, inventories of criteria pollutants provide annual emissions at the communal1 level in the case of RETC or for an entire city in the case of decontamination plans. Thus, none of these inventories have the spatial (gridded) resolution necessary for air quality modeling. Regional air quality (AQ) assessments in South America have relied on global emission inventories to understand the interactions between emissions, air quality and public health (e.g., Longo et al., 2013; Rosario et al., 2013; Klimont et al., 2017; UNEP/CCAC, 2018). Furthermore, a comparison of global emission inventories against city-scale emission inventories for five South American cities (namely, Buenos Aires, Bogotá, Lima, Rio de Janeiro and Santiago) revealed that although total emissions are in general comparable for these cities between the inventories, large differences exist for sectoral estimates (Huneeus et al., 2020a). Given that mitigation of air quality depends on identifying the dominating emission sectors, using global emission inventories is not recommended to define mitigation policies due to the risk of identifying the wrong target (Huneeus et al., 2020a). Therefore, national inventories built on local data are needed to understand the contribution of human activity to air quality and climate change and to design effective mitigation policies.
This paper presents the first gridded national inventory of anthropogenic emission for Chile of criteria pollutants as well as GHGs (hereafter INEMA from Spanish for Inventario Nacional de Emisiones Antropogénicas). The paper is structured as follows: the data and methodology used to estimate the emissions of each pollutant and sector are presented in Sect. 2, while in Sect. 3 the main results are shown, differentiating between the main pollutants and sectors that acquire relevance in the different regions of Chile. Discussion of the main results and uncertainty analysis of the estimated emissions are presented in Sect. 4. Finally, in Sect. 5 the main conclusions of this work are presented.
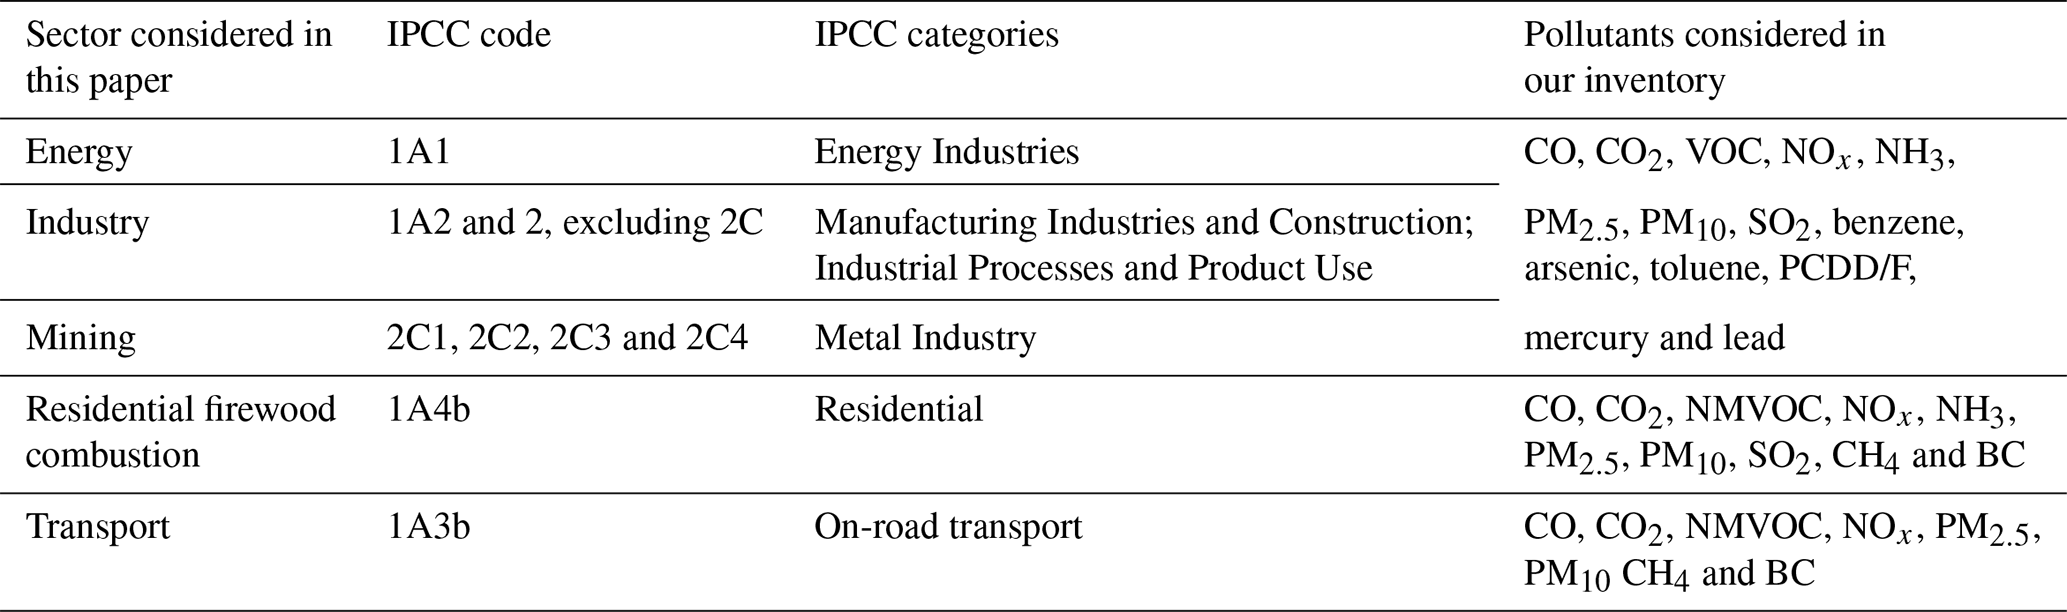
The INEMA inventory includes yearly emissions of carbon dioxide (CO2), nitrogen oxides (NOx), sulfur dioxide (SO2), carbon monoxide (CO), volatile organic compounds (VOCs), ammonia (NH3) and particulate matter (PM10 and PM2.5) from the residential (Sect. 2.2), industry (Sect. 2.3), energy (Sect. 2.3), mining (Sect. 2.3) and transport sectors (Sect. 2.4) for the years 2015 to 2017. Additionally, the residential and transport sectors include emission estimates of methane (CH4) and black carbon (BC), while for the industry, mining and energy sectors, emissions of arsenic, benzene, mercury, lead, toluene, and polychlorinated dibenzo-p-dioxins and furan (PCDD/F) are also reported. Emissions are grouped into sectors following the IPCC (2006a) classification (Table 1). It is important to clarify that in this inventory residential-emission estimations only consider firewood combustion, while IPCC code 1A4b considers all emissions from fuel combustion in households.
Table 1Pollutants and sectors considered in the Chilean inventory (INEMA) according to IPCC (2006a) classification.
Throughout this paper we will follow the EDGAR (Emission Database for Global Atmospheric Research) nomenclature and use the term “sectors” to refer to emission activities (Crippa et al., 2018). Furthermore, emissions of NOx correspond to emission of NO2+NO, and thus the units are kt NOx a−1, while for VOC and NMVOC (non-methane VOC) the corresponding units are kt VOC a−1 and kt NMVOC a−1.
The atmospheric emissions for each sector and pollutant are obtained by weighting the total activity level by an emission factor (EMEP/EEA, 2016), as shown in Eq. (1).
where Eizj is the total emission for species or pollutant i on year y and sector z; ALijz is the activity level of pollutant i, in sector z on year y; and EF is the emission factor for pollutant species i, type of source z. No interannual variability is assumed for the EFs. The following subsections present a detailed methodology and considerations for the estimations of each of the 2015–2017 emission sectors.
2.1 Study area
Chile spans from to S and has a population of over 19 million inhabitants. The administrative political division is made up of 16 regions containing 56 provinces and 346 communes, presenting considerable differences in size and population density. Furthermore, each commune contains urban and/or rural areas, with the exception of some purely urban communes in larger cities. The territory can be broken down into three large macrozones with distinctive climatic, geographical and demographic characteristics (Fig. 1). The north zone, with the regions of Arica and Parinacota, Tarapacá, Antofagasta, Atacama, and Coquimbo, has an arid climate and includes the presence of the Atacama Desert, the driest desert outside polar regions (Rondanelli et al., 2015). Between 32 and 38∘ S is the central zone with the regions of Valparaíso, Metropolitan, O'Higgins, Maule, Ñuble and Biobío. A Mediterranean climate with rainy winter and dry summer seasons prevails in this area. The regions of Araucanía, Los Ríos, Los Lagos, Aysén and Magallanes are located in the south zone, characterized by a temperate rainy climate, where low temperatures and abundant rainfall stand out. These conditions are accentuated further south, although the rainfall drastically decreases in the highest mountainous areas and south of the Strait of Magellan, where a tundra-type climate predominates (Sarricolea et al., 2017).
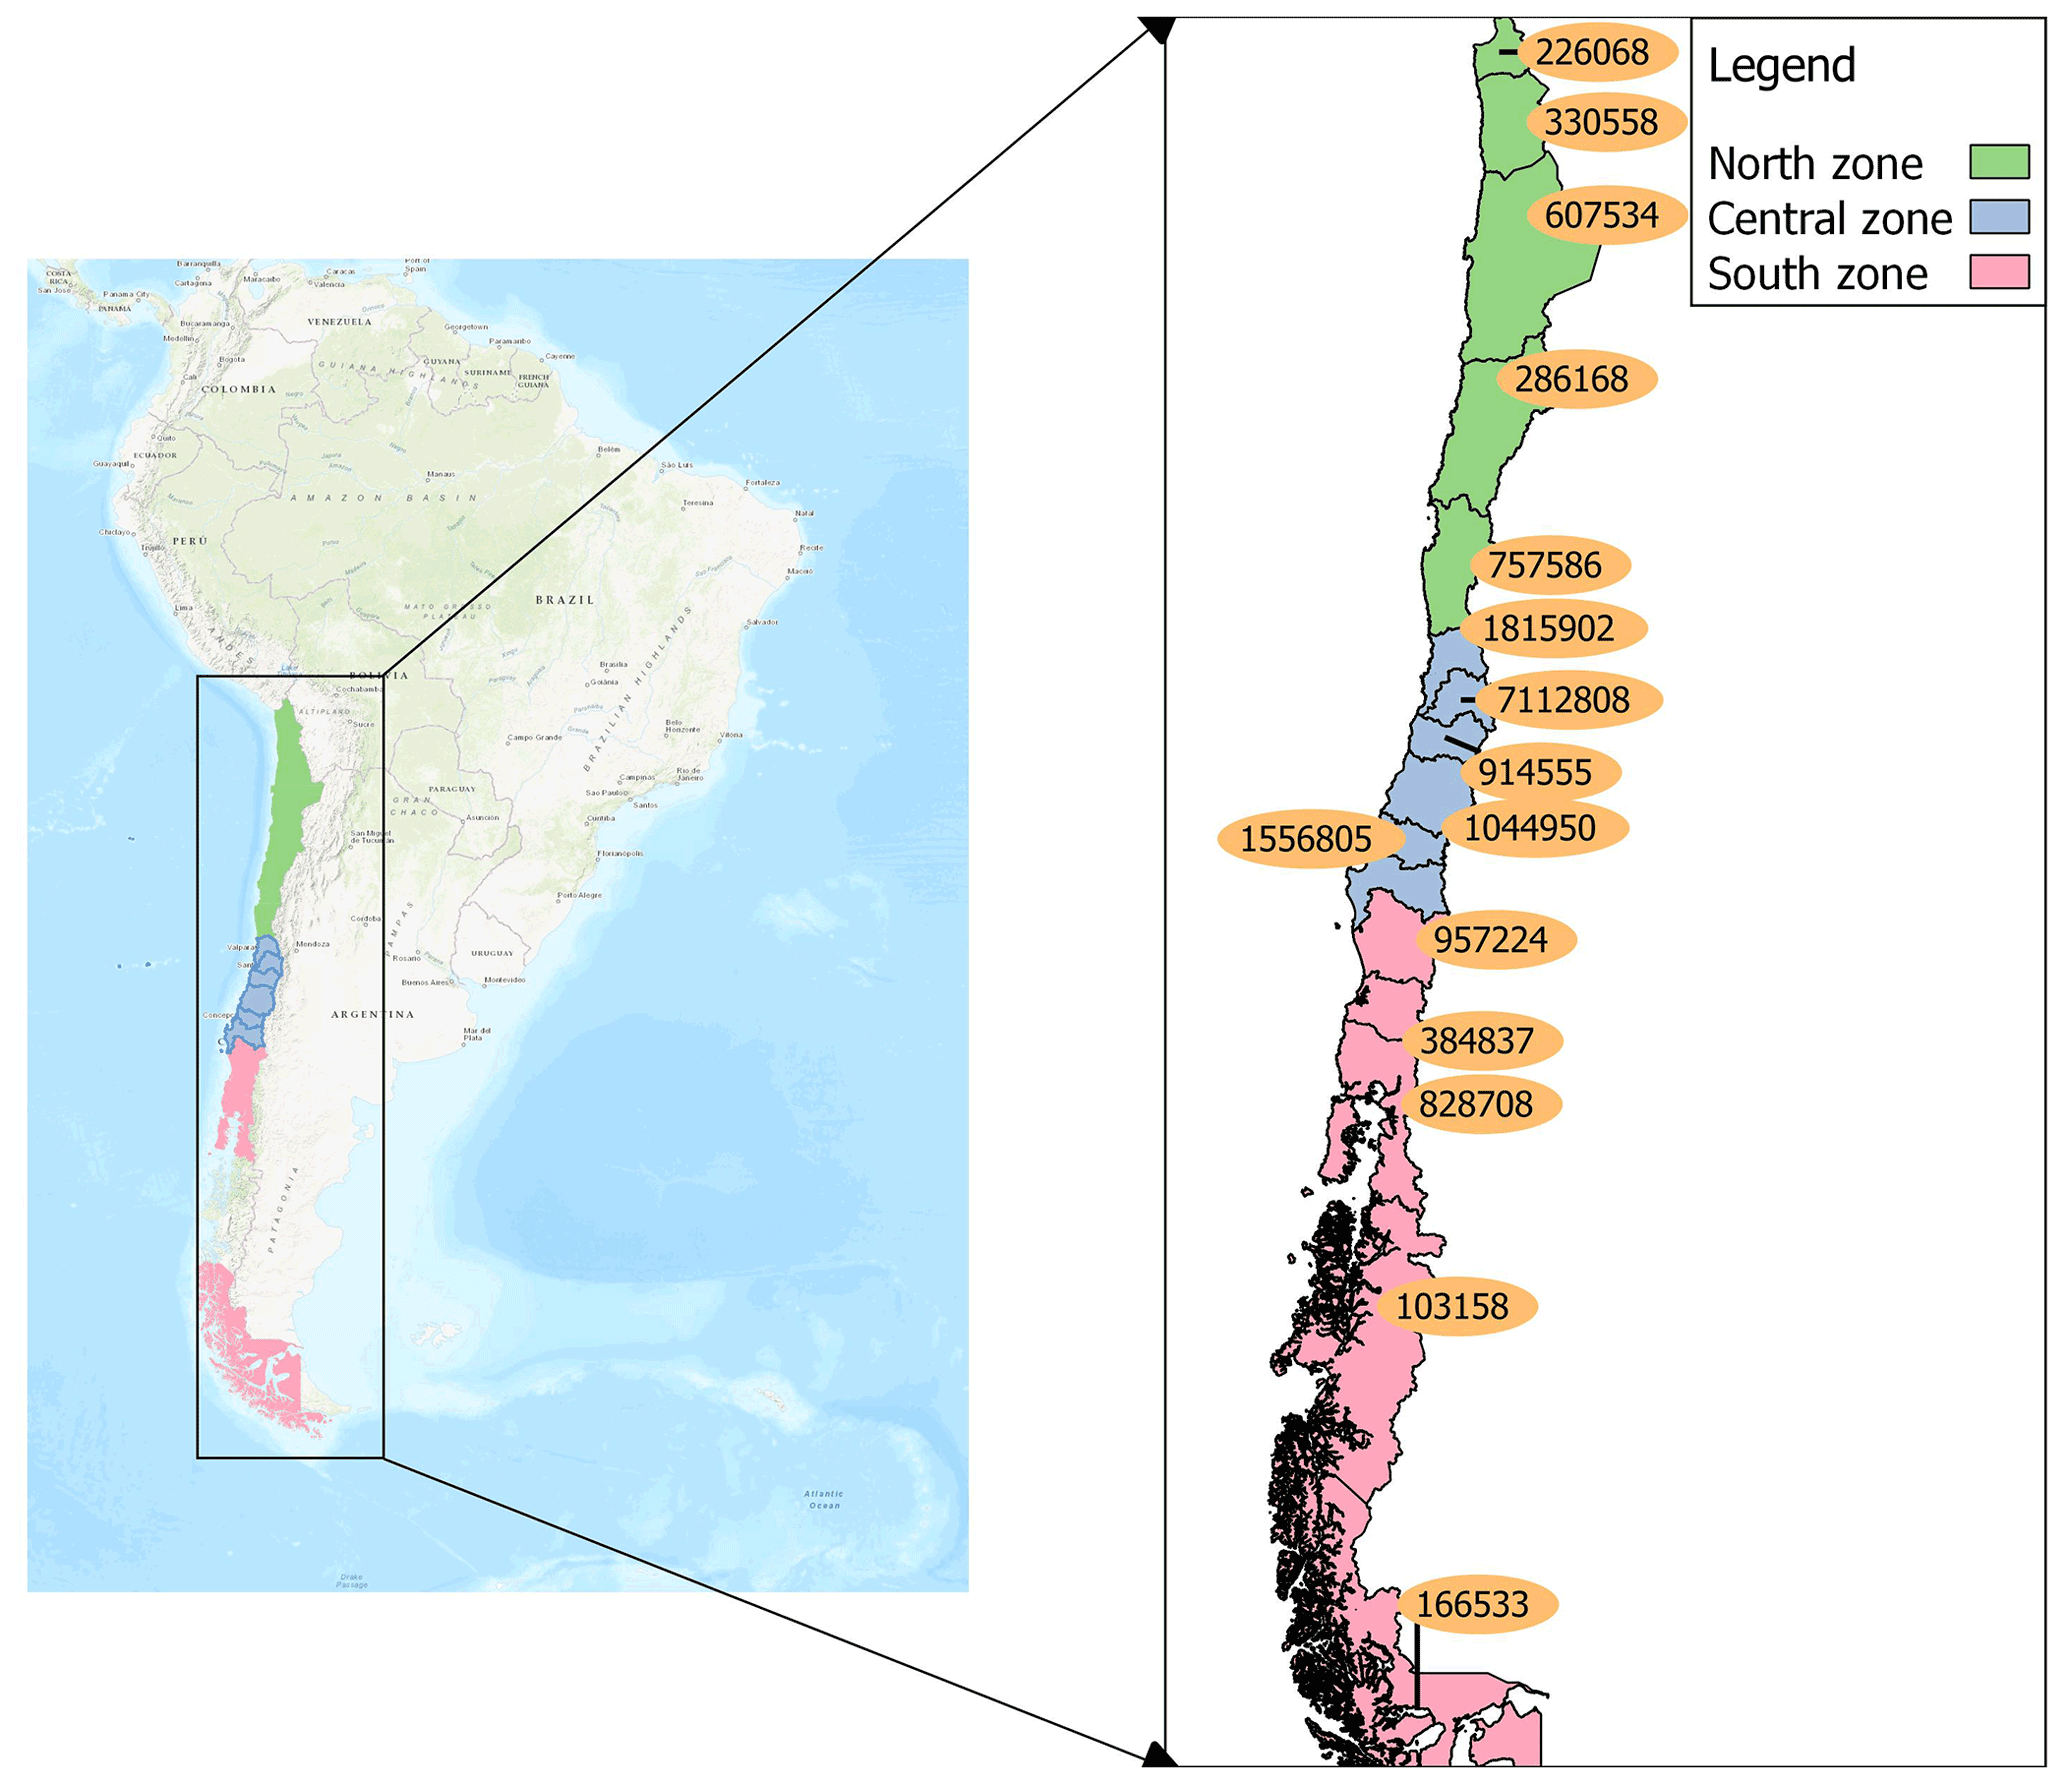
Figure 1Continental Chile highlighting three macrozones defined for the paper, namely the north (green), central (blue) and south zone (red). Divisions within each macrozone indicate limits of the 16 administrative regions. Population in each of these 16 regions is indicated in the orange ellipses.
2.2 Residential sector
Emissions from residential sources come from the combustion of all fuels used inside of homes, such as gasoline, kerosene and biomass, among others. However, in this first version of INEMA, the residential sector will focus on emissions from firewood combustion only given its dominant role in air quality in central and southern Chile (Saide et al., 2016; Huneeus et al., 2020b). The inclusion of additional fuels is left for future versions of this inventory.
Estimates for the residential sector include emissions from biomass combustion for heating, cooking and heating water. Firewood is acquired mostly through informal wood markets, and the few regular and consistent pieces of information that exist to characterize its consumption are collected through household surveys (REDPE, 2020). In this article, three studies with regional representation (conducted in the last 10 years) are used to estimate total firewood consumption in central and southern Chile.
The first one of the three aforementioned studies was conducted by the Universidad Austral de Chile (UACH). Firewood consumption in the residential sector was estimated based on existing studies for the years between 2005 and 2012 for each region in southern and central Chile (UACH, 2013; hereafter UACH13). Another study was mandated by the Ministry of Energy to the Corporation of Technological Development (CDT from Spanish for Corporación de Desarrollo Tecnológico; https://www.cdt.cl, last access: 30 June 2020), a private non-profit organization created in 1989 by the Chilean Construction Chamber. This study collected information on firewood consumption from the residential, commercial, public-service and industrial sectors for the entire Chilean territory for the year 2014. In each of the 16 Chilean regions, a total of 300 households in urban areas and 65 in rural ones were surveyed (CDT, 2015; hereafter CDT15). Finally, the most recent survey was done by the Forestry Institute (INFOR from Spanish for Instituto Forestal) by collecting samples of between 300 and 500 households for a single year between 2015 and 2018 in the six central Chilean regions considered in the study (INFOR, 2019; hereafter INFOR19) (Fig. 2). Despite their differences, these studies agree that consumption increases towards the south – consistent with lower temperatures and the corresponding higher energy requirement of dwellings (Fig. 2). However, significant differences in wood consumption are found between these datasets within several individual regions.
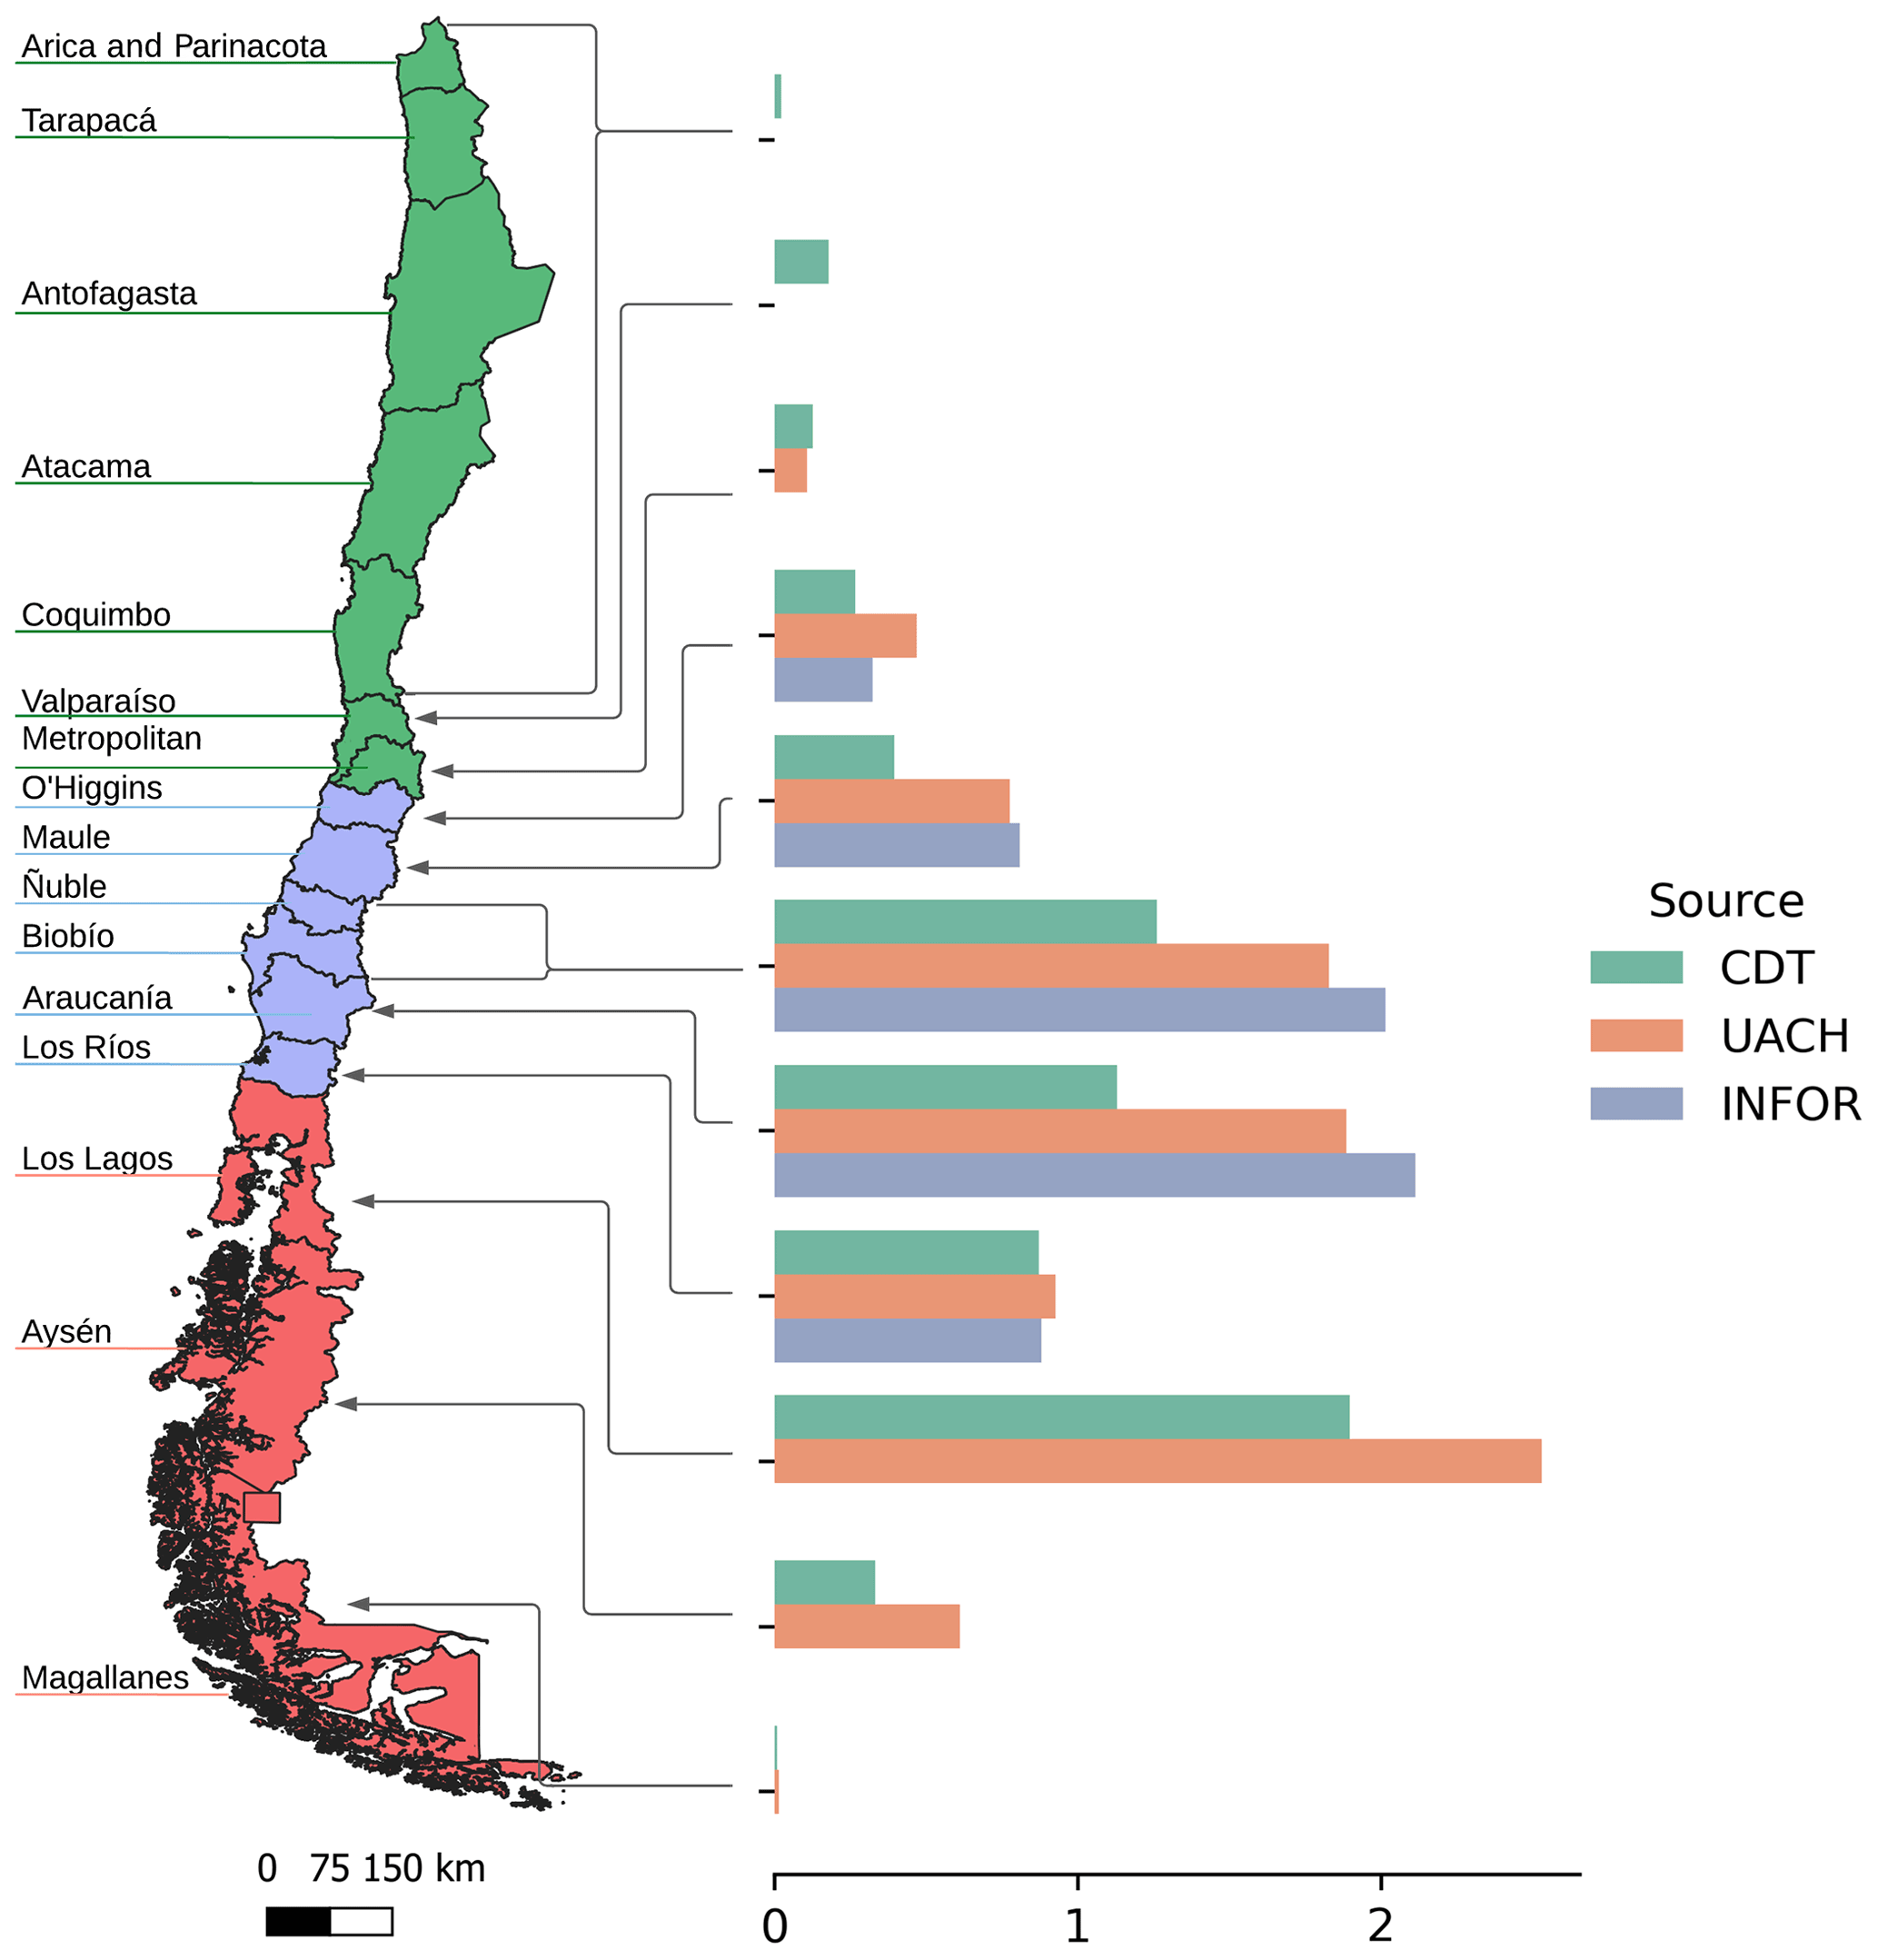
Figure 2Annual fuelwood consumption in kilotons for 2017 by region according to UACH (2013, red), CDT (2015, green) and INFOR (2019, blue). Regions are colored according to the data source used in each region.
Activity levels in INFOR19 are higher than the ones estimated in CDT15, and methodological shortcomings that potentially explain this underestimation have been identified (Reyes et al., 2018; Reyes, 2017). For this reason, firewood consumption from CDT15 is only used for regions lacking alternative data (all regions north of Santiago). For the regions of O'Higgins, Maule, Biobío, Ñuble, Araucanía and Los Ríos, the data reported in INFOR19 are used, whereas for the regions Los Lagos, Aysén and Magallanes, the information from UACH13 is selected over CDT15. Consumption estimates from UACH13 are consistent with the results from INFOR19 for regions with data from both sources (Fig. 2). It is worth noting that only INFOR19 provides firewood consumption at the communal level; the remaining studies estimate the firewood consumption at the regional scale. Regardless of the spatial disaggregation, in each study average household firewood consumption (AHFC) is computed at the communal level. For regions where the data are available at the regional level (see Fig. 2, those with information from CDT15 and UACH13), the same average consumption is assumed for all communes contained within the same administrative region.
A bottom-up approach is used to standardize the different information sources for the study period. The activity level of residential emissions is obtained at the communal level (c), differentiating between urban and rural areas (a) as follows:
where is the activity level corresponding to residential fuelwood consumption for year y in commune c for urban/rural area a, is the number of total dwellings in year y in commune c in area a registered in INE (2019), is the “penetration factor” representing the percentage of houses that use biomass in year y in commune c and area a obtained from the Chilean Ministry of Social Development and Family (MDS from Spanish for Ministerio de Desarrollo Social, 2015, 2017), and AHFCc,a is average household firewood consumption in commune c and area a.
The MDS conducts the National Socio-Economic Characterization Survey (CASEN) every 2 years for the entire country. This survey contains information on the type of fuel used by households for heating, cooking food and domestic hot-water production, allowing for deriving the penetration factor (PF) of biomass. For the isolated communes where this survey is not applied, the PF is taken for each region at an urban or rural level considering the regional PF value from CDT (2015).
Emission factors for residential combustion of firewood vary, among other factors, according to the efficiency of the technology used (e.g., fireplace, wood stove, simple heater, catalytic stove, etc.), the humidity present in the wood and the device's operating conditions2 (Jimenez et al., 2017; Guerrero et al., 2019; Schuefftan et al., 2016). Given that EMEP/EEA and IPCC's EFs do not include these aspects, which can lead to a negative bias in the estimated emissions, we use the local EFs from SICAM (2014), also used in MMA (2019b), to estimate emissions of NOx, PM2.5, PM10 and SO2 (Table A1 in Appendix A) and those estimated from MMA (2019b) for CO2 and NH3. However, for species absent in the aforementioned studies, EFs are taken from EMEP/EEA (2019) and IPCC (2006b); namely for CO and NMVOC EFs for dry firewood EMEP/EEA (2019) is used, while for CH4 the EFs estimated on the tier 1 approach from IPCC (2006b) is used. Finally, we follow EMEP/EEA (2016) and consider BC to represent 10 % of PM2.5 emissions.
2.3 Transport sector
Estimated emissions from the transport sector consider exhaust emissions from vehicles traveling on public routes nationwide, in urban and interurban areas, for the years 2015 to 2017. Neither rail, air and sea modes nor off-road machinery is included. Also, resuspended dust from paved and non-paved roads are not considered in this analysis. Approximately 60 % of the national roads in Chile are non-paved. Emissions were calculated per region based on estimates of the number of vehicles and their activity level. A more detailed description of the method applied to estimate transport emissions can be found in Osses et al. (2021, this issue).
The different types of vehicles and their activity levels per region come from information obtained from official reports of government agencies. This information includes statistics on fleet composition as the number of registered vehicles by region (INE, 2017b), average annual mileage by vehicle type (SCSS, 2014; MAPS, 2013) and fuel sales for road transport by region (SEC, 2017). Vehicle categories considered are light-passenger, commercial and taxi vehicles; 12 and 18 m buses; light-, medium- and heavy-duty trucks; and two-wheeled vehicles. Each of these categories is subdivided according to the type of fuel used (gasoline or diesel) and the emission standard in its European equivalent (Euro standard). Estimates of total fuel consumption from registered vehicles were compared to real fuel use for each region, using information on sales of diesel and gasoline for the transportation sector, by political region, provided by the Electricity and Fuel Superintendence (SEC from Spanish for Superintendencia de Electricidad y Combustibles, https://www.sec.cl, last access: 30 June 2020). A correction factor to the total number of registered vehicles in each region is applied to make these two fuel consumptions equal, correcting for those vehicles that are registered but do not contribute to actual driving activity. Thus, the number of active vehicles in a region was inferred and adjusted accordingly. The distribution of vehicles into urban and interurban activity per region was based on a proportional regional distribution provided by SCSS (2010). The combination of categories, fuels and emission standards generates a total of 70 types of vehicles for the emission analysis, distributed regionally and distinguishing between urban and interurban activity.
Activity level was expressed in VKT (vehicle kilometers traveled) calculated as the sum of the number of vehicles per mileage per type of vehicle (Eq. 3) expressed as follows
where is the number of vehicles of type v in region r and road class k (urban or interurban) and is the kilometers traveled per year by vehicle type v, in region r and road class k.
The estimate considers that all vehicles that enter Chile are required to comply with the European Euro regulations or their US equivalent. Consequently, the assignment of emission factors for each of the vehicle types was carried out by applying COPERT 5 values (EMEP/EEA, 2020), adapted to the Chilean fleet (Gomez, 2020). Total emissions are calculated by multiplying VKT by an emission factor in grams per kilometer. The result is a regional emission database differentiated by urban and interurban emissions for CO, CO2, VOC, NOx, PM2.5, PM10 CH4 and BC.
2.4 Point sources: energy, mining and industry sectors
Emissions from point sources and for species listed in Table 1 are not estimated by our work but downloaded from the Pollutant Release and Transfer Register (RETC from Spanish for Registro de Emisiones y Transporte de Contaminantes, https://datosretc.mma.gob.cl/group/emisiones-al-aire, last access: 30 August 2020) from the Ministry of the Environment. Every year, this register receives self-reported emissions from industrial facilities in accordance with current environmental regulations (MMA, 2019b). Verification and quality control of the declared emission estimates are neither conducted by the ministry nor done in this work. Although self-reported emissions estimates could have strong biases, they are currently the sole estimates of industrial emissions and are therefore used in this work. This limitation will be considered when analyzing and discussing the results. Industries are obligated to declare neither CH4 nor NMVOC but only total VOCs. Therefore, when analyzing VOC emissions from the energy, mining and/or industry sector we will be referring to total VOCs.
Establishments with economic activities (given by their International Standard Industrial Classification of All Economic Activities or ISIC designation) that meet any of the following criteria are subject to declare their atmospheric emissions to RETC:
-
pulp and paper production, primary and secondary smelters, thermoelectric power plants, cement, lime and gypsum production, glass production, ceramic production, iron and steel industry, petrochemical industry, and asphalt production
-
industries with generator sets greater than 20 kW and industrial and heating boilers with fuel energy consumption greater than 1 MJ h−1
-
establishments with electricity generation units, made up of boilers or turbines, with a thermal power greater than or equal to 50 MWt
-
establishments whose fixed sources, made up of boilers or turbines, individually or as a whole, add a thermal power greater than or equal to 50 MWt
-
establishments corresponding to copper smelters and arsenic emitting sources
Agricultural emissions, thermoelectric plants that are a part of cogeneration processes and other activity sectors not mentioned explicitly above or that do not meet one of the above criteria are not obligated to declare unless they are in a geographical zone with an existing atmospheric decontamination plan.
Emissions from point sources are differentiated between the energy, mining and industry sectors. The energy sector includes the production and distribution of fuels and the generation of electric energy, while mining includes the production and smelting of metals. The remaining point sources will be aggregated into a single sector to which we will refer as industry henceforth.
This database includes more than 8324 point sources along the territory, most of which have associated coordinates; however, a large number of sources exist in the database where only the commune of emission is known (along with additional information such as the company name, activity type and description) but not their coordinates. Approximate coordinates of these sources without a specified location and whose contribution to their respective commune was larger than 20 % were obtained by pinpointing them on Google Earth using the information provided in their declaration. The remainder of the point sources without a geographic location were not explicitly included in the inventory; however, their emissions were distributed among the located sources (including those manually georeferenced) within the same commune. For a given species, sector and commune, the spatial distribution of the emissions of located sources was scaled to fit the total (located and non-located) emissions.
2.5 Spatial distribution of emissions
While point source emissions from the industry, mining and energy sectors are spatially distributed using their coordinates (Sect. 2.4), those from the transport and residential sectors are estimated at the regional or communal level and thus need to be distributed to the final grid of (approximately 1 km×1 km) (Fig. 3).

Figure 3Map of Santiago at different scales: in blue the utilized grid (approximately 1 km×1 km) and in black the EDGAR v5.0 grid for comparison. © OpenStreetMap contributors 2021. Distributed under the Open Data Commons Open Database License (ODbL) v1.0.
Residential emissions were initially estimated at the communal level and distributed onto a regular grid (approximately 1 km×1 km) based on population density from the last census conducted in 2017 (INE, 2017a). The information is available at the census block scale, which is the smallest territorial scale for which relevant information from the census exists; it consists of a group of adjoining or separate dwellings, buildings, establishments and/or properties, delimited by geographical, cultural and natural features. The population distribution was obtained by projecting the lat–long grid (EPSG:4326, WGS 84) onto the information contained in the census blocks and retrieving the aggregated information. We used the population density to distribute the emissions with the assumption that firewood is consumed similarly among the population despite the limitations it presents. This was due to not having information available at the census block scale that would allow for making a finer spatial disaggregation according to population characteristics such as income. Furthermore, the CDT15 database reveals that households with higher incomes have higher firewood consumption levels per capita but fewer dwellings using firewood for heating and cooking, making it difficult to establish a clear relationship between income and firewood consumption.
The spatial distribution of transport emissions within each region was performed by projecting the road network of each region onto a latitude–longitude grid of (approximately 1 km×1 km). The QGIS open-source software, the official database for Chile's road network and regional limits (BCN, 2020), was used to characterize the Chilean road network and was complemented with information from OpenStreetMap (OSM, 2020) to organize it into a hierarchy comprising freeways, arterial roads, collectors and local roads of 77 800 km of both rural lands and main cities. Road vehicle flow per type of road was estimated by applying a road weight factor, based on toll barrier vehicle counts at interurban roads and origin–destiny surveys on urban roads. Average weight factors are 54 % for freeways, 23 % for arterial roads, 16 % for collectors and 7 % for local roads. In each region, urban emissions were distributed among cities based on population (INE, 2017a) first, and then within each city emissions were distributed by applying the aforementioned weight factors. Thus, urban emissions in each cell depend on the population and the roads in the cell.
2.6 Uncertainty on residential emissions
Emissions represent a large source of uncertainty in air quality modeling (Thunis et al., 2016), of which uncertainty in emission factors dominate over the better-known activity data (Scarpelli et al., 2019). To assess the uncertainty of the residential sector, we construct a range of possible estimates using different sources of information for the level of activity and emission factors. Two possible activity levels were considered; the lower limit is given by the CDT15 information for the whole country (CDT, 2015), while the upper limit considers the activity levels used in this inventory (Sect. 2.1). For emission factors we consider four possible datasets. The upper estimates are based on the EFs used in the RETC database until 2014, while the lower limit considers the EFs estimated based on IPCC (2006b) and EMEP/EEA (2019) for different species. Also, EFs used in the current inventory and those proposed by US EPA (1996a, b) are considered. Eight possible residential-emission levels were estimated by considering all possible combinations between the two activity level estimations and the four EF datasets. These eight emissions estimates are then normalized by INEMA's emissions, and therefore, for a given species, a resulting value of 4 represents an estimate 4 times larger than INEMA, while a value of 0.2 corresponds to an estimate 5 times smaller than INEMA, and the corresponding range of uncertainty of the estimated emission of the given species would be a factor of 20. The analysis (Sect. 4) focuses on the largest (considering INEMA's activity level and RETC EFs) and lowest (considering CTD15 activity level and EMEP/EEA EFs) emission estimate.
Total national emissions remain mainly stable for most species between 2015 and 2017 with a slight increase for PM2.5, NH3, SO2 and CO2 between the beginning and end of the period, whereas CO, VOC, PM10 and NOx show a slight decrease (Fig. 4, the values of emission per sector and year are available in Appendix B). While PM10 decreases due to a decreasing trend in industrial emissions (driven mostly by changes in the manufacturing industry) and stable residential ones, NOx remains mostly constant due to a decrease in energy emissions and the slight increase in the rest of the sectors. Almost half of the NOx emissions are from the transport sector, while the industry and energy sectors combined contribute to almost an equivalent amount of the total NOx emissions. Although the largest contributor to CO2 emissions in Chile is the energy sector due to thermoelectric power plants (MMA, 2017), the increase is associated with the increase of CO2 emissions in the industrial sector (mainly driven by the forestry along with the manufacturing industry). Mining activity, more specifically emissions from copper smelters, dominates SO2 emissions in Chile. Starting in 2016, seven additional copper smelters started declaring their emission to RETC due to changes in the regulatory framework driving an increase in SO2 emissions from 2015 to 2016 that is sustained in 2017. However, the decrease from 2016 to 2017 is the result of reductions in the energy and industry sectors combined with mostly stable emissions from the mining activity. Finally, for NH3 the emissions are dominated by the energy sector followed by emissions from the residential sector, and the increase in emissions is explained by increases from the energy and industry sectors. We highlight that the agriculture sector is not included in this inventory due to a lack of high-resolution data allowing for spatially distributing this sector's emission onto INEMA's grid and therefore is reflected in emissions of neither CH4 nor NH3. In general, the agriculture sector dominates NH3 (Muñoz et al., 2016) and CH4 (according to MMA, in 2017 more than half of CH4 emissions in Chile come from agriculture) emissions, and for any future study on these species, these sectors would need to be estimated.
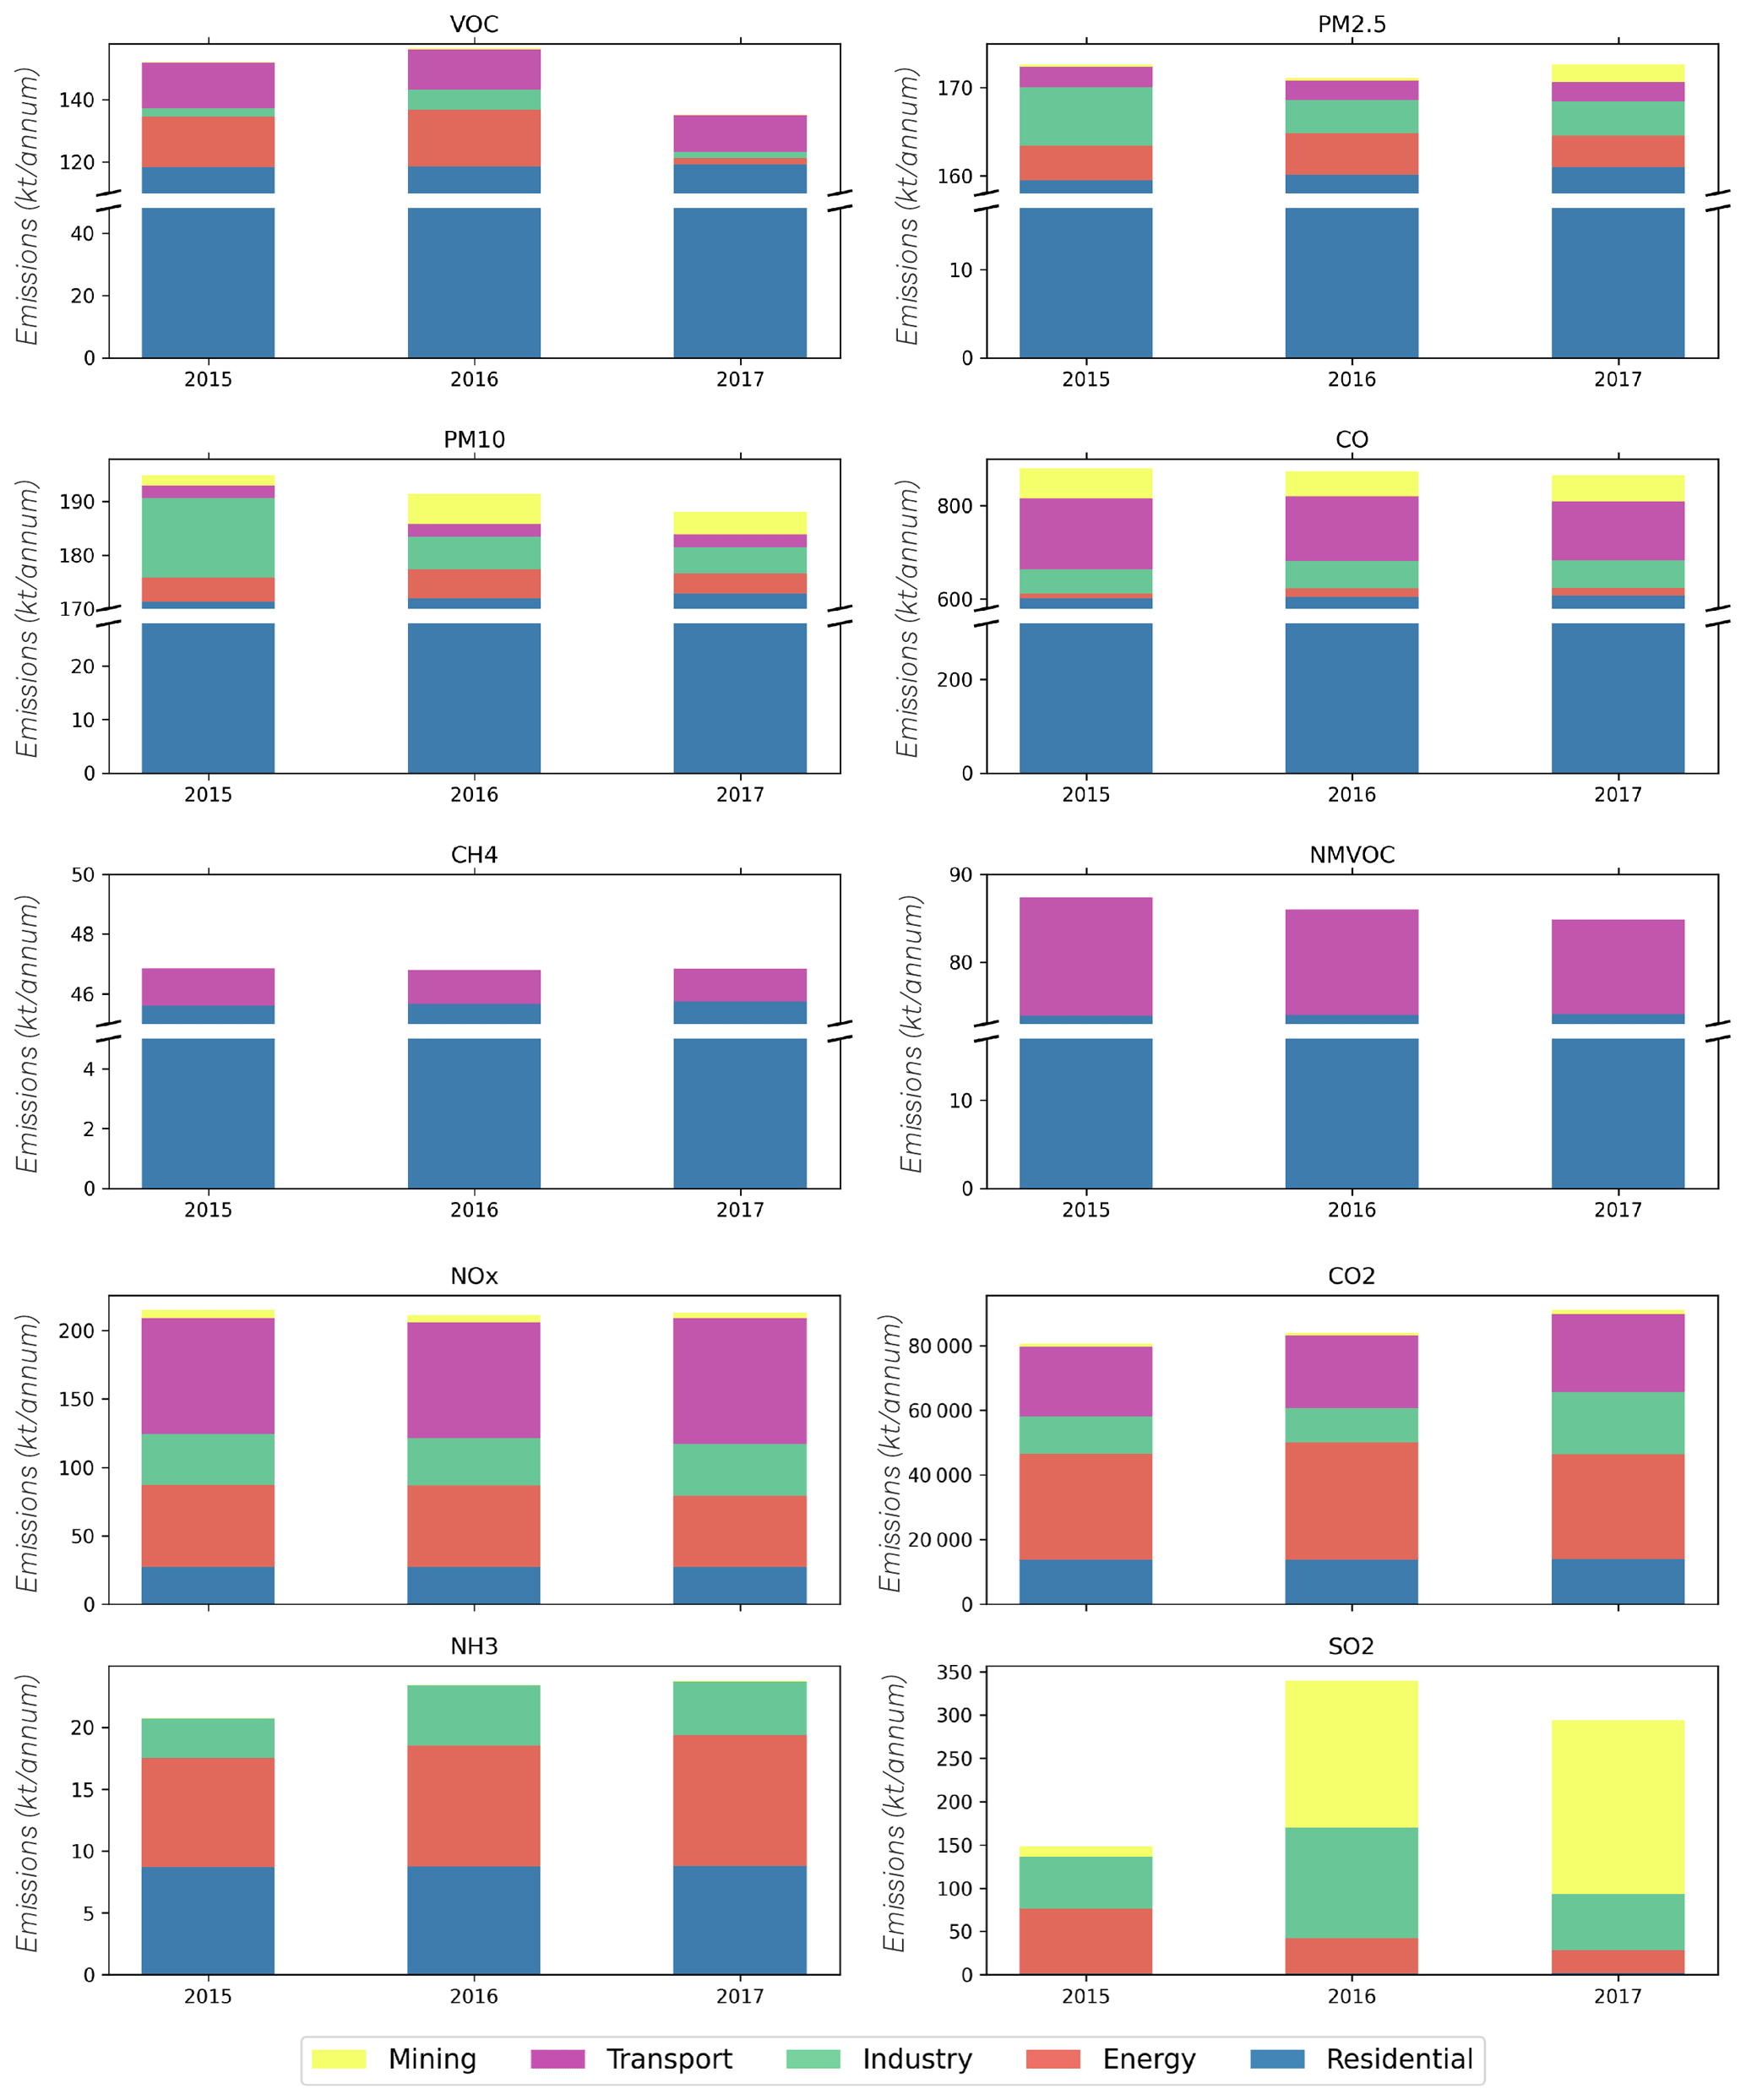
Figure 4Total national annual emissions distributed by sector for pollutants VOC, PM2.5, PM10, NOx, NH3, CO2, CO and SO2 in kilotons for 2015–2017.
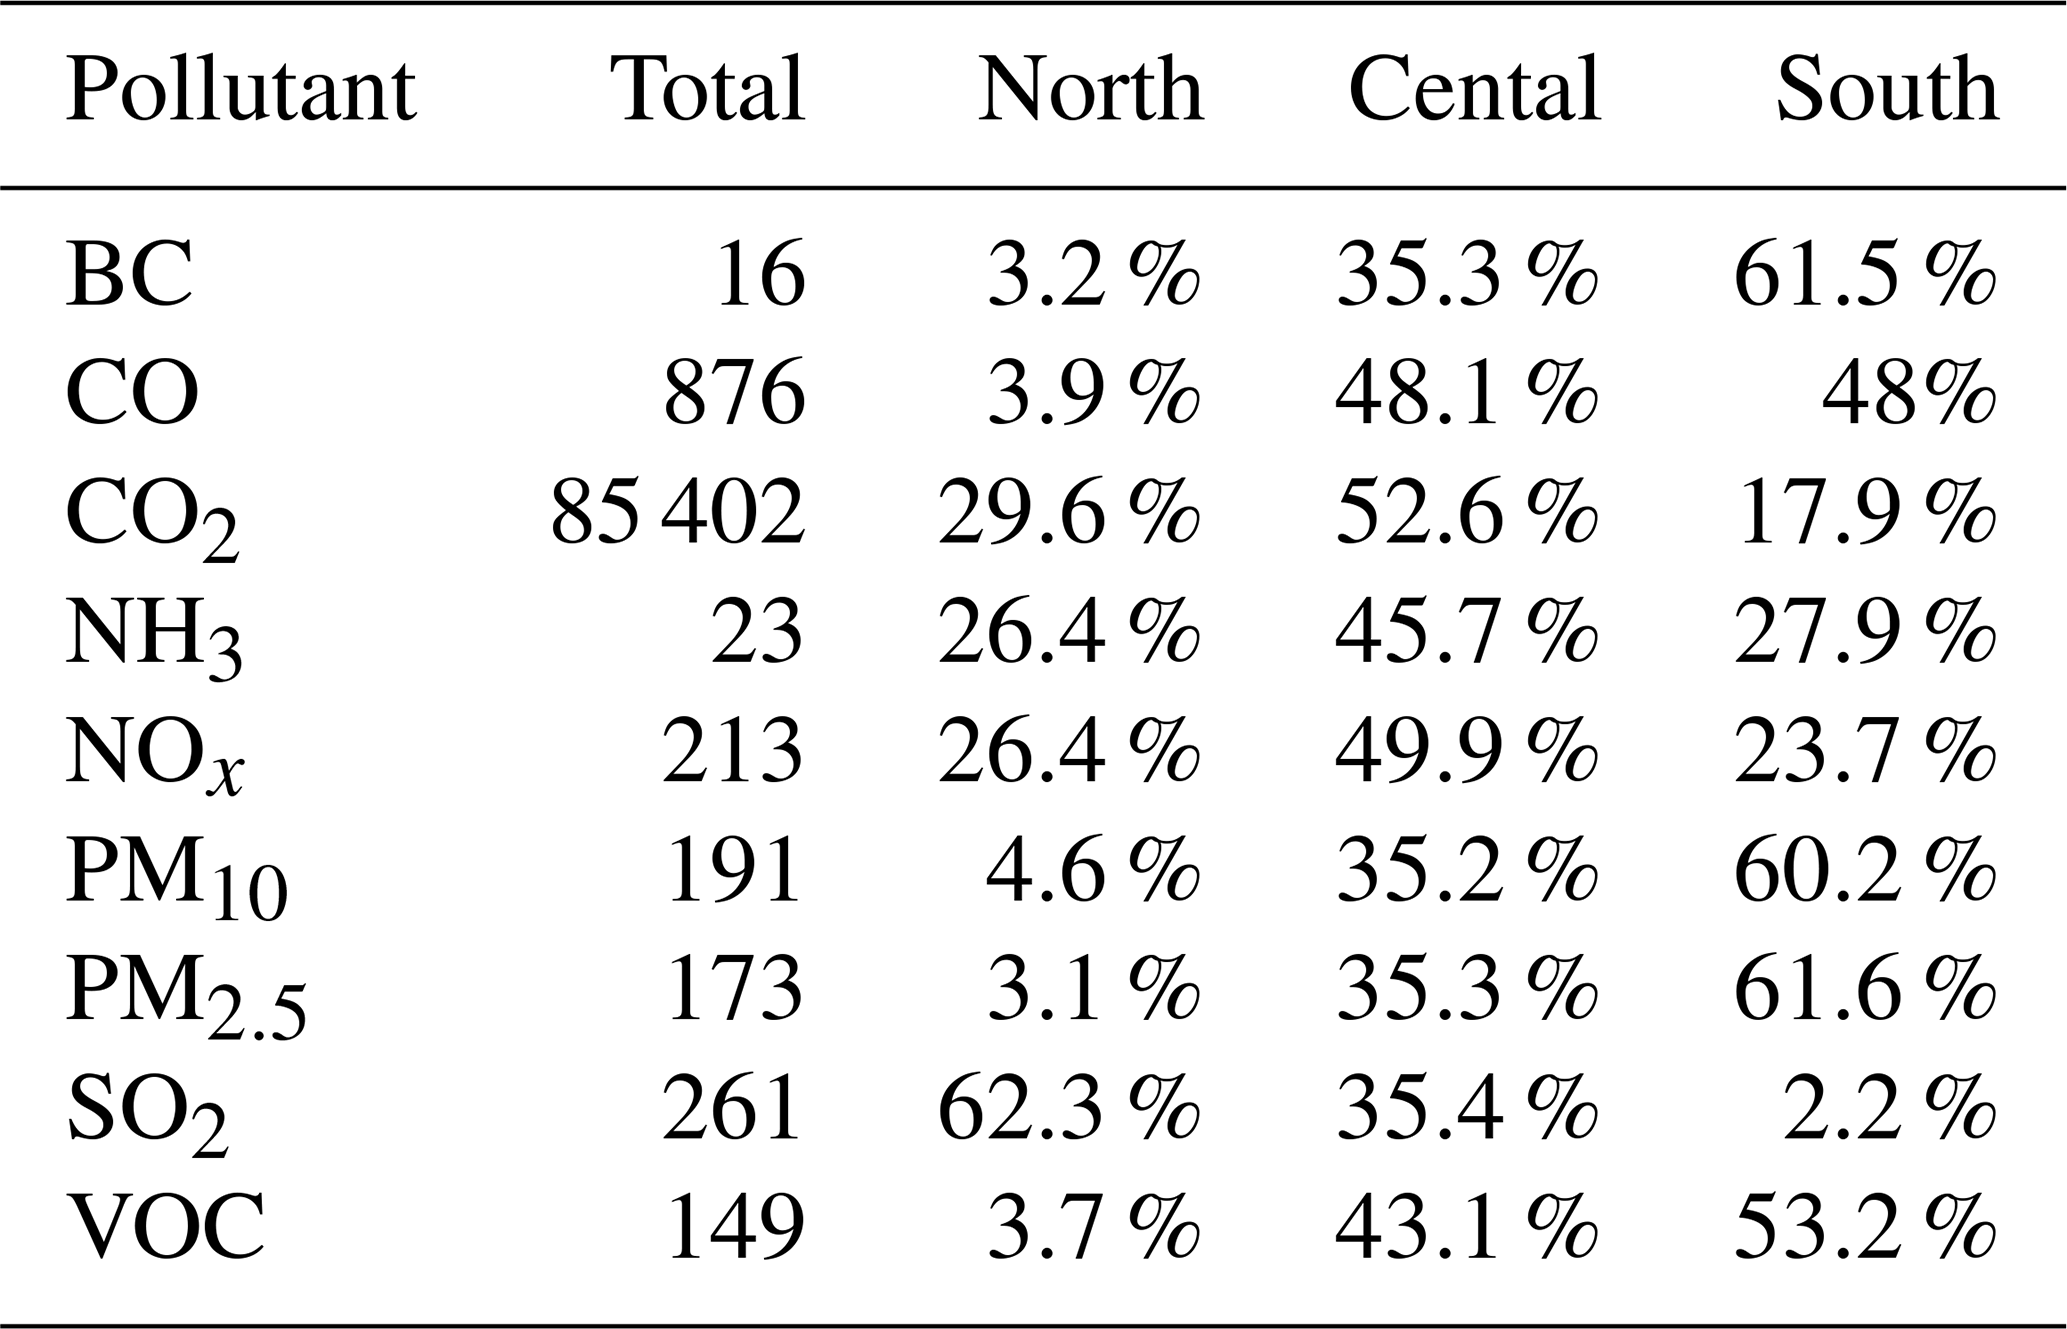
Emissions of NOx dominate in central Chile due to a larger population (see Fig. 1), urban centers and vehicular traffic in this area. CO2 emissions are distributed mainly in northern and central Chile, where thermoelectric power plants are abundant (Table 2). Furthermore, PM2.5 and PM10 are mostly emitted in southern Chile with large contributions also in central Chile, mainly from the residential sector in both cases. This sector also makes the largest contribution in CO and VOC. SO2 has a greater presence in the northern part of the country, consistent with a larger share of mining activity.
Table 2Average annual total emissions (kt a−1) for the period 2015–2017 from the energy, industry, residential and transportation sectors by pollutant and macrozone.
Given the large health impact associated with PM2.5 and its role in poor air quality in central and southern Chile, we focus now on this particular pollutant and its spatial emission distribution along the territory (Fig. 5). More than 90 % of the 158 (170) kt a−1 of PM2.5 (PM10) total national emissions for 2017 originated from the residential sector (Fig. 5). Emissions in the northern macrozone are mostly from the energy and industry sectors, which are generally located in urban areas. The Mejillones commune concentrates more than 20 % of all PM2.5 2017 emissions in the northern macrozone (Fig. 6a). More than 1300 t a−1 is emitted in this commune, of which 99 % comes from the energy sector (thermal power plants) concentrated in a few locations.
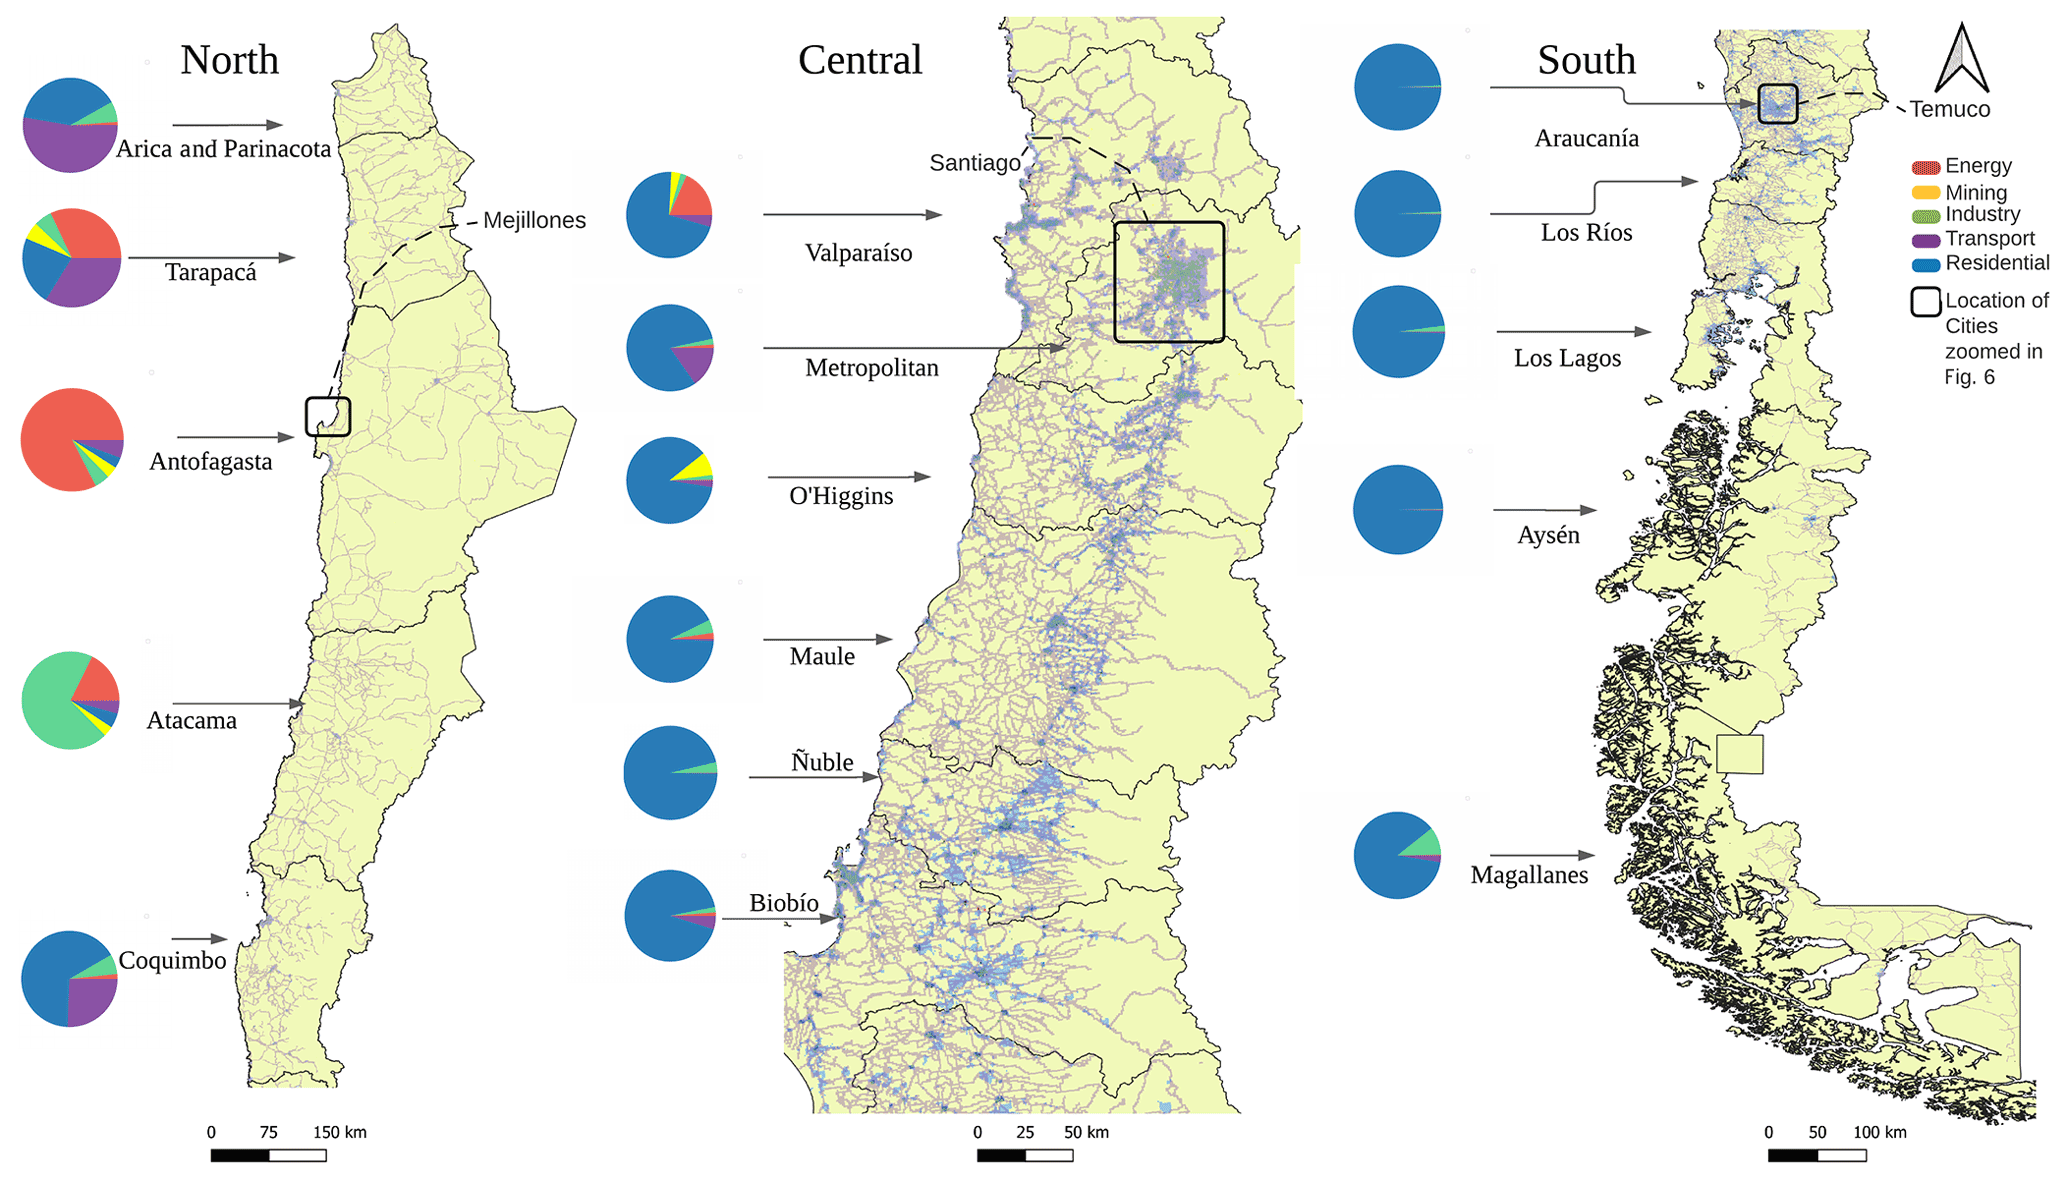
Figure 5Spatial distribution of the 2017 emissions of PM2.5 from the energy (red), industry (green), residential (blue) and transport (purple) sectors in a grid of on a map of Chile according to the macrozones defined for the country (Fig. 1). Note that Metropolitan includes the capital of Santiago and ∼40 % of the population. The pie charts indicate the relative contribution that each source makes to total PM2.5 emissions in each region.
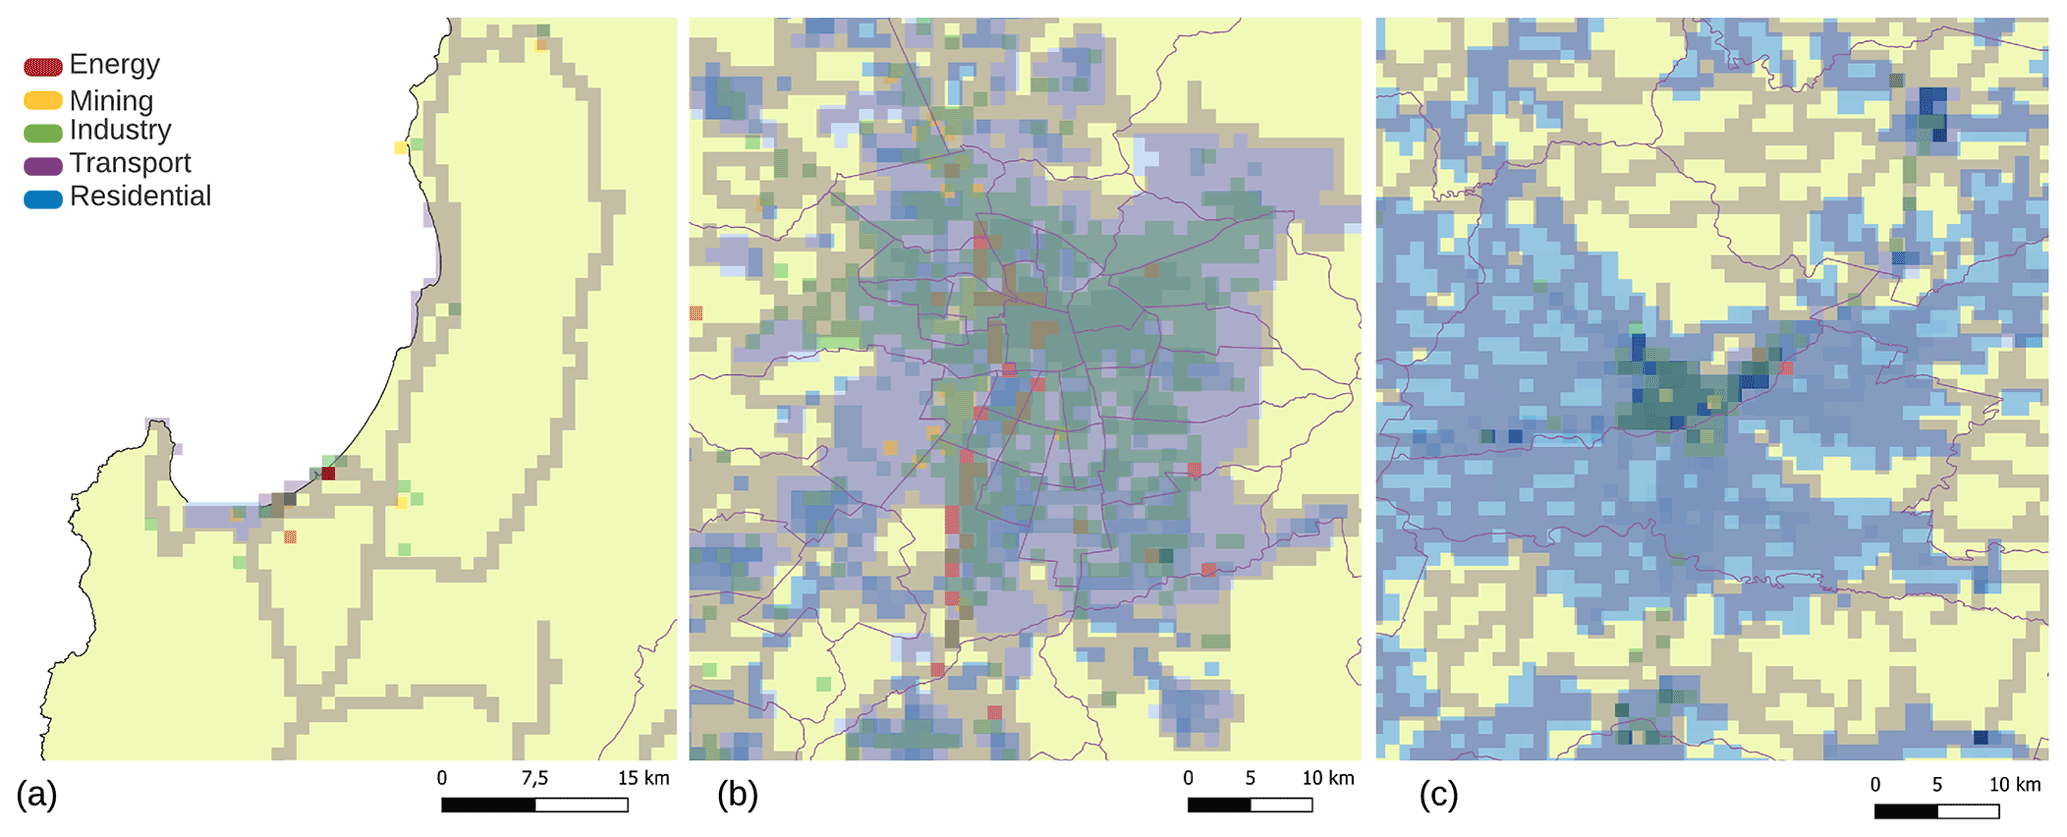
Figure 6Spatial distribution of the 2017 emissions of PM2.5 from the energy (red), industry (green), residential (blue) and transportation (purple) sectors in a grid of (approximately 1 km×1 km) for the cities of Mejillones (a), Santiago (b), and Temuco and Padre Las Casas (c). These cities are located in the north, central and south zones, respectively.
In central and southern Chile emissions are largely dominated by the residential sector and are consequently distributed along the territory according to population, with a larger magnitude in locations with a greater number of dwellings and concentrated in the country's central valley. However, contrary to cities of southern Chile (Fig. 6c), significant contributions from other sources are observed in some areas of central Chile. For instance, Santiago, the capital of Chile (Fig. 6b), where more than 40 % of the country's population resides, stands out in central Chile. Although firewood burning for heating and cooking is prohibited in the metropolitan area, it is still the largest contributor to PM2.5 in the region due to its use in the outskirts and surroundings; from the 2030 t a−1 of PM2.5 emitted in 2017, 1480 t a−1 is emitted in the outskirts and surroundings of the city. Within the Santiago metropolitan area, the largest polluter is the transport sector, representing 22 % of the total PM2.5 2017 emissions and almost 90 % of the 25 kt a−1 of NOx.
Comparison of total emissions by sector and pollutant with the EDGAR inventory
Puliafito et al. (2017) and Huneeus et al. (2020a) show that despite consistencies in the magnitude of total emissions of pollutants, global inventories have large discrepancies in sectoral contribution when compared to local or national inventories. We compare estimated emissions for 2015 from the present inventory against the EDGAR v5.0 inventory 2015 emissions (Crippa et al., 2019, 2020). Global inventories, such as EDGAR, have been used in South America in the absence of a local inventory for AQ assessments (Huneeus et al., 2020a). Both inventories, EDGAR and this work, follow the same sectoral classification proposed in IPCC (2006a) with the exception of the residential sector. While for INEMA the residential sector corresponds to IPCC code 1A4b with only firewood combustion, the residential sector in EDGAR corresponds to IPCC code 1A4, including residential emissions as well as emissions from commercial activities, agriculture, forestry, fishing and fish farms. In spite of these differences in activities represented in the residential sector between both inventories, INEMA presents larger total PM2.5 and sectoral residential emissions for all species (Figs. 7 and 8).
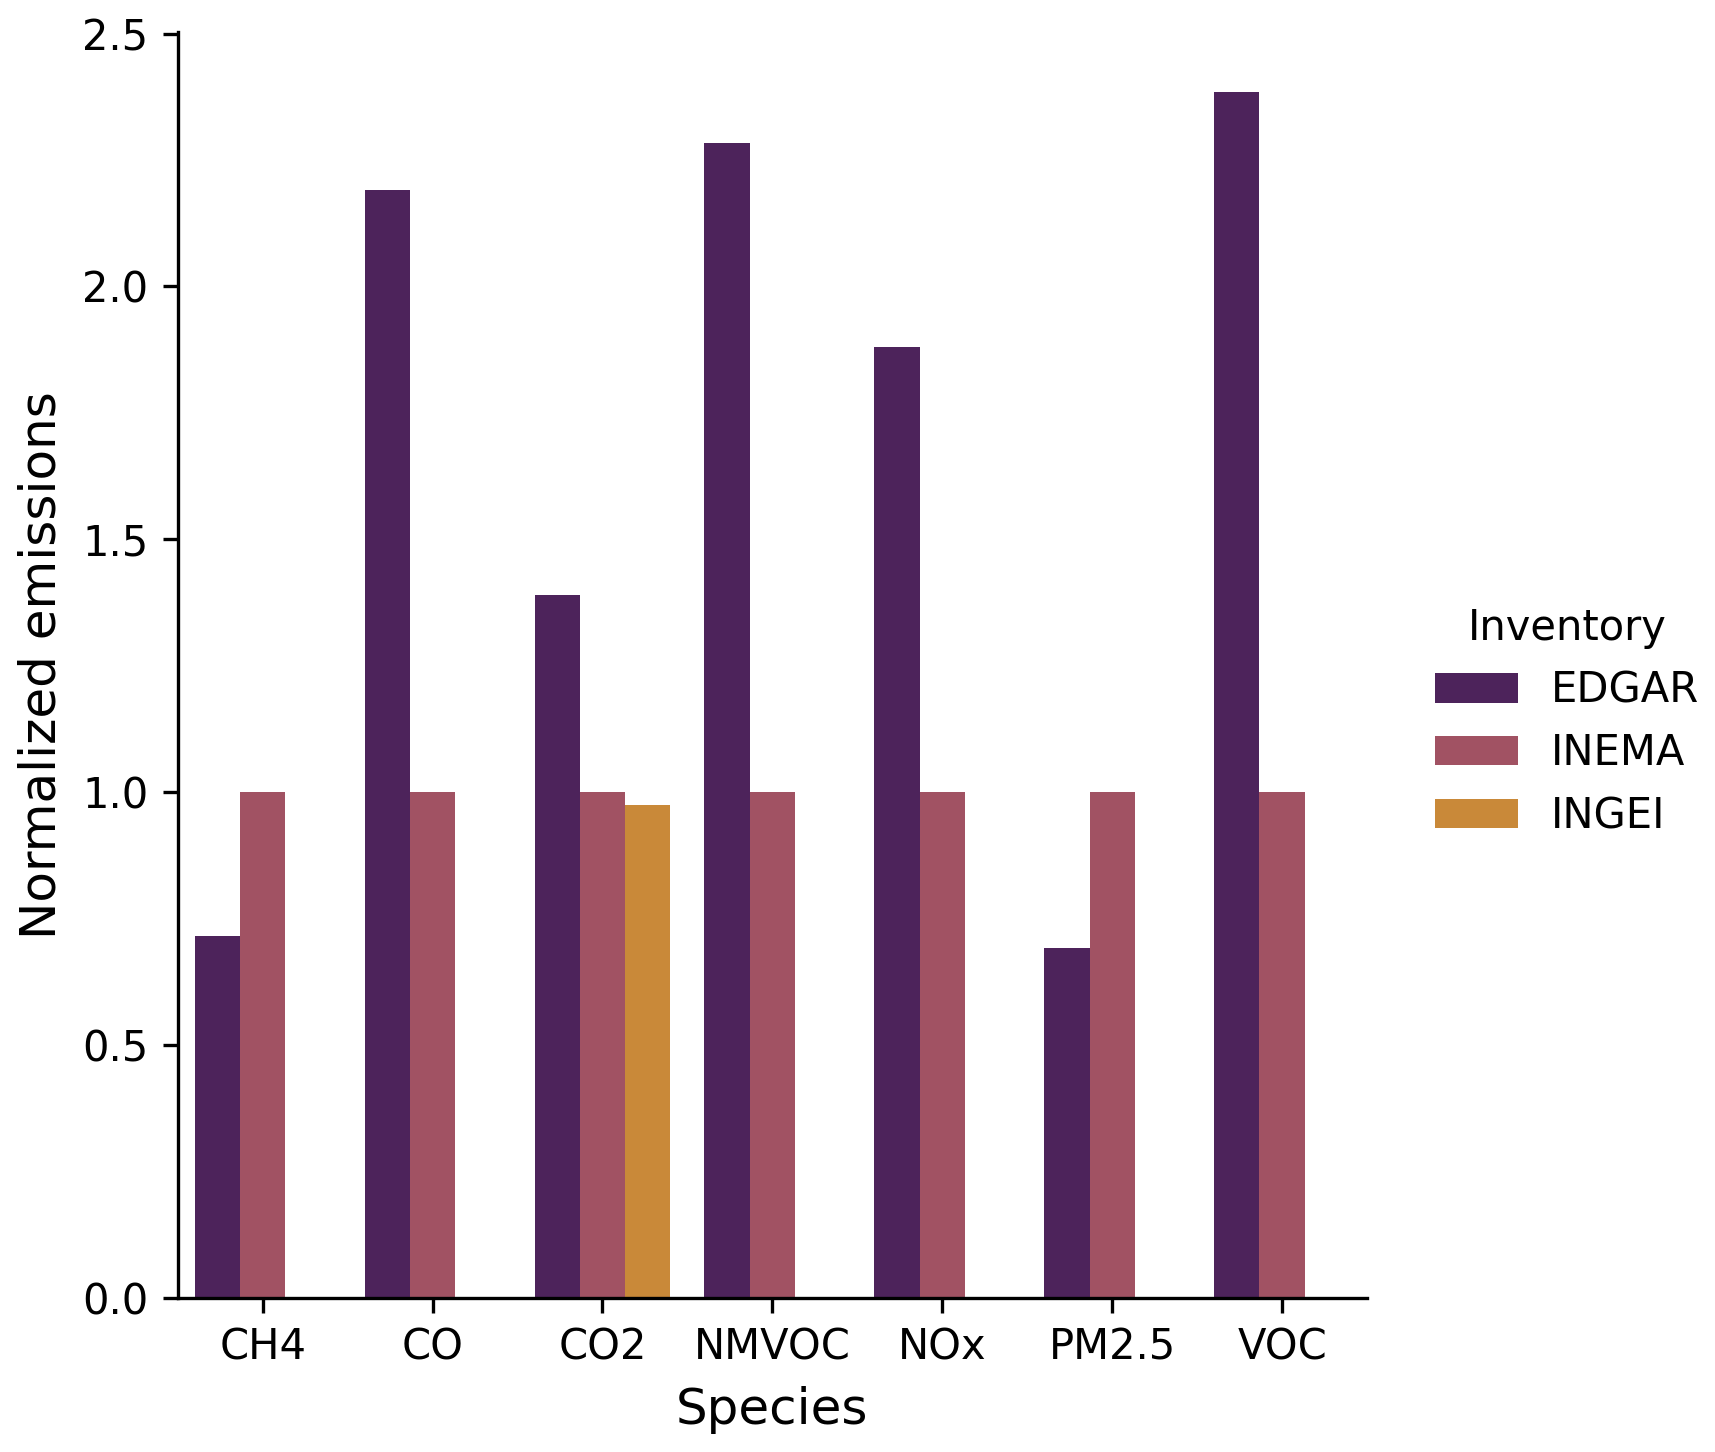
Figure 7Emissions of CH4, CO, CO2, NMVOC, VOC, NOx and PM2.5 for 2015 reported by EDGAR v5.0 (purple) relative to the present work (INEMA; pink). EDGAR emissions were normalized by the magnitude of the current INEMA inventory. We note that the residential sector from EDGAR corresponds to IPCC code 1A4, while for INEMA the residential sector corresponds to IPCC code 1A4b with only firewood combustion. IPCC code 1A4, in addition to residential emissions, also includes emissions from commercial activities, agriculture, forestry, fishing and fish farms.

Figure 8Total 2015 emissions in kilotons by pollutant and sector according to this work and EDGAR v5.0. Sectors considered in both inventories correspond to the classification proposed in IPCC (2006a) presented in Sect. 2.
The differences for 2015 between both inventories for all pollutants are considerable in terms of magnitude and sectoral contribution, especially for the residential sector (Figs. 7 and 8). Except for PM2.5 and CH4, EDGAR presents larger emissions than INEMA. For CO, NMVOC and VOC, EDGAR emissions are more than double that of INEMA's; for NOx differences are around 90 %; and for CO2 they are around 40 %. While for PM2.5 INEMA emissions are 45 % larger than those estimated in EDGAR. These differences can partly be explained due to the use of different emission factors in both inventories. Emission factors used in EDGAR do not consider wet firewood and combustion with poor operating conditions which considerably increases these pollutants' emissions (Schueftan et al., 2016; Guerrero et al., 2019). In contrast, the current inventory (INEMA) considers emission factors for PM10, PM2.5, NOx and SO2 that take these conditions into account. For NOx the larger emissions in EDGAR are from the transport, energy and industry sectors. While EDGAR and INEMA have comparable CO2 emissions for the transport, mining and residential sectors, they differ significantly for the energy and industry sectors. We note that the estimated emissions in this work for the energy and industry sectors are in line with what Chile reports to the UNFCCC (34 000 and 18 000 kt for energy and industry, respectively; see INGEI – from Spanish for Inventario Nacional de Gases de Efecto Invernadero – on CO2 graph of Fig. 8; MMA, 2020), suggesting a potential source of bias in the activity data used in EDGAR for the energy sector.
EDGAR NMVOC and CO transport emissions are larger, due to evaporation emissions, which are not considered in the INEMA inventory. Furthermore, smaller EDGAR emissions of PM2.5 are mostly due to differences in emissions from the residential sector. Although the use of distinct EFs by both inventories might explain this discrepancy, differences in estimating activity as highlighted by different CO2 emissions might also explain part of the difference.
To examine and estimate emission uncertainties associated with the residential sector, multiple emissions considering different levels of activity and EFs are estimated (Sect. 2.6). For VOC, CO, BC and particulate matter emissions, the range of possible residential-emission estimations can reach differences of a factor of 84, 24, 13 and 13, respectively, (Fig. 9a) between the upper and the lower estimation limits. For VOC and PM not all differences can be attributed to uncertainty; it is partly related to the choice of what is included in the definition of VOC or PM. For the residential sector in this study, the largest uncertainty in the estimated magnitude is associated with the emission factor. In the case of PM2.5 emissions, differences in the estimated magnitude following the different emissions factors can reach up to a factor of 8, whereas differences in the activity data are less than a factor of 2 (Fig. 9b). However, the final uncertainty is even larger when considering the combined uncertainties from each parameter (Fig. 9b). CO2, NH3 and SO2 have lower uncertainty ranges (Fig. 9a) due to the greater consensus on their EFs in the literature (MMA, 2019b; IPCC, 2006b; US EPA, 1996a, b; SICAM, 2014) and the fact that these are single well-defined species, whereas VOC and PM are container definitions; they include a variety of species and/or sizes. For CO2, NH3 and SO2 the possible estimations of the lower and upper limits differ by a factor of 2, while for NOx this value can reach up to a factor of 5.
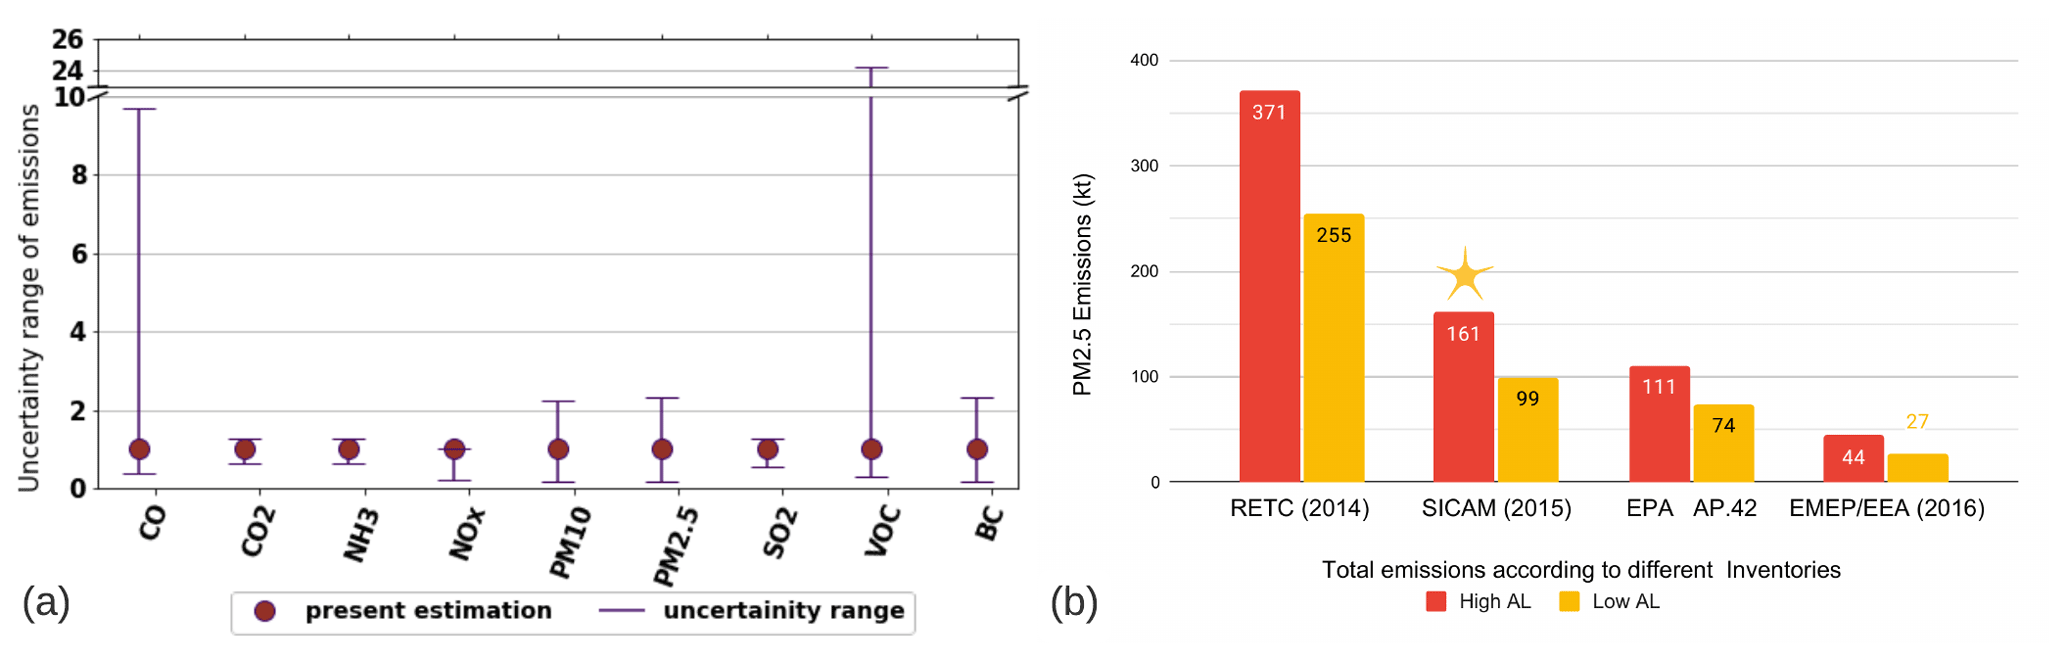
Figure 9(a) Uncertainty range of residential emissions considering the possible estimation that can be made with the different sources of information evaluated in this work. The units on the y axis are the ratio of total 2017 emissions from one set of assumptions to the INEMA estimate. The y axis is broken up for better visualization (b) with the 2017 PM2.5 emission uncertainty range disaggregated according to different emission factors (groups of columns) and activity levels (colors). In yellow are the inventories constructed using CDT information, which provides the lowest possible activity level (AL), while in red are the activity levels used in this inventory (Sect. 2.1). The first group of columns represents estimated PM2.5 emissions based on EF from RETC, while the second group corresponds to the estimate based on EF used in the current inventory (the bar used on INEMA's inventory is marked with a star). The third and fourth group of columns correspond to the estimate based on EF proposed by US EPA (1996a, b) and EMEP/EEA (2019), respectively. US EPA emission factors come from Compilation of Air Emission Factors (AP-42), available at https://www.epa.gov/air-emissions-factors-and-quantification/ap-42-compilation-air-emissions-factors (last access: 13 October 2022).
The final EFs used in this study (see Table A2) are obtained by aggregating several EFs, each one corresponding to a specific emission condition and/or fuel component. They determine the magnitude of the emitted flux (see Table A1), by weighting each EF according to distribution parameters estimated in household surveys. The most relevant parameters that were considered when weighting the EFs are the quality and efficiency of the technology used (appliance type), the humidity of firewood fuel and the operating conditions of the devices (Jimenez et al., 2017; Guerrero et al., 2019; Schuefftan et al., 2016). Each of these EFs has its uncertainty, which depends on the quality and the number of laboratory tests carried out to determine its robustness (RTI International, 2007). Despite the studies carried out, the uncertainty associated with EF estimation is considerable. EMEP/EEA (2019) indicates that for a standard heater the associated uncertainty to the estimated CO and PM2.5 EF can be larger than 10 and 4 times, respectively. Additionally, estimating activity data has sources of uncertainties associated. For example, to estimate the amount and type of firewood consumed as well as the technology used and operating conditions, household surveys are usually conducted. These studies have big uncertainties, due to high informality surrounding the firewood transactions and markets (Zhao et al., 2011), and depend on the size of the surveyed sample as well as its representativity. The combination of the aforementioned uncertainties (Fig. 10) impacts the expected final confidence of aggregated EFs and thus the magnitude of the estimated emissions (EMEP/EEA, 2016)
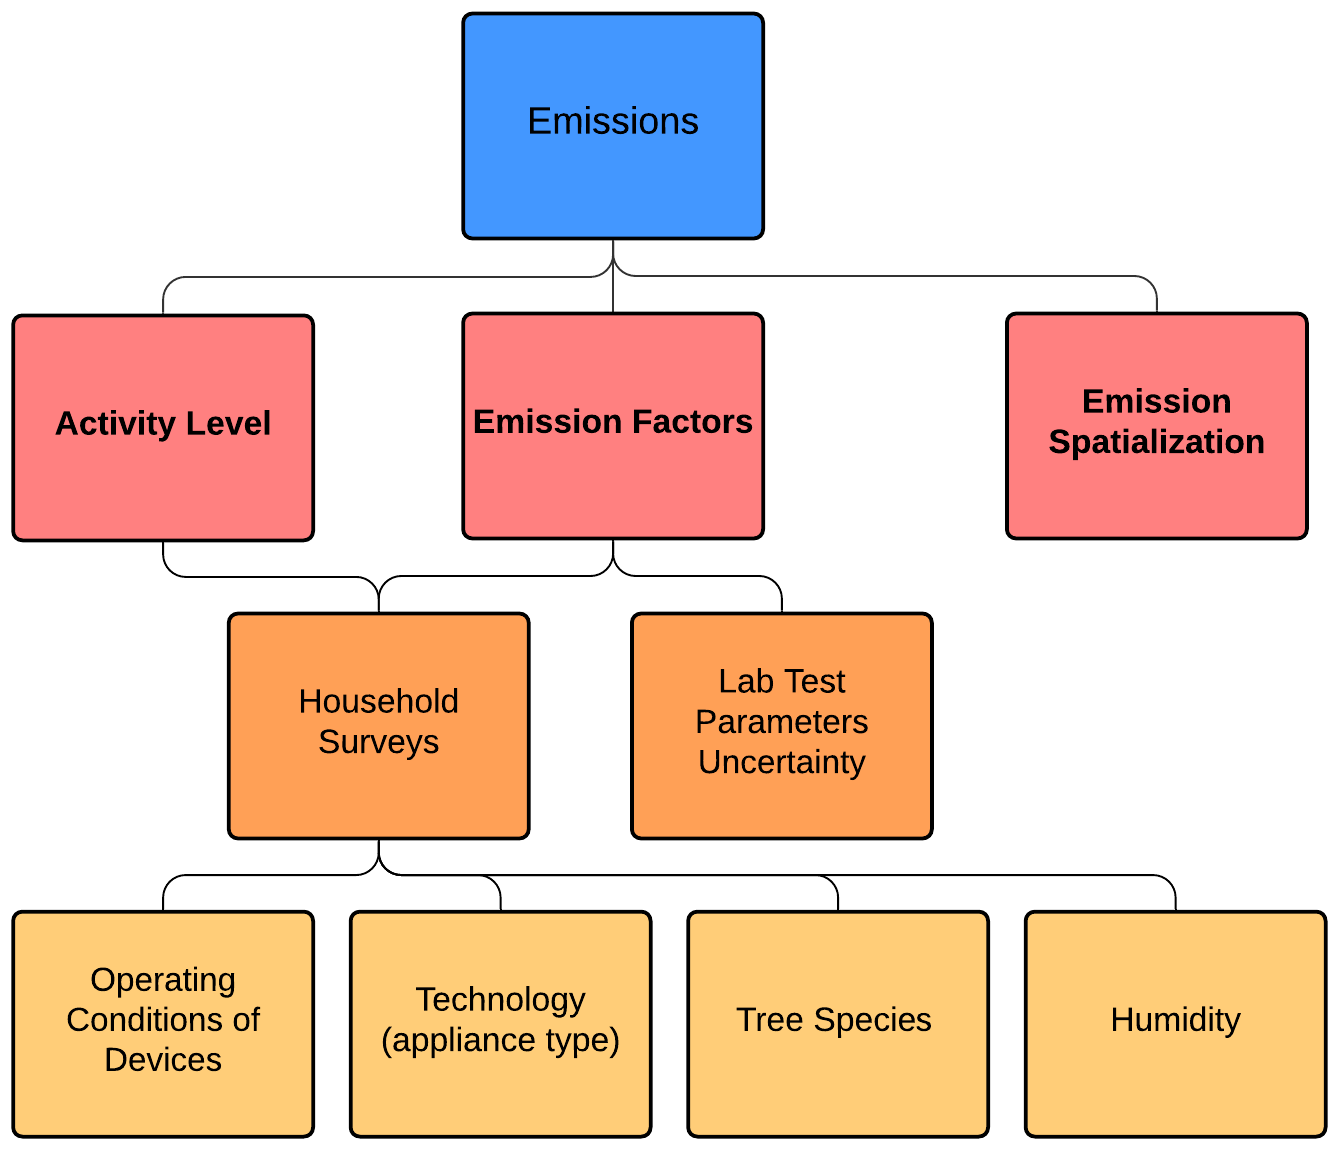
Figure 10Components that determine the final uncertainty of residential-emission estimations.
The emission database described is available at Zenodo (https://doi.org/10.5281/zenodo.4784286) (Alamos et al., 2021). The database consists of one .tar file for each year and sector, containing NetCDF (Network Common Data Form, .nc) files for each pollutant. Each NetCDF file contains annual total emissions for the pollutant and year indicated per grid cell.
A high-resolution emission inventory (, approximately 1 km×1 km) of criteria pollutants, CH4 and CO2 from the transport, industry, mining, energy and residential sectors in Chile for the period 2015 to 2017 was developed. This is the first time a national gridded emission inventory with consistent CH4, CO2 and criteria pollutants was created for the entire country. Urban and rural emissions from the residential sector are estimated based on firewood consumption data derived from different surveys conducted at the regional and communal level. The transport sector includes vehicles traveling on public urban and interurban routes nationwide. For mining, industry and energy sources, the self-reported emission estimates compiled by the environmental agency RETC are used.
Total national emissions remained mostly stable between 2015 and 2017 with slight increases for PM2.5, CO2, NH3 and SO2 and small decreases for CO, VOC, PM10 and NOx. Estimated total annual average emissions for the period 2015–2017 for PM10 and PM2.5 were 192 and 173 kt a−1, respectively, of which more than 90 % is emitted by the residential sector. This sector is also responsible for 69 % of the 872 kt a−1 CO emissions and 78 % of the 149 kt a−1 VOC emissions. Regarding NOx, total average annual emissions were estimated at 213 kt a−1 and dominated by the transport sector (87 kt a−1), while the industry and energy sectors combined contribute an almost equivalent amount with 57 and 36 kt a−1, respectively. Additionally, CO2 emissions (85 402 kt a−1) are dominated by the energy sector mostly due to emissions from thermoelectric power plants (33 911 kt a−1) followed by the transport and industrial sectors (22 770 and 13 804 kt a−1, respectively). Mining activity (due to copper smelters) dominates SO2 emissions in Chile, contributing an average of 201 kt a−1 of a total of 294 kt a−1 in 2017.
A comparison of the estimated emissions against the EDGAR v5.0 database (Crippa et al., 2019, 2020) shows significant differences for several species. For CO and VOC, EDGAR emissions double those of INEMA's, while NOx and CO2 have differences of around 90 % and 40 %, respectively. On the other hand, PM2.5 emissions estimated in this work are 45 % larger than those estimated on EDGAR. These differences are even larger when considering emissions per sector, in particular for the residential and energy sector. Furthermore, a preliminary uncertainty analysis on the residential sector suggests that the main uncertainty source in this work is the diversity in emission factors available, calling for the need to compile emission factors that include local conditions. Uncertainties also exist in activity data as suggested by the difference in CO2 emissions between INEMA and EDGAR.
We note that what we call the “residential sector” in EDGAR corresponds to IPCC code 1A4 and therefore, in addition to including residential emissions, also includes emissions from commercial activities, agriculture, forestry, fishing and fish farms. Given that the residential sector in INEMA only considers residential emissions (IPCC code 1A4b) the difference between both inventories (INEMA and EDGAR) are actually larger than illustrated in this study. Nevertheless, future versions of INEMA need to estimate the emissions from all activities in IPCC code 1A4 and not only residential emissions. This means including not only emissions from commercial activity, agriculture, forestry, fishing and fish farms but also residential emissions from fuels other than biomass.
The dominant contribution of the residential sector to various pollutants, especially particulate matter, highlights the importance of increasing efforts to mitigate this source. Increasing the thermal efficiency of dwellings, improving the firewood combustion quality by reducing the humidity of burned woods, increasing the efficiency of combustion technologies and implementing educational campaigns that ensure the correct use of the devices are among the potential policies to achieve this goal. Nevertheless, a consistent and robust estimation of firewood consumption is a prerequisite to estimate emissions from the residential sector. This requires the creation of an official database that characterizes firewood consumption throughout the territory. Given the timeliness of the consumption data used in the present work, the absence of such an official database would prevent updating the present inventory in the near future considering there is no activity level data of the residential sector collected regularly for the whole country. Furthermore, additional studies need to be conducted to develop EFs for residential emissions of VOC, CO, NMVOC and CH4 that consider local operating conditions, appliance type, the humidity of firewood and the tree species.
This is the first version of a national gridded inventory and will need to be further developed and continuously updated. It can be an important reference and benchmark for comparison in the future to track the impact of mitigation or other policy measures. Further, future development of this inventory should consider, for instance, including the speciation of VOCs, the agriculture sector and off-road vehicle emissions as well as emissions from non-paved roads given that approximately 60 % of the national roads in Chile fall into this category and completing the industry sector by locating in the territory the non-documented sources. Nevertheless, this inventory provides policymakers, stakeholders and scientists with qualified scientific spatially explicit emission information to support air quality modeling and the development and further evaluation of policies to minimize (health- and climate-relevant) atmospheric pollutant emissions.
Table A1Emission factors (g kg−1) for the residential sector by technology (appliance type), humidity and operation device conditions.
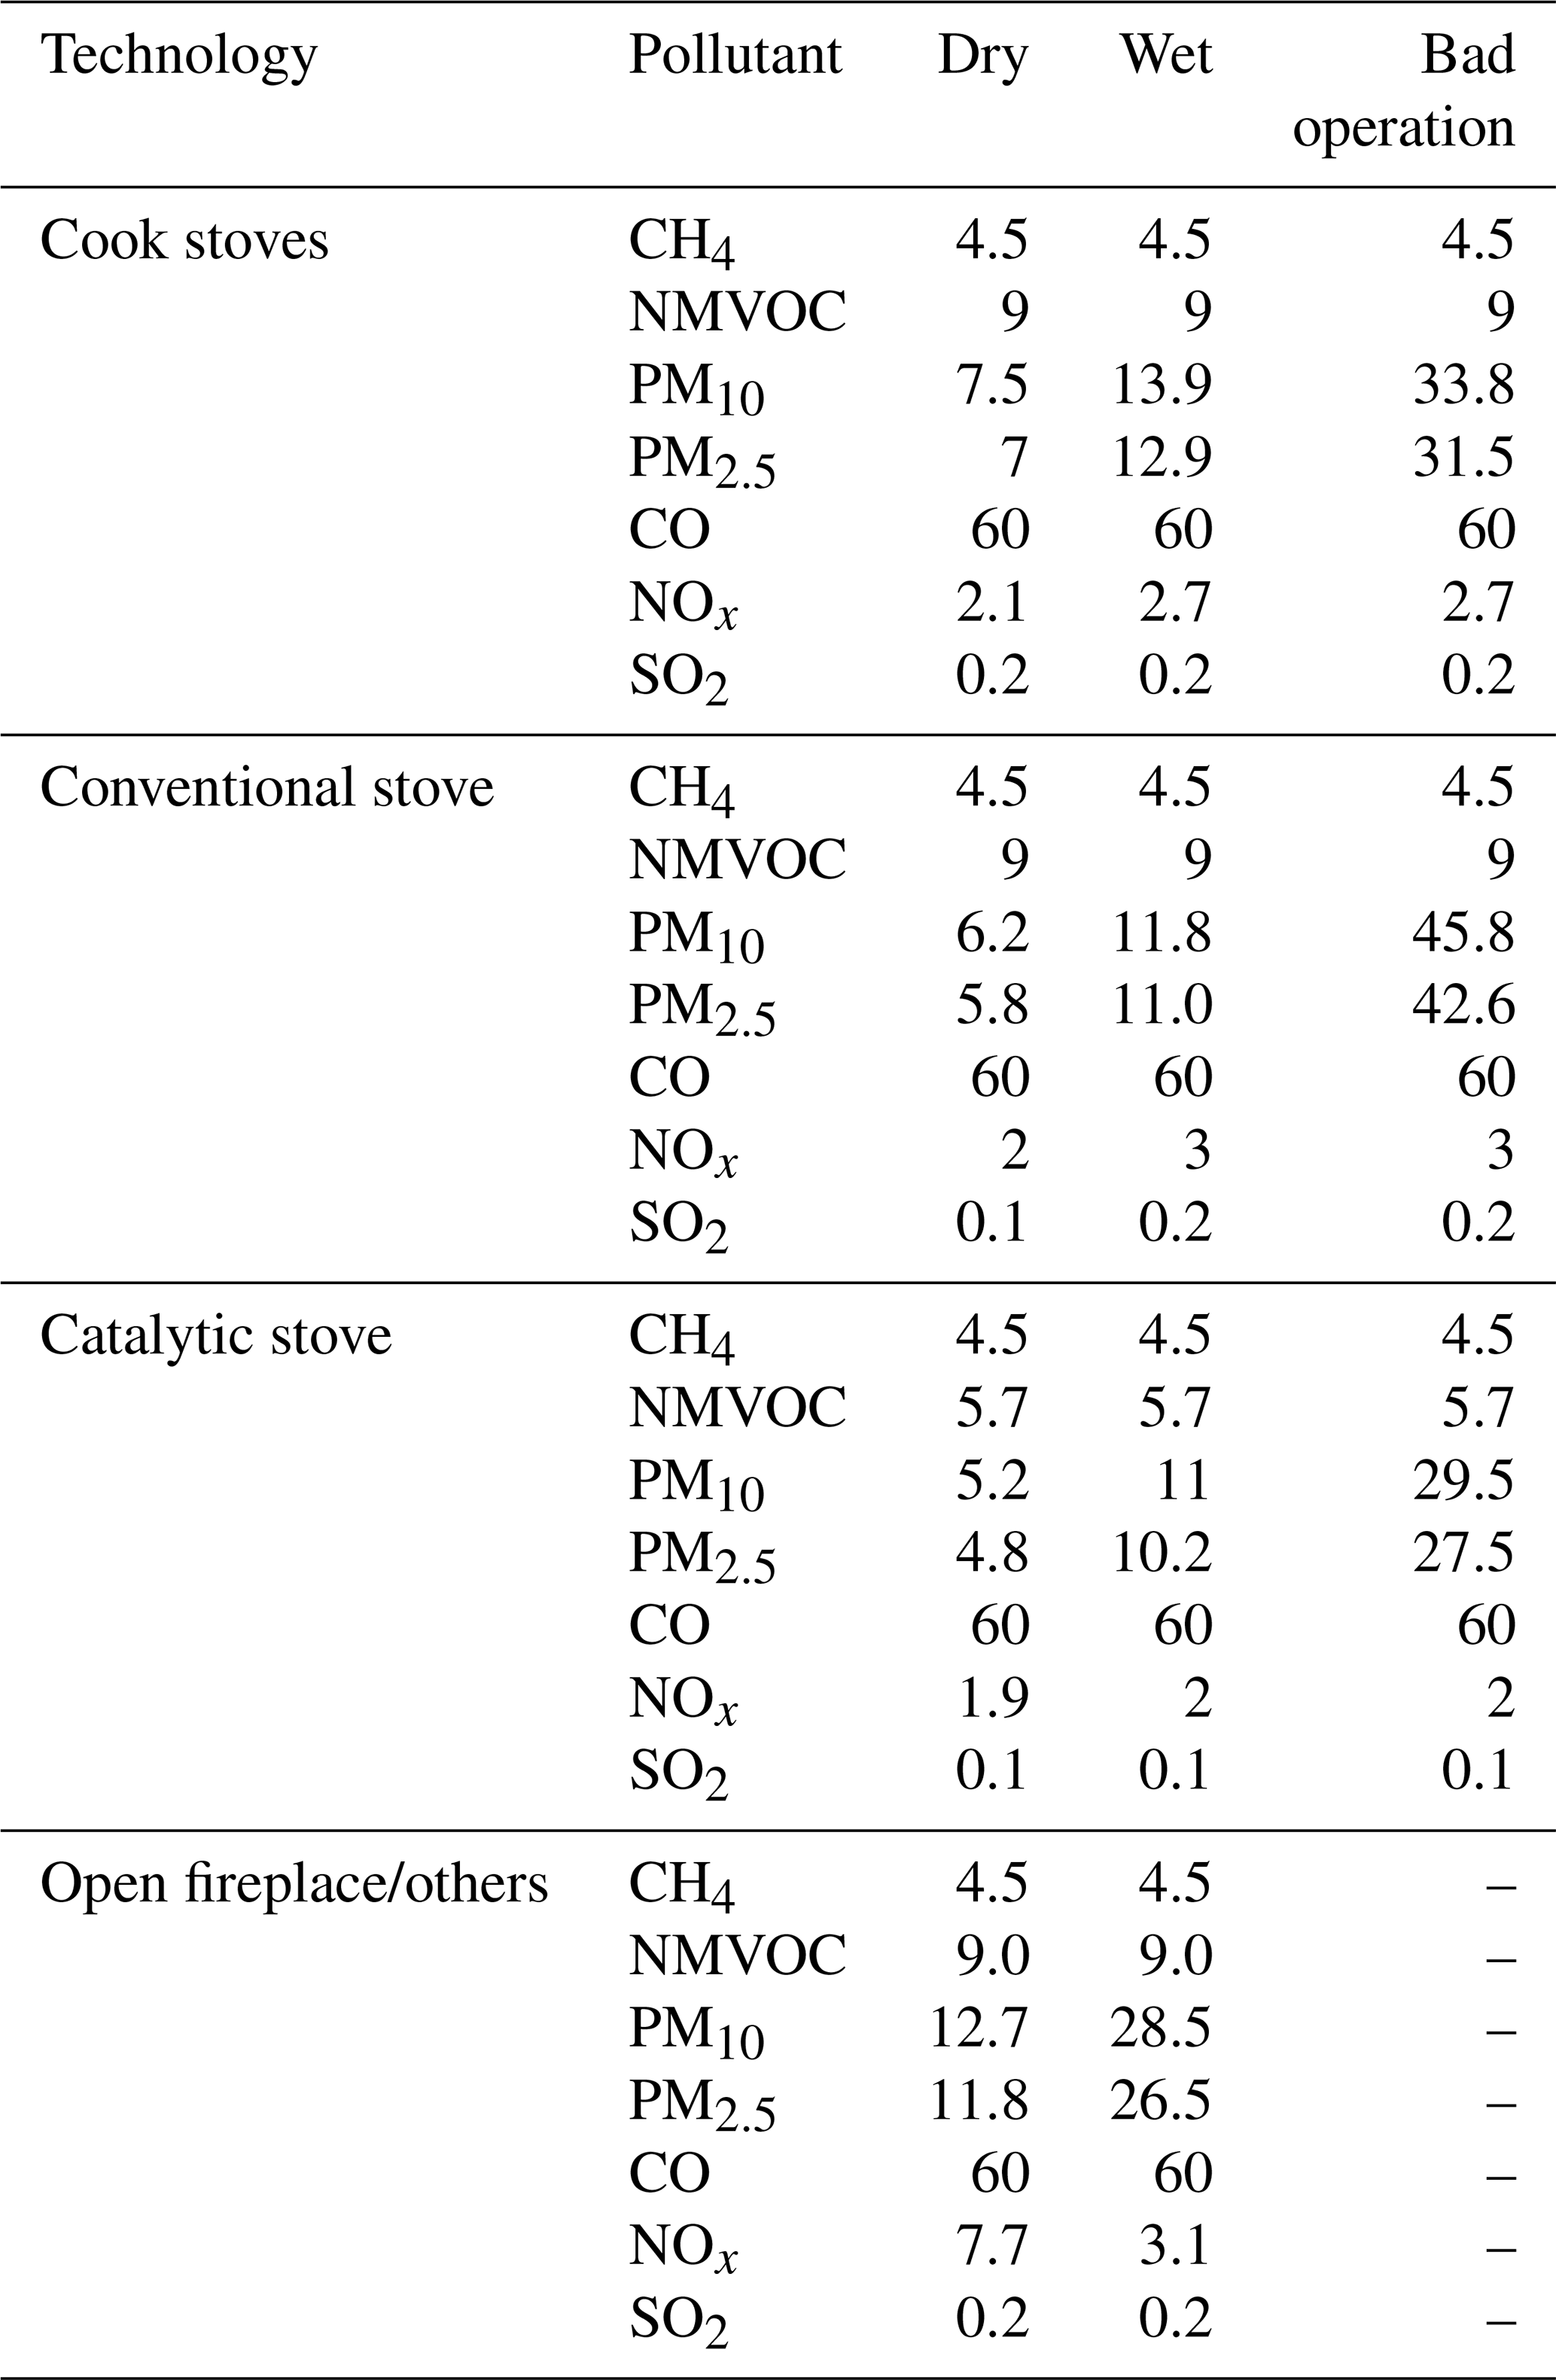
Table A1 shows emission factors (g kg−1) for the residential sector by technology (appliance type), humidity and operation device conditions for PM10, PM2.5, NOx and SO2. For CO and NMVOCs (non-methane VOCs) we use EFs for dry firewood from EMEP/EEA (2019), while for CH4 the EFs estimated on the tier 1 approach from IPCC (2006b) are used.
Table A2 shows the aggregated emission factors (g kg−1) at the regional level for each pollutant used in the residential sector (Eq. A1), considering the distribution of technologies and humidity conditions of fuelwood estimated in CDT (2015) for each region and 30 % of devices had a bad operation, according to RETC (MMA, 2019b). For CO2 and NH3 EFs estimated from MMA (2019b) are used:
where EFijz is the emission factor for pollutant i on region j; is the lab emission factor estimated for pollutant i, humidity conditions of fuelwood x, technology for combustion y and quality operation device z; Hx,j is the proportion of humidity conditions x of fuelwood on region j; Ty,j is the proportion of technology conditions for fuelwood combustion y on region j; and ODz is the proportion of bad-operation device condition z considered at the national level.
Table A2Aggregated emission factors (g kg−1) at a regional level for each pollutant used in the residential sector.

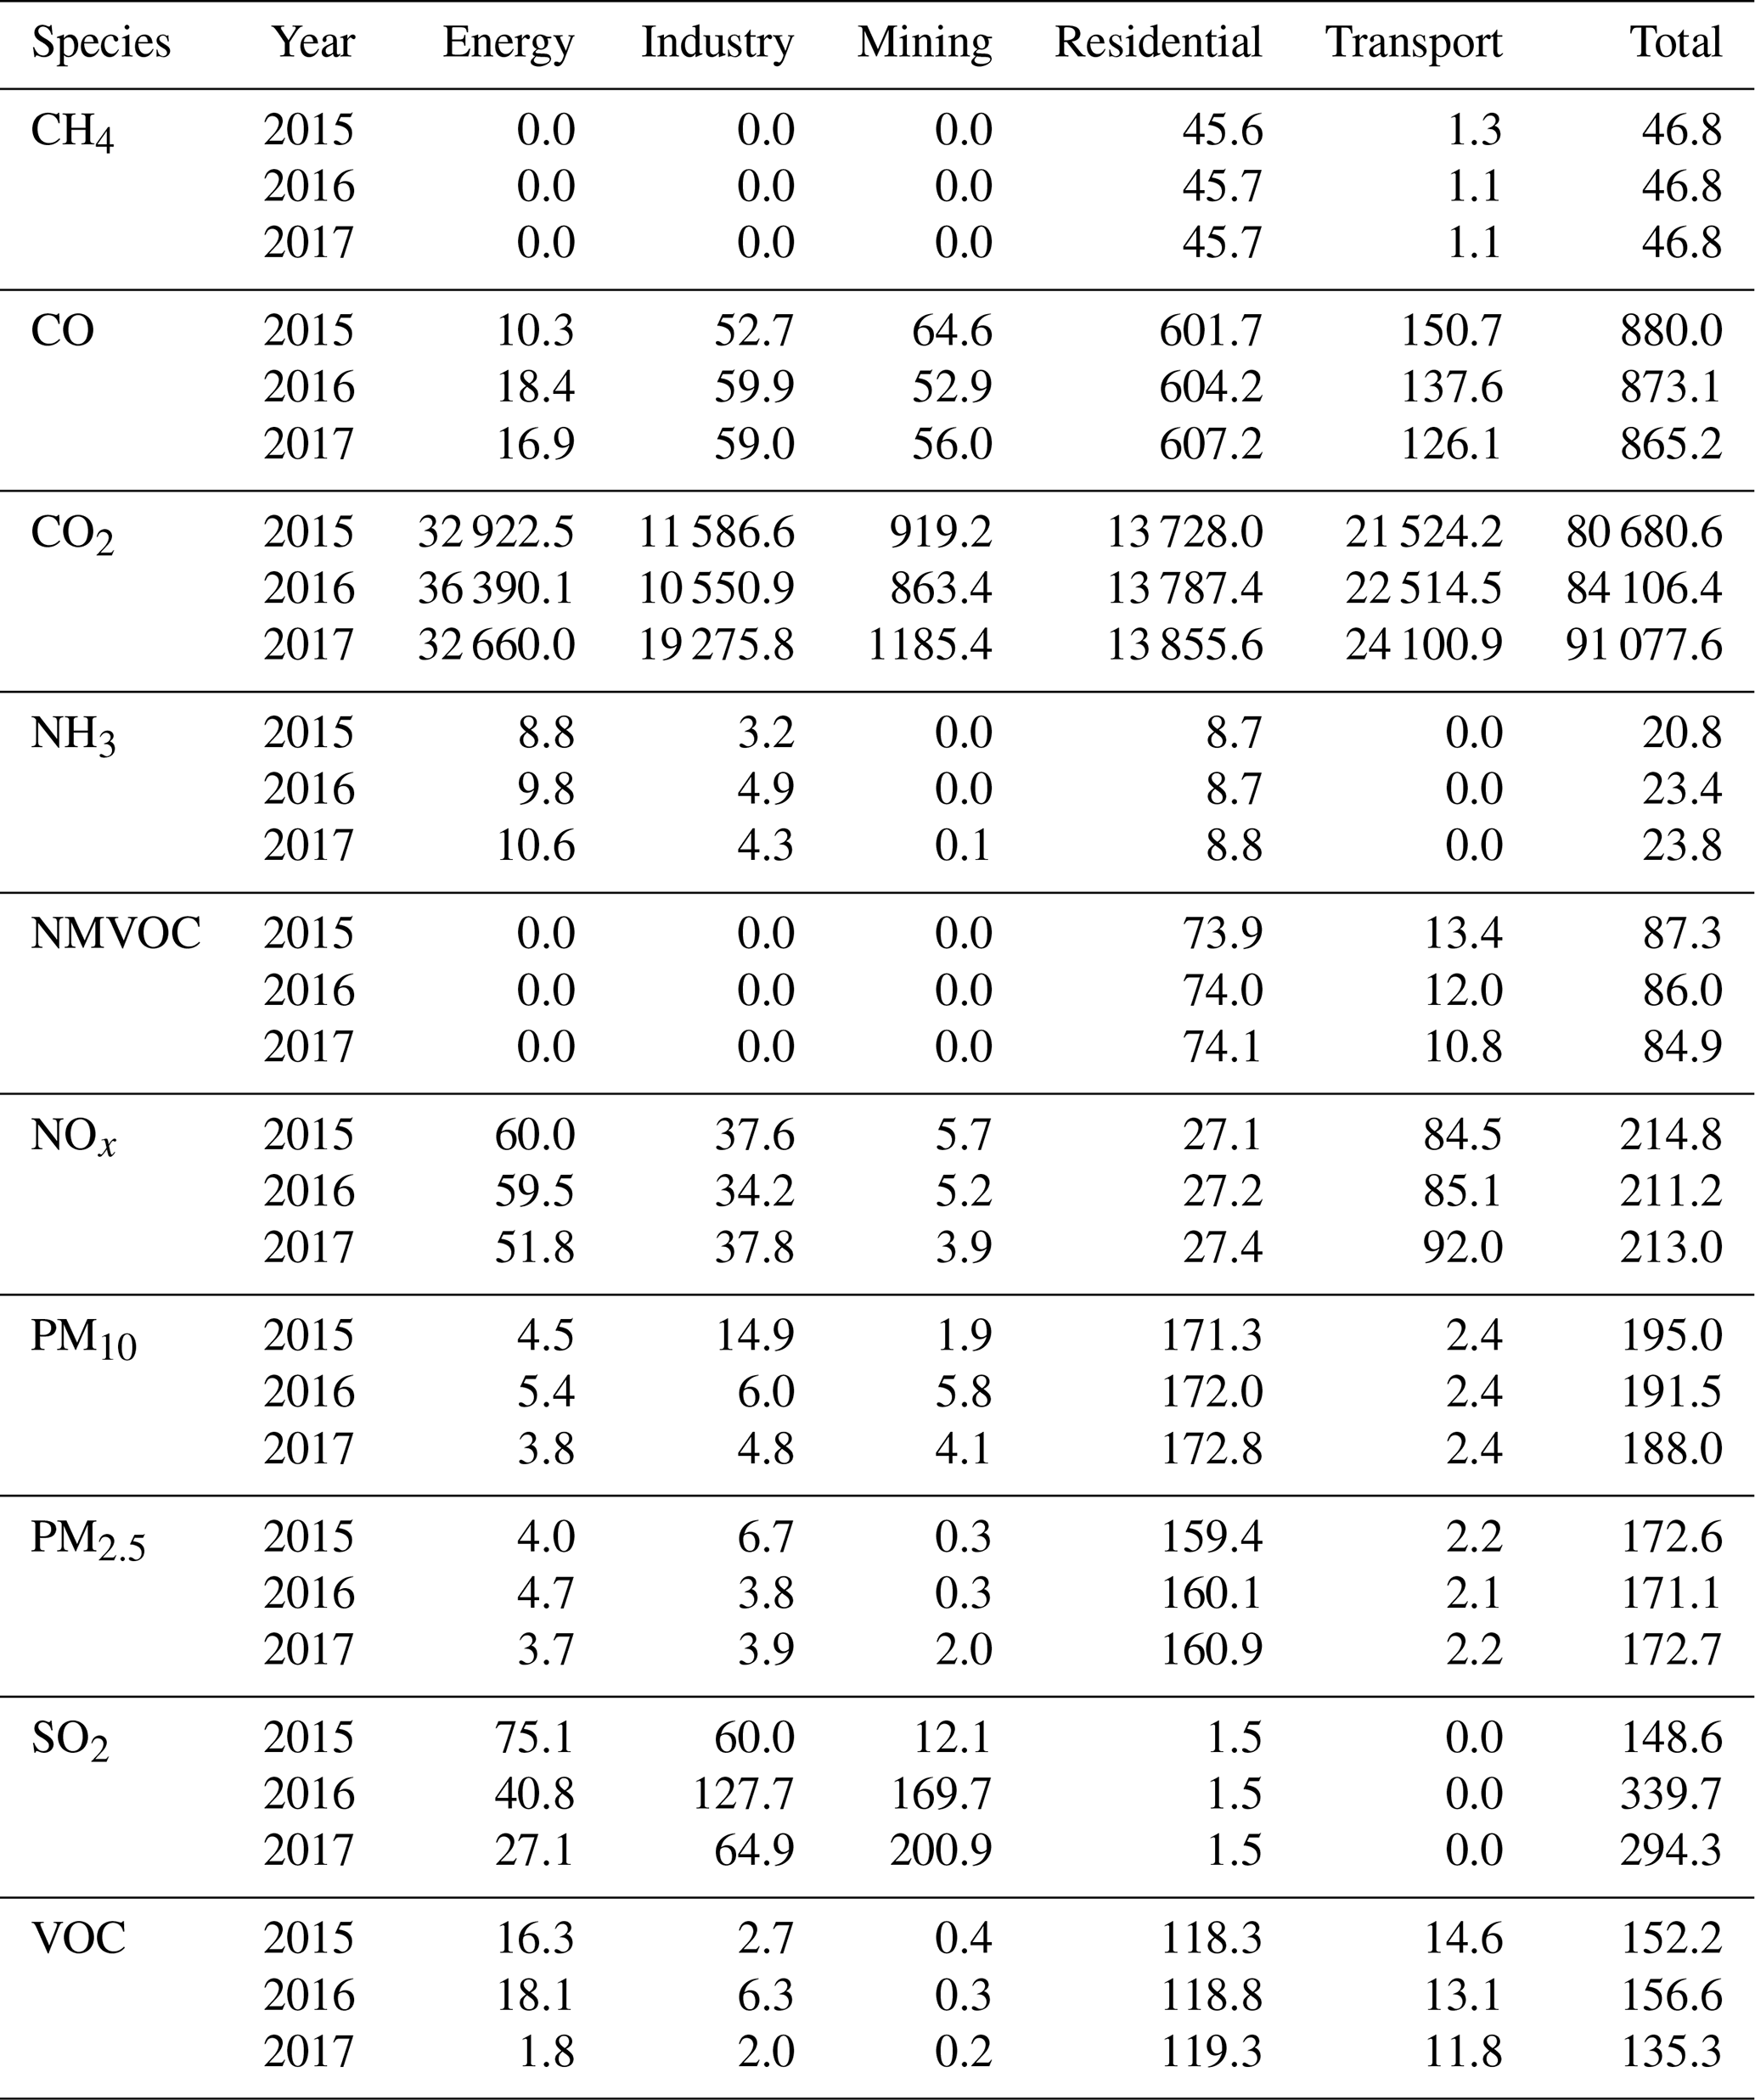
Table B1 displays the total emissions (kt a−1) by year and sector for each pollutant of INEMA with information for more than one sector (represented in Fig. 4).
Table B1Total emissions (kt a−1) by year and sector for each pollutant represented in Fig. 4.
NA and NH led the study and wrote the original draft with contributions from all authors. NA, NH, MOpazo and SP prepared and curated the data. MOsses and NP generated and described the emissions from the transport sector. RR and AS participated in the processing of the residential activity level data. NA generated the residential-emission data, while NA and MOpazo prepared the industry, mining and energy emission estimates. HDvdG and NH designed the algorithm to distribute the residential emissions and together with RC provided feedback on the methodology used and the global consistency of the inventory. All the authors reviewed and edited the manuscript.
At least one of the (co-)authors is a member of the editorial board of Earth System Science Data. The peer-review process was guided by an independent editor, and the authors also have no other competing interests to declare.
Publisher's note: Copernicus Publications remains neutral with regard to jurisdictional claims in published maps and institutional affiliations.
This article is part of the special issue “Surface emissions for atmospheric chemistry and air quality modelling”. It is not associated with a conference.
The authors would like to thank the Center for Climate and Resilience Research (Fondap no. 15110009) for institutional support and funding. Thanks also go to the data providers of the EDGAR v5.0 database, available on the EDGAR air pollutant website (https://edgar.jrc.ec.europa.eu/overview.php?v=50_AP, last access: 1 June 2021) and Crippa et al. (2019) (https://doi.org/10.2904/JRC_DATASET_EDGARTS23). Nicolás Huneeus acknowledges the support of project ANID-PIA-Anillo INACHACT192057. This study was supported by the MAP-AQ which is an IGAC- and WMO-sponsored activity. This research was partially supported by the supercomputing infrastructure of the NLHPC (ECM-02, Powered@NLHPC).
The Center for Climate and Resilience Research (Fondap no. 15110009) provided financial support. Nicolás Huneeus was also partially funded by the Science, Technology, Knowledge and Innovation Ministry of Chile through the FONDECYT (grant no. N1181139) and Research and Innovation programs (grant agreement no. N870301, AQ-WATCH). Mauricio Osses was funded by Centro Científico Tecnológico de Valparaíso ANID PIA/APOYO AFB 180002.
This paper was edited by Nellie Elguindi and reviewed by two anonymous referees.
Alamos, N., Hunneus, N., Osses, M., Opazo, M., Puja, S., and Pantoja, N.: INEMA: High resolution inventory of atmospheric emissions from transport, industrial, energy, mining and residential sectors of Chile, Version 1.0, Zenodo [data set], https://doi.org/10.5281/zenodo.4784286, 2021.
BCN (Biblioteca del Congreso Nacional): Mapoteca, Mapas vectoriales, available at: https://www.bcn.cl/siit/mapas_vectoriales, last access: 30 June 2020.
CDT (Corporación de Desarrollo Tecnológico): Medición del consumo nacional de leña y otros combustibles sólidos derivados de la madera, Ministerio de Energía, Santiago, Chile, available at: http://www.biblioteca.digital.gob.cl/handle/123456789/586 (last access: 30 June 2020), 2015.
Crippa, M., Guizzardi, D., Muntean, M., Schaaf, E., Dentener, F., van Aardenne, J. A., Monni, S., Doering, U., Olivier, J. G. J., Pagliari, V., and Janssens-Maenhout, G.: Gridded emissions of air pollutants for the period 1970–2012 within EDGAR v4.3.2, Earth Syst. Sci. Data, 10, 1987–2013, https://doi.org/10.5194/essd-10-1987-2018, 2018.
Crippa, M., Oreggioni, G., Guizzardi, D., Muntean, M., Schaaf, E., Lo Vullo, E., Solazzo, E., Monforti-Ferrario, F., Olivier, J. G. J., and Vignati, E.: Fossil CO2 and GHG emissions of all world countries – 2019 Report, EUR 29849 EN, Publications Office of the European Union, Luxembourg, https://doi.org/10.2760/687800, 2019.
Crippa, M., Solazzo, E., Huang, G., Guizzardi, D., Koffi, E., Muntean, M., Schieberle, C., Friedrich, R., and Janssens-Maenhout, G.: High resolution temporal profiles in the Emissions Database for Global Atmospheric Research, Sci. Data, 7, 121, https://doi.org/10.1038/s41597-020-0462-2, 2020.
EMEP/EEA: EMEP/EEA Air Pollutant Emission Inventory Guidebook 2016 – Technical Guidance to Prepare National Emission Inventories, EEA Report no. 21, 2016.
EMEP/EEA: EMEP/EEA Air Pollutant Emission Inventory Guidebook – 1.A.4 Small Combustion, 189 pp., available at: https://www.eea.europa.eu/publications/emep-eea-guidebook-2019/part-b-sectoral-guidance-chapters/1-energy/1-a-combustion/1-a-4-small-combustion/view (last access: 30 March 2021), 2019.
EMEP/EEA: 1.A.3.b.i-iv Road Transport Appendix 4 Emission Factors 2019, in: EMEP/EEA air pollutant emission inventory guidebook 2019, updated on 25 September 2020 and linked to COPERT v. 5.4, EMEP/EEA [data set], available at: https://www.eea.europa.eu/publications/emep-eea-guidebook-2019/part-b-sectoral-guidance-chapters/1-energy/1-a-combustion/road-transport-appendix-4-emission/view (last access: 30 March 2021), 2020.
Gómez, B.: Modelación y proyección de las emisiones generadas por vehículos terrestres en el periodo 2020–2050 en Chile, Undergraduate Thesis, Universidad Técnica Federico Santa Maria, Santiago, Chile, available at: https://repositorio.usm.cl/ (last access: 10 November 2020), 2020.
Guerrero, F., Yáñez, K., Vidal, V., and Cereceda-Balic, F.: Effects of wood moisture on emission factors for PM2.5, particle numbers and particulate-phase PAHs from Eucalyptus globulus combustion using a controlled combustion chamber for emissions, Sci. Total Environ., 648, 737–744, https://doi.org/10.1016/j.scitotenv.2018.08.057, 2019.
Huneeus, N., van der Gon, H. D., Castesana, P., Menares, C., Granier, C., Granier, L., Alonso, M., de Fatima Andrade, M., Dawidowski, L., Gallardo, L., and Gomez, D.: Evaluation of anthropogenic air pollutant emission inventories for South America at national and city scale, Atmos. Environ., 235, 117606, https://doi.org/10.1016/j.atmosenv.2020.117606, 2020a.
Huneeus, N., Urquiza, A., Gayó, E., Osses, M., Arriagada, R., Valdés, M., Álamos, N., Amigo, C., Arrieta, D., Basoa, K., Billi, M., Blanco, G., Boisier, J. P., Calvo, R., Casielles, I., Castro, M., Chahuán, J., Christie, D., Cordero, L., Correa, V., Cortés, J., Fleming, Z., Gajardo, N., Gallardo, L., Gómez, L., Insunza, X., Iriarte, P., Labraña, J., Lambert, F., Muñoz, A., Opazo, M., O'Ryan, R., Osses, A., Plass, M., Rivas, M., Salinas, S., Santander, S., Seguel, R., Smith, P., and Tolvett, S.: El aire que respiramos: pasado, presente y futuro – Contaminación atmosférica por MP2,5 en el centro y sur de Chile, Centro de Ciencia del Clima y la Resiliencia (CR)2, (ANID/FONDAP/15110009), 102 pp., available at: https://www.cr2.cl/contaminacion/ (last access: 1 March 2021), 2020b.
INE (Instituto Nacional de Estadísticas): Censo 2017, INE [data set], Chile, available at: http://www.censo2017.cl/microdatos/ (last access: 20 October 2020), 2017a.
INE (Instituto Nacional de Estadísticas): Official Statistics for transport webpage, INE [data set], available at: https://www.ine.cl/estadisticas/economia/transporte-y-comunicaciones/permiso-de-circulacion (last access: 20 October 2020), 2017b.
INE (Instituto Nacional de Estadísticas): Estimaciones y proyecciones de la población en Chile 2002–2035: totales regionales, población urbana y rural, INE [data set], available at: https://www.ine.cl/estadisticas/sociales/demografia-y-vitales/proyecciones-de-poblacion#:~:text=Las%20proyecciones%20de%20poblaci%C3%B3n%20proporcionan,demogr%C3%A1ficos%20fecundidad%2C%20mortalidad%20y%20migraci%C3%B3n (last access: 20 October 2020), 2019.
INFOR (Instituto Forestal): Base de datos no publicada. Sistema nacional de monitoreo del consumo de leña y otros biocombustibles sólidos, Instituto Forestal [data set], Valdivia, Chile, 2019.
IPCC: Chapter 2: Stationary combustion, in: 2006 IPCC Guidelines for National Greenhouse Gas Inventories, IEA, Volume 2: Energy, The National Greenhouse Gas Inventories Program, edited by: Gómez, D. R., Watterson, J. D., Americano, B. B., Ha, C., Marland, G., Matsika, E., Namayanga, L. N., Osman-Elasha, B., Kalenga, J. D., Tranton, K., Hayama, Kanagawa, Japan, 2006a.
IPCC: Chapter 4: Methodological Choice and identification of key categories, in: 2006 IPCC Guidelines for National Greenhouse Gas Inventories, Volume 1: General Guidance and Reporting, The National Greenhouse Gas Inventories Program, edited by: Eggleston, H. S., Buendia, L., Miwa, K., Ngara, T., Tanabe, K., Hayama, Kanagawa, Japan, 2006b.
Jimenez, J., Farias, O., Quiroz, R., and Yañez, J.: Emission factors of particulate matter, polycyclic aromatic hydrocarbons, and levoglucosan from wood combustion in south-central Chile, JAPCA J. Air Waste Ma., 67, 806–813, https://doi.org/10.1080/10962247.2017.1295114, 2017.
Klimont, Z., Kupiainen, K., Heyes, C., Purohit, P., Cofala, J., Rafaj, P., Borken-Kleefeld, J., and Schöpp, W.: Global anthropogenic emissions of particulate matter including black carbon, Atmos. Chem. Phys., 17, 8681–8723, https://doi.org/10.5194/acp-17-8681-2017, 2017.
Longo, K. M., Freitas, S. R., Pirre, M., Marécal, V., Rodrigues, L. F., Panetta, J., Alonso, M. F., Rosário, N. E., Moreira, D. S., Gácita, M. S., Arteta, J., Fonseca, R., Stockler, R., Katsurayama, D. M., Fazenda, A., and Bela, M.: The Chemistry CATT-BRAMS model (CCATT-BRAMS 4.5): a regional atmospheric model system for integrated air quality and weather forecasting and research, Geosci. Model Dev., 6, 1389–1405, https://doi.org/10.5194/gmd-6-1389-2013, 2013.
MAPS Chile: Escenarios referenciales para la mitigación del cambio climático en Chile., Resultados de la Fase 1, Ministerio del Medio Ambiente, Santiago, Chile, available at: https://mma.gob.cl/cambio-climatico/proyecto-maps-chile/ (last access: 20 May 2020), 2013.
Melamed, M. L., Schmale, J., von Schneidemesser, E.: Sustainable policy – key considerations for air quality and climate change, Curr. Opin. Env. Sust., 23, 85–91, https://doi.org/10.1016/j.cosust.2016.12.003, 2016.
MDS (Ministerio de Desarrollo Social): Encuesta CASEN 2015, Observatorio Social [data set], available at: http://observatorio.ministeriodesarrollosocial.gob.cl/encuesta-casen-2015 (last access: 1 September 2020), 2015.
MDS (Ministerio de Desarrollo Social): Encuesta CASEN 2017, Observatorio Social [data set], available at: http://observatorio.ministeriodesarrollosocial.gob.cl/encuesta-casen-2017 (last access: 1 September 2020), 2017.
MMA (Ministerio del Medio Ambiente): Segundo Informe del Inventario Nacional de Gases de Efecto Invernadero de Chile serie 1990–2013, Ministerio del Medio Ambiente, Santiago, Chile, 517 pp., 2017.
MMA (Ministerio del Medio Ambiente): Quinto Reporte del Estado del Medio Ambiente, Santiago, Chile, available at: https://sinia.mma.gob.cl/wp-content/uploads/2019/12/REMA-2019-comprimido.pdf (last access: 20 April 2021), 2019a.
MMA (Ministerio del Medio Ambiente): Informe Consolidado de Emisiones y Transferencias de Contaminantes 2005–2017, Santiago, Chile, available at: https://retc.mma.gob.cl/publicaciones/, 2019b.
MMA (Ministerio del Medio Ambiente): Inventario Nacional de GEI 1990–2018. Sistema Nacional de Inventarios de Gases de Efecto Invernadero [data set], available at: https://snichile.mma.gob.cl/documentos/ (last access: 20 September 2021), 2020.
Muñoz, E., Navia, R., Zaror, C., and Alfaro, M.: Ammonia emissions from livestock production in Chile: an inventory and uncertainty analysis, J. Soil Sci. Plant Nut., 16, 60–75, https://doi.org/10.4067/S0718-95162016005000005, 2016.
OSM: Open Street Maps, 2020, Webpage for Chile, available at: https://wiki.openstreetmap.org/wiki/ES:Chile, last access: 30 June 2020.
Osses, M., Rojas, N., Ibarra, C., Valdebenito, V., Laengle, I., Pantoja, N., Osses, D., Basoa, K., Tolvett, S., Huneeus, N., Gallardo, L., and Gómez, B.: High-definition spatial distribution maps of on-road transport exhaust emissions in Chile, 1990–2020, Earth Syst. Sci. Data Discuss. [preprint], https://doi.org/10.5194/essd-2021-218, in review, 2021.
Puliafito, S. E., Allende, D. G., Castesana, P. S., and Ruggeri, M. F.: High-resolution atmospheric emission inventory of the argentine energy sector. Comparison with EDGAR global emission database, Heliyon, 3, e00489, https://doi.org/10.1016/j.heliyon.2017.e00489, 2017.
RedPE: Caracterización del mercado de la leña y sus barreras para la transición energética, Red de Pobreza Energética, Santiago, Chile, available at: https://www.pobrezaenergetica.cl (last access: 5 September 2021), 2020.
Reyes, R.: Consumo de combustibles derivados de la madera y transición energética en la Región de Los Ríos, periodo 1991–2014, in: Informes Técnicos BES, Bosques – Energía – Sociedad, Año 3, no. 6, Enero 2017, Observatorio de los Combustibles Derivados de la Madera OCDM, Instituto Forestal, Chile, p. 20, available at: https://observatoriobes.infor.cl/ (last access: 15 October, 2020), 2017.
Reyes, R., Sagardía, R., and Schueftan A.: Consumo de combustibles derivados de la madera y transición energética en la Región del Maule, in: Informes técnicos BES, Bosques – Energía – Sociedad, Año 4, no. 8, Enero 2018, Observatorio de los Combustibles Derivados de la Madera OCDM, Instituto Forestal, Chile, p. 24, available at: https://observatoriobes.infor.cl/ (last access: 15 October, 2020), 2018.
Romero-Lankao, P., Qin, H., and Borbor-Cordova, M.: Exploration of health risks related to air pollution and temperature in three Latin American cities, Soc. Sci. Med., 83, 110–118, https://doi.org/10.1016/j.socscimed.2013.01.009, 2013.
Rondanelli, R., Molina, A., and Falvey, M.: The atacama surface solar maximum, B. Am. Meteorol. Soc., 96, 405–418, https://doi.org/10.1175/BAMS-D-13-00175.1, 2015.
Rosário, N. E., Longo, K. M., Freitas, S. R., Yamasoe, M. A., and Fonseca, R. M.: Modeling the South American regional smoke plume: aerosol optical depth variability and surface shortwave flux perturbation, Atmos. Chem. Phys., 13, 2923–2938, https://doi.org/10.5194/acp-13-2923-2013, 2013.
RTI International: Emissions Factor Uncertainty Assessment, prepared for Office of Air Quality Planning and Standards, US Environmental Protection Agency, US, 108 pp., available at: https://www.epa.gov/sites/default/files/2020-11/documents/ef_uncertainty_assess_draft0207s.pdf (last access: 13 January 2022), 2007.
Saide, P. E., Mena-Carrasco, M., Tolvett, S., Hernandez, P., and Carmichael, G. R.: Air quality forecasting for winter-time PM2.5 episodes occurring in multiple cities in central and southern Chile, J. Geophys. Res.-Atmos., 121, 558–575, https://doi.org/10.1002/2015JD023949, 2016.
Sarricolea, P., Herrera-Ossandon, M., and Meseguer-Ruiz, Ó.: Climatic regionalisation of continental Chile, J. Maps, 13, 66–73, https://doi.org/10.1080/17445647.2016.1259592, 2017.
Scarpelli, T. R., Jacob, D. J., Maasakkers, J. D., Sulprizio, M. P., Sheng, J.-X., Rose, K., Romeo, L., Worden, J. R., and Janssens-Maenhout, G.: A global gridded () inventory of methane emissions from oil, gas, and coal exploitation based on national reports to the United Nations Framework Convention on Climate Change, Earth Syst. Sci. Data, 12, 563–575, https://doi.org/10.5194/essd-12-563-2020, 2020.
Schueftan, A., Sommerhoff, J., and González, A. D.: Firewood demand and energy policy in south-central Chile, Energy Sustain. Dev., 33, 26–35, https://doi.org/10.1016/j.esd.2016.04.004, 2016.
SCSS (Sociedad Consultora Sistemas Sustentables): Análisis y Desarrollo de una Metodología de Estimación de Consumos Energéticos y Emisiones para el Transporte, Report commissioned by Secretaria de Transporte, SECTRA, available at: http://www.sectra.gob.cl/biblioteca/detalle1.asp?mfn=2800 (last access: 30 June 2020), 2010.
SCSS (Sociedad Consultora Sistemas Sustentables): Actualización metodológica del Modelo de Consumo Energético y Emisiones para el Sector Transporte (STEP), Report commissioned by Secretaria de Transporte, SECTRA, available at: http://www.sectra.gob.cl/biblioteca/detalle1.asp?mfn=3236 (last access: 30 June 2020), 2014.
SEC (Superintendencia de Electricidad y Combustibles): Anuario 2017, Santiago, Chile, available at: https://www.sec.cl/area-sec/anuario-sec/ (last access: 30 June 2020), 2017.
SICAM: Actualización del inventario de emisiones atmosféricas de las comunas de Temuco y Padre Las Casas, Año Base 2013, Seremi del Medio Ambiente región de la Araucanía, Temuco, Chile, available at: https://catalogador.mma.gob.cl/sinia/ (last access: 1 June 2021), 2014.
Thunis, P., Degraeuwe, B., Cuvelier, K., Guevara, M., Tarrason, L., and Clappier, A.: A novel approach to screen and compare emission inventories, Air Qual. Atmos. Hlth., 9, 325–333, https://doi.org/10.1007/s11869-016-0402-7, 2016.
UACH (Universidad Austral de Chile): Evaluación del mercado de biomasa y su potencial: Estimación de superficie disponible para el establecimiento de plantaciones dendroenergéticas, Ministerio de Energía y Corporación Nacional Forestal, Santiago, Chile, https://doi.org/10.13140/RG.2.1.2247.0561, 2013.
UNEP/CCAC: Integrated Assessment of Short-Lived Climate Pollutants in Latin America and the Caribbean: Improving Air Quality while Contributing to Climate Change Mitigation, United Nations Environment Programme (UNEP) and Climate and Clean Air Coalition (CCAC), Paris, France, available at: http://ccacoalition.org/en/resources/integrated-assessment-short-lived-climate-pollutants-latin- america-and-caribbean (last access: 20 November 2020), 2018.
US EPA: US EPA AP-42, Chap. 1.9, Residential Fireplaces, US Environmental Protection Agency, US, available at: https://www.epa.gov/air-emissions-factors-and-quantification/ap-42-fifth-edition-volume-i-chapter-1-external-0 (last access: 13 October 2021), 1996a.
US EPA: US EPA AP-42, Chap. 1.10, Residential Wood Stoves, US Environmental Protection Agency, US, available at: https://www.epa.gov/air-emissions-factors-and-quantification/ap-42-fifth-edition-volume-i-chapter-1-external-0 (last access: 13 October 2021), 1996b.
WHO: Health risk assessment of air pollution – general principles, WHO Regional Office for Europe, Copenhagen, available at: https://www.euro.who.int/en/publications/abstracts/health-risk-assessment-of-air-pollution.-general-principles-2016#:~:text=General%20principles%20(2016),-AddThis%20Sharing%20Buttons&text=An%20air%20pollution%20health%20risk,for%20informing%20public%20policy%20decisions (last access: 2 April 2020), 2016.
Zhao, Y., Nielsen, C. P., Lei, Y., McElroy, M. B., and Hao, J.: Quantifying the uncertainties of a bottom-up emission inventory of anthropogenic atmospheric pollutants in China, Atmos. Chem. Phys., 11, 2295–2308, https://doi.org/10.5194/acp-11-2295-2011, 2011.
- Abstract
- Introduction
- Methodology and data
- Results
- Uncertainty and quality of estimations on the residential sector
- Data availability
- Conclusions
- Appendix A
- Appendix B
- Author contributions
- Competing interests
- Disclaimer
- Special issue statement
- Acknowledgements
- Financial support
- Review statement
- References