the Creative Commons Attribution 4.0 License.
the Creative Commons Attribution 4.0 License.
 | 28 Jul 2022
Observational data from uncrewed systems over Southern Great Plains
Mikhail S. Pekour
Darielle Dexheimer
Gijs de Boer
RaeAnn Cook
Jason Tomlinson
Beat Schmid
Lexie A. Goldberger
Rob Newsom
Jerome D. Fast
Uncrewed Systems (UxS), including uncrewed aerial systems (UAS) and tethered balloon/kite systems (TBS), are significantly expanding observational capabilities in atmospheric science. Rapid adaptation of these platforms and the advancement of miniaturized instruments have resulted in an expanding number of datasets captured under various environmental conditions by the Department of Energy (DOE) Atmospheric Radiation Measurement (ARM) user facility. In 2021, observational data collected using ARM UxS platforms, including seven TigerShark UAS flights and 133 tethered balloon system (TBS) flights, were archived by the ARM Data Center (https://adc.arm.gov/discovery/#/, last access: 11 February 2022) and made publicly available at no cost for all registered users (https://doi.org/10.5439/1846798) (Mei and Dexheimer, 2022). These data streams provide new perspectives on spatial variability of atmospheric and surface parameters, helping to address critical science questions in Earth system science research. This paper describes the DOE UAS/TBS datasets, including information on the acquisition, collection, and quality control processes, and highlights the potential scientific contributions using UAS and TBS platforms.
- Article
(5259 KB) - Full-text XML
-
Supplement
(1883 KB) - BibTeX
- EndNote


Expanding development and deployment of various uncrewed aircraft systems (UAS) result in increasing opportunities for these platforms to provide high-quality atmospheric measurements (Stephens et al., 2000; Hobbs et al., 2002; Villa et al., 2016; de Boer et al., 2020b). Several recent atmospheric science campaigns have provided perspectives on the planetary boundary layer with both UAS (Reuder et al., 2009; Fladeland et al., 2011; Villa et al., 2016; Adkins and Sescu, 2018; Barbieri et al., 2019; Chen et al., 2020; de Boer et al., 2020a, b) and tethered balloon system (TBS) (Schuyler et al., 2019; de Boer et al., 2018; Creamean et al., 2021). These studies have taken advantage of various scales of UAS platforms, ranging from very small (Schuyler et al., 2019; de Boer et al., 2019b) to very large (Intrieri et al., 2014). The above studies developed various cost-efficient sensor systems to probe the Earth system and provided observational data of atmospheric parameters, such as temperature, relative humidity, and wind properties. The use of mid-sized UAS (Group 3, weight more than 55 lbs but less than 1320 lbs) has also gained traction in support of atmospheric science due to the ability of such platforms to carry out remotely sensed and in situ observing missions with collocated instruments in a large payload (>25 lbs) (Bates et al., 2013; Solbø and Storvold, 2013; de Boer et al., 2016; Barfuss et al., 2018; Rudnick et al., 2018; Lee and Kim, 2019). Extended endurance (up to 12 h) and operating range (at altitudes from 0 to 9000 m) support opportunities for extensive data collection, especially when deployed simultaneously with other ground and mobile observation stations (Stephens et al., 2000; Lawson et al., 2011; Bates et al., 2013; de Boer et al., 2016; Barfuss et al., 2018; de Boer et al., 2018, 2019a, b; Vihma et al., 2019).
In 1989, the US Department of Energy (DOE) established the Atmospheric Radiation Measurement (ARM) user facility. A series of instrumented platforms were developed to provide comprehensive measurements to support climate research, providing long-term records of the atmospheric state over a wide range of conditions (Mather and Voyles, 2013). The ARM Unmanned Areal Vehicle (UAV) program was first introduced in 1991 and demonstrated how measurements from UAV platforms contribute to our understanding of cloud and radiative processes through eight flight campaigns and over 140 h of science flights with three different UAV platforms (Stephens et al., 2000). With the continuing maturation of ARM TBS/UAS capabilities, the DOE ARM facility restarted UxS observing around 2013, supporting various TBS and UAS deployments within restricted airspace over Oliktok Point, Alaska (de Boer et al., 2016, 2018, 2019b; Creamean et al., 2021). After re-engaging with such activities, the DOE ARM facility procured and instrumented a mid-size UAS intended to provide new sampling capabilities globally (de Boer et al., 2018). Simultaneously, ARM engaged the community to articulate scientific needs (Mei et al., 2020a), guided and expanded approval requirements for the operation of UAS and TBS (Bendure et al., 2019), and supported the evaluation of numerous UAS platforms at ARM user facilities (Jacob et al., 2018; Schuyler et al., 2019), and practiced joint UAS-Balloon activities (Dexheimer et al., 2018).
This development path has resulted in an improved ability of the DOE ARM program to support lower-atmospheric research. One specific example of this type of research that is being undertaken involves detailed observations of the atmospheric boundary layer (ABL). Accurate prediction of ABL processes is challenging due to the diurnal cycle of heating and cooling of the various land surfaces (Banta, 2008; Friedrich et al., 2012; Klein et al., 2014). Known as a “hot spot” for land–atmosphere interactions, the ARM Southern Great Plains (SGP) atmospheric observatory is located in central Oklahoma, where significant diurnal variability is observed in both thermodynamic and kinematic properties (Klein et al., 2015). ARM observations from this location are leveraged to understand the occurrence and impact of mesoscale disturbances on the ABL and connections between ABL processes and the life cycle of shallow convective clouds (Fast et al., 2019). In this sense, extending the surface-based data collected at the SGP facility to include coincident airborne observations is critical in understanding the multitude of processes driving the ABL and its impacts on cloud development, weather, and climate. To meet this community need, the ARM user facility has implemented short-term routine TBS and UAS measurements at the SGP atmospheric observatory, specifically including enhanced observations from a mid-size UAS (Mei et al., 2019; Schmid et al., 2020).
In 2021, the ARM TBS team was routinely deployed at three sites within the SGP network for coordinated flights at two of these three sites: the central facility (C1, Lamont, OK) (Mather and Voyles, 2013) and two extended facilities, EF9 and E36. The TBS team conducted two-week missions in February, May, July, and October 2021, providing vertical profiles of atmospheric parameters, including aerosol properties. In addition, between 8 and 16 November 2021, a mid-size UAS equipped with miniaturized scientific instruments operated over the SGP central facility, collecting an extended dataset. The following sections of this paper provide descriptions of the TBS and UAS operated at the SGP site and the instrumentation carried by these platforms. Subsequent sections offer insight into the flight patterns used to collect data, data processing, and quality control; we conclude with a discussion of the data file structure and availability.
2.1 TBS description and flights
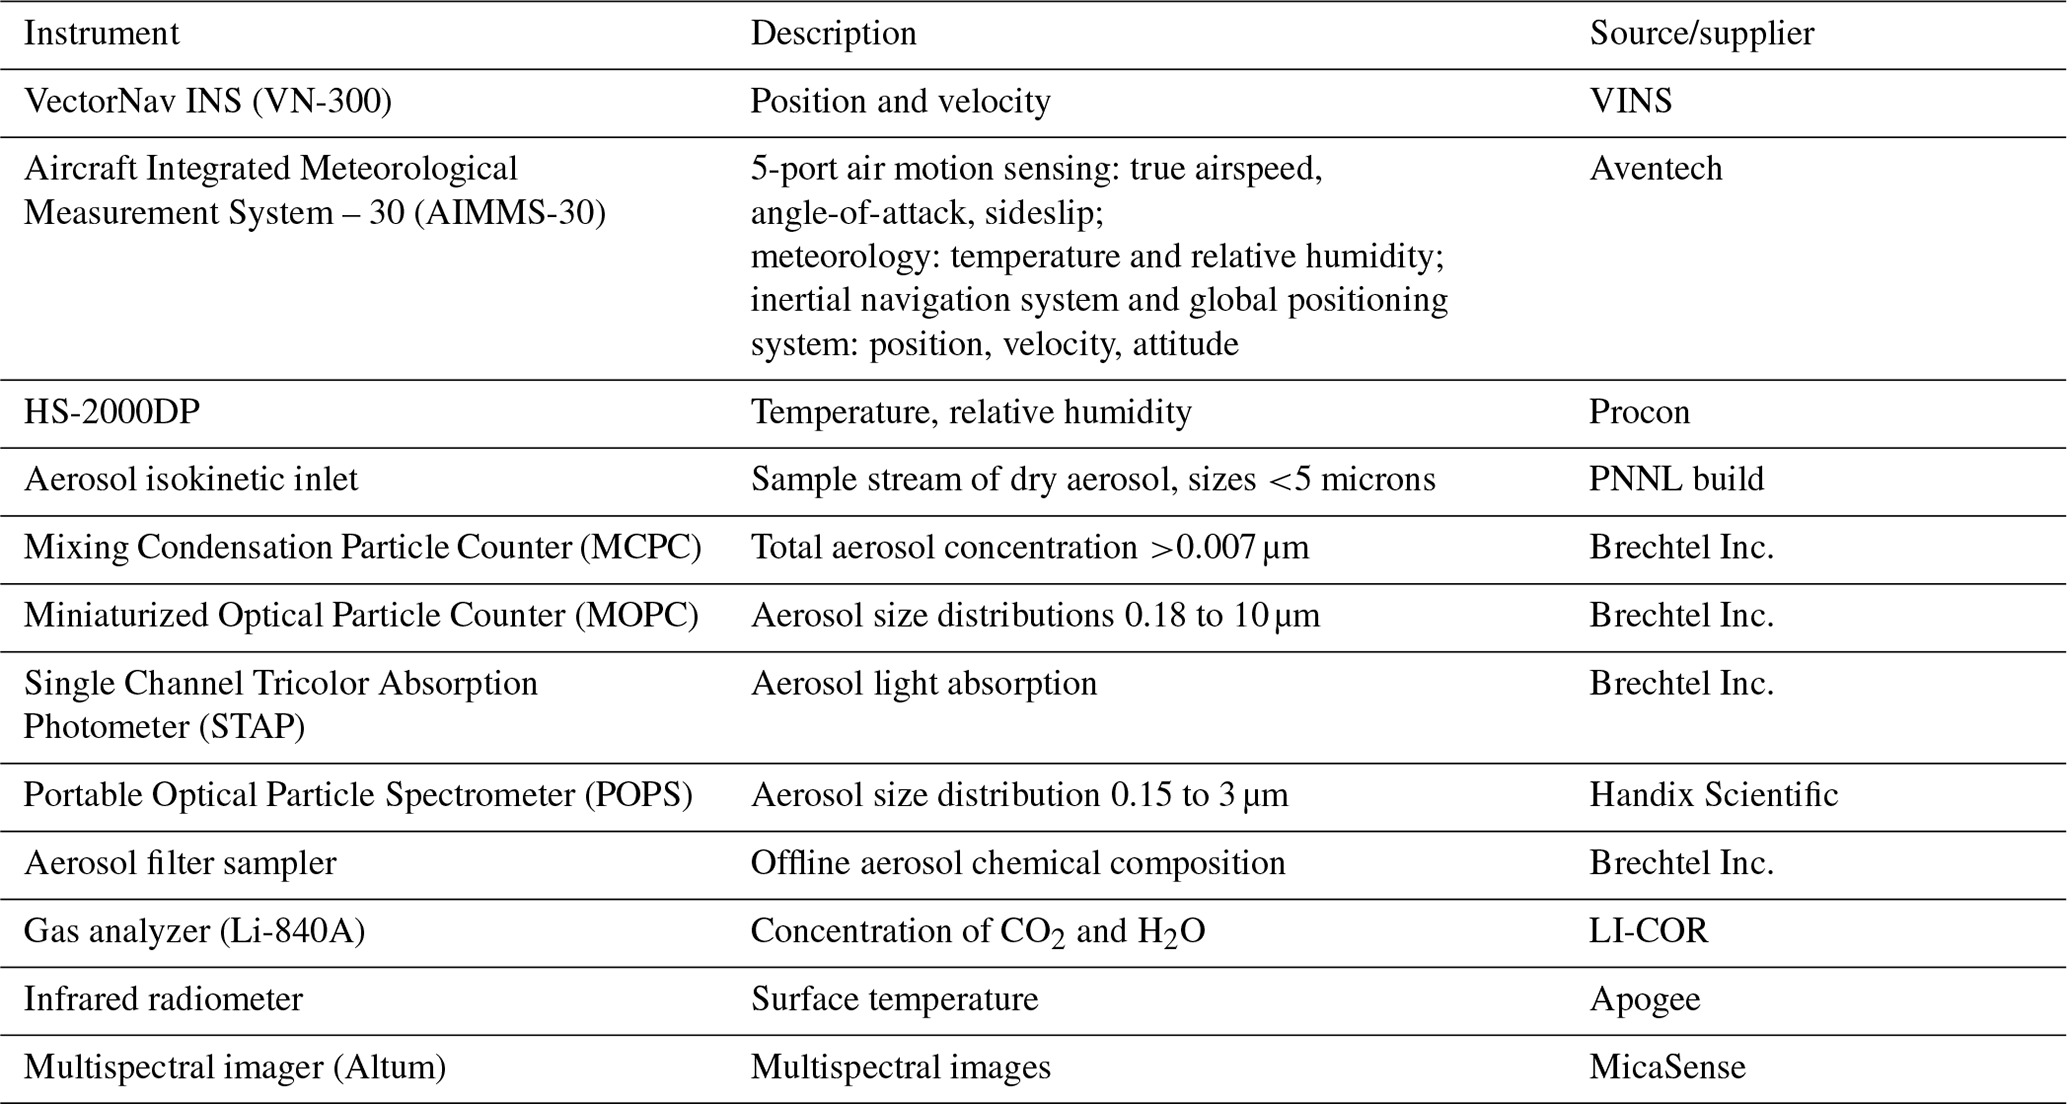
The DOE ARM program has explored the scientific potential of the TBS since 2013. The ARM TBS is an uncrewed system (UxS) composed of a helium-filled balloon, tether, winch system, and a suite of sensors, and currently, the ARM has two sets of them (Dexheimer, 2018). The ultimate goal is to daily deploy the TBS for 2 weeks (as weather permits) at the ARM observatory and spread four deployments throughout a year to capture the seasonal variation. Initial progress toward routine observations was made at Oliktok Point (OLI), AK, in conjunction with the deployment of the third ARM mobile facility (AMF3) in 2014 (de Boer et al., 2016, 2018). In addition, flights within DOE managed special use airspaces (R-2204 and W-220) at and north of OLI promoted the operation of UASs and TBSs and supported the development of publicly available data streams through the ARM Data Archive (Dexheimer, 2018; de Boer et al., 2019a, b; Dexheimer et al., 2019; Creamean et al., 2021). As discussed above, 2020 saw an extension of routine TBS observations to the ARM Southern Great Plains (SGP) atmospheric observatory. Despite the COVID-19 pandemic, the TBS team managed to carry out four missions (133 flights) at the SGP observatory in 2021. Coordinated TBS flights deploying instruments outlined in Table 1 occurred at two sites simultaneously, as shown in Fig. 1. These flights took place over the 160 acres of cattle pasture and wheat fields that make up the SGP, including the central facility C1 and extended facilities EF9 and E36. The three sites are stretched from north to south, with the central facility between the outer two. Together, these three sites are proposed to study the spatial variance of atmospheric properties such as the distribution of aerosols.

Figure 1Map of the TBS deployment locations for flights conducted in 2021.
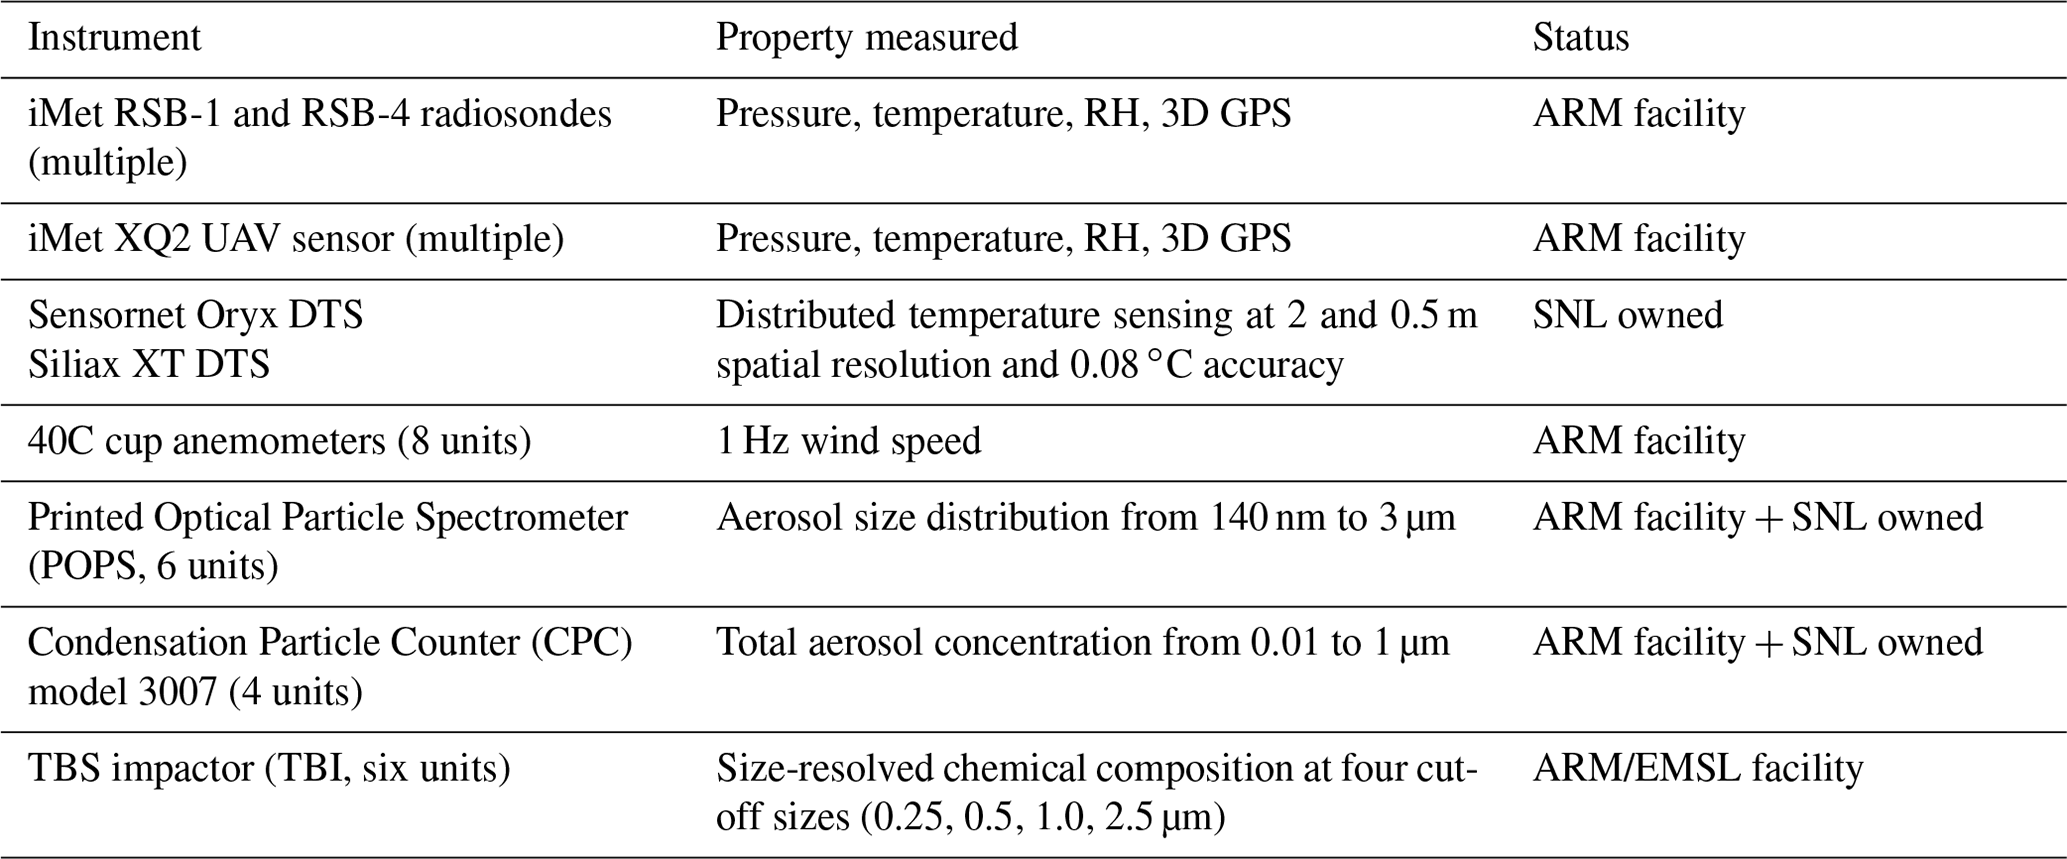
The TBSs were operated under the two (profiling and loitering) flight patterns shown in Figs. 2 and S1 in the Supplement when surface wind speeds were less than 10 m s−1. During the profiling flight pattern, the TBS was launched, carrying the payload (as shown in Fig. S2) to a maximum operating height (up to 2 km depending on the FAA approval) and then descended to the surface to complete one profile. Depending on the surface wind speeds, the maximum payload weight varied between 10 and 25 kg. The TBS employed a loitering flight pattern for targeted sampling. The system would ascend to a designated altitude, such as below the cloud base or inside a cloud, then remain static at that altitude for the desired period, i.e., 5 h, before descending to the surface. During the 2021 SGP deployment, most flights were flown with the profiling pattern (more information is given in Table S3). The purpose of these flights was to collect seasonal observations of boundary layer atmospheric properties and aerosol vertical distributions that could be used to create altitude resolved statistics.
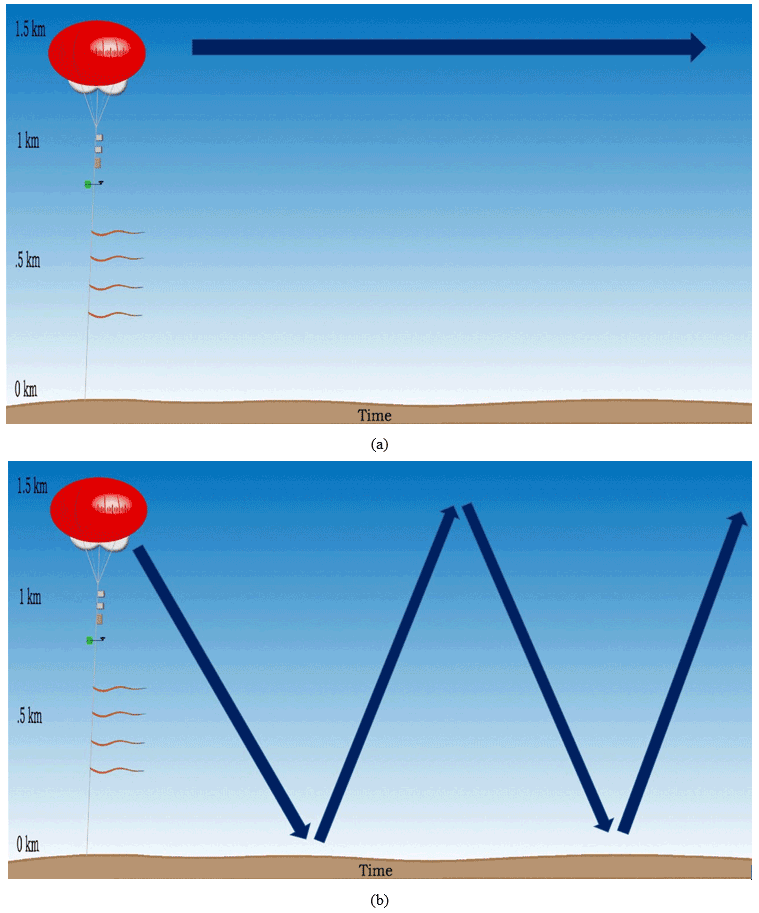
Figure 2TBS typical flight pattern: (a) loitering flight and the balloon fixed at one altitude; (b) profiling flight and the balloon going up and down. The arrows indicate that the altitudes of the balloon remain during the flight.
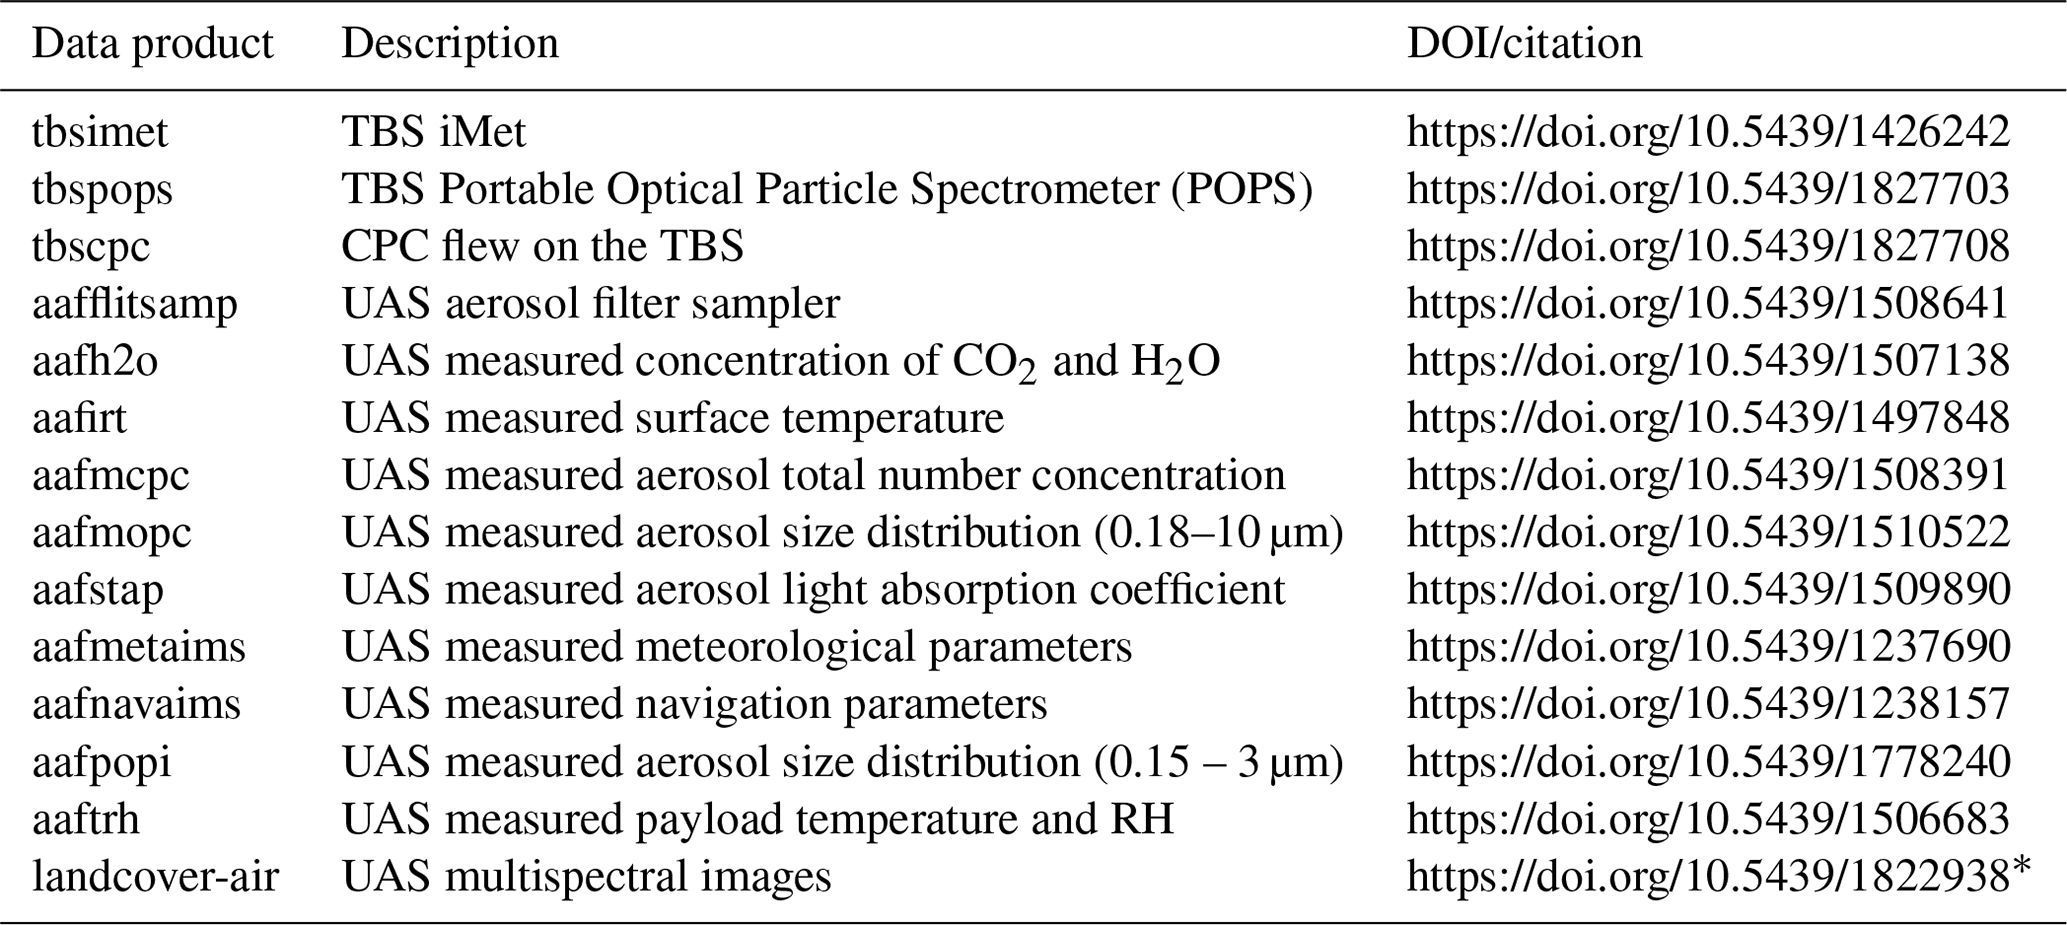
Table 1The ARM TBS instrumentation deployed during the 2021 SGP missions.
The instruments deployed on the TBS for the routine measurements are listed in Table 1. Except for the TBI, the rest of the instruments were measured at a 1 Hz sampling rate. More details about the TBS instruments have been discussed previously in several publications (de Boer et al., 2018; Dexheimer, 2018; Dexheimer et al., 2019; Mei et al., 2020b; Creamean et al., 2021). More information about the TBS 2021 flights is listed in Table S3.
2.2 UAS description and flights
2.2.1 Mid-size UAS description
Located at the Pacific Northwest National Laboratory (PNNL), the ARM Aerial Facility (AAF) currently operates the Navmar Science Corporation (NASC) ArcticShark Uncrewed Aerial System (UAS) (de Boer et al., 2018), which is a custom-built variant (TS-B3-XP-AS) of the standard TigerShark Block 3 (TS-B3-XP) UAS, as detailed in Table S1. While the ArcticShark was undergoing upgrades and modifications in 2021, the AAF staff collaborated with the Mississippi State University (MSU) Raspet Flight Research Laboratory (RFRL) to integrate the ArcticShark scientific payload on RFRL TS-B3-XP TigerShark (Fig. 3). Between 2 and 19 November 2021, both teams traveled to Blackwell-Tonkawa Municipal Airport (BKN) to conduct a series of flights with the RFRL TigerShark. The primary objective of this flight effort was to demonstrate the operational ability and durability of the payload (listed in Table 2) on an airframe similar to the ARM ArcticShark. In addition, these flights (flight details are shown in Table S4) provided a significant amount of data that were used to evaluate data quality and provide an initial demonstration of the data to the atmospheric research community.
Table 2The ARM UAS payload instruments deployed on the TigerShark during the SGP mission in 2021.
All the above sensors acquired data at a 1 Hz sampling rate. In addition, the AIMMS-30 also recorded binary raw datasets at a higher frequency (detailed in Sect. 3.2.1), which can be reprocessed to produce higher time resolution (10 Hz) data. The primary aerosol suite includes five aerosol sensors: an advanced mixing condensation particle counter (MCPC), a miniaturized optical particle counter (mOPC), a single-channel tricolor absorption photometer (STAP), a time-resolved aerosol filter sampler, and a POPS (Mei, 2020; Mei and Goldberger, 2020a, b; Mei et al., 2020b, c). Those five sensors were mounted on the top layer of the multiple instruments stackable tower (MIST), which is the central payload infrastructure (Mei et al., 2019). This aerosol payload is routinely evaluated against the PNNL aerosol ground mobile station (AGMS, detailed in Table S2). As shown in Fig. 3, the aerosol total number concentration measured by the MCPC was compared with a butanol-based CPC (TSI, model 3772) and a water-based CPC (Aerosol Device, Magic CPC). In addition, the aerosol absorption coefficients were compared between the STAP and a PSAP (Particle Soot Absorption Photometer). The size-resolved aerosol number concentrations measured by MOPC and POPS were matched against a UHSAS (DMT, Ultra-High Sensitive Aerosol Spectrometer) data in the overlapping size ranges.
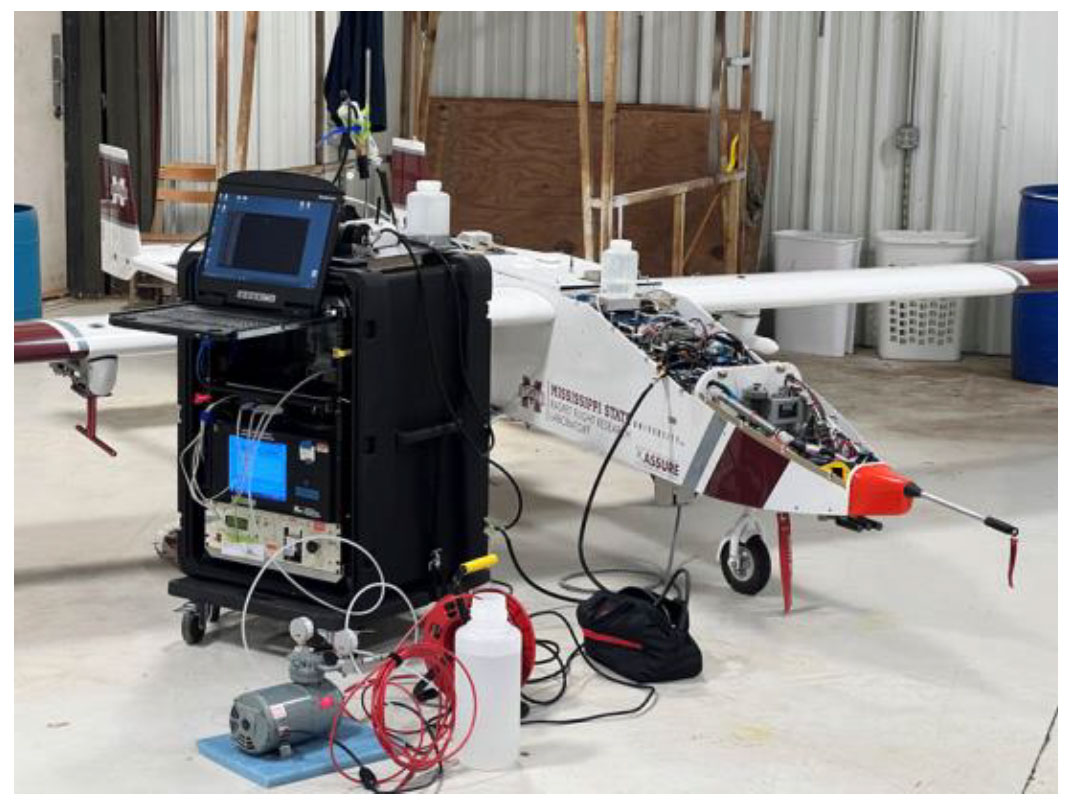
Figure 3The AAF UAS payload sensors installed on the MSU TigerShark were compared with the PNNL aerosol ground mobile station (AGMS) before each flight.
In addition to the aerosol instrumentation, the AAF has capitalized on recent advances in instrument miniaturization to include a variety of sensors on the TigerShark, as listed in Table 2. Together, these sensors observe the atmospheric state (temperature, pressure, humidity, three-dimensional wind), gas concentrations (H2O and CO2), surface temperature, multispectral surface images, and aerosol properties from the sensors described above (aerosol number concentration, size distribution, absorption coefficients, and chemical composition).
A forward-facing inlet was designed to ensure high-quality aerosol data (Figs. 3 and S3); the inlet provides isokinetic sampling by maintaining the sample airspeed at the tip of the inlet equal to the true air speed.
2.2.2 UAS scientific flight patterns
Several meteorological applications benefit from collecting frequent and detailed profiles of temperature, relative humidity (RH), pressure and wind speed and direction. We have designed several flight patterns to match the requirements of specific sampling strategies (Fig. 4). Using flight pattern A, we can survey the flight area using multiple spiral flight patterns during the deployment. The accumulated data from spiral flight patterns (pattern A) informs flight planning around science target areas such as inversion layers, entrainment zones, and aerosol pollution layers. Flight patterns B and C are advantageous for profiling aerosol properties and turbulence parameters using vertically distributed “level” flight legs that allow for the extended collection of statistics at a given altitude. Flight pattern D was targeted to survey the surface properties over a larger area from a single altitude. This “lawn mowing” flight pattern design ensures that the captured downward-looking multispectral images overlap over 75 % of the same surface area (projected on the ground) for post-processing.
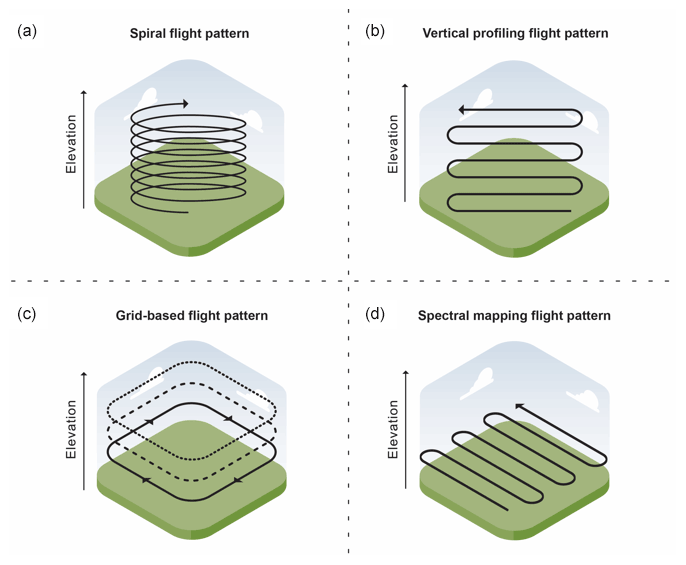
Figure 4Four typical flight patterns used during the deployment: (a) spiral pattern; (b) vertical profile (“ladder”) pattern; (c) grid-based (“parking garage”) pattern; and (d) spectral mapping (“lawn mowing”) pattern.
3.1 TBS data quality control
Platform position and meteorological data collected using the iMet were time-synchronized with the aerosol measurement data, such as the POPS and CPC at a 1 Hz sampling rate. The initial time stamps of TBS flights were established based on the launch and landing log. Per the manufacturer's specification, the iMet sensor has an accuracy of ±0.2 ∘C for ambient temperature (range −90 to 50 ∘C), ±5 for the relative humidity (%, range 0 %–100 %), and ±0.5 hPa for the ambient pressure (range 10–1200 hPa). The GPS altitude has ±15 m accuracy, with a position accuracy of ±10 m, and the wind velocity accuracy is ±0.1 m s−1 during loitering. A previous study compared the temperature measured by a fiber-optic distributed temperature sensing (DTS) system with the iMet sensor and concurrent radiosonde launches. The correlation R2 between radiosonde and DTS measurements was about 0.99, and a root mean square error (RMSE) of 0.6 ∘C. The mean RMSE between the iMet and DTS measurements improved from 0.39 to 0.32 ∘C with the correction derived from nine TBS flights (Dexheimer et al., 2019).
In 2021, the aerosol particle number concentrations were measured with a diffusion dryer installed upstream of the inlet line (RH <40 %). In addition, the aerosol particle size distribution was measured by POPS under ambient conditions (no dryer applied) in 2021. The calibrations for both CPC and POPS were performed before and after each deployment (Kuang and Mei, 2016; Mei et al., 2020b; Mei and Pekour, 2020; Bezantakos and Biskos, 2022), and all flow rates were periodically checked in the field. The CPC sample flow rate is usually 100 cm3 min−1, and the total flow rate is 700 cm3 min−1 with a variability of ±5 %. The manufacturer specified the lower cut-off size D50=10 nm, where D50 is defined as a particle diameter with 50 % of the detected sample particles.
We periodically run all CPCs side-by-side during the deployment for comparison, as shown in Fig. 5. The total number of concentration variations among all three units was below 15 % at all times during the 2021 deployment period. Each POPS unit was carefully evaluated in the controlled lab environment before each deployment by comparison with a scanning mobility particle sizer and an ultra-high sensitivity aerosol spectrometer to ensure the accuracy of sizing and counting (Mei et al., 2020b). When the UHSAS was operational (Cai et al., 2008) at the 3rd ARM mobile facility (AMF3 at Oliktok Point, AK, in 2018) and the ARM SGP observatory (Aerosol Observation Station (AOS) at OK, in 2019), we compared multiple POPS against the UHSAS on the ground. This comparison resulted in excellent agreement in the size distribution measurement, as shown in Fig. 6. When the total number concentration of POPS was over 4000 cm−3, the coincidence error caused about 25 % undercounting, and the POPS data would be flagged as questionable (Mei et al., 2020b). The laser temperature of the POPS was also monitored and is expected to stay between 25 and 65 ∘C to minimize the uncertainty in the size determination. Any out-of-range laser temperature will trigger a “bad” value flag in the data file (Mei et al., 2020b).
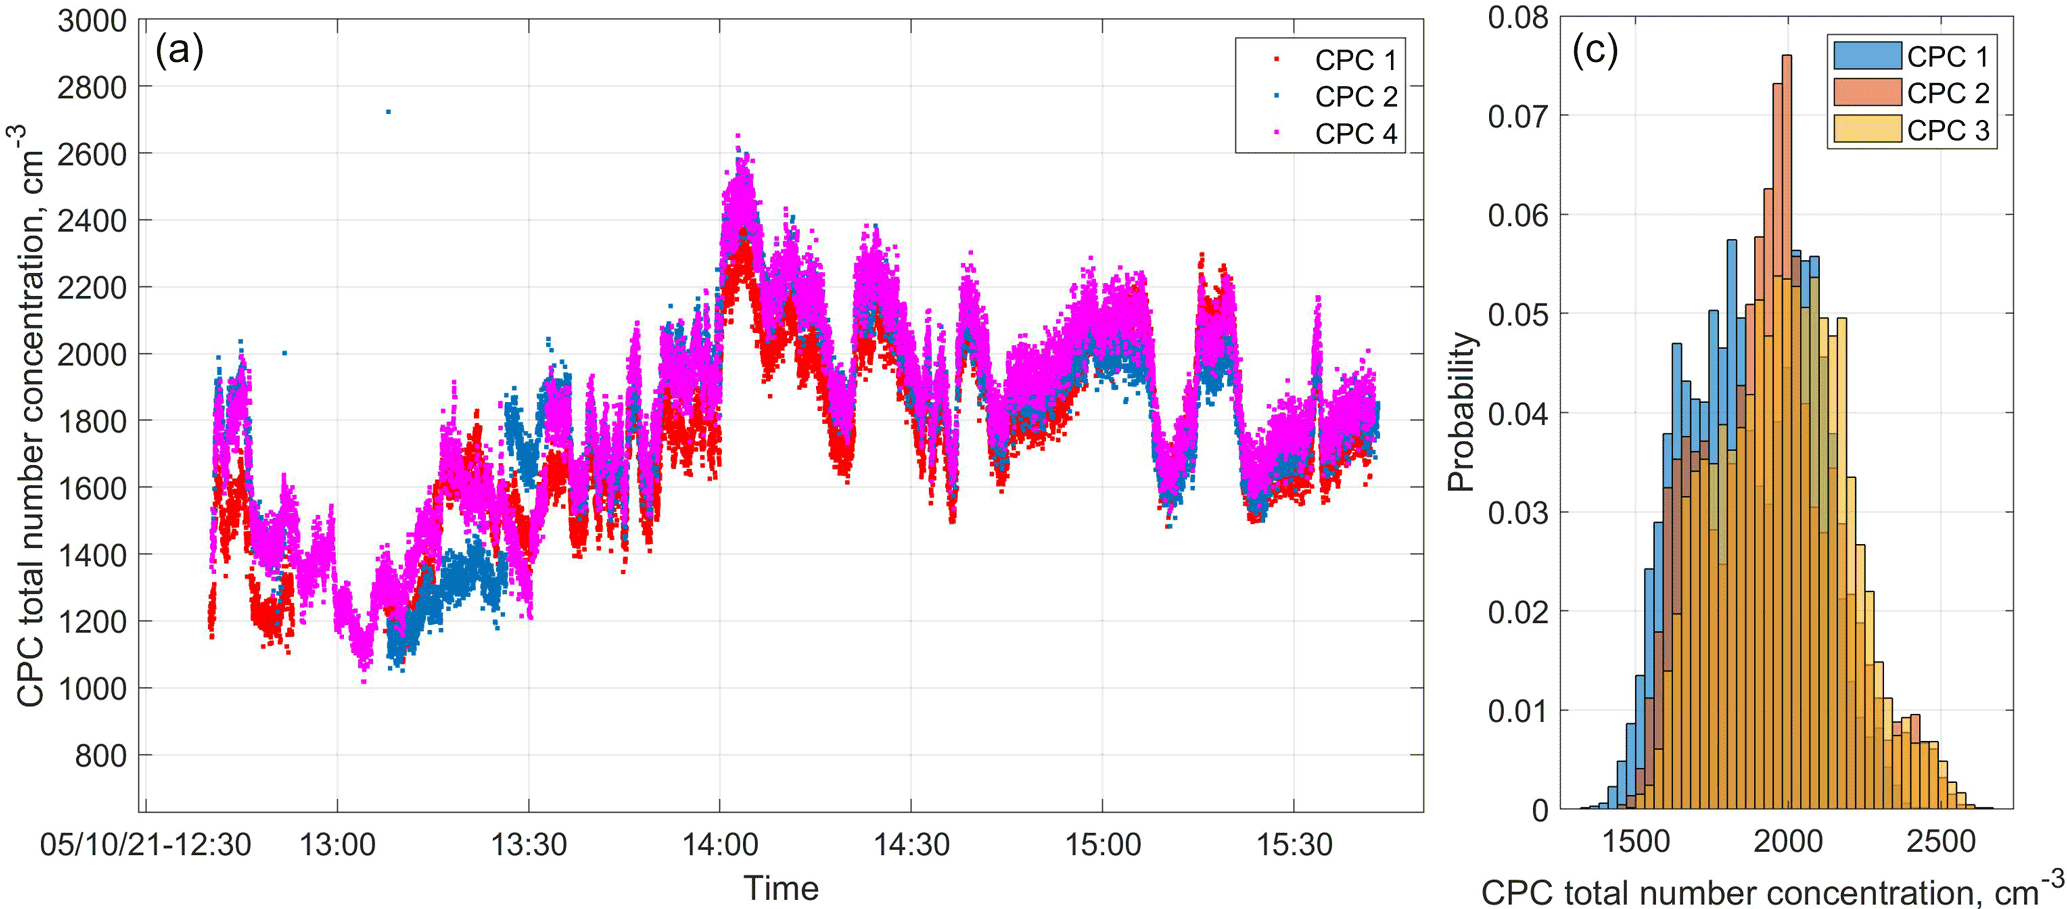
Figure 5Aerosol total number concentration comparison between three CPCs at the top of a trailer. (a) Time series of the total number concentrations from three CPCs. (b) Histogram of total number concentrations for three CPCs during the comparison period 13:40–15:30 LT, 10 May 2021.
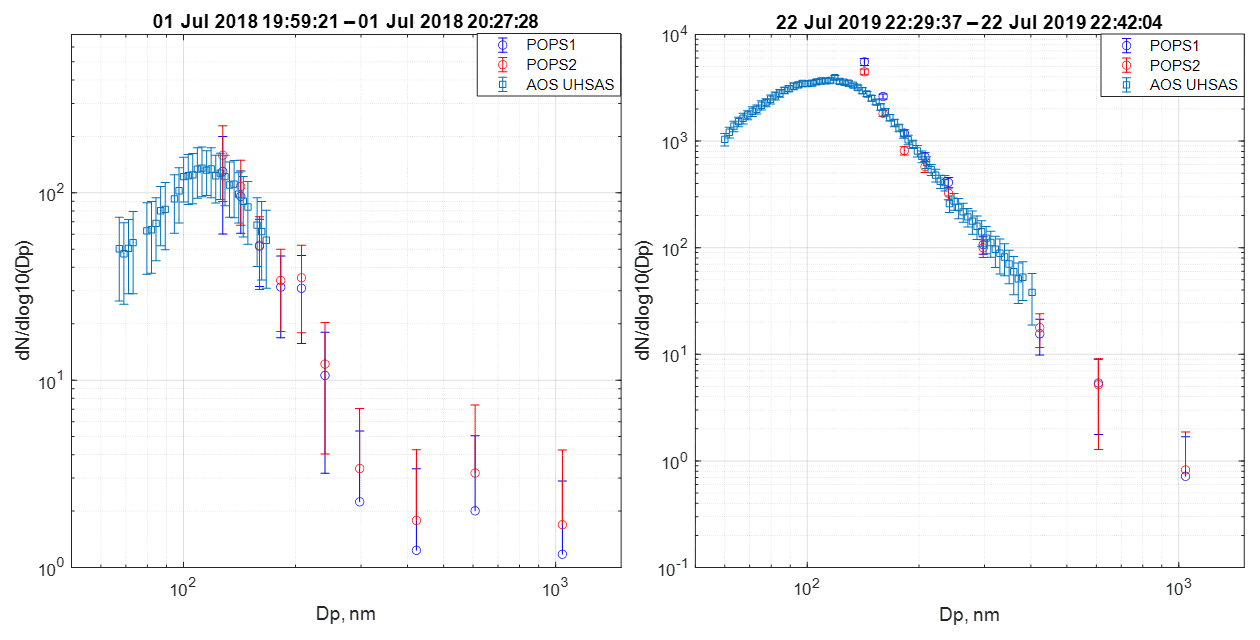
Figure 6Aerosol size distribution comparison between TBS POPS and AMF3 UHSAS in 2018 and AOS UHSAS in 2019.
3.2 UAS data quality control
3.2.1 Aircraft integrated meteorological measurement system data
The aircraft integrated meteorological measurement system (AIMMS-30, Aventech Research Inc.) provides accurate GPS position, platform velocity, aircraft attitude angles, and meteorological data, including wind vectors (https://aventech.com/products/aimms30.html, last access: 17 February 2022). The manufacturer specifies that the accuracy of static pressure is 100 Pa (range: 0–1100 hPa), and the accuracy of pressure difference is 25 Pa (the pitot-static differential range: 0–70 hPa; pressure difference ranges for the angle of attack (AOA) and the angle of sideslip (AOS): −70 to 70 hPa). The three-axis accelerations have an accuracy of 0.002 g (range: −10 to 10 g), and the three-axis angular rates have an accuracy of 0.025 ∘ s−1 (range: −150 to 150 ∘ s−1). The temperature sensor has an accuracy of 0.30 ∘C in the operating range of −40 to 50 ∘C. The relative humidity sensor has an accuracy of 2 % in the operating range of 0 %–100 %. The precision of these measurements and an AIMMS-30 calibration flight are critical for an accurate understanding of the environmental condition during a flight, especially to ensure the collection of a high-quality wind dataset. The measured true air speed (TAS) was validated by plotting the speed difference between the aircraft's ground speed and TAS against the aircraft heading angle when the UAS was flying in circles. The TAS errors derived for Aeroprobe, AIMMS-30, and PICCOLO (Pitot-static system) are 1.98, −0.57, and 2.53 m s−1, as shown in Fig. S4.
The AIMMS-30 calibration uses two different calibration procedures explicitly designed for the TigerShark platform, as shown in Fig. S5. The air data probe (ADP) associated with the AIMMS-30 was installed at 1.7 m from the center of the platform on the right wing, and the GPS antennas (referred to as the antenna baseline) were 6.54 m apart. First, the pilot and operator flew a level flight in the general direction of true north and south, manually between 27–41 m s−1 (53–80 kts), to perform the aerodynamic calibration maneuver to help determine aerodynamic errors induced by the aircraft itself. Then, the aircraft was operated to complete six 360∘ orbits at three different bank angles (8, 13 and 17∘) to complete an inertial system calibration maneuver and capture minor alignment errors (i.e., cross-axis error) between the gyros, accelerometers, GPS antenna baseline, and the primary reference frame of the inertial measurement unit (IMU). After the calibration flight, the updated setup parameters and calibration coefficients were programmed into the AIMMS-30 to ensure calibrated real-time wind data recording. During the operation, combining the measurements from the ADP, the GPS, and the IMU equipped with the AIMMS-30 provides the wind speed accuracy of 0.5 m s−1 at three dimensions (north, east, vertical components) at 150 kts (77.2 m s−1). The AIMMS wind parameters, such as wind speed, wind direction, and wind components, were compared with the ARM Doppler Lidar (DL) retrieved wind parameters (Newsom et al., 2019) in Fig. 7. The ARM DL is an active remote-sensing instrument that provides time and range-resolved measurements (Newsom and Krishnamurthy, 2020). During the flight on 9 November 2021, the airplane flew a “ladder” pattern (pattern B) above the SGP central facility at different altitudes (915, 1069, 1221, 1373, 1525, and 1610 m), while the DL operated in the near-infrared (IR: 1.5 microns) and provided accurate height-resolved measurements of wind speed and direction every 15 min. We achieved a reasonably good comparison between the AIMMS and DL wind parameters. Further statistic studies and turbulence structure studies will be conducted with data from future deployments.
The ADP internal sampling rate is 200 Hz, and the IMU and GPS have an internal sampling rate of 250 Hz. The platform position, including latitude and longitude, was output by the AIMMS-30 at 1 Hz. The aircraft altitude has various inputs – GPS and pressure altitude. Due to drift throughout a flight, the pressure altitude potentially has more considerable uncertainty, which can be corrected using the known altitude at the airport location during post-processing. Furthermore, the GPS signal sufficiency limits the accuracy of the GPS altitude. Thus, we checked each flight's data and made sure to receive at least 6 GPS signals for each antenna. The temperature sensor has an accuracy of 0.3 ∘C, and the relative humidity (RH) accuracy is 2 % as per manufacturer specification. We compared the dew point temperature derived from AIMMS-30 measured temperature and RH (Alduchov and Eskridge, 1996) with the dew point temperature measured by the H2O sensor (LiCor 840); the results are shown in Fig. S6. The accuracies of the concentration measurements by LiCor 840 are better than 1.5 % for both CO2 and H2O measurements, based on the manufacturer's specifications.
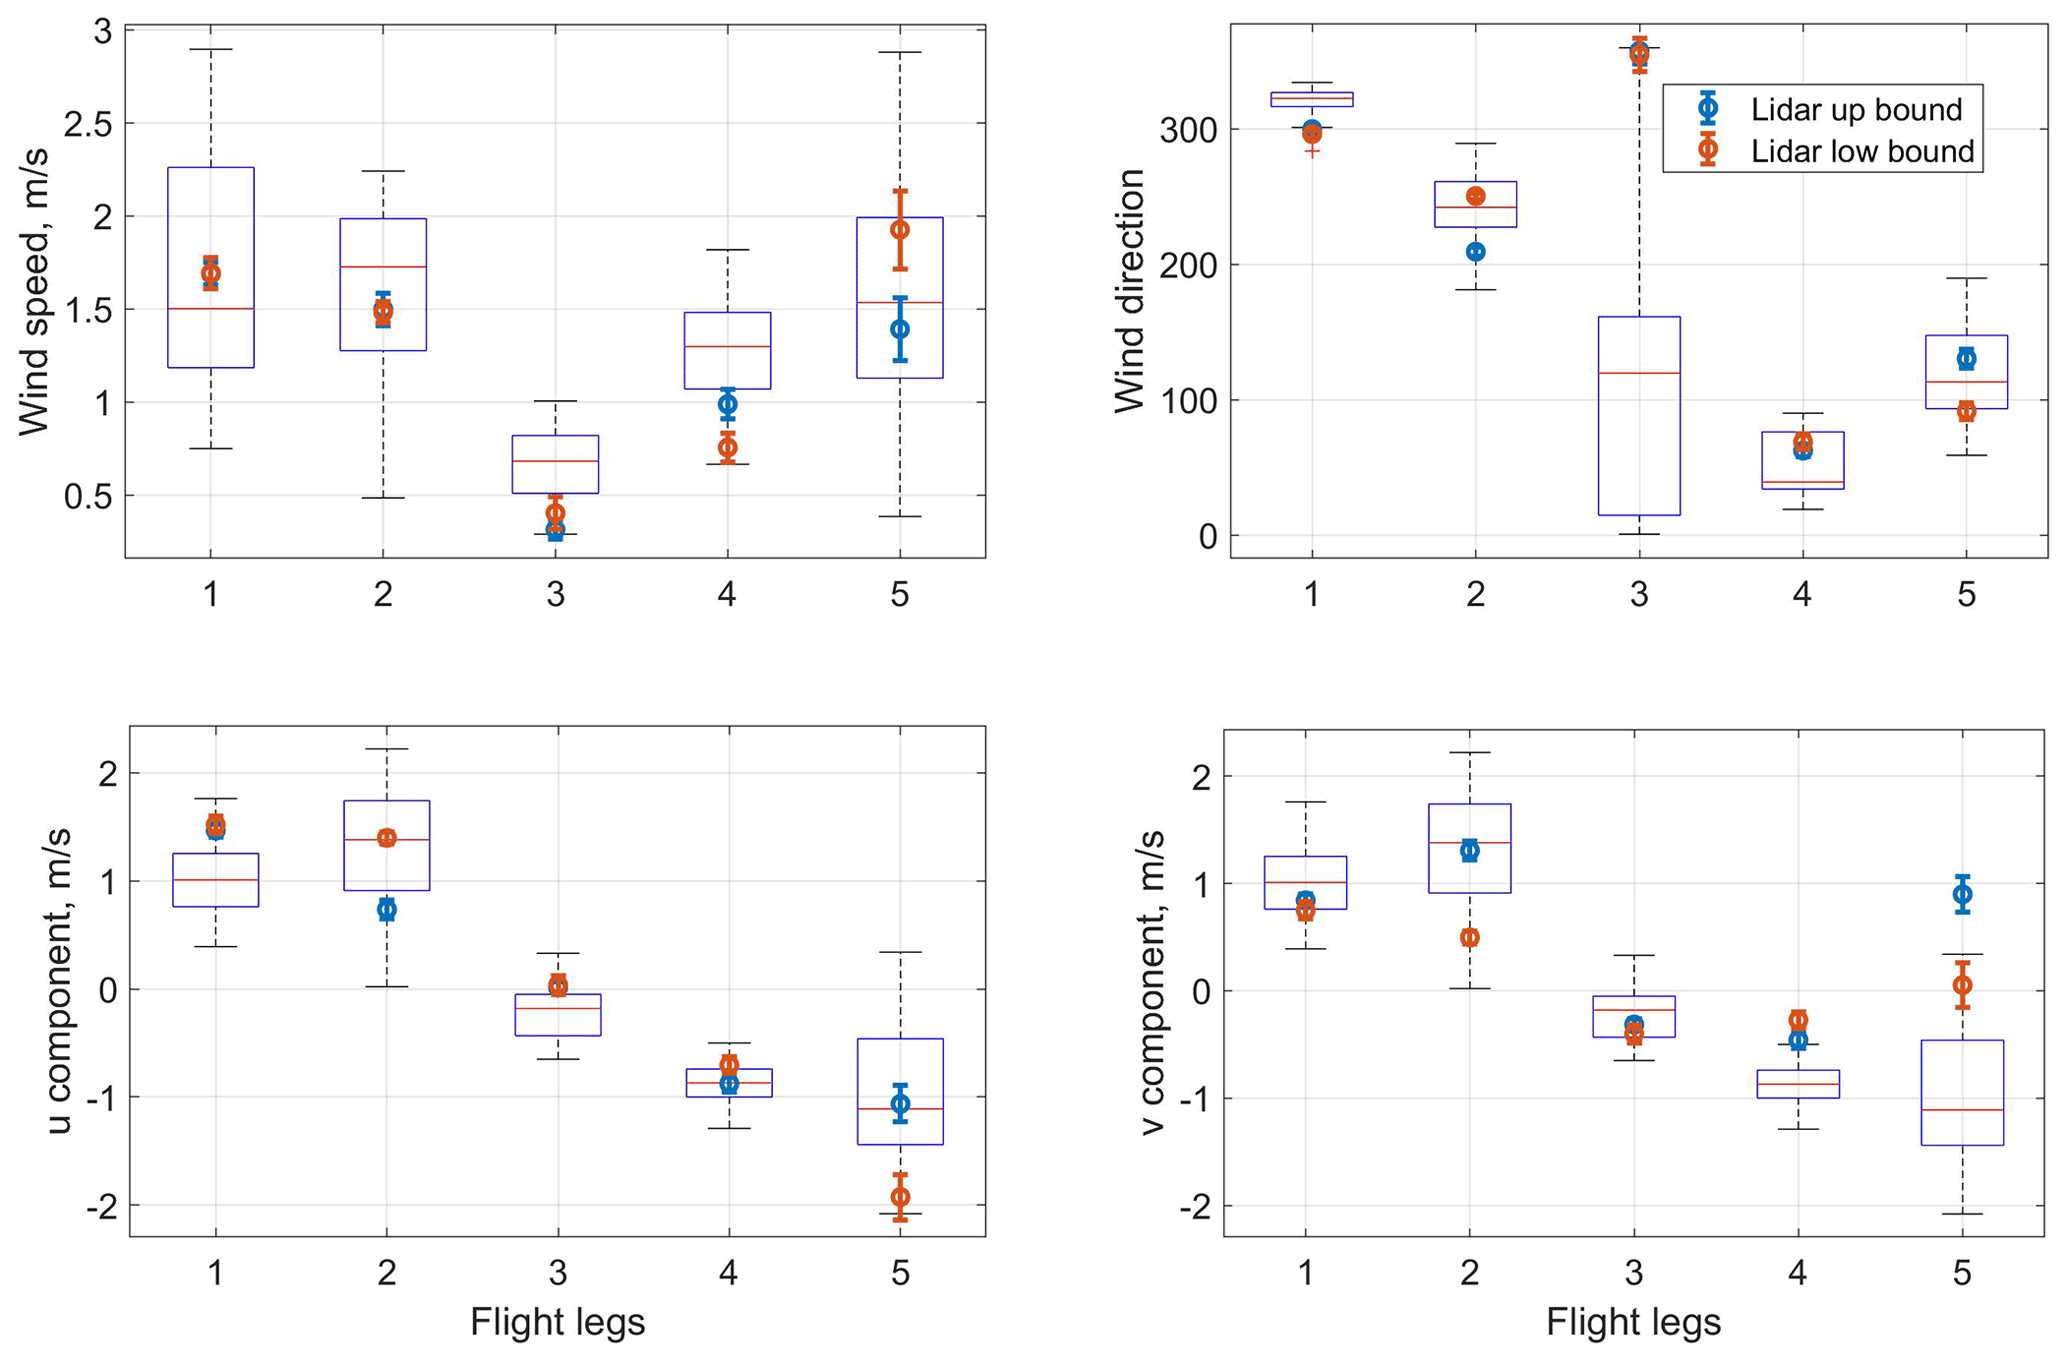
Figure 7Wind parameters comparison between the AIMMS-30 and Lidar from five “leveled” flight legs at different altitudes on 9 November 2021. The average altitudes from flight legs 1 to 5 are 915, 1069, 1221, 1373, 1525, and 1610 m. On each box (representing the AIMMS data), the central mark indicates the median, and the bottom and top edges of the box indicate the 25th and 75th percentiles, respectively. The whiskers extend to the most extreme data points not considered outliers. The blue and red circles with the error bar are DL retrieved data.
3.2.2 Aerosol payload data
Aerosol measurements aboard the UAS platform were conducted in “dry” conditions because the aerosol inlet used for sampling was equipped with a Nafion dryer ensuring relative humidity below 40 % for the air sample. The aerosol inlet was designed by PNNL for a mid-size UAS platform (the ARM technical report is under review). The inlet sampling condition was checked with the help of a five-port gust probe (Aeroprobe by AirData) that was mounted in place of the inlet tip for one flight. In Fig. 8, the AIMMS TAS is plotted as a blue bar in the top histogram, and the TAS measured at the tip of the isokinetic inlet is shown in orange. The median values from both measurements agree well with each other. The difference between the two TAS has a narrow distribution shown in the bottom histogram, which suggests the inlet was operated under the isokinetic condition as designed.
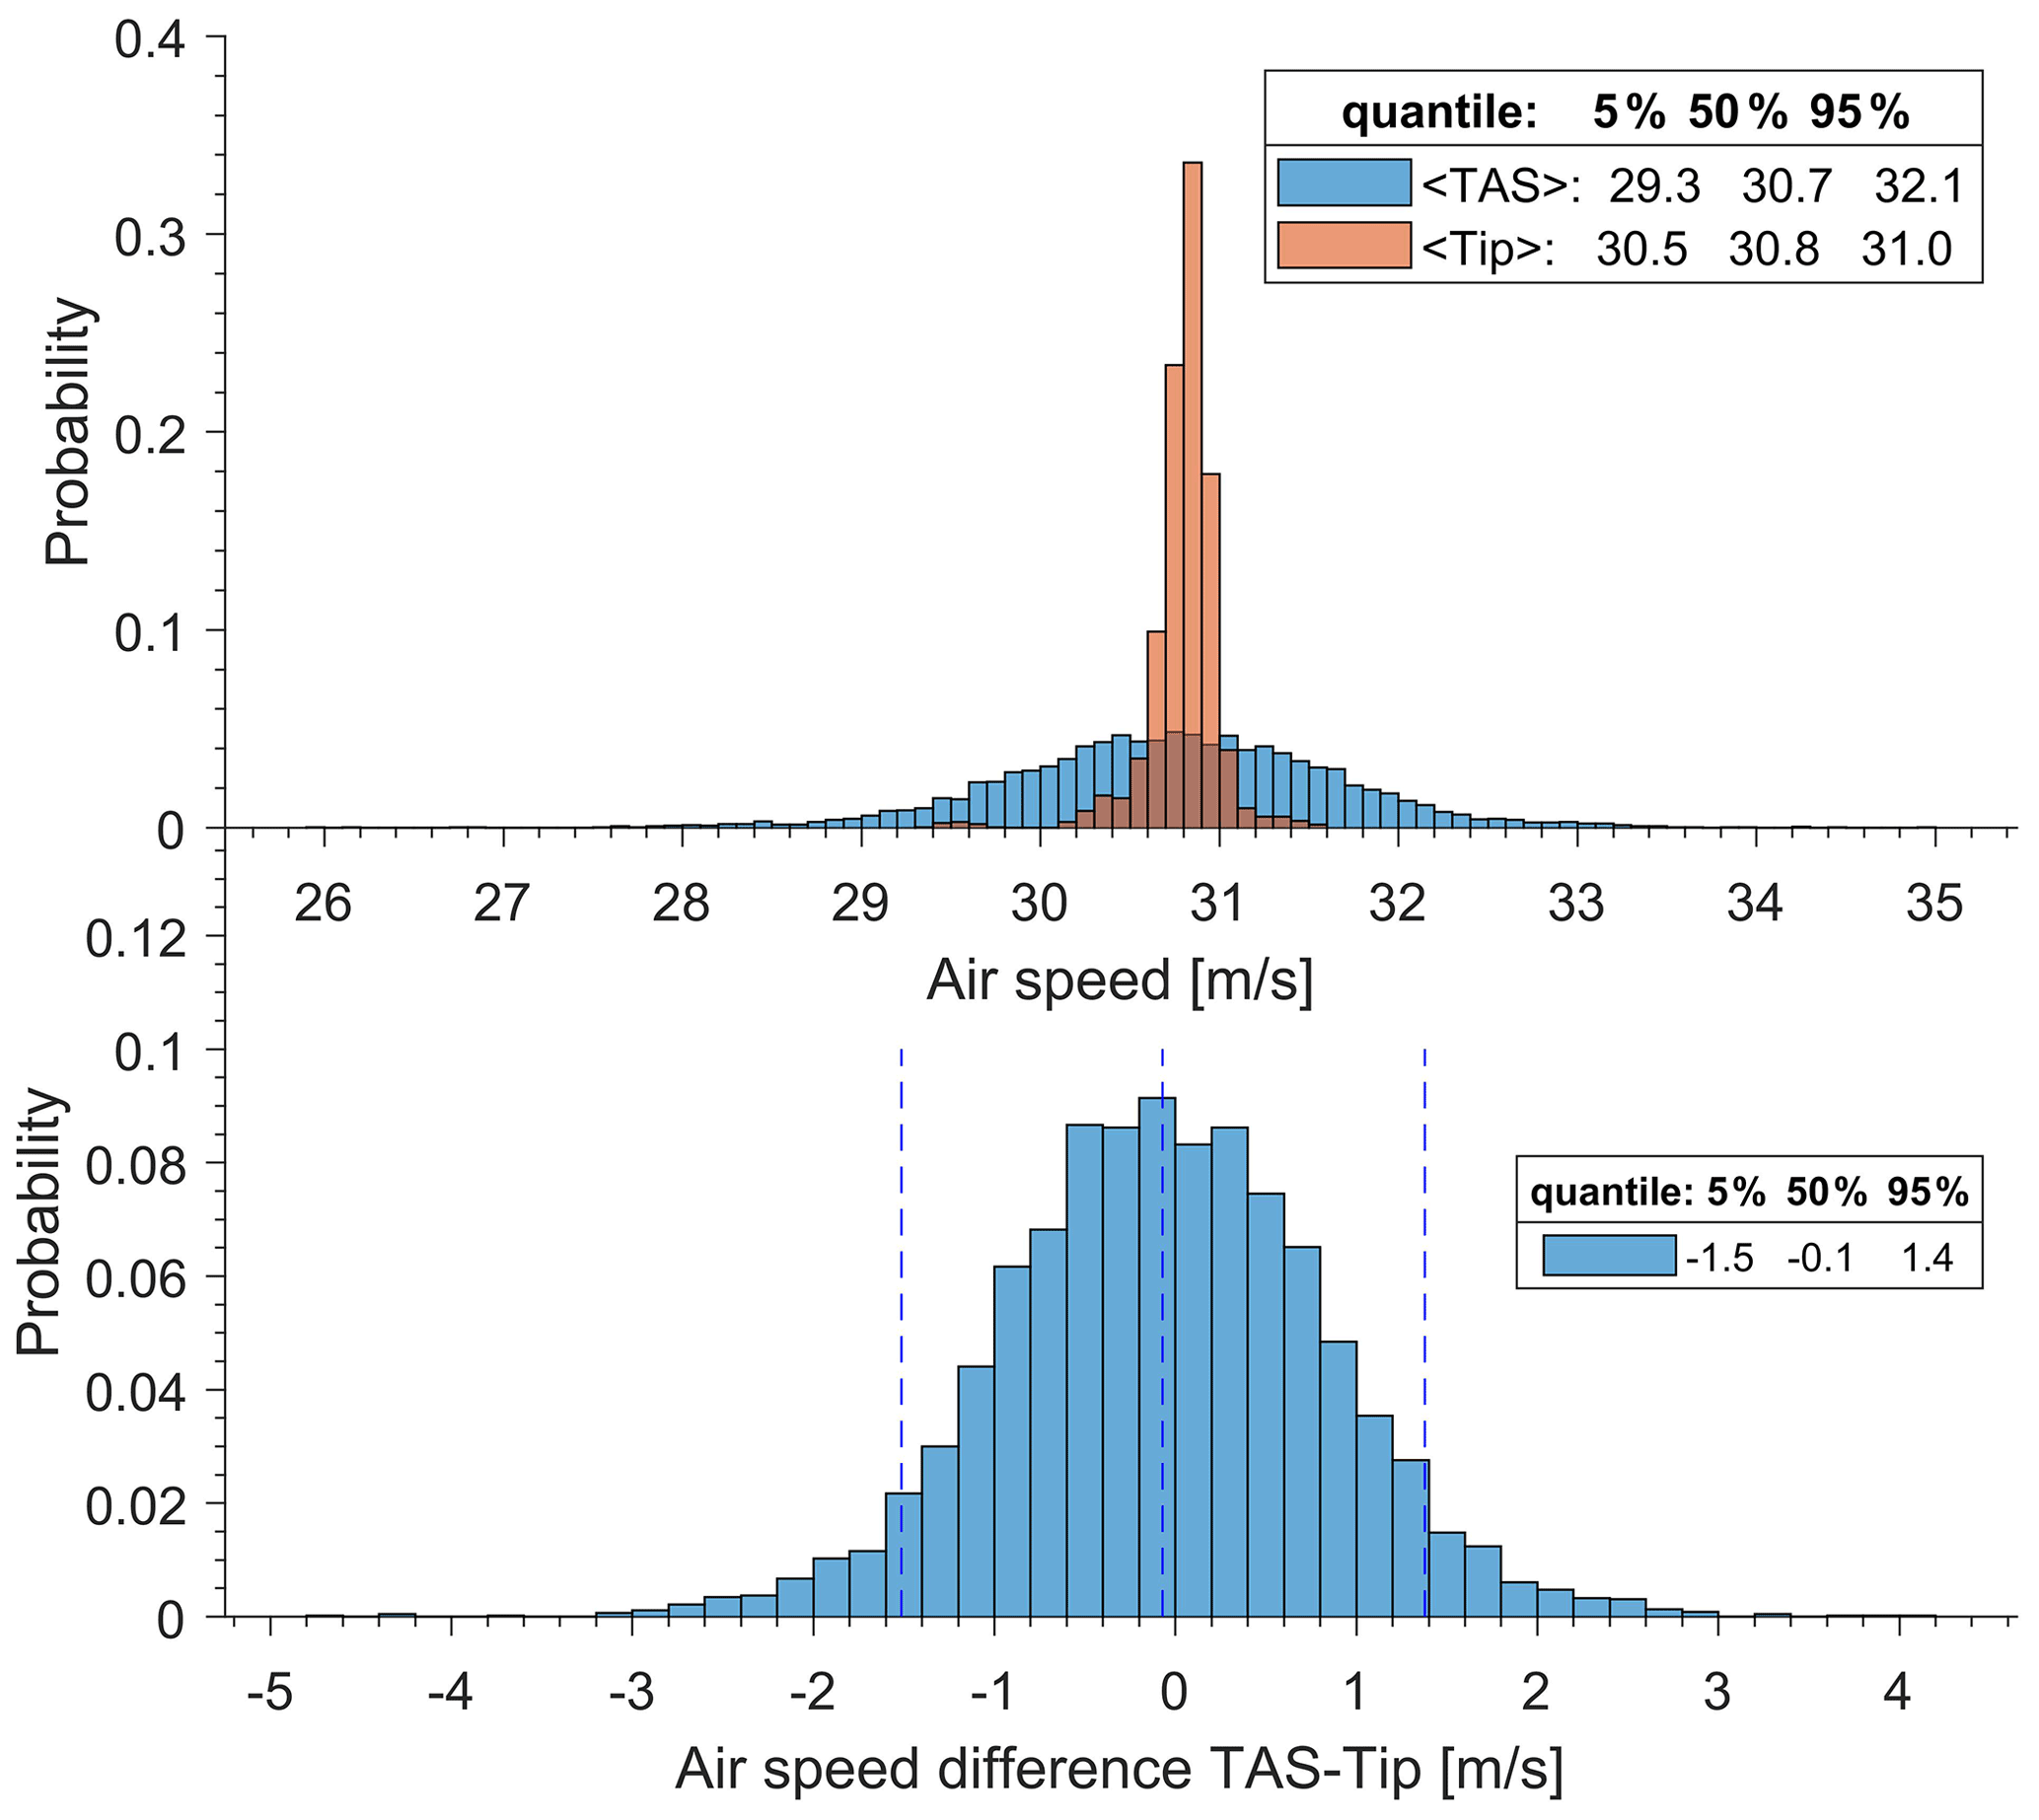
Figure 8The isokinetic inlet performance evaluated using one level flight leg on 8 November 2021.
Routine calibrations were carried out in the lab to characterize the primary aerosol sensors' performances before and after each deployment, such as the size accuracy determination and evaluation of the aerosol particle detection efficiency (Mei, 2020; Mei and Goldberger, 2020a, b; Mei et al., 2020b, c). In addition, the AGMS was also deployed to the ARM SGP observatory to compare with the standard ARM Observation Station (AOS, #07) between 15 and 18 November 2021. As shown in Figs. 9 and S7, we achieved excellent agreement between the AGMS CPC 3772 and the AOS CPC 3772. Although we did not directly compare the MCPC with the AOS CPC, the above sequenced comparisons ensured the CPC performance consistency among the measurements from the UAS payload, the AGMS, and the AOS site.
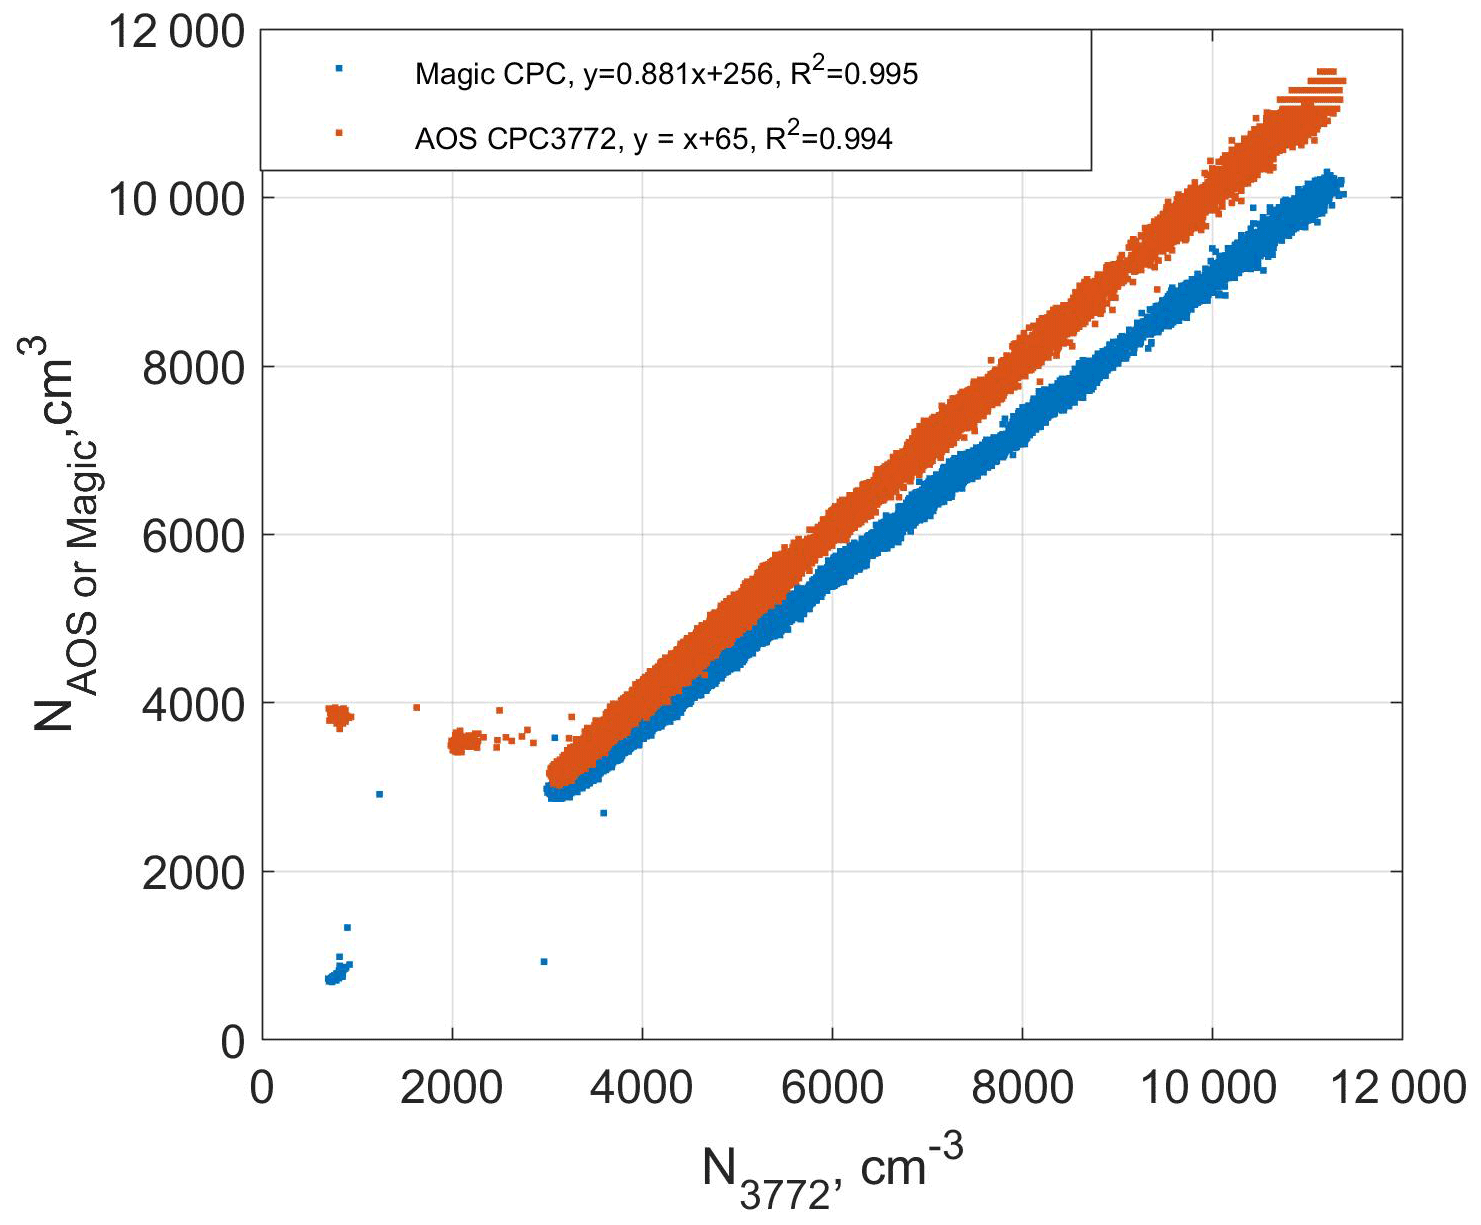
Figure 9Aerosol total number concentration comparison between the AGMS CPC 3772, the Magic CPC against the AOS CPC 3772 at the ARM SGP observatory between 15 and 18 November 2021.
During the UAS flight deployment between 6 and 15 November 2021, the UAS aerosol payload was compared against the AGMS instruments before or after each flight to assess the performance consistency. As shown in Figs. 10 and S7, the total number concentration of MCPC was constantly 20 % lower than the aerosol concentration of CPC 3772, which indicates a concentration correction factor should be applied to MCPC data if the UAS data are used to link with the AOS data. In addition, the water-based CPC is within a 10 % uncertainty range compared with the CPC 3772, which is a good payload candidate.
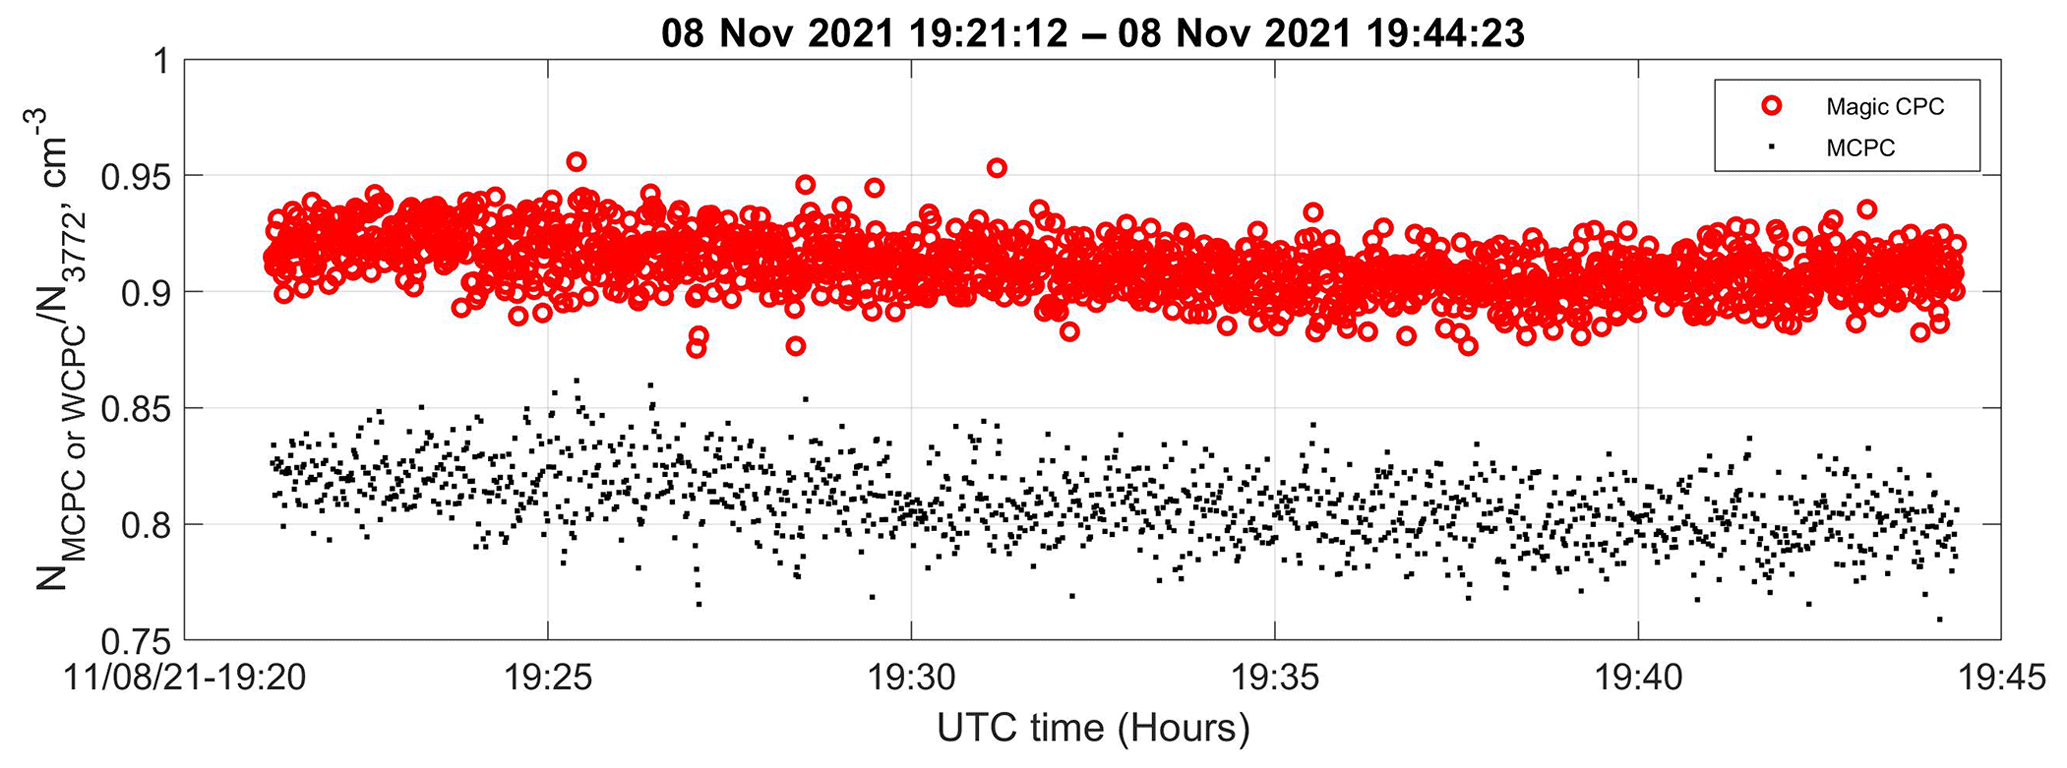
Figure 10Aerosol total number concentration comparison between the MCPC and the Magic CPC against the AGMS CPC 3772 before the flight on 8 November 2021.
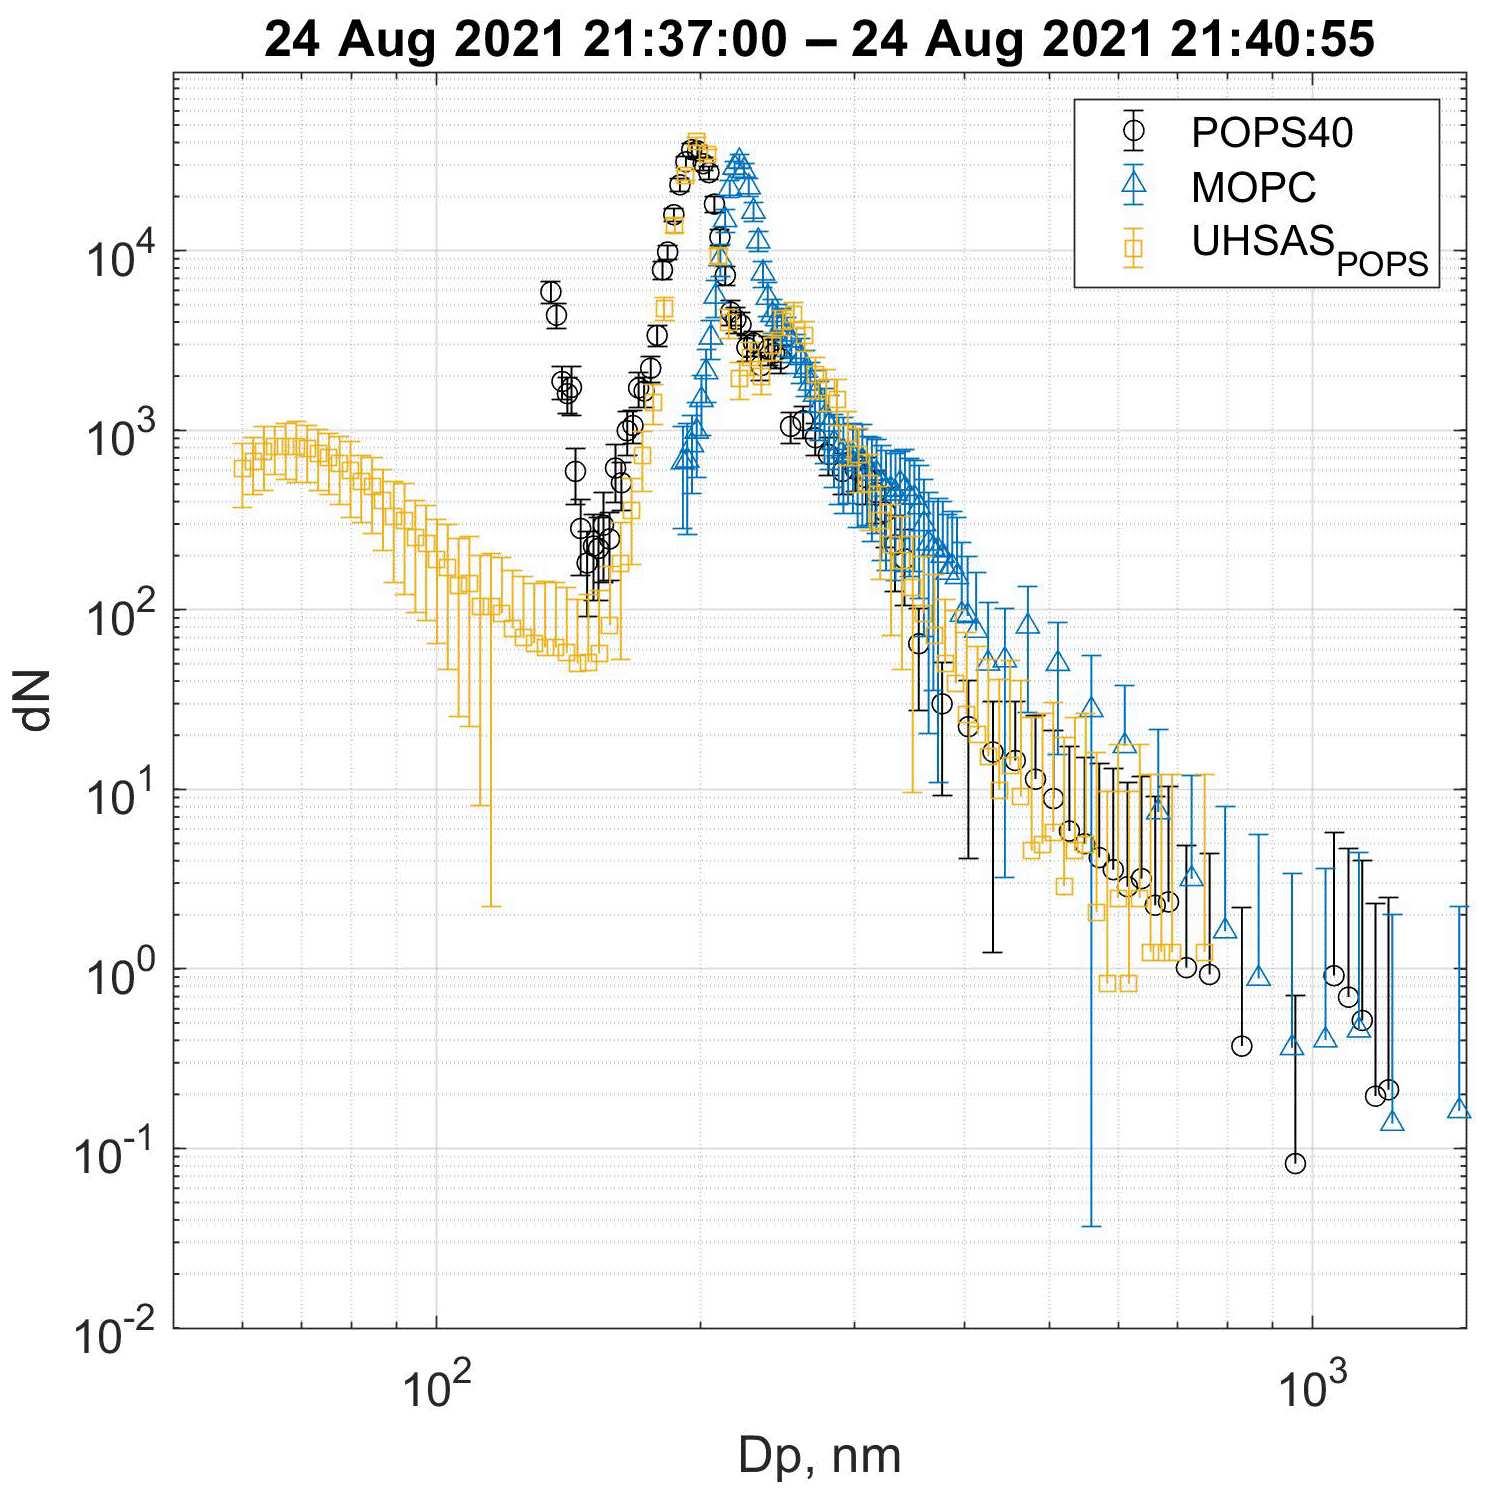
Figure 11Aerosol size distribution comparison among POPS, MOPC, and UHSAS using 200 nm PSL particles.
We also compared the miniaturized size distribution sensors (POPS and MOPC) with their standard-size “sibling”, UHSAS, for 10–30 min before each flight using the PSL particles, as shown in Fig. 11. POPS and UHSAS are in better agreement because both instruments were characterized using the PSL particles. The discrepancy between the MOPC and the UHSAS is because the refractive index of the calibration particles used by MOPC differs from POPS and UHSAS. The MOPC used ammonium sulfate particles to calibrate the aerosol signal in a size range between 180–500 nm. The calibration difference leads to about a 20 % variation in the size determination in MOPC data.
The aerosol absorption measured by STAP agreed well at the ground level with a widely used instrument – a particle soot absorption photometer (PSAP), as shown in Fig. S8. Previous studies have evaluated STAP's in-flight performance (Telg et al., 2017; Düsing et al., 2019; Pikridas et al., 2019). Düsing et al. (2019) pointed out that artifacts in STAP data due to rapid changes in RH can be corrected using a correction factor of 10.08 Mm−1 s−1 for every 1 % change in RH. Note that no correction was applied to the flight data in 2021 because there was no significant RH variation during the flight.
Ambient aerosol samples were also collected using a chemical sampler (Mei and Goldberger, 2020a) and analyzed by an independent research team to confirm the performance of the sensor. A micro-extraction technique was developed to pull out the aerosol particles collected on the 17 mm polytetrafluoroethylene (PTFE) sample medium for an offline aerosol mass spectrometer (AMS) analysis. The detailed analysis and results will be discussed in a separate publication, which is currently in preparation.
3.2.3 IRT and multispectral imager data
The infrared radiometer deployed on the UAS (IRT, Apogee SI-111-SS) has a 22∘ half-angle field of view (covering 0.06 km2 surface area from 1 km above the ground) and a response time of 0.6 s. The manufacturer calibration has an uncertainty of 0.2 ∘C when operating between −30 to 65 ∘C. However, the surface temperature recorded by this IRT was influenced by the ambient temperature at different altitudes. As shown in Fig. 12a, the aircraft flew the “ladder” pattern (pattern B) at different altitudes above the C1 site. With the altitude increase, the measured ambient temperature increased between 900–1200 m, then decreased between 1200–1500 m, then increased again between 1400–1600 m. This ambient temperature inversion affected the surface temperature readings obtained by the IRT sensors, shown in Fig. 12b. For example, when the ambient temperature increased between 900 and 1200 m, the IRT measured surface temperature had about 2–3 ∘C positive bias. Therefore, the IRT temperature measurements should be performed near the surface or corrected for sensor temperature bias to get an accurate surface temperature.
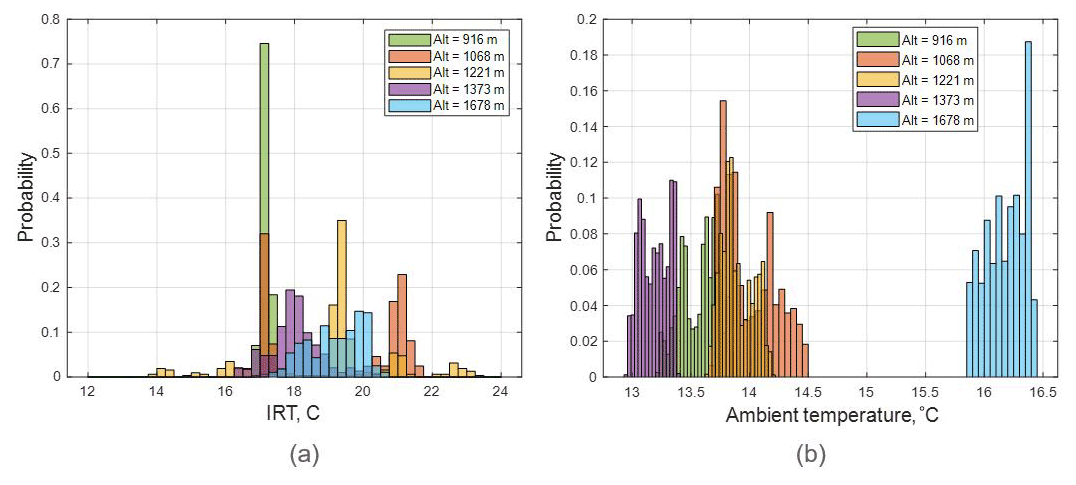
Figure 12Histogram plots of IRT (a) and ambient temperature (b) at each “level” flight leg on 9 November 2021.
A multispectral camera (Altum) was deployed on the TigerShark for remote surface imagery. The Altum integrates a radiometric thermal camera with five high-resolution narrow bands (475, 560, 668, 717, and 842 nm wavelengths) to produce advanced thermal, multispectral and high-resolution imagery, such as surface temperature and green normalized difference vegetation index (GNVDI) images (see the example in Fig. S9). The thermal accuracy of the imager is ±5 K with thermal sensitivity of <50 mK. Before every flight, imagery reflectance is calibrated with a reflectance panel and a sun sensor. While in flight, the imager recalibrates its thermal camera every 5 min or when a 2 ∘C change in internal temperature occurs. The field of view for the thermal channel of this camera is 48∘ × 39∘, which is comparable to the co-located IRT sensor and can be used for cross-checking the IRT sensor in the future. These images were archived separately by the ARM Data Center as user evaluation data and did not follow the data structure described in Sect. 4 as the rest of the ARM UAS/TBS data.
All data from the 2021 TBS and UAS deployments are considered as a “routine observation” data stream by the ARM Data management system. The data in this paper use Creative Commons License. They were produced following ARM data file standards and archived automatically during and after flight operations through the ARM data ingest process (Mather, 2014; Palanisamy, 2016). Data files are provided to the user community in netCDF format with a naming convention as follows:
where:
-
(sss) is the three-letter ARM site identifier (e.g., sgp for this dataset);
-
(inst) is the ARM instrument abbreviation (e.g., tbspops, aafmcpc), or the name of an ARM value-added product (e.g., tbsmerge);
-
(qualifier) is an optional qualifier that distinguishes multiple data from similar instruments but in different platforms;
-
(temporal) is an optional description of temporal data resolution (e.g., 1 s);
-
(Fn) is the two- or three-character ARM facility designation (e.g., C1, E36);
-
(dl) is the two-character descriptor of the data level, consisting of one lower-case letter followed by one number (e.g., b1);
-
(yyyymmdd) and (hhmmss) are the coordinated universal time (UTC) date and time, which indicates the start time of the first data point measured; and
-
(nc) is the netCDF file extension.
Note that data levels are based on the “level of processing”, with the lowest level of data – “00” representing primary raw data streams collected directly from the instruments. a0 are the raw data converted to netCDF format. With further processing, including the application of calibration factors and conversion to geophysical units, the data level will be designated to a1–a9. Furthermore, variables in each data file are checked against the valid range and combined with the position data (latitude, longitude and altitude), which then will increase the data level to “b”. Finally, “c” level data represent value-added data products providing derived or calculated variables. For example, a netCDF file produced by the TBS SGP deployment from the POPS that includes quality-controlled data (in geophysical units) collected starting at 17:30:00 UTC on 8 October 2021, is named as sgptbspopsC1.b1.20211008.173000.nc.
Note that it is not required to have all data levels for each instrument. The ARM data center (ADC) includes sufficient metadata in each netCDF file to facilitate the user's understanding and interpretation. The time dimension is defined as “unlimited” and is always the first dimension of a variable using the time dimension. The location variables describe the location of the measurements, such as latitude, longitude, and altitude. The global attributes include information related to the location of the platform or the corresponding airbase location (for the aerial platform), the time interval, the calibration procedures if available, and instrument mentor or principal investigator contact information. Additionally, the individual variables consist of a unique “long_name” to explain the measured variable with an accurate description of “units”, “missing_value”. A “standard_name” is required if a primary variable and the standard name exist in the climate forecast (CF) table.
Files from the UAS/TBS baseline instruments are archived through the ADC (https://doi.org/10.5439/1846798, Mei and Dexheimer, 2022). Note that ADC requires user registration to access the data archive. The individual DOIs for these datasets are listed in Table 4.
Table 3DOI for main TBS/UAS datasets. The overall DOI for the data archived in 2021 is https://doi.org/10.5439/1846798 (Mei and Dexheimer, 2022).
* Note that ARM archived raw images.
Files from the UAS/TBS baseline instruments are archived through the ADC (https://doi.org/10.5439/1846798) (Mei and Dexheimer, 2022). Note that a free ARM user account (https://adc.arm.gov/armuserreg/#/new, last access: 17 February 2022) is needed to access ARM data, which is the requirement of the Office of Management and Budget. The resources and information are provided here (https://arm.gov/data/work-with-arm-data/, last access: 17 February 2022) to help ARM users work with data.
Metadata Information. The ARM data center (ADC) includes sufficient metadata in each netCDF file to facilitate the user's understanding and interpretation. Public Data Usage Rights: This work is licensed under the Creative Commons Attribution 4.0 International License. To view a copy of this license, visit https://creativecommons.org/licenses/by/4.0/ (last access: 17 February 2022).
In 2021, 133 TBS flights and seven UAS flights were carried out by staff members from the DOE ARM user facility and the MSU RFRL over the SGP atmospheric observatory. A rich dataset was collected using two platforms (UAS and TBS). TBS data from different seasonal months (in February, May, July, and October) provided vertical profiling of aerosol physical properties and atmospheric thermodynamic state at three locations (the central facility and two extended facilities (EF9 and EF36). In 2022, AAF will continue supporting the TBS data collection with the TBS team from Sandia National Laboratories at the SGP observatory in February, April, and October, and two ARM-approved field campaigns in summer.
UAS data expanded the collective spatial database, provided additional information to assess how measured variables vary spatially, and demonstrated how to compare the mean and turbulent observations derived from SGP remote sensors. After additional training and instrument integration onto the ArcticShark, AAF will carry out more UAS flights over the ARM SGP observatory in July 2022 and pave the path toward routine UAS deployments in conjunction with other ARM facilities.
Paralleling the deployment effort, staff from the AAF, TBS, and ADC teams are also working together to generate merged data products (see the example in Table S5) for the user community.
This paper provides an overview of the platform and flight patterns used during the data collection and introduces information on data quality control. Those combined observational data can facilitate the current study of the influence of irrigation and urbanization on the land-atmosphere-cloud interactions and help improve the understanding of how the naturally occurring processes impact the aerosol–cloud interactions, especially in the boundary layer. We hope our effort will encourage broader usage of the ARM data and enhance the collaboration between the ARM user facility and the atmospheric science community.
The supplement related to this article is available online at: https://doi.org/10.5194/essd-14-3423-2022-supplement.
FM led the formulation of this paper. FM wrote the draft. FM, DD, MSP, RC, and LAG provided the figures. GdB, JDF, MSP and BS provided editing suggestions to the manuscript. JT, FM, DD, RC, RN, MSP participated in the data collection and preparation of the field campaigns.
The contact author has declared that none of the authors have any competing interests.
Publisher’s note: Copernicus Publications remains neutral with regard to jurisdictional claims in published maps and institutional affiliations.
This work has been supported by the Office of Biological and Environmental Research (OBER) of the US Department of Energy (DOE) as part of the Atmospheric Radiation Measurement (ARM) and Atmospheric System Research (ASR) programs. We sincerely appreciate the support from the AAF UAS crew – Peter Carroll, Hardeep S. Mehta, Matt Newburn, and the MSU crew – Austin Wingo, Peter McKinley, Miles Ennis, Connor White, Cavin Skidmore, Nolan Parker, Justin Eskridge, Chase Jackson, Clay Shires, and Randy Welch.
Battelle operates the Pacific Northwest National Laboratory (PNNL) for the DOE under contract DE-A06-76RLO 1830. Gijs de Boer was additionally supported by the US Department of Energy Atmospheric System Research program (DE-SC0013306), and the NOAA Physical Sciences Laboratory.
This paper was edited by Nellie Elguindi and reviewed by two anonymous referees.
Adkins, K. A. and Sescu, A.: Analysis of near-surface relative humidity in a wind turbine array boundary layer using an instrumented unmanned aerial system and large-eddy simulation, Wind Energy, 21, 1155–1168, https://doi.org/10.1002/we.2220, 2018.
Alduchov, O. A. and Eskridge, R. E.: Improved Magnus Form Approximation of Saturation Vapor Pressure, J. Appl. Meteorol. Clim., 35, 601–609, https://doi.org/10.1175/1520-0450(1996)035<0601:Imfaos>2.0.Co;2, 1996.
Banta, R. M.: Stable-boundary-layer regimes from the perspective of the low-level jet, Acta Geophys., 56, 58–87, 2008.
Barbieri, L., Kral, S. T., Bailey, S. C. C., Frazier, A. E., Jacob, J. D., Reuder, J., Brus, D., Chilson, P. B., Crick, C., Detweiler, C., Doddi, A., Elston, J., Foroutan, H., Gonzalez-Rocha, J., Greene, B. R., Guzman, M. I., Houston, A. L., Islam, A., Kemppinen, O., Lawrence, D., Pillar-Little, E. A., Ross, S. D., Sama, M. P., Schmale, D. G., Schuyler, T. J., Shankar, A., Smith, S. W., Waugh, S., Dixon, C., Borenstein, S., and de Boer, G.: Intercomparison of Small Unmanned Aircraft System (sUAS) Measurements for Atmospheric Science during the LAPSE-RATE Campaign, Sensors-Basel, 19, 2179, https://doi.org/10.3390/s19092179, 2019.
Barfuss, K., Patzold, F., Altstadter, B., Kathe, E., Nowak, S., Bretschneider, L., Bestmann, U., and Lampert, A.: New Setup of the UAS ALADINA for Measuring Boundary Layer Properties, Atmospheric Particles and Solar Radiation, Atmosphere-Basel, 9, 28, https://doi.org/10.3390/atmos9010028, 2018.
Bates, T. S., Quinn, P. K., Johnson, J. E., Corless, A., Brechtel, F. J., Stalin, S. E., Meinig, C., and Burkhart, J. F.: Measurements of atmospheric aerosol vertical distributions above Svalbard, Norway, using unmanned aerial systems (UAS), Atmos. Meas. Tech., 6, 2115–2120, https://doi.org/10.5194/amt-6-2115-2013, 2013.
Bendure, A. O., Fadel, G., Ray, J., and Washburn, P. J.: ARM-Related Unmanned Aerial System (UAS) and Tethered Balloon System (TBS) Operational Requirements and Approval, DOE Office of Science Atmospheric Radiation Measurement (ARM) Program, https://www.osti.gov/servlets/purl/1558925 (last access: 8 February 2022), 2019.
Bezantakos, S. and Biskos, G.: Temperature and pressure effects on the performance of the portable TSI 3007 condensation particle counter: Implications on ground and aerial observations, J. Aerosol Sci., 159, 105877, https://doi.org/10.1016/j.jaerosci.2021.105877, 2022.
Cai, Y., Montague, D. C., Mooiweer-Bryan, W., and Deshler, T.: Performance characteristics of the ultra high sensitivity aerosol spectrometer for particles between 55 and 800 nm: Laboratory and field studies, J. Aerosol Sci., 39, 759–769, 2008.
Chen, Q., Li, X. B., Song, R. F., Wang, H. W., Li, B., He, H. D., and Peng, Z. R.: Development and utilization of hexacopter unmanned aerial vehicle platform to characterize vertical distribution of boundary layer ozone in wintertime, Atmos. Pollut. Res., 11, 1073–1083, https://doi.org/10.1016/j.apr.2020.04.002, 2020.
Creamean, J. M., de Boer, G., Telg, H., Mei, F., Dexheimer, D., Shupe, M. D., Solomon, A., and McComiskey, A.: Assessing the vertical structure of Arctic aerosols using balloon-borne measurements, Atmos. Chem. Phys., 21, 1737–1757, https://doi.org/10.5194/acp-21-1737-2021, 2021.
de Boer, G., Ivey, M., Schmid, B., McFarlane, S., and Petty, R.: Unmanned platforms monitor the Arctic atmosphere, Eos, 97, https://doi.org/10.1029/2016EO046441, 2016a.
de Boer, G., Palo, S., Argrow, B., LoDolce, G., Mack, J., Gao, R.-S., Telg, H., Trussel, C., Fromm, J., Long, C. N., Bland, G., Maslanik, J., Schmid, B., and Hock, T.: The Pilatus unmanned aircraft system for lower atmospheric research, Atmos. Meas. Tech., 9, 1845–1857, https://doi.org/10.5194/amt-9-1845-2016, 2016b.
de Boer, G., Ivey, M., Schmid, B., Lawrence, D., Dexheimer, D., Mei, F., Hubbe, J., Bendure, A., Hardesty, J., Shupe, M. D., McComiskey, A., Telg, H., Schmitt, C., Matrosov, S. Y., Brooks, I., Creamean, J., Solomon, A., Turner, D. D., Williams, C., Maahn, M., Argrow, B., Palo, S., Long, C. N., Gao, R. S., and Mather, J.: A BIRD'S-EYE VIEW Development of an Operational ARM Unmanned Aerial Capability for Atmospheric Research in Arctic Alaska, B. Am. Meteorol. Soc., 99, 1197–1212, https://doi.org/10.1175/Bams-D-17-0156.1, 2018.
de Boer, G., Argrow, B., Cassano, J., Cione, J., Frew, E., Lawrence, D., Wick, G., and Wolff, C.: Advancing Unmanned Aerial Capabilities for Atmospheric Research, B. Am. Meteorol. Soc., 100, ES105–ES108, https://doi.org/10.1175/Bams-D-18-0254.1, 2019a.
de Boer, G., Dexheimer, D., Mei, F., Hubbe, J., Longbottom, C., Carroll, P. J., Apple, M., Goldberger, L., Oaks, D., Lapierre, J., Crume, M., Bernard, N., Shupe, M. D., Solomon, A., Intrieri, J., Lawrence, D., Doddi, A., Holdridge, D. J., Hubbell, M., Ivey, M. D., and Schmid, B.: Atmospheric observations made at Oliktok Point, Alaska, as part of the Profiling at Oliktok Point to Enhance YOPP Experiments (POPEYE) campaign, Earth Syst. Sci. Data, 11, 1349–1362, https://doi.org/10.5194/essd-11-1349-2019, 2019b.
de Boer, G., Houston, A., Jacob, J., Chilson, P. B., Smith, S. W., Argrow, B., Lawrence, D., Elston, J., Brus, D., Kemppinen, O., Klein, P., Lundquist, J. K., Waugh, S., Bailey, S. C. C., Frazier, A., Sama, M. P., Crick, C., Schmale III, D., Pinto, J., Pillar-Little, E. A., Natalie, V., and Jensen, A.: Data generated during the 2018 LAPSE-RATE campaign: an introduction and overview, Earth Syst. Sci. Data, 12, 3357–3366, https://doi.org/10.5194/essd-12-3357-2020, 2020a.
de Boer, G., Diehl, C., Jacob, J., Houston, A., Smith, S. W., Chilson, P., Schmale, D. G., Intrieri, J., Pinto, J., Elston, J., Brus, D., Kemppinen, O., Clark, A., Lawrence, D., Bailey, S. C. C., Sama, M. P., Frazier, A., Crick, C., Natalie, V., Pillar-Little, E., Klein, P., Waugh, S., Lundquist, J. K., Barbieri, L., Kral, S. T., Jensen, A. A., Dixon, C., Borenstein, S., Hesselius, D., Human, K., Hall, P., Argrow, B., Thornberry, T., Wright, R., and Kelly, J. T.: Development of Community, Capabilities, and Understanding through Unmanned Aircraft-Based Atmospheric Research: The LAPSE-RATE Campaign, B. Am. Meteorol. Soc., 101, E684–E699, https://doi.org/10.1175/Bams-D-19-0050.1, 2020b.
Dexheimer, D.: Tethered Balloon System (TBS) Instrument Handbook, DOE Office of Science Atmospheric Radiation Measurement (ARM) Program, https://doi.org/10.2172/1415858, 2018.
Dexheimer, D., Apple, M., Bendure, A., Callow, D., Longbottom, C., Novick, D., and Wilson, C.: Joint UAS-Balloon Activities (JUBA) Field Campaign Report, DOE Office of Science Atmospheric Radiation Measurement (ARM) Program, https://www.osti.gov/servlets/purl/1422521 (last access: 8 February 2022), 2018.
Dexheimer, D., Airey, M., Roesler, E., Longbottom, C., Nicoll, K., Kneifel, S., Mei, F., Harrison, R. G., Marlton, G., and Williams, P. D.: Evaluation of ARM tethered-balloon system instrumentation for supercooled liquid water and distributed temperature sensing in mixed-phase Arctic clouds, Atmos. Meas. Tech., 12, 6845–6864, https://doi.org/10.5194/amt-12-6845-2019, 2019.
Düsing, S., Wehner, B., Müller, T., Stöcker, A., and Wiedensohler, A.: The effect of rapid relative humidity changes on fast filter-based aerosol-particle light-absorption measurements: uncertainties and correction schemes, Atmos. Meas. Tech., 12, 5879–5895, https://doi.org/10.5194/amt-12-5879-2019, 2019.
Fast, J. D., Berg, L. K., Alexander, L., Bell, D., D'Ambro, E., Hubbe, J., Kuang, C., Liu, J., Long, C., and Matthews, A.: Overview of the HI-SCALE field campaign: A new perspective on shallow convective clouds, B. Am. Meteorol. Soc., 100, 821–840, 2019.
Fladeland, M., Sumich, M., Lobitz, B., Kolyer, R., Herlth, D., Berthold, R., McKinnon, D., Monforton, L., Brass, J., and Bland, G.: The NASA SIERRA science demonstration programme and the role of small-medium unmanned aircraft for earth science investigations, Geocarto Int., 26, 157–163, https://doi.org/10.1080/10106049.2010.537375, 2011.
Friedrich, K., Lundquist, J. K., Aitken, M., Kalina, E. A., and Marshall, R. F.: Stability and turbulence in the atmospheric boundary layer: A comparison of remote sensing and tower observations, Geophys. Res. Lett., 39, L03801, https://doi.org/10.1029/2011GL050413, 2012.
Hobbs, S., Dyer, D., Courault, D., Olioso, A., Lagouarde, J. P., Kerr, Y., McAneney, J., and Bonnefond, J.: Surface layer profiles of air temperature and humidity measured from unmanned aircraft, Agronomie, 22, 635–640, https://doi.org/10.1051/agro:2002050, 2002.
Intrieri, J. M., de Boer, G., Shupe, M. D., Spackman, J. R., Wang, J., Neiman, P. J., Wick, G. A., Hock, T. F., and Hood, R. E.: Global Hawk dropsonde observations of the Arctic atmosphere obtained during the Winter Storms and Pacific Atmospheric Rivers (WISPAR) field campaign, Atmos. Meas. Tech., 7, 3917–3926, https://doi.org/10.5194/amt-7-3917-2014, 2014.
Jacob, J. D., Chilson, P. B., Houston, A. L., and Smith, S. W.: Considerations for Atmospheric Measurements with Small Unmanned Aircraft Systems, Atmosphere-Basel, 9, 252, https://doi.org/10.3390/atmos9070252, 2018.
Klein, P., Bonin, T. A., Newman, J. F., Turner, D. D., Chilson, P. B., Wainwright, C. E., Blumberg, W. G., Mishra, S., Carney, M., Jacobsen, E. P., Wharton, S., and Newsom, R. K.: LABLE: A Multi-Institutional, Student-Led, Atmospheric Boundary Layer Experiment, B. Am. Meteorol. Soc., 96, 1743–1764, https://doi.org/10.1175/bams-d-13-00267.1, 2015.
Klein, P. M., Hu, X.-M., and Xue, M.: Impacts of mixing processes in the nocturnal atmospheric boundary layer on urban ozone concentrations, Bound.-Layer Meteor., 150, 107–130, 2014.
Kuang, C. and Mei, F.: Condensation particle counter (CPC) instrument handbook, US Department of Energy, https://doi.org/10.2172/1562676, 2016.
Lawson, R. P., Stamnes, K., Stamnes, J., Zmarzly, P., Koskuliks, J., Roden, C., Mo, Q. X., Carrithers, M., and Bland, G. L.: Deployment of a Tethered-Balloon System for Microphysics and Radiative Measurements in Mixed-Phase Clouds at Ny-Alesund and South Pole, J. Atmos. Ocean. Tech., 28, 656–670, https://doi.org/10.1175/2010jtecha1439.1, 2011.
Lee, C. and Kim, H. R.: Optimizing UAV-based radiation sensor systems for aerial surveys, J. Environ. Radioactiv., 204, 76–85, https://doi.org/10.1016/j.jenvrad.2019.04.002, 2019.
Mather, J.: Introduction to Reading and Visualizing ARM Data, DOE Office of Science Atmospheric Radiation Measurement (ARM) Program, https://doi.org/10.2172/1226262, 2014.
Mather, J. H. and Voyles, J. W.: The Arm Climate Research Facility: A Review of Structure and Capabilities, B. Am. Meteorol. Soc., 94, 377–392, https://doi.org/10.1175/bams-d-11-00218.1, 2013.
Mei, F.: Miniaturized Optical Particle Counter Instrument Handbook, Oak Ridge National Lab (ORNL), Oak Ridge, TN (US), Atmospheric Radiation Measurement User Facility, https://doi.org/10.2172/1725876, 2020.
Mei, F. and Dexheimer, D.: ARM TBS and TigerShark deployment data in 2021, Oak Ridge National Lab (ORNL), Oak Ridge, TN (United States), Atmospheric Radiation Measurement User Facility [data set], https://doi.org/10.5439/1846798, 2022.
Mei, F. and Goldberger, L. A.: Time-Resolved Aerosol Filter Sampler Instrument Handbook, Oak Ridge National Lab (ORNL), Oak Ridge, TN (US), Atmospheric Radiation Measurement User Facility, https://doi.org/10.2172/1725795, 2020a.
Mei, F. and Goldberger, L. A.: Advanced Mixing Condensation Particle Counter (aMCPC) Instrument Handbook, Oak Ridge National Lab (ORNL), Oak Ridge, TN (US), Atmospheric Radiation Measurement User Facility, https://doi.org/10.2172/1725829, 2020b.
Mei, F. and Pekour, M.: Portable Optical Particle Spectrometer (POPS) Instrument Handbook, Oak Ridge National Lab (ORNL), Oak Ridge, TN (US), Atmospheric Radiation Measurement, https://doi.org/10.2172/1725831, 2020.
Mei, F., Dexheimer, D., Tomlinson, J. M., Pekour, M. S., Newburn, M. K., Mendoza, A., Longbottom, C., Goldberger, L., and Schmid, B.: ARM Aerosol Measurements Using Unmanned Aerosystems, AGU Fall Meeting Abstracts, A13T-2985, 2019.
Mei, F., Dexheimer, D., Fast, J., Diao, M., Geerts, B., Bucholtz, A., Riihimaki, L., Flynn, C., Thornberry, T., Campos, T., Springston, S., Kuang, C., Tomlinson, J., and Schmid, B.: ARM Aerial Instrument Workshop Report, edited by: Stafford, R., ARM user facility, DOE/SC-ARM-20-010, 2020a.
Mei, F., McMeeking, G., Pekour, M., Gao, R.-S., Kulkarni, G., China, S., Telg, H., Dexheimer, D., Tomlinson, J., and Schmid, B.: Performance Assessment of Portable Optical Particle Spectrometer (POPS), Sensors-Basel, 20, 6294, https://doi.org/10.3390/s20216294, 2020b.
Mei, F., Goldberger, L., Flynn, C., and Pekour, S. P.: Single-Channel Tricolor Absorption Photometer (STAP) Instrument Handbook, Oak Ridge National Lab (ORNL), Oak Ridge, TN (US), Atmospheric Radiation Measurement user facility, https://doi.org/10.2172/1734658, 2020c.
Newsom, R. and Krishnamurthy, R.: Doppler Lidar (DL) instrument handbook, DOE Office of Science Atmospheric Radiation Measurement (ARM) User Facility, https://doi.org/10.2172/1034640, 2020.
Newsom, R., Sivaraman, C., Shippert, T., and Riihimaki, L.: Doppler lidar wind value-added product, DOE ARM Climate Research Facility, Washington, DC, US, https://doi.org/10.2172/1238069, 2019.
Palanisamy, G.: ARM Data File Standards Version 1.2, DOE Office of Science Atmospheric Radiation Measurement (ARM) Program, https://doi.org/10.2172/1253898, 2016.
Pikridas, M., Bezantakos, S., Močnik, G., Keleshis, C., Brechtel, F., Stavroulas, I., Demetriades, G., Antoniou, P., Vouterakos, P., Argyrides, M., Liakakou, E., Drinovec, L., Marinou, E., Amiridis, V., Vrekoussis, M., Mihalopoulos, N., and Sciare, J.: On-flight intercomparison of three miniature aerosol absorption sensors using unmanned aerial systems (UASs), Atmos. Meas. Tech., 12, 6425–6447, https://doi.org/10.5194/amt-12-6425-2019, 2019.
Rudnick, D., Costa, D., Johnson, K., Lee, C., and Timmermans, M.-L. (Eds.): ALPS II – Autonomous Lagrangian Platforms and Sensors. A Report of the ALPS II Workshop, La Jolla, CA, 21–24 February 2018, 66 pp., 2018.
Schmid, B., Mei, F., Carroll, P., Newburn, M. K., Mather, J. H., Engelbert, C., and Hazlett, B.: DOE ARM User Facility ArcticShark Unmanned Aerial System, AGU Fall Meeting Abstracts, NH028-0002, 2020.
Schuyler, T. J., Bailey, S. C. C., and Guzman, M. I.: Monitoring Tropospheric Gases with Small Unmanned Aerial Systems (sUAS) during the Second CLOUDMAP Flight Campaign, Atmosphere-Basel, 10, 434, https://doi.org/10.3390/atmos10080434, 2019.
Solbø, S. and Storvold, R.: Mapping Svalbard glaciers with the cryowing UAS, Int. Arch. Photogramm. Remote Sens. Spatial Inf. Sci., XL-1/W2, 373–377, https://doi.org/10.5194/isprsarchives-XL-1-W2-373-2013, 2013.
Stephens, G. L., Ellingson, R. G., Vitko, J., Bolton, W., Tooman, T. P., Valero, F. P. J., Minnis, P., Pilewskie, P., Phipps, G. S., Sekelsky, S., Carswell, J. R., Miller, S. D., Benedetti, A., McCoy, R. B., McCoy, R. F., Lederbuhr, A., and Bambha, R.: The Department of Energy's Atmospheric Radiation Measurement (ARM) Unmanned Aerospace Vehicle (UAV) program, B. Am. Meteorol. Soc., 81, 2915–2937, https://doi.org/10.1175/1520-0477(2000)081<2915:Tdoesa>2.3.Co;2, 2000.
Telg, H., Murphy, D. M., Bates, T. S., Johnson, J. E., Quinn, P. K., Giardi, F., and Gao, R.-S.: A practical set of miniaturized instruments for vertical profiling of aerosol physical properties, Aerosol. Sci. Tech., 51, 715–723, https://doi.org/10.1080/02786826.2017.1296103, 2017.
Vihma, T., Uotila, P., Sandven, S., Pozdnyakov, D., Makshtas, A., Pelyasov, A., Pirazzini, R., Danielsen, F., Chalov, S., Lappalainen, H. K., Ivanov, V., Frolov, I., Albin, A., Cheng, B., Dobrolyubov, S., Arkhipkin, V., Myslenkov, S., Petäjä, T., and Kulmala, M.: Towards an advanced observation system for the marine Arctic in the framework of the Pan-Eurasian Experiment (PEEX), Atmos. Chem. Phys., 19, 1941–1970, https://doi.org/10.5194/acp-19-1941-2019, 2019.
Villa, T. F., Gonzalez, F., Miljievic, B., Ristovski, Z. D., and Morawska, L.: An Overview of Small Unmanned Aerial Vehicles for Air Quality Measurements: Present Applications and Future Prospectives, Sensors-Basel, 16, 1072, https://doi.org/10.3390/s16071072, 2016.
Reuder, J., Brisset, P., Jonassen, M. M., and Mayer, S.: The Small Unmanned Meteorological Observer SUMO: A new tool for atmospheric boundary layer research, Meteorol. Z., 18, 141–147, https://doi.org/10.1127/0941-2948/2009/0363, 2009.
Schuyler, T. J., Gohari, S. M. I., Pundsack, G., Berchoff, D., and Guzman, M. I.: Using a Balloon-Launched Unmanned Glider to Validate Real-Time WRF Modeling, Sensors-Basel, 19, 1914, https://doi.org/10.3390/s19081914, 2019.