the Creative Commons Attribution 4.0 License.
the Creative Commons Attribution 4.0 License.
 | 05 Jul 2022
A compiled soil respiration dataset at different time scales for forest ecosystems across China from 2000 to 2018
Hongru Sun
Zhenzhu Xu
China's forests rank fifth in the world by area, covering a broad climatic gradient from cold-temperate to tropical zones, and play a key role in the global carbon cycle. Studies of forest soil respiration (Rs) have increased rapidly in China over the last two decades, but the resulting Rs data need to be summarized. Here, we compile a comprehensive dataset of Rs in China's undisturbed forest ecosystems from the literature published up to 31 December 2018, including monthly Rs and the concurrently measured soil temperature (N=8317), mean monthly Rs (N=5003), and annual Rs (N=634). Detailed plot information was also recorded, such as geographical location, climate factors, stand characteristics, and measurement description. We examine some aspects of the dataset – Rs equations fitted with soil temperature, temperature sensitivity (Q10), monthly variations, and annual effluxes in cold-temperate, temperate, subtropical, and tropical zones. We hope the dataset will be used by the science community to provide a better understanding of the carbon cycle in China's forest ecosystems and reduce uncertainty in evaluating of carbon budget at a large scale. The dataset is publicly available at https://doi.org/10.1594/PANGAEA.943617 (Sun et al., 2022).
- Article
(4151 KB) - Full-text XML
-
Supplement
(700 KB) - BibTeX
- EndNote


Soil respiration (Rs) refers to the total amount of CO2 released by undisturbed soil, including autotrophic respiration and heterotrophic respiration, the former from plant roots and their microbial symbionts, and the latter from microorganisms decomposing litter and soil organic matter. As the second-largest terrestrial carbon flux, the recent estimations of global annual Rs (80–98 Pg C yr−1) are over 10 % of the atmospheric carbon pool (750 Pg C) (Bond-Lamberty and Thomson, 2010b; Hashimoto et al., 2015; Raich et al., 2002; Warner et al., 2019); thus, accelerating soil respiration rates with climate warming have a strong potential to influence atmospheric CO2 levels. It is therefore important to understand better soil respiration dynamics and their response to climate changes.
Forest area in China ranks fifth in the world (FAO, 2020) and covers a broad climatic gradient, including cold-temperate, temperate, subtropical, and tropical zones. In China, most Rs measurements began only after 2001 (Chen et al., 2010), but have rapidly increased during the last 20 years (Jian et al., 2020). Several studies have summarized annual Rs in China's forest ecosystems, but with small samples (e.g., N=50 in Zheng et al., 2010; N=62 in Chen et al., 2008; N=120 in Zhan et al., 2012; N=139 in Song et al., 2014). Yu et al. (2010) established a geostatistical model with a total of 390 monthly Rs data from different ecosystems in China. With 1782 monthly Rs in forest ecosystems across China, Jian et al. (2020) analyzed the spatial patterns and temporal trends from 1961 to 2014. However, numerous Rs data are still unexploited, because they were only displayed in the form of monthly dynamics in the figures of the original papers. Rs data at a subannual timescales are important for upscaling global Rs (Jian et al., 2018), which may yield different conclusions and deserve further exploration (Huang et al., 2020).
The lack of large-scale and observation-driven Rs data is a main constraining factor in quantifying regional- to global-scale carbon budgets (Bond-Lamberty and Thomson, 2010a; Rayner et al., 2005). Rs data and concurrently measured temperature thus provide not only a solid base for understanding the critical factors influencing Rs, but also the opportunity for better simulation of Rs at a large scale. We attempted to compile a complete forest Rs dataset at different temporal scales in China, and to analyze temperature sensitivity (Q10) as well as monthly and annual Rs in cold-temperate, temperate, subtropical, and tropical zones.
2.1 Data sources
The terms “soil respiration”, “soil carbon (or CO2) efflux”, or “soil carbon (or CO2) emission” were searched in publications before 2018 in the China Knowledge Resource Integrated Database (http://www.cnki.net/, last access: 27 March 2021), China Science and Technology Journal Database (http://www.cqvip.com, last access: 27 March 2021), ScienceDirect (http://www.sciencedirect.com/, last access: 8 June 2020), ISI Web of Science (http://isiknowledge.com/, last access: 8 June 2020), and Springer Link (http://link.springer.com/, last access: 8 June 2020). Means, minimums, and maximums of soil respiration during the observation periods were usually given in these published studies, and monthly patterns of soil respiration rates with the corresponding temperature were frequently shown in figures. WEBPLOTDIGITIZER, a graphic digitizing software, was used to acquire data from figures when values were not reported in the text (Burda et al., 2017).
2.2 Data collection criteria
The following criteria were used to ensure data consistency and accuracy: (i) Rs was measured in the field without obvious disturbances or manipulation experiments, e.g., fire, cutting, nitrogen addition treatments, etc. (ii) Forested swamps and commercial plantations (e.g., orchard, rubber, etc.) were not examined. (iii) Rs was measured either by static chamber and gas chromatography (GC) or by dynamic chamber and infrared gas analyzers (IRGA, model Li-6400, Li-8100, Li-8150 (LI-COR Inc., Lincoln, Nebraska, USA)), which are the most popular methods and provide methodological consistency (Sun et al., 2020; Wang et al., 2011; Yang et al., 2018; Zheng et al., 2010).
Based on these criteria, a total of 10 288 monthly soil respiration data and 634 annual soil respiration data were assembled from 568 publications. Moreover, the related information was recorded, including geographical location (province, study site, latitude, longitude and elevation), climate (mean annual temperature and mean annual precipitation), stand description (forest type, origin, age, density, mean tree height and diameter at breast height), and measurement regime (method, time, frequency, collar area, height and numbers) (Table 1). There were 155 study sites from 28 provinces in China (18.61–52.86∘ N, 84.91–129.08∘ E, 7–4200 m) (Fig. 1). This forest region encompasses a large gradient of climate regimes, with mean annual temperature ranging from −5.4 to 23.8 ∘C and mean annual precipitation ranging from 105 to 3000 mm. The observation years were from 2000 to 2018.
Table 1Variable information of soil respiration dataset in China's forest ecosystems, available at https://doi.org/10.1594/PANGAEA.943617 (Sun et al., 2022). n/a refers to values that are not applicable.
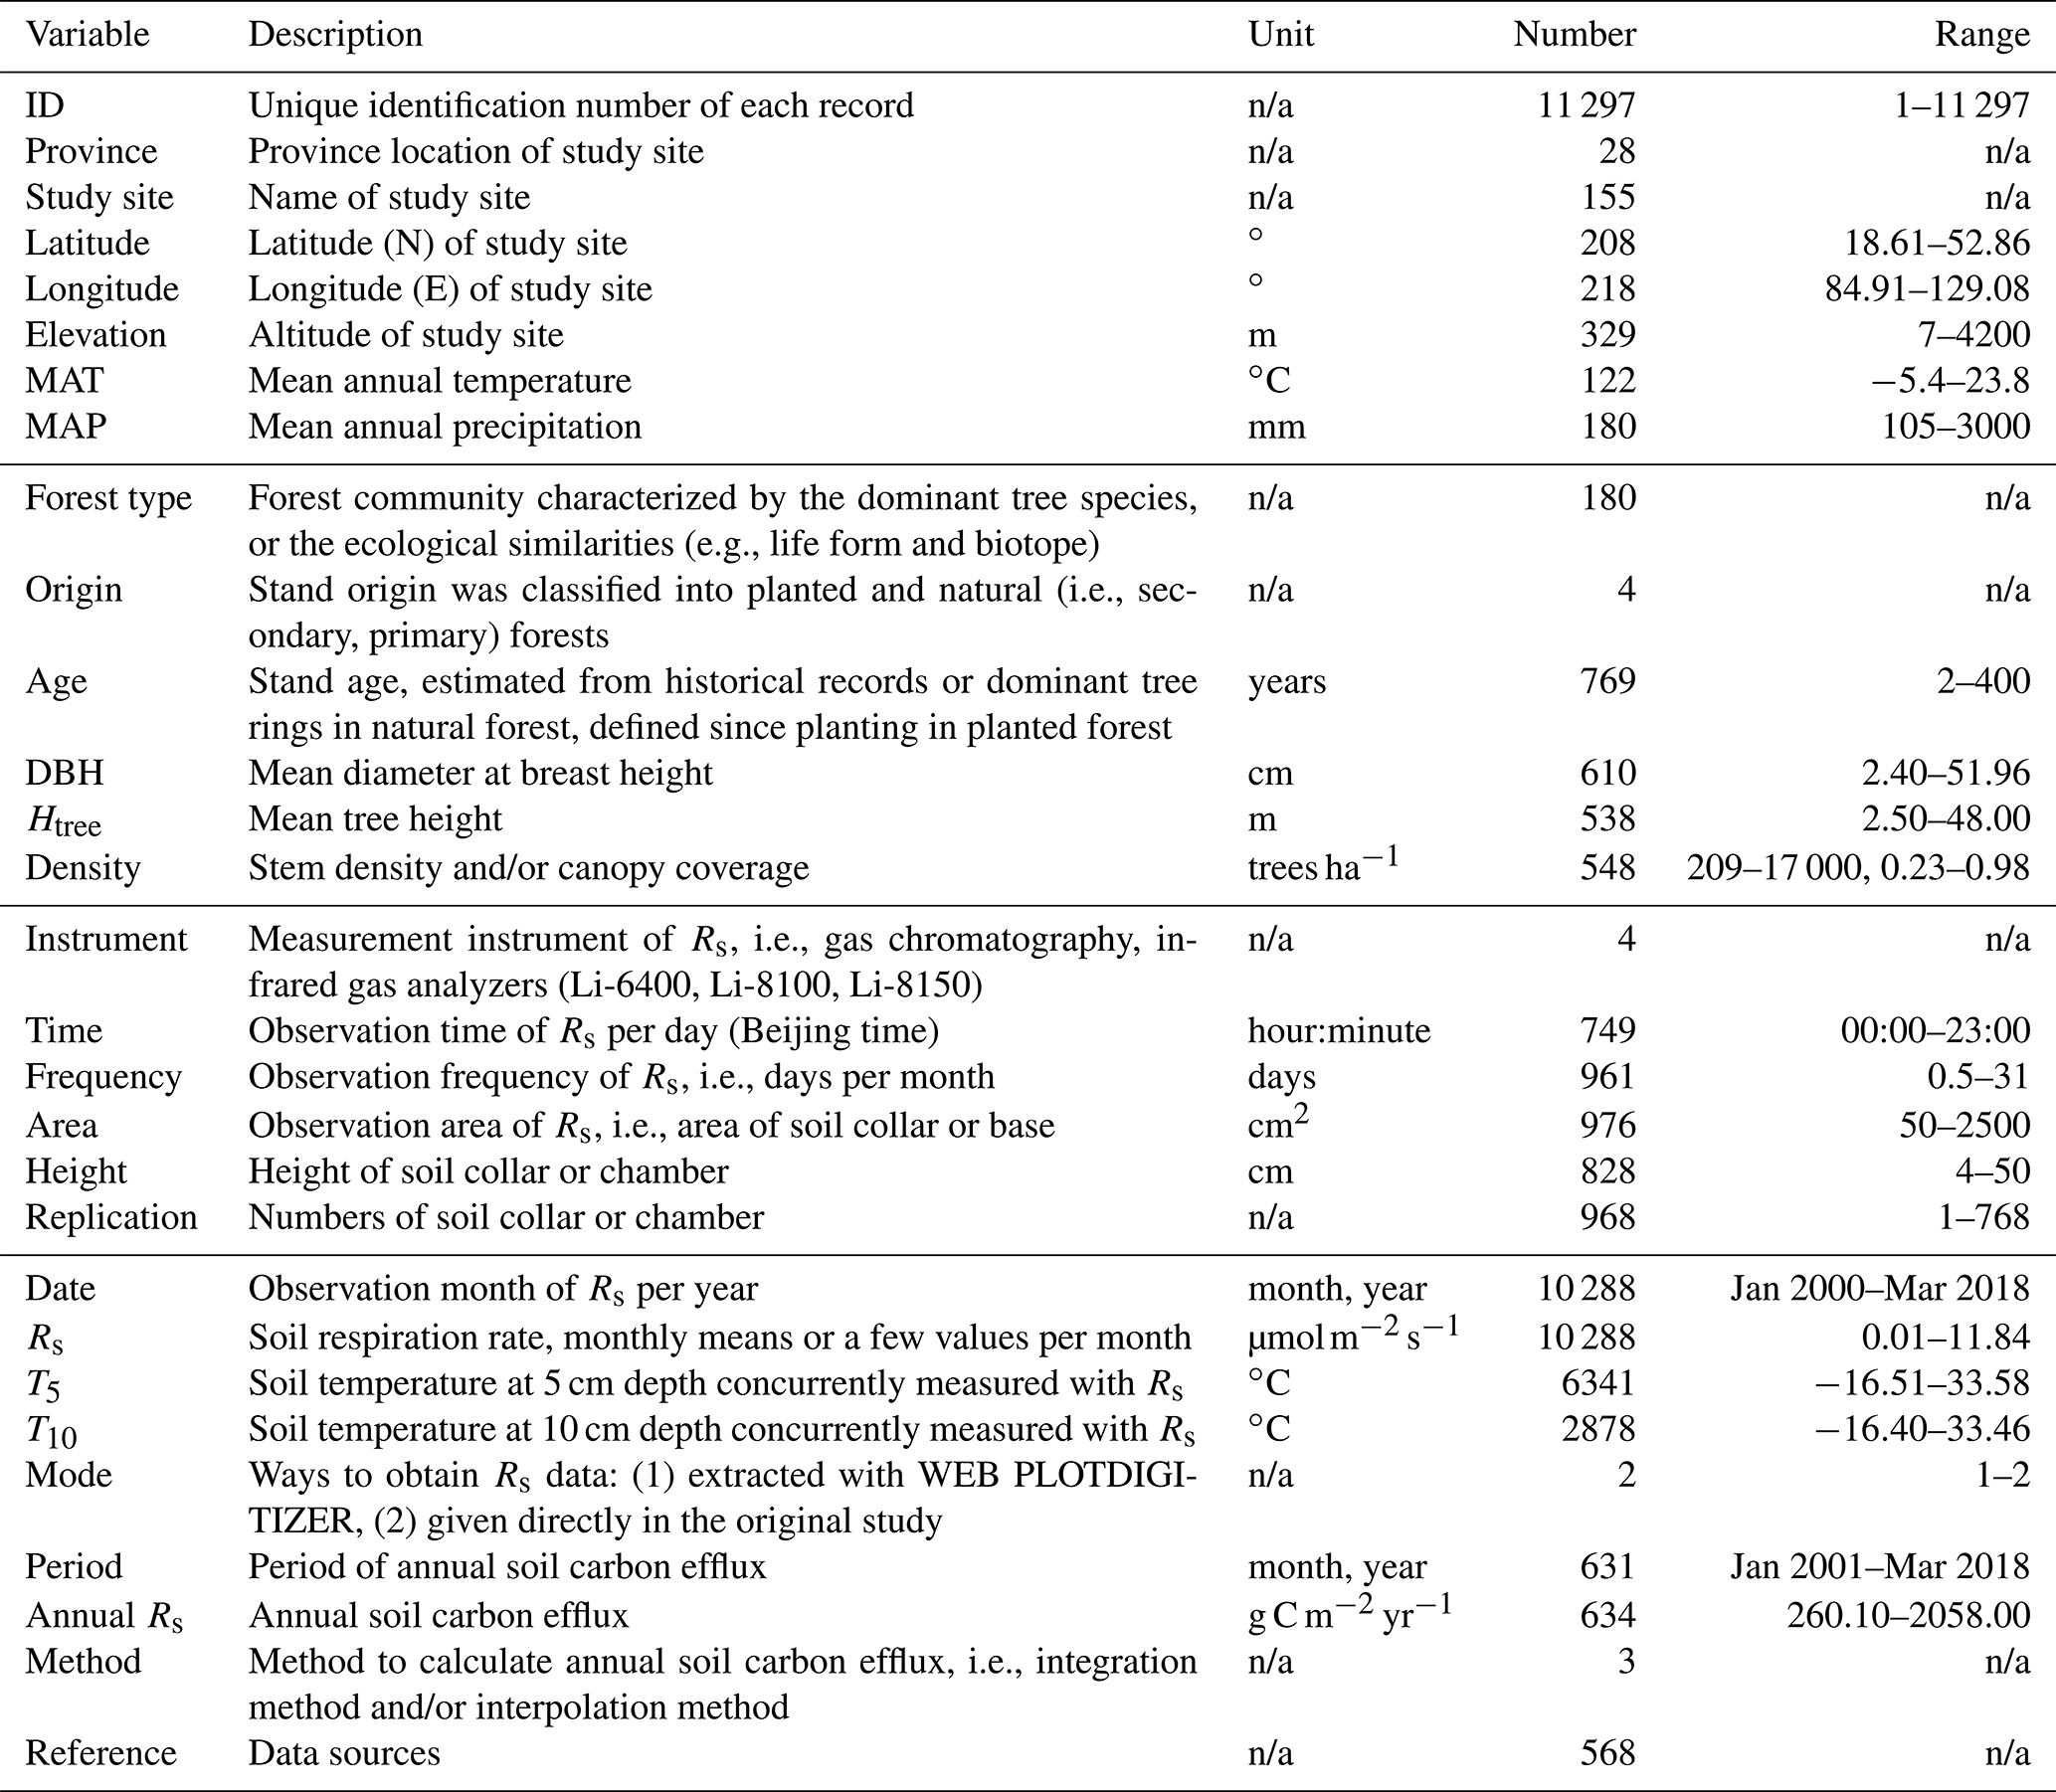
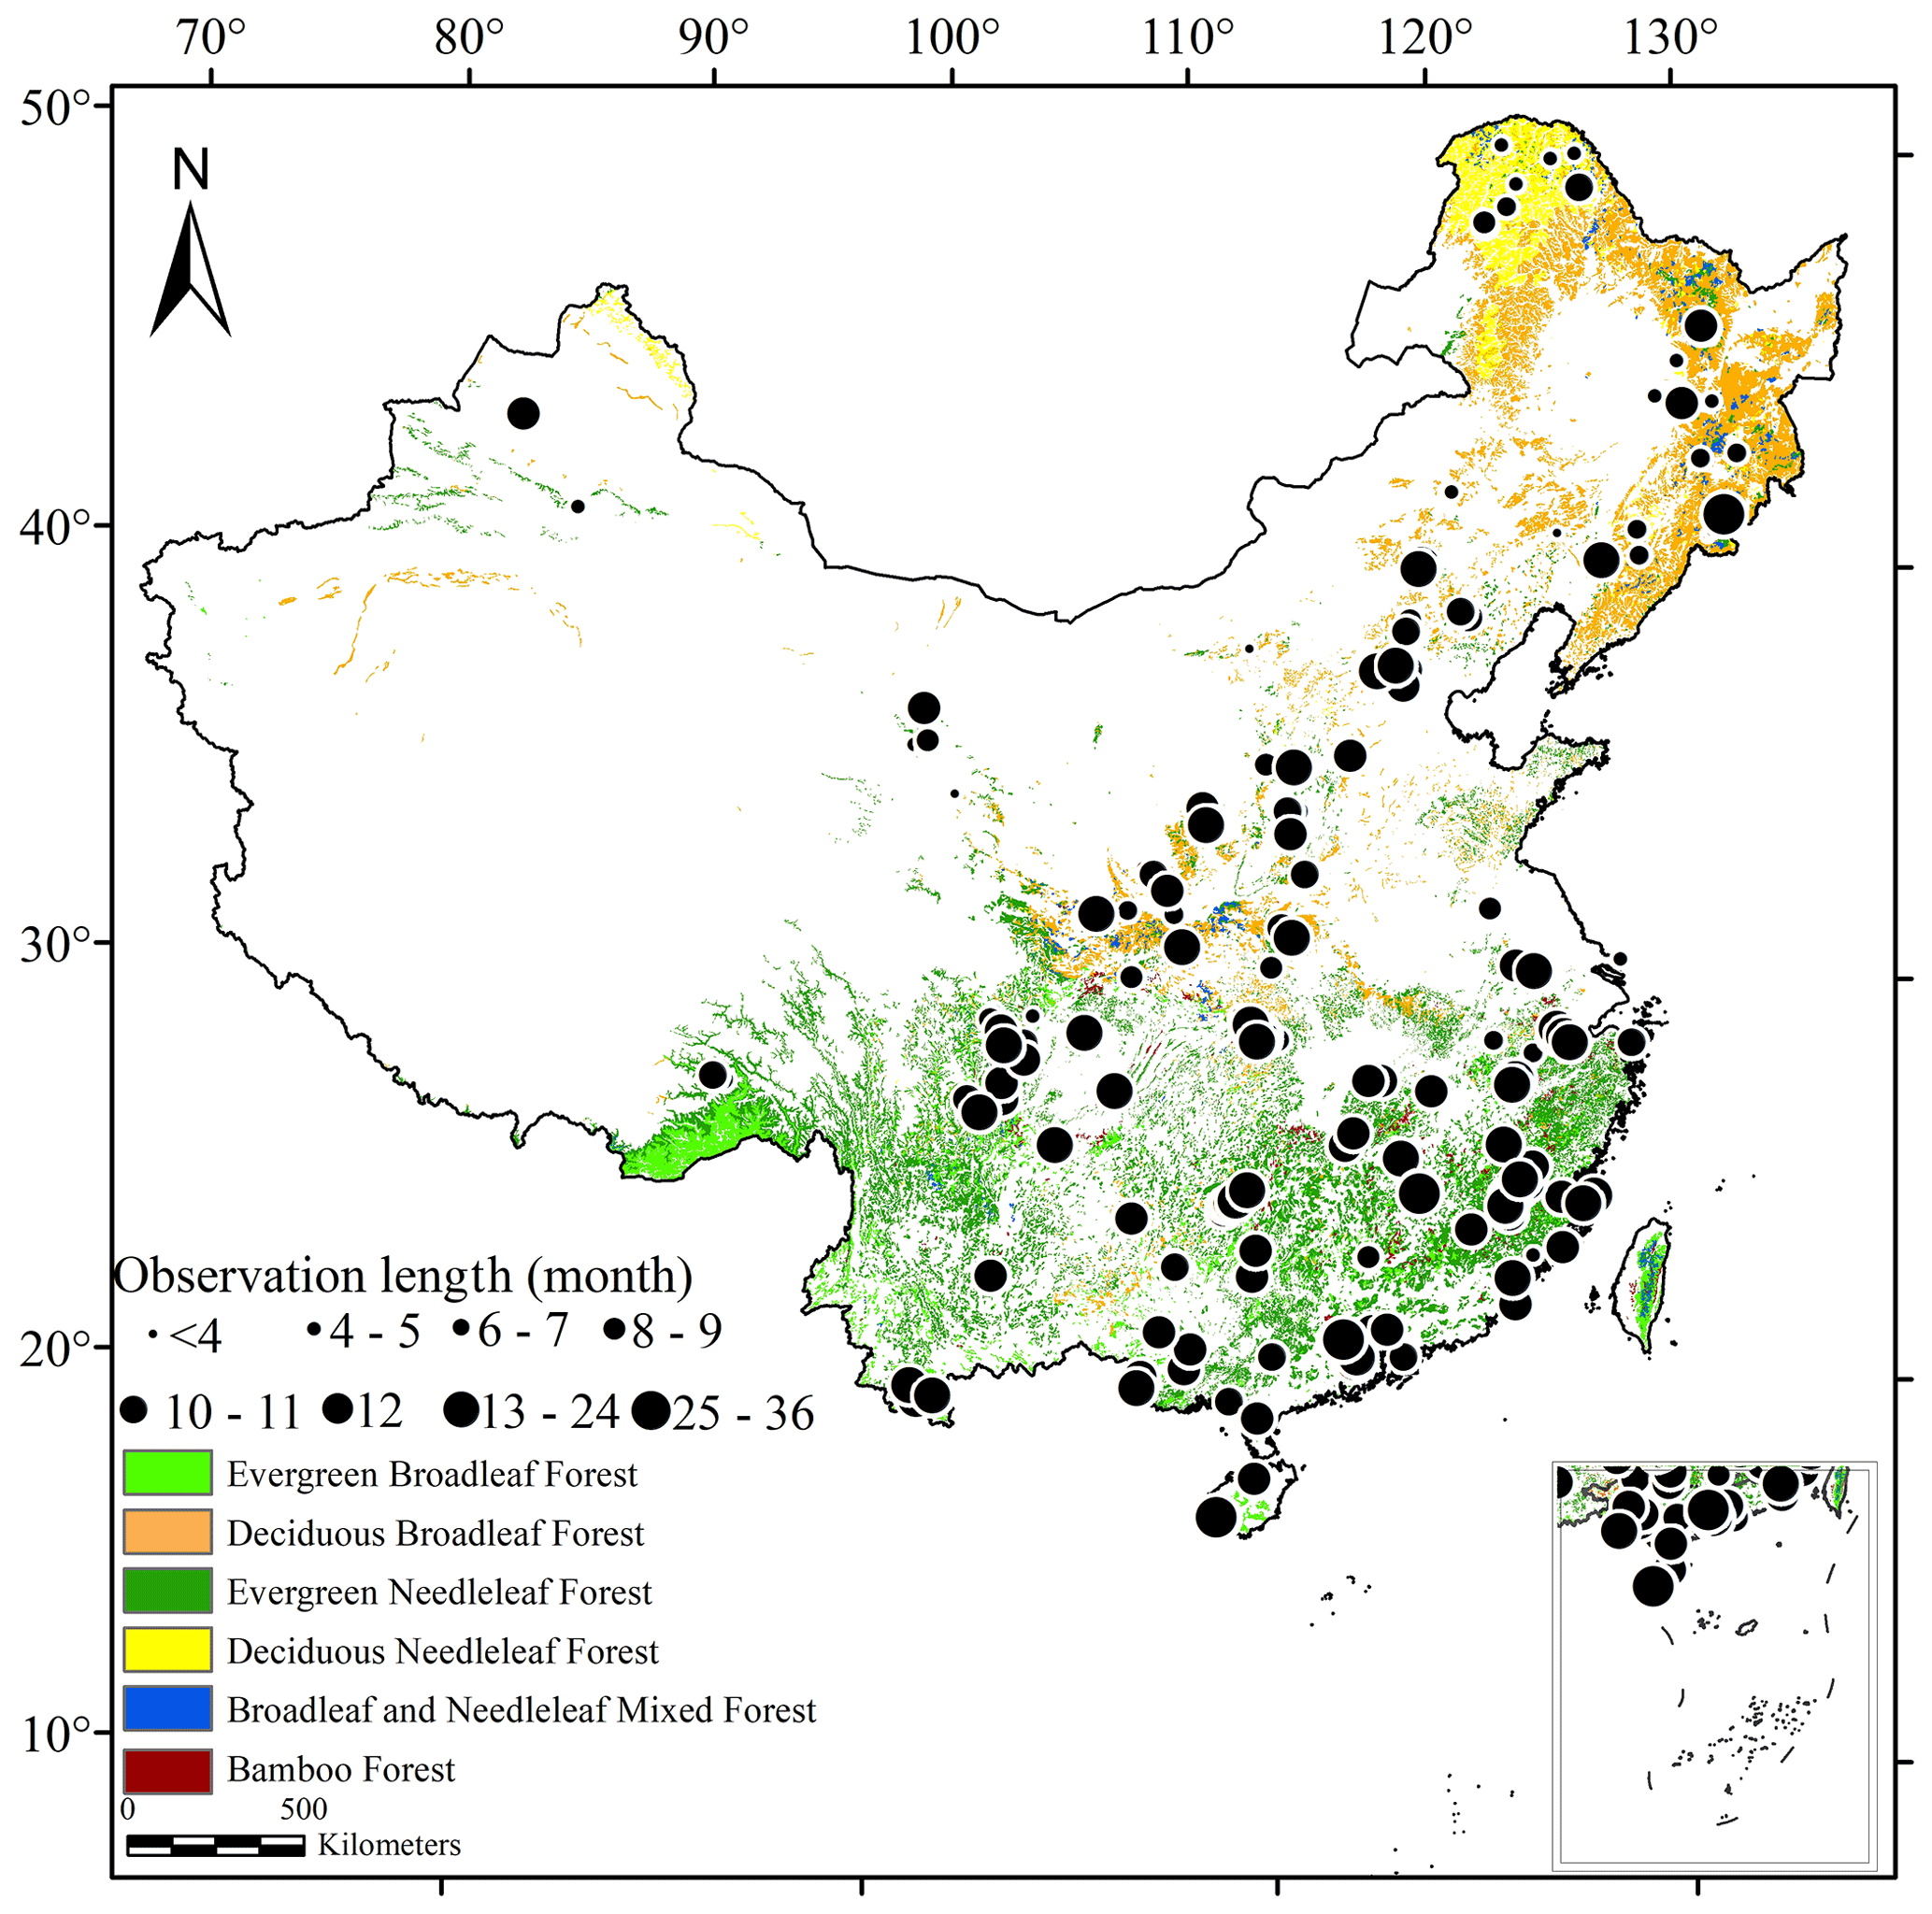
Figure 1Distribution of study sites used to develop the forest soil respiration dataset in China.
2.3 Data verification
Soil temperature as a main influencing factor was usually concurrently measured with Rs. Monthly dynamics of Rs and soil temperature at 5 cm depth (T5) and/or 10 cm depth (T10) were shown with figures in many studies in the literature. In this study, most of the Rs data (∼82 %) and the concurrent T5 and/or T10 were extracted with WEBPLOTDIGITIZER, while others (e.g., minimum, maximum) were given directly in the original papers. To verify the accuracy of the digital software, the means (Rs, T5, T10) averaged from the extracted data were compared with the corresponding means given in the original papers (Fig. S1 in the Supplement). The root mean square error (RMSE) of Rs, T5, and T10 was 0.09 , 0.35 ∘C, and 0.44 ∘C, respectively, and the coefficients of determination (R2) were all greater than 0.99, indicating that the accuracy of WEBPLOTDIGITIZER is excellent. Moreover, the data from the same authors and different sources (e.g., master's thesis or PhD dissertation and journal article) were carefully cross-checked and supplemented.
2.4 Monthly and annual soil respiration calculation
Long-term continuous Rs could be monitored with infrared gas analyzers (e.g., Li-8100, Li-8150), but there are few published studies of such continuous data (Bond-Lamberty et al., 2020; Tu et al., 2015; Wu et al., 2014; Yu et al., 2011). The observation frequency was 1–12 d per month – high during the growing season, but low in winter. Rs was measured throughout the day (16 %) or at a representative time, e.g., 09:00–11:00 (45 %), 09:00–12:00 (22 %), etc., which was validated to be close to the diurnal mean value (Xu and Qi, 2001; Yan et al., 2006; Yang et al., 2018; Yao et al., 2011; You et al., 2013; Zheng et al., 2010). Annual soil carbon efflux was integrated with the soil respiration model (i.e., integration method) or interpolated with the average soil respiration rate between sampling dates (i.e., interpolation method) (Shi et al., 2014). Finally, monthly Rs and annual soil carbon efflux were converted to the common unit of and g C m−2 yr−1, respectively (Bond-Lamberty and Thomson, 2010a).
2.5 Statistical analysis
Monthly and annual Rs were averaged arithmetically in cold-temperate, temperate, subtropical, and tropical zones. Independent-samples t tests (two groups) and one-way ANOVA (≥3 groups) at the P=0.05 significance level were used to test the differences among various forest types in the same climate zone and among the same forest type in different climate zones. Temperature sensitivity (Q10) is defined as the factor by which Rs is multiplied when temperature increases by 10 ∘C (Davidson and Janssens, 2006; Lloyd and Taylor, 1994), which is usually calculated with the van't Hoff equation ( and ), where Rs is soil respiration rate () and T is temperature (∘C). All statistical analyses were performed with SPSS Statistics 21 (SPSS Inc., Chicago, IL, USA).
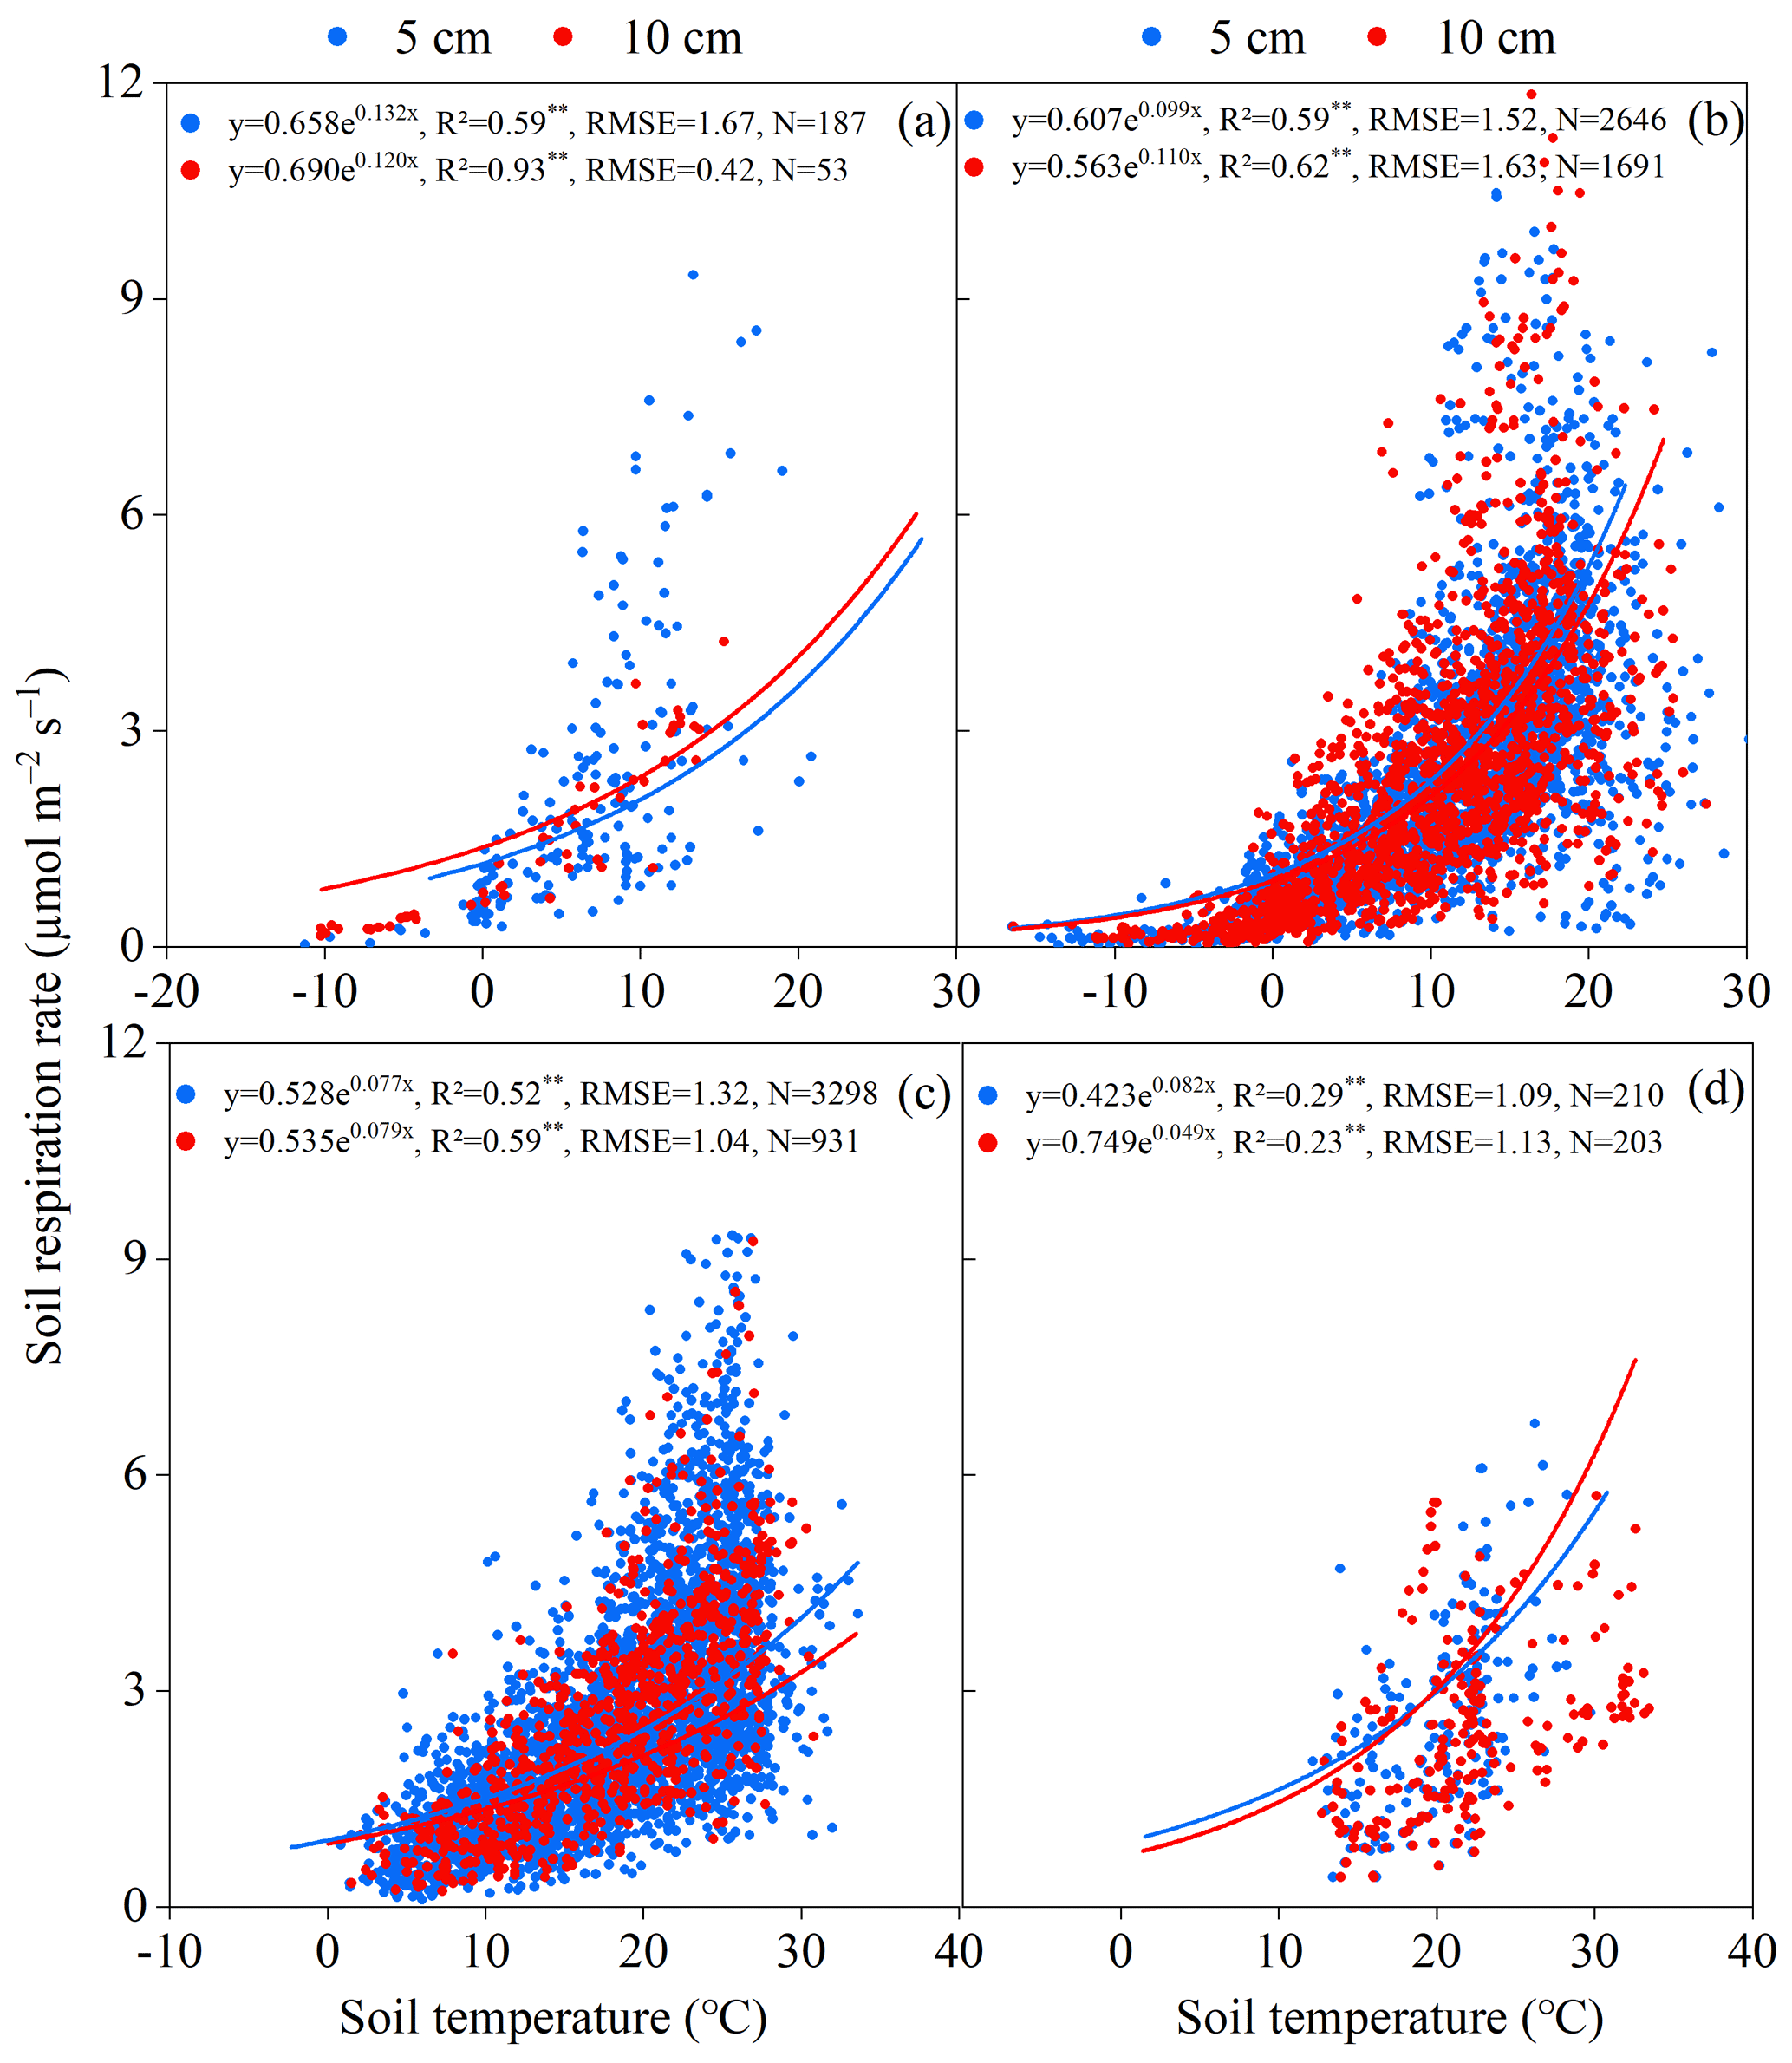
Figure 2Exponential relationships of forest soil respiration rates with soil temperature at 5 and 10 cm depth in cold-temperate (a), temperate (b), subtropical (c), and tropical zones (d). P <0.01.
3.1 Relationship between soil respiration rate and soil temperature
Temperature is often the main factor determining soil respiration rates. The samples of the paired Rs & T5 and Rs & T10 were 6341 (69 %) and 2878 (31 %) in the dataset, respectively. There were statistically significant exponential relationships of Rs with T5 and T10 in forest ecosystems across China, which could explain about 48 % and 52 % of the Rs variations, respectively (Fig. S2). The exponential correlations were all significant in four climatic zones (R2=0.23–0.93) (Fig. 2). RMSE values in cold-temperate and temperate zones (1.52–1.67 ) were greater than those in subtropical and tropical zones (1.04–1.32 ), except for the smallest RMSE from T10 in the cold-temperate zone (0.42 ).
Q10 could be calculated with the exponential equations between Rs and soil temperature. At the national scale, the Q10 values in China's forest ecosystems from T5 (−16.51–33.58 ∘C) and T10 (−16.40–33.46 ∘C) were 2.05 and 2.17, respectively. Q10 was the largest in the cold-temperate zone (T5: 3.74 & T10: 3.32), secondary in the temperate zone (T5: 2.69 & T10: 3.00), and the smallest in the subtropical zone (T5: 2.15 & T10: 2.20) and tropical zone (T5: 2.28 & T10: 1.63).
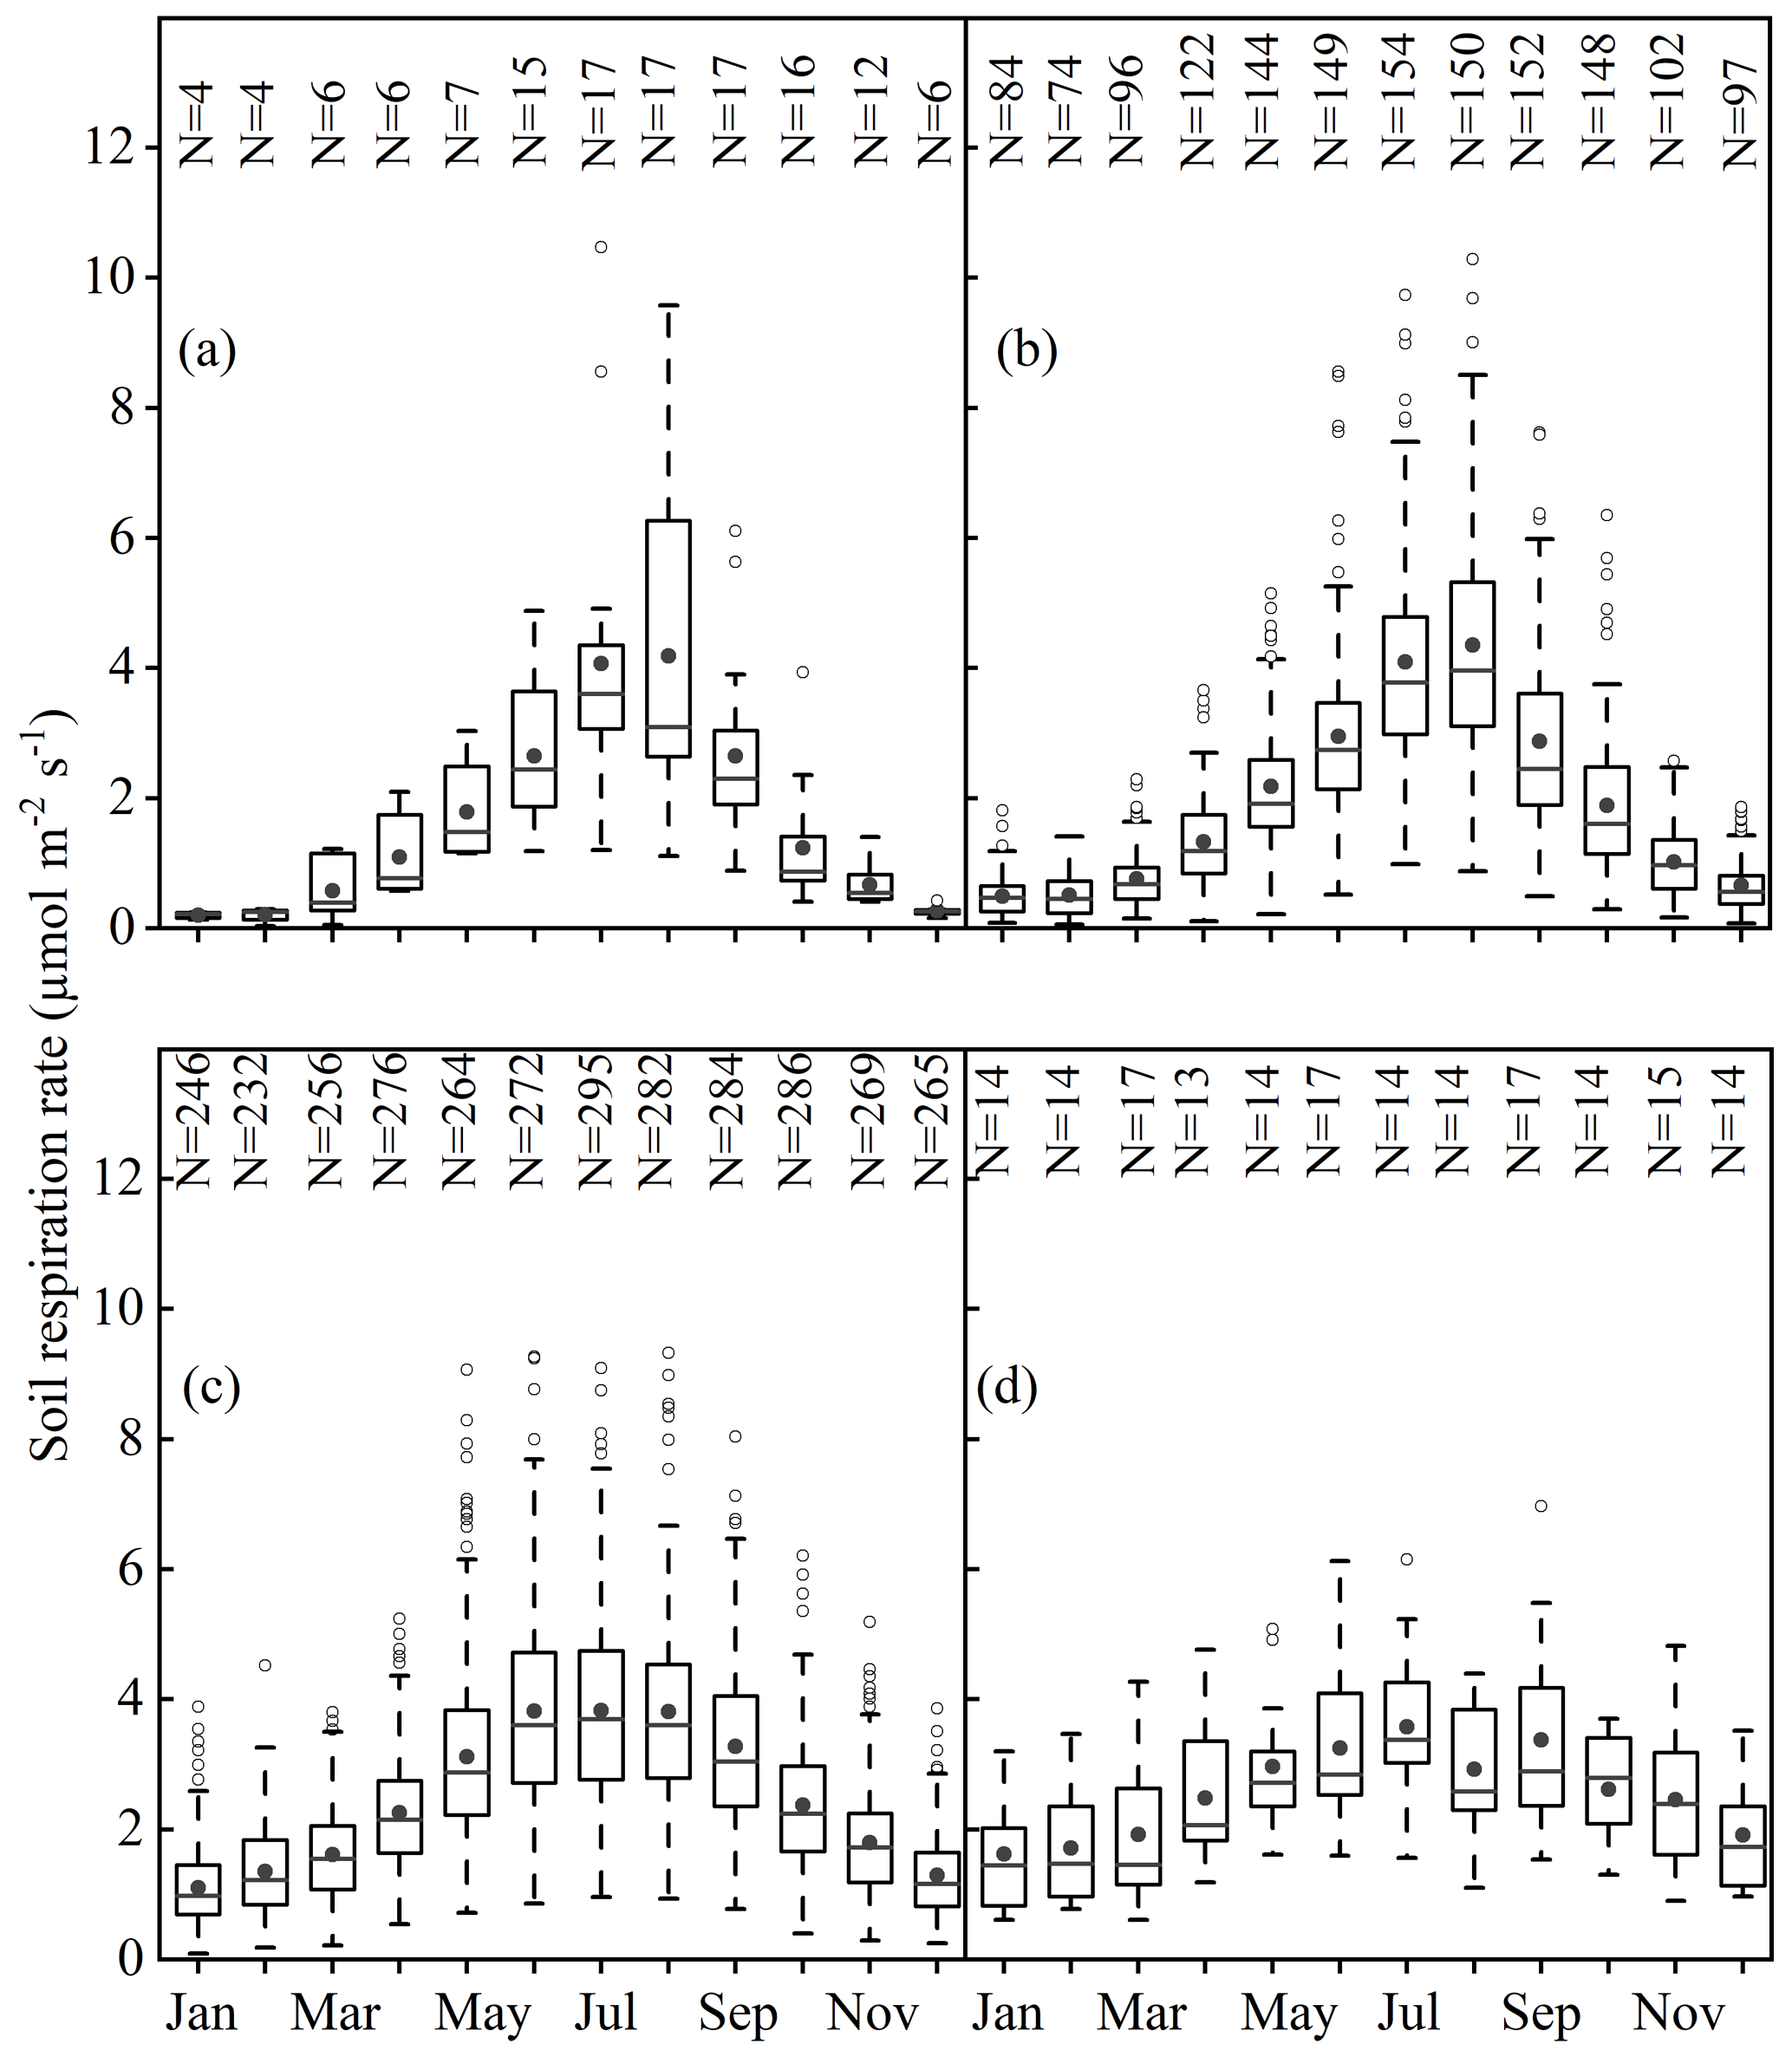
Figure 3Monthly patterns of forest soil respiration rates in cold-temperate (a), temperate (b), subtropical (c), and tropical zones (d). Solid circle: mean value; solid horizontal line: median; box: 25th to 75th percentiles; whisker: 1.5 times interquartile range; open circle: data points beyond the whiskers. The samples per month are listed in the upper part of the figure.
3.2 Monthly dynamics of soil respiration
Monthly Rs appeared as a single-peak curve (Fig. 3), which derived from similar years in cold-temperate (2003–2016), temperate (2002–2018), subtropical (2000–2017), and tropical zones (2003–2015). The highest values were found in August (4.18–4.36 ) in cold-temperate and temperate zones, higher than the highest values in July (3.58–3.83 ) in subtropical and tropical zones. The lowest values occurred in January in cold-temperate (0.20 ), temperate (0.49 ), subtropical (1.10 ), and tropical zones (1.62 ). Monthly variations were largest in the cold-temperate and temperate zones, secondary in the subtropical zone, and smallest in the tropical zone.
Annual mean Rs during January–December from low to high was cold-temperate (1.63 ), temperate (1.93 ), subtropical (2.47 ), and tropical zones (2.57 ). Annual soil carbon emissions were calculated with the annual mean Rs: 621.91 g C m−2 yr−1 in the cold-temperate zone, 733.31 g C m−2 yr−1 in the temperate zone, 937.15 g C m−2 yr−1 in the subtropical zone, and 973.35 g C m−2 yr−1 in the tropical zone. Soil carbon emissions in the growing season (May–October) and in winter (November–April) accounted for 85 % and 15 % of emissions in the cold-temperate zone, 80 % and 20 % in the temperate zone, 69 % and 31 % in the subtropical zone, and 61 % and 39 % in the tropical zone. Subtropical and tropical zones maintained high soil respiration rates during November–April, which is the main source of their higher annual soil carbon emissions.
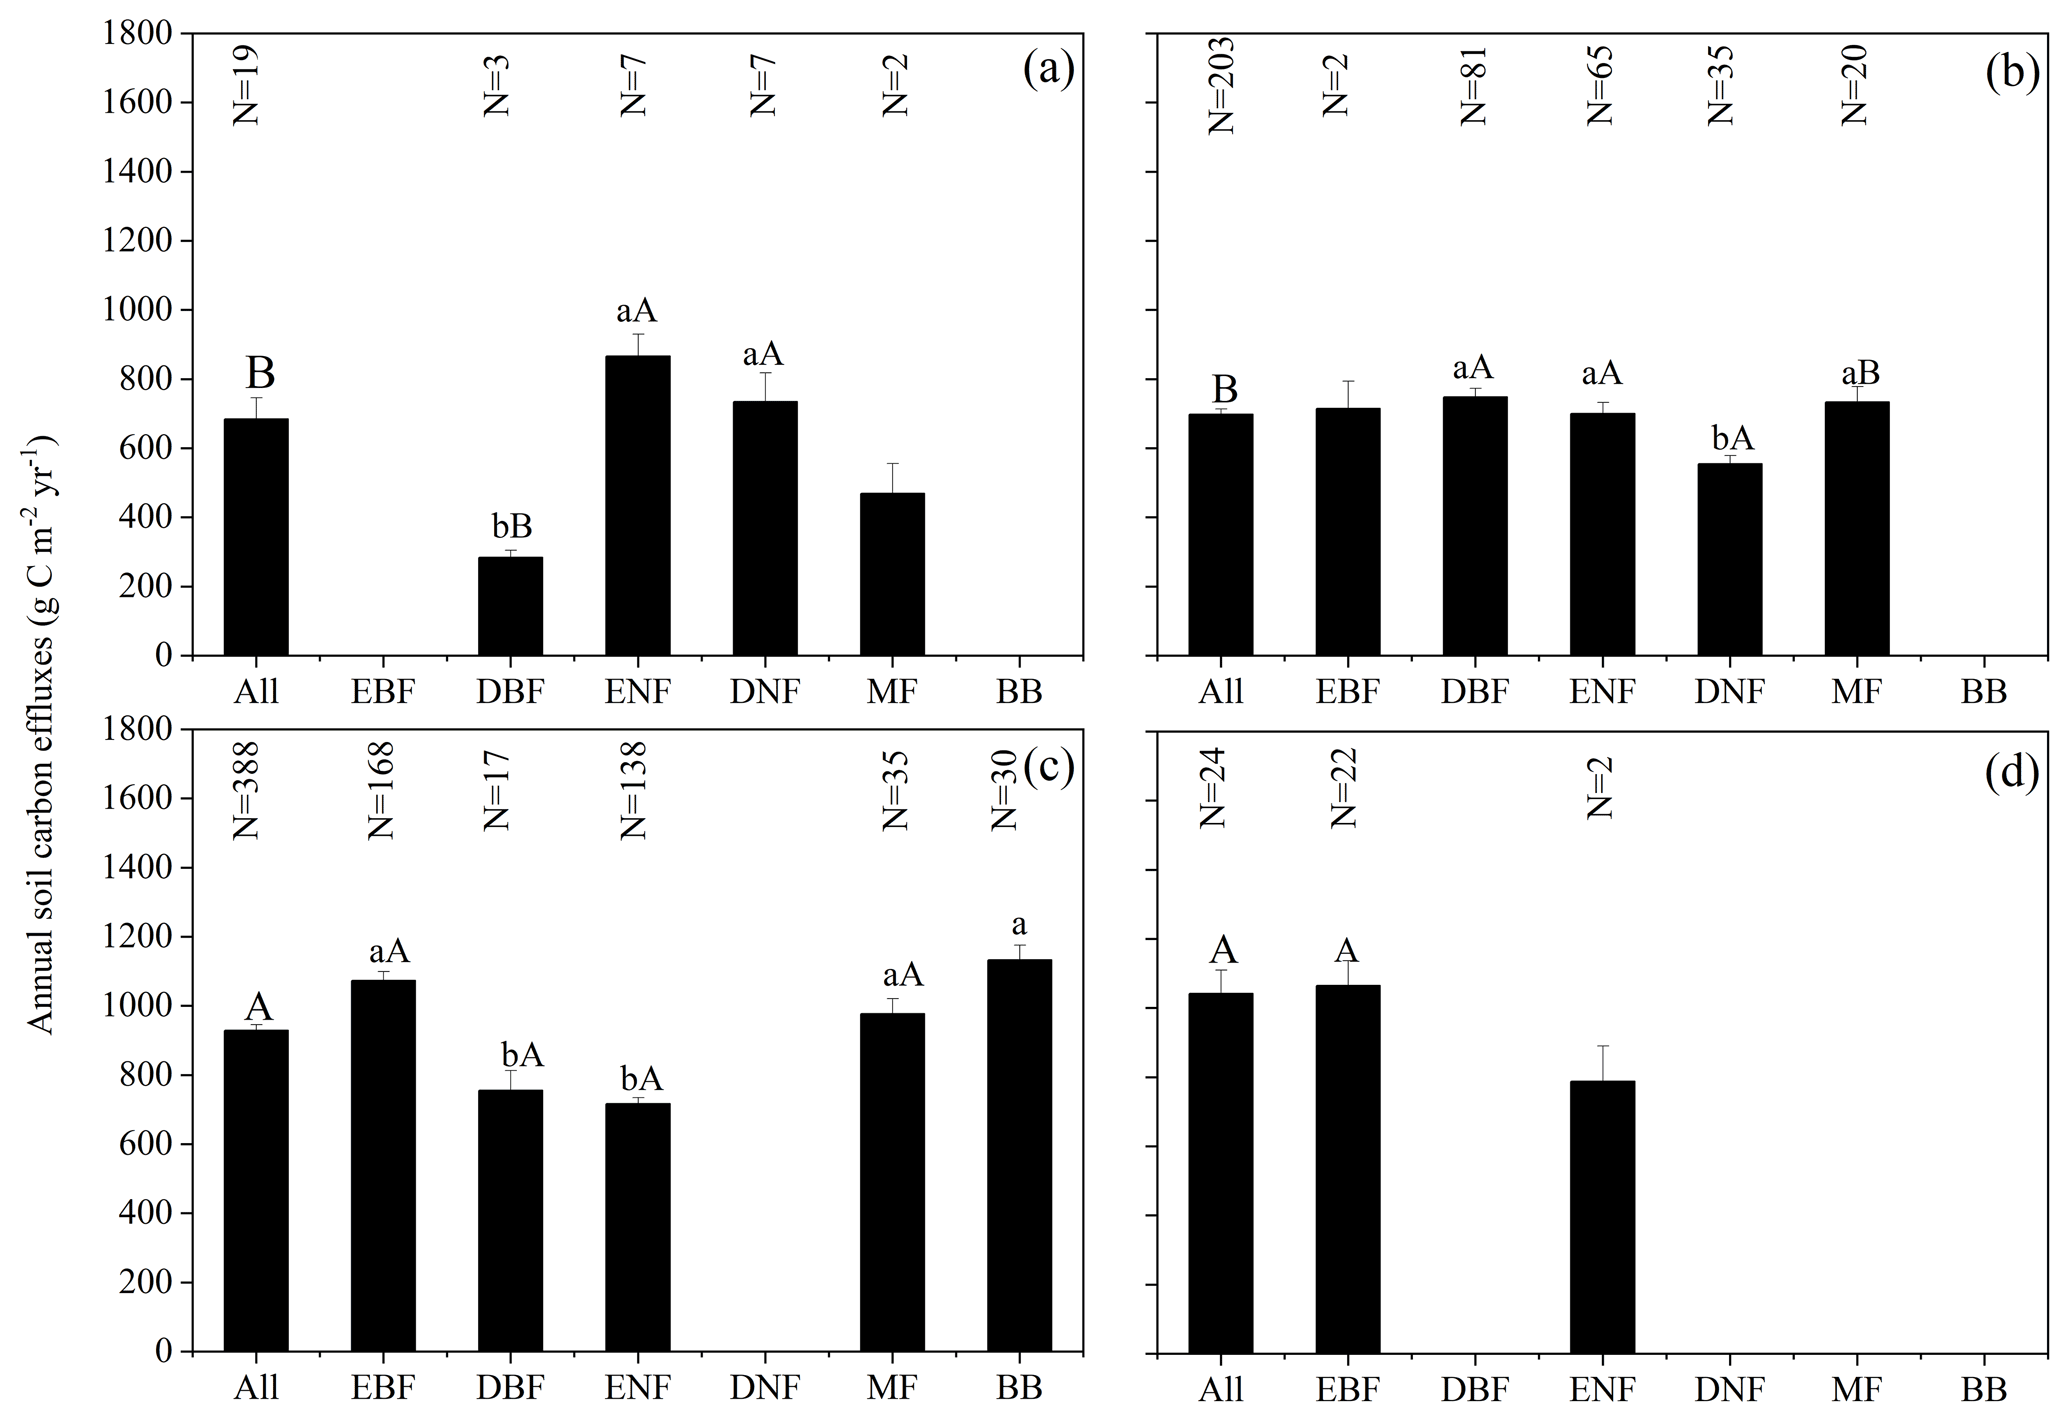
Figure 4Comparisons of annual soil carbon effluxes (mean ± standard error) among different forest types across China in cold-temperate (a), temperate (b), subtropical (c), and tropical zones (d). Lowercase letters indicate comparisons of different forest types in each climatic zone, while uppercase letters are comparisons of the same forest type in different climatic zones. The samples are listed in the upper part of the figure, and samples larger than 3 were compared. EBF: evergreen broadleaf forest, DBF: deciduous broadleaf forest, ENF: evergreen needleleaf forest, DNF: deciduous needleleaf forest, MF: broadleaf and needleleaf mixed forest and BB: bamboo forest.
3.3 Annual soil carbon effluxes
There were 634 annual soil carbon effluxes, and most of the observations were conducted in the subtropical zone (61 %) and temperate zone (32 %) (Fig. 4). The observations spanned the period 2003–2014 in the cold-temperate zone, 2000–2018 in the temperate zone, 2002–2017 in the subtropical zone, and 2003–2017 in the tropical zone. The annual soil carbon effluxes ranged from 260.10 to 2058.00 g C m−2 yr−1 in China's forest ecosystems, and the mean was 851.88±12.75 g C m−2 yr−1. The annual soil carbon effluxes increased with the increase in mean annual temperature and precipitation at the national scale (Fig. S3). The mean annual soil carbon emissions in the tropical, subtropical, temperate, and cold-temperate zones were 1042.01±68.55, 928.91±16.68, 697.85±16.39, and 684.29±61.81 g C m−2 yr−1, respectively. The first two were significantly higher than the last two, but the differences were not significant between the tropical and subtropical zones, and between the temperate and cold-temperate zones. The differences were not significant for evergreen broadleaf forest (EBF), evergreen needleleaf forest (ENF), and deciduous needleleaf forest (DNF) among different climate zones. The values for deciduous broadleaf forest (DBF) in the temperate (748.59±25.18 g C m−2 yr−1) and subtropical zones (755.41±58.26 g C m−2 yr−1) were similar, both of which were greater than that in the cold-temperate zone (284.20±21.36 g C m−2 yr−1). Broadleaf and needleleaf mixed forest in the subtropical zone (977.35±43.56 g C m−2 yr−1) had significantly higher emissions than in the temperate zone (733.44±45.29 g C m−2 yr−1).
Emissions in evergreen forests were usually higher than in deciduous forests in the same climatic zone, e.g., ENF (866.98±63.74 g C m−2 yr−1) and DNF (734.56±83.67 g C m−2 yr−1) in the cold-temperate zone, ENF (699.96±32.77 g C m−2 yr−1) and DNF (555.15±24.19 g C m−2 yr−1) in the temperate zone, EBF (1073.50±26.44 g C m−2 yr−1) and DBF (755.41±58.26 g C m−2 yr−1) in the subtropical zone. Broadleaf forests showed significantly larger annual fluxes than coniferous forests in the temperate zone (DBF: 748.59±25.18 g C m−2 yr−1 vs. DNF: 555.15±24.19 g C m−2 yr−1) and subtropical zone (EBF: 1073.50±26.44 g C m−2 yr−1 vs. ENF: 717.50±17.61 g C m−2 yr−1). However, DNF fluxes (734.56±83.67 g C m−2 yr−1) were larger compared with DBF (284.20±21.36 g C m−2 yr−1) in the cold-temperate zone, which was from the high-latitude Great Xing'an Mountains (∼51∘ N) and high-altitude Mount Gongga (2800–2950 m). Additionally, bamboo is a special type in subtropical areas, exhibiting the highest soil carbon emissions (1133.55±42.74 g C m−2 yr−1).
4.1 Temperature sensitivity (Q10) of soil respiration
Q10 is a key parameter in modeling the effects of climate warming on soil carbon release. The Q10 values calculated with the exponential equations of T5 and T10 were 2.05 and 2.17, respectively, at the national scale (Fig. S2), which were lower than the averaged Q10 from different studies in the syntheses of China's forest ecosystems (T5: 2.28–2.51 and T10: 2.74–3.00, Peng et al., 2009; Song et al., 2014; Xu et al., 2015; Zheng et al., 2009) and global forest ecosystems (T5: 2.55–2.70 and T10: 3.01–3.31, W. Wang et al., 2010; X. Wang et al., 2010). Our results were close to the Q10 of 2, which is commonly used in many biogeochemical models (e.g., Cox et al., 2000; Sampson et al., 2007), and the mean Q10 of 2.11 estimated with inverse modeling in forest soils across China (Zhou et al., 2009).
Temperature was the most important limiting factor for soil microbial activity and root growth in cold regions; thus, Rs was more sensitive to temperature changes (Lloyd and Taylor, 1994; Peng et al., 2009; Zheng et al., 2009, 2020). The Q10 increased from the tropical zone to the cold-temperate zone in this study, and varied from 1.63 to 3.74. Soil temperature at the depth of 5 and 10 cm could only explain 29 % and 23 % of the Rs variations and RMSEs were 1.09 and 1.13 in the tropical zone, respectively (Fig. 2d). The difference of the mean Rs between tropical moist forests (1260 g C m−2 yr−1) and tropical dry forests (673 g C m−2 yr−1) was about 2-fold (Raich and Schlesinger, 1992), indicating that soil moisture might play more important roles.
4.2 Comparisons of monthly and annual soil carbon effluxes
The lowest monthly Rs occurred in January, and the highest values occurred in August in the cold-temperate and temperate zones and in July in the subtropical and tropical zones (Fig. 3). Similarly, monthly Rs values of global terrestrial ecosystems reached their minima in February and peaked in July and August (Hashimoto et al., 2015; Raich et al., 2002). Due to the limitation of low temperature, winter observations of Rs were relatively fewer in the cold-temperate and temperate zones. The Rs in winter (November–April) was usually assumed to account for 20 % of the total annual Rs (Geng et al., 2017; Yang and Wang, 2005), which was in agreement with the proportion in the temperate zone, but greater than 15 % in the cold-temperate zone.
Annual soil carbon emissions were synthesized for forest ecosystems across China, and the mean was 745.34 g C m−2 yr−1 (Zheng et al., 2010), 764.11 g C m−2 yr−1 (Zhan et al., 2012), 917.73 g C m−2 yr−1 (Song et al., 2014) and 975.50 g C m−2 yr−1 (Chen et al., 2008); the mean of 851.88 g C m−2 yr−1 in the present study was in the mid-range. The mean annual Rs in China's forest ecosystems was slightly lower than the mean Rs of 990.00 g C m−2 yr−1 in global forest ecosystems (Chen et al., 2010). Warner et al. (2019) modeled global Rs and found that the lowest and highest annual soil carbon emissions were in deciduous needleleaf forests (mean = 344.10 g C m−2 yr−1) and evergreen broadleaf forests (mean = 1310.47 g C m−2 yr−1), respectively. Compared with the predicted annual Rs, deciduous needleleaf forests in the cold-temperate (mean = 734.56 g C m−2 yr−1) and temperate zones (mean = 555.15 g C m−2 yr−1) had higher values, but those of evergreen broadleaf forests in subtropical (mean = 1073.50 g C m−2 yr−1) and tropical zones (mean = 1065.09 g C m−2 yr−1) were lower (Fig. 4).
The mean annual soil carbon emissions from 634 annual Rs and 5003 mean monthly Rs were 684.29 and 621.91 g C m−2 yr−1, respectively, in the cold-temperate zone, 697.85 and 733.31 g C m−2 yr−1 in the temperate zone, 928.91 and 937.15 g C m−2 yr−1 in the subtropical zone, and 1042.01 and 973.35 g C m−2 yr−1 in the tropical zone (Figs. 4 and 3). The differences between the directly averaged annual Rs and the accumulative mean monthly Rs were smallest in the tropical zone (−8.24 g C m−2 yr−1), secondary in the temperate zone (−35.46 g C m−2 yr−1), and largest in the cold-temperate and tropical zones (62.38–68.66 g C m−2 yr−1). From Fig. 4 we can also see that the standard errors in the tropical and temperate zones (∼16 g C m−2 yr−1) were smaller than those in the cold-temperate and tropical zones (∼65 g C m−2 yr−1). Mean annual soil carbon emissions in the temperate, subtropical, and tropical ecosystems were 745, 776, and 1286 g C m−2 yr−1 at the global scale, respectively (Bond-Lamberty and Thomson, 2010a), which were comparable to our results.
4.3 Improvements of the dataset
Rs measurements were mainly from Li-8100 (47 %) and Li-6400 (33 %), secondary from gas chromatography (18 %), and Li-8150 only accounted for 2 %. The differences of the four common measurement methods were proved to be small (∼10 %) (Wang et al., 2011; Yang et al., 2018; Zheng et al., 2010). The sample sizes of annual Rs were 50–139 (Chen et al., 2008; Song et al., 2014; Zhan et al., 2012; Zheng et al., 2010) and 634 in the current study, and increased more than 4-fold. The global soil respiration database (SRDB-V5) collected 523 undisturbed annual Rs in China's forest ecosystems (Jian et al., 2021), but all methods were included, e.g., alkali absorption, gas chromatography, and various infrared gas analyzers. The alkali absorption method could underestimate Rs (Chen et al., 2008; Jian et al., 2020). The total samples of mean monthly Rs were 5003, which was much larger than the other dataset monthly samples of 1782 in China's forest ecosystems (Jian et al., 2020; Steele and Jian, 2018). Additionally, we extended the dataset with the digital software (WEBPLOTDIGITIZER) from the monthly dynamics figures of the original papers, including the paired Rs & T5 (N=6341) and Rs & T10 (N=2878). Predicting soil respiration from soil temperature has gained extensive acceptance (Shi et al., 2014; Song et al., 2014; Sun et al., 2020). These data could be used to establish a large-scale soil respiration equation and acquire the key parameters of the carbon cycle. Compared with the aforementioned monthly or annual databases, this study collected all available Rs data at different time scales. Figure S4 showed the length of the individual time series from the different sites; the high frequencies were 12 months (38 %), 6–7 months (20 %), and 13–24 months (15 %). Bamboo forests were seldom considered in the previous databases (Chen et al., 2008; Steele and Jian, 2018; Zhan et al., 2012; Zheng et al, 2010), which exhibited the highest soil carbon emissions (Mean = 1133.55 g C m−2 yr−1, Fig. 4). With the area increasing at a high rate of 3.1 % per year (Song et al., 2017), bamboo forests would play an important role in the regional and even national carbon cycle. It is worth noting that the Rs studies were fewer in the regions of latitude greater than 48∘ (∼2 %) or elevation higher than 3000 m (∼4 %). The potentially under-represented forest types might affect the evaluation of the temperature sensitivity of soil respiration and of annual soil carbon emissions at the regional and national scales.
The soil respiration dataset in China's forest ecosystems used to produce the results in this study is free to the public for scientific purposes and can be downloaded at https://doi.org/10.1594/PANGAEA.943617 (Sun et al., 2022).
In this study, we reviewed the Rs-related literature and collected in situ Rs measurements with common infrared gas analyzers (i.e., Li-6400, Li-8100, Li-8150) or gas chromatography to assemble a comprehensive and uniform dataset of China's forest ecosystems at different time scales. Besides the Rs data reported directly in the original papers, the monthly patterns of Rs and the concurrently measured soil temperature at 5 and/or 10 cm depth in the figures were digitized. Moreover, we made a preliminary analysis of the data. The results showed that soil temperature could explain 22.5 %–93.4 % of the Rs variations. Temperature sensitivity (Q10) was about 2.05–2.17 at the national scale, increasing from 1.63 in the tropical zone to 3.74 in the cold-temperate zone. Monthly Rs showed a single-peak curve, and the highest values occurred in August (4.18–4.36 ) in the cold-temperate and temperate zones, higher than the highest values in July (3.58–3.83 ) in the subtropical and tropical zones. Mean annual soil carbon emissions decreased from tropical (1042.01 g C m−2 yr−1), subtropical (928.91 g C m−2 yr−1), temperate (697.85 g C m−2 yr−1) to cold-temperate zones (684.29 g C m−2 yr−1). This study provides basic data and a scientific basis for the quantitative evaluation of soil carbon emissions from forest ecosystems in China.
The supplement related to this article is available online at: https://doi.org/10.5194/essd-14-2951-2022-supplement.
BJ designed the soil respiration dataset and searched the papers published until 2018. HS and BJ collected and digitized soil respiration data and compiled the associated information. HS and BJ prepared the manuscript. ZX provided many useful suggestions and reviewed the paper.
The contact author has declared that none of the authors has any competing interests.
Publisher's note: Copernicus Publications remains neutral with regard to jurisdictional claims in published maps and institutional affiliations.
We are grateful to the scientists who contributed their work to the dataset. We thank Ben Bond-Lamberty and four anonymous reviewers for their constructive comments and improvements to this manuscript.
This research has been supported by the National Natural Science Foundation of China (grant no. 32071592) and the National Key Research and Development Program of China (grant no. 2017YFC0503906).
This paper was edited by Giulio G. R. Iovine and reviewed by four anonymous referees.
Bond-Lamberty, B. and Thomson, A.: A global database of soil respiration data, Biogeosciences, 7, 1915–1926, https://doi.org/10.5194/bg-7-1915-2010, 2010a.
Bond-Lamberty, B. and Thomson, A.: Temperature-associated increases in the global soil respiration record, Nature, 464, 579–582, https://doi.org/10.1038/nature08930, 2010b.
Bond-Lamberty, B., Christianson, D. S., Malhotra, A., Pennington, S. C., Sihi, D., AghaKouchak, A., Anjileli, H., Arain, M. A., Armesto, J. J., Ashraf, S., Ataka, M., Baldocchi, D., Black, T. A., Buchmann, N., Carbone, M. S., Chang, S. C., Crill, P., Curtis, P. S., Davidson, E. A., Desai, A. R., Drake, J. E., El-Madany, T. S., Gavazzi, M., Görres, C. M., Gough, C. M., Goulden, M., Gregg, J., del Arroyo, O. G., He, J. S., Hirano, T., Hopple, A., Hughes, H., Järveoja, J., Jassal, R., Jian, J. S., Kan, H. M., Kaye, J., Kominami, Y., Liang, N. S., Lipson, D., Macdonald, C. A., Maseyk, K., Mathes, K., Mauritz, M., Mayes, M. A., McNulty, S., Miao, G. F., Migliavacca, M., Miller, S., Miniat, C. F., Nietz, J. G., Nilsson, M. B., Noormets, A., Norouzi, H., O'Connell, C. S., Osborne, B., Oyonarte, C., Pang, Z., Peichl, M., Pendall, E., Perez-Quezada, J. F., Phillips, C. L., Phillips, R. P., Raich, J. W., Renchon, A. A., Ruehr, N. K., Sánchez-Cañete, E. P., Saunders, M., Savage, K. E., Schrumpf, M., Scott, R. L., Seibt, U., Silver, W. L., Sun, W., Szutu, D., Takagi, K., Takagi, M., Teramoto, M., Tjoelker, M. G., Trumbore, S., Ueyama, M., Vargas, R., Varner, R. K., Verfaillie, J., Vogel, C., Wang, J. S., Winston, G., Wood, T. E., Wu, J. Y., Wutzler, T., Zeng, J. Y., Zha, T. S., Zhang, Q., and Zou J. L.: COSORE: A community database for continuous soil respiration and other soil-atmosphere greenhouse gas flux data, Glob. Change Biol., 26, 7268–7283, https://doi.org/10.1111/gcb.15353, 2020.
Burda, B. U., O'Connor, E. A., Webber, E. M., Redmond, N., and Perdue, L. A.: Estimating data from figures with a web-based program: Considerations for a systematic review, Res. Synth. Methods, 8, 258–262, https://doi.org/10.1002/jrsm.1232, 2017.
Chen, G. S., Yang, Y. S., Lv, P. P., Zhang, Y. P., and Qian, X. L.: Regional Patterns of soil respiration in China's forests, Acta Ecol. Sin., 28, 1748–1761, 2008.
Chen, S., Huang, Y., Zou, J., Shen, Q., Hu, Z., Qin, Y., Chen, H., and Pan, G.: Modeling interannual variability of global soil respiration from climate and soil properties, Agr. Forest Meteorol., 150, 590–605, https://doi.org/10.1016/j.agrformet.2010.02.004, 2010.
Cox, P. M., Betts, R. A., Jones, C. D., Spall, S. A., and Totterdell, I. J.: Acceleration of global warming due to carbon-cycle feedbacks in a coupled climate model, Nature, 408, 184–187, https://doi.org/10.1038/35041539, 2000
Davidson, E. A. and Janssens, I. A.: Temperature sensitivity of soil carbon decomposition and feedbacks to climate change, Nature, 440, 165–173, https://doi.org/10.1038/nature04514, 2006.
FAO: Global Forest Resources Assessment 2020: Main report, Rome, https://pipap.sprep.org/content/global-forest-resources-assessment-2020-main-report (last access: 1 July 2022), 2020.
Geng, Z. P., Mao Z. J., Huang, W., and Han, Y. Y.: Comparative study on the soil respiration and component characteristics of primary broad-leaved Korean Pine forest and Betula costata secondary forest in Xiaoxing'an Mountains, China, Bull. Bot. Res., 37, 312–320, 2017.
Hashimoto, S., Carvalhais, N., Ito, A., Migliavacca, M., Nishina, K., and Reichstein, M.: Global spatiotemporal distribution of soil respiration modeled using a global database, Biogeosciences, 12, 4121–4132, https://doi.org/10.5194/bg-12-4121-2015, 2015.
Huang, N., Wang, L., Song, X. P., Black, T. A., Jassal, R. S., Myneni, R. B., Wu, C. Y., Wang, L., Song, W. J., Ji, D. B., Yu, S. S., and Niu, Z.: Spatial and temporal variations in global soil respiration and their relationships with climate and land cover, Sci. Adv., 6, eabb8508, https://doi.org/10.1126/sciadv.abb8508, 2020.
Jian, J., Steele, M. K., Thomas, R. Q., Day, S. D., and Hodges, S. C.: Constraining estimates of global soil respiration by quantifying sources of variability, Glob. Chang. Biol., 24, 4143–4159, https://doi.org/10.1111/gcb.14301, 2018.
Jian, J., Yuan, X., Steele, M. K., Du, C., and Ogunmayowa, O.: Soil respiration spatial and temporal variability in China between 1961 and 2014, Eur. J. Soil Sci., 72, 739–755, https://doi.org/10.1111/EJSS.13061, 2020.
Jian, J., Vargas, R., Anderson-Teixeira, K., Stell, E., Herrmann, V., Horn, M., Kholod, N., Manzon, J., Marchesi, R., Paredes, D., and Bond-Lamberty, B.: A restructured and updated global soil respiration database (SRDB-V5), Earth Syst. Sci. Data, 13, 255–267, https://doi.org/10.5194/essd-13-255-2021, 2021.
Lloyd, J. and Taylor, J. A.: On the temperature dependence of soil respiration, Funct. Ecol., 8, 315–323, https://doi.org/10.2307/2389824, 1994.
Peng, S., Piao, S., Wang, T., Sun, J., and Shen, Z.: Temperature sensitivity of soil respiration in different ecosystems in China, Soil Biol. Biochem., 41, 1008–1014, https://doi.org/10.1016/j.soilbio.2008.10.023, 2009.
Raich, J. W. and Schlesinger, W. H.: The global carbon dioxide flux in soil respiration and its relationship to vegetation and climate, Tellus, 44, 81–99, https://doi.org/10.3402/tellusb.v44i2.15428, 1992.
Raich, J. W., Potter, C. S., and Bhagawati, D.: Interannual variability in global soil respiration, 1980–94, Glob. Chang. Biol., 8, 800–812, https://doi.org/10.1046/j.1365-2486.2002.00511.x, 2002.
Rayner, P. J., Scholze, M., Knorr, W., Kaminski, T., Giering, R., and Widmann, H.: Two decades of terrestrial carbon fluxes from a carbon cycle data assimilation system (CCDAS), Glob. Biogeochem. Cycle., 19, GB2026, https://doi.org/10.1029/2004GB002254, 2005.
Sampson, D. A., Janssens, I. A., Curiel Yuste, J., and Ceulemans, R.: Basal rates of soil respiration are correlated with photosynthesis in a mixed temperate forest, Glob. Chang. Biol., 13, 2008–2017, https://doi.org/10.1111/j.1365-2486.2007.01414.x, 2007.
Shi, W. Y., Yan, M. J., Zhang, J. G., Guan, J. H., and Du, S.: Soil CO2 emissions from five different types of land use on the semiarid Loess Plateau of China, with emphasis on the contribution of winter soil respiration, Atmos. Environ., 88, 74–82, https://doi.org/10.1016/j.atmosenv.2014.01.066, 2014.
Song, X., Peng, C., Zhao, Z., Zhang, Z., Guo, B., Wang, W., Jiang, H., and Zhu, Q.: Quantification of soil respiration in forest ecosystems across China, Atmos. Environ., 94, 546–551, https://doi.org/10.1016/j.atmosenv.2014.05.071, 2014.
Song, X., Chen, X., Zhou, G., Jiang, H., and Peng, C.: Observed high and persistent carbon uptake by Moso bamboo forests and its response to environmental drivers, Agr. Forest Meteorol., 247, 467–475, https://doi.org/10.1016/j.agrformet.2017.09.001, 2017.
Steele, M. K. and Jian, J.: Monthly global soil respiration database (MGRsD), Blacksburg, VA, VTechData, https://doi.org/10.7294/W400008X, 2018.
Sun, H. R., Zhou, G. S., Xu, Z. Z., Wang, Y. H., Liu, X. D., Yu, H. Y., Ma, Q. H., and Jia, B. R.: Temperature sensitivity increases with decreasing soil carbon quality in forest ecosystems across northeast China, Clim. Change, 160, 373–384, https://doi.org/10.1007/s10584-019-02650-z, 2020.
Sun, H. R., Xu, Z. Z., and Jia, B. R.: Soil respiration at different time scales from 2000 to 2018 in forest ecosystems across China, PANGAEA [data set], https://doi.org/10.1594/PANGAEA.943617, 2022.
Tu, Z. H., Pang, Z., Zhao, Y. Zheng, L. W., Yu, X. X., and Chen, L. H.: Soil respiration components and their controlling factors in a Platycladus orientalis plantation in west mountain area of Beijing, Acta Sci. Circumstantiae, 35, 2948–29562015.
Wang, W., Chen, W., and Wang, S.: Forest soil respiration and its heterotrophic and autotrophic components: Global patterns and responses to temperature and precipitation, Soil Biol. Biochem., 42, 1236–1244, https://doi.org/10.1016/j.soilbio.2010.04.013, 2010.
Wang, X., Piao, S., Ciais, P., Janssens, I. A., Reichstein, M., Peng, S., and Wang, T.: Are ecological gradients in seasonal Q10 of soil respiration explained by climate or by vegetation seasonality?, Soil Biol. Biochem., 42, 1728–1734, https://doi.org/10.1016/j.soilbio.2010.06.008, 2010.
Wang, Y., Li, Q., Wang, H., Wen, X., Yang, F., Ma, Z., Liu, Y., Sun, X., and Yu, G. Precipitation frequency controls interannual variation of soil respiration by affecting soil moisture in a subtropical forest plantation, Can. J. For. Res., 41, 1897–1906, https://doi.org/10.1139/x11-105, 2011.
Warner, D. L., Bond-Lamberty, B., Jian, J., Stell, E., and Vargas, R.: Spatial predictions and associated uncertainty of annual soil respiration at the global scale, Glob. Biogeochem. Cycle., 33, 1733–1745, https://doi.org/10.1029/2019GB006264, 2019.
Wu, Y. C., Li, Z. C., Cheng, C. F., and Ma, S. J.: Characteristics of soil respiration in a Phyllostachys pubescens plantation in the northeast of subtropics, Adv. Mater. Res., 869–870, 832–835, https://doi.org/10.4028/www.scientific.net/AMR.869-870.832, 2014.
Xu, M., and Qi, Y.: Soil-surface CO2 efflux and its spatial and temporal variations in a young ponderosa pine plantation in northern California, Glob. Change Biol., 7, 667–677, https://doi.org/10.1046/j.1354-1013.2001.00435.x, 2001.
Xu, Z., Tang, S., Xiong, L., Yang, W., Yin, H., Tu, L., Wu, F., Chen, L., and Tan, B.: Temperature sensitivity of soil respiration in China's forest ecosystems: Patterns and controls, Appl. Soil Ecol., 93, 105–110, https://doi.org/10.1016/j.apsoil.2015.04.008, 2015.
Yan, J., Wang, Y., Zhou, G., and Zhang, D.: Estimates of soil respiration and net primary production of three forests at different succession stages in south China, Glob. Change Biol., 12, 810–821, https://doi.org/10.1111/j.1365-2486.2006.01141.x, 2006.
Yang, H., Liu, S., Li, Y., and Xu, H.: Diurnal variations and gap effects of soil CO2, N2O and CH4 fluxes in a typical tropical montane rainforest in Hainan Island, China, Ecol. Res., 33, 379–392, https://doi.org/10.1007/s11284-017-1550-4, 2018.
Yang, J. Y. and Wang, C. K.: Soil carbon storage and flux of temperate forest ecosystems in northeastern China, Acta Ecol. Sin., 25, 2875–2882, 2005.
Yao, Y. G., Zhang, Y. P., Yu, G. R., Sha, L. Q., Deng, Y., and Tan, Z. H.: Representative time selection analysis on daily average value of soil respiration in a tropical rain forest, J. Nanjing For. Univ., 35, 74–782011.
You, W., Wei, W., Zhang, H., Yan, T., and Xing, Z.: Temporal patterns of soil CO2 efflux in a temperate Korean Larch (Larix Olgensis Herry.) plantation, Northeast China, Trees, 27, 1417–1428, https://doi.org/10.1007/s00468-013-0889-6, 2013.
Yu, G., Zheng, Z., Wang, Q., Fu, Y., Zhuang, J., Sun, X., and Wang, Y.: Spatiotemporal pattern of soil respiration of terrestrial ecosystems in China: The development of a geostatistical model and its simulation, Environ. Sci. Technol., 44, 6074–6080, https://doi.org/10.1021/es100979s, 2010.
Yu, X., Zha, T., Pang, Z., Wu, B., Wang, X., Chen, G., Li, C., Cao, J., Jia, G., Li, X., and Wu, H.: Response of soil respiration to soil temperature and moisture in a 50-year-old Oriental arborvitae plantation in China, PLoS ONE, 6, e28397, https://doi.org/10.1371/journal.pone.0028397, 2011.
Zhan, X. Y., Yu, G. R., Zheng, Z. M., and Wang, Q. F.: Carbon emission and spatial pattern of soil respiration of terrestrial ecosystems in China: Based on geostatistic estimation of flux measurement, Prog. Geogr., 31, 97–108, 2012.
Zheng, J. J., Huang, S. Y., Jia, X., Tian, Y., Mu, Y., Liu, P., and Zha, T. S.: Spatial variation and controlling factors of temperature sensitivity of soil respiration in forest ecosystems across China, Chin. J. Plant Ecol., 44, 687–698, https://doi.org/10.17521/cjpe.2019.0300, 2020.
Zheng, Z. M., Yu, G. R., Fu, Y. L., Wang, Y. S., Sun, X. M., and Wang, Y. H.: Temperature sensitivity of soil respiration is affected by prevailing climatic conditions and soil organic carbon content: A trans-china based case study, Soil Biol. Biochem., 41, 1531–1540, https://doi.org/10.1016/j.soilbio.2009.04.013, 2009.
Zheng, Z. M., Yu, G. R., Sun, X. M., Li, S. G., Wang, Y. S., Wang, Y. H., Fu, Y. L., and Wang, Q. F.: Spatio-temporal variability of soil respiration of forest ecosystems in China: Influencing factors and evaluation model, Environ. Manage., 46, 633–642, https://doi.org/10.1007/s00267-010-9509-z, 2010.
Zhou, T., Shi, P. J., Hui, D. F., and Luo, Y. Q.: Spatial patterns in temperature sensitivity of soil respiration in China: Estimation with inverse modeling, Sci. China Ser. C-Life Sci., 52, 982–989, https://doi.org/10.1007/s11427-009-0125-1, 2009.