the Creative Commons Attribution 4.0 License.
the Creative Commons Attribution 4.0 License.
 | 06 May 2022
Moment tensor catalogue of earthquakes in West Bohemia from 2008 to 2018
Petra Adamová
Jana Doubravová
Josef Horálek
We present a unique catalogue of full moment tensors (MTs) of earthquakes with ML between 0.5 and 4.4 that occurred in West Bohemia, Czech Republic, in the period from 2008 to 2018 (Vavryčuk et al., 2022a, b). The MTs were calculated from vertical components of P-wave amplitudes. The MT inversion was based on principal component analysis applied to optimally filtered velocity records of local seismic stations deployed in the West Bohemia area. The minimum number of inverted stations is 15, and the rms between theoretical and observed amplitudes is lower than 0.5. The catalogue is exceptional in several aspects: (1) it represents an extraordinary, extensive dataset of more than 5100 MTs; (2) it covers a long period of seismicity in the studied area, during which several prominent earthquake swarms took place; (3) the locations and retrieved MTs of earthquakes are of a high accuracy. Additionally, we provide three-component records at the West Bohemia (WEBNET) seismic stations, the velocity model in the region, and the technical specification of the stations. The dataset is ideal for being utilized by a large community of researchers for various seismological purposes, e.g. for studies of (1) the migration of foci and the spatiotemporal evolution of seismicity, (2) redistribution of stress during periods of intense seismicity, (3) the interaction of faults, (4) the Coulomb stress along the faults and local stress anomalies connected to fault irregularities, (5) diffusivity of fluids along the activated faults, or (6) the time-dependent seismic risk due to the migration of seismicity in the region. In addition, the dataset is optimum for developing and testing new inversions for MTs and for tectonic stress. Since most of the earthquakes are non-shear, the dataset can contribute to studies of non-double-couple components of MTs and their relation to shear–tensile fracturing and/or seismic anisotropy in the focal zone.
- Article
(8781 KB) - Full-text XML
- BibTeX
- EndNote


The seismic moment tensor (MT) describes equivalent body forces acting at an earthquake source (Knopoff and Randall, 1970). It is a basic quantity evaluated for earthquakes that informs us about their moment magnitude, focal mechanism, and type of faulting. It can be separated into double-couple (DC), isotropic (ISO), and compensated linear vector dipole (CLVD) components (Jost and Hermann, 1998; Vavryčuk, 2015a). The DC component is produced by shear faulting in isotropic media; the ISO and CLVD components reflect complexities in the earthquake source, e.g. irregularly shaped faults, seismic anisotropy, shear–tensile faulting induced by fluid injection in volcanic or geothermal areas, or the presence of a material interface in the focal zone (Frohlich, 1994; Julian et al., 1998; Miller et al., 1998; Růžek et al., 2003; Šílený and Milev, 2008; Vavryčuk, 2005, 2006, 2011a, 2013, 2015a; Vavryčuk and Hrubcová, 2017).
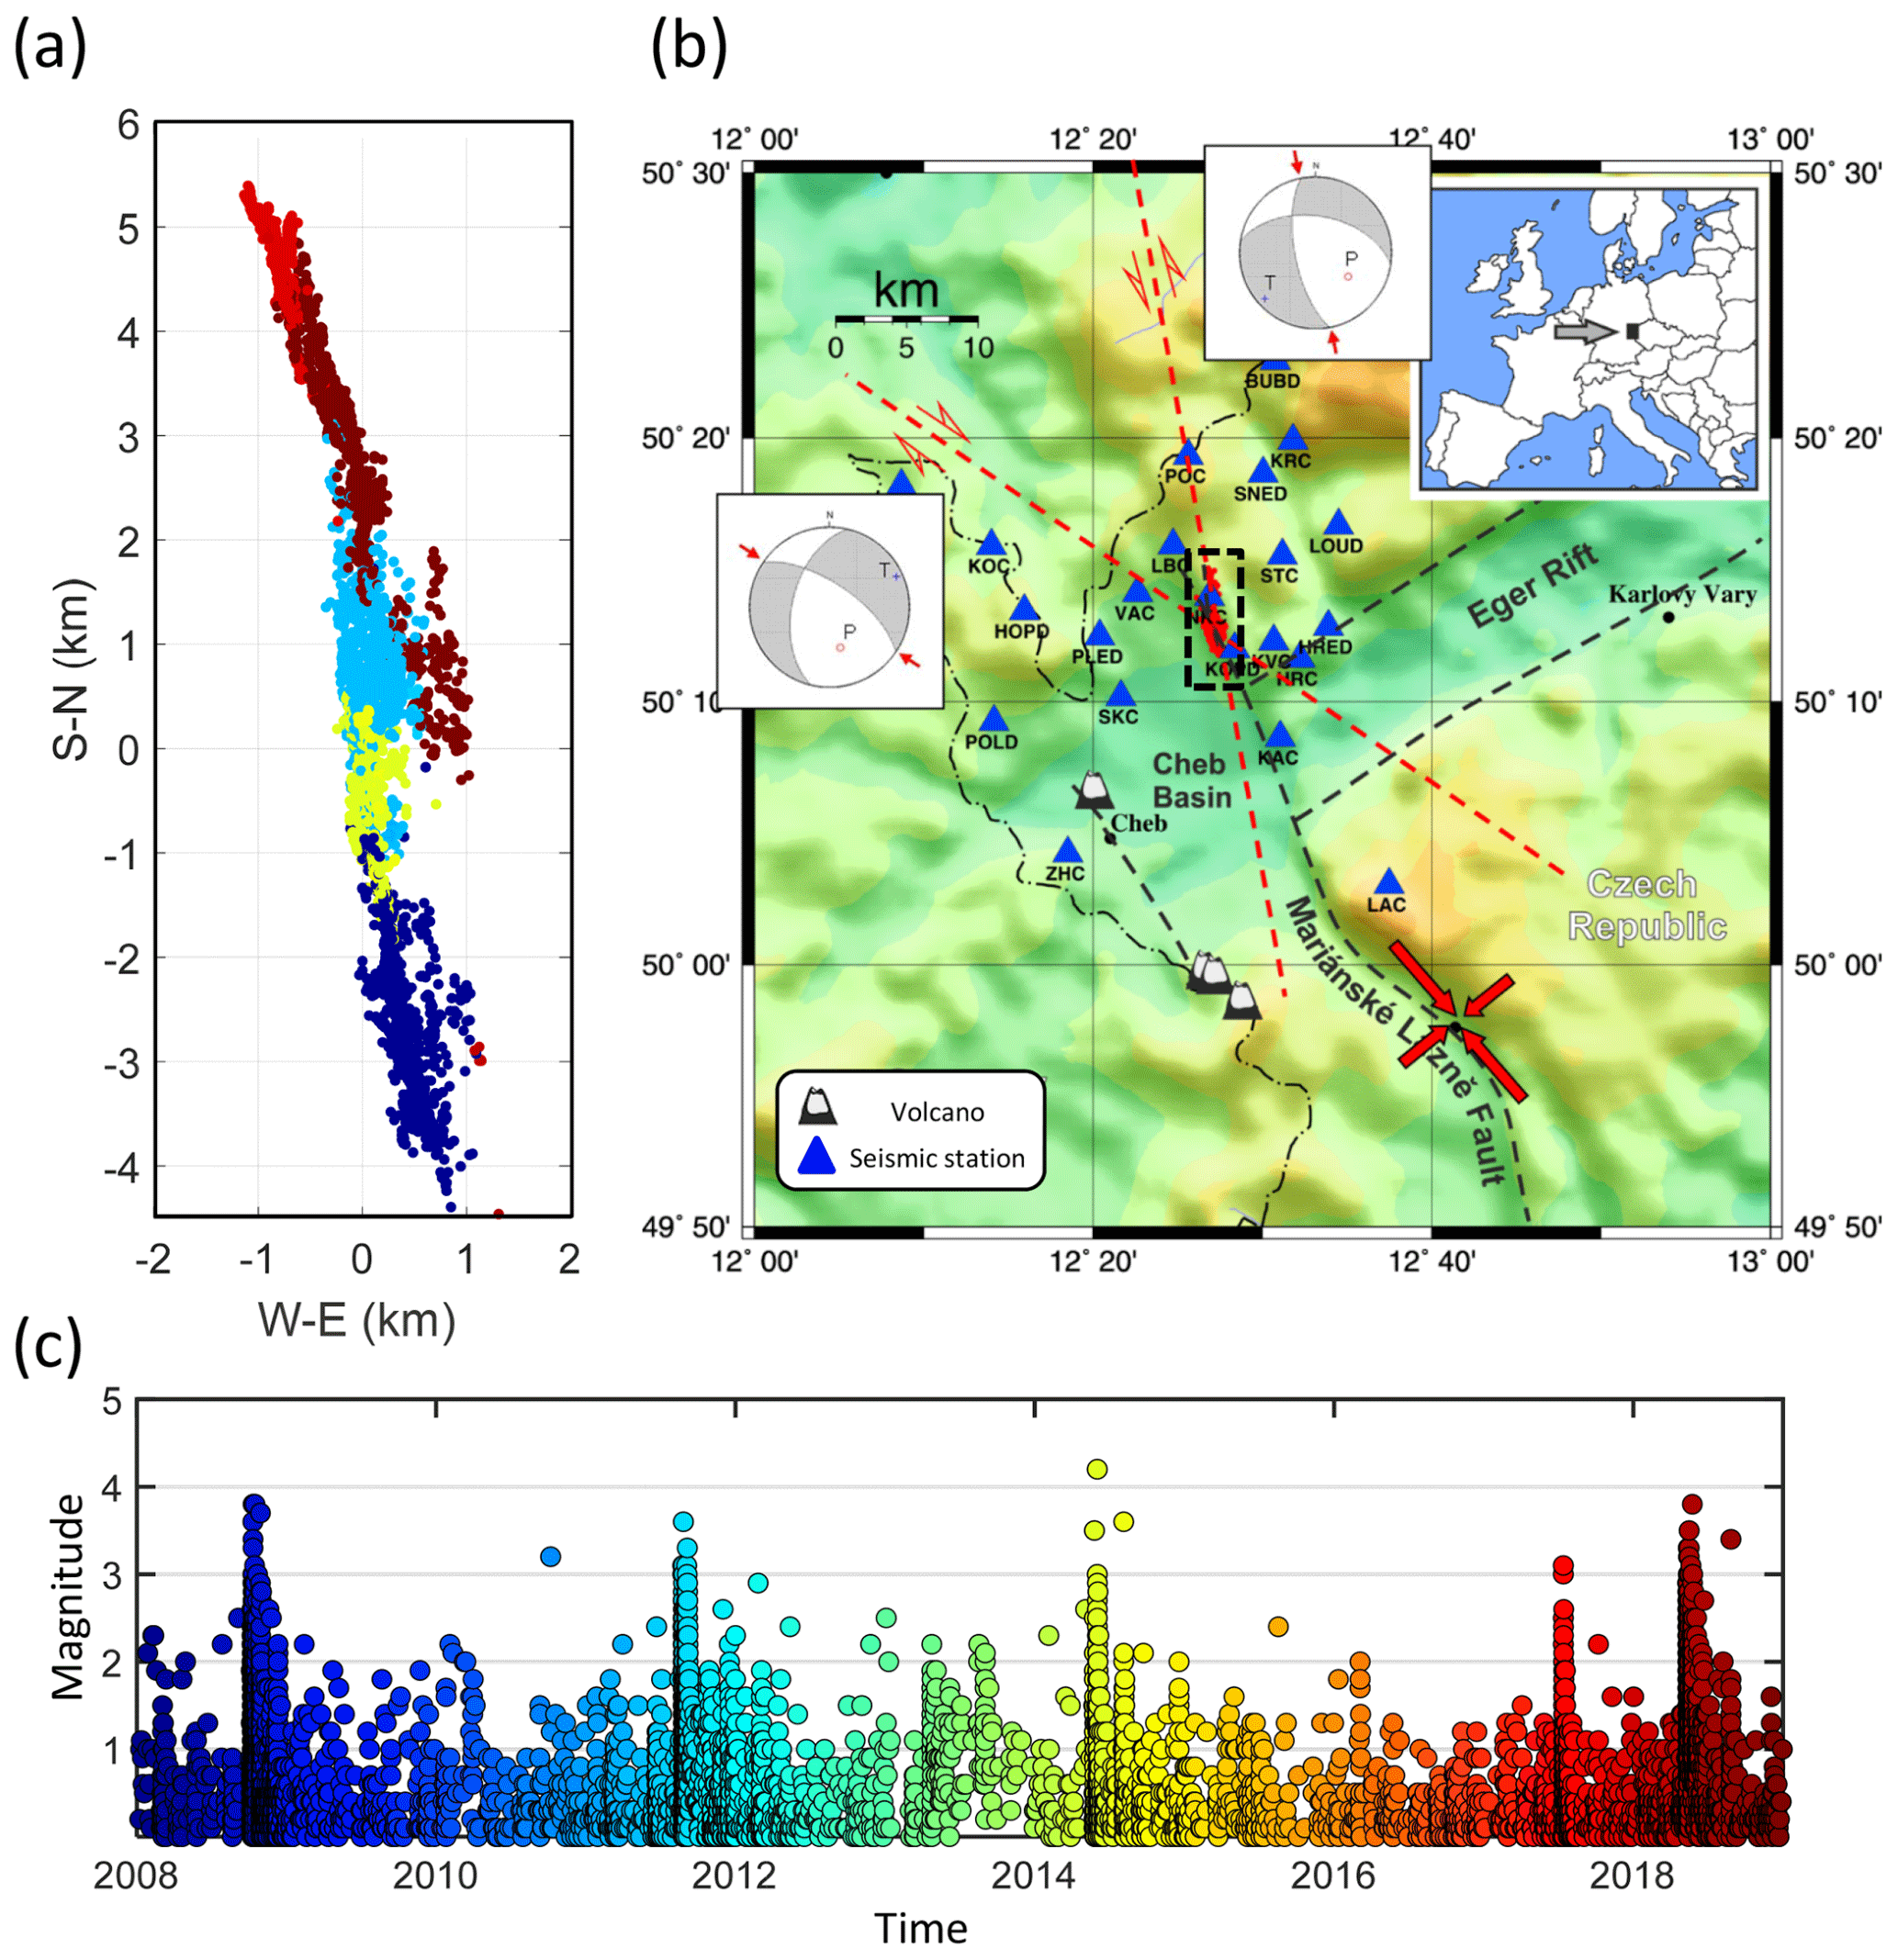
Figure 1(a) Map view of earthquake foci in the period from 2008 to 2018, (b) topographic map with tectonic faults (dashed black lines) and positions of stations (blue triangles), and (c) magnitude–time plot with colour-coded time. The red dots in (b) show the earthquake foci. The dashed rectangle around the foci in (b) defines the area shown in panel (a). The red-filled arrows mark the orientation of the maximum and minimum principal stress axes. The dash-dotted line marks the boundary between the Czech Republic and Germany. The position of West Bohemia in Europe is indicated in the inset. The focal mechanisms typical of the area are also indicated.
Since earthquakes do not occur separately but in sequences, it is necessary to compile high-quality MT catalogues for understanding origins of seismicity, tectonic stress regimes, and seismic energy release of any region under study. In this way, we can identify prominent periods of seismicity, trace faults, and fault segments; monitor migration of earthquake foci; analyse interactions of nearby or intersecting faults; and map the fluid flow along the fault systems in the focal zone (Vavryčuk et al., 2021). Hence, MT catalogues are fundamental sources of information for all detailed studies of seismicity on the local, regional, or global scale.
In this paper, we present recordings, locations, and high-quality moment tensors of 5134 earthquakes that occurred in the West Bohemia geothermal region, Czech Republic, in the period from 2008 to 2018. The earthquakes were monitored by the West Bohemia local seismic network WEBNET (Horálek et al., 2000; Fischer et al., 2010; Horálek and Doubravová, 2015). Their locations were calculated by the double-difference location method, and the moment tensors were determined using the moment tensor inversion of P waves based on principal component analysis. Because of its extent and quality, the presented dataset is unique and represents an extraordinary dataset, which might find exciting applications in numerous future studies.
Table 1Location and instrumentation of the WEBNET seismic stations.
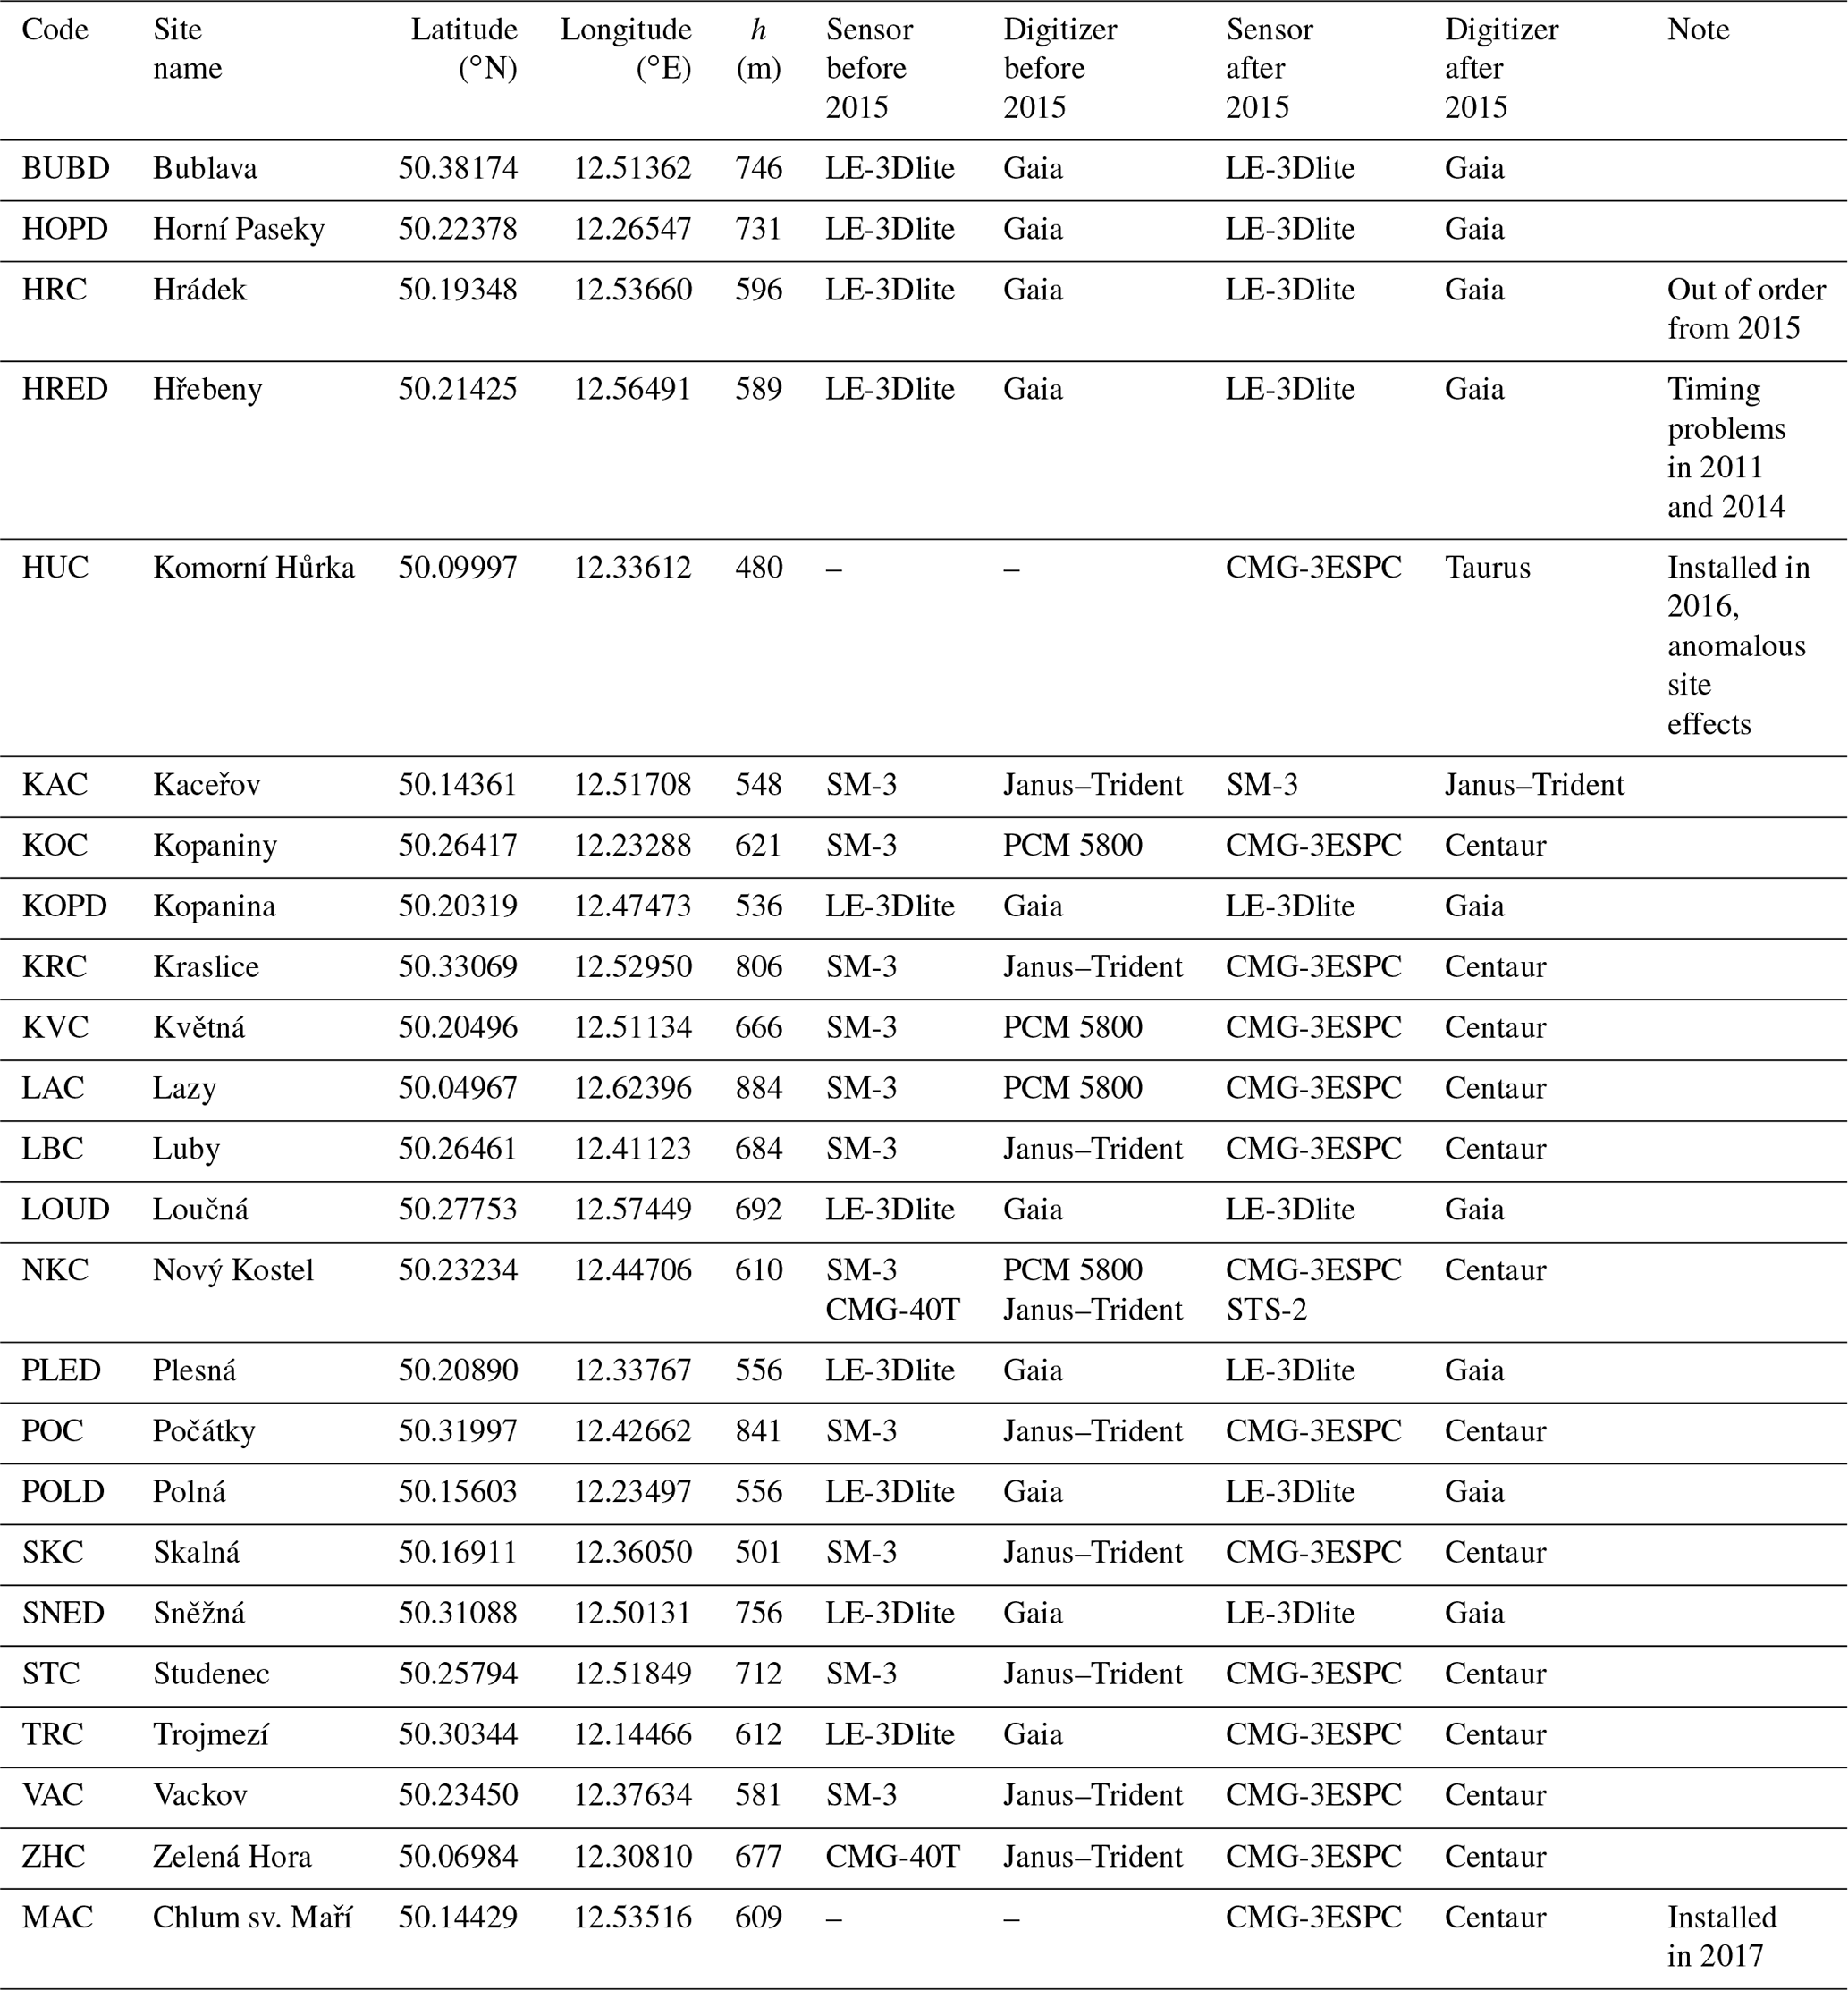
Quantity h means the altitude of the stations. Recording systems are as follows: Taurus – Nanometrics digitizer; Janus–Trident – Nanometrics communications controller–digitizer, Centaur – Nanometrics digitizer, Gaia – Vistec digitizer, and PCM 5800 – Lennartz digitizing system. Seismometers are as follows: SM-3 – short-period sensor, LE-3Dlite – Lennartz short-period sensor, CMG-40T – Güralp broadband sensor, and CMG-3ESPC – Güralp broadband sensor. Station HUC has anomalous site effects, and it was not used in the MT inversion. The time in station HRED was erroneously shifted by 0.45 s in 2011 and by 2 s in 2014.
Table 2The layered velocity model.
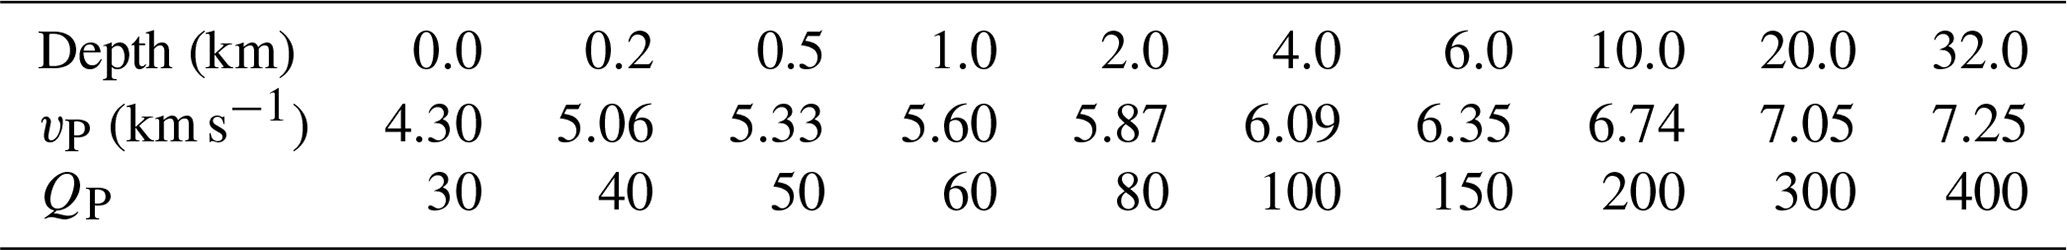
Ratio is 1.70, and ratio is 2.
The region of West Bohemia is located in the western part of the Bohemian Massif, where three major tectonic units are merged: the Saxothuringian, the Teplá–Barrandian, and the Moldanubian. The region is geodynamically active exposed to the Tertiary and Quaternary volcanism associated with CO2 emanations, dry and wet mofettes, and numerous mineral springs (Kämpf et al., 2013; Hrubcová et al., 2017; Bräuer et al., 2018). Two major fault systems are identified in the area: the Mariánské Lázně fault striking in the NW–SE direction and the Ore Mountains fault striking in the WSW–ENE direction (Fig. 1b). The recently most active fault is, however, a left-lateral strike-slip fault in the N–S direction, situated at the eastern boundary of the Cheb Basin filled by up to 300 m thick Tertiary and Quaternary sediments. The seismically active faults were identified at depth by clustering of hypocentres and by focal mechanisms (Vavryčuk et al., 2013), but they also have some geological evidence on the surface (Bankwitz et al., 2003).
The seismic energy in the West Bohemia region is typically released in the form of earthquake swarms. The occurrence of the earthquake swarms has been well documented in the region since the beginning of the 19th century. A significant increase in the earthquake activity was observed at the turn of the 19th and 20th century, when several larger swarms were observed. There were earthquake swarms in 1897, 1900, 1903, and 1908. During the last 40 years, the seismicity has occurred in the area of 40×50 km2, but the most intense seismicity is focused in the Nový Kostel zone with a size of 3×12 km2 (Fischer et al., 2014; Čermáková and Horálek, 2015). Foci of earthquakes in this zone are clustered along a fault striking in a roughly N–S direction (Fig. 1a) with depths ranging from 6 to 11 km. The duration of the earthquake swarms varies; it lasts from several days for micro-swarms and up to 2–3 months for the most prominent swarms. The swarms may consist of several thousands of earthquakes. The local magnitudes ML of the earthquakes rarely exceed a value of 4.0. The strongest instrumentally recorded swarm activity occurred in 1985–1986 with two main shocks having magnitudes of ML 4.6 and 4.2.
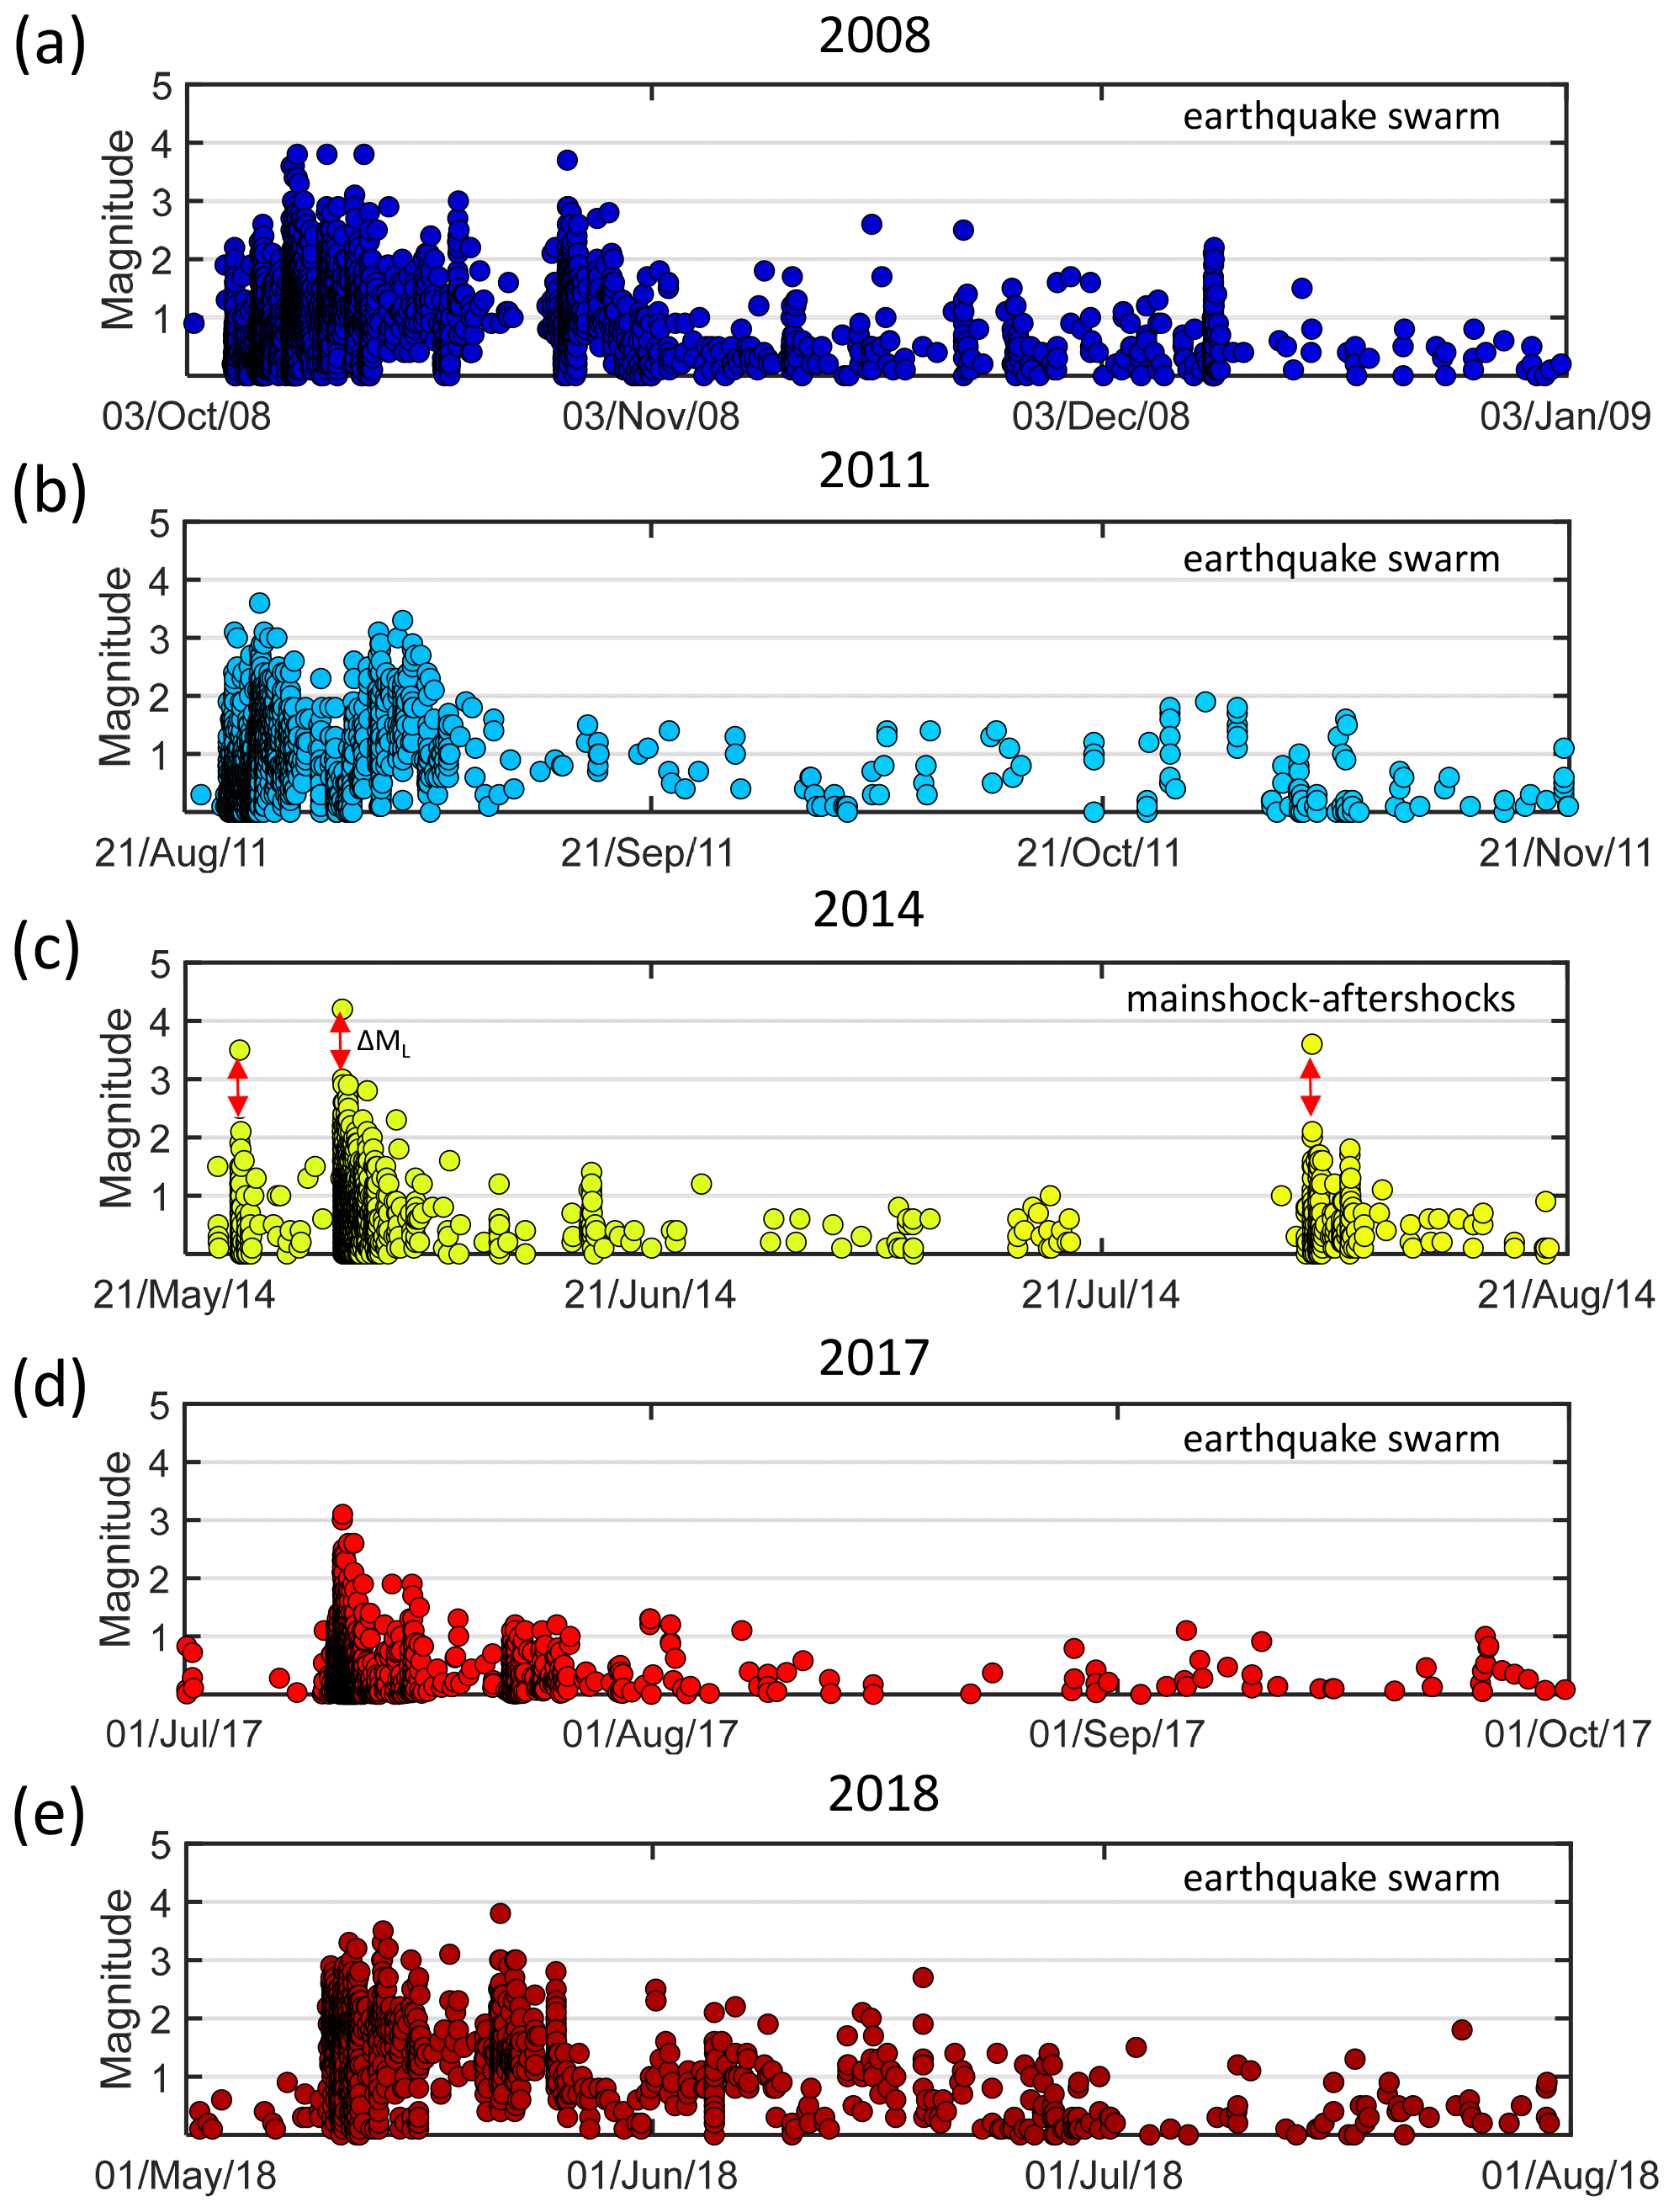
Figure 2Magnitude–time plots of the major seismic sequences in the period from 2008 to 2018. According to Bath's law (Bath, 1965), the 2014 activity resembles rather a mainshock–aftershock sequence, because the difference in magnitudes ΔML between two strongest events in individual seismicity phases exceeds 1. In other seismic sequences, the magnitude gaps between the two strongest events are not so prominent.
The seismic activity in the region is monitored by the local seismic network WEBNET (Fig. 1b, Table 1). The network has been operating since 1994, and the number of stations has gradually increased (Horálek et al., 2000; Fischer et al., 2010). After its major upgrade in 2008, the WEBNET network has consisted of 23 seismic stations within the epicentral distance of 25 km. The stations cover the area rather uniformly with a minor azimuthal gap of 45∘ to the south. The three-component ground-velocity records are sampled at 250 Hz, and the frequency response is flat at least between 1 and 80 Hz. Until the end of July 2014, all data were processed based on triggered records. Since the beginning of August 2014, the recordings have been processed by using automatic pre-processing of continuous recordings. Another major upgrade of the network was realized in 2015. Originally, the stations were equipped by the LE-3Dlite and SM-3 seismometers; some of them were recently upgraded using the Güralp CMG-3ESPC seismometers. The station with the nearest epicentral distance (station NKC) is additionally equipped with the broadband STS-2 seismometer. For a technical specification of the WEBNET seismic stations, see Table 1. Full information on stations is provided in files Webnet.xml (formatted according to the FDSN StationXML standard, http://docs.fdsn.org/projects/stationxml/en/latest/, last access: 4 May 2022) and Webnet.dataless (formatted according to the dataless SEED format, https://ds.iris.edu/ds/nodes/dmc/data/formats/dataless-seed/, last access: 4 May 2022) that are included in the dataset.
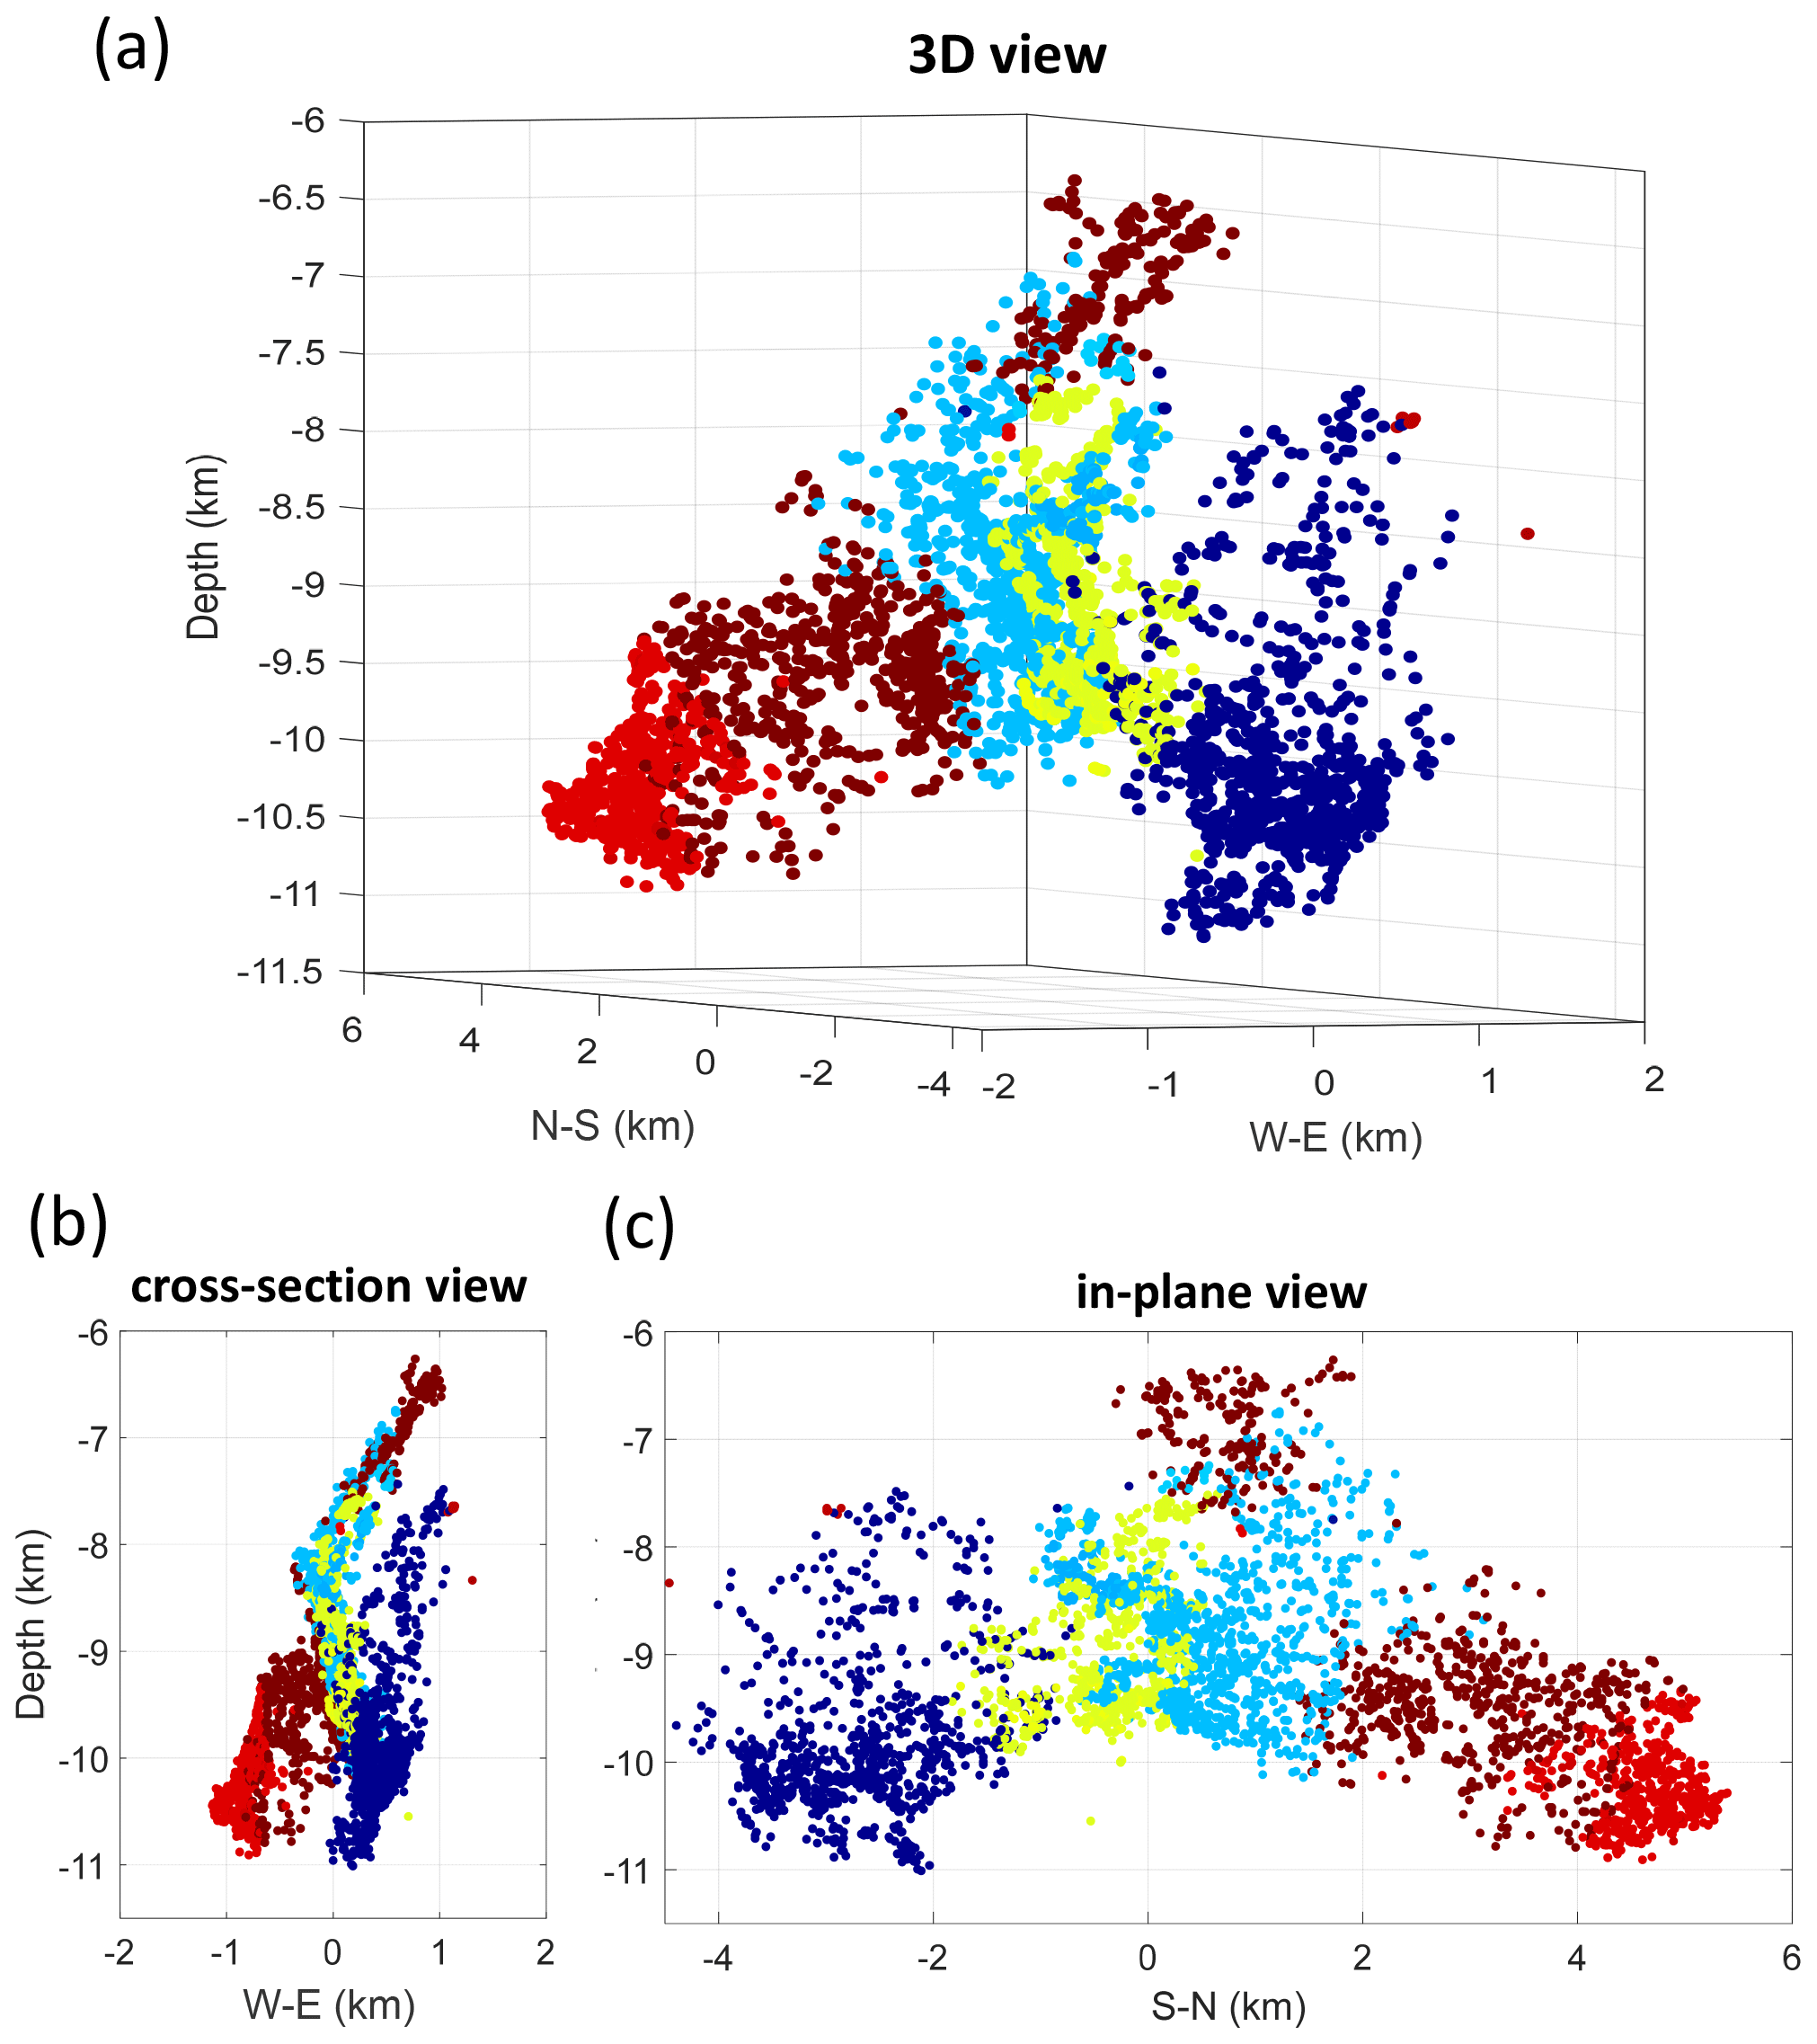
Figure 3The earthquakes foci with local magnitude ML≥0.5 in (a) 3D view, (b) cross-section vertical view, and (c) in-plane vertical view. The foci are colour-coded according to time: dark blue – 2008, light blue – 2011, yellow – 2014, red – 2017, and brown – 2008.
The West Bohemia region is characterized by continuous background seismicity scattered over the whole region interrupted by earthquake swarm sequences located mostly in the Nový Kostel focal zone. The most intense periods of seismicity were in 2008, 2011, 2014, 2017, and 2018 (Figs. 1c and 2). All these sequences are typical earthquake swarms except for the seismic activity in 2014, which was exceptional. This sequence resembled a mainshock–aftershock sequence rather than an earthquake swarm (Hainzl et al., 2016; Jakoubková et al., 2018; Vavryčuk and Adamová, 2018), being formed by three pronounced activity periods. The strongest events in these periods reached magnitudes significantly larger than those of the other events (Fig. 2c). The seismic sequences differ in the earthquake productivity, in the duration, and in the number of periods of the intense seismicity (Fig. 2). The strongest event in the period from 2008 to 2018 reached a magnitude ML of 4.2, and it occurred in 2014.

Figure 4Example of the MT inversion of the earthquake on 24 May 2014 at 16:14:30 UTC with ML 2.1. (a) Whole velocity records; (b) window with aligned P waves; (c) the common wavelet (red line) together with the P-wave traces at individual stations (blue lines); (d) the common wavelet represented by the first principal component (red line) and noise in waveforms represented by the second principal component (black line). The polarities of the P-wave in panel (c) are switched to be consistent with the polarity of the common wavelet. The inset in plot (a) shows the focal mechanism and positions of stations on the focal sphere (red circles mark negative polarities, and blue plus signs mark the positive polarities).
The local magnitude of earthquakes is computed from the velocity records according to the formula of Horálek et al. (2000). The locations are computed in two steps. First, initial locations were calculated by the NonLinLoc code (Lomax et al., 2009) in a layered velocity model (see Table 2) developed by Málek et al. (2005). For the locations, manual picks of the P and S arrivals were used. Second, we applied the double-difference location algorithm developed by Waldhauser and Ellsworth (2000) to differential times calculated from manual picks. The relative precision of hypocentres was less than ±20 m within the cluster (Bouchaala et al., 2013). The absolute location of the cluster was determined with an accuracy of about ±100 m in the horizontal plane and ±350 m in depth (see Bouchaala et al., 2013).
The locations of foci point to complex geometry of the fault system in the focal area (Fig. 3). The seismicity migrated from south to north in time, and the individual seismic sequences occurred along different subfaults (Fischer et al., 2010; Bouchaala et al., 2013; Vavryčuk et al., 2013; Jakoubková et al., 2018). For example, the 2008, 2011, and 2017 swarms activated three similarly oriented subfaults separated with gaps and offsets between them. The barrier between the fault segments activated in 2008 and 2011 was broken in 2014 (Hainzl et al., 2016; Vavryčuk and Adamová, 2018), and the gap between the fault segments activated in 2011 and 2017 was broken during the 2018 swarm (Bachura et al., 2021; Vavryčuk et al., 2021). The overall direction of the whole fault system is defined by a strike of 170∘ and dip of 75∘. However, some fault segments may deviate from this overall direction significantly. For example, small echelon faults located at the deepest part of the fault system have a strike of 305∘ and dip of 65∘ (see Fig. 3c, dark blue dots at the depth range of 10.5–11 km).
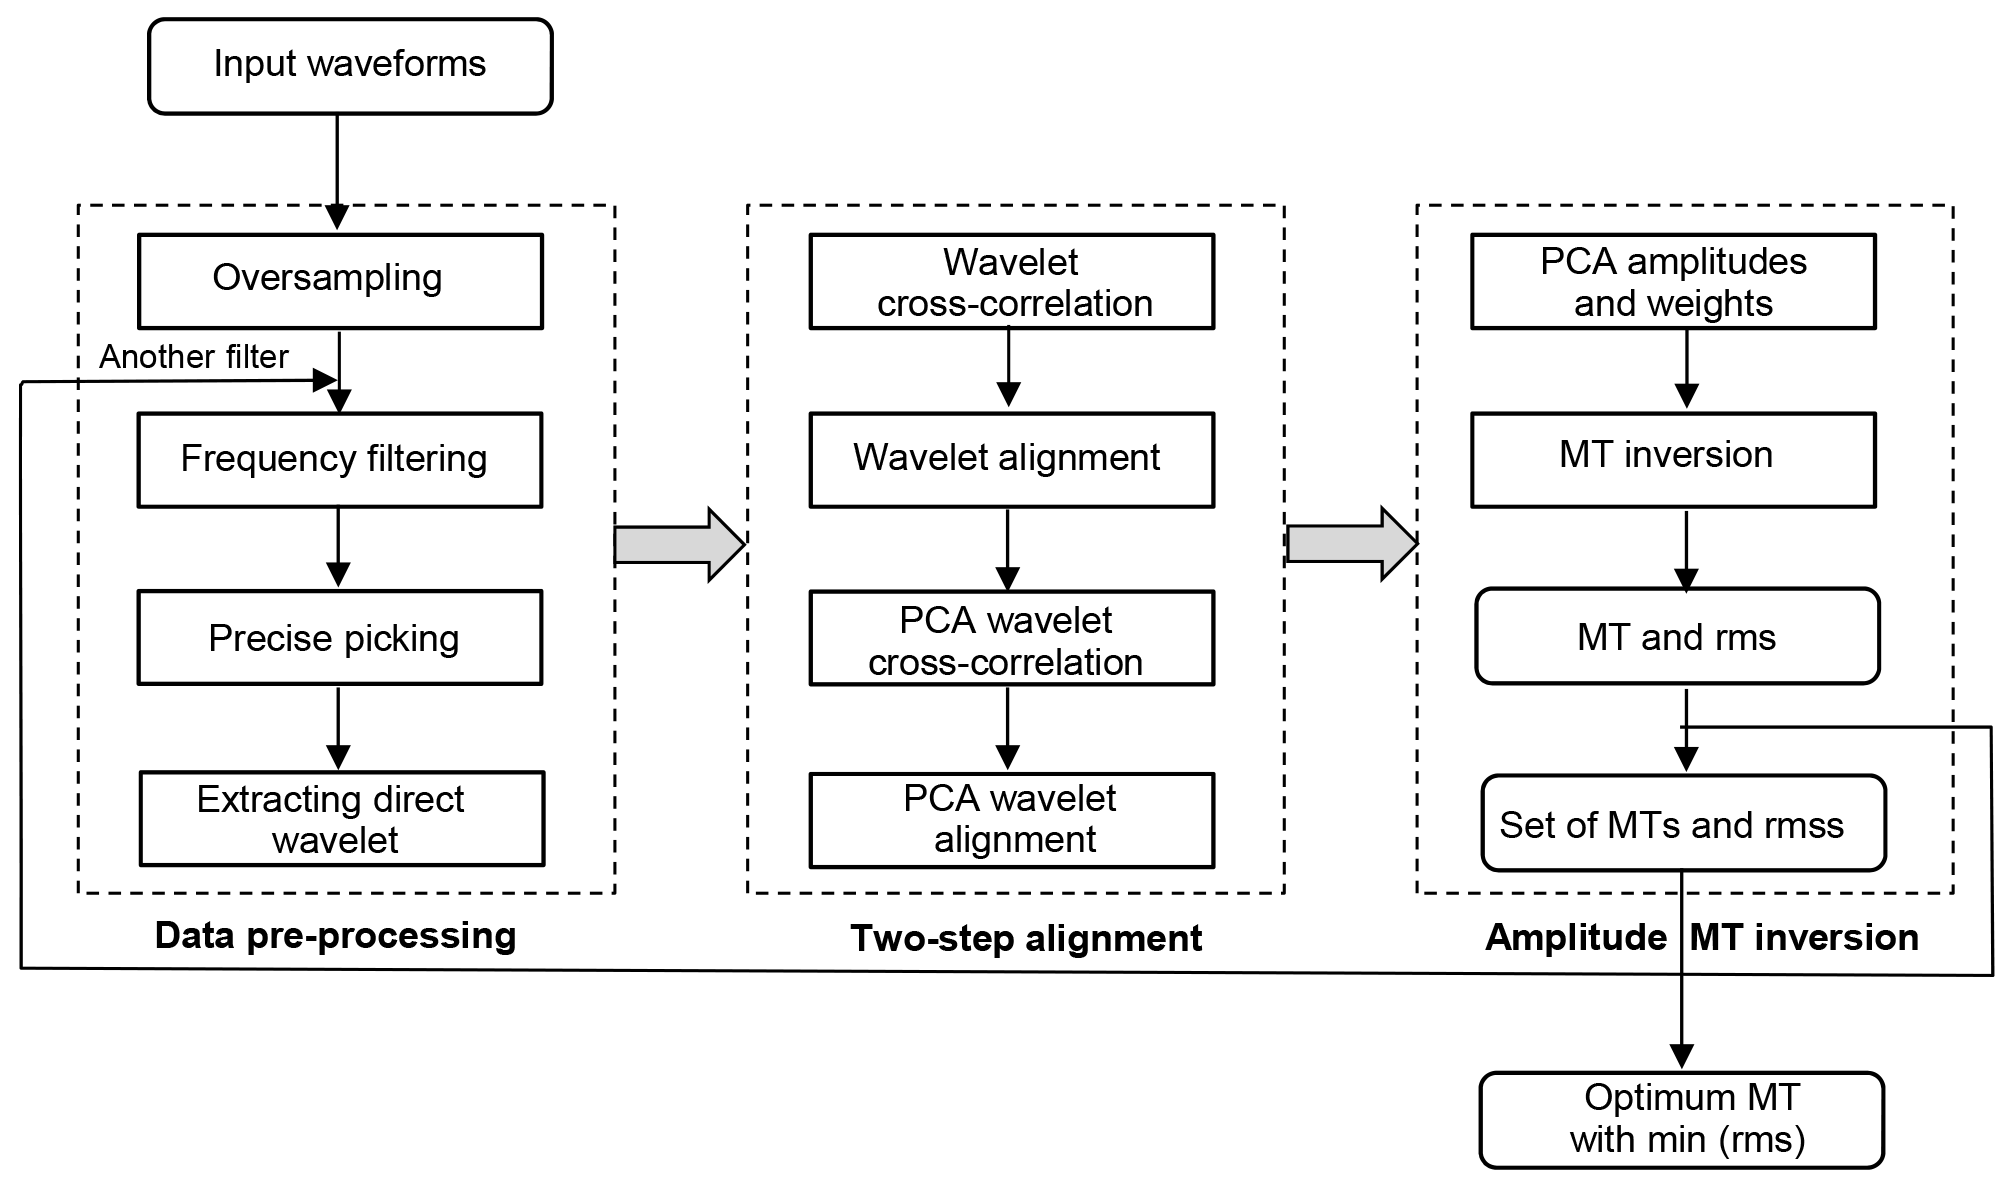
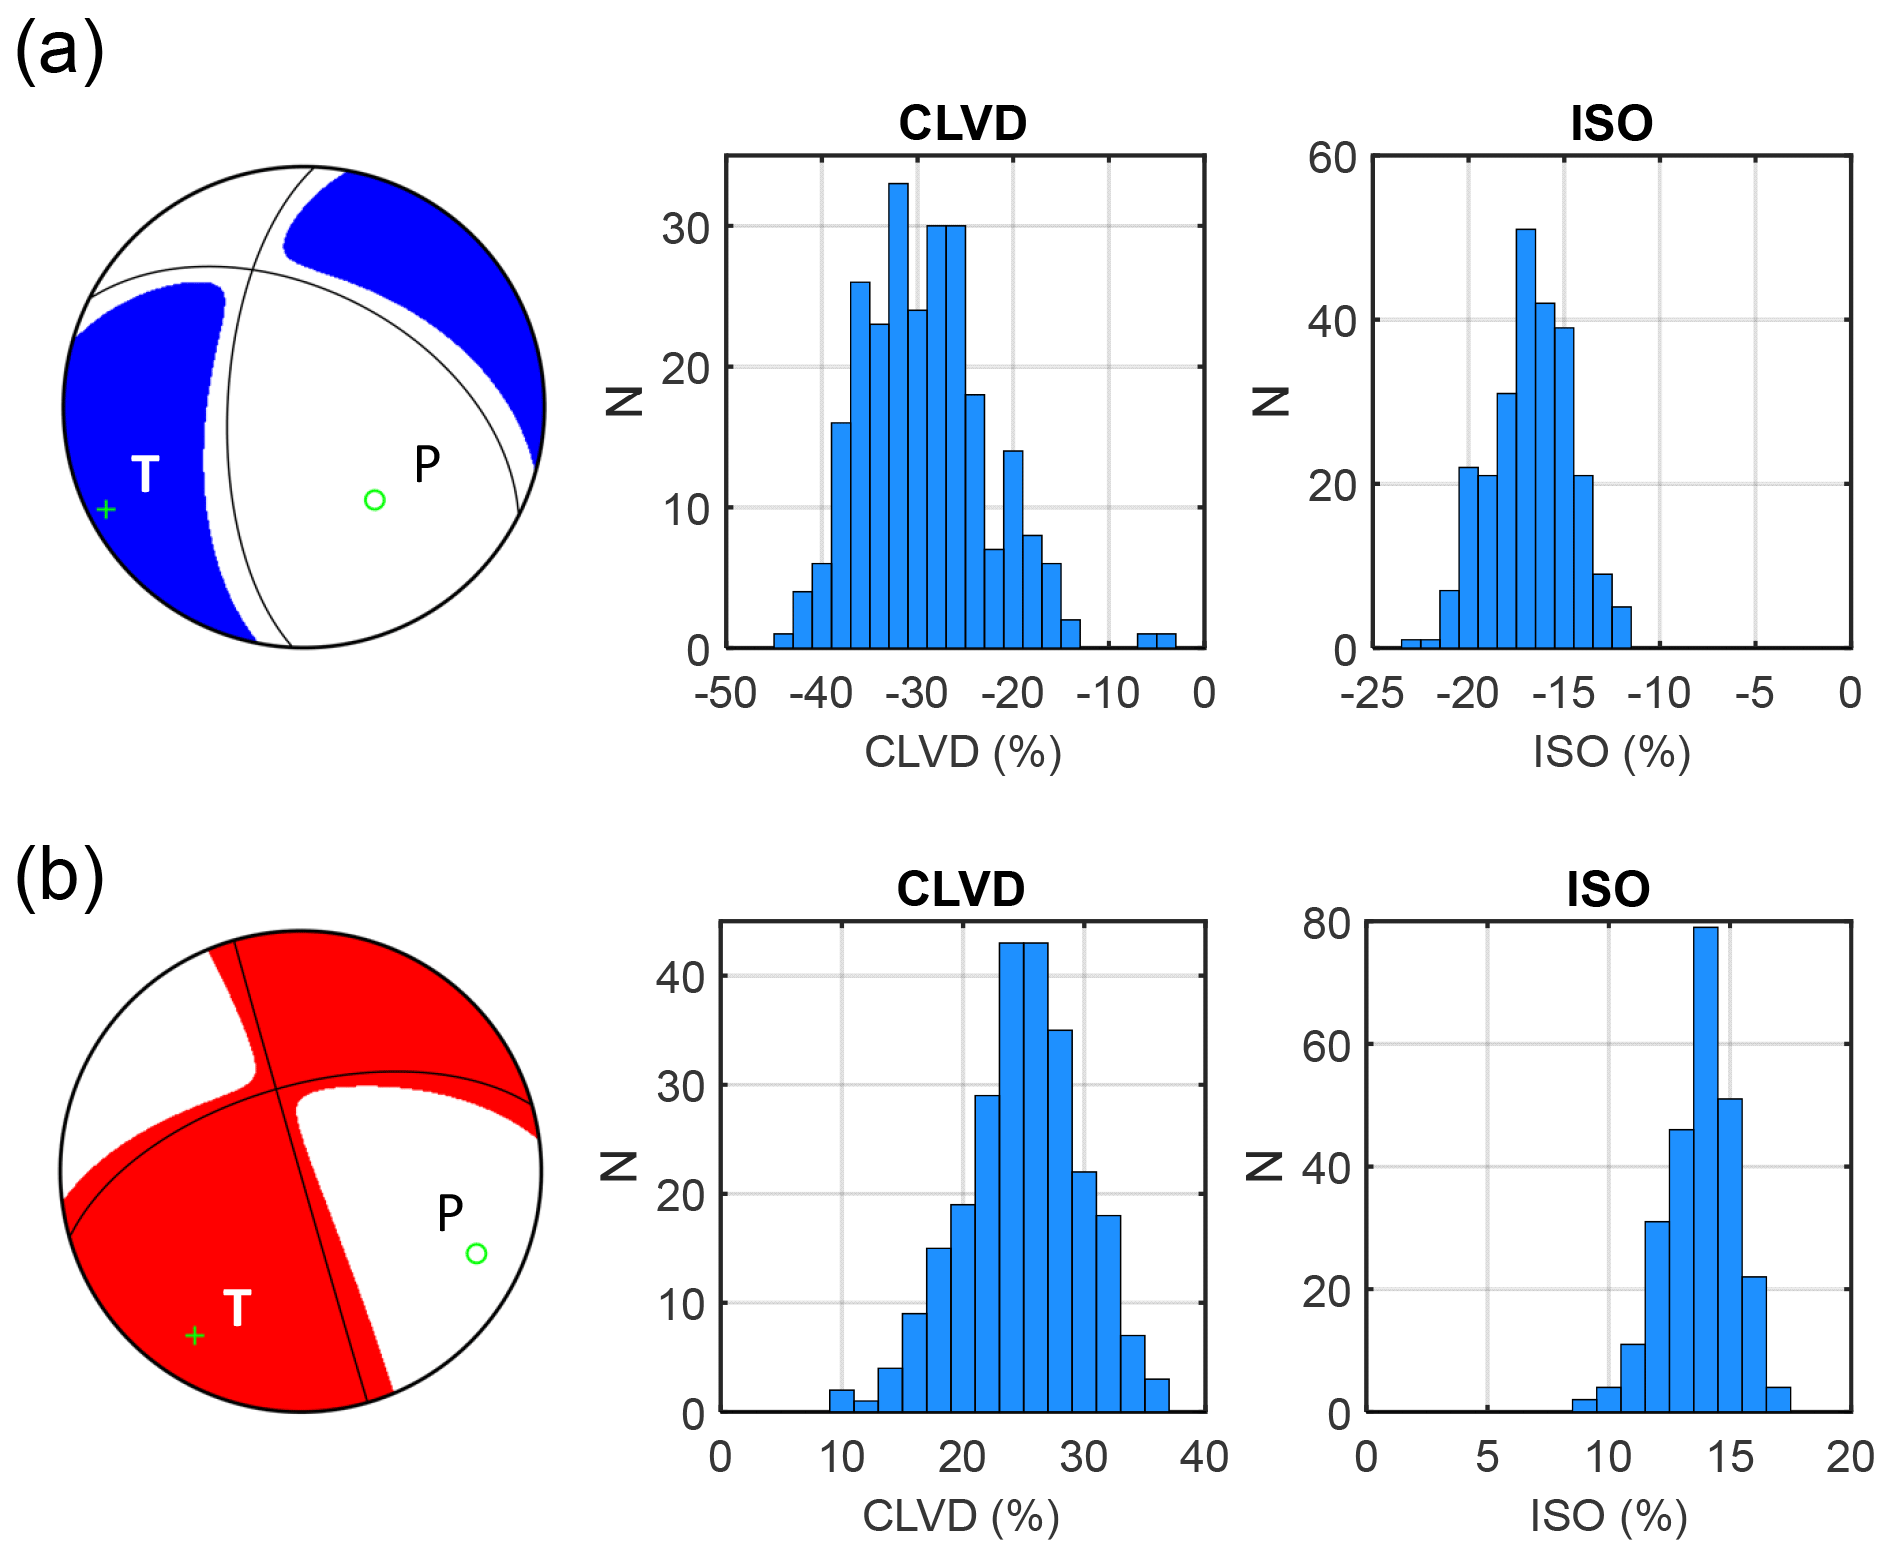
Figure 6Examples of focal mechanisms and histograms of the CLVD and ISO errors. (a) Earthquake on 1 September 2011 at 12:54:05.7 UTC with ML=0.6 and (b) earthquake on 11 May 2018 at 06:26:09.0 UTC with ML=2.3.
6.1 MT inversion of earthquakes
The MT inversion requires accurate locations of earthquakes, an accurate crustal velocity model, dense coverage of stations on the focal sphere, and low seismic noise (Šílený, 2009; Ford et al., 2010; Stierle et al., 2014a). We can invert amplitudes of seismic phases, amplitude ratios, or full waveforms (Dreger and Woods, 2002; Cesca et al., 2006; Sokos and Zahradník, 2008; Cesca and Dahm, 2008; Vavryčuk et al., 2008; Zahradník et al., 2008; Fojtíková et al., 2010; Fojtíková and Zahradník, 2014; Stierle et al., 2014b; Kwiatek et al., 2016; Jechumtálová and Šílený, 2005; Vavryčuk and Kühn, 2012; Kühn and Vavryčuk, 2013; Yu et al., 2018, 2019). The applicability of the individual MT inversions is specific, depending on the magnitude of analysed earthquakes, predominant wave frequencies, and epicentral distances of stations. MTs of moderate or large earthquakes are usually calculated from full waveforms recorded at regional or global seismic networks. By contrast, MTs of small earthquakes and microearthquakes are commonly calculated from amplitudes of P and/or S waves picked up in short-period seismograms recorded at local networks. In this way, the sensitivity of the MT inversion to small-scale complexities of the local geological structure is suppressed and a computationally demanding modelling of high-frequency full waveforms is avoided.
The inversion for MTs of small earthquakes and microearthquakes is challenging for several reasons: (1) the waveforms are complex due to high frequencies and noise, and (2) the datasets are extensive with thousands of events, which require semi-automated or fully automated processing. Here, the MT inversion developed by Vavryčuk et al. (2017) is applied. The inversion is based on principal component analysis (PCA), which transforms correlated waveforms into a set of the so-called principal components (see Fig. 4). The first component has the highest variance and reproduces a so-called “common wavelet”, i.e. a wavelet with the highest similarity with all analysed traces. This common wavelet physically represents a signal radiated by the earthquake's source, which can be distorted during its propagation from the source to the receiver by inhomogeneities in the geological structure, site effects, or seismic noise.
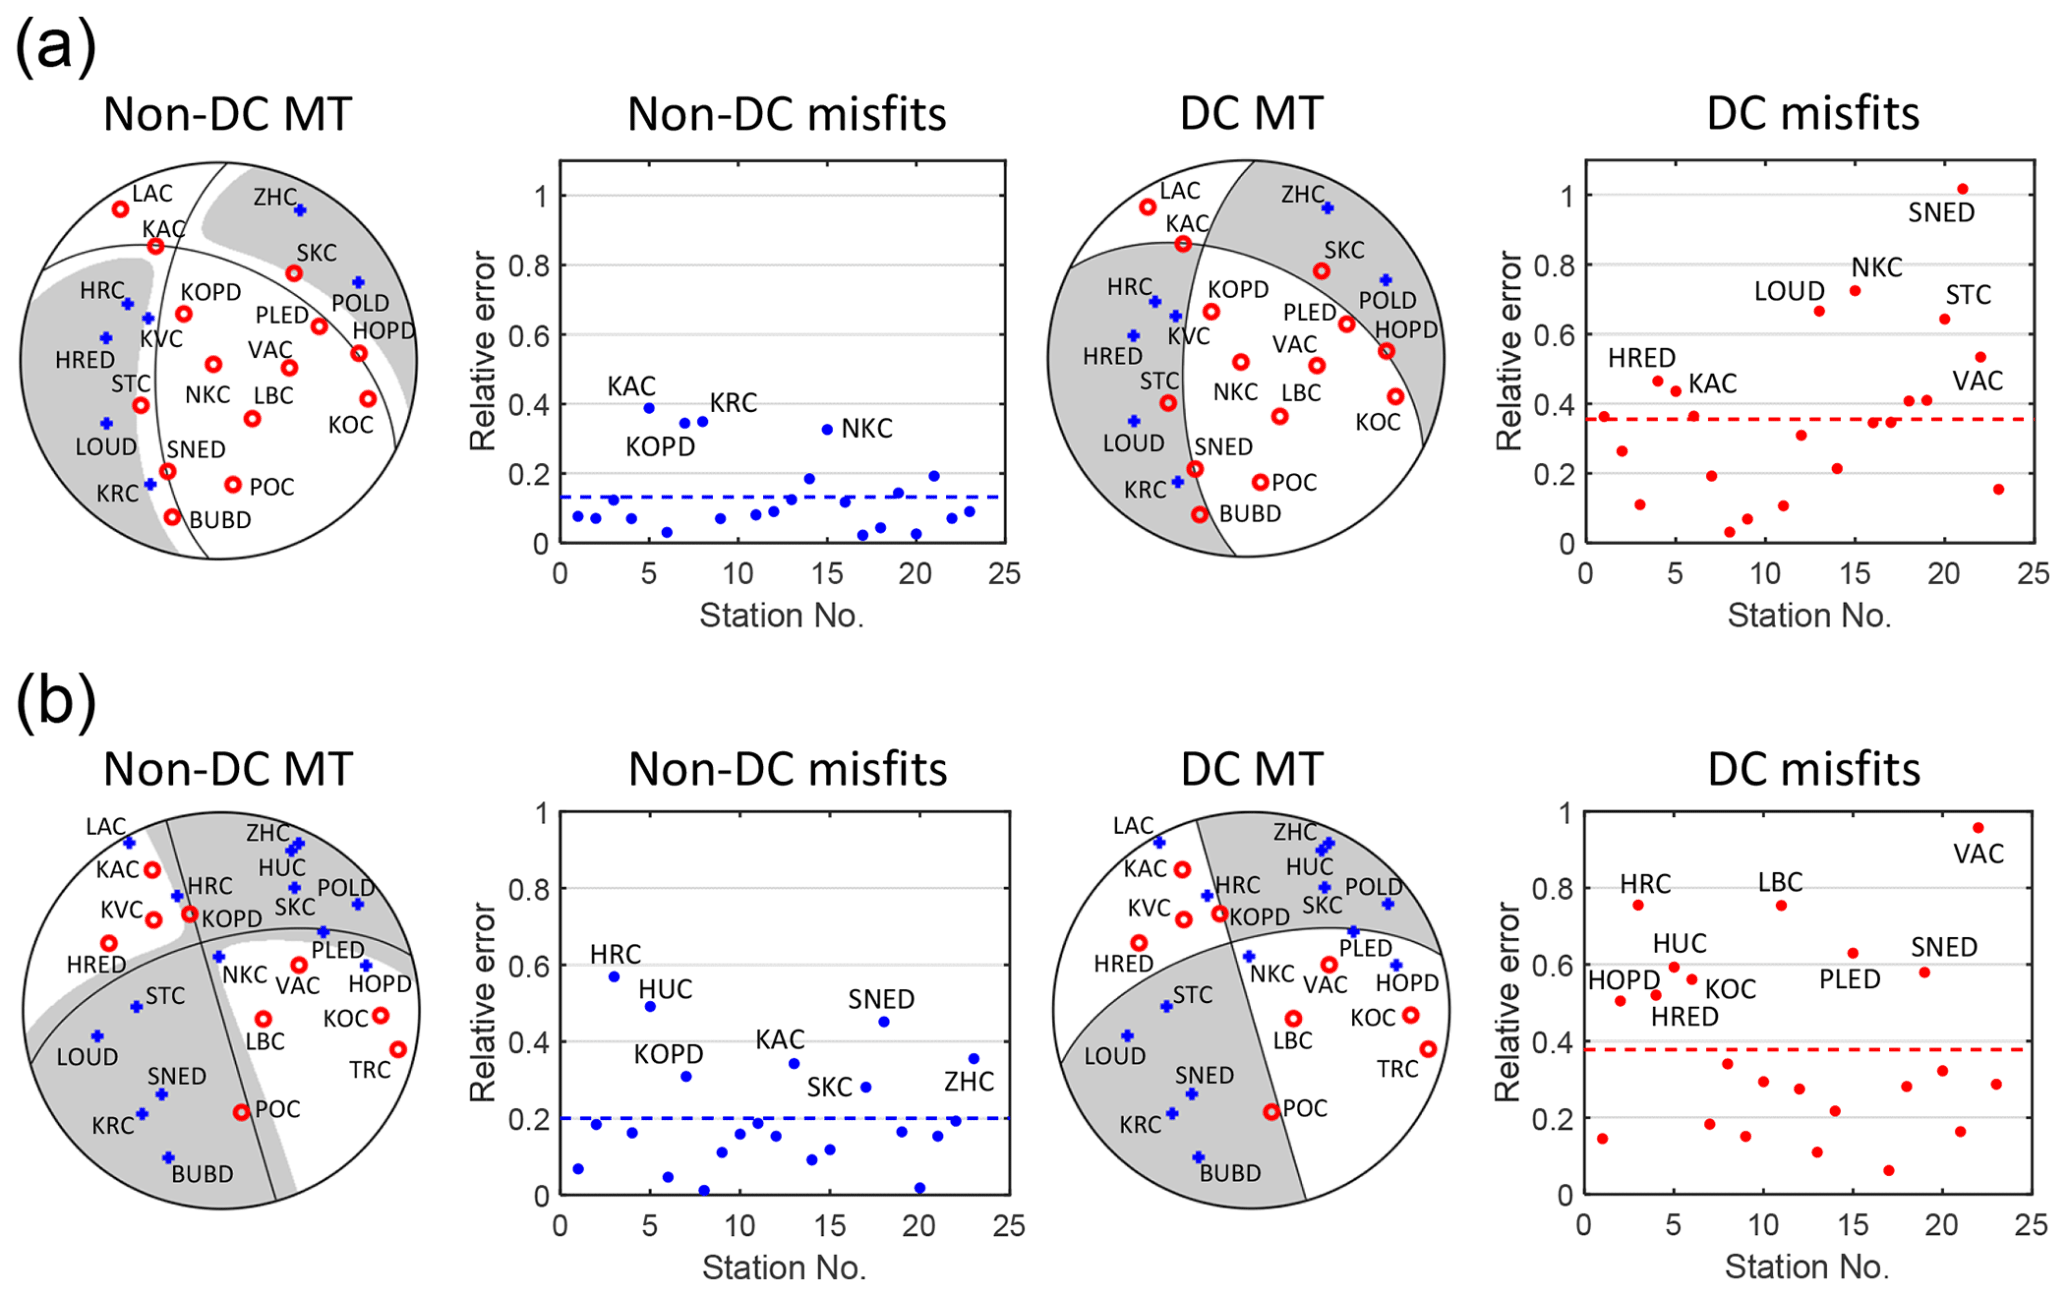
Figure 7Inversion for the full MT solution (“Non-DC MT” and “Non-DC misfits”) and for the DC solution (“DC MT” and “DC misfits”) for earthquakes in Fig. 6. The mean amplitude misfits for the full MT and DC solutions are shown by dashed blue and red lines, respectively.
Table 3Number of reported events for each year. Bold numbers represent the total numbers.
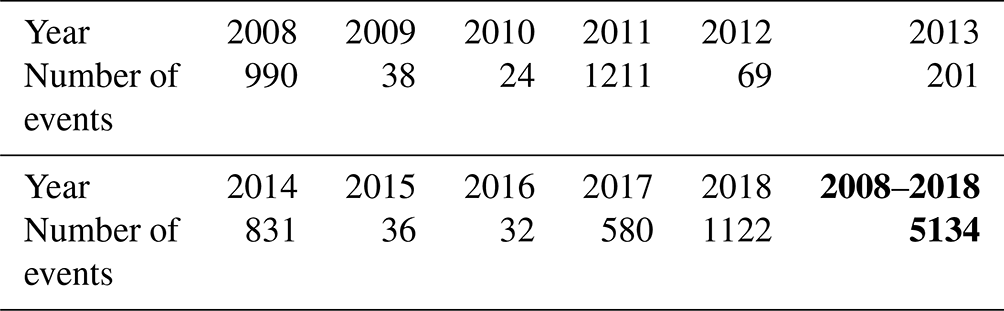
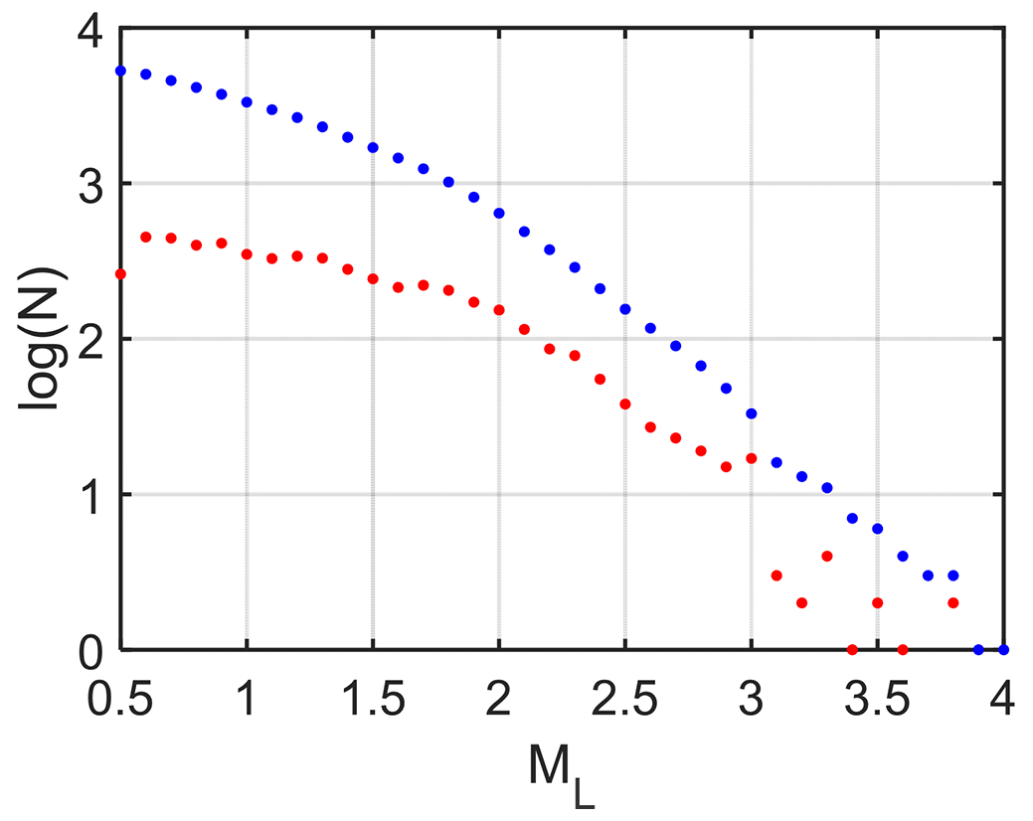
Figure 8Cumulative (blue) and non-cumulative (red) magnitude–frequency distribution of the analysed earthquakes.
Subsequently, the common wavelet is correlated with individual recorded traces and the effective P-wave amplitudes are calculated as the amplification factors applied to the common wavelet in order to optimally reproduce the recorded traces. The obtained amplitudes are inverted for the MTs using generalized linear inversion (Lay and Wallace, 1995). The Green's function amplitudes are computed by the ray method (Červený, 2001; Vavryčuk, 1999, 2008) and incorporate the effects of the Earth's surface. An inhomogeneous medium with a vertical gradient obtained by smoothing the layered model of Málek et al. (2005) was applied for computing the rays by the ray-tracing algorithm. The inversion is robust, fast, and insensitive to noise in data.
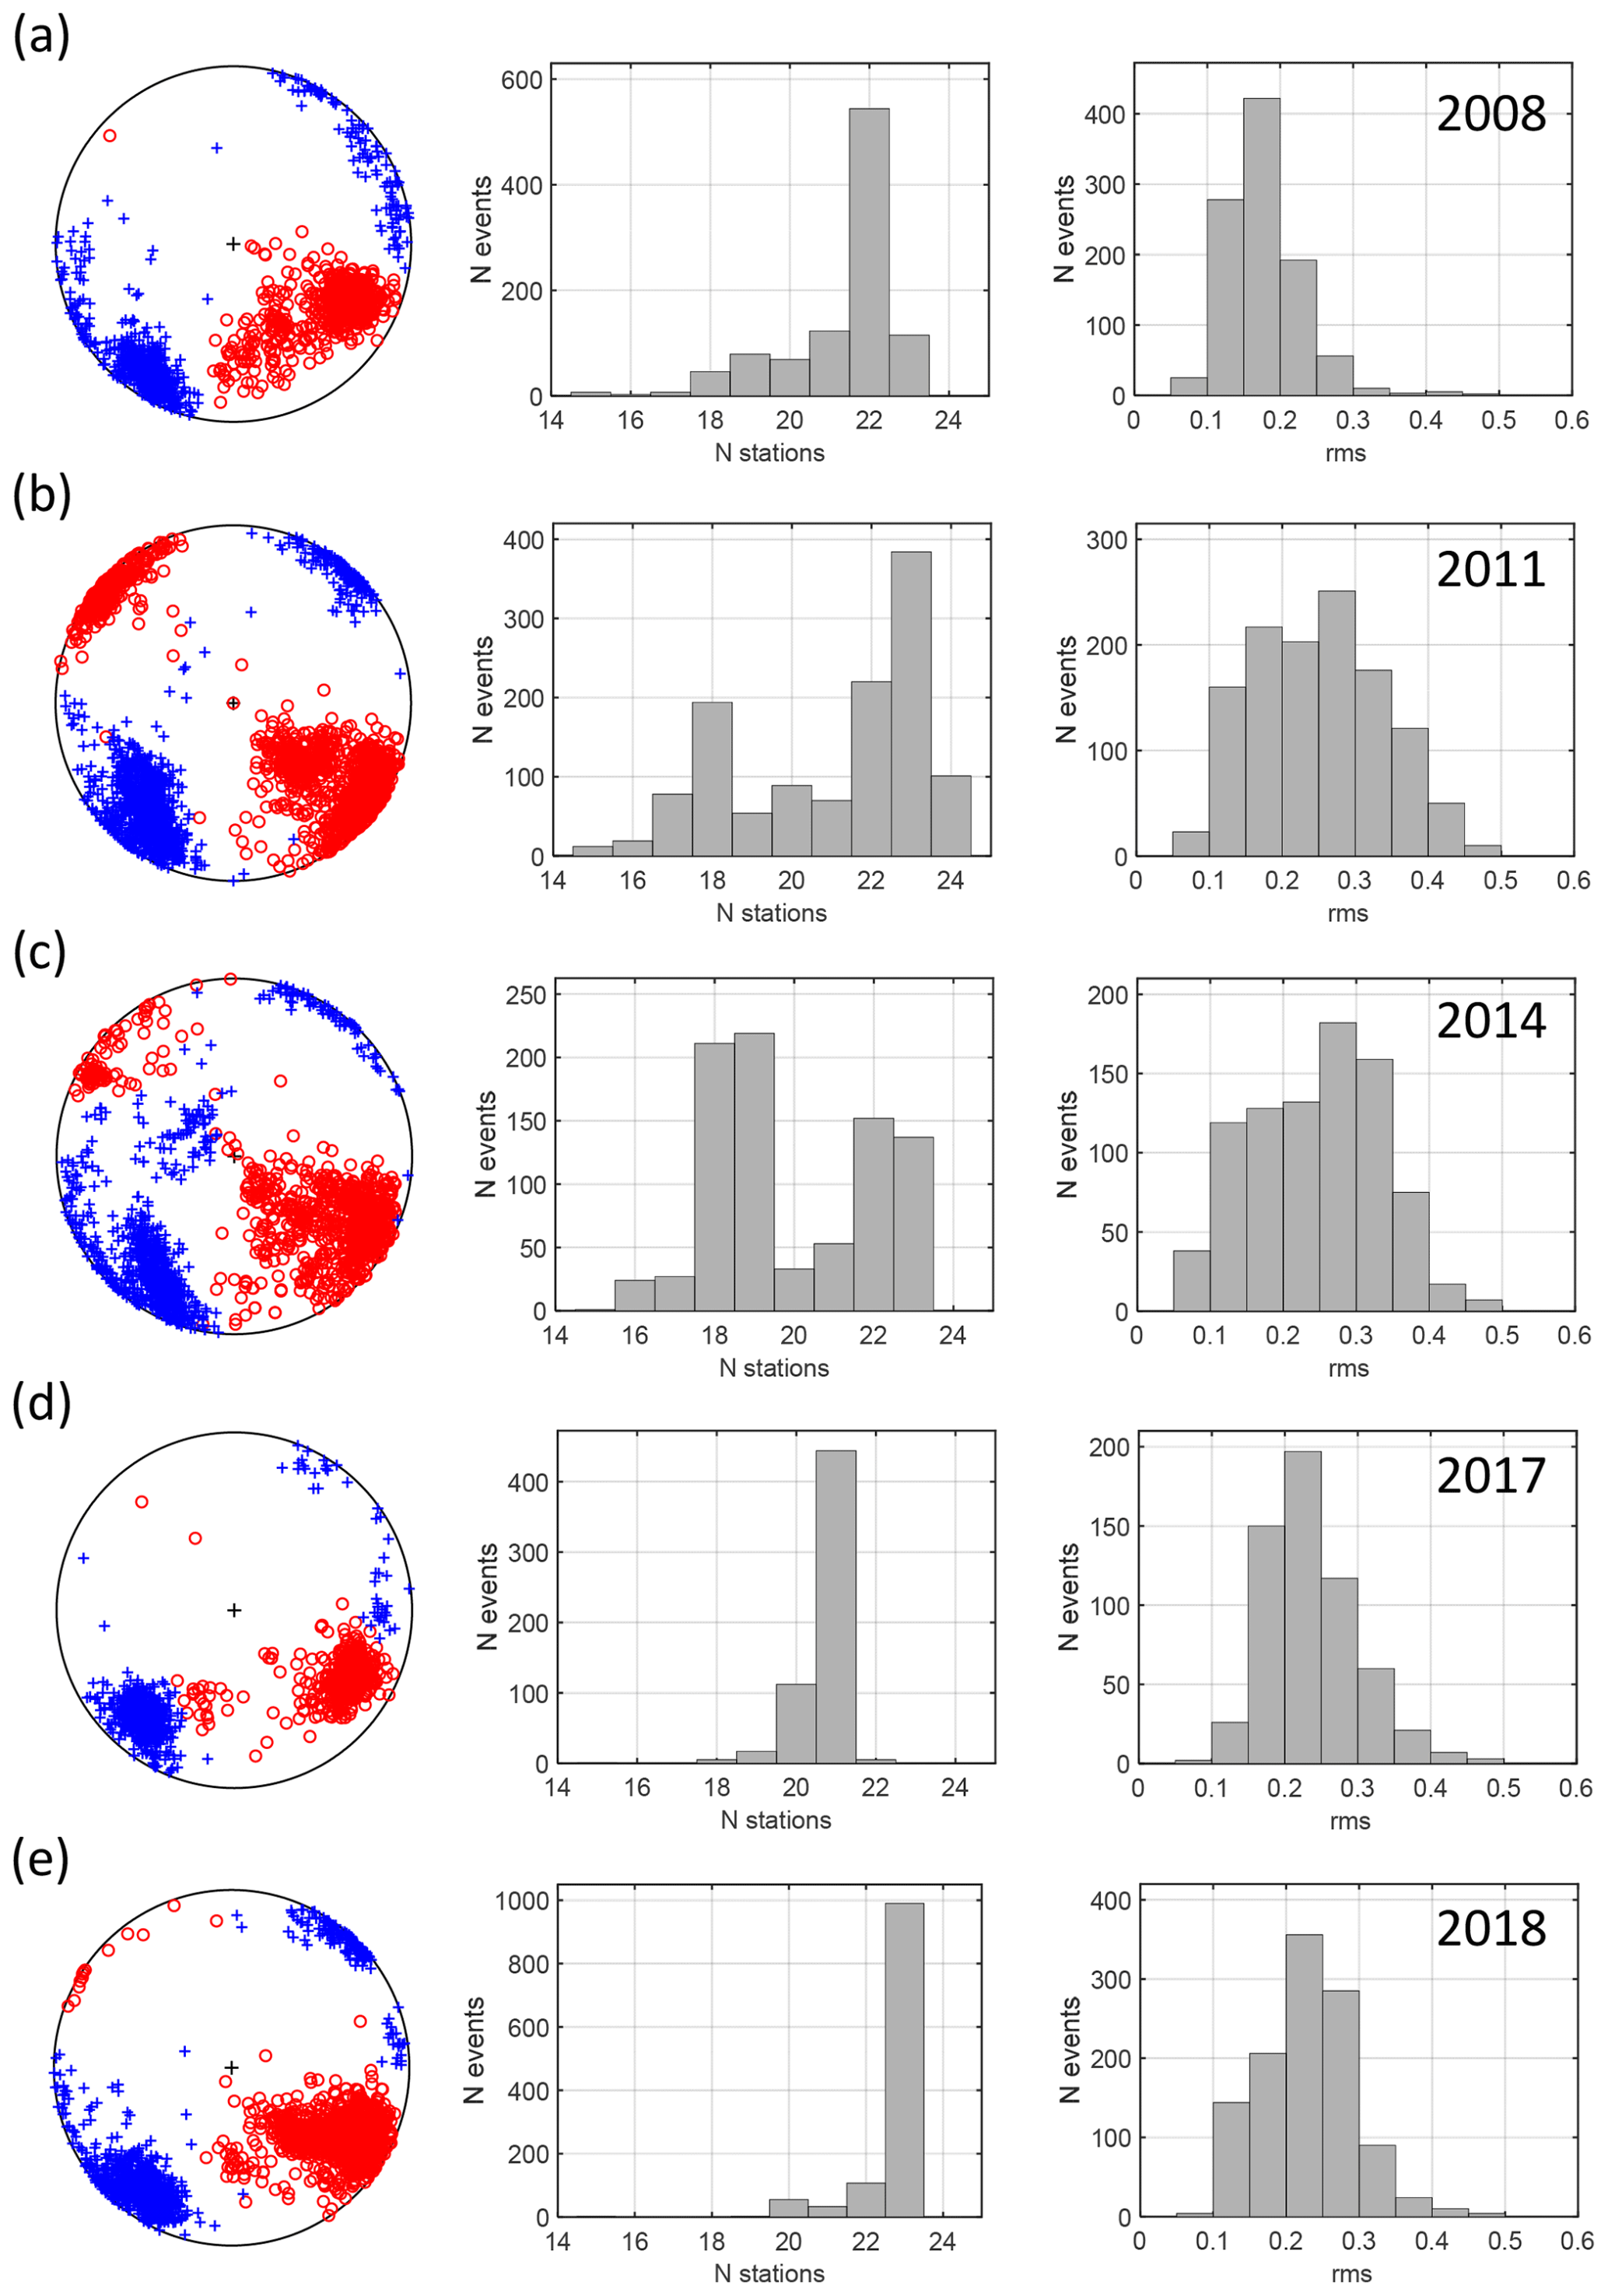
Figure 9The P/T axes (left-hand plots), histograms of the number of stations used in the MT inversion (middle plots), and histograms of the rms of the retrieved MTs (right-hand plots) for seismic activities in 2008 (a), 2011 (b), 2014 (c), 2017 (d), and 2018 (e). N denotes the number of stations which recorded the individual earthquakes.
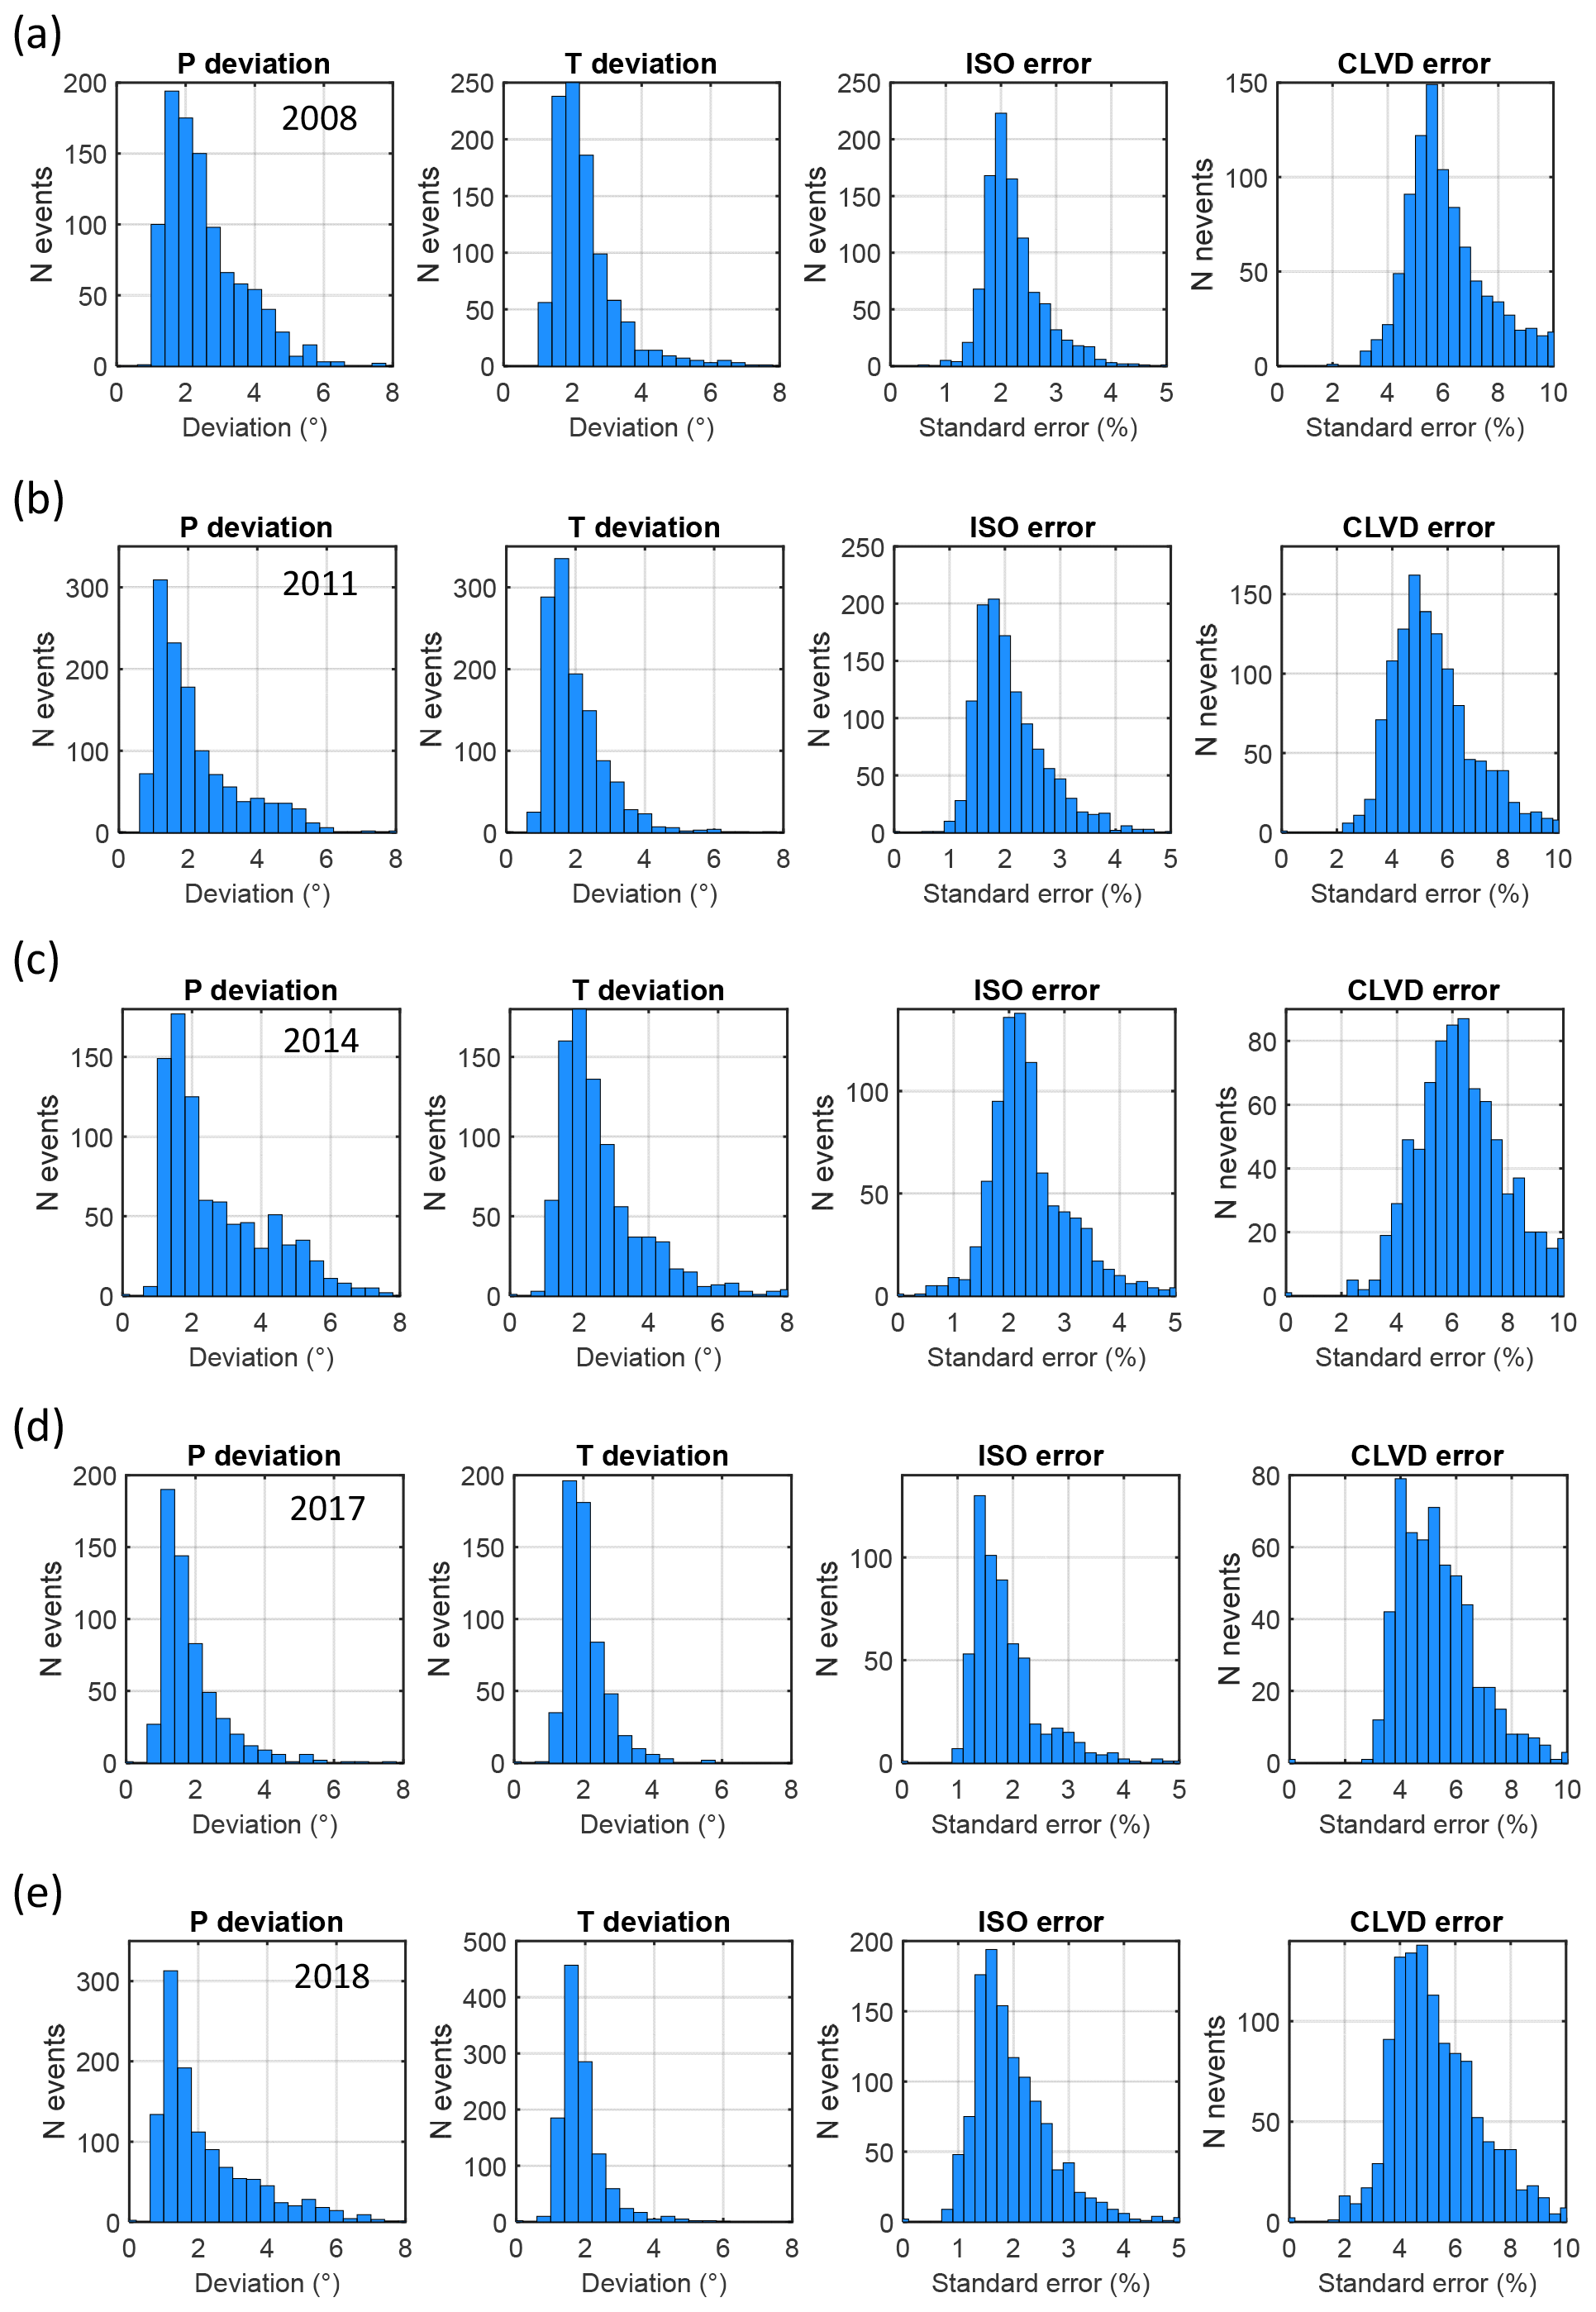
Figure 10Histograms of mean deviations of the P/T axes and histograms of the ISO and CLVD standard errors for MTs of earthquakes from individual prominent seismic activities in 2008 (a), 2011 (b), 2014 (c), 2017 (d), and 2018 (e). The mean P/T deviations and the ISO and CLVD standard errors were calculated for each event from 100 MTs inverted using randomly generated noisy data.
6.2 Individual steps of the MT inversion
The MT inversion consists of data pre-processing, alignment of traces, computation of the effective amplitudes using the PCA method, and the MT inversion. The data are not corrected for the frequency response of sensors because the response is flat for all sensors at least from 1 to 80 Hz. The individual steps of the inversion are as follows (see Fig. 5):
-
Data pre-processing. This comprises (a) an oversampling of records in order to perform an accurate alignment of waveforms; (b) band-pass filtering to enhance the signal-to-noise ratio; and (c) a rough alignment of waveforms using manual picks, if available, or using an automatic picking algorithm called the Suspension Bridge Picking (SBPx); see FeedMeImATroll (2021).
-
Two-step accurate alignment of waveforms. This comprises (a) an alignment of waveforms using the cross-correlation with the waveform of the highest signal-to-noise ratio, (b) calculation of the first principal component from the aligned waveforms, (c) another alignment of waveforms using the cross-correlation with the computed first principal component, and (d) calculation of the refined first principal component from the aligned waveforms.
-
Calculation of the PCA amplitudes and weights in the MT inversion. This comprises (a) calculation of the PCA coefficients of the first principal component, which serve as the effective amplitudes used in the MT inversion, and (b) calculation of the correlation coefficients between individual traces and the first principal component, which serve as the weights in the linear MT inversion scheme (in this way, a station with a waveform significantly different from the common wavelet is suppressed in the inversion).
-
Repeated MT inversion. This is performed for several alternative band-pass filters and time windows in order to adapt the inversion to earthquakes with a varying frequency content. The inversion is firstly run with the whole set of stations and secondly with eliminating two stations that produce the largest misfits in the inversion.
In this way, we obtain a set of candidate MTs. The optimum MT is that with the minimum root-mean squares (rms's) of differences between the synthetic amplitudes Asynth and the observed amplitudes Aobs:
where N is the number of stations. The optimum MT is normalized and expressed in a relative scale because it is computed from wave amplitudes but not from full displacement records. The scalar moment is obtained by integrating the common (displacement) wavelet. The optimum MTs were further decomposed into the DC, ISO, and CLVD components according to Eqs. (6)–(10) of Vavryčuk (2015a).
In order to estimate errors in the MTs, the inversion is performed for each MT repeatedly 100 times using amplitudes distorted by noise characterized by a flat probability distribution. The level of noise ranges from −25 % to 25 % of the inverted amplitude at each trace. The scatter of the solutions served for estimating (1) the mean errors in the P/T axes' directions calculated as the mean of deviations between the directions of the P/T axes of noise-free solution and the noisy solutions and (2) the mean errors in the percentages of the DC, ISO, and CLVD components calculated as the standard deviations of the DC, ISO, and CLVD values of noisy MT solutions.
Figure 6 exemplifies the MT inversion for two earthquakes, which display significant non-DC components. The histograms of the CLVD and ISO errors indicate that the ISO component is always better constrained than the CLVD component. Nevertheless, despite the numerical errors produced by the inversion, the histograms prove that both the events contain also true non-DC components. This is also confirmed by a comparison of fits for the full MTs and for the DC solutions for the events shown in Fig. 7. The figure indicates that the misfits for the full MT solutions are almost 2 times lower than those for the DC solutions. This proves that at least some part of the non-DC components retrieved by the MT inversion should be of physical origin.
Firstly, we processed all events with a local magnitude larger than 0.5. After that, we checked manually the quality of input data and the retrieved MT and excluded earthquakes (1) recorded at a low number of stations (N<15), (2) with an extremely low signal-to-noise ratio, and (3) that produced unstable moment tensors with anomalously high rms values (rms >0.5). In this way, we obtained a dataset of 5134 earthquakes listed in the catalogue. Table 3 summarizes the numbers of events in individual years. The magnitude–frequency distribution of the analysed events is shown in Fig. 8.
The earthquakes inverted for MTs were recorded mostly by 20 or more stations (Fig. 9, middle column). The rms varied during the whole period and ranged mostly from 0 to 0.5 (Fig. 9, right column). The MTs with rms values higher than 0.5 were considered unreliable. The variation in the rms in time is probably produced by varying station coverage due to the foci migration. The P/T axes form compact and non-overlapping clusters for all seismic sequences in the studied time period (Fig. 9). The position of clusters slightly differs in individual years and indicates some stress variation in the focal zone. Directions of the P/T axes are well resolved with the mean standard deviation less than 2∘ (Fig. 10, two left columns). The errors in the ISO and CLVD components are mostly about 1.5 %–2 % and 5 %–6 %, respectively (Fig. 10, two right columns). Comparing these errors for individual activity periods, we see that the errors tend to slightly decrease with time. This might be due to the continuously increasing quality of the WEBNET network. The histograms of the standard deviations of the P/T axes and the ISO and CLVD errors for the whole period from 2008–2018 are shown in Fig. 11.
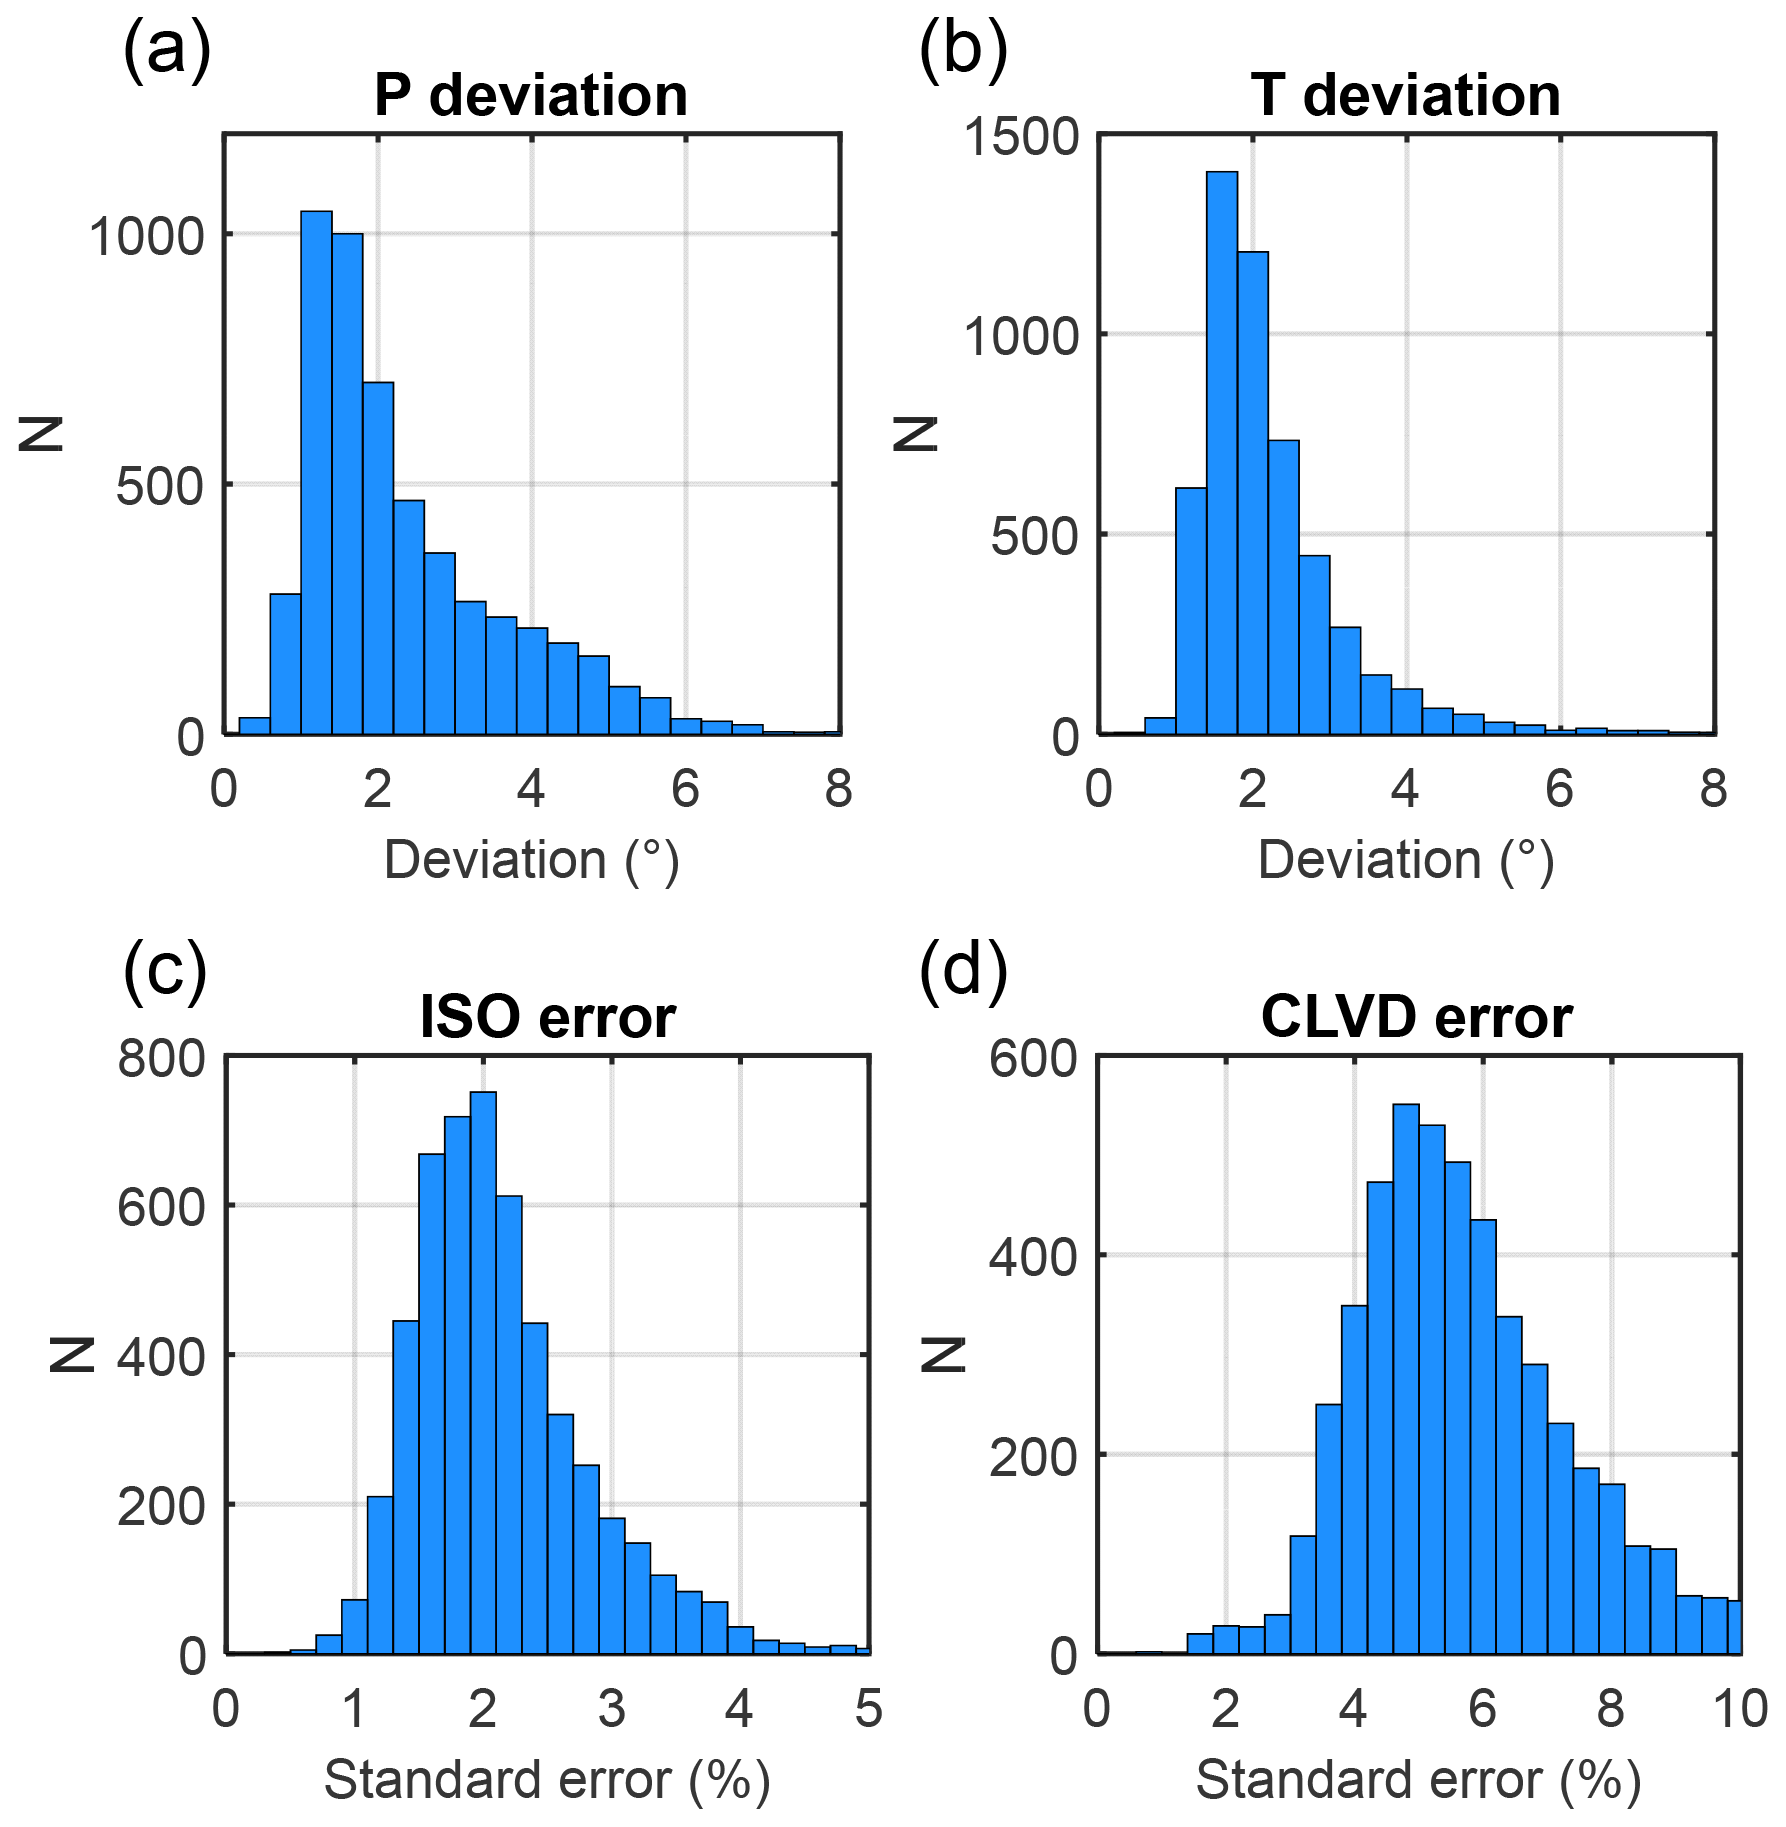
Figure 11Histograms of mean deviations of the axes (a–b) and histograms of the standard ISO and CLVD errors (c–d) for the 5134 reported MTs. The mean P/T deviations and the ISO and CLVD standard errors were calculated for each event from 100 MTs inverted using randomly generated noisy data.
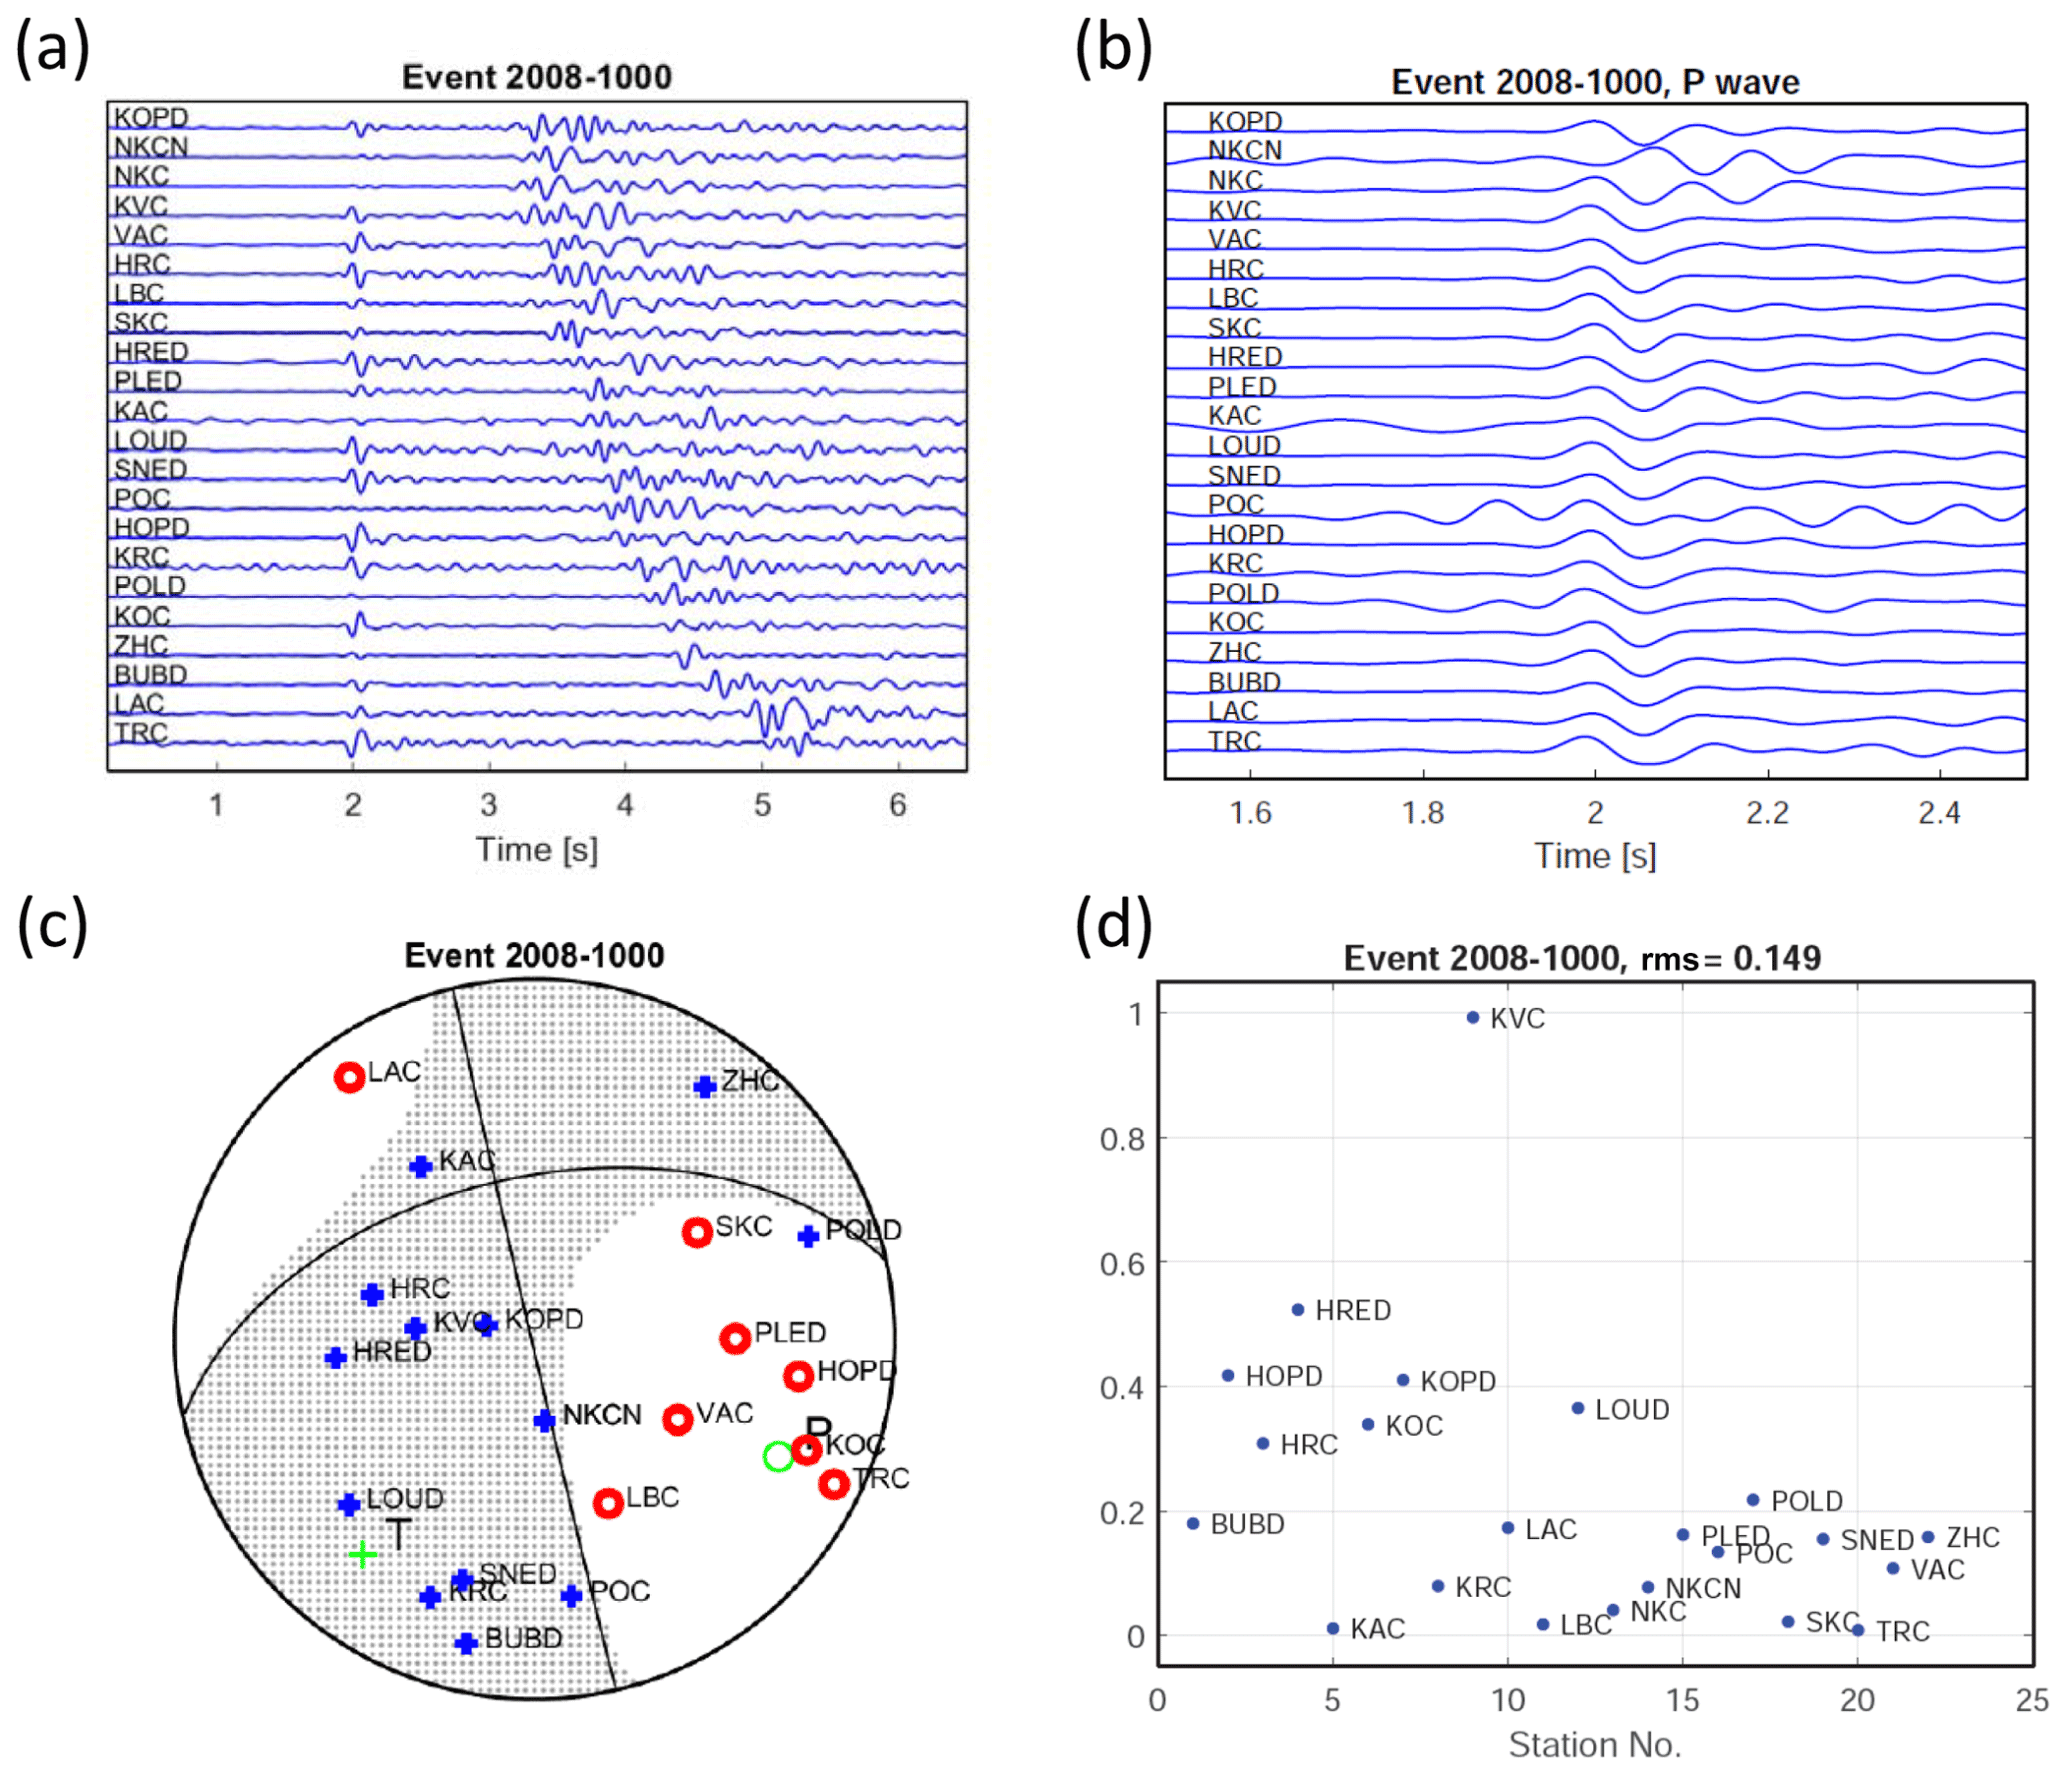
Figure 12Example of plots provided for each earthquake in the dataset. (a) Vertical components of complete waveforms recorded at the WEBNET stations and aligned according to the arrival time of the P wave. Stations are sorted according to their epicentral distance. (b) Vertical components of the P waves aligned according to their arrival time and with polarity switched according to the polarity of the common wavelet. (c) The focal mechanism with positions of the stations on the focal sphere (negative polarities – red circles, positive polarities – blue plus signs). (d) Root-mean squares (rms's) of the differences between the theoretical and observed amplitudes of the P waves.
The dataset consists of the following directories:
-
Waveforms. This directory is further structured into subdirectories according to individual years and earthquakes. Three-component velocity records are stored in ASCII files with four columns (time + three components: Z, N, E) individually for each station and each earthquake. The first line of the files contains the time of the first sample. The pre-event time before the P-wave arrival is 2 s.
-
Model. This directory contains the ASCII file “model.crust”, which defines the layered velocity model for the West Bohemia region (depth in km, P-wave velocity in km s−1, ratio, P-wave quality factor QP, and ratio of P-wave and S-wave quality factors).
-
Stations. This directory contains the ASCII file “Webnet_coordinates.dat” with coordinates of stations (site, name of the station, latitude, longitude, elevation), file “Webnet.xml” with a full technical specification of stations formatted according to the FDSN StationXML standard (http://docs.fdsn.org/projects/stationxml/en/latest/, last access: 4 May 2022), and file “Webnet.dataless” with a full technical specification of stations formatted according to the dataless SEED format (https://ds.iris.edu/ds/nodes/dmc/data/formats/dataless-seed/, last access: 4 May 2022).
-
Moments. This directory contains the ASCII file “catalogue_2008–2018.dat” with double-difference locations, magnitudes, moment tensors and their errors, rms values, and the numbers of inverted stations.
-
Figures. This directory is further structured into subdirectories according to individual years. Four figures are provided for each earthquake in .pdf format (see Fig. 12) – complete waveforms of vertical components, detail of the P waveforms, the focal mechanism with positions of stations, and the rms at individual stations.
The catalogue_2008–2018.dat file lists the following quantities for each earthquake:
-
event identification (composed from year and the sequential number of the event in the year, e.g. 2008–216);
-
double-difference locations with
-
origin time (year, d, h, min, s),
-
latitude (∘ N),
-
longitude (∘ E),
-
depth (km);
-
-
local magnitude ML (calculated according to Horálek et al., 2000);
-
N – number of stations used in the MT inversion;
-
frequencies f1 and f2 (in Hz) – low and high corner frequencies of the optimum Butterworth fourth-order band-pass filter;
-
rms – definition in Eq. (1);
-
moment magnitude MW;
-
components of the normalized moment tensor – M11, M12, M13, M22, M23, and M33 (x1 – north, x2 – east, x3 – down) – moment tensor normalized using the Euclidean norm (see Eq. 17 of Vavryčuk, 2015a);
-
strike1, dip1, rake1, strike2, dip2, and rake2 (in degrees);
-
DC, CLVD, and ISO (in %, calculated according to Eqs. 6–10 of Vavryčuk, 2015a);
-
errors in DC, CLVD, and ISO (in % – definition of errors in the text);
-
deviations of the P/T axes (in degrees – definition of errors in the text).
The moment tensor decomposition was performed using public open MATLAB code MT_DECOMPOSITION available via https://www.ig.cas.cz/en/mt-decomposition/ (Vavryčuk, 2015b).
The MT catalogue and waveforms are available at the Mendeley Data repository via https://doi.org/10.17632/9pwy7rgzkt.2 (Vavryčuk et al., 2022a) and at the International Seismological Centre (ISC) Dataset Repository via https://doi.org/10.31905/H212Z6OX (Vavryčuk et al., 2022b).
We publish a unique catalogue of moment tensors of earthquakes that occurred in West Bohemia in the period from 2008 to 2018. The catalogue is exceptional in several aspects: (1) it represents an extraordinary, extensive dataset of more than 5100 MTs; (2) it covers a long period of seismicity in the studied area, during which several prominent earthquake swarms took place; and (3) the foci locations and retrieved MTs are of a very high accuracy. In addition, the three-component velocigrams recorded at the WEBNET stations together with the velocity model in the region and the technical specification of stations are provided. This predetermines the dataset to be utilized by a large community of researchers for various seismological purposes.
The great potential of the dataset or its subsets has so far been proved in studies of origins of the swarm activity in this area (Horálek and Fischer, 2008; Fischer et al., 2010, 2014), migration of seismicity in time due to fluid flow and/or stress redistribution in the focal zone (Hainzl et al., 2012, 2016; Vavryčuk and Hrubcová, 2017), changes in the ratio in the focal zone (Dahm and Fischer, 2014; Bachura and Fischer, 2016), identification of fault segments and their mutual interaction (Vavryčuk and Adamová, 2018; Vavryčuk et al., 2021), the fault instability (Vavryčuk, 2011b, 2014), differences in the seismic energy release in earthquake swarms and mainshock–aftershock sequences (Čermáková and Horálek, 2015; Vavryčuk and Adamová, 2018), the efficiency of new moment tensor inversion algorithms such as the MT inversion based on PCA (Vavryčuk et al., 2017), the MT inversion using empirical Green's functions (Vavryčuk and Adamová, 2020), or the MT inversion using network calibration (Davi and Vavryčuk, 2012; Davi et al., 2013). The provided records were also utilized in a study of seismic anisotropy based on the analysis of shear-wave splitting (Vavryčuk and Boušková, 2008), of identification of shallow discontinuities in the Earth's crust (Hrubcová et al., 2016), of lateral variation in depth of the Moho discontinuity (Hrubcová et al., 2013, 2017), and for detailed mapping of the non-DC components of MTs and shear–tensile fracturing in the Nový Kostel focal zone (Vavryčuk, 20011a; Vavryčuk et al., 2021).
The dataset is ideal for being utilized in many other studies in future, e.g. for studies of (1) the interaction between the scattered background regional seismicity and the swarm seismicity focused in the Nový Kostel zone, (2) the Coulomb stress and local stress anomalies connected to fault irregularities, (3) diffusivity of fluids along the activated faults, or (4) time-dependent seismic risk due to the migration of seismicity in the region. In addition, the dataset is optimum for developing and testing new MT inversions (Šílený and Vavryčuk, 2000, 2002) and stress inversions and for the spatiotemporal evolution of tectonic stress. Since most of the earthquakes are non-shear, the dataset can contribute to studies of the non-DC components and their relation to shear–tensile fracturing and/or seismic anisotropy in the focal zone (Vavryčuk, 1997; Vavryčuk and Boušková, 2008).
VV designed the study, prepared the code for the moment tensor inversion, and wrote the paper; PA calculated seismic moment tensors; JD pre-processed data and calculated double-difference locations; JH designed the WEBNET network, analysed seismic waveforms, and checked the quality of the seismic moment tensors.
The contact author has declared that neither they nor their co-authors have any competing interests.
Publisher's note: Copernicus Publications remains neutral with regard to jurisdictional claims in published maps and institutional affiliations.
We thank Grzegorz Kwiatek and the anonymous reviewer for their helpful reviews.
This research has been supported by the Grantová Agentura České Republiky (grant no. 19-06422S).
This paper was edited by Kirsten Elger and reviewed by Grzegorz Kwiatek and one anonymous referee.
Bachura, M. and Fischer, T.: Detailed velocity ratio mapping during the aftershock sequence as a tool to monitor the fluid activity within the fault plane, Geophys. J. Int., 453, 215–222, https://doi.org/10.1016/j.epsl.2016.08.017, 2016.
Bachura, M., Fischer, T., Doubravová, J., and Horálek, J.: From earthquake swarm to a main shock-aftershocks: the 2018 activity in West Bohemia/Vogtland, Geophys. J. Int., 224, 1835–1848, 2021.
Bankwitz, P., Schneider, G., Kämpf, H., and Bankwitz, E.: Structural characteristics of epicentral areas in Central Europe: study case Cheb Basin (Czech Republic), J. Geodyn., 35, 5–32, https://doi.org/10.1016/S0264-3707(02)00051-0, 2003.
Bath, M.: Lateral inhomogeneities in the upper mantle, Tectonophysics, 2, 483–514, 1965.
Bouchaala, F., Vavryčuk, V., and Fischer, T.: Accuracy of the master-event and double-difference locations: Synthetic tests and application to seismicity in West Bohemia, Czech Republic, J. Seismol., 17, 841–859, https://doi.org/10.1007/s10950-013-9357-4, 2013.
Bräuer, K., Kämpf, H., Niedermann, S., and Strauch, G.: Monitoring of helium and carbon isotopes in the western Eger Rift area (Czech Republic): Relationships with the 2014 seismic activity and indications for recent (2000–2016) magmatic unrest, Chem. Geol., 482, 131–145, https://doi.org/10.1016/j.chemgeo.2018.02.017, 2018.
Čermáková, H. and Horálek, J.: The 2011 West Bohemia (Central Europe) earthquake swarm compared with the previous swarms of 2000 and 2008, J. Seismol., 19, 899–913, https://doi.org/10.1007/s10950-015-9502-3, 2015.
Červený, V.: Seismic Ray Theory, Cambridge University Press, Cambridge, https://doi.org/10.1017/CBO9780511529399,, 2001.
Cesca, S. and Dahm, T.: A frequency domain inversion code to retrieve time-dependent parameters of very long period volcanic sources, Comput. Geosci., 34, 235–246, 2008.
Cesca, S., Buforn, E., and Dahm, T.: Amplitude spectra moment tensor inversion of shallow earthquakes in Spain, Geophys. J. Int., 166, 839–854, 2006.
Dahm, T. and Fischer, T.: Velocity ratio variations in the source region of earthquake swarms in NW Bohemia obtained from arrival time double-differences, Geophys. J. Int., 196, 957–970, 2014.
Davi, R. and Vavryčuk, V.: Seismic network calibration for retrieving accurate moment tensors, B. Seismol. Soc. Am., 102, 2491–2506, https://doi.org/10.1785/0120110344, 2012.
Davi, R., Vavryčuk, V., Charalampidou, E.-M., and Kwiatek, G.: Network sensor calibration for retrieving accurate moment tensors of acoustic emissions, Int. J. Rock Mech. Min., 62, 59–67, https://doi.org/10.1016/j.ijrmms.2013.04.004, 2013.
Dreger, D. and Woods, B.: Regional distance seismic moment tensors of nuclear explosions, Tectonophysics, 356, 139–156, 2002.
FeedMeImATroll: Suspension Bridge Picking Algorithm (SBPx), MATLAB Central File Exchange, https://www.mathworks.com/matlabcentral/fileexchange/51996-suspension-bridge-picking-algorithm-sbpx, last access: 21 September 2021.
Fischer, T., Horálek, J., Michálek, J., and Boušková, A.: The 2008 West Bohemia earthquake swarm in the light of the WEBNET network, J. Seismol., 14, 665–682, 2010.
Fischer, T., Horálek, J., Hrubcová, P., Vavryčuk, V., Bräuer, K., and Kämpf, H.: Intra-continental earthquake swarms in West-Bohemia and Vogtland: a review, Tectonophysics, 611, 1–27, https://doi.org/10.1016/j.tecto.2013.11.001, 2014.
Fojtíková, L. and Zahradník, J.: A new strategy for weak events in sparse networks: The first-motion polarity solutions constrained by single-station waveform inversion, Seismol. Res. Lett., 85, 1265–1274, https://doi.org/10.1785/0220140072, 2014.
Fojtíková, L., Vavryčuk, V., Cipciar, A., and Madarás, J.: Focal mechanisms of micro-earthquakes in the Dobrá Voda seismoactive area in the Malé Karpaty Mts. (Little Carpathians), Slovakia, Tectonophysics, 492, 213–229, https://doi.org/10.1016/j.tecto.2010.06.007, 2010.
Ford, S. R., Dreger, D. S., and Walter, W. R.: Network sensitivity solutions for regional moment-tensor inversions, B. Seismol. Soc. Am., 100, 162–1970, 2010.
Frohlich, C.: Earthquakes with non-double-couple mechanisms, Science, 264, 804–809, 1994.
Hainzl, S., Fischer, T., and Dahm, T.: Seismicity-based estimation of the driving fluid pressure in the case of swarm activity in Western Bohemia, Geophys. J. Int., 191, 271–278, 2012.
Hainzl, S., Fischer, T., Čermáková, H., Bachura, M., and Vlček, J.: Aftershocks triggered by fluid intrusion: Evidence for the aftershock sequence occurred 2014 in West Bohemia/Vogtland, J. Geophys. Res., 121, 2575–2590, 2016.
Horálek, J. and Doubravová, J.: West Bohemia local seismic network, FDSN [data set], https://doi.org/10.7914/sn/wb, 2015.
Horálek, J. and Fischer, T.: Role of crustal fluids in triggering the West Bohemia/Vogtland earthquake swarms: just what we know (a review), Stud. Geophys. Geod., 52, 455–478, 2008.
Horálek, J., Fischer, T., Boušková, A., and Jedlička, P.: The Western Bohemia/Vogtland region in the light of the WEBNET network, Stud. Geophys. Geod., 44, 107–125, 2000.
Hrubcová, P., Vavryčuk, V., Boušková, A., and Horálek, J.: Moho depth determination from waveforms of microearthquakes in the West Bohemia/Vogtland swarm area, J. Geophys. Res., 118, 1–17, https://doi.org/10.1029/2012JB009360, 2013.
Hrubcová, P., Vavryčuk, V., Boušková, A., and Bohnhoff, M.: Shallow crustal discontinuities inferred from waveforms of microearthquakes: Method and application to KTB drill site and West Bohemia swarm area, J. Geophys. Res.-Sol. Ea., 121, 881–902, https://doi.org/10.1002/2015JB012548, 2016.
Hrubcová, P., Geissler, W. H., Bräuer, K., Vavryčuk, V., Tomek, Č., and Kämpf, H.: Active magmatic underplating in western Eger Rift, Central Europe, Tectonics, 36, 2846–2862, https://doi.org/10.1002/2017TC004710, 2017.
Jakoubková, H., Horálek, J., and Fischer, T.: 2014 mainshock-aftershock activity versus earthquake swarms in West Bohemia, Czech Republic, Pure Appl. Geophys., 175, 109–131, https://doi.org/10.1007/s00024-017-1679-7, 2018.
Jechumtálová, Z. and Šílený, J.: Amplitude ratios for complete moment tensor retrieval, Geophys. Res. Lett., 32, L22303, https://doi.org/10.1029/2005GL023967, 2005.
Jost, M. L. and Hermann, R. B.: A student's guide to and review of moment tensors, Seismol. Res. Lett., 60, 37–57, 1989.
Julian, B. R., Miller, A. D., and Foulger, G. R.: Non-double-couple earthquakes 1: Theory, Rev. Geophys., 36, 525–549, 1998.
Kämpf, H., Bräuer, K., Schumann, J., Hahne, K., and Strauch, G.: CO2 discharge in an active, non-volcanic continental rift area (Czech Republic): Characterisation (δ13C, 3He/4He) and quantification of diffuse and vent CO2 emissions, Chem. Geol., 339, 71–83, https://doi.org/10.1016/j.chemgeo.2012.08.005, 2013.
Knopoff, L. and Randall, M. J.: The compensated linear vector dipole: A possible mechanism for deep earthquakes, J. Geophys. Res., 75, 4957–4963, 1970.
Kühn, D. and Vavryčuk, V.: Determination of full moment tensors of microseismic events in a very heterogeneous mining environment, Tectonophysics, 589, 33–43, https://doi.org/10.1016/j.tecto.2012.12.035, 2013.
Kwiatek, G., Martínez-Garzón, P., and Bohnhoff, M.: HybridMT: A MATLAB/Shell environment package for seismic moment tensor inversion and refinement, Seismol. Res. Lett., 87, 964–976, 2016.
Lay, T. and Wallace, T. C.: Modern Global Seismology, Academic Press, New York, ISBN 9780080536712, 1995.
Lomax, A., Michelini, A., and Curtis, A.: Earthquake location, direct, global-search methods, in: Complexity In Encyclopedia of Complexity and System Science, Part 5, Springer, New York, 2449–2473, https://doi.org/10.1007/978-0-387-30440-3, 2009.
Málek, J., Horálek, J., and Janský, J.: One-dimensional qP-wave velocity model of the upper crust for the West Bohemia/Vogtland earthquake swarm region, Stud. Geophys. Geod., 49, 501–524, 2005.
Miller, A. D., Foulger, G. R., and Julian, B. R.: Non-double-couple earthquakes 2: Observations, Rev. Geophys., 36, 551–568, 1998.
Růžek, B., Vavryčuk, V., Hrubcová, P., Zedník, J., and Celebration Working Group: Crustal anisotropy in the Bohemian Massif, Czech Republic: Observations based on Central European Lithospheric Experiment Based on Refraction (CELEBRATION) 2000, J. Geophys. Res., 108, 2392, https://doi.org/10.1029/2002JB002242, 2003.
Šílený, J.: Resolution of non-double-couple mechanisms: Simulation of hypocenter mislocation and velocity structure mismodeling, B. Seismol. Soc. Am., 99, 2265–2272, 2009.
Šílený, J. and Milev, A.: Source mechanism of mining induced seismic events – Resolution of double couple and non double couple models, Tectonophysics, 456, 3–15, 2008.
Šílený, J. and Vavryčuk, V.: Approximate retrieval of the point source in anisotropic media: numerical modelling by indirect parametrization of the source, Geophys. J. Int., 143, 700–708, https://doi.org/10.1046/j.1365-246X.2000.00256.x, 2000.
Šílený, J. and Vavryčuk, V.: Can unbiased source be retrieved from anisotropic waveforms by using an isotropic model of the medium?, Tectonophysics, 356, 125–138, https://doi.org/10.1016/S0040-1951(02)00380-3, 2002.
Sokos, E. and Zahradník, J.: ISOLA – A Fortran code and Matlab GUI to perform multiple point source inversion of seismic data, Comput. Geosci., 34, 967–977, 2008.
Stierle, E., Vavryčuk, V., Šílený, J., and Bohnhoff, M.: Resolution of non-double-couple components in the seismic moment tensor using regional networks: 1. A synthetic case study, Geophys. J. Int., 196, 1869–1877, https://doi.org/10.1093/gji/ggt502, 2014a.
Stierle, E., Bohnhoff, M., and Vavryčuk, V.: Resolution of non-double-couple components in the seismic moment tensor using regional networks: 2. Application to aftershocks of the 1999 Mw 7.4 Izmit earthquake, Geophys. J. Int., 196, 1878–1888, https://doi.org/10.1093/gji/ggt503, 2014b.
Vavryčuk, V.: Elastodynamic and elastostatic Green tensors for homogeneous weak transversely isotropic media, Geophys. J. Int., 130, 786–800, https://doi.org/10.1111/j.1365-246X.1997.tb01873.x, 1997.
Vavryčuk, V.: Weak-contrast reflection/transmission coefficients in weakly anisotropic elastic media: P-wave incidence, Geophys. J. Int., 138, 553–562, https://doi.org/10.1046/j.1365-246X.1999.00890.x, 1999.
Vavryčuk, V.: Focal mechanisms in anisotropic media, Geophys. J. Int., 161, 334–346, https://doi.org/10.1111/j.1365-246X.2005.02585.x, 2005.
Vavryčuk, V.: Spatially dependent seismic anisotropy in the Tonga subduction zone: a possible contributor to the complexity of deep earthquakes, Phys. Earth Planet. Int., 155, 63–72, https://doi.org/10.1016/j.pepi.2005.10.005, 2006.
Vavryčuk, V.: Real ray tracing in anisotropic viscoelastic media, Geophys. J. Int., 175, 617–626, https://doi.org/10.1111/j.1365-246X.2008.03898.x, 2008.
Vavryčuk, V.: Tensile earthquakes: Theory, modeling, and inversion, J. Geophys. Res.-Sol. Ea., 116, B12320, https://doi.org/10.1029/2011JB008770, 2011a.
Vavryčuk, V.: Principal earthquakes: Theory and observations from the 2008 West Bohemia swarm, Earth Planet. Sc. Lett., 305, 290–296, https://doi.org/10.1016/j.epsl.2011.03.002, 2011b.
Vavryčuk, V.: Is the seismic moment tensor ambiguous at a material interface?, Geophys. J. Int., 194, 395–400, https://doi.org/10.1093/gji/ggt084, 2013.
Vavryčuk, V.: Iterative joint inversion for stress and fault orientations from focal mechanisms, Geophys. J. Int., 199, 69–77, https://doi.org/10.1093/gji/ggu224, 2014.
Vavryčuk, V.: Moment tensor decompositions revisited, J. Seismol., 19, 231–252, https://doi.org/10.1007/s10950-014-9463-y, 2015a.
Vavryčuk, V.: MT decomposition package: decomposition and visualization of seismic moment tensors, https://www.ig.cas.cz/mt-decomposition/ (last access: 4 May 2022), 2015b.
Vavryčuk, V. and Adamová, P.: Detection of stress anomaly produced by interaction of compressive fault steps in the West Bohemia swarm region, Czech Republic, Tectonics, 37, 4212–4225, https://doi.org/10.1029/2018TC005163, 2018.
Vavryčuk, V. and Adamová, P.: Non-double-couple moment tensors of earthquakes calculated using empirical Green's functions, Seismol. Res. Lett., 91, 390–398, https://doi.org/10.1785/0220190154, 2020.
Vavryčuk, V. and Boušková, A.: S-wave splitting from records of local micro-earthquakes in West Bohemia/Vogtland: An indicator of complex crustal anisotropy, Stud. Geophys. Geod., 52, 631–650, https://doi.org/10.1007/s11200-008-0041-z, 2008.
Vavryčuk, V. and Hrubcová, P.: Seismological evidence of fault weakening due to erosion by fluids from observations of intraplate earthquake swarms, J. Geophys. Res., 122, 3701–3718, https://doi.org/10.1002/2017JB013958, 2017.
Vavryčuk, V. and Kühn, D.: Moment tensor inversion of waveforms: a two-step time-frequency approach, Geophys. J. Int., 190, 1761–1776, https://doi.org/10.1111/j.1365-246X.2012.05592.x, 2012.
Vavryčuk, V., Bohnhoff, M., Jechumtálová, Z., Kolář, P., and Šílený, J.: Non-double-couple mechanisms of micro-earthquakes induced during the 2000 injection experiment at the KTB site, Germany: A result of tensile faulting or anisotropy of a rock?, Tectonophysics, 456, 74–93, https://doi.org/10.1016/j.tecto.2007.08.019, 2008.
Vavryčuk, V., Bouchaala, F., and Fischer, T.: High-resolution fault image from accurate locations and focal mechanisms of the 2008 swarm earthquakes in West Bohemia, Czech Republic, Tectonophysics, 590, 189–195, https://doi.org/10.1016/j.tecto.2013.01.025, 2013.
Vavryčuk, V., Adamová, P., Doubravová, J., and Jakoubková, H.: Moment tensor inversion based on the principal component analysis of waveforms: Method and application to microearthquakes in West Bohemia, Czech Republic, Seismol. Res. Lett., 88, 1303–1315, https://doi.org/10.1785/0220170027, 2017.
Vavryčuk, V., Adamová, P., Doubravová, J., and Ren, Y.: Mapping stress and fluids on faults by nonshear earthquakes, J. Geophys. Res.-Sol. Ea., 126, e2020JB021287, https://doi.org/10.1029/2020JB021287, 2021.
Vavryčuk, V., Adamová, P., Doubravová, J., and Horálek, J.: WEBNET moment tensor catalogue 2008–2018, Mendeley Data, V2, https://doi.org/10.17632/9pwy7rgzkt.2, 2022a.
Vavryčuk, V., Adamová, P., Doubravová, J., and Horálek, J.: WEBNET moment tensor catalogue 2008–2018, ISC Seismological Dataset Repository, https://doi.org/10.31905/H212Z6OX, 2022b.
Waldhauser, F. and Ellsworth, W. L.: A double-difference earthquake location algorithm: Method and application to the northern Hayward fault, California, B. Seismol. Soc. Am., 90, 1353–1368, https://doi.org/10.1785/0120000006, 2000.
Yu, C., Vavryčuk, V., Adamová, P., and Bohnhoff, M.: Moment tensors of induced microearthquakes in The Geysers geothermal reservoir from broadband seismic recordings: Implications for faulting regime, stress tensor and fluid pressure, J. Geophys. Res.-Sol. Ea., 123, 8748–8766, https://doi.org/10.1029/2018JB016251, 2018.
Yu, C., Vavryčuk, V., Adamová, P., and Bohnhoff, M.: Frequency-dependent moment tensors of induced microearthquakes, Geophys. Res. Lett., 46, 6406–6414, https://doi.org/10.1029/2019GL082634, 2019.
Zahradník, J., Sokos, E., Tselentis, G.-A., and Martakis, N.: Non-double-couple mechanism of moderate earthquakes near Zakynthos, Greece, April 2006; explanation in terms of complexity, Geophys. Prospect., 56, 341–356, 2008.
- Abstract
- Introduction
- West Bohemia seismoactive region
- Monitoring system
- Seismicity in 2008–2018
- Magnitudes and foci locations
- Moment tensors
- Basic characteristics of the MT catalogue
- Description of the dataset
- Code availability
- Data availability
- Discussion and conclusions
- Author contributions
- Competing interests
- Disclaimer
- Acknowledgements
- Financial support
- Review statement
- References