the Creative Commons Attribution 4.0 License.
the Creative Commons Attribution 4.0 License.
 | 27 Apr 2022
Mapping long-term and high-resolution global gridded photosynthetically active radiation using the ISCCP H-series cloud product and reanalysis data
Wenjun Tang
Jun Qin
Yaozhi Jiang
Weihao Pan
Photosynthetically active radiation (PAR) is a fundamental physiological variable for research in the ecological, agricultural, and global change fields. In this study, we produced a 35-year (1984–2018) high-resolution (3 h, 10 km) global gridded PAR dataset using an effective physical-based model. The main inputs of the model were the latest International Satellite Cloud Climatology Project (ISCCP) H-series cloud products, MERRA-2 aerosol data, ERA5 surface routine variables, and MODIS and CLARRA-2 albedo products. Our gridded PAR product was evaluated against surface observations measured at 7 experimental stations of the SURFace RADiation budget network (SURFRAD), 42 experimental stations of the National Ecological Observatory Network (NEON), and 38 experimental stations of the Chinese Ecosystem Research Network (CERN). Instantaneous PAR was validated against SURFRAD and NEON data; mean bias errors (MBE) and root mean square errors (RMSE) were, on average 5.8 and 44.9 W m−2, respectively, and the correlation coefficient (R) was 0.94 at the 10 km scale. When upscaled to 30 km, the errors were markedly reduced. Daily PAR was validated against SURFRAD, NEON, and CERN data, and the RMSEs were 13.2, 13.1, and 19.6 W m−2, respectively, at the 10 km scale. The RMSEs were slightly reduced when upscaled to 30 km. Compared with the well-known global satellite-based PAR product of the Earth's Radiant Energy System (CERES), our PAR product was found to be a more accurate dataset with higher resolution. This new dataset is now available at https://doi.org/10.11888/RemoteSen.tpdc.271909 (Tang, 2021).
- Article
(5197 KB) - Full-text XML
- BibTeX
- EndNote


Plants rely on chlorophyll to absorb solar radiation in the visible wavelength range (400–700 nm) for photosynthesis (Huang et al., 2020), and sunlight in this band is commonly referred to as photosynthetically active radiation (PAR). Thus, PAR is the source of energy for biomass formation and may directly affect the growth, development, yield, and product quality of vegetation (Zhang et al., 2014; Ren et al., 2021), modulating energy exchange between the earth's surface and the atmosphere (Zhang et al., 2021). Therefore, a high-quality PAR dataset is indispensable for studies of ecosystems, agriculture, and global change (Frouin et al., 2018); however, measurements of PAR are not routinely conducted at weather stations or radiation stations. For example, PAR is not routinely observed at the Baseline Surface Radiation Network (BSRN, Ohmura et al., 1998) or at the China Meteorological Administration (CMA, Tang et al., 2013) radiation and weather stations, respectively. Long-term PAR observations are only provided by a few ecological experimental observation networks, such as the Chinese Ecosystem Research Network (CERN, Wang et al., 2016), the AmeriFlux network (https://ameriflux.lbl.gov/, last access: 23 April 2022), the SURFace RADiation budget network (SURFRAD, https://www.esrl.noaa.gov/gmd/grad/surfrad/, last access: 23 April 2022), and the National Ecological Observatory Network (NEON, https://www.neonscience.org/, last access: 23 April 2022). To compensate for the lack of PAR observations, a number of methods have been developed over recent decades to estimate PAR. These methods can be roughly divided into two categories: station-based methods and satellite-based methods (Tang et al., 2017).
Station-based methods mainly estimate PAR using other available variables measured using empirical or physical methods. Empirical methods usually use the observed PAR and other variables to build an empirical relationship to conduct PAR estimation. One such method is the well-known power law equation, which usually uses the cosine of the solar zenith angle and the clearness index as inputs. The clearness index, defined as the ratio of the solar radiation at the surface to that at the top of the atmosphere (TOA), roughly reflects the degree of solar light attenuation caused by clouds, aerosols, water vapor, and other atmospheric compositions. A number of such empirical methods based on the power law equation have been developed in the last two decades (Alados et al., 1996; Xia et al., 2008; Hu et al., 2010; Hu and Wang, 2014; Yu et al., 2015; Wang et al., 2015, 2016). In addition, artificial neural network (ANN) methods have also been used to estimate PAR from surface solar radiation (SSR) and other meteorological variables (e.g., air temperature, relative humidity, dew point, water vapor pressure, and air pressure) in a variety of ecosystems in China (Wang et al., 2016). Generally, the aforementioned empirical methods can work well when calibrated with local PAR observations, but the parameters in these methods are station-dependent and their performance at locations where observations are not available will deteriorate.
Physical methods of PAR estimation generally consider various attenuations in the atmosphere through parameterization approximation to complicated radiative transfer processes. For example, Gueymard (1989a, b, 2008) developed three physical methods for the estimation of PAR, but these only work under clear sky conditions. To obtain all-sky PAR, Qin et al. (2012) further extended these methods to cloudy skies by importing the measurements of sunshine duration that are usually conducted at most meteorological stations. Tang et al. (2013) used the PAR method of Qin et al. (2012) to estimate the daily PAR at more than 700 CMA routine weather stations, and found its accuracy was comparable to those of local calibrated methods. Nevertheless, the PAR method of Qin et al. (2012) can only be used to estimate daily PAR, and strictly can only be applied at weather stations where the observation of sunshine duration is available.
Alternatively, satellite-based methods can be used to map spatially continuous PAR, but compared to SSR, little attention has been paid to PAR estimation using remote sensing data (Van Laake and Sanchez-Azofeifa, 2004; Liang et al., 2006). There are a few algorithms for estimating PAR using satellite data, and these algorithms may be grouped into two categories: methods based on look-up tables (LUTs) and parameterization methods.
The LUT-based methods can circumvent complicated radiative transfer calculations (Huang et al., 2019) to estimate PAR directly from the satellite's signal by searching precalculated LUTs. Since first proposed by Pinker and Laszlo (1992), several similar LUT-based methods (Liang et al., 2006; Zhang et al., 2014; Huang et al., 2016) have emerged to estimate PAR from regional to global scales with different satellite sources; however, LUT-based methods are more vulnerable to various uncertainties due to their “black-box” nature, and they are also difficult to port across different satellite platforms.
In contrast, parameterization methods do not rely on satellite platforms. Essentially, they comprise a simplification of the radiative transfer processes, and thus require various land and atmospheric products from satellite retrievals as inputs to estimate PAR. To some extent, the accuracy of these methods depends on the accuracy of the input data. On the other hand, the uncertainty of parameterization methods comes mainly from the treatment of clouds; this is because the clear sky part of the method is relatively mature with uncertainty less than 10 % compared with the rigorous radiative transfer calculation (Huang et al., 2020). Little attention has been paid to specific cloud parameterization for PAR estimation except for the work of Van Laake and Sanchez-Azofeifa (2004), Sun et al. (2017), and Huang et al. (2020). Sun et al. (2017) used one (UV-visible) of their two broadbands (UV-visible and near infrared) models (a physical-based parameterization scheme for the estimation of SSR), to estimate all-sky PAR. By further considering the multiple scattering and reflection of clouds, Huang et al. (2020) developed a more complicated cloud parameterization scheme and combined this with the clear sky PAR model of Gueymard (1989a) to estimate all-sky PAR. Although the accuracies are both acceptable, there is no corresponding PAR product currently being produced for relevant scientific research.
In the past, a few global PAR products have been developed, such as the global gridded PAR products of the International Satellite Cloud Climatology Project (ISCCP-PL, Pinker and Laszlo, 1992), the Clouds and the Earth's Radiant Energy System (CERES, Su et al., 2007), the Global LAnd Surface Satellite products (GLASS, Zhang et al., 2014), the MODIS (MCD18A2 product, Wang et al., 2020), the Breathing Earth System Simulator (BESS, Ryu et al., 2018), and a product from Hao et al. (2019) based the observations from the Earth Polychromatic Imaging Camera (EPIC) onboard the Deep Space Climate Observatory (DSCOVR, Burt and Smith, 2012); however, these global PAR products are either too coarse in spatial resolution to meet refined analyses, too low in temporal resolution to reflect daily variations, or too short in time series to meet the demand of climate change studies. As a result, a high-resolution long-term global gridded PAR product is urgently needed in the scientific community.
In this study, a high-resolution 35-year global gridded PAR product was developed using an effective physical PAR estimation model, driven mainly by the latest high-resolution ISCCP H-series cloud products, the aerosol product of the Modern-Era Retrospective analysis for Research and Applications, Version 2 (MERRA-2) reanalysis data, and water vapor, surface pressure, and ozone amount products of the ERA5 reanalysis data. We also evaluated the performance of our PAR product using in situ observations measured across three experimental observation networks in the USA and China, and compared its performance with another common global satellite product. The rest of the article is organized as follows. In Sect. 2, we introduce the method used to map the global gridded PAR product. The input data for estimating the global gridded PAR product, and the in situ data for evaluating the performance of our estimated global gridded PAR product are described in Sect. 3. Section 4 presents the validation results of our global gridded PAR product and compares this with the well-known satellite-based global PAR product of CERES. Section 5 describes data availability, and a summary and conclusions are given in Sect. 6.
The algorithm used to map global gridded PAR in this study was the parameterization method developed by Tang et al. (2017), who combined the physical-based clear sky PAR model of Qin et al. (2012) and the parameterization scheme for cloud transmittance of Sun et al. (2012). In calculating the surface PAR, the algorithm takes various attenuation processes in the atmosphere into account, such as absorption of water vapor and ozone, Rayleigh scattering, and absorption and scattering of cloud and aerosol. In addition, the algorithm also considers the multiple reflections between the surface and the atmosphere. The parametric expressions for the PAR algorithm are all converted from the extensive radiative transfer calculations, and thus it is a physical and efficient method that does not require calibration with ground-based observations.
The inputs of the PAR algorithm mainly include aerosol optical depth, cloud optical depth, water vapor, ozone amount, surface albedo, and surface air pressure. Tang et al. (2017) used the developed PAR algorithm to estimate instantaneous PAR using the atmosphere and land products of the Moderate Resolution Imaging Spectroradiometer (MODIS), and the estimated instantaneous PAR was evaluated against in situ observations collected by the SURFRAD network. It was found that this algorithm performs better than previous algorithms and the estimated instantaneous PAR can have a root mean square error (RMSE) of about 40 W m−2. Wang et al. (2021) have compared five representative methods for estimating downward shortwave radiation, and found that the parameterization method performed best among them. This increases our confidence in estimating PAR with the physical parameterization method. Therefore, we expect good performance from our algorithm in mapping global gridded PAR. Interested readers can refer to our earlier article (Tang et al., 2017) for further details.
3.1 Input data
To produce a long-term (from 1984 to 2018) high-resolution global gridded PAR product using the PAR algorithm presented above, we used input data from four different sources.
The first source of input data was the latest level-2 H-series pixel-level global (HXG) cloud products of the ISCCP, here referred to as ISCCP-HXG; these were publicly available, spanned the period July 1983 to December 2018, had a spatial resolution of 10 km, and a temporal resolution of 3 h. The ISCCP-HXG cloud products were produced by a series of cloud-related algorithms based on global gridded two-channel radiance data (visible 0.65 µm and infrared 10.5 µm) merged from different geostationary and polar orbiting meteorological satellites. We must bear in mind that the 3 h ISCCP-HXG cloud products denote instantaneous data at a given moment every 3 h, not a mean of 3 h. We used four variables from the ISCCP-HXG cloud products; these were cloud mask, cloud top temperature, and the optical depths of water cloud or ice cloud retrieved based on the visible radiance. The sky condition (clear or cloudy) of a pixel was distinguished by the cloud mask data, and the cloud phase (liquid or ice) of a cloudy pixel was roughly determined by the cloud top temperature. If the cloud top temperature (TC) of a cloudy pixel was greater than or equal to 253.1 K, it was regarded as water cloud; otherwise, it was classed as ice cloud. For more detailed information on the ISCCP-HXG cloud products, the reader can refer to the cloud products article of Young et al. (2018). The uncertainties in cloud detection and cloud property can be found in the official Climate Algorithm Theoretical Basis Document (C-ATBD, https://www.ncei.noaa.gov/pub/data/sds/cdr/CDRs/Cloud_Properties-ISCCP/AlgorithmDescription_01B-29.pdf, last access: 23 April 2022). The accuracies of these cloud parameters in the latest ISCCP-H series are considered to be more reliable than those of cloud parameters in the previous ISCCP-D series.
The second source of input data was the aerosol product of the MERRA-2 reanalysis data, which can be downloaded from the Goddard Earth Sciences Data and Information Services Center of the National Aeronautics and Space Administration (NASA). MERRA-2 assimilates ground-observed aerosol optical depth (AOD) measured at the AERONET (Holben et al., 1998), and satellite-retrieved AOD from the MODIS Aqua and Terra sensors, MISR sensor, and AVHRR sensor (Randles et al., 2017). The MERRA-2 hourly aerosol product used in this study was called “tavg1_2d_aer_Nx”, having a spatial resolution of 0.5∘ × 0.625∘, a temporal resolution of 1 h, and a time period of 1980 to the present. Two variables of the MERRA-2 aerosol product were used in this study; these were the total AOD at 550 nm and the total aerosol Ångström parameter (470–870 nm). To map the global gridded PAR product with a spatial resolution of 10 km, we resampled the MERRA-2 aerosol product to a spatial resolution of 10 km. Gueymard and Yang (2020) have validated the MERRA-2 AOD product against 793 AERONET stations worldwide, and also compared it with other aerosol products. It was found that the average RMSE for the MERRA-2 AOD at 550 nm was about 0.126, which was generally lower than that of other aerosol products.
The third source of input data was the routine weather variables of the ERA5 reanalysis data, which mainly included total column ozone, total column water vapor, and surface pressure, with a spatial resolution of 25 km and a temporal resolution of 1 h. Total column ozone and total column water vapor were used to calculate the transmittance due to ozone absorption and water vapor absorption, respectively. Surface pressure was used to calculated the Rayleigh scattering in the atmosphere. To maintain consistency with the spatial resolution of the ISCCP-HXG cloud product, these three routine weather variables of the ERA5 reanalysis data were resampled to 10 km.
The fourth source of input data was albedo data from the MODIS MCD43C3 product (Schaaf et al., 2002) and from the Satellite Application Facility on Climate Monitoring (CM-SAF) (CLARA-A2-SAL, Karlsson et al., 2017), to take into account the multiple scattering effect between the land surface and atmosphere on the calculation of PAR. The spatial resolutions of MODIS and CM-SAF were both 5 km, and thus we downscaled them to 10 km. The MODIS albedo product was used after 2000, the date when it first became available, and the CM-SAF albedo product was used before 2000 (when MODIS was unavailable). The use of different albedo products will lead to inconsistent accuracy for the final global gridded PAR product, and thus caution should be exercised when performing trend analyses.
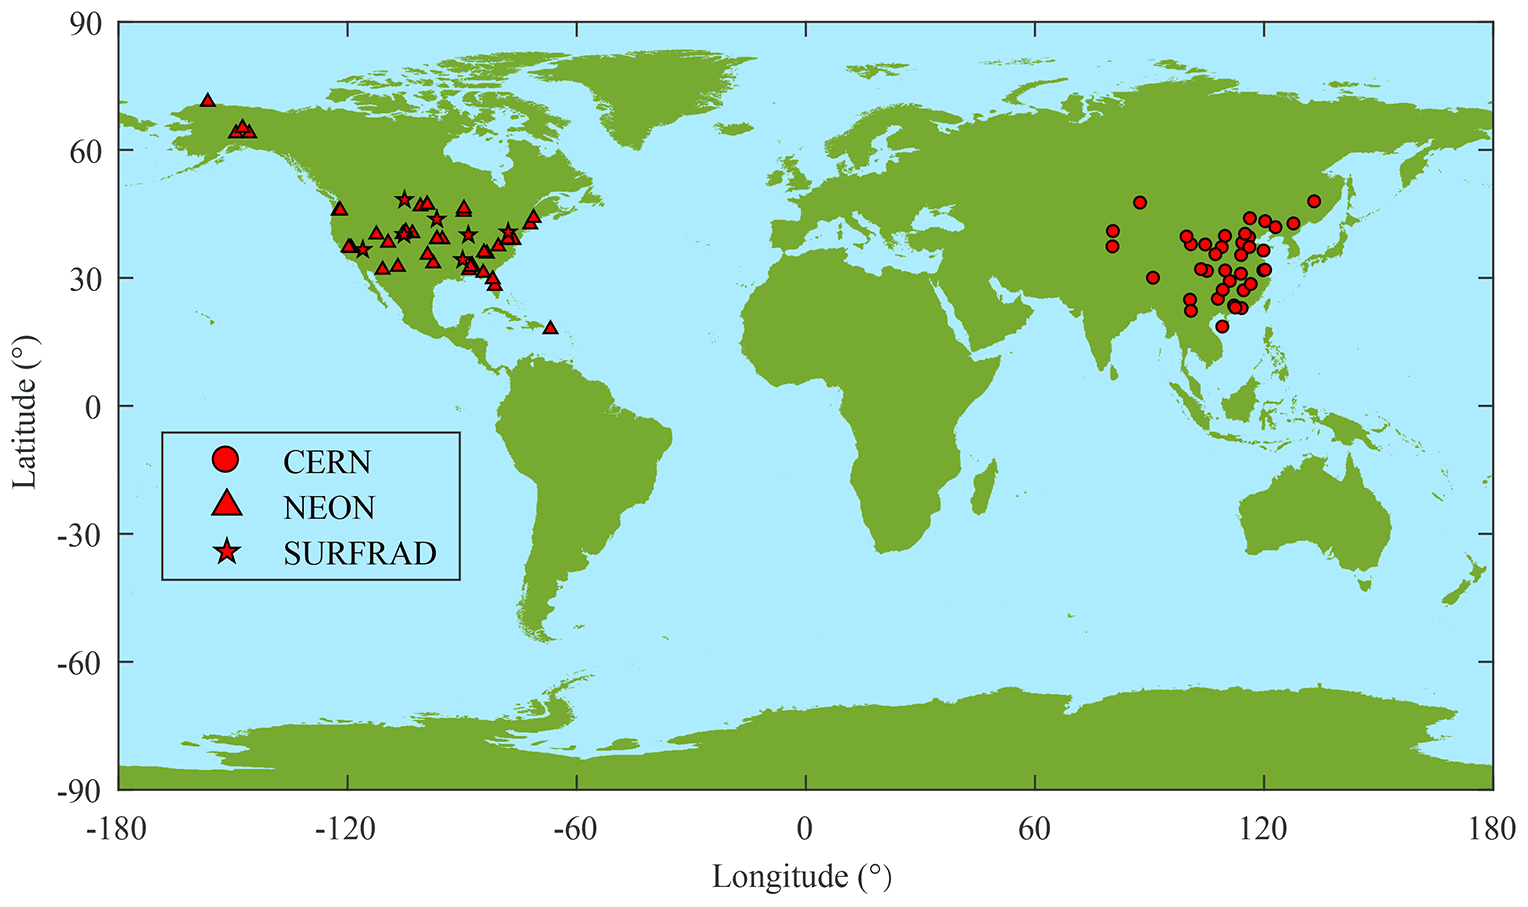
Figure 1Distribution of observation stations within the three observation networks, where measurements of PAR were carried out. The red circles denote the locations of the 38 CERN stations, the red triangles denote the 42 NEON stations, and the red pentagrams denote the 7 SURFRAD stations.
3.2 In situ measurements
In situ PAR measurements collected across three networks from the USA and China were used to validate our global gridded PAR product. The PAR measurements at these networks are all quantified as photosynthetic photo flux density (), and McCree's conversion factor with a value of approximately 4.6 (McCree, 1972) was used to convert the quantum units of PAR into energy units (W m−2) of PAR. The first network used was SURFRAD (Augustine et al., 2000) of the National Oceanic and Atmospheric Administration (NOAA), which contains seven experimental stations (Goodwin Greek, Fort Peek, Bondville, Desert Rock, Sioux Falls, Table Mountain, and Penn State) in different climatic regions (red pentagrams in Fig. 1). LI-COR quantum sensors were used to measure PAR at the SURFRAD network. The standards of instrument calibration for the Baseline Surface Radiation Network (BSRN) were adopted and the quality of radiation data at SURFRAD were considered to be comparable to those of the BSRN. Many previous studies have used SURFRAD radiation data to evaluate their algorithms for estimation of different radiation components. The PAR observations at 1 min temporal resolution from 2009 to 2016 at the 7 SURFRAD stations were used.
The second network used was NEON (Metzger et al., 2019), and 42 terrestrial tower stations (denoted by red triangles in Fig. 1) in the network were used in this study. Generally, measurements of the PAR vertical profile at multiple vertical levels were conducted at each tower station and the tower-top PAR measurements were used to validate our global gridded PAR product. Kipp & Zonen PQS 1 quantum sensors with an uncertainty within 4 % (Blonquist and Johns, 2018) were used to measure PAR across the NEON. The sensors sampled with a frequency of 1 Hz, recorded PAR values every minute, and were calibrated every year. The starting times of PAR observations at the 42 NEON stations are different to each other, and we therefore used PAR observations from the starting time of each site to the end of 2018.
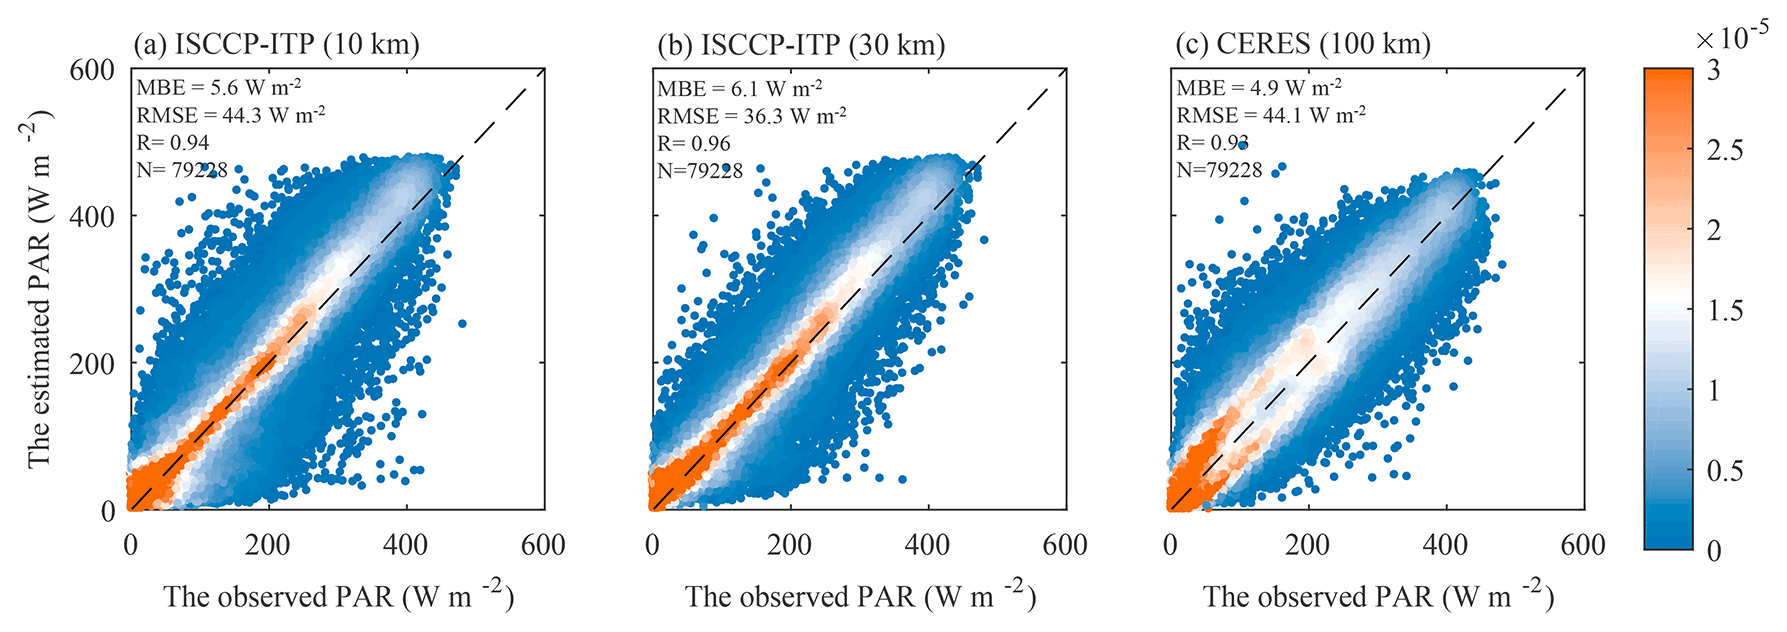
Figure 2Comparisons of our estimated instantaneous PAR product (ISCCP-ITP) at spatial resolutions of (a) 10 km, (b) 30 km, and (c) hourly PAR of the CERES SYN1deg (edition 4.1) with observed PAR collected at seven SURFRAD stations.
The third network used was CERN, and 38 stations (marked with red circles in Fig. 1) across diverse terrestrial ecosystems were used in this study. These 38 CERN stations were distributed across different climatic zones and belonged to 8 different ecosystems: agriculture, forest, desert, marine, grassland, lake, marsh wetland, and urban. LI-190SA quantum sensors with an uncertainty of approximately 5 % (Hu et al., 2007) were used to measure PAR across CERN, and the spectrometer and standard radiative lamp were adopted for centralized calibration and comparison among the quantum sensors. The PAR observations were recorded hourly and thus we only validated our daily PAR product against CERN due to the mismatch between the hourly observed data and the satellite-based instantaneous retrievals. The daily mean PAR datasets from the 38 CERN stations during 2005–2015 were publicly shared by Liu et al. (2017) and used herein. The PAR observations collected at the CERN network were quality controlled by the data sharers and more details about the quality control procedure can be found in the article of Liu et al. (2017).
Based on the above inputs and the physical-based PAR algorithm, we produced a long-term (from 1984 to 2018) high-resolution (10 km spatial resolution and 3 h temporal resolution) global gridded PAR product, here referred to as the ISCCP-ITP PAR product. In situ observations from three networks were used to evaluate the performance of our ISCCP-ITP PAR product at instantaneous and daily scales. In addition, a widely used global gridded PAR product of the CERES (SYN1deg-1hour, edition 4A), with a spatial resolution of 1∘ × 1∘ and a temporal resolution of 1 h, was used to provide a comparison with our ISCCP-ITP PAR product. Here, we directly compared the ground-based observations with the estimated PAR values of the corresponding satellite pixel. The comparison process would introduce some uncertainty in the results. This is also an issue of site representativeness. If a site is representative of the corresponding satellite pixel, then the uncertainty in the validation result is negligible, otherwise the uncertainty is non-negligible. Generally, the representativeness of a site over a flat area can be greater than 25 km for downward shortwave radiation according to Schwarz et al. (2017) and Huang et al. (2019). In this study, most of the experimental stations are over flat areas, and thus the uncertainty in the validation result of this study is negligible. To discuss the influence of spatial resolution on the accuracy of our global gridded PAR product, we also evaluated the estimated PAR at different spatial resolutions from 10 to 110 km. The estimated PAR at spatial resolutions from 30 to 110 km were calculated by averaging the corresponding original PAR at the 10 km scale. Here, the three statistical metrics of mean bias error (MBE), RMSE, and correlation coefficient (R), were used to evaluate the performance of our ISCCP-ITP PAR product and the CERES PAR product.
Table 1Effect of spatial resolution (from 10 to 110 km) on the accuracy of our estimated instantaneous PAR product (ISCCP-ITP) compared to observations at the seven SURFRAD stations.
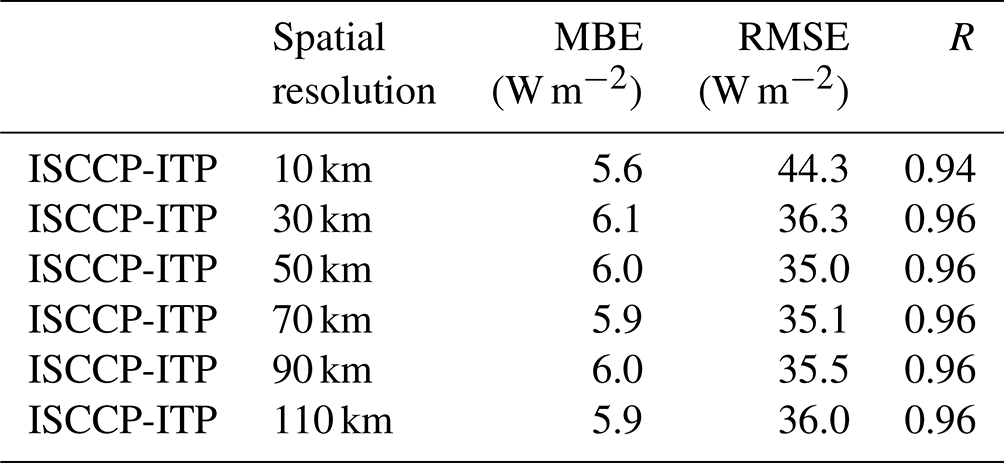
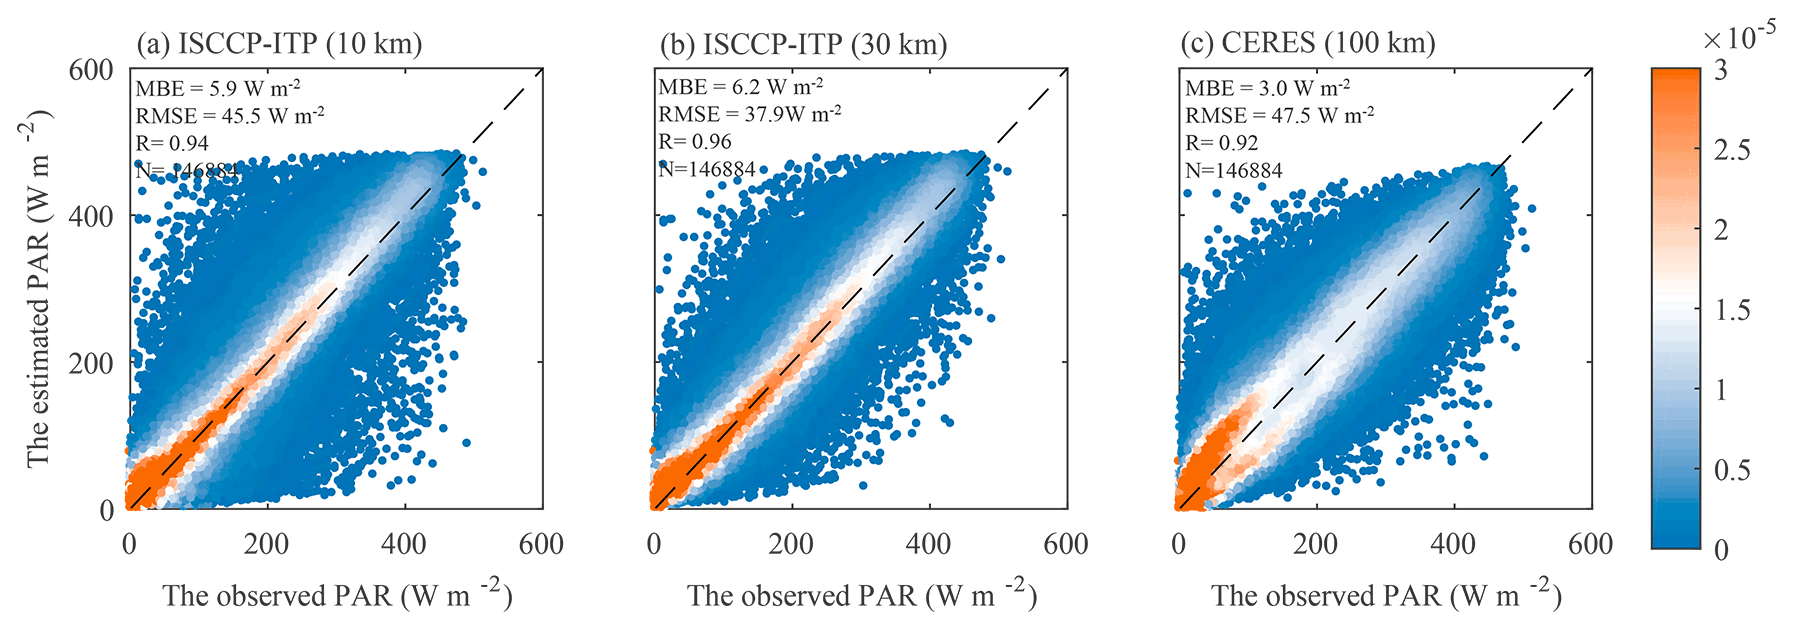
Figure 3Comparisons of our estimated instantaneous PAR product (ISCCP-ITP) at spatial resolutions of (a) 10 km, (b) 30 km, and (c) hourly PAR of the CERES SYN1deg (edition 4.1) with observed PAR collected at 42 NEON stations.
4.1 Validation of instantaneous PAR
In this study, the instantaneous PAR was validated against the observed hourly PAR, which was calculated by averaging the 1 min PAR over the time period of 30 min before and after satellite overpass. Our estimated instantaneous PAR was first validated against in situ data measured at the seven SURFRAD stations. Figure 2 presents the validation results for the instantaneous PAR at spatial resolutions of 10 and 30 km, and the validation result for the CERES hourly PAR with a spatial resolution of approximately 100 km. It can be seen that the accuracy of the instantaneous PAR at 10 km spatial resolution (MBE = 5.6 W m−2, RMSE = 44.3 W m−2, R=0.94) is comparable to that of the CERES hourly PAR at 100 km spatial resolution (MBE = 4.9 W m−2, RMSE = 44.1 W m−2, R=0.93); however, when the instantaneous PAR at 10 km spatial resolution was averaged to 30 km, its accuracy was markedly improved; RMSE decreased from 44.3 to 36.3 W m−2 and R increased from 0.94 to 0.96, and thus its accuracy at 30 km spatial resolution is clearly higher than that of the CERES product.
Table 2Effect of spatial resolution (from 10 to 110 km) on accuracy of our estimated instantaneous PAR product (ISCCP-ITP) compared to observations at the 42 NEON stations.
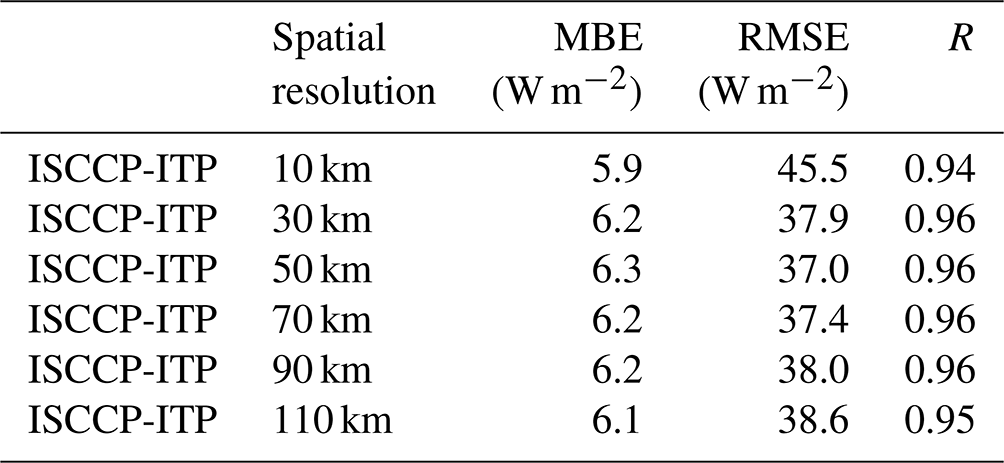
Table 1 shows the accuracies of our estimated instantaneous PAR at different spatial resolutions from 10 to 110 km. It can be seen that the accuracy at the original 10 km spatial resolution was clearly lower than at all other resolutions (30–110 km), and the accuracy was highest at a resolution of 50–70 km. This may be due to two reasons. Firstly, the representativeness of ground-based observational stations may be greater than 10 km. Secondly, there is time mismatch between satellite-based and surface-based observations because the last generation of geostationary meteorological satellites (e.g., the Geostationary Operational Environmental Satellite, GOES) require approximately half an hour to complete a disk scan. Spatially averaging the instantaneous PAR to a larger area could partially eliminate this time mismatch.
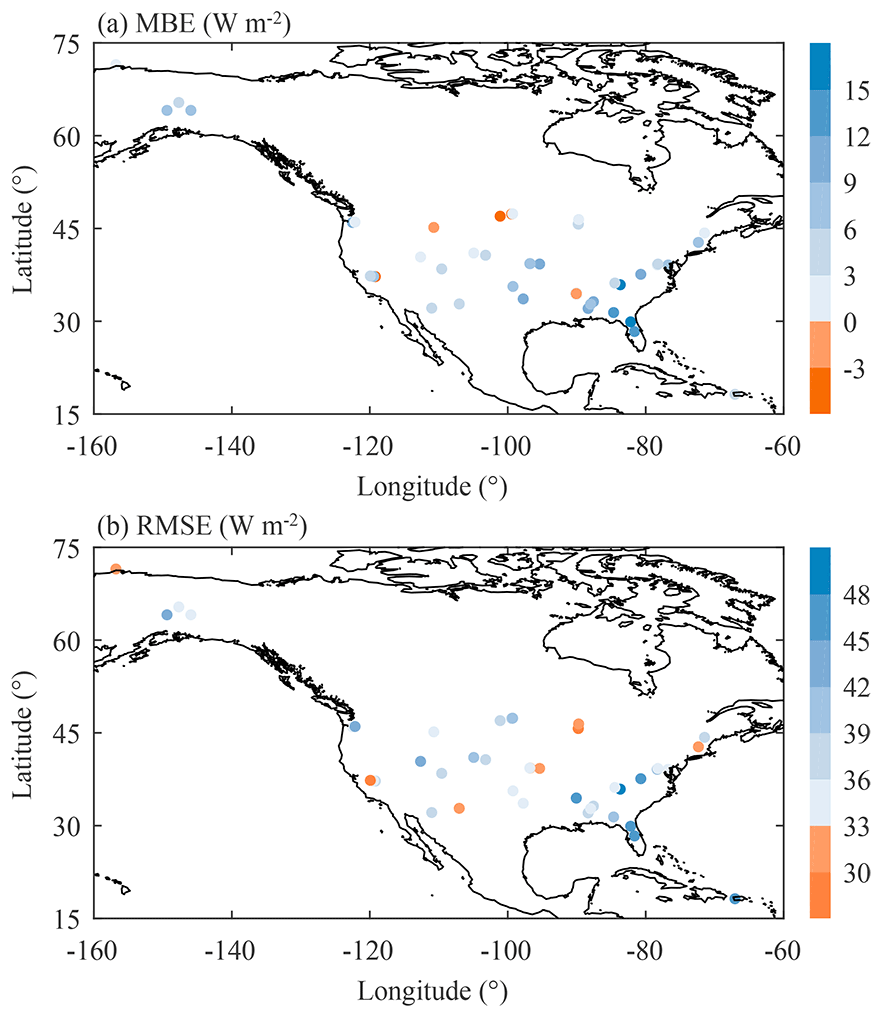
Figure 4Spatial distribution of (a) MBE (W m−2) and (b) RMSE (W m−2) for our estimated instantaneous PAR product (ISCCP-ITP, 30 km) at 7 SURFRAD stations and 42 NEON stations.
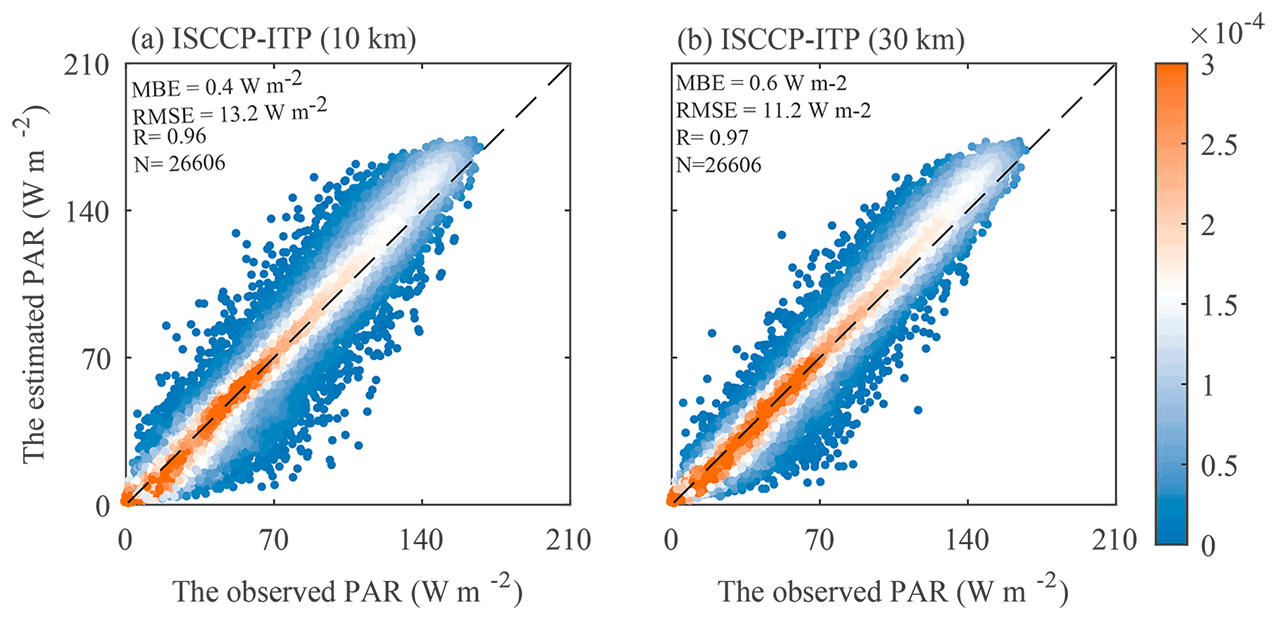
Figure 5Comparisons of our estimated daily PAR product (ISCCP-ITP) at spatial resolutions of (a) 10 km and (b) 30 km with observed PAR collected at 7 SURFRAD stations.
The instantaneous PAR was also evaluated against the 42 NEON stations (Fig. 3 and Table 2). The performance against NEON was slightly worse than that against SURFRAD. At the 10 km scale, the former produced a 1.2 W m−2 larger RMSE than the latter, and both produced a positive MBE of approximately 6 W m−2 and an R of 0.94. Similar to the situation at SURFRAD, the accuracy at NEON was markedly improved at 30 km spatial resolution, reached a peak at 50 km resolution, and then started to decrease slightly at 70 km resolution. Compared to the performance of the CERES hourly PAR at NEON, the accuracy of our estimated instantaneous PAR was higher at all scales from 10 to 110 km. More importantly, the spatial resolution of our PAR product (10 km) is much finer than that of the CERES PAR product (100 km).
Table 3Effect of spatial resolution (from 10 to 110 km) on accuracy of our estimated daily PAR product (ISCCP-ITP) compared to observations at the seven SURFRAD stations.
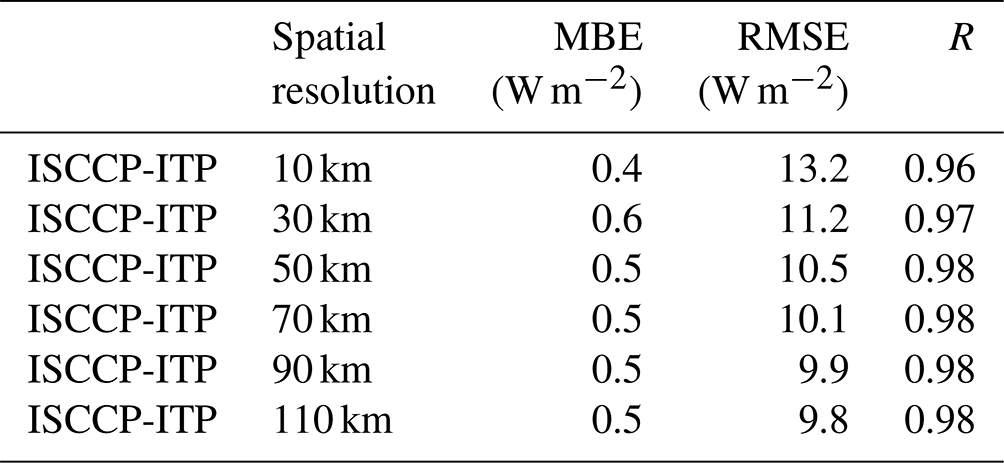
Table 4Effect of spatial resolution (from 10 to 110 km) on accuracy of our estimated daily PAR product (ISCCP-ITP) compared to observations at the 42 NEON stations.

Due to the significant improvement when our estimated PAR was upscaled to 30 km spatial resolution, we used a 3×3 spatial window to smooth the raw PAR to derive our final global gridded PAR product. Thus, we here present the spatial distributions of MBE and RMSE (Fig. 4) for our estimated PAR with a spatial resolution of 30 km across 7 SURFRAD and 42 NEON stations in the USA. The MBE values range from −11.2 to 19.8 W m−2, with a negative MBE at 5 of the 49 stations. From an MBE point of view, 42 stations fall into the range −10–10 W m−2, and among these 22 stations fall within −5–5 W m−2. The RMSE values range from 24.2 to 52.3 W m−2, with RMSE ≤35 W m−2 at 18 stations, RMSE between 35 and 40 W m−2 at 19 stations, RMSE between 40 and 50 W m−2 at 12 stations, and RMSE >50 W m−2 at only 1 station. The largest MBE and RMSE both occur at the Great Smoky Mountains National Park (GRSM) station, which is situated in the mountains of southeastern Tennessee. Similar large errors at this station were also found for the CERES PAR product. The relatively large errors at this station could be caused by the poor representativeness of the mountain observational station.
4.2 Validation of daily PAR
Our estimated daily PAR (ISCCP-ITP) was derived by averaging the instantaneous PAR of eight moments in the day, and validated against the three networks of SURFRAD, NEON, and CERN. Similar to the validation results for the instantaneous PAR, the performance of our estimated daily PAR at 10 km spatial resolution was comparable to that of the CERES product at SURFRAD and NEON, and when upscaled to ≥30 km, our daily PAR product performed slightly better than that of CERES. Therefore, here we do not give validation results for the CERES daily PAR at SURFRAD and NEON, but only give validation results for the CERES daily PAR at CERN.
Validation results for our estimated daily PAR against in situ data collected at SURFRAD are shown in Fig. 5 and Table 3. The MBE, RMSE, and R values were 0.4 W m−2, 13.2 W m−2, and 0.96, respectively, for daily PAR at 10 km spatial resolution. When upscaled to 30 km spatial resolution, these statistical metrics changed to 0.6 W m−2, 11.2 W m−2, and 0.97, respectively. When upscaled to ≥50 km, the RMSE gradually decreased to approximately 10 W m−2. The MBE and R changed to 0.5 W m−2 and 0.98, respectively.
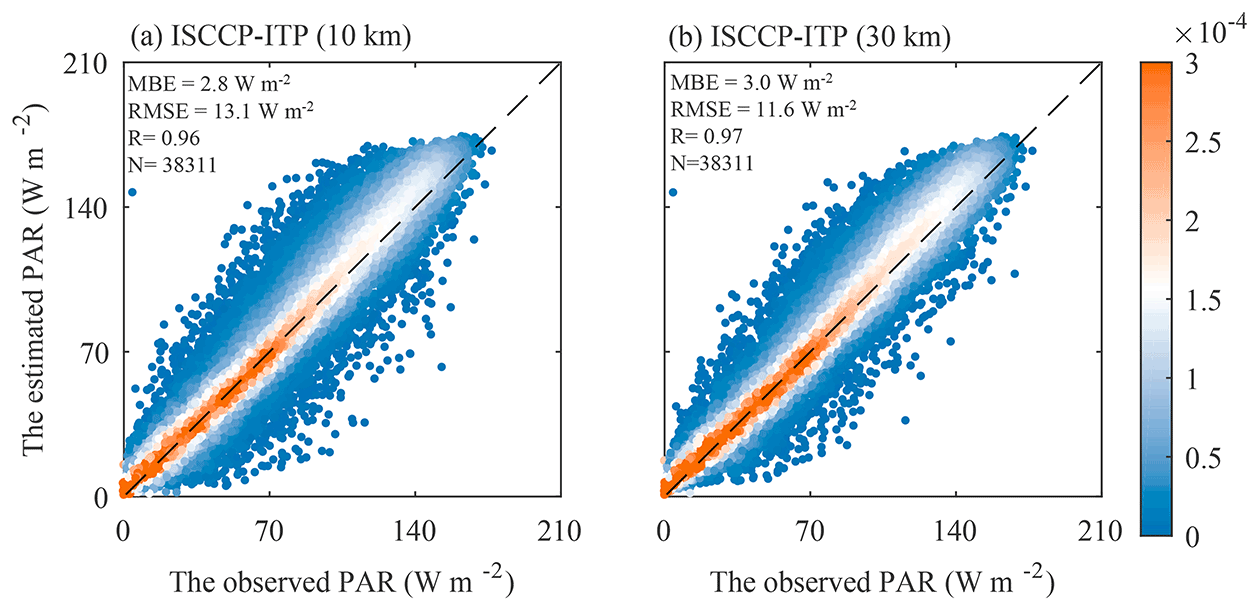
Figure 6Comparisons of our estimated daily PAR product (ISCCP-ITP) at spatial resolutions of (a) 10 km and (b) 30 km with observed PAR collected at 42 NEON stations.
Validation results for our estimated daily PAR against NEON are shown in Fig. 6 and Table 4. The RMSE for daily PAR at 10 km spatial resolution was 13.1 W m−2, and this value decreased to 11.6 W m−2 for 30 km spatial resolution. The R for daily PAR was 0.96 and 0.97 for 10 and 30 km spatial resolution, respectively. When upscaled to ≥50 km, these statistical metrics remained almost unchanged. The performance against NEON is comparable to that against SURFRAD for our daily PAR product.
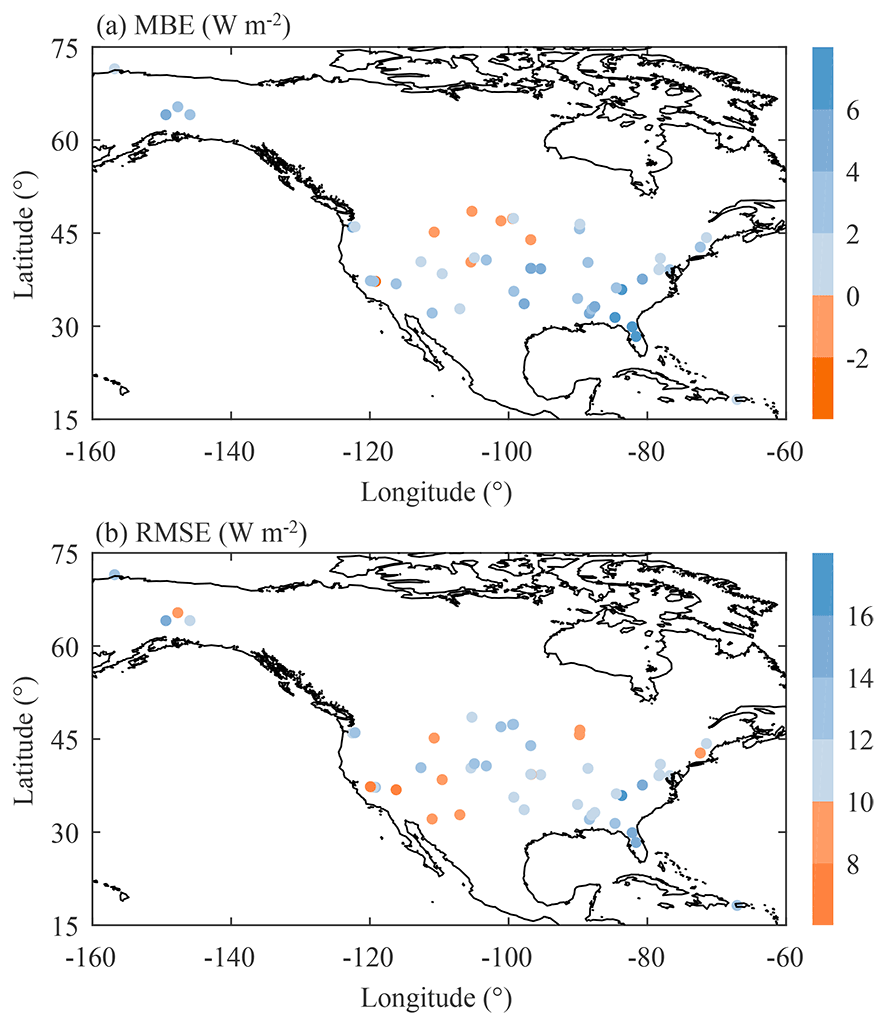
Figure 7Same as Fig. 4, but for our estimated daily PAR product (ISCCP-ITP, 30 km).
Figure 7 shows the spatial distributions of MBE and RMSE for our estimated daily PAR with a spatial resolution of 30 km against 7 SURFRAD and 42 NEON stations in the USA. The largest negative and positive MBE values were −5.3 and 9.3 W m−2, respectively. There were 7 stations with MBE <0 W m−2, 41 stations with MBE values between −5 and 5 W m−2, 31 stations with MBE values between −3 and 3 W m−2, and only 8 stations with absolute MBE >5 W m−2. The largest and smallest RMSE values were 17.6 and 6.9 W m−2, respectively. There were 12 stations with RMSE <10 W m−2, 19 stations with RMSE between 10 and 12 W m−2, 12 stations with RMSE between 12 and 13 W m−2, and only 6 stations with RMSE >13 W m−2. Likewise, the largest MBE and RMSE values were found at the GRSM station with the main reason again likely being due to the poor representativeness of this station.
Table 5Effect of spatial resolution (from 10 to 110 km) on accuracy of our estimated daily PAR product (ISCCP-ITP) compared to observations at the 38 CERN stations.
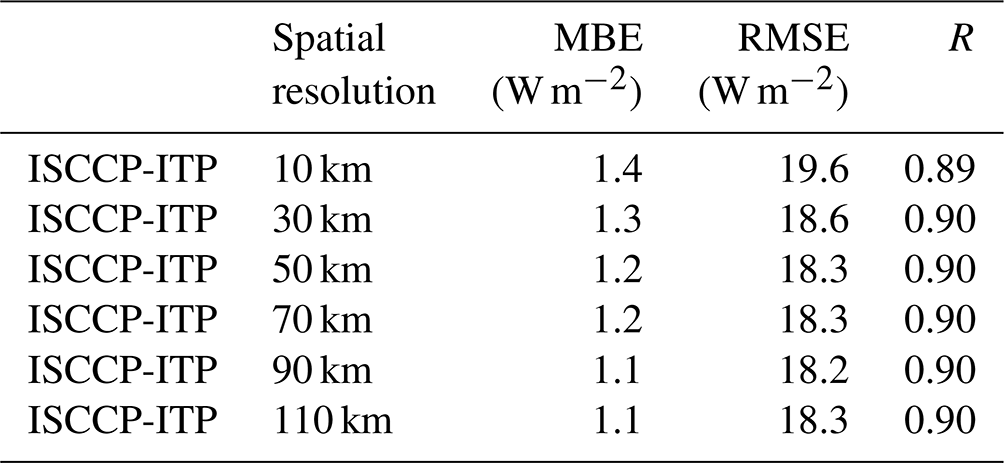
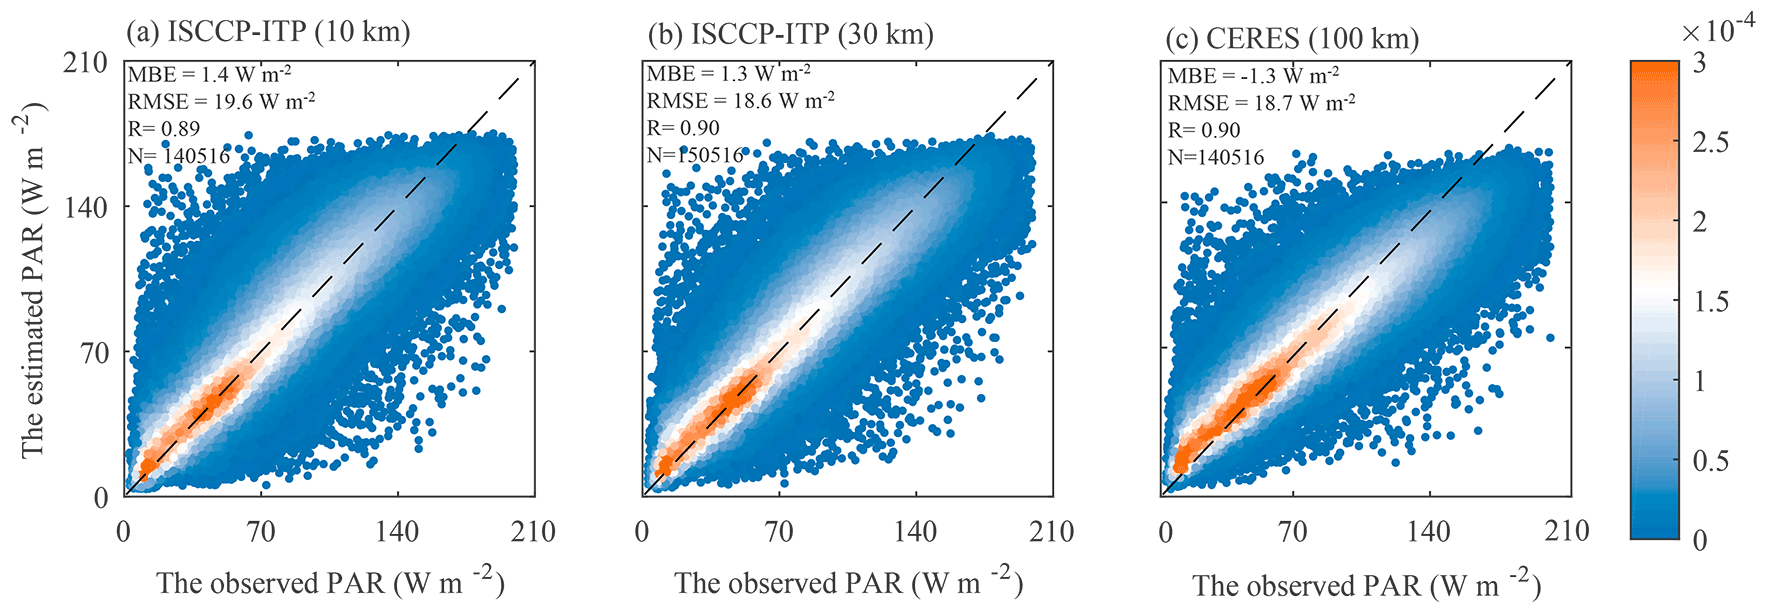
Figure 8Comparisons of our estimated daily PAR product (ISCCP-ITP) at spatial resolutions of (a) 10 km, (b) 30 km, and (c) daily PAR of the CERES SYN1deg (edition 4.1) with observed PAR collected at 38 CERN stations.
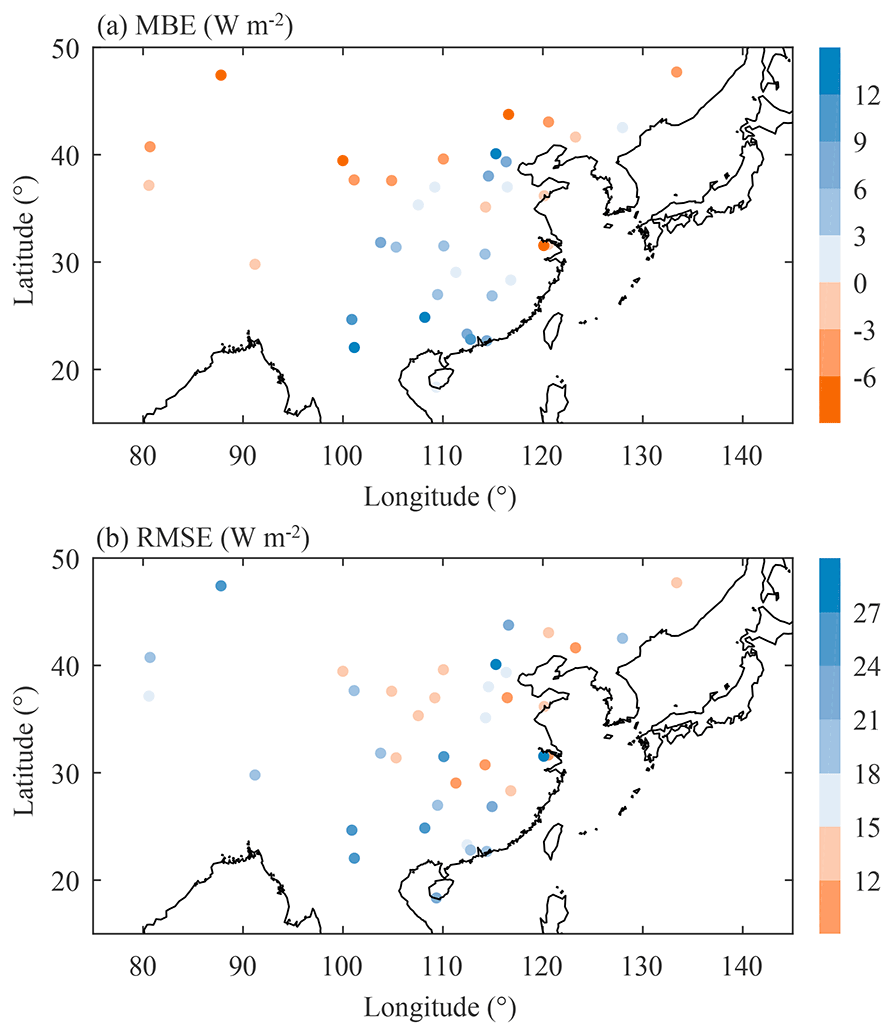
Figure 9Spatial distribution of (a) MBE (W m−2) and (b) RMSE (W m−2) for our estimated daily PAR product (ISCCP-ITP, 30 km) at 38 CERN stations.
Finally, we validated our daily PAR and the CERES daily PAR products against in situ data collected across CERN (Fig. 8, Table 5). The performance of our daily PAR product at the 10 km scale (MBE = 1.4 W m−2, RMSE = 19.6 W m−2, R=0.89) was slightly worse than that of the CERES daily PAR product (MBE W m−2, RMSE = 18.7 W m−2, R=0.90); however, when upscaled to ≥30 km, the accuracies of our estimated daily PAR were comparable to, or slightly better than, those of the CERES daily PAR. Another phenomenon we noticed was that the RMSEs for CERN data were approximately 7–8 W m−2 greater than those for SURFRAD and NEON data for both our daily PAR and the CERES PAR products. This could be attributed to the fact that the quality of PAR observations at CERN is slightly worse than that at SURFRAD and NEON, but further evidence is required to support this speculation. Another possible reason could be the effect of aerosols because aerosols are a major attenuation factor affecting the clear sky PAR (Qin et al., 2012; Tang et al., 2013). Because the aerosol optical depth (AOD) over China is much greater than that over the USA (Li et al., 2011), greater uncertainty in the aerosol data over China would lead to larger errors in PAR estimation over China.
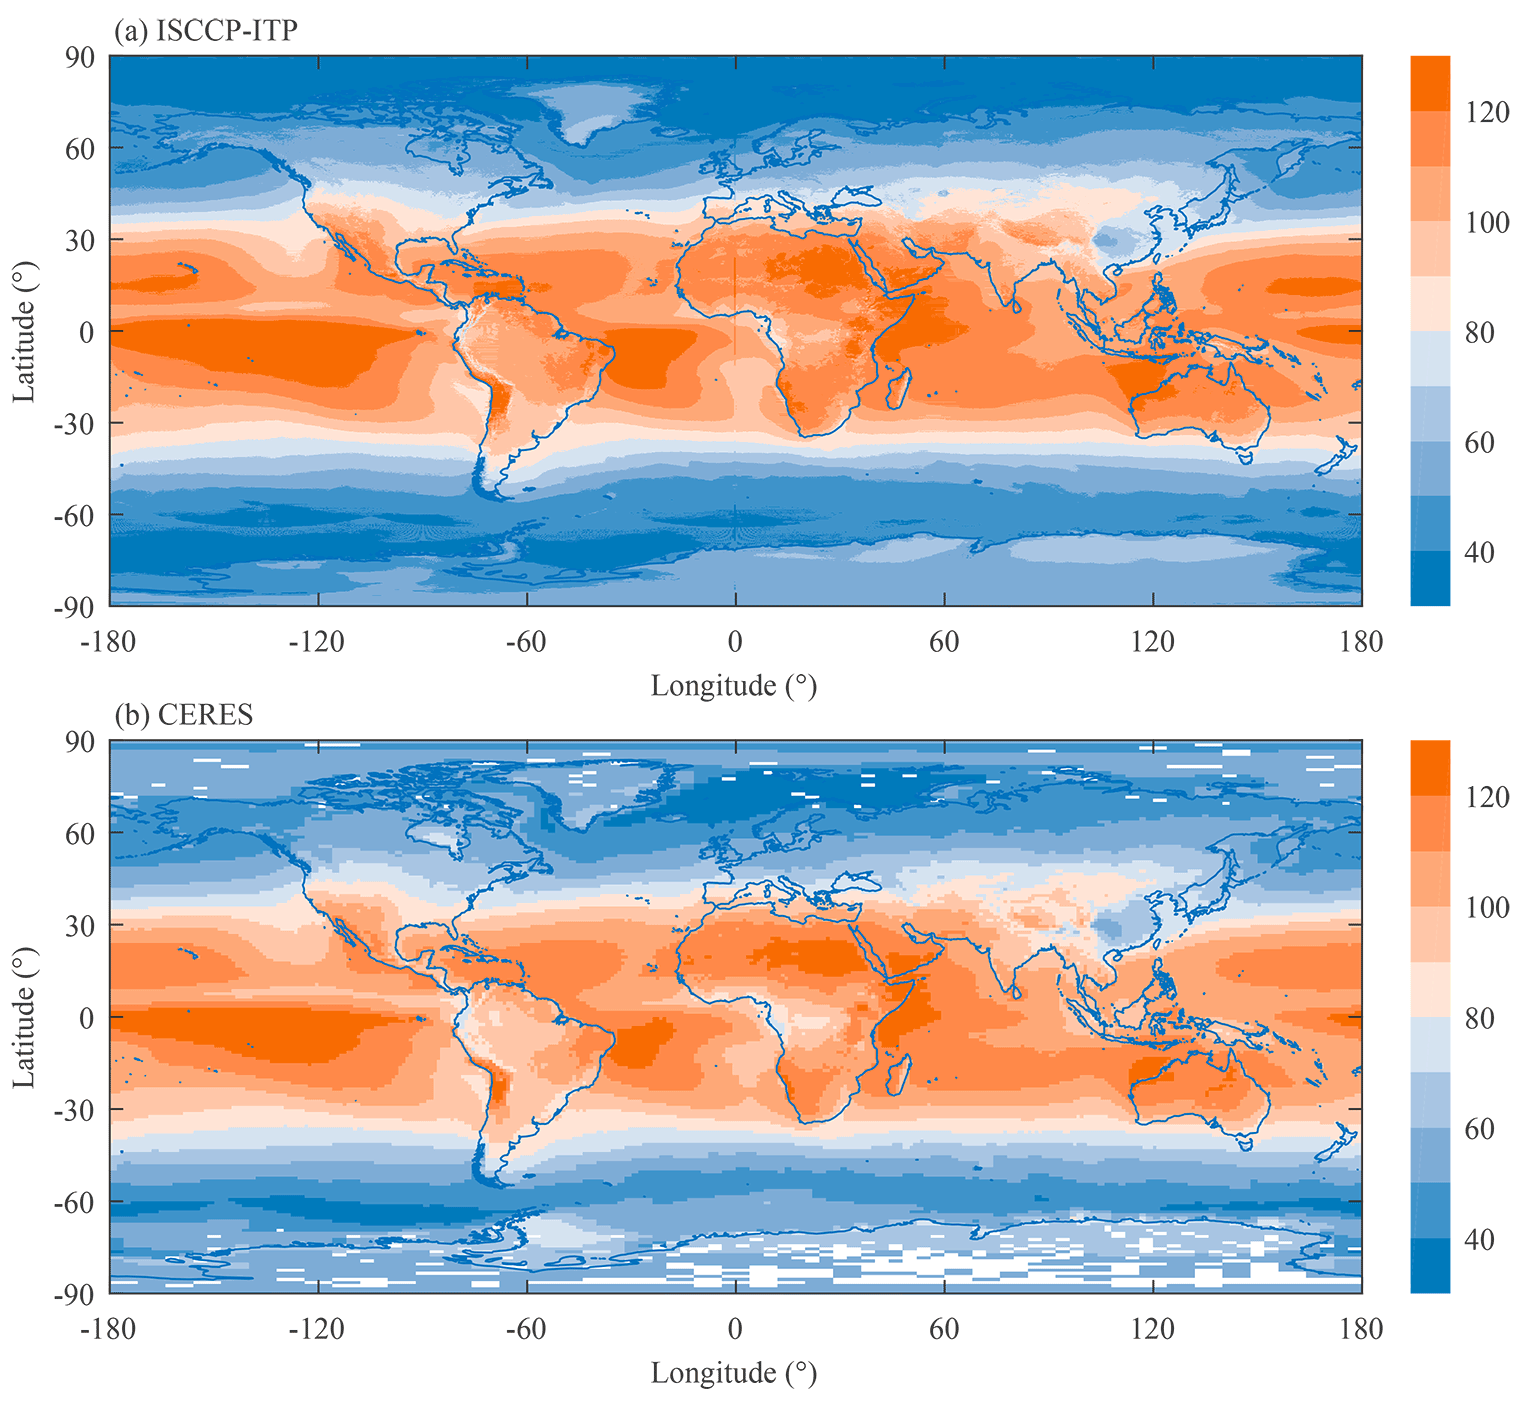
Figure 10Spatial distribution of annual mean PAR between 2001 and 2018, derived from (a) our estimated PAR product (ISCCP-ITP), and (b) the CERES PAR product. The unit of PAR is W m−2.
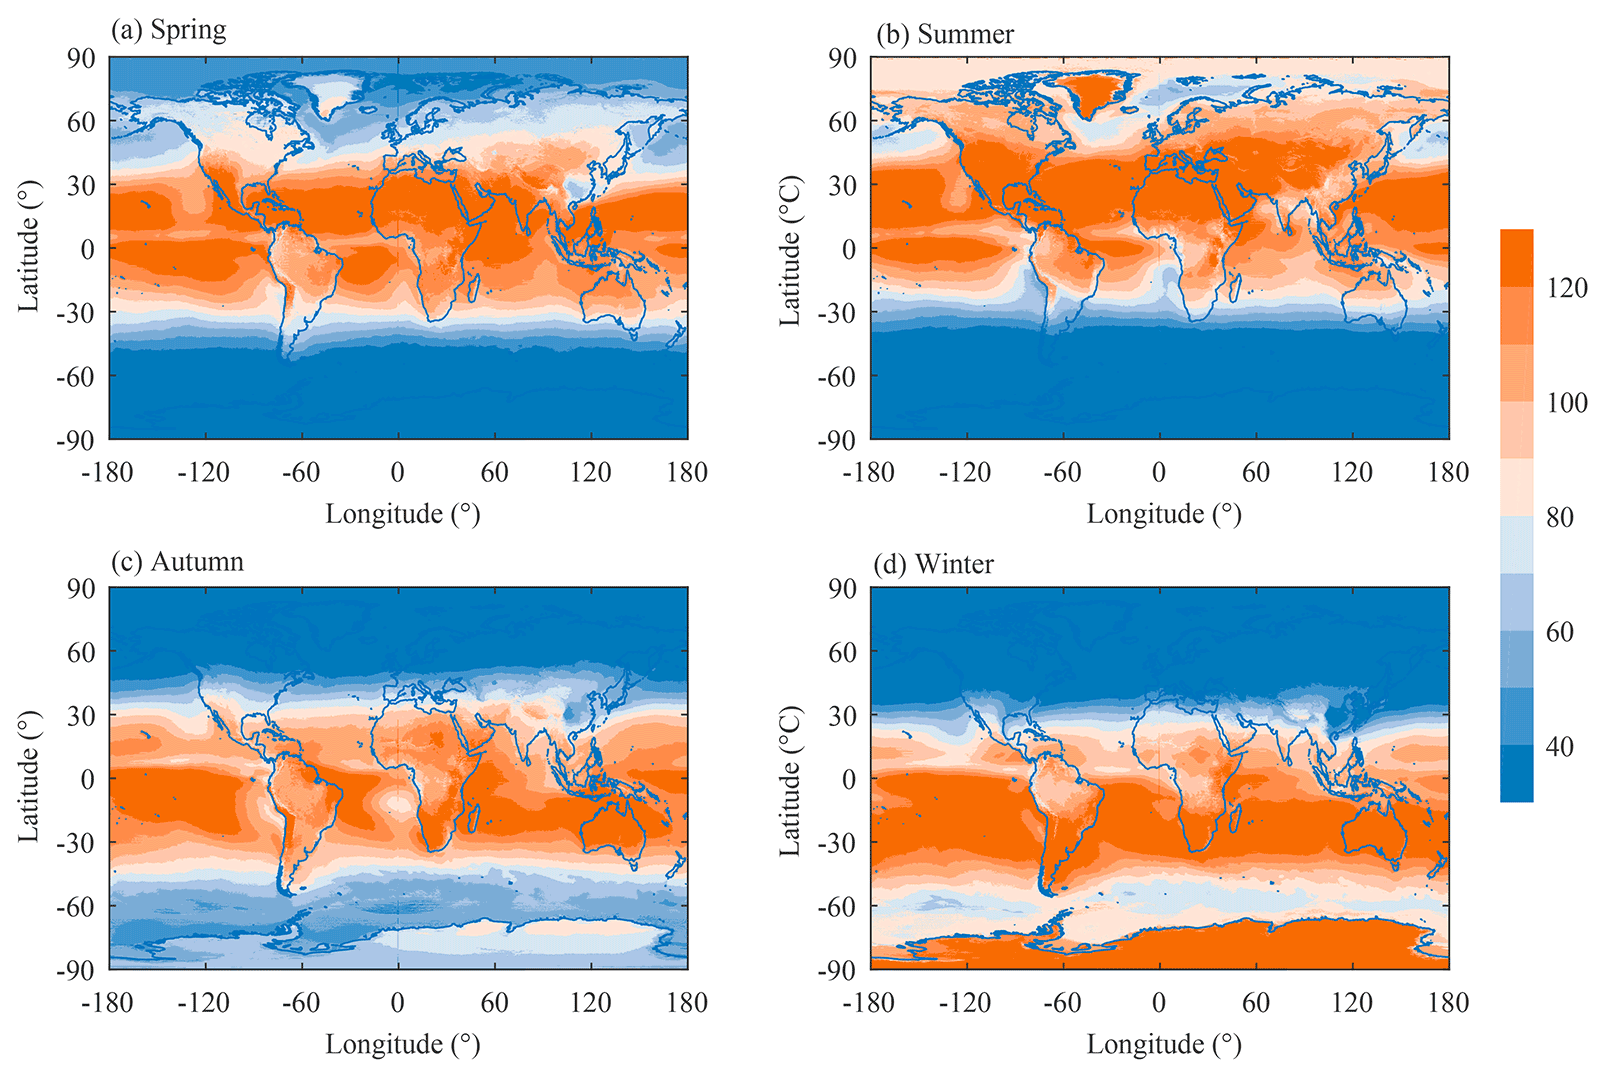
Figure 11Spatial distribution of seasonal mean PAR between 2001 and 2018 derived from our estimated PAR product (ISCCP-ITP). The unit of PAR is W m−2.
Figure 9 presents the spatial distributions of MBE and RMSE for our estimated daily PAR with a spatial resolution of 30 km against the 38 CERN stations. The MBE values at most of the stations were between −10 and 10 W m−2. The stations with negative MBE were mainly located in northwestern China, and the stations with positive MBE were mainly located in southeastern China. The RMSE values at most of the stations were <23 W m−2, and there were only 5 stations where the RMSE was >25 W m−2. Stations with an absolute MBE >10 W m−2 were mainly located in four forested areas (Beijing, Xishuangbanna, Heshan, and Ailao Mountain), one agricultural area (Huanjiang), one lake area (Taihu), and one desert area (Fukang). Likewise, the RMSE values at these seven stations were relatively large. Similar large errors at these stations were also found for the CERES PAR product. The large errors at these stations could be caused by the poor representativeness at some mountain stations, large uncertainty in the inputs at some stations, or uncertainty in observational data.
4.3 Spatial distribution of multi-year average PAR
Figure 10 shows the global spatial distribution of multi-year annual average PAR (ISCCP-ITP) during the period 2001–2018, and comparison with that of the CERES PAR is also shown. The spatial pattern of our ISCCP-ITP PAR product is quite consistent with that of the CERES PAR product, whose spatial resolution was far coarser than that of our PAR product. There were some finer patterns that the CERES PAR product could not distinguish, but our PAR product could clearly capture. This defect in the CERES PAR product was especially evident in mountainous areas, such as the Tibetan Plateau. The annual average PAR was generally high in latitudinal zones lying between 30∘ N and 30∘ S, and low in other regions. In addition, there were some high-altitude regions with high PAR values, such as the Tibetan Plateau and Bolivian Plateau.
Figure 11 displays the global spatial distributions of multi-year seasonal average PAR (ISCCP-ITP) during the period 2001–2018. The four panels in the figure reflect the process of seasonal change and exhibit different spatial distribution characteristics. Compared to mid-latitude and high-latitude areas, more PAR was received around the Equator and low latitudes (30∘ N–30∘ S) in all four seasons. Over the latitudinal zone between 30 and 90∘ S in the Southern Hemisphere, PAR received by the surface gradually increased from spring to winter, with the lowest values in spring and summer, a relatively larger value in autumn, and the largest value in winter. Over the latitudinal zone between 30 and 90∘ N in the Northern Hemisphere, the situation was very different. PAR received by the surface was largest in summer, lowest in autumn and winter, and intermediate in spring.
Our long-term global gridded PAR product is available at the National Tibetan Plateau Data Center (https://doi.org/10.11888/RemoteSen.tpdc.271909, Tang, 2021), Institute of Tibetan Plateau Research, Chinese Academy of Sciences.
A long-term (1984–2018) global high-resolution (10 km spatial resolution, 3 h temporal resolution) gridded PAR product was produced using our previously published physical-based PAR parametrization scheme. The main inputs for this PAR model were the latest ISCCP H-series cloud product, ERA5 routine meteorological data (water vapor, surface pressure, and ozone), MERRA-2 aerosol product, and albedo products from MODIS (after 2000) and CLARRA-2 (before 2000). The generated PAR product was validated globally against in situ data measured across three observational networks in the USA and China. For the instantaneous PAR at original the scale (10 km), the overall MBE, RMSE, and R were 5.8 W m−2, 44.9 W m−2 and 0.94, respectively. When smoothed to ≥30 km, the accuracy was markedly improved, with RMSE decreasing to 37.1 W m−2 and R increasing to 0.96. For the daily PAR at spatial resolutions of 10 and 30 km, the RMSE values were approximately 13.1 and 11.4 W m−2, respectively, in the USA. Validation results in China showed a greater RMSE than in the USA. Due to the marked improvement when our PAR products were upscaled to ≥30 km, we applied a 3×3 spatial smoothing window to the original PAR data to produce the final PAR product.
Our estimated PAR product was also compared with the CERES PAR product; we found that the accuracy of our estimated PAR product at the original scale (10 km) was generally comparable to, or higher than, that of the CERES PAR product. When it was upscaled to ≥30 km, the accuracy advantage of our product over the CERES PAR product became more evident. Another clear advantage of our PAR product was the increased spatial resolution it offered compared to the CERES PAR product. We expect that our PAR product will contribute to the future understanding and modeling of the global carbon cycle and ecological processes. In future work, we will attempt to separate the components of direct and diffuse PAR from the total PAR because light use efficiency is mainly controlled by diffuse PAR.
All authors discussed the results and contributed to the paper. WT calculated the dataset, analyzed the results, and drafted the paper.
The contact author has declared that neither they nor their co-authors have any competing interests.
Publisher's note: Copernicus Publications remains neutral with regard to jurisdictional claims in published maps and institutional affiliations.
The in situ observations of PAR at CERN were shared by Liu et al. (2017) and are available online via http://www.sciencedb.cn/dataSet/handle/326 (last access: 23 April 2022). The observed PAR data at SURFRAD and NEON are available online from their official websites (https://www.esrl.noaa.gov/gmd/grad/surfrad/, last access: 23 April 2022, and http://data.neonscience.org, last access: 23 April 2022). The ISCCP H-series cloud products were provided by the NOAA's National Centers for Environmental Information (NCEI). The ERA5 routine weather data, MODIS albedo data, and MERRA-2 aerosol data are available from their official websites (https://www.ecmwf.int, last access: 23 April 2022; https://ladsweb.modaps.eosdis.nasa.gov, last access: 23 April 2022, and https://gmao.gsfc.nasa.gov/reanalysis/MERRA-2/, last access: 23 April 2022). The authors would like to thank the staff members at these observational networks and data production centers for their valuable work.
This research has been supported by the National Key Research and Development Program of China (grant no. 2017YFA0603604) and the National Natural Science Foundation of China (grant no. 42171360).
This paper was edited by Qingxiang Li and reviewed by two anonymous referees.
Alados, I., Foyo-Moreno, I., and Alados-Arboledas, L.: Photosynthetically active radiation: measurements and modelling, Agric. For. Meteorol., 78, 121–131, https://doi.org/10.1016/0168-1923(95)02245-7, 1996.
Augustine, J. A., DeLuisi, J. J., and Long, C. N.: SURFRAD – A national surface radiation budget network for atmospheric research, B. Am. Meteorol. Soc., 81, 2341–2357, https://doi.org/10.1175/1520-0477(2000)081<2341:SANSRB>2.3.CO;2, 2000.
Blonquist, M. and Johns, J.: Accurate PAR Measurement: Comparison of Eight Quantum Sensor Models, https://www.apogeeinstruments.com/content/Comparison-of-Eight-Quantum-Sensor-Models.pdf (last access: 23 April 2022), 2018.
Burt, J. and Smith, B.: Deep space climate observatory: the DSCOVR mission, IEEE Aerosp. Conf. Proc., https://doi.org/10.1109/AERO.2012.6187025, 2012.
Frouin, R., Ramon, D., Boss, E., Jolivet, D., Compi`egne, M., Tan, J., Bouman, H., Jackson, T., Franz, B., Platt, T., and Sathyendranath, S.: Satellite radiation products for ocean biology and biogeochemistry: needs, state-of-the-art, gaps, development priorities, and opportunities, Front. Mar. Sci., 5, 1–20, https://doi.org/10.3389/fmars.2018.00003, 2018.
Gueymard, C.: An atmospheric transmittance model for the calculation of the clear sky beam, diffuse and global photosynthetically active radiation, Agric. For. Meteorol., 45, 215–229, https://doi.org/10.1016/0168-1923(89)90045-2, 1989a.
Gueymard, C.: A two-band model for the calculation of clear sky solar irradiance, illuminance, and photosynthetically active radiation at the earth's surface, Sol. Energy, 43, 253–265, https://doi.org/10.1016/0038-092X(89)90113-8, 1989b.
Gueymard, C. A.: REST2: High-performance solar radiation model for cloudless-sky irradiance, illuminance, and photosynthetically active radiation–Validation with a benchmark dataset, Sol. Energy, 82, 272–285, https://doi.org/10.1016/j.solener.2007.04.008, 2008.
Gueymard, C. A. and Yang, D.: Worldwide validation of CAMS and MERRA-2 reanalysis aerosol optical depth products using 15 years of AERONET observations, Atmos. Environ., 225, 117216, https://doi.org/10.1016/j.atmosenv.2019.117216, 2020.
Hao, D., Asrar, G. R., Zeng, Y., Zhu, Q., Wen, J., Xiao, Q., and Chen, M.: Estimating hourly land surface downward shortwave and photosynthetically active radiation from DSCOVR/EPIC observations, Remote Sens. Environ., 232, 111320, https://doi.org/10.1016/j.rse.2019.111320, 2019.
Holben, B. N., Eck, T. F., Slutsker, I., Tanre, D., Buis, J. P., Setzer, A., Vermote, E., Reagan, J. A., Kaufman, Y. J., Nakajima, T., Lavenu, F., Jankowiak, I., and Smirnov, A.: AERONET – a federated instrument network and data archive for aerosol characterization, Remote Sens. Environ., 66, 1–16, https://doi.org/10.1016/S0034-4257(98)00031-5, 1998.
Hu, B., Wang, Y., and Liu, G.: Spatiotemporal characteristics of photosynthetically active radiation in China, J. Geophys. Res., 112, D14106, https://doi.org/10.1029/2006JD007965, 2007.
Hu, B., Wang, Y., and Liu, G.: Long-term trends in photosynthetically active radiation in Beijing, Adv. Atmos. Sci., 27, 1380–1388, https://doi.org/10.1007/s00376-010-9204-2, 2010.
Hu, B. and Wang, Y.: Comparison of multi-empirical estimation models of photosynthetically active radiation under all sky conditions in Northeast China, Theor. Appl. Climatol., 116, 119–129, https://doi.org/10.1007/s00704-013-0941-x, 2014.
Huang, G., Li, Z., Li, X., Liang, S., Yang, K., Wang, D., and Zhang, Y.: Estimating surface solar irradiance from satellites: Past, present, and future perspectives, Remote Sens. Environ., 233, 111371, https://doi.org/10.1016/j.rse.2019.111371, 2019.
Huang, G. H., Li, X., Ma, M. G., Li, H. Y., and Huang, C. L.: High resolution surface radiation products for studies of regional energy, hydrologic and ecological processes over Heihe river basin, northwest China, Agric. Forest Meteor., 230, 67–78, 2016.
Huang, G. H., Li, X., Lu, N., Wang, X., and He, T.: A General Parameterization Scheme for the Estimation of Incident Photosynthetically Active Radiation under Cloudy Skies, IEEE T. Geosci. Remote, 58, 6255–6265, 2020.
Karlsson, K.-G., Anttila, K., Trentmann, J., Stengel, M., Meirink, J. F., Devasthale, A., Hanschmann, T., Kothe, S., Jääskeläinen, E., Sedlar, J., Benas, N., van Zadelhoff, G.-J., Schlundt, C., Stein, D., Finkensieper, S., Håkansson, N., Hollmann, R., Fuchs, P., and Werscheck, M.: CLARA-A2: CM SAF cLoud, Albedo and surface RAdiation dataset from AVHRR data – Edition 2, Satellite Application Facility on Climate Monitoring, https://doi.org/10.5676/EUM_SAF_CM/CLARA_AVHRR/V002, 2017.
Li, Z., Li, C., Chen, H., Tsay, S.-C., Holben, B., Huang, J., Li, B., Maring, H., Qian, Y., and Shi, G.: East Asian Studies of Tropospheric Aerosols and their Impact on Regional Climate (EAST-AIRC): An overview, J. Geophys. Res., 116, D00K34, https://doi.org/10.1029/2010JD015257, 2011.
Liang, S., Zheng, T., Liu, R. G., Fang, H. L., Tsay, S. C., and Running, S.: Estimation of incident photosynthetically active radiation from Moderate Resolution Imaging Spectrometer data, J. Geophys. Res., 111, D15208, https://doi.org/10.1029/2005JD006730, 2006.
Liu, H., Tang, L., Hu, B., Liu, G., Wang, Y., Bai, F., Chen, Y., Cheng, Y., Du, J., Du, M., Gao, M., Gao, X., Gao, Y., Guan, Y., Guo, Y., Han, J., Han, J., He, Q., Jiang, J., Jiang, Z., Li, G., Li, M., Li, X., Li, Y., Lin, J., Liu, W., Liu, Y., Lou, J., Meng, Z., Qiao, T., Song, X., Sun, D., Sun, W., Wang, K., Wang, K., Wu, C., Xu, H., Xu, W., Yin, C., Zhang, F., Zhang, X., Zhao, Y., Zhu, G., and Zhu, Y.: CERN photosynthetically active radiation dataset from 2005 to 2015, China Sci. Data, 2017, 2, 1–10, https://doi.org/10.11922/csdata.170.2016.0100, 2017.
McCree, K. J.: Test of current definitions of photosynthetically active radiation against leaf photosynthesis data, Agric. Meteorol., 10, 443–453, https://doi.org/10.1016/0002-1571(72)90045-3, 1972.
Metzger, S., Ayres, E., Durden, D., Florian, C., Lee, R., Lunch, C., Luo, H., Pingintha-Durden, N., Roberti, J. A., SanClements, M., Sturtevant, C., Xu, K., and Zulueta, R. C.: From NEON feld sites to data portal: a community resource for surface–atmosphere research comes online, B. Am. Meteorol. Soc., 100, 2305–2325, 2019.
Ohmura, A., Dutton, E. G., Forgan, B., Fröhlich, C., Gilgen, H., Hegner, H., Heimo, A., König-Langlo, G., McArthur, B., Müller, G., Philipona, F., Pinker, R., Whitlock, C. H., Dehne, K., and Wild, M.: Baseline Surface Radiation Network (BSRN/WCRP): New precision radiometry for climate change research, B. Am. Meteorol. Soc., 79, 2115–2136, https://doi.org/10.1175/1520-0477(1998)079<2115:BSRNBW>2.0.CO;2, 1998.
Pinker, R. T. and Laszlo, I.: Global Distribution of Photosynthetically Active Radiation as Observed from Satellites, J. Climate, 5, 56–65, 1992.
Qin, J., Yang, K., Liang, S., and Tang, W.: Estimation of daily photosynthetically active radiation under all-sky conditions from sunshine duration data, J. Appl. Meteorol. Climatol., 51, 150–160, https://doi.org/10.1175/JAMC-D-10-05018.1, 2012.
Randles, C. A., Silva, A. M. D., Buchard, V., Colarco, P. R., Darmenov, A., Govindaraju, R., Smirnov, A., Holben, B., Ferrare, R., Hair, J., Shinozuka, Y., and Flynn, C. J.: The MERRA-2 Aerosol Reanalysis, 1980 Onward. Part I: system description and data assimilation evaluation, J. Climate, 30, 6823–6850, https://doi.org/10.1175/jcli-d-16-0609.1, 2017.
Ren, Y., Yang, K., Wang, H., Zhao, L., Chen, Y., Zhou, X., and La, Z.: The South Asia monsoon break promotes grass growth on the Tibetan Plateau, J. Geophys. Res.-Biogeo., 126, e2020JG005951, https://doi.org/10.1029/2020JG005951, 2021.
Ryu, Y., Jiang, C., Kobayashi, H., and Detto, M.: MODIS-derived global land products of shortwave radiation and diffuse and total photosynthetically active radiation at 5 km resolution from 2000, Remote Sens. Environ., 204, 812–825, https://doi.org/10.1016/j.rse.2017.09.021, 2018.
Schaaf, C. B., Gao, F., Strahler, A. H., Lucht, W., Li, X., Tsang, T., Strugnell, N. C., Zhang, X., Jin, Y., Muller, J.-P., Lewis, P., Barnsley, M., Hobson, P., Disney, M., Roberts, G., Dunderdale, M., Doll, C., Entremont, R. P., Hu, B., Liang, S., Privette, J. L., and Roy, D.: First operational BRDF, albedo nadir reflectance products from MODIS, Remote Sens. Environ., 83, 135–148, https://doi.org/10.1016/S0034-4257(02)00091-3, 2002.
Schwarz, M., Folini, D., Hakuba, M. Z., and Wild, M.: Spatial representativeness of surface-measured variations of downward solar radiation, J. Geophys. Res.-Atmos., 122, 13319–13337, https://doi.org/10.1002/2017JD027261, 2017.
Su, W., Charlock, T. P., Rose, F. G., and Rutan, D.: Photosynthetically active radiation from Clouds and the Earth's Radiant Energy System (CERES) products, J. Geophys. Res.-Biogeo., 112, 1–11, https://doi.org/10.1029/2006JG000290, 2007.
Sun, Z.: Improving transmission calculations for Edwards-Slingo radiation scheme using a correlated k-distribution method, Q. J. Roy. Meteor. Soc., 137, 2138–2148, https://doi.org/10.1002/qj.880, 2011.
Sun, Z., Liu, J., Zeng, X., and Liang, H.: Parameterization of instantaneous global horizontal irradiance: Cloudy sky component, J. Geophys. Res., 117, D14202, https://doi.org/10.1029/2012JD017557, 2012.
Sun, Z., Liang, H., Liu, J., and Shi, G.: Estimation of photosynthetically active radiation using solar radiation in the UV–visible spectral band, Sol. Energy, 153, 611–622, https://doi.org/10.1016/j.solener.2017.06.007, 2017.
Tang, W.: A long-term and high-resolution global gridded photosynthetically active radiation product (1984–2018), National Tibetan Plateau Data Center [data set], https://doi.org/10.11888/RemoteSen.tpdc.271909, 2021.
Tang, W., Qin, J., Yang, K., Niu, X., Zhang, X., Yu Y., and Zhu X.: Reconstruction of Daily Photosynthetically Active Radiation and its Trends over China, J. Geophys. Res. Atmos., 118, 13292–13302, https://doi.org/10.1002/2013JD020527, 2013.
Tang, W. J., Qin, J., Yang, K., Niu, X. L., Min, M., and Liang, S. L.: An efficient algorithm for calculating photosynthetically active radiation with MODIS products, Remote Sens. Environ., 194, 146–154, 2017.
Van Laake, P. E. and Sanchez-Azofeifa, G. A.: Simplified atmospheric radiative transfer modelling for estimating incident PAR using MODIS atmosphere products, Remote Sens. Environ., 91, 98–113, 2004.
Wang, D., Liang, S., Zhang, Y., Gao, X., Brown, M. G. L., and Jia, A.: A new set of MODIS land products (MCD18): downward shortwave radiation and photosynthetically active radiation, Remote Sens., 12, 168, https://doi.org/10.3390/rs12010168, 2020.
Wang, D., Liang, S., Li, R., and Jia, A.: A synergic study on estimating surface downward shortwave radiation from satellite data, Remote Sens. Environ., 264, 112639, https://doi.org/10.1016/j.rse.2021.112639, 2021.
Wang, L., Gong, W., Feng, L., Lin, A., Hu, B., and Zhou, M.: Estimation of hourly and daily photosynthetically active radiation in Inner Mongolia, China, from 1990 to 2012, Int. J. Climatol., 35, 3120–3131, https://doi.org/10.1002/joc.4197, 2015.
Wang, L., Kisi, O., Zounemat-Kermani, M., Hu, B., and Gong, W.: Modeling and comparison of hourly photosynthetically active radiation in different ecosystems, Renew. Sust. Energy Rev., 56, 436–453, 2016.
Xia, X., Li, Z., Wang, P., Cribb, M., Chen, H., and Zhao, Y.: Analysis of photosynthetic photon flux density and its parameterization in Northern China, Agric. For. Meteorol., 148, 1101–1108, https://doi.org/10.1016/j.agrformet.2008.02.008, 2008.
Young, A. H., Knapp, K. R., Inamdar, A., Hankins, W., and Rossow, W. B.: The International Satellite Cloud Climatology Project H-Series climate data record product, Earth Syst. Sci. Data, 10, 583–593, https://doi.org/10.5194/essd-10-583-2018, 2018.
Yu, X., Wu, Z., Jiang, W., and Guo, X.: Predicting daily photosynthetically active radiation from global solar radiation in the Contiguous United States, Energy Convers. Manage., 89, 71–82, https://doi.org/10.1016/j.enconman.2014.09.038, 2015.
Zhang, H., Dong, X., Xi, B., Xin, X., Liu, Q., He, H., Xie, X., Li, L., and Yu, S.: Retrieving high-resolution surface photosynthetically active radiation from the MODIS and GOES-16 ABI data, Remote Sens. Environ., 260, 112436, https://doi.org/10.1016/j.rse.2021.112436, 2021.
Zhang, X., Liang, S., Zhou, G., Wu, H., and Zhao, X.: Generating Global LAnd Surface Satellite incident shortwave radiation and photosynthetically active radiation products from multiple satellite data, Remote Sens. Environ., 152, 318–332, 2014.