the Creative Commons Attribution 4.0 License.
the Creative Commons Attribution 4.0 License.
 | 07 Jan 2022
Measurements from the University of Colorado RAAVEN Uncrewed Aircraft System during ATOMIC
Steven Borenstein
Radiance Calmer
Christopher Cox
Michael Rhodes
Christopher Choate
Jonathan Hamilton
Jackson Osborn
Dale Lawrence
Brian Argrow
Janet Intrieri
Between 24 January and 15 February 2020, small uncrewed aircraft systems (sUASs) were deployed to Morgan Lewis (Barbados) as part of the Atlantic Tradewind Ocean–Atmosphere Mesoscale Interaction Campaign (ATOMIC), a sister project to the ElUcidating the RolE of Cloud-Circulation Coupling in ClimAte (EUREC4A) project. The observations from ATOMIC and EUREC4A were aimed at improving our understanding of trade-wind cumulus clouds and the environmental regimes supporting them and involved the deployment of a wide variety of observational assets, including aircraft, ships, surface-based systems, and profilers. The current paper describes ATOMIC observations obtained using the University of Colorado Boulder RAAVEN (Robust Autonomous Aerial Vehicle – Endurant Nimble) sUAS. This platform collected nearly 80 h of data throughout the lowest kilometer of the atmosphere, sampling the near-shore environment upwind from Barbados. Data from these platforms are publicly available through the National Oceanic and Atmospheric Administration's National Center for Environmental Intelligence (NCEI) archive. The primary DOI for the quality-controlled dataset described in this paper is https://doi.org/10.25921/jhnd-8e58 (de Boer et al., 2021).
- Article
(3515 KB) - Full-text XML
- BibTeX
- EndNote


The trade winds are a fundamental feature of Earth's atmospheric circulation arising from the balance of equatorward motions in large-scale overturning balanced by the Coriolis force. In the Northern Hemisphere, the trade winds present as northeasterlies over the sub-tropical oceans and interact with the cloud-topped marine boundary layer, which modulates the vertical transfer of energy between the sea surface and the atmosphere. For example, trade-wind clouds situated over ocean surfaces have a strong influence on how energy from the sun is transmitted, scattered, and reflected before reaching the surface in both observations (e.g., Hartmann and Short, 1980) and numerical simulations (e.g., Bony and Dufresne, 2006). Additionally, these clouds help to drive larger-scale circulations that have both local and distant effects. Included is the ability of trade-wind cumulus to support mass transport out of the sub-cloud mixed layer, which in turn impacts energy exchange between the ocean surface and underlying atmosphere (e.g., Tiedtke et al., 1988; Jakob and Siebesma, 2003). Their efficiency in this regard makes them a critical component of feedbacks sitting at the interface between the causes and responses of changes to tropical and global climate, and modeling studies have demonstrated a sensitivity of cloud structure and albedo to climate-induced changes to liquid water lapse rate and an even greater (but opposite) sensitivity to surface-flux-induced changes to the depth and moisture content of the planetary boundary layer (Rieck et al., 2012).
In support of advancing our understanding of trade-wind cumulus clouds and the environmental regimes supporting them, two large field campaigns were developed to simultaneously sample the tropical Atlantic Ocean east of Barbados and overlying atmosphere. Together, the EUREC4A (ElUcidating the RolE of Cloud-Circulation Coupling in ClimAte; Stevens et al., 2021) field study and the Atlantic Tradewind Ocean–Atmosphere Mesoscale Interaction Campaign (ATOMIC) represent the largest-ever effort to document and understand the intraseasonal drivers of cloud properties in this region. Taking place during January and February 2020, these campaigns build on knowledge gained through previous and ongoing observing efforts, including data from the long-term Barbados Cloud Observatory (BCO; Stevens et al., 2016) and from previous field campaigns like the Atlantic Tradewind Experiment (ATEX; Augstein et al., 1974), the Barbados Oceanographic and Meteorological Experiment (BOMEX; Holland, 1970), and the Rain In shallow Cumulus over the Ocean (RICO; Rauber et al., 2007) project. EUREC4A and ATOMIC saw the combined deployment of three research vessels, four manned research aircraft, and a fleet of robotic airborne and surface vehicles, which were combined to provide extended regional sampling.
Through the analysis and evaluation of data collected in the field campaigns listed in the previous paragraph, there has been substantial advancement of our understanding of the complex interplay between the atmospheric state and resulting cloud cover. Specifically, a significant amount of work has gone into understanding how clouds and precipitation interact with large-scale divergence (e.g., Schubert et al., 1979), turbulent transfer of heat and moisture between the surface and overlying atmosphere, and the thermodynamic structure of the lower atmosphere (e.g., Slingo, 1987; Albrecht, 1993). Additionally, there have been studies that aim to explain connections between cloud cover and lower-atmospheric winds (e.g., Nuijens and Stevens, 2012). Interestingly, the response of clouds to environmental conditions appears to be more significant in global climate models (e.g., Nuijens et al., 2015; Bretherton, 2015) than observed during field campaigns or in high-resolution simulations (e.g., Vial et al., 2017). The concept of EUREC4A was developed to support the unraveling of remaining mysteries associated with the interplay between clouds in the tropical trade regime and the environment supporting their existence (Bony et al., 2017).
This publication describes the dataset collected by one of the robotic airborne vehicles deployed during ATOMIC and EUREC4A, the University of Colorado Integrated Remote and In Situ Sensing (IRISS) RAAVEN (Robust Autonomous Aerial Vehicle – Endurant Nimble) uncrewed aircraft system (UAS)1. The RAAVEN was deployed to document in detail the structure of the lower atmosphere, with a focus on the sub-cloud mixed-layer, throughout the length of the campaign. Specific objectives included measurement of thermodynamic and kinematic structure of the lower atmosphere, turbulent fluxes of heat and momentum, cloud base mass flux, and updraft distribution in relation to cloud cover. Flights covered the time period between 24 January and 16 February 2020 and took place over the near-shore marine environment off of the northeastern coast of Barbados. In total, 39 flights were completed, resulting in a dataset of more than 77 flight hours that is documented here. After providing an overview of the RAAVEN platform and instruments it carried for ATOMIC in Sect. 2, we provide insight into the measurement location and sampling patterns (Sect. 3) and information on data processing and quality control (Sect. 4),
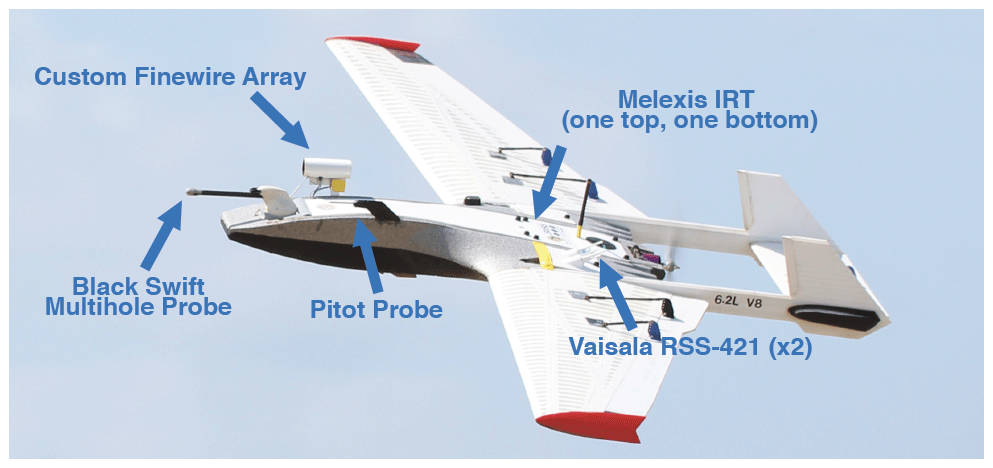
Figure 1Figure showing a picture of the University of Colorado RAAVEN UAS, as operated in Barbados for ATOMIC, with labels pointing out the locations of the individual sensors.
The RAAVEN UAS (Fig. 1) has been operated for atmospheric science missions by the University of Colorado since early 2019. With a wingspan of 2.3 m, the airframe is a custom-manufactured model from RiteWing RC and has been modified to meet the needs of intense atmospheric sampling measurements in a variety of environments. Specific modifications include the integration of a tail boom to enhance longitudinal stability and improve the platform's performance. The platform is equipped with a PixHawk2 autopilot system and leverages an 8S 21 000 mAh lithium ion (Li-Ion) battery pack to offer flight times around 2.5 h, depending on conditions and executed flight patterns. The aircraft has a top airspeed of approximately 130 km h−1, though operations during ATOMIC were almost exclusively conducted in the 60–70 km h−1 range.
For ATOMIC, the RAAVEN was equipped with an instrument suite modeled after the miniFlux payload co-developed by the National Oceanic and Atmospheric Administration (NOAA) and the Cooperative Institute for Research in Environmental Sciences (CIRES) and IRISS at the University of Colorado. In this configuration, the aircraft is equipped to measure a variety of atmospheric and surface properties to support evaluation of thermodynamic state, kinematic state, and turbulent fluxes of heat and momentum. This involves a collection of core instruments (see Fig. 1), which include a multihole pressure probe (MHP) from Black Swift Technologies, LLC (BST); a pair of RSS421 PTH (pressure, temperature, humidity) sensors from Vaisala, Inc.; a custom fine-wire array, developed and manufactured at the University of Colorado Boulder; a pair of Melexis MLX90614 IR thermometers; and a VectorNav VN-300 inertial navigation system (INS). This sensor suite is logged using a custom-designed FlexLogger data logging system.
The Vaisala RSS421 sensors are identical to those used in the RD41 dropsondes deployed by the NOAA WP-3D Orion (Pincus et al., 2021) and DLR HALO aircraft during ATOMIC and EUREC4A and very similar to the RS41 radiosondes launched from a variety of platforms (Stephan et al., 2021), including the NOAA research vessel Ronald H. Brown (Quinn et al., 2021). This unit includes a linear resistive platinum temperature sensor that features a measurement resolution of 0.01 ∘C, a repeatability of 0.1 ∘C, and a response time as measured within the RS41 radiosonde of 0.5 s at 1000 hPa when moving at 6 m s−1. To measure relative humidity (RH), the RSS421 leverages a thin-film capacitor with a resolution of 0.1 % RH and a repeatability of 2 % RH, with a temperature-dependent response time of better than 0.3 s at 20 ∘C (again, as measured within the RS41, with 6 m s−1 airflow at 1000 hPa). Finally, the pressure sensor is capacitive with a silicon diaphragm, having a resolution of 0.01 hPa and a repeatability of 0.4 hPa. For ATOMIC, a pair of these sensor modules was integrated into the fuselage, about halfway between the nose and the tail of the aircraft on the port side. The mounting angles of these two sensors were offset to ensure that the two sensors would have different amounts of solar exposure as the aircraft maneuvers through the atmosphere and to allow for the detection of solar heating effects since no shading is used. The readings from these sensors are not adjusted for any potential differences between the total and static temperature as those are generally believed to be small (< 0.15 K) at the airspeed of the RAAVEN. Additional information on atmospheric thermodynamic state is available from an E+E EE03 sensor that is integrated into the BST MHP and from a Sensiron SHT-85 sensor that is integrated in the custom fine-wire array. The EE-03 has a stated temperature accuracy (at 20 ∘C) of 0.3 ∘C, while the humidity accuracy is stated to be 3 % RH at 21 ∘C. The SHT-85 has a stated temperature accuracy of 0.1 ∘C (from 20–50 ∘C) and a repeatability of 0.08 ∘C, while the humidity sensor has a stated accuracy of 1.5 % RH and a repeatability of 0.15 % RH. Both the EE03 and the SHT-85 sensors have slower response times than the RSS421 sensor described above and are typically not used for scientific purposes unless there is a complete failure of the RSS421.
In addition to the SHT-85 sensor, the fine-wire array developed by the University of Colorado consists of two 5 µm diameter platinum wires extending over a 2 mm length, suspended in the free stream by supporting prongs. One wire is operated as a hot-wire anemometer, with approximately 100 ∘C overheating compared to the ambient environmental temperature. The other wire is operated as a cold-wire thermometer, with approximately 1 ∘C overheating relative to the surrounding environment. These wires have thermal time constants of 0.5 ms in a 15 m s−1 airflow regime and support a sampling frequency of up to 800 Hz. This high-frequency output enables measurement of turbulent fluctuations in velocity and temperature at sampling rates up to 400 Hz. A custom electronics module converts resistance change in the wires due to velocity or temperature variability in the airflow to amplified voltages that output at 800 Hz. For ATOMIC, these outputs were logged at 250 Hz by the FlexLogger, which is equivalent to a 7.2 cm minimum length scale at the RAAVEN cruise airspeed of 18 m s−1. Time series of these recorded data are processed during post-flight analysis to calibrate the voltages recorded by the fine-wire module to velocity and temperature. Additionally, these measured quantities can be fit to inertial sub-range turbulence models to wavenumber spectra over suitable time intervals, producing turbulence intensity parameters ε (kinetic energy dissipation rate) and (temperature structure constant). The resolution (noise floor) of these parameterizations is 2.0 × 10⁻⁷ W kg−1 for ε and 4.5 × 10⁻⁶ for . Resolution of the raw time series is 8.3 × 10⁻⁵ m s−1 for the hot wire and 1.3 × 10⁻⁴ K for the cold wire.
In addition to the EE-03 PTH measurements, the BST five-hole probe provides measurements of airspeed, angle of attack (α), and sideslip angle (β). These measurements are used together with the inertial velocities and aircraft attitude from the VectorNav VN-300 to derive the three components of the inertial wind (u, v, w), as discussed in Sect. 4. The VN-300 can be configured in a dual-global navigation satellite system (GNSS) mode, under which the relative positions of two GNSS antennae are used to calculate the platform yaw. However, this setting was not used during the ATOMIC deployment. Under dynamic conditions, the system has a stated accuracy of 0.3∘ in GPS heading, 0.1∘ in pitch and roll, 2.5 m horizontal position accuracy, 2.5 m vertical position accuracy when integrating information from the barometric pressure sensor, and 0.05 m s−1 accuracy in inertial velocity. Input from the system's gyroscope, accelerometer, GNSS receiver, magnetometer, and pressure sensor is filtered through an extended Kalman filter (EKF) to produce a navigation solution. Data from the VN-300 are logged at 50 Hz resolution.
Finally, the RAAVEN carries a pair of Melexis MLX90614 IR thermometers, with one looking up from the top of the aircraft and one looking down towards the surface in level flight. These sensors are factory-calibrated to work in operational temperatures between −40 and 125 ∘C and to measure target brightness temperatures between −70 and 380 ∘C. They have a high accuracy (0.5 ∘C) and a measurement resolution of 0.02 ∘C. Unlike in the miniFlux sensor system, the RAAVEN version is not stabilized to maintain a vertical orientation, meaning that the observed target is perpendicular to the reference frame of the aircraft. This requires some care when interpreting measurement from time periods when the aircraft is conducting pitch or rolling maneuvers. To limit the impact of surface or sky heterogeneity, we leverage the “I” version of this sensor, which has a 5∘ field of view. These sensors have a broad passband range of 5–14 µm, meaning that while it covers the infrared atmospheric window, it is also subject to radiation emitted by water vapor and other radiatively active gases. This means that at significant distances from a given target (e.g., cloud, surface), atmospheric gases will influence the temperature reading. Therefore, if absolute accuracy of brightness temperature is important, the sensor should be operated in close proximity (tens of meters or less) to the target. However, relative contributions from different surface types or atmospheric conditions can still be easily distinguished despite a lack of absolute calibration for extended distance sensing. Such gradient detection can be useful for detecting surface inhomogeneities or for understanding whether the aircraft is operating under cloudy or clear-sky conditions.
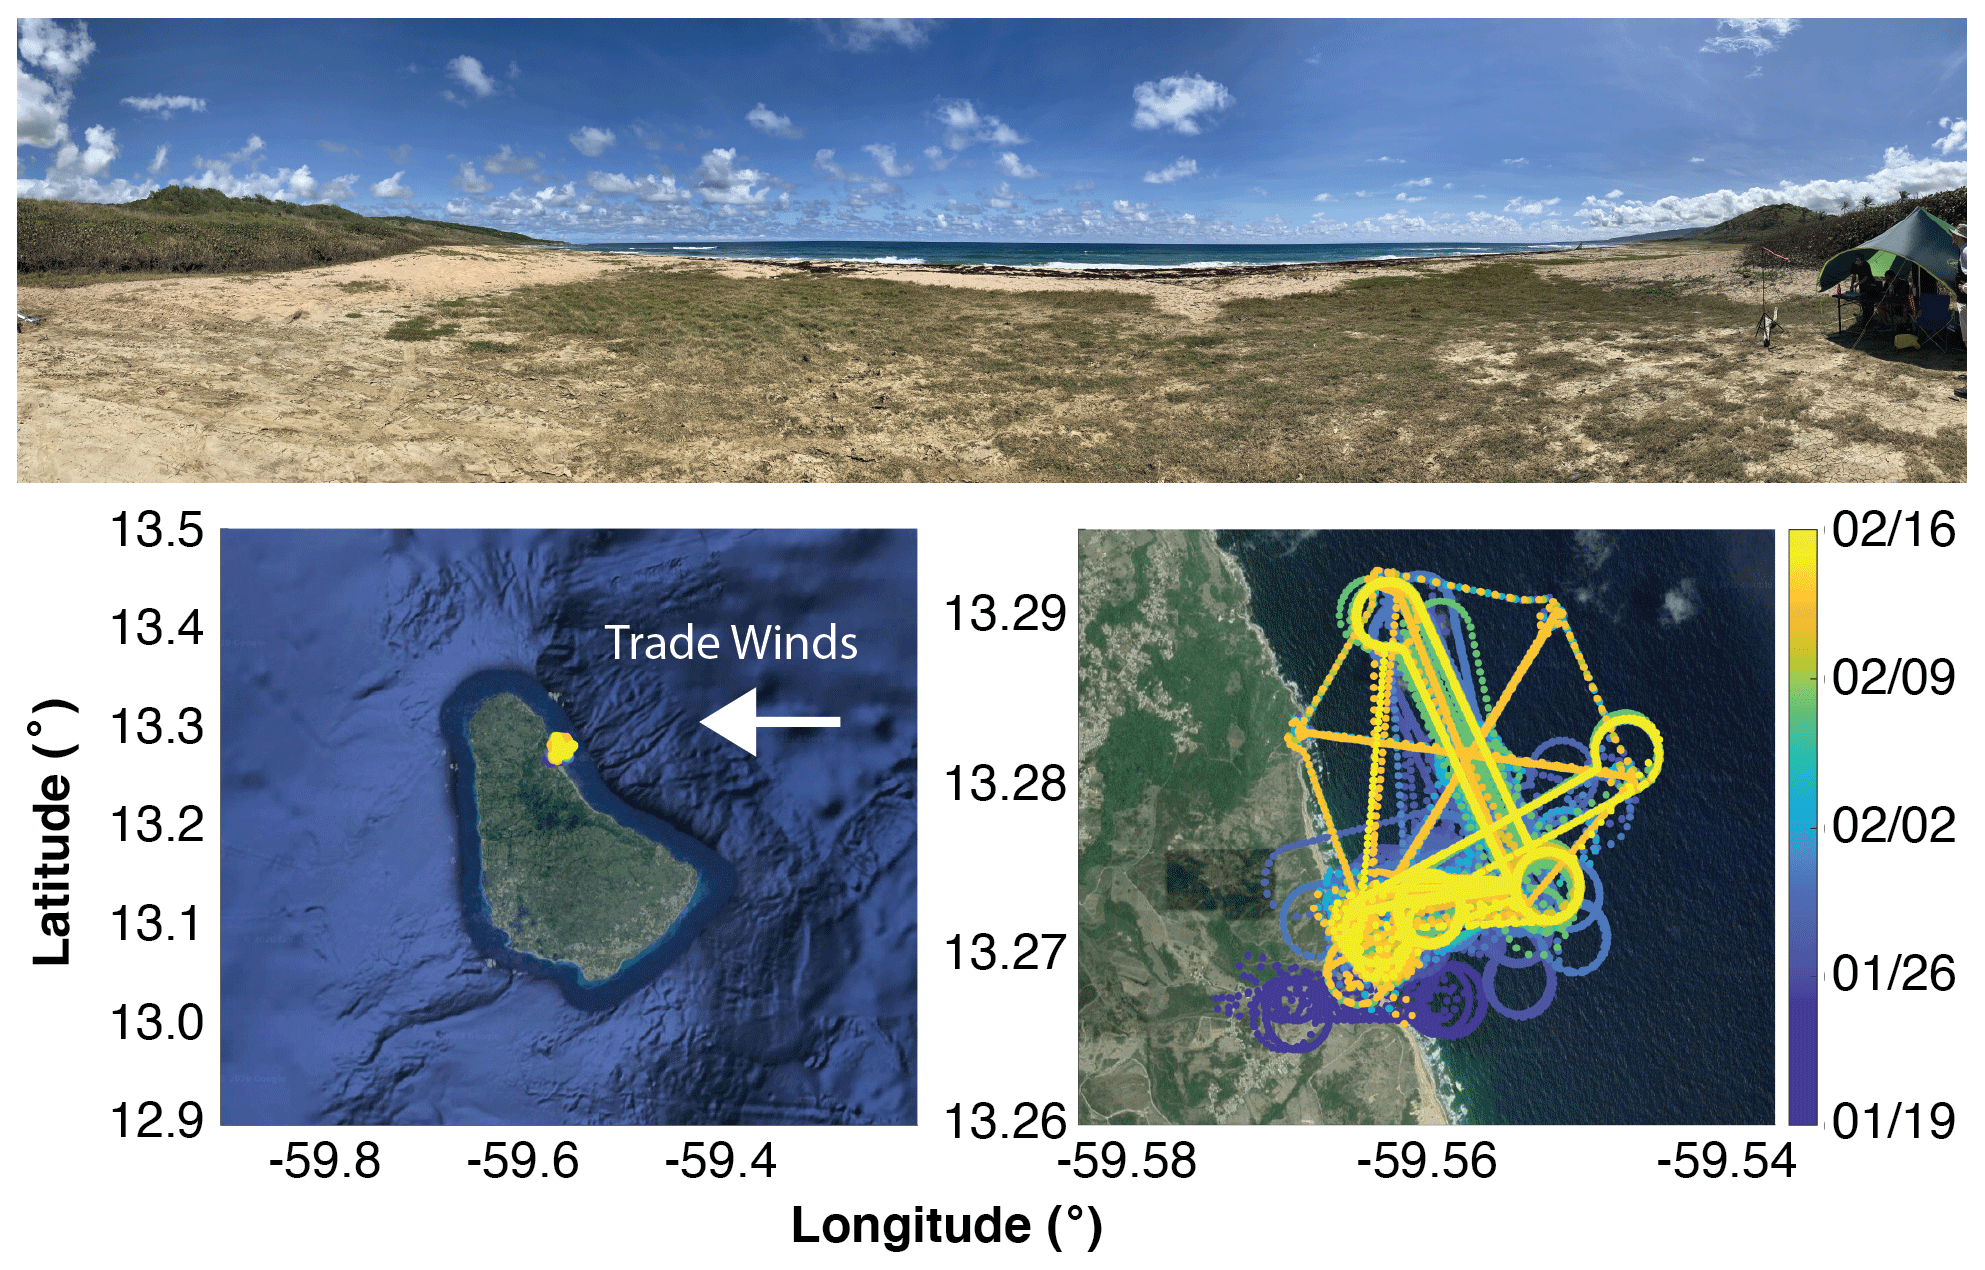
Figure 2Morgan Lewis Beach (top) as seen from our operations site. A map of Barbados, showing the location of RAAVEN flights, relative to the rest of the island (bottom left). Details on the flight tracks completed, color-coded by date (bottom right). Background maps are ©Google Maps 2021, downloaded through their API.
RAAVEN flights for ATOMIC were completed at Morgan Lewis, Barbados (Fig. 2). Morgan Lewis is located approximately 20 km to the north-northeast of Bridgetown, on the island's northeast coastline (bottom left panel of Fig. 2), and 19 km north-northwest of Ragged Point, where the BCO is situated. The primary operations location was Morgan Lewis Beach (see top panel of Fig. 2), with the aircraft launching from and landing on the beach surface. This location was selected to offer direct flight access to the coastline and the near-shore marine environment and the best possible visibility of the aircraft while it conducted sampling missions over the Atlantic Ocean. The Morgan Lewis Beach is generally oriented from north-northwest to south-southeast, meaning that the prevailing wind direction was onshore, at a slight angle to the beach, offering a relatively undisturbed marine atmosphere offshore. The ocean at Morgan Lewis featured significant surf, with swells generally around 1–3 m in height, depending on the day. On windier days, there was significant sea spray, which impacted measurements from the RAAVEN multihole pressure probe on occasion, as described in Sect. 4. Additionally, the coast is relatively undeveloped, with limited farmland and houses. The terrain quickly rises from the ocean, with hills topping 200 approximately 1.6 km inland. Vegetation along the coastline includes low-growing trees and shrubs, along with palm trees and some grassy fields.
In general, two flights were executed per day, with one flight occurring in the morning (typically around 13:00 UTC, 09:00 AST) and one in the afternoon (typically around 17:00 UTC, 13:00 AST). Some days saw an extra third flight, while others saw only one flight or none at all in order to accommodate crew rest requirements and help coordinate airspace and traffic in connection with the operation of two additional UASs in the Morgan Lewis area. Figure 3a provides an overview of flight times throughout the ATOMIC deployment. Flights were typically a little over 2 h in duration and were primarily executed in the near-shore marine environment over the Atlantic Ocean. Most of the flight time was executed in a racetrack pattern that was oriented parallel to shore, though profiling was completed using a loiter circle, as was the lowest flight level at approximately 20 m above the ocean surface. Additionally, most flights saw at least one leg oriented at 90∘ relative to the shore.
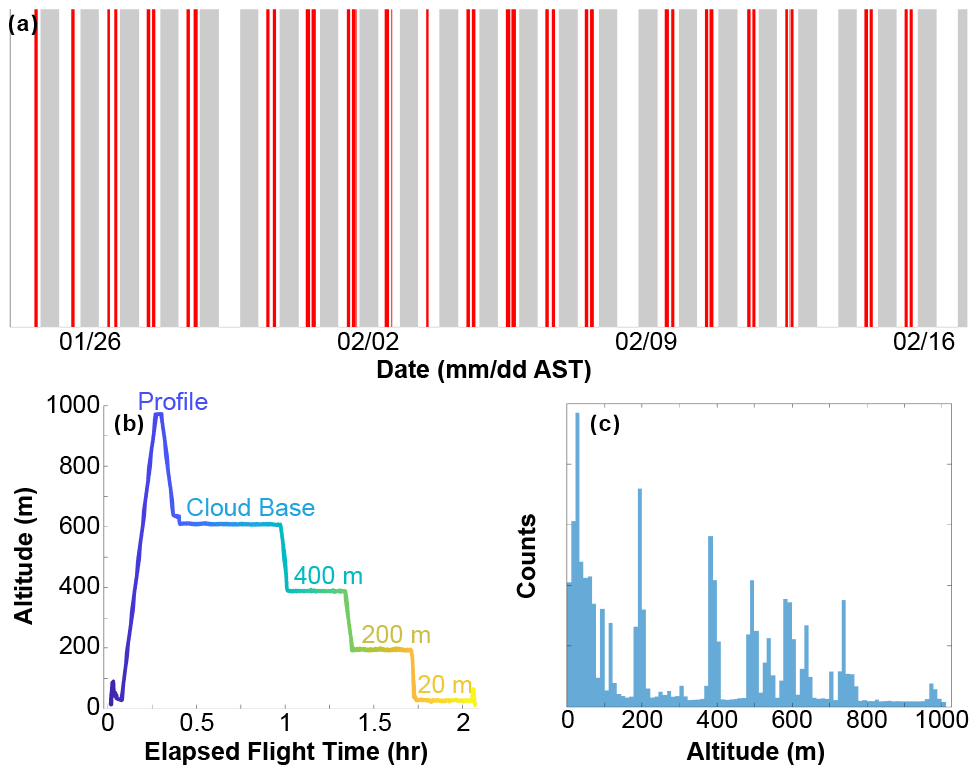
Figure 3A figure illustrating information on the completed flights. Panel (a) shows RAAVEN flight times (red bars) relative to nautical twilight (gray bars). Panel (b) shows an example of the most commonly flown pattern, including a profile to 1 km, and then extended sampling legs at cloud base and 400, 200, and 20 m (colors represent time into the flight). Panel (c) shows a histogram of flight altitudes covered by the RAAVEN during ATOMIC.
The primary flight pattern executed by the RAAVEN is shown in Fig. 3b. This pattern included a launch from the beach, followed by a couple of nearby, low-altitude orbits to verify system functionality. Once the system was ready to continue its mission, the aircraft was first sent to conduct an orbital profile (225 m diameter) between 20 and 1000 m altitude, assuming that cloud cover allowed for a profile at this altitude. If cloud cover was extensive, then the profile was capped at the cloud base. This profile was included to obtain information on lower-atmospheric thermodynamic and dynamic structure, extending from the surface, through the boundary layer, and into the cloud layer capping the boundary layer. After reaching the top of the profile, the aircraft would descend to the boundary layer top (“cloud base”), as detected using data from a ceilometer at the BCO, situated approximately 19 km to the southeast of Morgan Lewis, and by visual confirmation of the aircraft being below the clouds. Once at the cloud base, the aircraft would execute a horizontal “racetrack” pattern spanning approximately 2.5–3 km and oriented approximately parallel to the shoreline for an extended flight period (typically 20–40 min) to collect statistics on the spatial variability in thermodynamic and kinematic properties of the cloud base environment. Specific measurement targets for this flight leg included the cloud base mass flux, vertical velocity distribution and eddy length scale at the cloud base, turbulent fluxes of heat and momentum through the top of the atmospheric boundary layer, and cloud horizontal extent. Following this, the aircraft would execute additional extended racetrack sampling legs at 400 and 200 to collect statistics to evaluate atmospheric properties, including turbulent fluxes of heat and momentum and vertical velocity distributions and eddy length scale in the center of the boundary layer at these two levels. During these racetrack flight patterns, the aircraft was typically additionally operated to conduct one racetrack that was oriented perpendicular to the others to help with calibration of wind measurements. Finally, the aircraft would descend to approximately 20 and conduct 20 min of circular orbiting at this low altitude to measure quantities related to the surface layer, the underlying ocean, surface–atmosphere exchange, and the turbulent structure of the lower atmosphere. This orbit was positioned to be outside of the near-shore surf zone to avoid the influence of breaking waves on these measurements. Following this low-altitude leg, the aircraft would return to the beach for landing.
In addition to this primary flight pattern, the RAAVEN was also operated to conduct a more complex pattern designed to help with the calibration of winds. This pattern was typically carried out at 100 and included a series of three racetrack patterns (∼ 2 km) oriented in directions approximately offset by 120∘ to create a star pattern. This offered a variety of flight directions relative to the very steady (in both speed and direction) trade winds that the aircraft was operating in. This pattern was specifically designed to assist with evaluating any biases in the wind measurement system and is fashioned after flight patterns recommended in Sect. 6 of van den Kroonenberg et al. (2008).
Over the course of the campaign, the completed flights sampled a variety of altitudes, with enhanced sampling at 20, 200, and 400 m and near the cloud base (variable altitude). This resulted in the distribution of sampled altitudes shown in Fig. 3c. These levels of enhanced sampling are meant to support the analysis of statistics at a given level, as may be required for evaluating turbulent transport of heat and momentum and as needed for understanding wind and thermodynamic variance. Additionally, the cloud base legs are meant to support the evaluation of the vertical velocity structure associated with the cumulus clouds present in the tropical trades.
Data collected by the RAAVEN during ATOMIC were logged at a variety of different rates, depending on the sensor. The custom fine-wire sensor was logged at 250 Hz, the fastest rate of all of the sensors. The BST MHP was logged at 100 Hz, the VectorNav VN-300 was logged at 50 Hz, and the Melexis IR sensors and variables related to fine-wire status were logged at 20 Hz, while data collected from the PixHawk autopilot and RSS421 sensors were logged at 5 Hz. For each logging event, a sample time from the clock on the FlexLogger system is recorded, allowing for post-collection time alignment. These sample times, along with artificial 5, 20, 50, 100, and 250 Hz clocks spanning the sample time that the VN-300 first acquired GPS lock to the last recorded sample time for the VN-300, are used to align the times of the different variables to a set of common clocks, primarily through one-dimensional linear interpolation. One exception to the linear interpolation is the yaw estimate, which is circular in nature (ranging between −180 and 180∘), which uses a “nearest” interpolation, where the value at the nearest time stamp is used. During this interpolation process, a limited number of points sharing a common sample time with another point are removed from the record. Once these time variables are established, a base_time variable is established using the 250 Hz time stamp, and offsets from base_time are then calculated for all different logging resolutions.
Once the initial time stamps are established, the resampled dataset includes a variety of derived and measured quantities. Aircraft position, including latitude and longitude, is measured by the VN-300. The aircraft altitude is derived using a combination of various inputs. While the aircraft carries sensors to measure both GPS and pressure altitude, neither of these outputs can be used reliably as the flight altitude. The pressure altitude is subject to drift over the duration of a single flight, potentially resulting in values at landing that are higher or lower than those at take-off. Similarly, the accuracy of the GPS altitude is insufficient to accurately capture the vertical position of the aircraft. Additionally, the VN-300 was not calibrated specifically for this location, resulting in a significant negative bias (∼ 50 m) for its reported altitude. To calculate a true altitude, a combination of the autopilot altitude, VN-300 altitude, and VN-300 pressure is used. First, a flight_flag variable is computed using airspeed and altitude information from the autopilot. Any data points with airspeed exceeding 10 m s−1 and an altitude exceeding 5 m are flagged as a time when the aircraft is flying (flight_flag = 1). The point at 200 samples (4 s) prior to the first point in the record where the aircraft is deemed to be flying is recorded as the initial take-off index, while the data point at 200 samples (4 s) after the last point in the record where the aircraft is deemed to be flying is recorded as the landing index. The difference between the autopilot altitude at launch and at landing is added into the flight record on a time-step-by-time-step basis to correct for temporal drift in pressure. A linear fit is then calculated to relate the VN-300 pressure and the difference between the VN-300-reported altitude and the autopilot-reported altitude. This pressure-dependent altitude correction is then applied to the VN-300-reported altitude to derive a final altitude.
Estimation of winds from fixed-wing aircraft requires a combination of a variety of measurements related to airspeed, aircraft motion, and airflow over the aircraft (see van den Kroonenberg et al., 2008). These measurements need to be of sufficient quality, and any angular offsets and logging delays need to be considered and removed. This includes the removal of effects related to biases in the reported aircraft true airspeed (TAS), application of a time lag correction to account for potential delays separating the VN-300-reported GPS velocities and the airspeed, and correcting for possible angular offsets between the VN-300 and multihole pressure probe. For the RAAVEN system, biases in TAS are found to have the largest impact on wind speed derivation, while the time lag correction was found to have the smallest impact. All of these potential sources of error are corrected for using a multi-variate optimization process that includes small adjustments to TAS, pitch, and yaw to account for probe miscalibration and angular offsets between the INS and the multihole probe. In this process, we check for a possible time shift between the GPS and other variables of up to 200 data points (4 s); up to a 10 % TAS bias; and up to 10 and 3∘ angular offsets in yaw and pitch, respectively. Through an iterative minimization, a full coordinate system rotation is applied, and a variance in the resulting wind components is computed. The minimum variance is used as offsets in TAS, yaw, and pitch will result in increased “steps” in the wind data when completing repeated flight legs in an orbital or racetrack pattern.
For the RAAVEN ATOMIC dataset, TAS is calculated using measurements from the MHP and RSS421 probe. Using Eq. (1) from Brown et al. (1983), TAS can be calculated as
where ρ is the density of air, calculated as
where ps is the static pressure (Pa) reported from the MHP, T is the air temperature (K) reported by the RSS421, and Rd is the specific gas constant for dry air and is equal to 287.058 ; is defined as
where sin 2θa is the total aerodynamic angle of the MHP, calculated using the angle of attack (α) and sideslip angle (β) reported by the MHP, and p0 is the dynamic pressure at the central hole of the MHP.
From testing in a temperature chamber, it was found that the pressure sensors used in this version of the MHP had non-linear temperature dependencies. These dependencies were, unfortunately, not found to be consistent between the five sensors in the MHP. Therefore, after an initial calculation of the TAS using the technique above, an additional temperature-dependent correction was applied to ensure that an artificial alteration of TAS with altitude was not present. Using a linear regression, for this particular probe it was found that TAS needed to be corrected as follows:
where TC is the temperature from the RSS421 sensor in degrees Celsius. Efforts are currently being undertaken to improve the MHP measurements by including a temperature-dependent correction of the pressure data as well as a full wind-tunnel-based calibration of the MHP itself to evaluate the factory-supplied calibration coefficients.
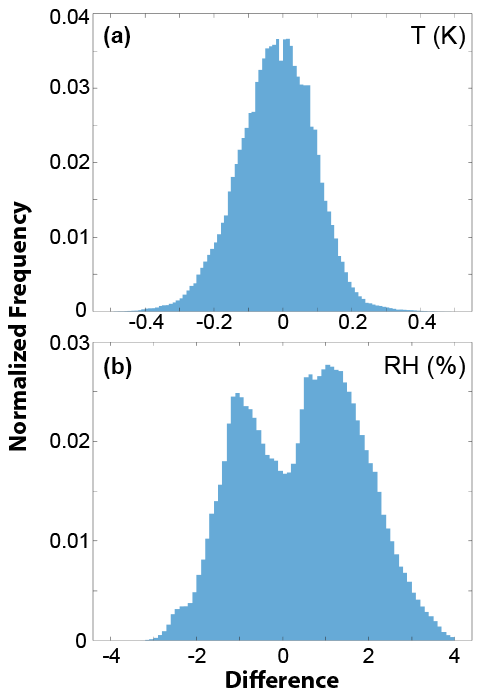
Figure 4Distributions of differences in the RSS421-measured temperatures (a) and relative humidities (b) for all times the aircraft was in flight during the ATOMIC campaign.
Development of thermodynamic measurements from the RAAVEN included multiple processing steps. First, the data from the two RSS421 sensors are averaged to attempt to reduce the influence of any solar exposure of the sensors. After review of the temperatures from these sensors as a function of yaw angle, we did not see evidence of solar influence on the measurement. Nevertheless, because the sensors were oriented at different angles relative to the airframe it is unlikely that they were both impacted by solar exposure at the same time, and there is further opportunity to reduce any solar influence. We do this by taking the average value of the two sensors as the ambient temperature. Typically, the two sensors vary by less than 0.2 ∘C (see Fig. 4). After this temperature time series has been developed, a temperature calibration is derived for the cold-wire data. This is done by developing a linear fit to the relationship between the cold-wire voltage and the temperature measured by the RSS421 sensor. As is the case with the RSS421 temperature measurements, the RSS421 relative humidity values are also averaged. Typically, these measurements agree to within 2 %. The relative humidity measurements did undergo one additional correction for the first 2 flight days due to the fact that the sensors were not conditioned prior to flight as required, resulting in measurements that have a dry bias. Fortunately, we were conducting flights around the same time that a radiosonde was launched from the BCO, and we were able to apply a linear correction to the data for these first two flights, taking the form of
where RHadj is the corrected relative humidity, RHorig is the measured relative humidity, and Z is the altitude of the aircraft above the surface in meters. This correction assumes that over the 2 d period prior to the sensors being conditioned, the bias is constant. Additionally, it assumes that there is a temperature dependence associated with the correction, which is accounted for with the height-dependent scaling factor since the flights in question took place within the mixed layer.
All of the measured quantities have data quality flags associated with them. For the RSS421-derived temperature, the flag is set to zero for good data and set to one for times when any of the following occur: the absolute value of the difference between the temperature from either of the individual sensors and the output temperature is greater than 0.5 ∘C, the absolute value of the difference between the output temperature and the temperature from the EE-03 sensor on the MHP exceeds 5 ∘C, the recorded error flag of either of the RSS421 sensors is active, or the aircraft is not flying. For the RH measurement from the RSS421, a similar set of criteria are used to activate the data quality flag, except the limits are set to be 5 % between RSS421 sensors and 15 % between the output RH value and the MHP-provided RH value. The cold-wire temperature data quality flag is activated when the difference between the cold-wire temperature and either of the RSS421 temperatures exceeds 0.6 ∘C, when the absolute value of the difference between the cold-wire temperature and the MHP temperature exceeds 2 ∘C, when the cold-wire voltage is observed to fall outside of the 0–4 V analog range, or when the aircraft is not flying. Finally, the pressure quality control flag for the pressure measurement from the VN-300 is activated if the absolute value of the difference between the reported VN-300 static pressure and that measured by either of the RSS421 sensors exceeds 2 hPa. The RSS421 pressure measurements are not used because they are believed to be biased low due to the airflow passing over their location on the aircraft.
Finally, we include a three-stage flag for the wind measurements, which is set to 0 (good data), 1 (suspect data), or 2 (bad data). Data are determined to be bad if any of the following conditions were met.
-
The measured angle of attack or sideslip exceeds 20∘, with values between 10–20∘ flagged as “suspect”.
-
The true airspeed (TAS) is below 10 m s−1.
-
Any of the MHP ports are deemed to be blocked, as determined by the differential pressure value for any of the sensors falling below −100 Pa.
-
The moving window variance of the MHP-derived TAS over 40 s is less than 5.
-
The aircraft is not flying.
-
The difference between the MHP TAS and that from the Pitot probe is greater than 5 m s−1.
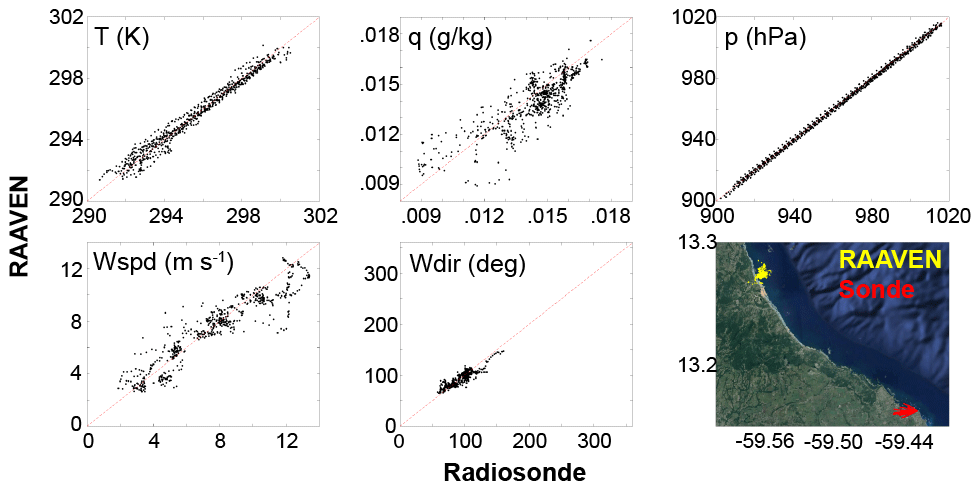
Figure 5A comparison between radiosonde observations and those from the RAAVEN. The lower right-hand panel shows the positions of the RAAVEN and radiosonde during times of shared altitude used for this comparison. Quantities compared include air temperature, specific humidity and air pressure (top row, left to right), and wind speed and direction (lower row, left and center). Background maps are ©Google Maps 2021, downloaded through their API.
To evaluate the accuracy of the RAAVEN observations, we completed a comparison with measurements collected by radiosondes launched from the BCO (Stephan et al., 2021). Results from this comparison are shown in Fig. 5. This comparison includes any periods where the RAAVEN sampling time and that of the radiosonde are less than 1 h apart. While the radiosondes were launched approximately 20 km to the southeast, we believe that the air sampled by both systems is largely representative of the marine boundary layer, given that wind directions were always between east-southeast and east-northeast. Both datasets are averaged onto a common altitude grid which includes points between the surface and 1060 in 20 m altitude steps. Figure 5 shows how well the RAAVEN observations match those from the radiosondes and demonstrate the amount of variability in individual variables, with air pressure and wind direction typically varying very little, temperature a bit more, and wind speed and specific humidity having the largest amount of small-scale variability. However, for all measurements the observations fall around the one-to-one line, supporting the idea that the RAAVEN measurements are providing an accurate depiction of the lower atmosphere, relative to radiosondes launched from the BCO.
Finally, to allow the data user to better understand the aircraft's flight state and to allow for improved selection of specific phases of flight, we included two additional flags in the data stream. These include the “Flight_Flag” introduced previously as well as a “Flight_State” flag. The “Flight_State” flag includes information on whether the aircraft is in flight (1) or not (0) in the hundreds place; whether the aircraft is descending (0), level (1), or ascending (2) in the tens place; and whether the aircraft is flying straight (0) or is turning (1). For example, if a data user wanted to find straight, level legs in flight, they would search for data with “Flight_State” equal to 110. These flags are derived from information from a combination of sensors, including the altitude variable described above, the aircraft yaw, and the “Flight_Flag” variable described earlier on in this paragraph.
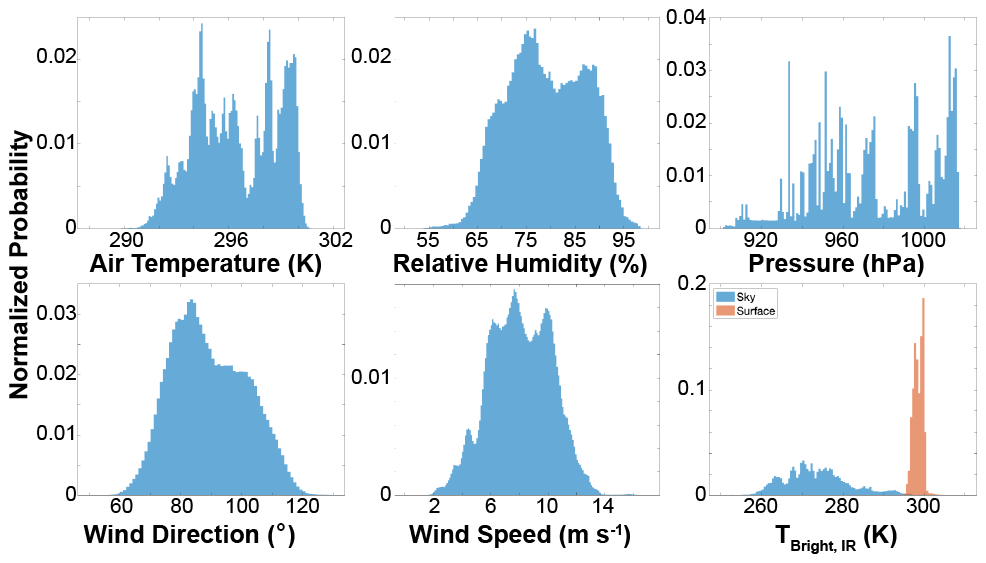
Figure 6Histograms of the primary measurements from RAAVEN, collected while in flight, over all flights conducted during ATOMIC.
Figure 6 illustrates distributions of several key parameters across the entire ATOMIC campaign. These distributions include “in-flight” data only and reveal the relative consistency of the structure of the lower atmosphere in the trade-wind regime. Despite covering nearly a month of time, these observations have relatively narrow distributions in most parameters, with the majority of the variability being a function of altitude rather than a function of synoptic variability. Peaks in the air temperature and pressure data are the result of the aircraft spending significant amounts of time at a series of levels between the cloud base and the surface.
ATOMIC RAAVEN data are available for public download at the NOAA National Center for Environmental Intelligence (https://doi.org/10.25921/jhnd-8e58; de Boer et al., 2021). Files are provided in NetCDF format, with the filename convention ATOMIC_CU-RAAVEN_YYYYMMDD_HHMMSS_B1.nc, where the date reflects the power-on time for the aircraft. In total, there are 39 files totaling 703 MB. Files described in this paper and accessible using the above DOI are quality-controlled and labeled as “B1”. The raw data (A1 files) are not currently archived but are stored on local backed-up disk storage and can be accessed if necessary.
Between 24 January and 15 February 2020, the University of Colorado and NOAA Physical Sciences Laboratory deployed the RAAVEN small uncrewed aircraft platform to Morgan Lewis, Barbados, as part of the ATOMIC field campaign. Over the course of 3 weeks, the team collected nearly 80 h of flight data over 39 flights. These flights were generally conducted at a 2× daily frequency, with one morning and one afternoon flight. These flights provide extensive observations of the thermodynamic and kinematic structure of the marine boundary layer (between surface and 1000 ) in the tropical trades. It is believed that these data offer high-resolution insight not readily achieved with other observing techniques. Due to the slow flight speed of the RAAVEN (18 m s−1) and the platform's extensive endurance (2+ h), observations collected span length scales from approximately 5 cm to 130 km.
Data were processed and quality-controlled to provide consistent data at 10 Hz temporal resolution. This includes the correction of wind, temperature, and humidity data. A comparison with radiosondes launched approximately 20 km away was conducted and reveals good agreement between the RAAVEN observations and those from the radiosondes. It is believed that these data offer new perspectives that can be leveraged to gain better understanding of the interactions between the surface and cloud layer, including turbulence, turbulent transport, internal variability in thermodynamic and kinematic variables, and turbulent surface fluxes. In conjunction with the other observations collected during ATOMIC and EUREC4A, these data should provide the basis for a variety of studies over the coming years.
Table A1A list of variables included in the B1 data files, the units for each variable, and the sensors used to derive that variable. Note that the data quality flags for each variable are not included in this list but are included in the NetCDF files.
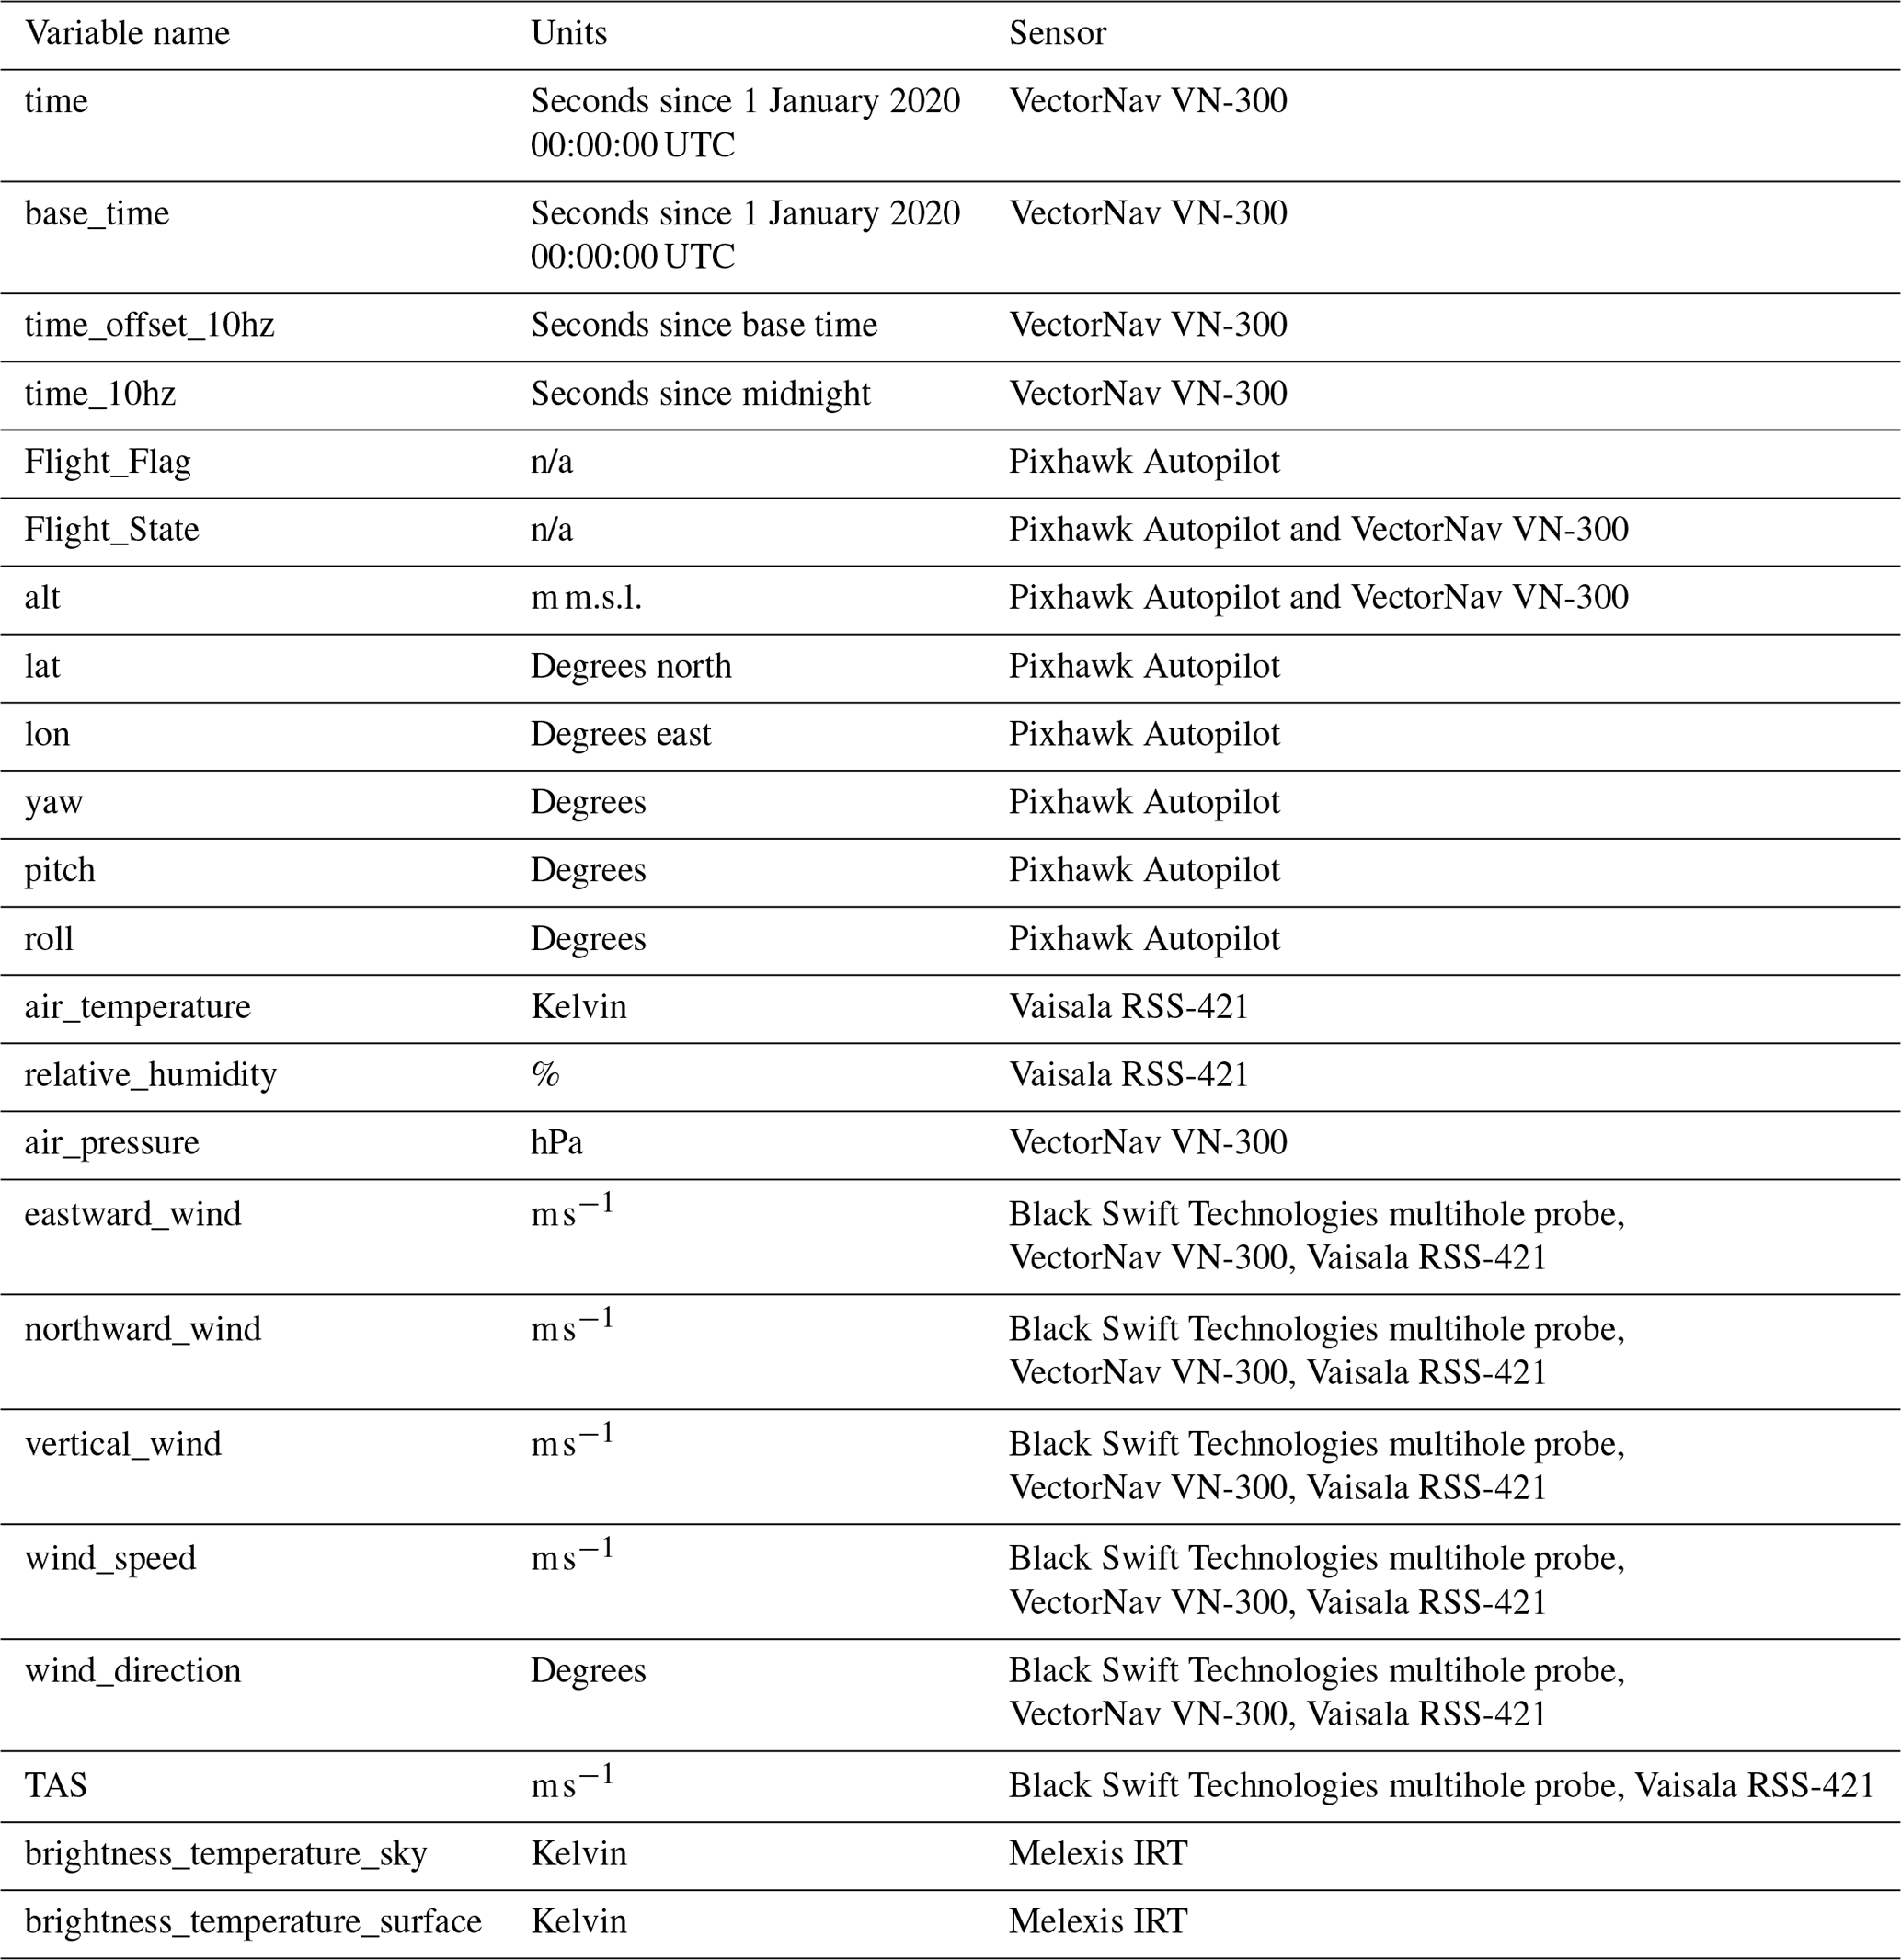
n/a: not applicable.
All co-authors contributed to the development of this dataset. GB coordinated the collection of the data and deployed to Barbados for ATOMIC, along with SB, RC, MR, CC, JH, and JI. CC and RC helped to support the analysis, preparation, and quality control of these data. JO, DL, and BA contributed to the preparation of the vehicles and other items for field deployment. GB led the development of the manuscript, with all authors contributing to editing the resulting paper.
At least one of the (co-)authors is a member of the editorial board of Earth System Science Data. The peer-review process was guided by an independent editor. Additionally, the lead author works as a consultant for Black Swift Technologies, who manufacture the multihole pressure probe used in the collection of this dataset.
Publisher's note: Copernicus Publications remains neutral with regard to jurisdictional claims in published maps and institutional affiliations.
This article is part of the special issue “Elucidating the role of clouds–circulation coupling in climate: datasets from the 2020 (EUREC4A) field campaign”. It is not associated with a conference.
We acknowledge the significant planning that went into the development of the ATOMIC and EUREC4A projects and would like to specifically thank Christopher Fairall, Bjorn Stevens, Sandrine Bony, and David Farrell for their efforts in planning and executing these major campaigns. We would specifically like to thank David Farrell for his assistance in working with local authorities to obtain the import and flight permissions required to conduct these flights. Furthermore, we would like to acknowledge Gregory Roberts and Christophe Mazel for their collaboration and for their coordination of the RPAS activities occurring from Morgan Lewis and allowing us to store equipment in their containers throughout the field campaign. Funding for this work was provided by the NOAA UAS Program Office, the NOAA Climate Program Office, and the NOAA Physical Sciences Laboratory.
This research has been supported by the National Oceanic and Atmospheric Administration Climate Program Office (CVP), the NOAA UAS Program Office, and the NOAA Physical Sciences Laboratory.
This paper was edited by Lisan Yu and reviewed by two anonymous referees.
Albrecht, B. A.: Effects of precipitation on the thermodynamic structure of the trade wind boundary layer, J. Geophys. Res., 98, 7327–7337, https://doi.org/10.1029/93JD00027, 1993.
Augstein, E., Schmidt, H., and Ostapoff, F.: The vertical structure of the atmospheric planetary boundary layer in undisturbed trade winds over the Atlantic ocean, Bound.-Lay. Meteorol., 6, 129–150, https://doi.org/10.1007/BF00232480, 1974.
Bony, S. and Dufresne, J. L.: Marine boundary layer clouds at the heart of tropical cloud feedback uncertainties in climate models, Geophys. Res. Lett., 32, L20806, https://doi.org/10.1029/2005GL023851, 2006.
Bony, S., Stevens, B., Ament, F., Bigorre, S., Chazette, P., Crewell, S., Delanoë, J., Emanuel, K., Farrell, D., Flamant, C., Gross, S., Hirsch, L., Karstensen, J., Mayer, B., Nuijens, L., Ruppert, J. H., Sandu, I., Siebesma, P., Speich, S., Szczap, F., Totems, J., Vogel, R., Wendisch, M., and Wirth, M.: EUREC4A: A Field Campaign to Elucidate the Couplings Between Clouds, Convection and Circulation, Surv. Geophys., 38, 1529–1568, https://doi.org/10.1007/s10712-017-9428-0, 2017.
Bretherton, C. S.: Insights into low-latitude cloud feedbacks from high-resolution models, Philos. T. Roy. Soc. A, 373, 20140415, https://doi.org/10.1098/rsta.2014.0415, 2015.
Brown, E. N., Friehe, C. A., and Lenschow, D. H.: The Use of Pressure Fluctuations on the Nose of an Aircraft for Measuring Air Motion, J. Appl. Meteorol. Clim., 22, 171–180, https://doi.org/10.1175/1520-0450(1983)022<0171:TUOPFO>2.0.CO;2, 1983.
de Boer, G., Borenstein, S., Calmer, R., Rhodes, M., Choate, C., Hamilton, J., Argrow, B., and Intrieri, J.: ATOMIC (Atlantic Tradewind Ocean–Atmosphere Mesoscale Interaction Campaign) CU-RAAVEN UAS: Lower-atmospheric meteorological and surface properties from the CU-RAAVEN unmanned aircraft system (UAS) over the Tropical Atlantic Ocean, near Barbados, 2020–01-24 to 2020-02-16 (NCEI Accession 0225373), NOAA National Centers for Environmental Information [data set], https://doi.org/10.25921/jhnd-8e58, 2021.
Hartmann, D. L. and Short, D. A.: On the use of Earth radiation budget statistics for studies of clouds and climate, J. Atmos. Sci., 37, 1233–1250, 1980.
Holland, J. Z.: Preliminary report on the BOMEX sea-air interaction program, B. Am. Meteorol. Soc., 51, 809–820, DOI https://doi.org/10.1175/1520-0477(1970)051<0809:PROTBS>2.0.CO;2, 1970.
Jakob, C. and Siebesma, A. P.: A New Subcloud Model for Mass-Flux Convection Schemes: Influence on Triggering, Updraft Properties, and Model Climate, Mon. Weather Rev., 131, 2765–2778 https://doi.org/10.1175/1520-0493(2003)131<2765:ANSMFM>2.0.CO;2, 2003.
Nuijens, L. and Stevens, B.: The Influence of Wind Speed on Shallow Marine Cumulus Convection, J. Atmos. Sci., 69, 168–184, available at: https://journals.ametsoc.org/view/journals/atsc/69/1/jas-d-11-02.1.xml (last access: 17 December 2021), 2012.
Nuijens, L., Medeiros, B., Sandu, I., and Ahlgrimm, M.: The behavior of trade-wind cloudiness in observations and models: the major cloud components and their variability, J. Adv. Model. Earth Sy., 7, 600–616, https://doi.org/10.1002/2014MS000390, 2015.
Pincus, R., Fairall, C. W., Bailey, A., Chen, H., Chuang, P. Y., de Boer, G., Feingold, G., Henze, D., Kalen, Q. T., Kazil, J., Leandro, M., Lundry, A., Moran, K., Naeher, D. A., Noone, D., Patel, A. J., Pezoa, S., PopStefanija, I., Thompson, E. J., Warnecke, J., and Zuidema, P.: Observations from the NOAA P-3 aircraft during ATOMIC, Earth Syst. Sci. Data, 13, 3281–3296, https://doi.org/10.5194/essd-13-3281-2021, 2021.
Quinn, P. K., Thompson, E. J., Coffman, D. J., Baidar, S., Bariteau, L., Bates, T. S., Bigorre, S., Brewer, A., de Boer, G., de Szoeke, S. P., Drushka, K., Foltz, G. R., Intrieri, J., Iyer, S., Fairall, C. W., Gaston, C. J., Jansen, F., Johnson, J. E., Krüger, O. O., Marchbanks, R. D., Moran, K. P., Noone, D., Pezoa, S., Pincus, R., Plueddemann, A. J., Pöhlker, M. L., Pöschl, U., Quinones Melendez, E., Royer, H. M., Szczodrak, M., Thomson, J., Upchurch, L. M., Zhang, C., Zhang, D., and Zuidema, P.: Measurements from the RV Ronald H. Brown and related platforms as part of the Atlantic Tradewind Ocean-Atmosphere Mesoscale Interaction Campaign (ATOMIC), Earth Syst. Sci. Data, 13, 1759–1790, https://doi.org/10.5194/essd-13-1759-2021, 2021.
Rauber R. M., Stevens, B., Ochs III, H. T., Knight, C., Albrecht, B. A., Blyth, A. M., Fairall, C. W., Jensen, J. B., Lasher-Trapp, S. G., Mayol-Bracero, O. L., Vali, G., Anderson, J. R., Baker, B. A., Bandy, A. R., Burnet, E., Brenguier, J.-L., Brewer, W. A., Brown, P. R. A., Chuang, R., Cotton, W. R., Di Girolamo, L., Geerts, B., Gerber, H., Göke, S., Gomes, L., Heikes, B. G., Hudson, J. G., Kollias, P., Lawson, R. R., Krueger, S. K., Lenschow, D. H., Nuijens, L., O'Sullivan, D. W., Rilling, R. A., Rogers, D. C., Siebesma, A. P., Snodgrass, E., Stith, J. L., Thornton, D. C., Tucker, S., Twohy, C. H., and Zuidema, P.: Rain in shallow cumulus over the ocean: The RICO campaign, B. Am. Meteorol. Soc., 88, 1912–1928, https://doi.org/10.1175/BAMS-88-12-1912, 2007.
Rieck, M., Nuijens, L., and Stevens, B.: Marine boundary layer cloud feedbacks in a constant relative humidity atmosphere, J. Atmos. Sci., 69, 2538–2550, https://doi.org/10.1175/JAS-D-11-0203.1, 2012.
Schubert, W. H., Wakefield, J. S., Steiner, E. J., and Cox, S. K.: Marine stratocumulus convection. Part II: Horizontally inhomogeneous solutions, J. Atmos. Sci., 36, 1308–1324, https://doi.org/10.1175/1520-0469(1979)036<1308:MSCPIH>2.0.CO;2, 1979.
Slingo, J. M.: The development and verification of a cloud prediction scheme for the ECMWF model, Q. J. Roy. Meteor. Soc., 113, 899–927, https://doi.org/10.1002/qj.49711347710, 1987.
Stephan, C. C., Schnitt, S., Schulz, H., Bellenger, H., de Szoeke, S. P., Acquistapace, C., Baier, K., Dauhut, T., Laxenaire, R., Morfa-Avalos, Y., Person, R., Quiñones Meléndez, E., Bagheri, G., Böck, T., Daley, A., Güttler, J., Helfer, K. C., Los, S. A., Neuberger, A., Röttenbacher, J., Raeke, A., Ringel, M., Ritschel, M., Sadoulet, P., Schirmacher, I., Stolla, M. K., Wright, E., Charpentier, B., Doerenbecher, A., Wilson, R., Jansen, F., Kinne, S., Reverdin, G., Speich, S., Bony, S., and Stevens, B.: Ship- and island-based atmospheric soundings from the 2020 EUREC4A field campaign, Earth Syst. Sci. Data, 13, 491–514, https://doi.org/10.5194/essd-13-491-2021, 2021.
Stevens, B., Farrell, D., Hirsch, L., Jansen, F., Nuijens, L., Serikov, I., Brügmann, B., Forde, M., Linne, H., Lonitz, K., and Prospero, J. M.: The Barbados cloud observatory: Anchoring investigations of clouds and circulation on the edge of the ITCZ, B. Am. Meteorol. Soc., 97, 787–801, https://doi.org/10.1175/BAMS-D-14-00247.1, 2016.
Stevens, B., Bony, S., Farrell, D., Ament, F., Blyth, A., Fairall, C., Karstensen, J., Quinn, P. K., Speich, S., Acquistapace, C., Aemisegger, F., Albright, A. L., Bellenger, H., Bodenschatz, E., Caesar, K.-A., Chewitt-Lucas, R., de Boer, G., Delanoë, J., Denby, L., Ewald, F., Fildier, B., Forde, M., George, G., Gross, S., Hagen, M., Hausold, A., Heywood, K. J., Hirsch, L., Jacob, M., Jansen, F., Kinne, S., Klocke, D., Kölling, T., Konow, H., Lothon, M., Mohr, W., Naumann, A. K., Nuijens, L., Olivier, L., Pincus, R., Pöhlker, M., Reverdin, G., Roberts, G., Schnitt, S., Schulz, H., Siebesma, A. P., Stephan, C. C., Sullivan, P., Touzé-Peiffer, L., Vial, J., Vogel, R., Zuidema, P., Alexander, N., Alves, L., Arixi, S., Asmath, H., Bagheri, G., Baier, K., Bailey, A., Baranowski, D., Baron, A., Barrau, S., Barrett, P. A., Batier, F., Behrendt, A., Bendinger, A., Beucher, F., Bigorre, S., Blades, E., Blossey, P., Bock, O., Böing, S., Bosser, P., Bourras, D., Bouruet-Aubertot, P., Bower, K., Branellec, P., Branger, H., Brennek, M., Brewer, A., Brilouet, P.-E., Brügmann, B., Buehler, S. A., Burke, E., Burton, R., Calmer, R., Canonici, J.-C., Carton, X., Cato Jr., G., Charles, J. A., Chazette, P., Chen, Y., Chilinski, M. T., Choularton, T., Chuang, P., Clarke, S., Coe, H., Cornet, C., Coutris, P., Couvreux, F., Crewell, S., Cronin, T., Cui, Z., Cuypers, Y., Daley, A., Damerell, G. M., Dauhut, T., Deneke, H., Desbios, J.-P., Dörner, S., Donner, S., Douet, V., Drushka, K., Dütsch, M., Ehrlich, A., Emanuel, K., Emmanouilidis, A., Etienne, J.-C., Etienne-Leblanc, S., Faure, G., Feingold, G., Ferrero, L., Fix, A., Flamant, C., Flatau, P. J., Foltz, G. R., Forster, L., Furtuna, I., Gadian, A., Galewsky, J., Gallagher, M., Gallimore, P., Gaston, C., Gentemann, C., Geyskens, N., Giez, A., Gollop, J., Gouirand, I., Gourbeyre, C., de Graaf, D., de Groot, G. E., Grosz, R., Güttler, J., Gutleben, M., Hall, K., Harris, G., Helfer, K. C., Henze, D., Herbert, C., Holanda, B., Ibanez-Landeta, A., Intrieri, J., Iyer, S., Julien, F., Kalesse, H., Kazil, J., Kellman, A., Kidane, A. T., Kirchner, U., Klingebiel, M., Körner, M., Kremper, L. A., Kretzschmar, J., Krüger, O., Kumala, W., Kurz, A., L'Hégaret, P., Labaste, M., Lachlan-Cope, T., Laing, A., Landschützer, P., Lang, T., Lange, D., Lange, I., Laplace, C., Lavik, G., Laxenaire, R., Le Bihan, C., Leandro, M., Lefevre, N., Lena, M., Lenschow, D., Li, Q., Lloyd, G., Los, S., Losi, N., Lovell, O., Luneau, C., Makuch, P., Malinowski, S., Manta, G., Marinou, E., Marsden, N., Masson, S., Maury, N., Mayer, B., Mayers-Als, M., Mazel, C., McGeary, W., McWilliams, J. C., Mech, M., Mehlmann, M., Meroni, A. N., Mieslinger, T., Minikin, A., Minnett, P., Möller, G., Morfa Avalos, Y., Muller, C., Musat, I., Napoli, A., Neuberger, A., Noisel, C., Noone, D., Nordsiek, F., Nowak, J. L., Oswald, L., Parker, D. J., Peck, C., Person, R., Philippi, M., Plueddemann, A., Pöhlker, C., Pörtge, V., Pöschl, U., Pologne, L., Posyniak, M., Prange, M., Quiñones Meléndez, E., Radtke, J., Ramage, K., Reimann, J., Renault, L., Reus, K., Reyes, A., Ribbe, J., Ringel, M., Ritschel, M., Rocha, C. B., Rochetin, N., Röttenbacher, J., Rollo, C., Royer, H., Sadoulet, P., Saffin, L., Sandiford, S., Sandu, I., Schäfer, M., Schemann, V., Schirmacher, I., Schlenczek, O., Schmidt, J., Schröder, M., Schwarzenboeck, A., Sealy, A., Senff, C. J., Serikov, I., Shohan, S., Siddle, E., Smirnov, A., Späth, F., Spooner, B., Stolla, M. K., Szkółka, W., de Szoeke, S. P., Tarot, S., Tetoni, E., Thompson, E., Thomson, J., Tomassini, L., Totems, J., Ubele, A. A., Villiger, L., von Arx, J., Wagner, T., Walther, A., Webber, B., Wendisch, M., Whitehall, S., Wiltshire, A., Wing, A. A., Wirth, M., Wiskandt, J., Wolf, K., Worbes, L., Wright, E., Wulfmeyer, V., Young, S., Zhang, C., Zhang, D., Ziemen, F., Zinner, T., and Zöger, M.: EUREC4A, Earth Syst. Sci. Data, 13, 4067–4119, https://doi.org/10.5194/essd-13-4067-2021, 2021.
Tiedtke, M., Heckley, W. A., and Slingo, J.: Tropical forecasting at ECMWF: The influence of physical parametrization on the mean structure of forecasts and analyses, Q. J. Roy. Meteor. Soc., 114, 639–664, https://doi.org/10.1002/qj.49711448106, 1988.
van den Kroonenberg, A., Martin, T., Buschmann, M., Bange, J., and Vörsmann, P.: Measuring the wind vector using the autonomous mini aerial vehicle M2AV, J. Atmos. Ocean. Tech., 25, 1969–1982, https://doi.org/10.1175/2008JTECHA1114.1, 2008.
Vial, J., Bony, S., Stevens, B., and Vogel, R.: Mechanisms and Model Diversity of Trade-Wind Shallow Cumulus Cloud Feedbacks: A Review, Surv. Geophys., 38, 1331–1353, https://doi.org/10.1007/s10712-017-9418-2, 2017.
Also known as drones, unmanned aircraft systems, and remotely piloted aircraft systems.
- Abstract
- Introduction
- Instrument and vehicle descriptions
- Description of measurement locations, deployment strategies, and sampling
- Data processing and quality control
- Data availability
- Summary
- Appendix A
- Author contributions
- Competing interests
- Disclaimer
- Special issue statement
- Acknowledgements
- Financial support
- Review statement
- References