the Creative Commons Attribution 4.0 License.
the Creative Commons Attribution 4.0 License.
 | 21 Jan 2022
The ABCflux database: Arctic–boreal CO2 flux observations and ancillary information aggregated to monthly time steps across terrestrial ecosystems
Anna-Maria Virkkala
Susan M. Natali
Brendan M. Rogers
Jennifer D. Watts
Kathleen Savage
Sara June Connon
Marguerite Mauritz
Edward A. G. Schuur
Darcy Peter
Christina Minions
Julia Nojeim
Roisin Commane
Craig A. Emmerton
Mathias Goeckede
Manuel Helbig
David Holl
Hiroki Iwata
Hideki Kobayashi
Pasi Kolari
Efrén López-Blanco
Maija E. Marushchak
Mikhail Mastepanov
Lutz Merbold
Frans-Jan W. Parmentier
Matthias Peichl
Torsten Sachs
Oliver Sonnentag
Masahito Ueyama
Carolina Voigt
Mika Aurela
Julia Boike
Gerardo Celis
Namyi Chae
Torben R. Christensen
M. Syndonia Bret-Harte
Sigrid Dengel
Han Dolman
Colin W. Edgar
Bo Elberling
Eugenie Euskirchen
Achim Grelle
Juha Hatakka
Elyn Humphreys
Järvi Järveoja
Ayumi Kotani
Lars Kutzbach
Tuomas Laurila
Annalea Lohila
Ivan Mammarella
Yojiro Matsuura
Gesa Meyer
Mats B. Nilsson
Steven F. Oberbauer
Sang-Jong Park
Roman Petrov
Anatoly S. Prokushkin
Christopher Schulze
Vincent L. St. Louis
Eeva-Stiina Tuittila
Juha-Pekka Tuovinen
William Quinton
Andrej Varlagin
Donatella Zona
Viacheslav I. Zyryanov
Past efforts to synthesize and quantify the magnitude and change in carbon dioxide (CO2) fluxes in terrestrial ecosystems across the rapidly warming Arctic–boreal zone (ABZ) have provided valuable information but were limited in their geographical and temporal coverage. Furthermore, these efforts have been based on data aggregated over varying time periods, often with only minimal site ancillary data, thus limiting their potential to be used in large-scale carbon budget assessments. To bridge these gaps, we developed a standardized monthly database of Arctic–boreal CO2 fluxes (ABCflux) that aggregates in situ measurements of terrestrial net ecosystem CO2 exchange and its derived partitioned component fluxes: gross primary productivity and ecosystem respiration. The data span from 1989 to 2020 with over 70 supporting variables that describe key site conditions (e.g., vegetation and disturbance type), micrometeorological and environmental measurements (e.g., air and soil temperatures), and flux measurement techniques. Here, we describe these variables, the spatial and temporal distribution of observations, the main strengths and limitations of the database, and the potential research opportunities it enables. In total, ABCflux includes 244 sites and 6309 monthly observations; 136 sites and 2217 monthly observations represent tundra, and 108 sites and 4092 observations represent the boreal biome. The database includes fluxes estimated with chamber (19 % of the monthly observations), snow diffusion (3 %) and eddy covariance (78 %) techniques. The largest number of observations were collected during the climatological summer (June–August; 32 %), and fewer observations were available for autumn (September–October; 25 %), winter (December–February; 18 %), and spring (March–May; 25 %). ABCflux can be used in a wide array of empirical, remote sensing and modeling studies to improve understanding of the regional and temporal variability in CO2 fluxes and to better estimate the terrestrial ABZ CO2 budget. ABCflux is openly and freely available online (Virkkala et al., 2021b, https://doi.org/10.3334/ORNLDAAC/1934).
- Article
(9105 KB) - Full-text XML
- BibTeX
- EndNote


The Arctic–boreal zone (ABZ), comprising the northern tundra and boreal biomes, stores approximately half the global soil organic carbon pool (Hugelius et al., 2014; Tarnocai et al., 2009; Mishra et al., 2021). As indicated by this large carbon reservoir, the ABZ has acted as a carbon sink over the past millennia due to the cold climate and slow decomposition rates (Siewert et al., 2015; Hugelius et al., 2020; Gorham, 1991). However, these carbon stocks are increasingly vulnerable to climate change, which is occurring rapidly across the ABZ (Box et al., 2019). As a result, carbon is being lost from this reservoir to the atmosphere as carbon dioxide (CO2) through increased ecosystem respiration (Reco) (Schuur et al., 2015; Parker et al., 2015; Voigt et al., 2017). The impact of increased CO2 emissions on global warming depends on the extent to which respiratory losses are offset by gross primary productivity (GPP), the vegetation uptake of atmospheric CO2 via photosynthesis (McGuire et al., 2016; Cahoon et al., 2016).
Carbon dioxide flux measurements provide a means to monitor the net CO2 balance (i.e., net ecosystem exchange; NEE, a balance between GPP and Reco) across time and space (Baldocchi, 2008; Pavelka et al., 2018). There are three main techniques used to measure fluxes at the ecosystem level that represent fluxes from plants and soils to the atmosphere: eddy covariance, automated and manual chambers, and snow diffusion methods (hereafter diffusion; for a comparison of the techniques, see Table 1 in McGuire et al., 2012). The eddy covariance technique estimates NEE at the ecosystem scale (ca. 0.01 to 1 km2 footprint) at high temporal resolution (i.e., h) using nondestructive and automated measurements (Pastorello et al., 2020). Automated and manual chamber techniques measure NEE at fine spatial scales (<1 m2) and in small-statured ecosystems, common in the tundra, where the chambers can fit over the whole plant community (Järveoja et al., 2018; López-Blanco et al., 2017). The diffusion technique, also operating at fine spatial scales, can be used to measure the transport of CO2 within a snowpack (Björkman et al., 2010b). The eddy covariance technique has been used globally for over three decades and chamber and diffusion techniques for even longer.
Historically, the number and distribution of ABZ flux sites has been rather limited compared to observations in temperate regions (Baldocchi et al., 2018). Due to these data gaps, quantifying the net annual CO2 balance across the ABZ has posed a significant challenge (Natali et al., 2019a; McGuire et al., 2016; Virkkala et al., 2021a). However, over the past decade, the availability of ABZ flux data has increased substantially. Many, but not all, of the ABZ eddy covariance sites are a part of broader networks, such as the global FLUXNET and regional AmeriFlux, Integrated Carbon Observation System (ICOS) and the European Fluxes Database Cluster (EuroFlux), where data are standardized and openly available (Paris et al., 2012; Novick et al., 2018; Pastorello et al., 2020). These networks primarily include flux and meteorological data but do not often include other environmental descriptions such as soil carbon stocks, dominant plant species, or the disturbance history of a given site (but see, for example, Biological, Ancillary, Disturbance, and Metadata data in Ameriflux), which are important for understanding the controls on CO2 fluxes. Moreover, even though some ABZ annual chamber measurements are included in the global soil respiration database (SRDB) (Jian et al., 2021), and in the continuous soil respiration database (COSORE) (Bond-Lamberty et al., 2020), standardized datasets providing ABZ CO2 flux measurements from eddy covariance, chambers, and diffusion, along with comprehensive metadata, have been nonexistent. Such an effort would create potential for a more thorough understanding of ABZ CO2 fluxes. Therefore, compiling these flux measurements and their supporting ancillary data into one database is clearly needed to support future modeling, remote sensing, and empirical data mining efforts.
Table 1A summary of past CO2 flux synthesis efforts. If site numbers were not provided in the paper, this was calculated as the number of unique sets of coordinates. Note: n/a – not applicable.

Arctic–boreal CO2 fluxes have been previously synthesized in a handful of regional studies (Belshe et al., 2013; McGuire et al., 2012; Luyssaert et al., 2007; Baldocchi et al., 2018; Virkkala et al., 2018, 2021a; Natali et al., 2019a) (Fig. 1 and Table 1). One of the main challenges in these previous efforts, in addition to the limited geographical coverage of ABZ sites and lack of environmental descriptions, has been the variability of the synthesized seasonal measurement periods. Most of these efforts have allowed the seasonal definitions and measurement periods to vary across the sites, creating uncertainty in the inter-site comparison of flux measurements. An alternative approach to define seasonality is to focus on standard time periods such as months (Natali et al., 2019a). Although focusing on monthly fluxes may result in a small decrease in synthesizable data, because publications, particularly older ones, often provide seasonal rather than monthly flux estimates (see, e.g., Euskirchen et al., 2012; Nykänen et al., 2003; Björkman et al., 2010a; Oechel et al., 2000; Merbold et al., 2009), compiling monthly fluxes has several advantages over the seasonal fluxes. These advantages include (i) better comparability of measurements, (ii) ability to bypass problems related to defining seasons across large regions, and (iii) ease of linking these fluxes to remote sensing and models.

Figure 1The flux site distribution in previous syntheses that focused on compiling fluxes from high latitudes (McGuire et al., 2012; Belshe et al., 2013; Natali et al., 2019a; Virkkala et al., 2021a; and this study, ABCflux). The Arctic–boreal zone is highlighted in dark grey; countries are shown in the background. Based on the unique latitude–longitude coordinate combinations in the tundra, there were 136 tundra sites in ABCflux, 104 tundra sites in Virkkala et al. (2021a), 68 tundra sites in Natali et al. (2019a), 34 tundra sites in Belshe et al. (2013), and 66 tundra sites in McGuire et al. (2012). Observations that were included in previous studies but not in ABCflux represent fluxes aggregated over seasonal, not monthly periods.
Our goal is to build upon past synthesis efforts and compile a new database of Arctic–boreal CO2 fluxes (ABCflux version 1) that combines eddy covariance, chamber, and diffusion data at monthly timescales with supporting environmental information to help facilitate large-scale assessments of the ABZ carbon cycle. This paper provides a general description of the ABCflux database by characterizing the data sources and database structure (Sect. 2), as well as describing the characteristics of the database (Sect. 3). Additionally, we describe the main strengths, limitations, and opportunities of this database (Sect. 4) and its potential utility for future studies aiming to understand terrestrial ABZ CO2 fluxes.
ABCflux focuses on the area covered by the northern tundra and boreal biomes (>45∘ N), as characterized in Dinerstein et al. (2017), Fig. 2, and compiles in situ measured terrestrial ecosystem-level CO2 fluxes aggregated to monthly time periods (unit: g C m−2 per month). We chose this aggregation interval as monthly temporal frequency is a common, straightforward, and standard interval used in many synthesis, modeling studies, remote sensing products, and process model output (Didan, 2015; Natali et al., 2019a; Hayes et al., 2014). Furthermore, scientific papers often report monthly fluxes, facilitating accurate extraction to ABCflux. We compiled only aggregated fluxes to allow easy usage of the database and to keep the database concise and cohesive. We designed this database so that these monthly fluxes, compiled from scientific papers or data repositories or contributed by site principal investigators (PIs), can be explored from as many sites as possible and across different months, regions and ecosystems. The database is not designed for studies exploring flux variability within a month, or how different methodological decisions (e.g., flux filtering or partitioning approaches) influence the estimated fluxes. If a potential data user requires fluxes at higher temporal frequency or is interested to study the uncertainties related to flux processing, we suggest they utilize data from other flux repositories (see Sect. 2.1.2.) or contact PIs.
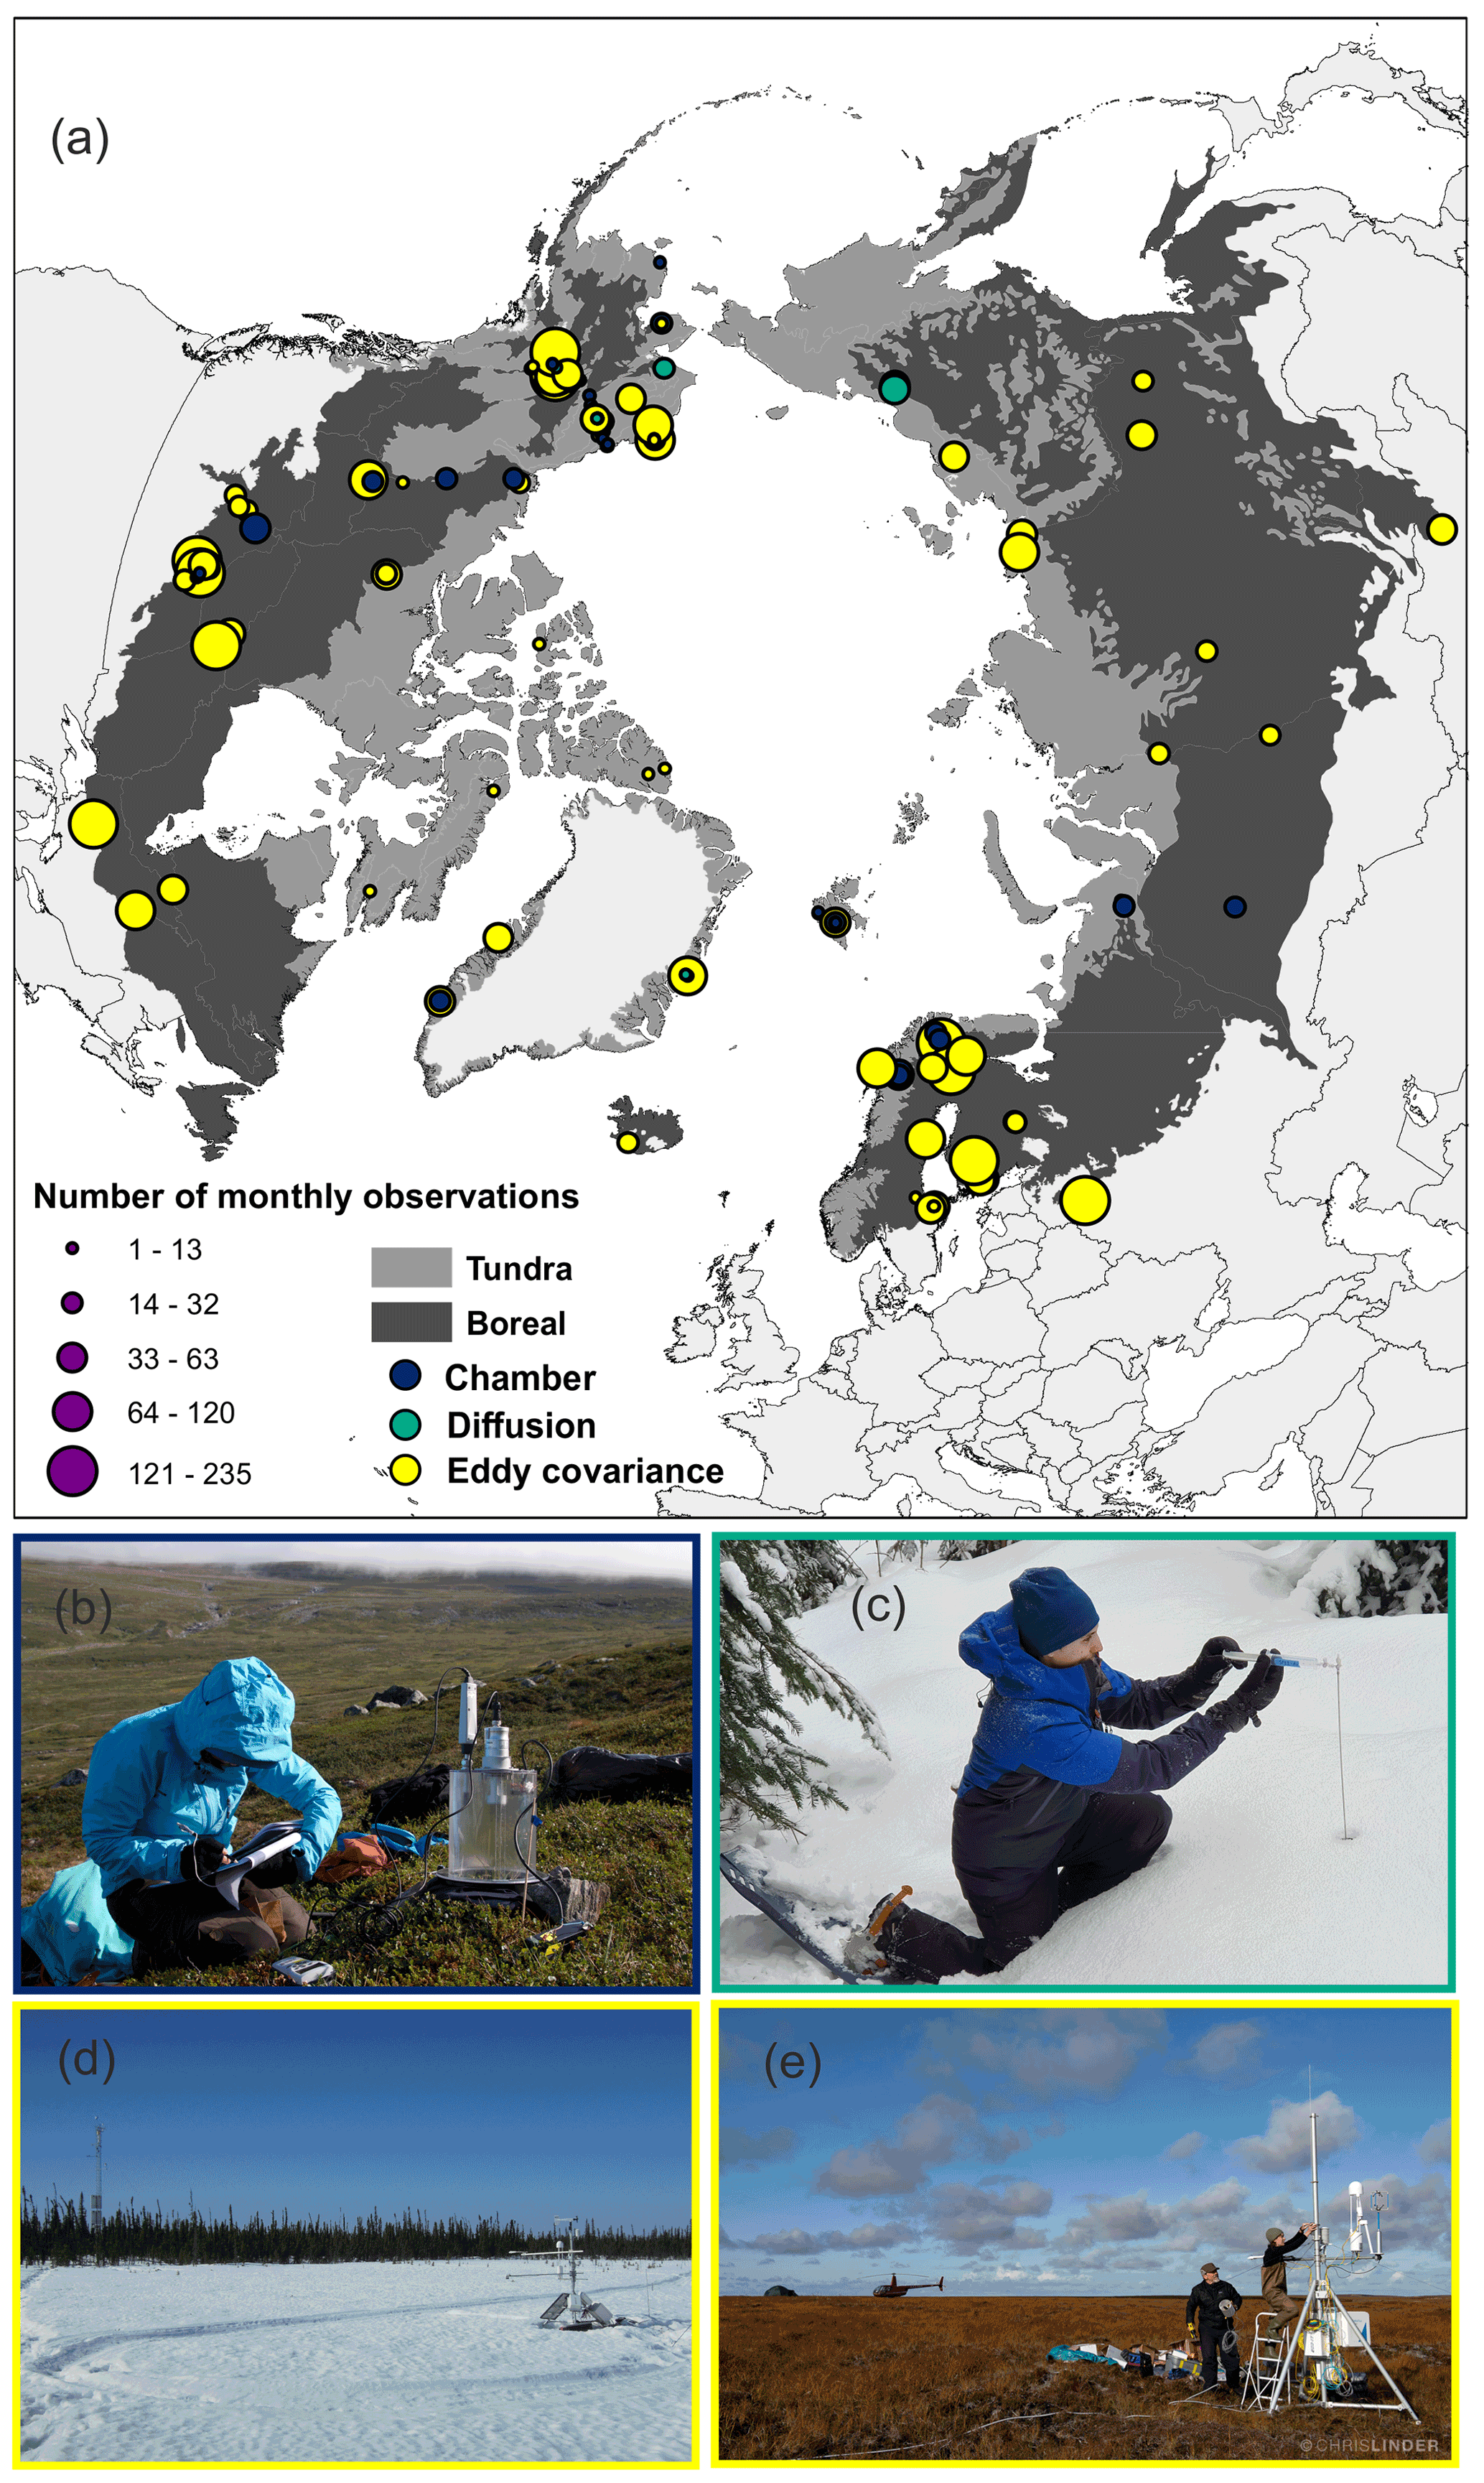
Figure 2Map showing the distribution and measurement technique at each site (a), and examples of a manual chamber (b), diffusion measurements (c), and two eddy covariance towers in a wetland–forest and tundra ecosystem (d, e). Photographs were taken in Kilpisjärvi, Finland (July 2016), Montmorency forest, Canada (April 2021), Scotty Creek, Canada (April, 2014), and Yukon–Kuskokwim Delta, Alaska (September 2019). Image credits for panels (b)–(e): Markus Jylhä, Alex Mavrovic, Gabriel Hould Gosselin, Chris Linder, and Manuel Helbig.
Although the three flux measurement techniques included in ABCflux primarily measure NEE, chamber and eddy covariance techniques can also be used to estimate GPP (the photosynthetic flux) and Reco (comprising emissions from autotrophic and heterotrophic respiration) (Keenan and Williams, 2018), which are also included in the database. At eddy covariance sites, GPP and Reco are indirectly derived from NEE using partitioning methods that primarily use light and temperature data (Lasslop et al., 2010; Reichstein et al., 2005). At chamber sites, Reco can be measured directly with dark chambers, from which GPP can be calculated by subtracting Reco from NEE (Shaver et al., 2007). In general, these partitioned GPP and Reco fluxes have higher uncertainties than the NEE measurements since they are modeled based on additional data and various assumptions (Aubinet et al., 2012). However, GPP and Reco fluxes were included in ABCflux because these component fluxes may help to better understand and quantify the underlying processes of land–atmosphere CO2 exchange.
In addition to CO2 fluxes, we gathered information describing the general site conditions (e.g., site name, coordinates, vegetation type, disturbance history, a categorical soil moisture variable, and soil organic carbon stocks), micrometeorological and environmental measurements (e.g., air and soil temperatures, precipitation, soil moisture, snow depth), and flux measurement technique (e.g., measurement frequency, instrumentation, gap-filling and partitioning method, number of spatial replicates for chamber measurements, flux data quality), wherever possible.
2.1 Data sources
2.1.1 Literature search
We identified potential CO2 flux studies and sites from prior synthesis efforts (Belshe et al., 2013; McGuire et al., 2012, 2018, 2021b; Natali et al., 2019a), including a search of citations within and of the studies included in these prior syntheses. We also conducted a literature search in Web of Science with the following search words: “carbon flux” or “carbon dioxide flux” or “NEE” or “net ecosystem exchange” and “arctic” or “tundra” or “boreal”. This was done to ensure that our database included the most recent publications. We included studies that reported at least NEE, presented at monthly or finer temporal resolution, and had supporting environmental ancillary data describing the sites. We did not include fluxes reported at longer time steps (e.g., seasonal aggregations), which, based on our rough estimate, resulted in a 10 %–20 % loss of data from sites and periods that would have been new to ABCflux. These excluded data primarily included some older, non-active eddy covariance sites and seasonal chamber measurements (e.g., Nobrega and Grogan, 2008; Heliasz et al., 2011; Fox et al., 2008). However, many of these data were located in the vicinity of existing sites covered by ABCflux (e.g., Daring Lake, Abisko); thus excluding these measurements does not dramatically influence the geographical coverage of the sites. We extracted our variables of interest (Sect. 2.3.) from these selected papers during 2018–2020. Data from line and bar plots were extracted using Plot Digitizer (http://plotdigitizer.sourceforge.net/, last access: 16 October 2019) and converted to our flux units (g C m−2 per month) if needed. Data from experimental treatments were excluded; however, we included flux data from unmanipulated control plots. Monthly non-growing season fluxes from Natali et al. (2019a) were extracted from the recently published data compilation (Natali et al., 2019b). Winter chamber or diffusion measurements in forests from Natali et al. (2019b) were included in the “ground_nee” field, which represents forest understory (not whole-ecosystem) NEE.
2.1.2 Flux repositories
We downloaded eddy covariance and supporting environmental data products from AmeriFlux (Novick et al., 2018), Fluxnet2015 (Pastorello et al., 2020), EuroFlux database cluster (ICOS, Carbon Extreme, Carbo Africa, GHG Europe, Carbo Italy, INGOS) (Paris et al., 2012; Valentini, 2003), and Station for Measuring Ecosystem–Atmosphere Relations (Hari et al., 2013). Data that were filtered for USTAR (i.e., low friction velocity conditions) and gap-filled were downloaded from repositories in 2018–2020. USTAR varied among sites due to differing site-level assumptions. We downloaded only gap-filled data that met the USTAR criteria for either the tower PI or given through the database processing pipeline. However, Fluxnet2015 provides several different methods for determining data quality based on different USTAR criteria. In this case, we used the Fluxnet2015 common USTAR threshold (CUT, i.e. all years at the site filtered with the same USTAR threshold; Pastorello et al., 2020). For observations extracted from EuroFlux, USTAR thresholds for each site were derived as described in Papale et al. (2006) and Reichstein et al. (2005), using nighttime data. We extracted fluxes readily aggregated to monthly intervals by the data processing pipeline from Fluxnet2015 and EuroFlux. These aggregations were not given in AmeriFlux and SMEAR. We downloaded daily gap-filled data from these repositories and summed the data to monthly time steps. We did not aggregate any repository GPP, Reco, or NEE datasets that were not gap-filled. If fluxes were available for the same site and period both in Natali et al. (2019b) and flux repository extractions, the flux repository observations were kept in the database. Some repositories supplied eddy covariance data version numbers, which were added to the flux database.
2.1.3 Permafrost Carbon Network data solicitation
A community call was solicited in 2018 through a CO2 flux synthesis workshop (Parmentier et al., 2019; Arctic Data Center, 2021), whereby the network of ABZ flux researchers was contacted and invited to contribute their most current unpublished eddy covariance and chamber data. This resulted in an additional 39 sites and 1372 monthly observations (see column extraction_source).
2.2 Partitioning approaches at eddy covariance flux sites
ABCflux compiles eddy covariance observations that were primarily partitioned using nighttime Reco, which is based on the assumption that during night, NEE measured at low light levels is equivalent to Reco (Reichstein et al., 2005). This nighttime partitioning approach has been the most frequently used approach to fill gaps in flux time series (Wutzler et al., 2018) due to its simplicity, strong evidence of temperature sensitivity of respiration, and direct use of Reco (i.e. nighttime NEE) flux data to estimate temperature response curves (Reichstein et al., 2005). As the nighttime approach was one of the first widely used partitioning approaches, fluxes partitioned with the approach were the only ones available in the flux repositories at some of the older sites. Daytime partitioning and other approaches started to develop more rapidly in the 2010s (Lasslop et al., 2010; Tramontana et al., 2020). Each of the partitioning approaches has uncertainties related to the ecological assumptions, input data, model parameters, and statistical approaches used to fill the gaps.
PIs that submitted data to us directly gap-filled and partitioned fluxes using the approach that they determined works best at their site. Based on similar logic, fluxes extracted from papers were not always partitioned using the nighttime approach. In these cases, we trusted the expertise of PIs and authors and included fluxes partitioned using other methods. Although this created some heterogeneity in the flux processing algorithms in the database, this approach was chosen so that we could be more inclusive with the represented sites.
Thus, in summary, our goal was to compile fluxes that (1) can be easily compared with each other (i.e., have been gap-filled and partitioned in a systematic way), (2) are as accurate as possible given the site conditions and measurement setup (i.e., other approaches were accepted if this was suggested by the PI), and (3) summarize information about the processing algorithms used.
2.3 Data quality screening
We screened for poor-quality data, potential unit and sign convention issues, and inaccurate coordinates. Repository eddy covariance data were processed and quality checked using quality flags associated with monthly data supplied by the repository processing pipeline. Fluxnet2015 and EuroFlux database include a data quality flag for the monthly aggregated data indicating percentage of measured (quality flag QC=0 in FLUXNET2015) and good-quality gap-filled data (quality flag QC=1 in FLUXNET2015; average from monthly data; 0=extensive gap-filling, 1=low gap-filling); for more details see the Fluxnet2015 web page (https://fluxnet.org/data/fluxnet2015-dataset/variables-quick-start-guide/last access: 7 October 2020) and Pastorello et al. (2020). Note that this quality flag field for the aggregated data differs from the ones calculated for half-hourly data derived directly from eddy covariance tower processing programs (such as Eddypro). We removed monthly data with a quality flag of 0. Data with quality flags >0 were left within the database for the user to decide on additional screening criteria. Note that the monthly data produced by the repository processing pipeline do not include separate gap-filled percentages or errors of model fit for NEE similar to those associated with the half-hourly data. However, we included these fields to the database as PIs contributing data or scientific papers sometimes had this information; however these fields were not used in data quality screening. Both the monthly quality flag and gap-filled percentage fields describe the number and quality of the gap-filled data that needed to be filled due to, for example, instrument malfunction, power shortage, extreme weather events, and periods with insufficient turbulence conditions.
At chamber and diffusion sites, we disregarded observations including a low number of temporal replicates within a month (<3 individual measurements in summer months) and only one measurement month to ensure the temporal representativeness of the measurements. For the spring (March–May), autumn (September–November), and winter (December–February) months, one temporal replicate was accepted due to scarcity of measurements outside the summer season (June–August); measurement frequency is included in the database. We excluded monthly summertime measurements with <3 temporal replicates because within summer months, meteorological conditions and the phenological status of the ecosystem can vary significantly (Lafleur et al., 2012; Euskirchen et al., 2012; Schneider et al., 2012; Heiskanen et al., 2021), and a single measurement is unlikely to capture this variability. Our decision to exclude measurements that have only one measurement month was based on our goal to assess the temporal variability of fluxes. We justified the acceptance of a lower number of temporal replicates for the other seasons based on the assumption that flux variability is lower during the winter months, and at least during most of the spring and autumn months, due to the insulating effects of snow (Aurela et al., 2002; Bäckstrand et al., 2010). We estimate that excluding measurements with <3 temporal replicates during the summer months resulted in a 10 % loss of data. In total, 98 % of the chamber observations were from published studies; we assume that the peer review process assessed the quality of published data.
We further screened for spatial coordinate accuracy by visualizing the sites on a map. If a given site was located in water or had imprecise coordinates, the site researchers were contacted for more precise coordinates. We screened for potential duplicate sites and observations that were extracted from different data sources. Duplicate NEEs extracted from papers that were also extracted from flux repositories were compared to estimate uncertainties associated with paper extractions using Plot Digitizer as a means for extracting monthly fluxes. A linear regression between paper (Plot Digitizer) and repository extraction showed that data extracted using Plot Digitizer were highly correlated with data from online databases, providing confidence in estimates extracted using Plot Digitizer (R2=0.91, slope=1.002, n=192). Out of these duplicate observations, we only kept the data extracted from the repository in the database. Finally, we asked site PIs to verify that the resulting information was correct.
2.4 Database structure and columns
The resulting ABCflux database includes 94 variables: 16 are flux measurements and associated metadata (e.g., NEE, measurement date and duration), 21 describe flux measurement methods (e.g., measurement frequency, gap-filling method), 49 describe site conditions (e.g., soil moisture, air temperature, vegetation type), and 8 describe the extraction source (e.g., primary author or site PI, citation, data maturity). A total of 61 variables are considered static and thus do not vary with repeated measurements at a site (e.g., site name, coordinates, vegetation type), while 33 variables are considered dynamic and vary monthly (e.g., soil temperature). Table 2 includes a description of each of the 94 variables, as well as the proportion of monthly observations present in each column. ABCflux is shared as a comma separated values (csv) file with 6309 rows; however, not all the rows have data in each column (indicated by NA for character columns and −9999 for numeric columns).
Table 2Database variables and the proportion of monthly observations in each variable. There are in total 6309 monthly observations in the database.

We refer to all fields included in ABCflux as “observations” although we acknowledge that, for example, GPP and Reco are indirectly derived variables at eddy covariance sites and that some flux and ancillary data can also be partly gap-filled. Further, our database does not include the actual raw observations; rather it provides monthly aggregates. Positive values for NEE indicate net CO2 loss to the atmosphere (i.e., CO2 source), and negative numbers indicate net CO2 uptake by the ecosystem (i.e., CO2 sink). For consistency, GPP is presented as negative (uptake) values and Reco as positive.
2.5 Database visualization
The visualizations in this paper were made with the full ABCflux database using each site month as a unique data point (from now on, these are referred to as monthly observations) and the sites listed in the “study_id_short” field. We visualized these across the vegetation types (“veg_type_short”), countries (“country”), biomes (“biome”), and measurement method (“flux_method”).
To understand the distribution and representativeness of monthly observations and sites across the ABCflux as well as the entire ABZ, we used geospatial data to calculate the aerial coverages of each vegetation type and country. Vegetation type was derived from the European Space Agency Climate Change Initiative's (ESA CCI) land cover product aggregated and resampled to 0.0083∘ for the boreal biome (Lamarche et al., 2013) and the raster version of the Circumpolar Arctic Vegetation Map (CAVM) for the tundra biome resampled to the same resolution as the ESA CCI product (Raynolds et al., 2019). ESA CCI layers were reclassified by grouping land cover types to the same vegetation type classes represented by ABCflux: boreal wetland and peatland (from now on, boreal wetland; classes 160, 170, 180 in ESA CCI product), deciduous broadleaf forest (60–62), evergreen needleleaf forest (70–72), deciduous needleleaf forest (80–82), mixed forest (90), and sparse and mosaic boreal vegetation (40, 100, 100, 120, 121, 122, 130, 140, 150, 151, 152, 153, 200, 201, 202). Croplands (10, 11, 12, 20, 30) and urban areas (190) were removed. We used the five main physiognomic classes from CAVM in the tundra. Glaciers and permanent water bodies included in either of these products were removed. Note that in ABCflux and for the site-level visualizations in this paper, vegetation type for each of the flux sites was derived from site-level information, not these geospatial layers. These same glacier, water, and cropland masks were applied to the country boundaries (Natural Earth Data, 2021) to calculate the terrestrial area of each country. We further used TerraClimate annual and seasonal air temperature and precipitation layers averaged over 1989–2020 to visualize the distribution of monthly observations across the Arctic–boreal climate space (Abatzoglou et al., 2018).
3.1 General characteristics of the database
ABCflux includes 244 sites and 6309 monthly observations, out of which 136 sites and 2217 monthly observations are located in the tundra (54 % of sites and 52 % of observations from North America, 46 % and 48 % from Eurasia), while 108 sites and 4092 monthly observations are located in the boreal biome (59 % of sites and 58 % of observations from North America, 41 % and 42 % from Eurasia) (Table 3). The largest source of flux data is the flux repositories (48 % of the monthly observations), while flux data extracted from papers or contributed by site PIs amount to 30 % and 22 % of the monthly observations, respectively. The database primarily includes sites in unmanaged ecosystems, but it does contain a small number (6) of sites in managed forests.
Table 3General statistics of the database. Number of monthly CO2 flux measurements and sites derived from eddy covariance, chamber, and diffusion techniques, and the proportion of data coming from different data sources. Note that some of the data extracted from flux repositories and papers were further edited by the PIs; this information can be found in the database. For this table, observations that were fully contributed by the PI were considered as PI-contributed.
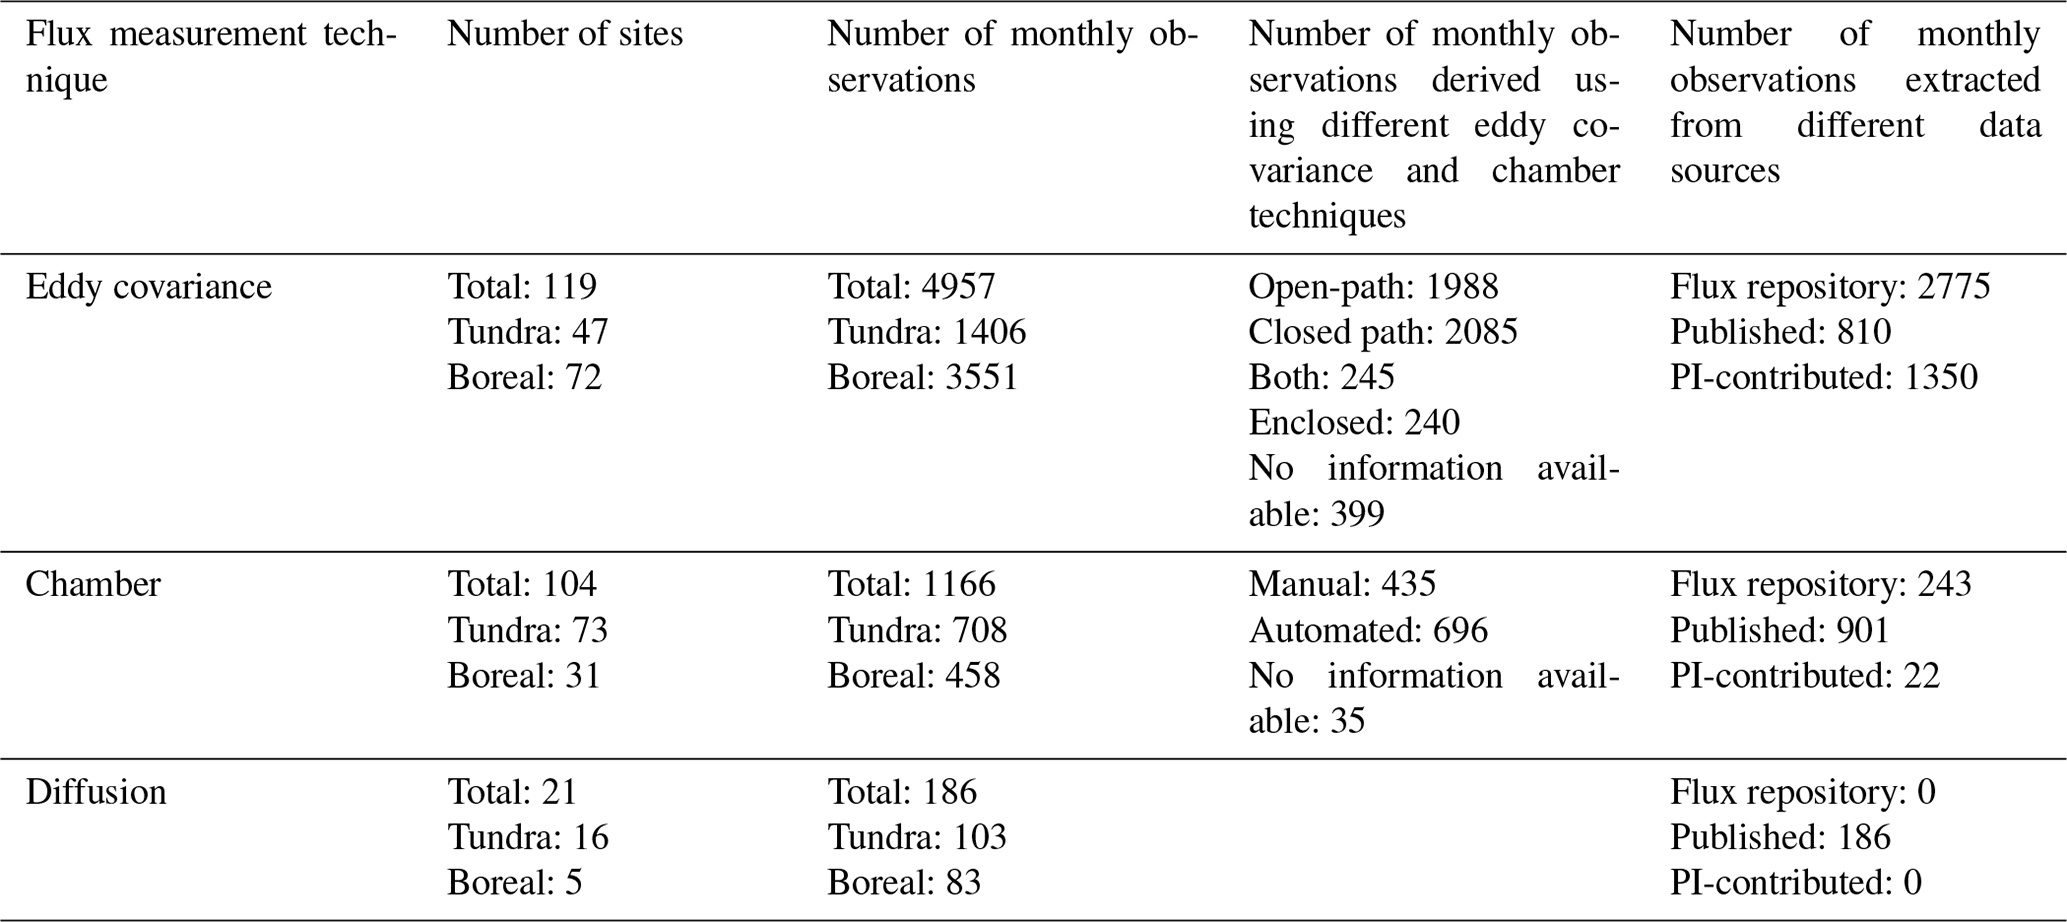
The majority of observations in ABCflux have been measured with the eddy covariance technique (119 sites and 4957 monthly observations), whereas chambers and diffusion methods were used at 125 sites and 1352 observations (Table 3). About 46 % of the eddy covariance measurements are based on gas analyzers using closed-path technology (including enclosed analyzers), 40 % are based on open-path technology, 5 % include both and 8 % are unknown. A total of 52 % of chamber measurements were automated chambers (monitoring the fluxes continuously throughout the growing season). Only 3 % of the measurements were completed using diffusion methods during the winter. Chamber and diffusion studies were primarily from the tundra and the sparsely treed boreal wetlands, but a few studies with ground surface CO2 fluxes from forests (i.e., capturing the ground cover vegetation and not the whole ecosystem) are also included in their own fields so that they can not be mixed up with ecosystem-scale measurements (“ground_nee”, ”ground_gpp”, “ground_reco”). Further, a few soil CO2 flux sites measuring fluxes primarily on unvegetated surfaces during the non-growing season are included in the database (“rsoil”). These were included in the database because ground surface or soil fluxes during the non-growing season can be of similar magnitude to the ecosystem-level fluxes when trees remain dormant (Ryan et al., 1997; Hermle et al., 2010). Therefore, these ground or soil fluxes could potentially be used to represent ecosystem-level fluxes during some of the non-growing season months. However, we did not make an extensive literature search for these observations, rather we compiled observations if they came up in our NEE search. Therefore, the data in these ground surface and soil flux columns represent only a portion of such available data across the ABZ.
The geographical coverage of the flux data is highly variable across the ABZ, with most of the sites and monthly observations coming from Alaska (37 % of the sites and 28 % of the monthly observations), Canada (19 % and 29 %), Finland (7 % and 15 %), and Russia (14 % and 13 %) (Fig. 3). The sites cover a broad range of vegetation types but were most frequently measured in evergreen needleleaf forests (23 % of the sites and 37 % of the monthly observations) and wetlands in the tundra or boreal zone (30 % and 27 %) (Fig. 4). The northernmost and southernmost ecosystems had fewer sites and observations than more central ecosystems (barren tundra: 45 % of the sites and 3 % of the monthly observations, prostrate shrub: 2 % and <1 %, deciduous broadleaf forest: 1 % and 3 %, deciduous needleleaf forest: 5 % and 4 %, mixed forest <1 % and <1 %). The sites in ABCflux cover the most frequent climatic conditions across the Arctic–boreal zone relatively well; however, conditions with high precipitation and low temperatures are lacking sites (Fig. 5). ABCflux includes sites experiencing various types of disturbances, with the majority of disturbed sites encountering fires (24 sites and 901 monthly observations), thermokarst (4 sites and 113 monthly observations), or harvesting (6 sites and 258 monthly observations). However, ABCflux is dominated by sites in relatively undisturbed environments or sites lacking disturbance information (only 20 % of the sites and 30 % of the monthly observations include disturbance information).
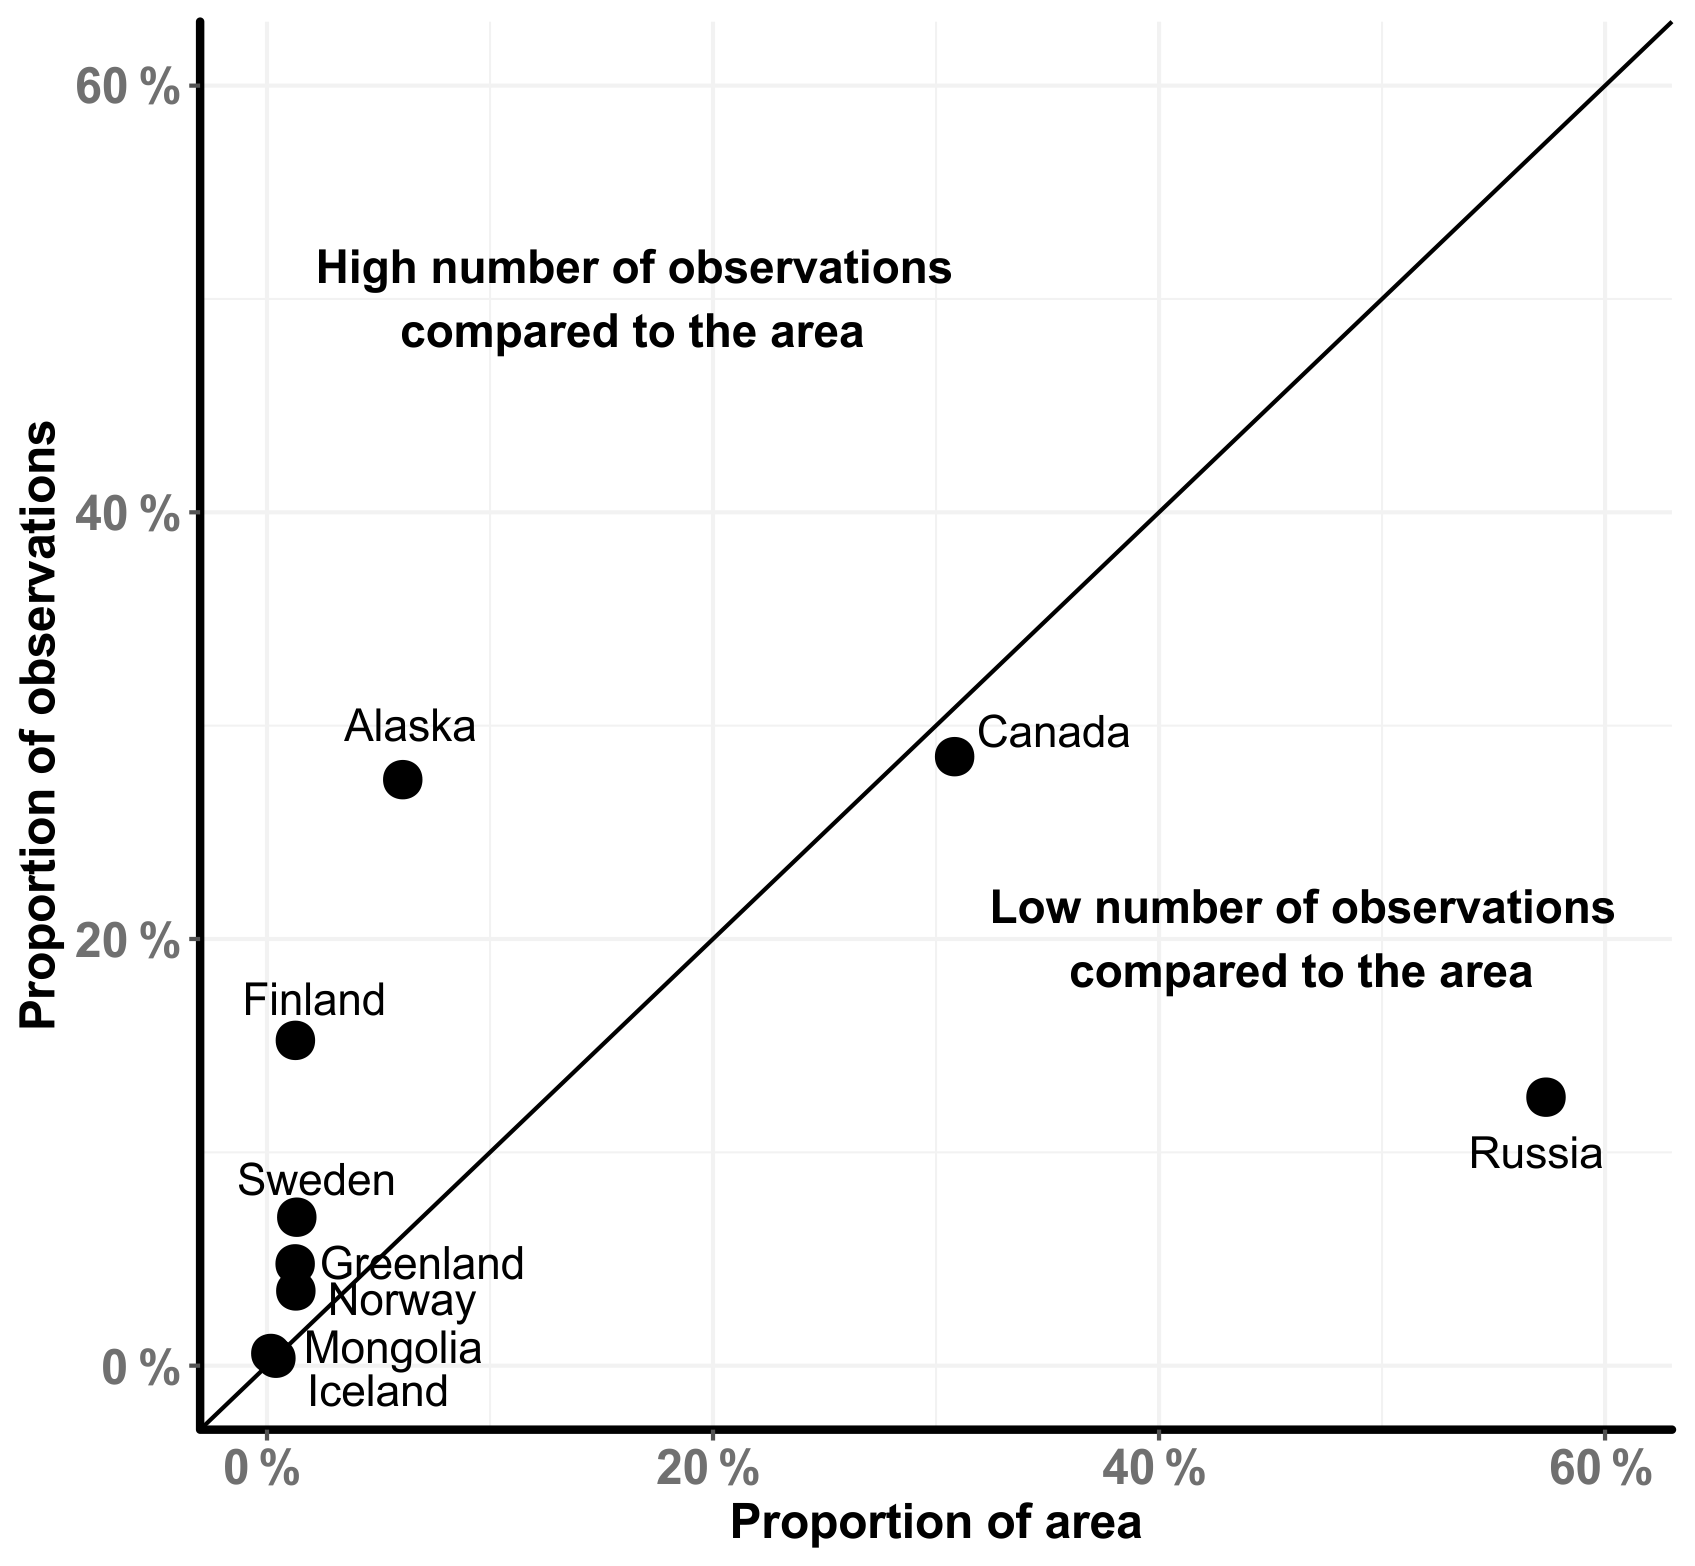
Figure 3The proportion of monthly observations in each country/region compared to the proportion of the areal extent of the country/region across the entire Arctic–boreal zone. Ideally, points would be close to the 1:1 line (i.e., large countries/regions have more observations than small countries/regions). Permanent water bodies, glaciers, croplands, and urban areas were masked from the areal extent calculation.
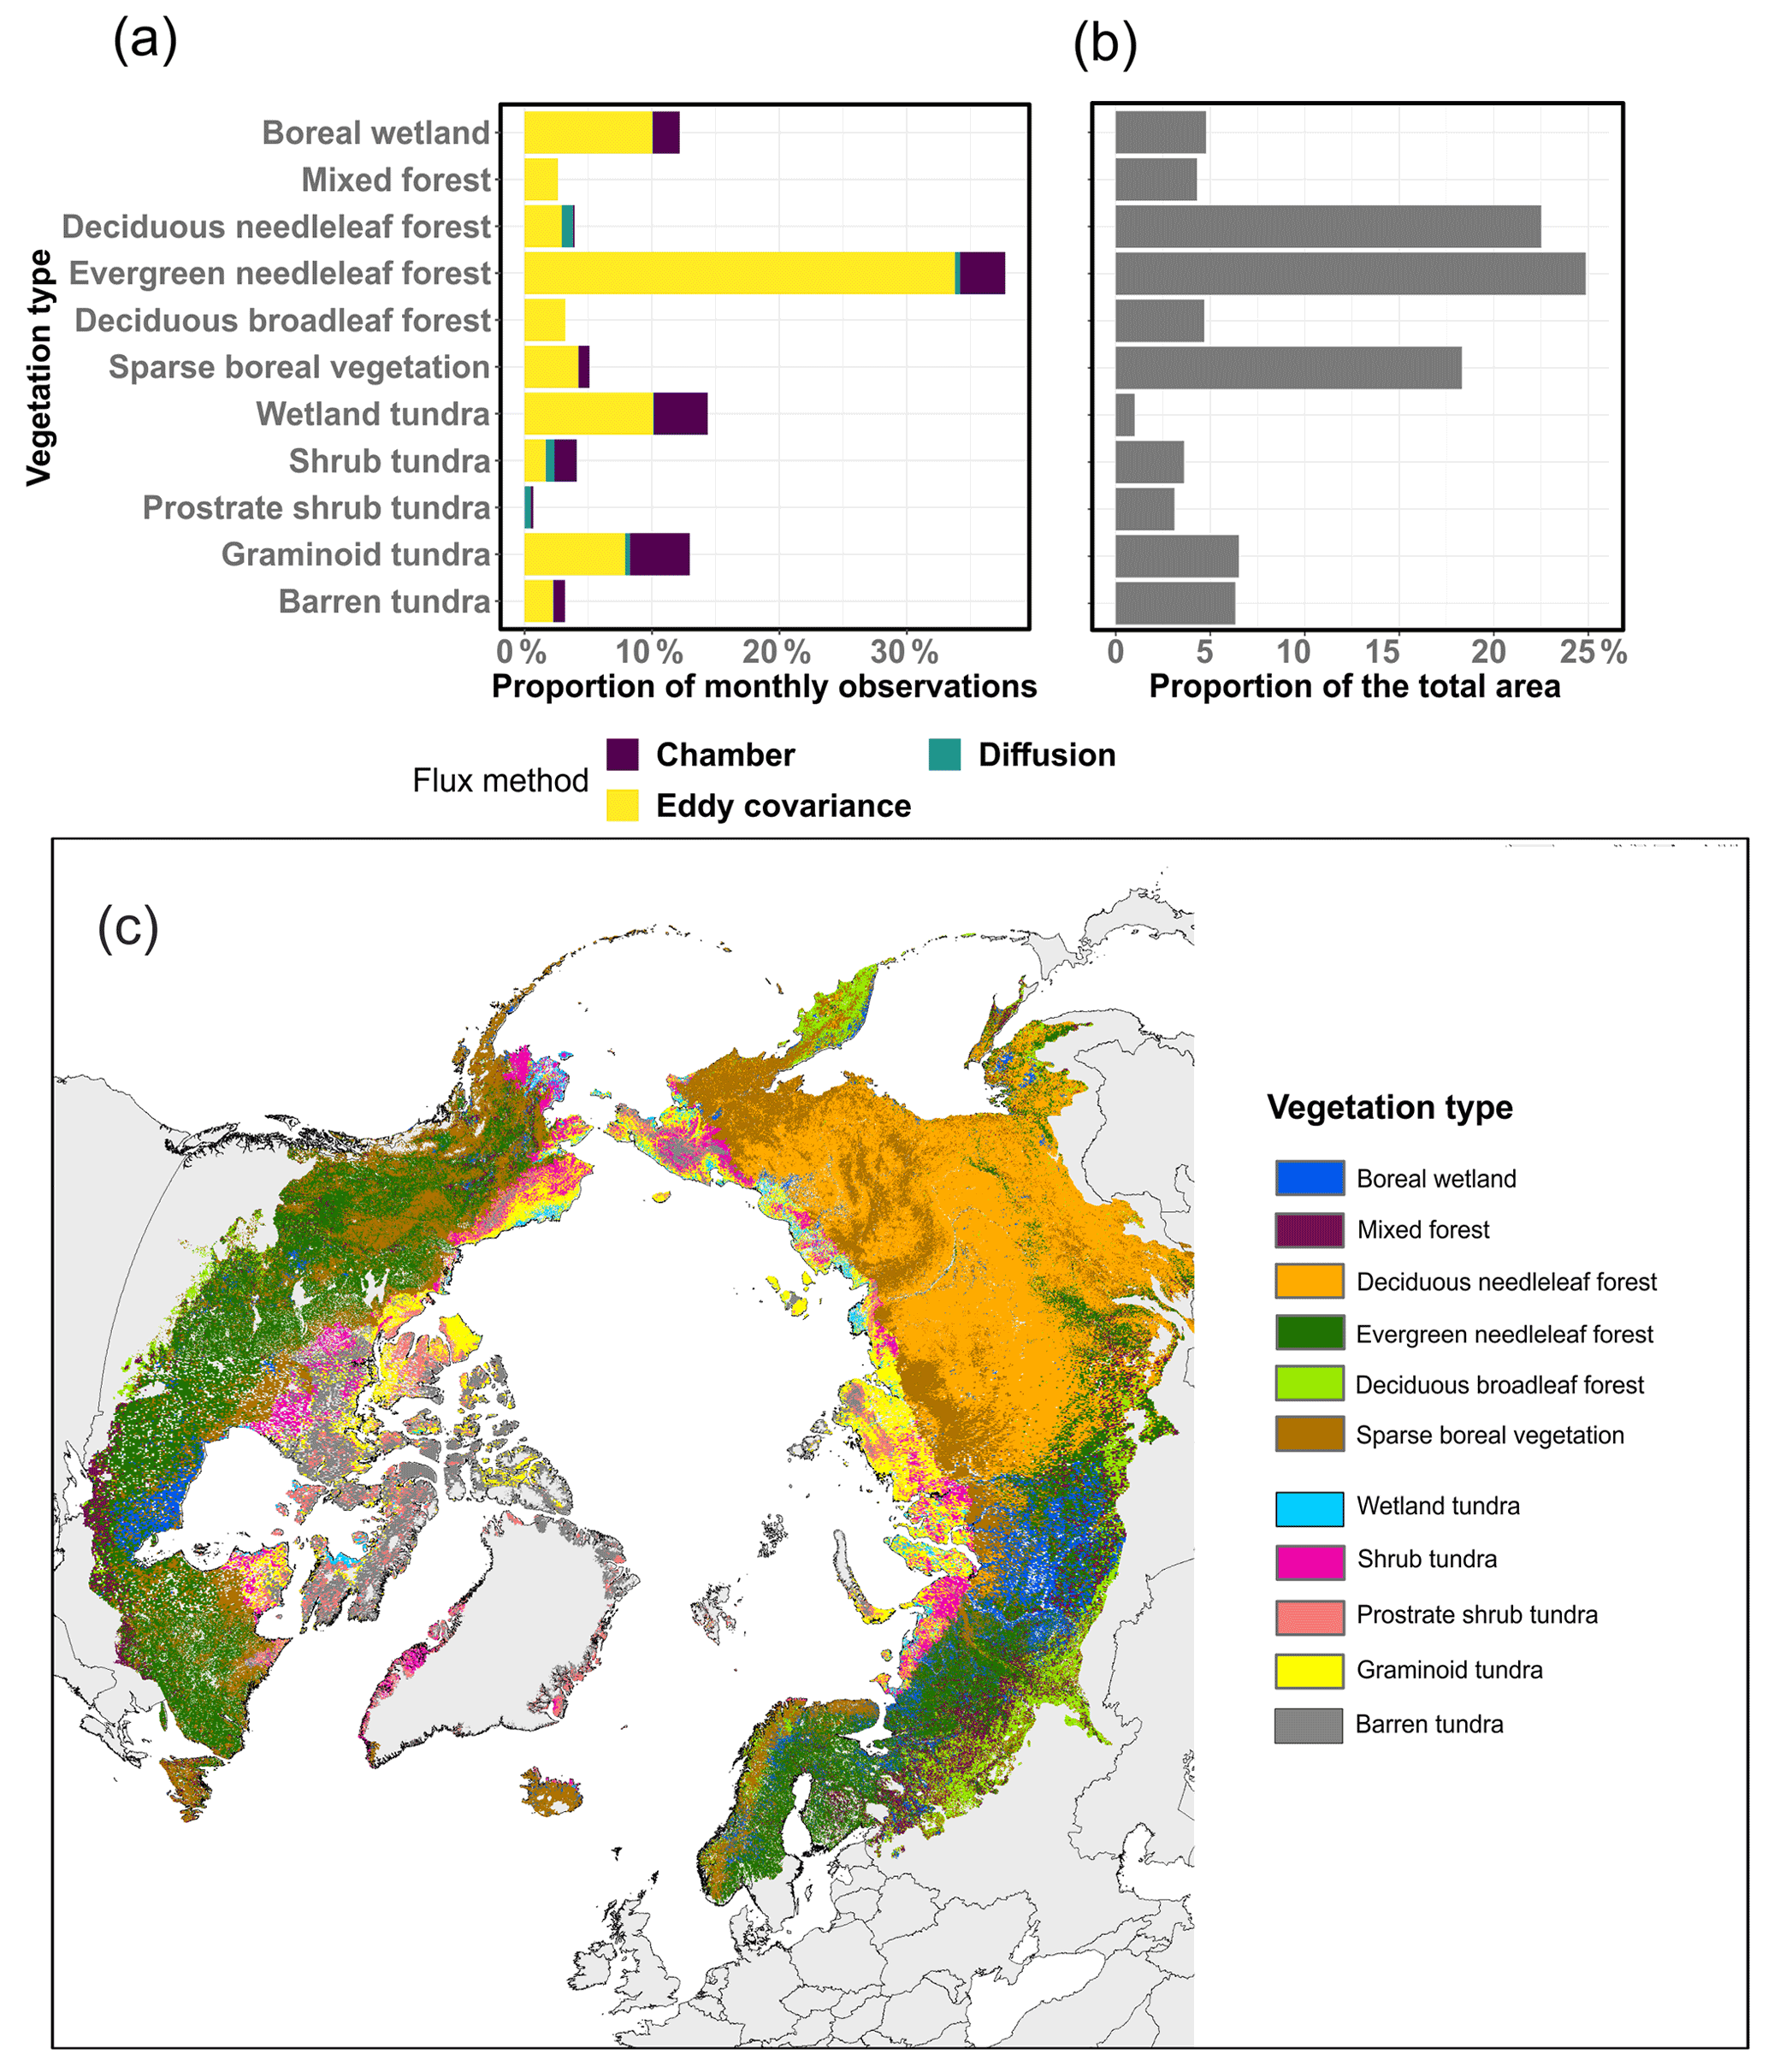
Figure 4The proportion of monthly observations in each vegetation type colored by the flux measurement technique (a) and the proportion of the areal extent of each vegetation type across the entire Arctic–boreal zone (b). Permanent water bodies, croplands, and urban areas were masked from the areal extent calculation. Sparse boreal vegetation class in the vegetation map includes vegetation mixtures and mosaics.
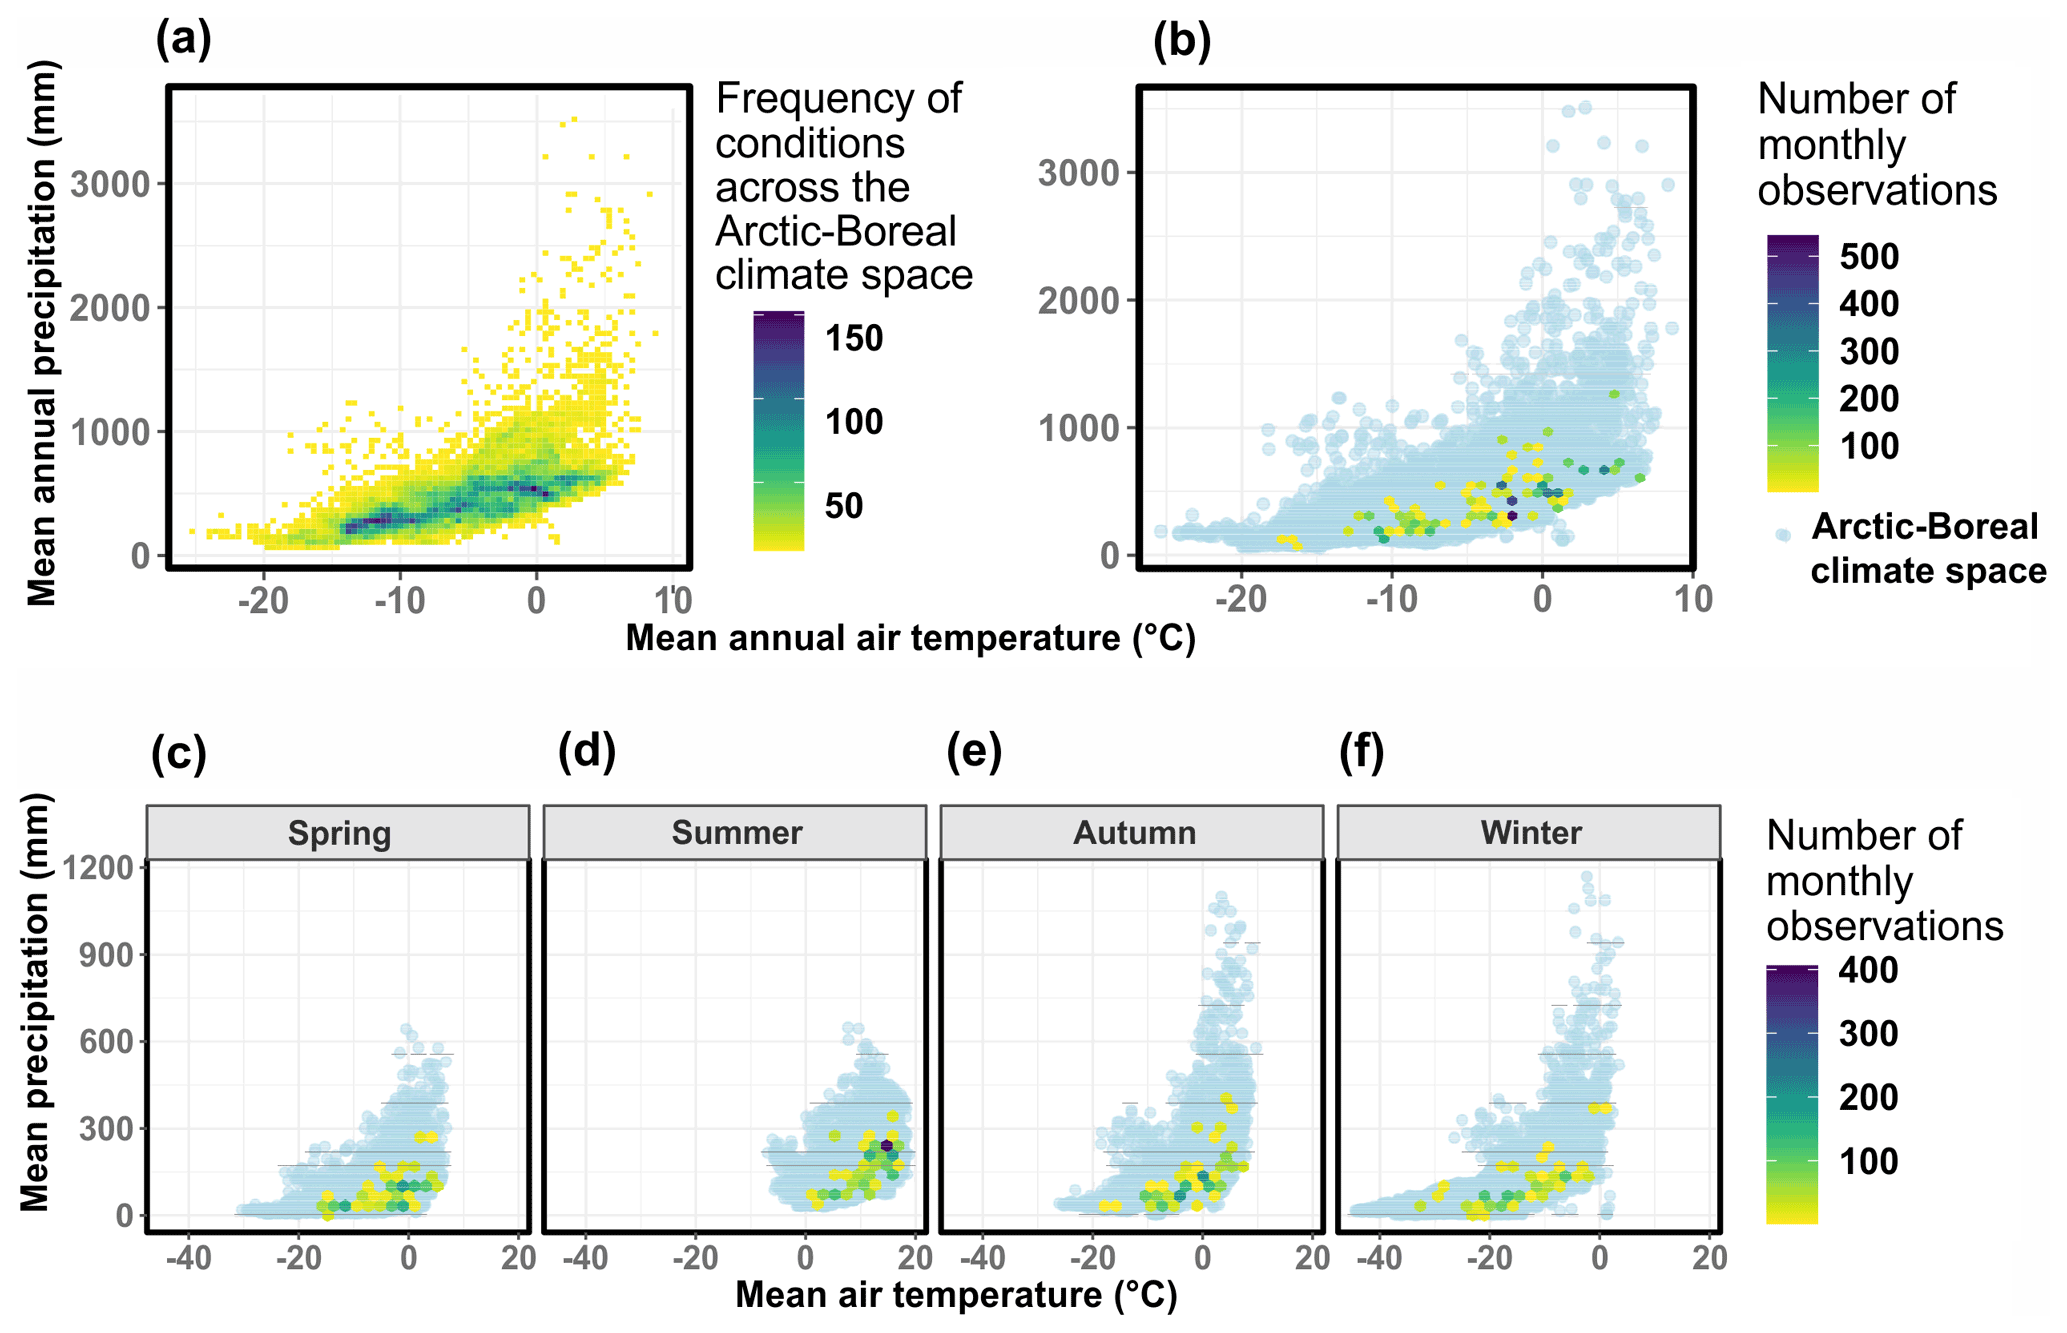
Figure 5Mean annual air temperature and precipitation conditions across the Arctic–boreal zone (a), the entire ABCflux (b), and the air temperature and precipitation conditions across the different climatological seasons included in ABCflux (c–f). Arctic–boreal climate space was defined based on a random sample of 20000 pixels across the domain.
ABCflux spans a total of 31 years (1989–2020), but the largest number of monthly observations originate from 2000–2015 (80 % of the data) (Fig. 6). The reason for a decrease in flux data over 2015–2020 is likely related to a reporting lag, not a decrease in flux sites and records. The largest number of measurements were conducted during the summer (June–August; 32 %) and the least during the winter (November–February; 18 %) (Figs. 5 and 6). The overall eddy covariance data quality and gap-filled data percentage were lowest during the winter compared to other seasons (0.76 compared to 0.8–0.85 for overall data quality, 0=extensive gap-filling, 1=low gap-filling; 69 % compared to 47 % to 59 % for gap-filled data percentage).
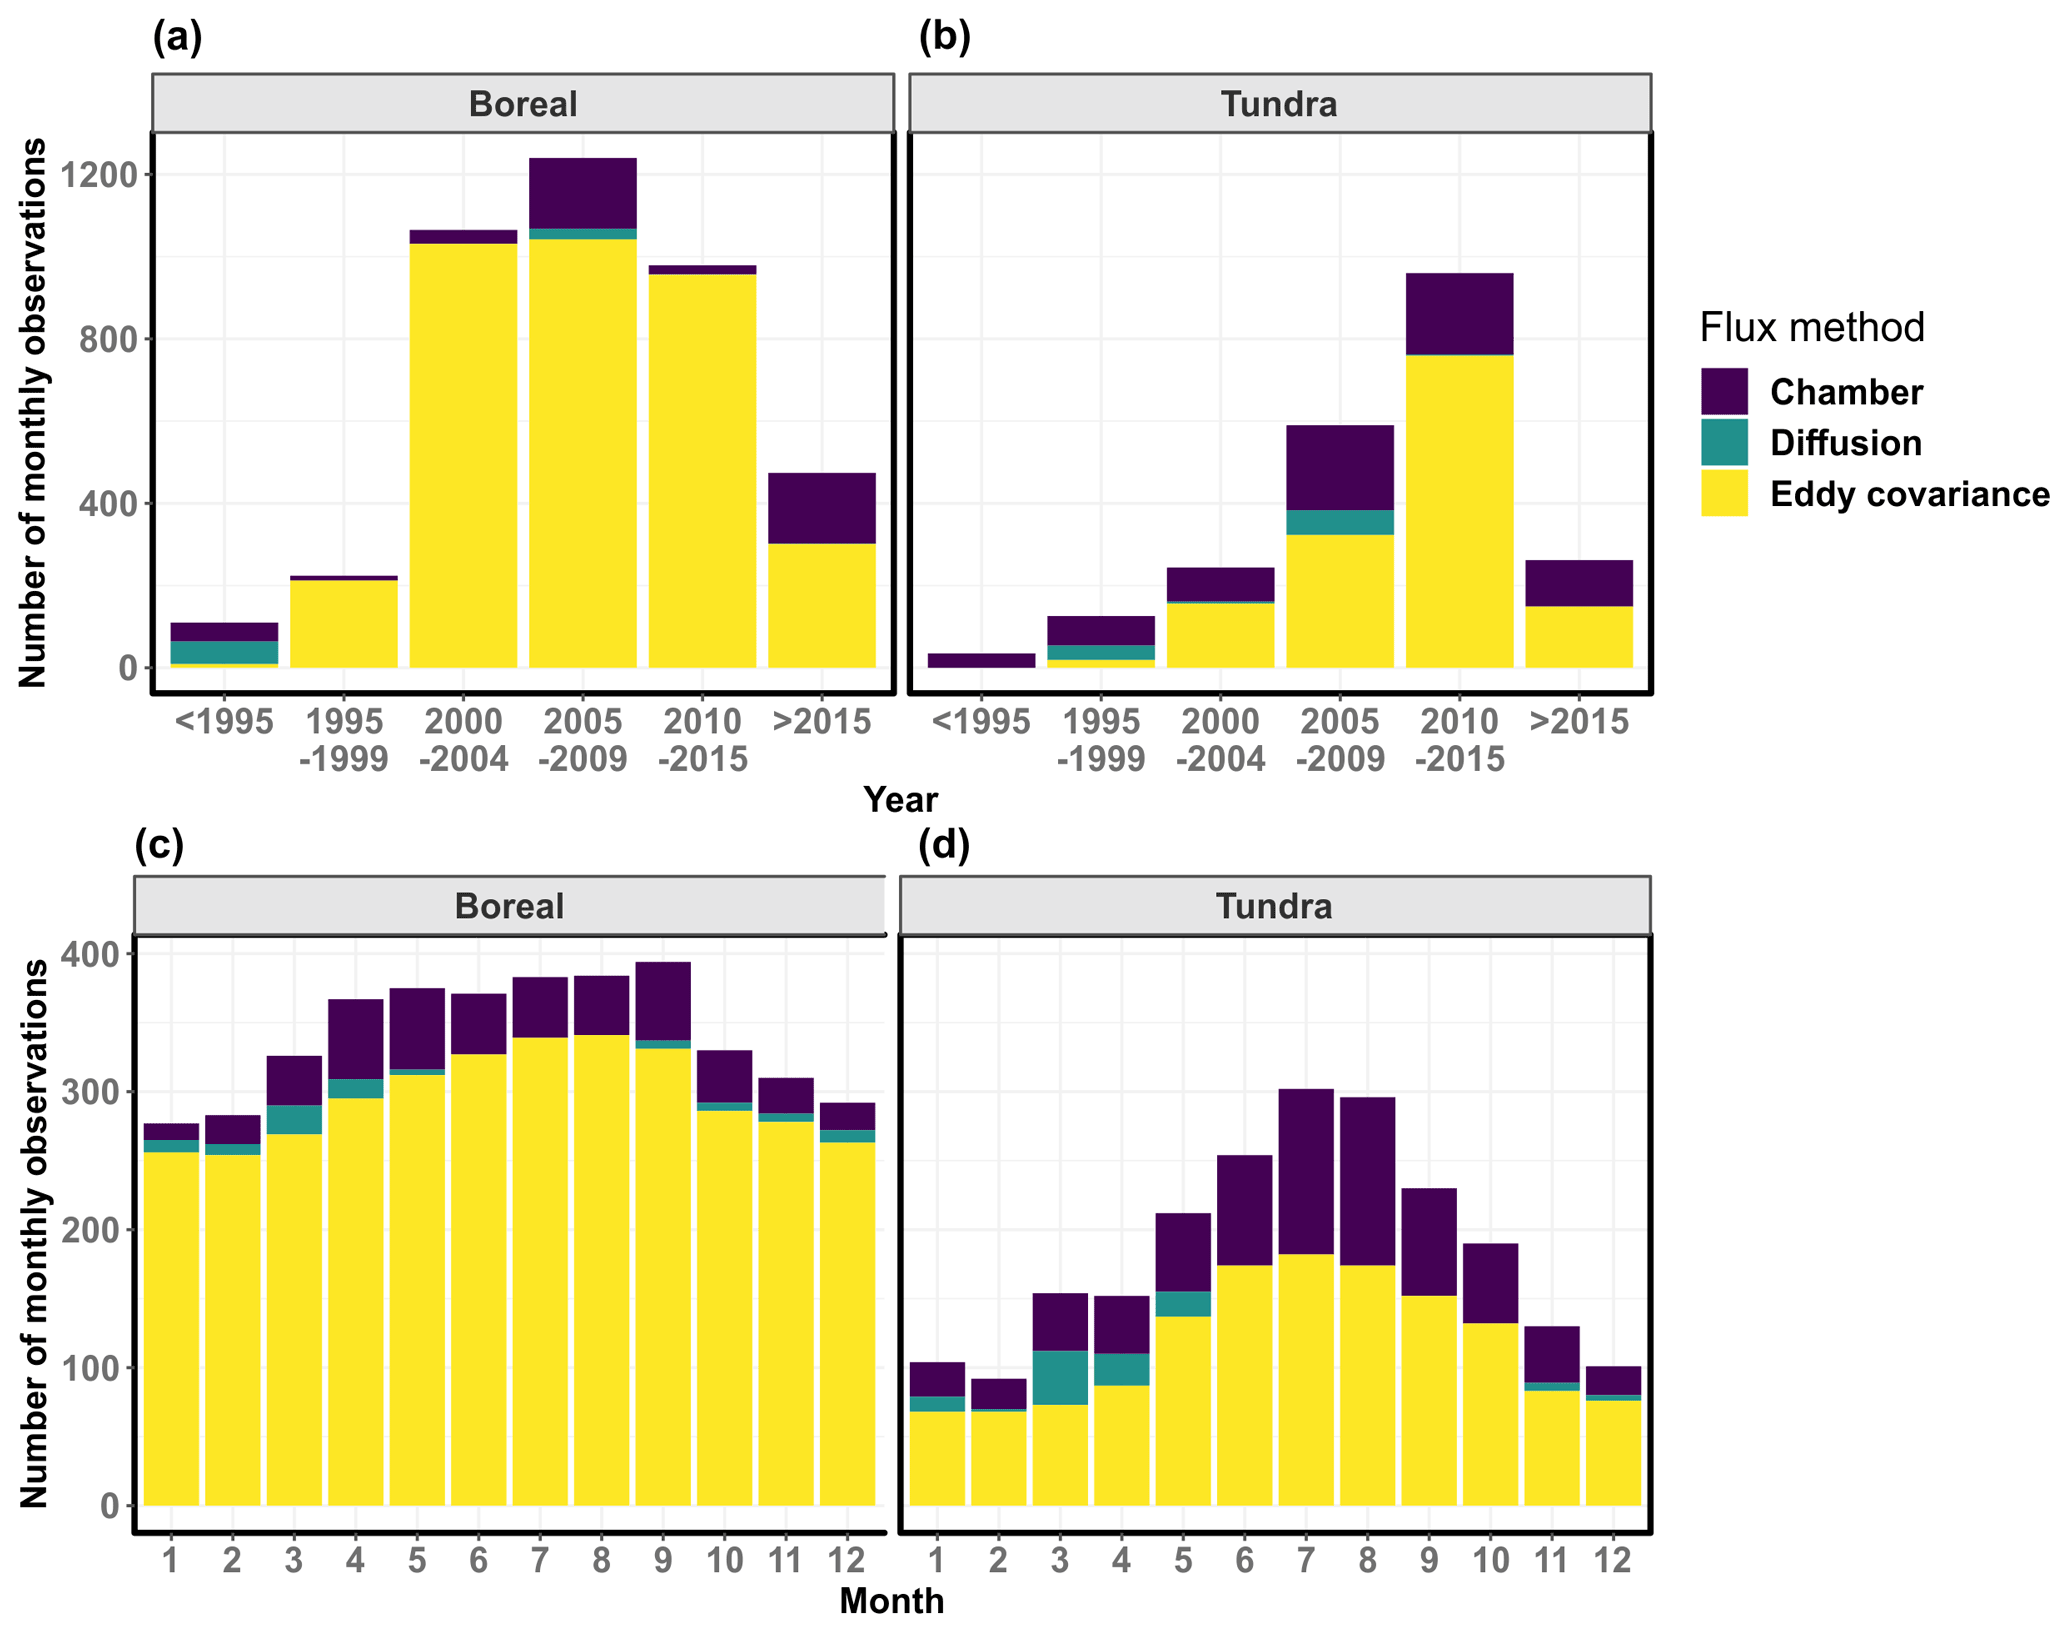
Figure 6Histograms showing the number of monthly measurements across 5-year periods (a, b) and across months (c, d) across the tundra and boreal biomes. The bar plots are colored by the flux measurement technique. Chambers in the boreal biome measured fluxes in treeless or sparsely treed areas (primarily wetlands).
3.2 Coverage of ancillary data
All of the observations in ABCflux include information describing the site name, location, vegetation type, NEE, measurement technique (eddy covariance/chamber/diffusion), and how the data were compiled (Table 2). Details about the measurement technique (e.g., open or closed-path eddy covariance, manual or automated chambers) are included in 93 % of sites and 93 % of monthly observations. Most of the monthly observations further include information about permafrost extent (67 % of the sites and 72 % of the monthly observations) or soil moisture state (47 % of the sites and 56 % of the monthly observations). Data describing air temperature, soil temperature, precipitation, and soil moisture are included in 71, 73, 37, and 35 % of monthly observations, respectively. Some ancillary variables have low data coverage, such as soil organic carbon stocks (16 % of the monthly observations) or active layer thickness (15 % of the monthly observations).
3.3 Coverage and distribution of flux data
There are 110 sites and 4290 monthly observations for GPP, 121 sites and 4603 monthly observations for Reco, and 212 sites and 5759 monthly observations for NEE in ABCflux. Monthly values range from −2 to −516 g C m−2 per month for GPP, from 0 to 550 g C m−2 per month for Reco, and from −376 to 95 g C m−2 per month for NEE (Table 4). NEE is typically negative during the summer (i.e., net CO2 sink) and mostly positive during other seasons (i.e., net CO2 source) (Fig. 7). Out of all site and year combinations, annual cumulative NEE (the sum of monthly NEE values for each year and site) can be calculated for 267 site years. An average annual NEE calculated based on the site-level averages from 1995 to 2020 is −27.9 (SD 85.4) for the entire region, −35.5 (SD 93.7) for the boreal biome, and −3.3 (SD 44.2) for the tundra. However, these averages do not account for the spatial or temporal distribution of the observations and therefore represent coarse summaries of the database.
Table 4Mean and standard deviation of monthly observations of net ecosystem exchange (NEE), gross primary productivity (GPP), and ecosystem respiration (Reco) in g C m−2 per month. Seasons were defined based on the climatological definition (autumn: September–November; winter: December–February; spring: March–May; summer: June–August). Positive numbers for NEE indicate net CO2 loss to the atmosphere (i.e., CO2 source), and negative numbers indicate net CO2 uptake by the ecosystem (i.e., CO2 sink). For consistency, GPP is presented as negative values and Reco as positive. Some sites compute only NEE and, consequently, NEE summaries might not entirely match with GPP and Reco statistics.
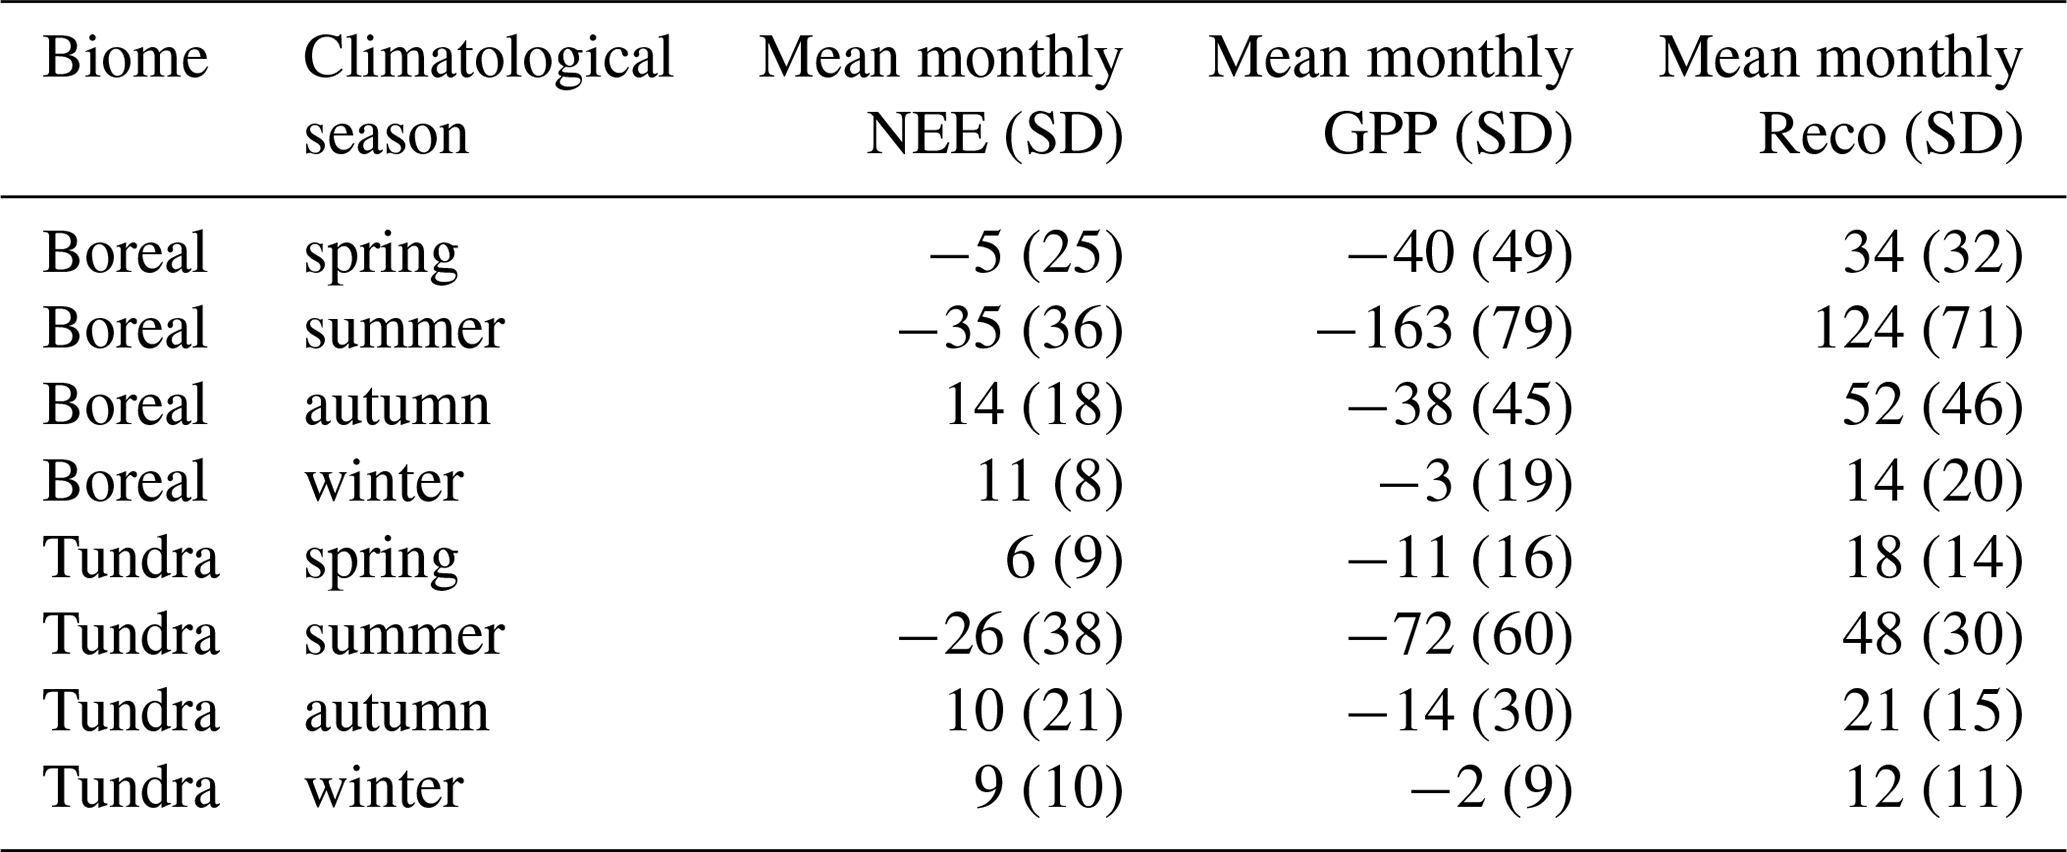
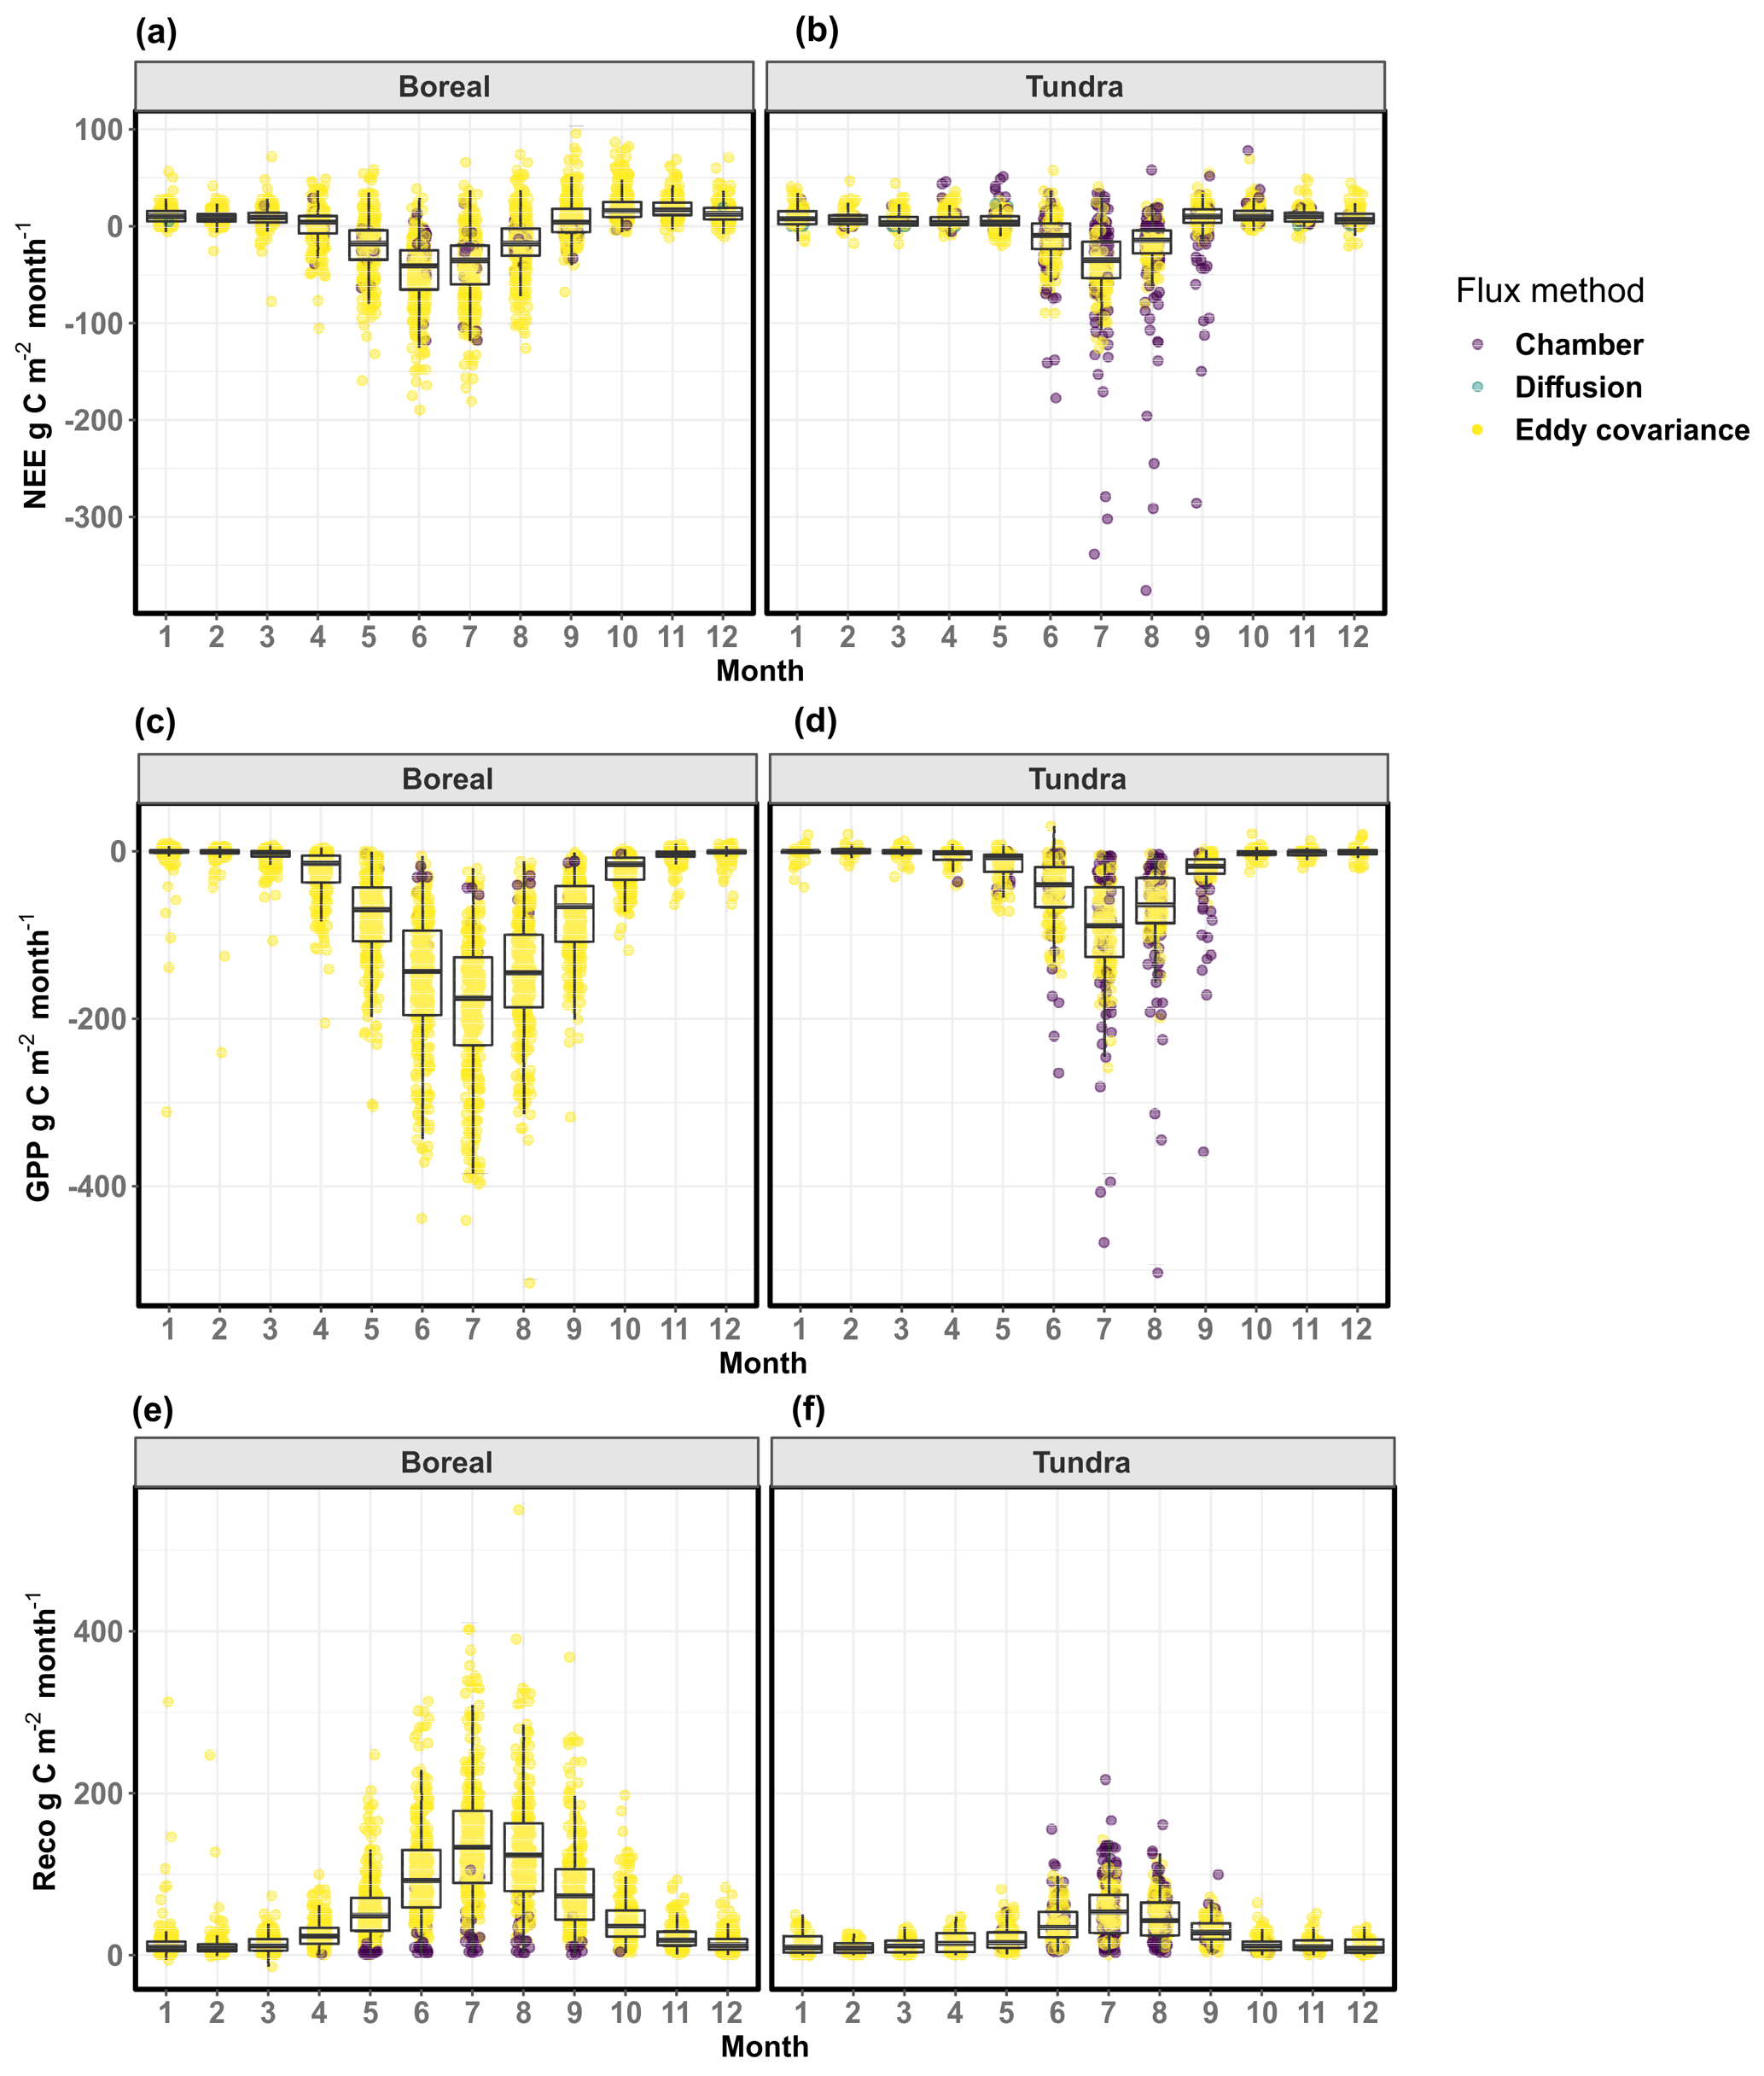
Figure 7The distribution of net ecosystem exchange (NEE; a, b), gross primary productivity (GPP; c, d), and ecosystem respiration (Reco; e, f) across the months and biomes, colored by the flux measurement technique. Positive numbers for NEE indicate net CO2 loss to the atmosphere (i.e., CO2 source), and negative numbers indicate net CO2 uptake by the ecosystem (i.e., CO2 sink). For consistency, GPP is presented as negative values and Reco as positive. The boxes correspond to the 25th and 75th percentiles. The lines denote the 1.5 IQR of the lower and higher quartile, where IQR is the inter-quartile range, or distance between the first and third quartiles. There is not much chamber data from the boreal regions as they capture NEE only at treeless wetlands.
ABCflux provides several opportunities for an improved understanding of the ABZ carbon cycle. It can be used to calculate both short- and longer-term monthly, seasonal, or annual flux summaries for different regions, or it can be combined with remote sensing and other gridded datasets to build monthly statistical and process-based models for CO2 flux upscaling. ABCflux can further be utilized to study the inter- and intra-annual CO2 flux variability resulting from climate and environmental change. The site distribution in ABCflux can also be used to evaluate the extent of the current flux network and identify under-sampled regions. From a methodological perspective, data users can compare fluxes estimated with the different measurement techniques which can help understand the uncertainties associated with individual techniques. However, there are also some uncertainties that the data user should be aware of when using ABCflux, which we describe below.
4.1 Comparing fluxes estimated with different techniques
The ABCflux database comprises aggregated observations using eddy covariance, chamber, and diffusion methods. These methods measure CO2 fluxes at different spatiotemporal resolutions and are based on different assumptions. The eddy covariance technique is currently the primary method to monitor long-term trends in ecosystem CO2 fluxes (Baldocchi et al., 2018; Baldocchi, 2008), and the majority of observations in ABCflux (79 %) have been made using the technique. Transforming high-frequency eddy covariance measurements to budgets includes several processing steps that can, without harmonization and standardization of these steps (Baldocchi et al., 2001; Pastorello et al., 2020), lead to highly different budget estimates (Soloway et al., 2017). It is also important to acknowledge that the extent and size of the tower footprint differs across the sites due to differences in the height of the tower and the direction and magnitude of the wind (Chu et al., 2021). When fluxes are aggregated over longer time periods to cumulative budgets, one generally assumes the tower footprint remains relatively constant, capturing fluxes from a similar part of the ecosystem (i.e., the assumption that monthly observations within one site in ABCflux can be reliably compared with each other), but note that at shorter time periods this might not be the case (Pirk et al., 2017; Chu et al., 2021).
The different gas analyzer technologies also play an important role for the fluxes estimated with the eddy covariance technique. Sites located in the most northern and remote parts of the ABZ experience a drop in irradiation during autumn and winter which limits solar power availability for eddy covariance measurements. Closed-path systems require more power to run than open-path sensors, but open-path sensors are known to have larger uncertainties. For example, open-path eddy covariance sensors have been shown to incorrectly estimate NEE due to the self-heating effect of the analyzer, which can result in systematically higher net CO2 uptake compared to closed-path sensors (Kittler et al., 2017a); however, this pattern was not clearly observed in ABCflux when across-site comparisons were made. Furthermore, wintertime fluxes indicating CO2 uptake can be erroneous due to the limited ability of the gas analyzer to resolve very high frequency turbulent eddies (Jentzsch et al., 2021). Recently, some types of open-path infrared gas analyzers have been found to be prone to biases in NEE that scale with sensible heat fluxes in all seasons rather than with self-heating (Wang et al., 2017; Helbig et al., 2016).
While using eddy covariance to estimate small-scale spatial variability in NEE is challenging (McGuire et al., 2012), this can be accomplished with chamber and diffusion techniques. Chamber measurements can be done in highly heterogeneous environments as long as chamber closure can be guaranteed; however, most of the chamber measurements in ABCflux have been conducted in relatively flat and homogeneous graminoid- and wetland-dominated vegetation types. Most chamber sites in ABCflux include ca. 10–20 individual plots in total from ca. 3–5 land cover types where fluxes are being measured (Virkkala et al., 2018). Chambers can also provide more direct estimates of Reco and GPP relative to eddy covariance-derived fluxes and are therefore useful for estimating the magnitude and range of those component fluxes. However, manual chamber and diffusion measurements are laborious and have limited temporal representation, particularly during the non-growing season when they often have only one monthly temporal replicate in ABCflux (McGuire et al., 2012; Fox et al., 2008). Automated chamber measurements during the non-growing season are also rare in ABCflux. Furthermore, uncertainty around gap-filled monthly chamber fluxes is presumably larger than that of the eddy covariance because of the low temporal replication of chamber measurements. Manual chamber measurements might, for example, be conducted during a limited period which does not cover the range of meteorological and phenological conditions within a month. Additional uncertainties in chamber measurements include, for example, accurate determination of chamber volume, pressure perturbations, temperature increase during the measurement, and collars disturbing the ground and causing plant root excision.
Because of these methodological differences across the eddy covariance, chamber and diffusion techniques, comparing fluxes between the methods may result in inconsistencies (Fig. 7). It has been shown that chamber measurements can be both larger or smaller than the fluxes estimated with eddy covariance (Phillips et al., 2017). This difference can be related to the uncertainties with the eddy covariance or chamber technique as described above. The differences can also be due to the mismatch between the chamber and tower footprints (<1 m vs. 250–3000 m radii over the measurement equipment, respectively) and the difficulty of extrapolating local chamber measurements to landscape scales (Marushchak et al., 2013; Fox et al., 2008). However, several studies have also shown good agreement across the eddy covariance and chamber measurements (Laine et al., 2006; Wang et al., 2013; Eckhardt et al., 2019; Riutta et al., 2007). Potential mismatches may also be due to a bias towards daytime measurements in manual chamber measurements (see field “diurnal_coverage”). During daytime, plants are actively photosynthesizing whereas respiration is the dominant flux at night (López-Blanco et al., 2017). Presumably because of these day vs. nighttime differences, we observed stronger sink strength in manual chamber measurements compared to other flux measurements in ABCflux, even though eddy covariance measurements have also been observed to underestimate nighttime CO2 loss. This underestimation in nighttime eddy covariance measurements is due to suppressed turbulent exchange linked to stable atmospheric stratification and systematic biases due to horizontal advection (Aubinet et al., 2012). Despite these uncertainties, including fluxes estimated with all of these techniques into one database improves the understanding of underlying variability of landscape-scale flux estimates. Indeed, there are roughly 10 sites in ABCflux that include both eddy covariance and chamber/diffusion measurements conducted at the same time. These observations might not have identical site coordinates, but they are often very close to each other (<500 m away from each other). Including multiple methods from the same site provides an opportunity to compare estimates from different methods over a larger number of sites.
4.2 Uncertainties in eddy covariance flux partitioning
Monthly Reco and GPP fluxes derived from eddy covariance were primarily estimated using nighttime partitioning (Reichstein et al., 2005). Focusing on nighttime partitioning ensured that data from older sites using this partitioning method could be included and that most of the fluxes were standardized using one common partitioning method. However, particularly at sites at higher latitudes of the ABZ, low-light nighttime conditions are restricted to rather short periods during summer, limiting the database for assessing Reco rates and therefore increasing uncertainties associated with the nighttime partitioning (López-Blanco et al., 2020). Recent research suggests that other methods such as daytime partitioning (Lasslop et al., 2010), and even more recently artificial neural networks (ANN) (Tramontana et al., 2020), might be more accurate methods for flux partitioning by addressing the assumptions from nighttime partitioning methods (Pastorello et al., 2020; Papale et al., 2006; Reichstein et al., 2005; Keenan et al., 2019). Specifically, the assumption of a constant diel temperature sensitivity during night- and daytime might introduce error in eddy covariance-based Reco estimates extrapolated from nighttime measurements (Järveoja et al., 2020; Keenan et al., 2019). It should be noted that ABCflux database used nighttime partitioning of fluxes extracted from repositories for consistency; however, fluxes contributed by some databases, PIs or extracted from papers may be based on other partitioning methods, as noted in the database. In a few cases, observations from the same site were based on different partitioning methods, which limits the usage of data at those sites for time-series exploration. These different gap-filling and partitioning approaches can impact the magnitude of monthly CO2 budgets. For example, a study comparing four gap-filling methods in a boreal forest showed that the 14-year average annual NEE budget varied from 4 to 48 depending on the gap-filling approach (Soloway et al., 2017). However, a comparison of multiple gap-filling and partitioning methods across sites showed that variation in annual GPP and Reco between partitioning methods was small (Desai et al., 2008), which provides confidence in estimates from partitioned GPP and Reco components from the differing methods used in this database.
Any one choice in gap-filling and partitioning introduces uncertainties, and to understand and minimize those uncertainties remains an important research priority. However, since this database was not designed for detailed explorations of how the different gap-filling and partitioning approaches influence fluxes, we recommend users interested in those to access these data in flux repositories or contact site PIs. Fluxes calculated using multiple gap-filling techniques may be considered in the next versions of ABCflux. We further suggest data users remain cautious when using ABCflux data to understand mechanistic relationships between meteorological variables and fluxes, as the gap-filled and partitioned monthly fluxes already include some information about, for example, air or soil temperatures and light conditions. To completely avoid circularity in these exploratory analyses, we recommend data users download the original and non-gap-filled NEE records, or download fluxes partitioned in a way that is consistent and biologically relevant for the particular research question from flux repositories.
4.3 Representativeness and completeness of the data
The ABCflux database site distribution covers all vegetation types and countries within the ABZ. However, there are regional and temporal biases in the database due to the differences in accessibility for sampling certain regions (also documented in Virkkala et al., 2019, and Pallandt et al., 2021). As a result, the number of monthly observations does not always correlate with the size of the country/region or vegetation type. For example, Russia and Canada cover in total ca. 80 % of the ABZ but include only ca. 40 % of the monthly observations. While the distribution of these measurements is rather balanced between the Russian tundra and boreal biomes, Canadian observations are primarily located in the boreal biome, largely due to the high number of measurements conducted as part of the NASA Boreal Ecosystem–Atmosphere Study (Sellers et al., 1997). Deciduous needleleaf (i.e., larch) forests, the primary vegetation type in central and eastern Siberia, has the smallest number of data compared to its area (<5 % of monthly observations vs. >20 % coverage of the ABZ). Additional data gaps are located in barren and prostrate-shrub tundra and sparse boreal vegetation, as well as in areas with high precipitation. Eddy covariance towers in mountainous regions are also rare (Pallandt et al., 2021) as eddy covariance towers are most often set up over homogeneous and flat terrains to avoid advection (Baldocchi, 2003; Etzold et al., 2010). Alaska and Finland cover <10 % of the ABZ but include >40 % of the monthly observations.
There are differences in environmental coverage of ABCflux depending on the measured flux, measurement year, and the measurement season. Sites with NEE observations have the largest geographical coverage, with less availability for partitioned GPP and Reco fluxes. Therefore, regional summaries of Reco and GPP do not sum up to NEE. Moreover, although the oldest records in ABCflux originate from 1989, observations from the 1990s are primarily located in a few boreal or Alaskan tundra sites. The measurement records from tundra sites are shorter than boreal sites over the full time span of the database, and it is therefore more uncertain to investigate long-term temporal changes in tundra fluxes. Finally, the lowest number of flux data in ABCflux is during winter, which is the most challenging period for data collection in high latitudes (Kittler et al., 2017b; Jentzsch et al., 2021). Autumn and winter data included in ABCflux further cover a smaller Arctic–boreal climate space, with no data coming from extremely cold or wet conditions (Fig. 5). Fluxes are generally small during this period (Natali et al., 2019a), leading to higher relative uncertainties in flux estimation compared to other seasons. These regional and temporal biases need to be considered in future analyses to assure the robustness of our understanding of carbon fluxes across the ABZ.
Although ABCflux includes a comprehensive compilation of flux and supporting environmental and methodological information, the information is not exhaustive. We acknowledge that this database is missing some eddy covariance sites that were recently summarized in a tower survey (see preliminary results in https://cosima.nceas.ucsb.edu/carbon-flux-sites/, last access: 12 February 2020), because these data were unavailable at the time of database compilation. Moreover, the overall quality or the gap-filled percentage of the eddy covariance observations is not reported for each eddy covariance site, limiting the potential to explore the effects of data quality on fluxes across all the eddy covariance sites. Comparing soil temperature or moisture across sites has uncertainties due to differences in sensor depths, which are not always reported in the database. We hope to improve and increase the flux and supporting data in the future as new data are being collected, for example, by leveraging the ONEflux pipeline and its different outputs (Pastorello et al., 2020), as well as aggregating new measurements that are not part of any networks.
Data are publicly available using a Creative Commons Attribution 4.0 International copyright (CC BY 4.0). Data are fully public but should be appropriately referenced by citing this paper and the database (see Sect. 6). We suggest that researchers planning to use this database as a core dataset for their analysis contact and collaborate with the database developers and relevant individual site contributors.
The database associated with this publication can be found at Virkkala et al. (2021b, https://doi.org/10.3334/ORNLDAAC/1934).
ABCflux provides the most comprehensive database of ABZ terrestrial ecosystem CO2 fluxes to date. It is particularly useful for future modeling, remote sensing, and empirical studies aiming to understand CO2 budgets and regional variability in flux magnitudes, as well as changes in fluxes through time. It can also be used to understand how different environmental conditions influence fluxes and to better understand the current extent of the flux measurement network and its representativeness across the Arctic–boreal region.
The ABCflux database was conceptualized and developed by a team led by SMN, BMR, JDW, MM, AMV, and EAGS, with additional comments from OS. KS and SJC compiled the data, with contributions from AMV, MM, DP, CM, and JN, and data screening by AMV and SMN. AMV drafted and coordinated the manuscript in close collaboration with SMN, BMR, JDW, KS, and MM. All authors contributed to the realization of the ABCflux database and participated in the editing of the manuscript. PIs whose data were extracted from publications are not coauthors in this paper, unless new data were provided, but their contact details can be found in the database.
The contact author has declared that neither they nor their co-authors have any competing interests.
Publisher's note: Copernicus Publications remains neutral with regard to jurisdictional claims in published maps and institutional affiliations.
Anna-Maria Virkkala, Brendan M. Rogers, Susan M. Natali, and Jennifer D. Watts were funded by the Gordon and Betty Moore Foundation (grant no. 8414). Brendan M. Rogers, Kathleen Savage, Sara June Connon, Christina Minions, and Julia Nojeim were also funded by the NASA Carbon Cycle Science and Arctic-Boreal Vulnerability Experiment programs (ABoVE grant NNX17AE13G), Susan M. Natali by NASA ABoVE (grant NNX15AT81A), and Jennifer D. Watts by NNX15AT81A and NASA NIP grant NNH17ZDA001N. Edward A. G. Schuur acknowledges NSF Research, Synthesis, and Knowledge Transfer in a Changing Arctic: Science Support for the Study of Environmental Arctic Change (grant no. 1331083) and NSF PLR Arctic System Science Research Networking Activities (Permafrost Carbon Network: Synthesizing Flux Observations for Benchmarking Model Projections of Permafrost Carbon Exchange; grant no. 1931333. Edward A. G. Schuur further acknowledges US Department of Energy and Denali National Park. Mats B. Nilsson and Matthias Peichl acknowledge Swedish ICOS (Integrated Carbon Observatory System) funded by VR and contributing institutions; SITES (Swedish Infrastructure for Ecosystem Science) funded by VR and contributing institutions; VR (grant nos. 2018-03966 and 2019-04676), FORMAS (grant no. 2016-01289), and Kempe Foundations (SMK-1211). Eugenie Euskirchen and M. Syndonia Bret-Harte were funded by NSF Arctic Observatory Network and Craig A. Emmerton, Vincent L. St. Louis, and Elyn Humphreys by Natural Sciences and Engineering Research Council. Ivan Mammarella, Pasi Kolari, Eeva-Stiina Tuittila, and Annalea Lohila acknowledge ICOS-Finland and AV Russian Science Foundation, project 21-14-00209. Annalea Lohila, Mika Aurela, Tuomas Laurila, Juha-Pekka Tuovinen, and Juha Hatakka further acknowledge the Ministry of Transport and Communication. William Quinton, Eugenie Euskirchen, and Vincent L. St. Louis were funded by ArcticNet. Hideki Kobayashi acknowledges The Arctic Challenge for Sustainability and The Arctic Challenge for Sustainability II (JPMXD1420318865), Maija E. Marushchak the Academy of Finland project PANDA (decision no. 317054), and Carolina Voigt the Academy of Finland project MUFFIN (decision no. 332196). Marguerite Mauritz acknowledges Arctic Data Center, National Science Foundation, US Department of Energy, Denali National Park. Yojiro Matsuura was funded by Ministry of Environment, Japan, and Masahito Ueyama by the Arctic Challenge for Sustainability II (ArCS II; JPMXD1420318865) and KAKENHI (19H05668). Steven F. Oberbauer acknowledges US National Science Foundation, and Mikhail Mastepanov, Bo Elberling, and Torben R. Christensen the Greenland Ecosystem Monitoring program. Bo Elberling further acknowledge Arctic Station, University of Copenhagen and the Danish National Research Foundation (CENPERM DNRF100). Efrén López-Blanco was funded by Greenland Research Council, grant no. 80.35, financed by the Danish Program for Arctic Research and Lutz Merbold by TCOS Siberia. David Holl and Lars Kutzbach were funded by Deutsche Forschungsgemeinschaft under Germany's Excellence Strategy – EXC 177 “CliSAP – Integrated Climate System Analysis and Prediction”. Järvi Järveoja acknowledges Swedish Forest Society Foundation (2018-485-Steg 2 2017) and FORMAS (2018-00792). Donatella Zona was funded by National Science Foundation (NSF) (award nos. 1204263 and 1702797) NASA ABoVE (NNX15AT74A; NNX16AF94A) Program, Natural Environment Research Council (NERC) UAMS Grant (NE/P002552/1), NOAA Cooperative Science Center for Earth System Sciences and Remote Sensing Technologies (NOAA-CESSRST) under the Cooperative agreement grant no. NA16SEC4810008, European Union's Horizon 2020 research and innovation program under grant agreement no. 72789. Sang-Jong Park was funded by National Research Foundation of Korea Grant from the Korean Government (NRF-2021M1A5A1065425, KOPRI-PN21011). Namyi Chae acknowledges the National Research Foundation of Korea Grant from the Korean Government (MSIT; the Ministry of Science and ICT) (NRF-2021M1A5A1065679 and NRF-2021R1I1A1A01053870). Sigrid Dengel was funded by Department of Energy and NGEE-Arctic. Frans-Jan W. Parmentier is funded by the Swedish Research Council (registration no. 2017-05268) and the Research Council of Norway (grant no. 274711). Anatoly S. Prokushkin and Viacheslav I. Zyryanov were funded by a grant of the Russian Fund for Basic Research no. 18-05-60203-Arktika. The authors would like to acknowledge Tiffany Windholz for her work on standardizing and cleaning up the database.
This research has been supported by the National Aeronautics and Space Administration (grant nos. NNX17AE13G, NNX15AT81A, NNH17ZDA001N, NNX15AT74A, and NNX16AF94A), the Gordon and Betty Moore Foundation (grant no. 8414), the National Science Foundation (grant nos. 1331083, 1931333, NSF Arctic Observatory Network, 1204263, and 1702797), the Vetenskapsrådet (grant nos. 2017-05268, 2018-03966, and 2019-04676), the Svenska Forskningsrådet Formas (grant nos. 2016-01289 and 2018-00792), the Kempe Foundation (grant no. SMK-1211), the Russian Science Foundation (grant no. 21-14-00209), the Academy of Finland (grant nos. 317054 and 332196), the Danmarks Grundforskningsfond (grant no. CENPERM DNRF100), the Deutsche Forschungsgemeinschaft (grant no. EXC 177 CliSAP), the Skogssällskapet (grant no. 2018-485-Steg 2 2017), the Natural Environment Research Council (grant no. NE/P002552/1), the National Research Foundation of Korea (grant nos. NRF-2021M1A5A1065425, KOPRI-PN21011, NRF-2021M1A5A1065679, and NRF-2021R1I1A1A01053870), the Norges Forskningsråd (grant no. 274711), US Department of Energy, Natural Sciences and Engineering Research Council, Russian Science Foundation (grant no. 21-14-00209), the Ministry of Transport and Communication (Finland), ArcticNet, The Arctic Challenge for Sustainability and The Arctic Challenge for Sustainability II (grant no. JPMXD1420318865), KAKENHI (grant no. 19H05668), Greenland Ecosystem Monitoring Program, Danish Program for Arctic Research (grant no. 80.35), TCOS Siberia, NOAA-CESSRST (grant no. NA16SEC4810008), European Union's Horizon 2020 (grant no. 72789), NGEE Arctic, and Russian Fund for Basic Research (grant no. 18-05-60203-Arktika).
This paper was edited by David Carlson and reviewed by two anonymous referees.
Abatzoglou, J. T., Dobrowski, S. Z., Parks, S. A., and Hegewisch, K. C.: TerraClimate, a high-resolution global dataset of monthly climate and climatic water balance from 1958–2015, Sci. Data, 5, 170191, https://doi.org/10.1038/sdata.2017.191, 2018.
Arctic Data Center: Reconciling historical and contemporary trends in terrestrial carbon exchange of the northern permafrost-zone, https://arcticdata.io/reconciling-historical- and-contemporary-trends-in-terrestrial-carbon-exchange-of-the-northern-permafrost-zone/, last access: 11 February 2021.
Aubinet, M., Vesala, T., and Papale, D.: Eddy Covariance: A Practical Guide to Measurement and Data Analysis, Springer Science & Business Media, 438 pp., ISBN 9789400723504, 2012.
Aurela, M., Laurila, T., and Tuovinen, J. P.: Annual CO2 balance of a subarctic fen in northern Europe: Importance of the wintertime efflux, J. Geophys. Res.-Atmos., 107, 4607, https://doi.org/10.1029/2002JD002055, 2002.
Bäckstrand, K., Crill, P. M., Jackowicz-Korczyñski, M., Mastepanov, M., Christensen, T. R., and Bastviken, D.: Annual carbon gas budget for a subarctic peatland, Northern Sweden, Biogeosciences, 7, 95–108, https://doi.org/10.5194/bg-7-95-2010, 2010.
Baldocchi, D.: “Breathing” of the terrestrial biosphere: lessons learned from a global network of carbon dioxide flux measurement systems, Aust. J. Bot., 56, 1–26, 2008.
Baldocchi, D., Falge, E., Gu, L., Olson, R., Hollinger, D., Running, S., Anthoni, P., Bernhofer, C., Davis, K., Evans, R., Fuentes, J., Goldstein, A., Katul, G., Law, B., Lee, X., Malhi, Y., Meyers, T., Munger, W., Oechel, W., Paw U, K. T., Pilegaard, K., Schmid, H. P., Valentini, R., Verma, S., Vesala, T., Wilson, K., and Wofsy, S.: FLUXNET: A New Tool to Study the Temporal and Spatial Variability of Ecosystem-Scale Carbon Dioxide, Water Vapor, and Energy Flux Densities, B. Am. Meteorol. Soc., 82, 2415–2434, https://doi.org/10.1175/1520-0477(2001)082<2415:FANTTS>2.3.CO;2, 2001.
Baldocchi, D., Chu, H., and Reichstein, M.: Inter-annual variability of net and gross ecosystem carbon fluxes: A review, Agr. Forest Meteorol., 249, 520–533, https://doi.org/10.1016/j.agrformet.2017.05.015, 2018.
Baldocchi, D. D.: Assessing the eddy covariance technique for evaluating carbon dioxide exchange rates of ecosystems: past, present and future, Glob. Change Biol., 9, 479–492, https://doi.org/10.1046/j.1365-2486.2003.00629.x, 2003.
Belshe, E. F., Schuur, E. A. G., and Bolker, B. M.: Tundra ecosystems observed to be CO2 sources due to differential amplification of the carbon cycle, Ecol. Lett., 16, 1307–1315, https://doi.org/10.1111/ele.12164, 2013.
Björkman, M. P., Morgner, E., Björk, R. G., Cooper, E. J., Elberling, B., and Klemedtsson, L.: A comparison of annual and seasonal carbon dioxide effluxes between sub-Arctic Sweden and High-Arctic Svalbard, Polar Res., 29, 75–84, https://doi.org/10.1111/j.1751-8369.2010.00150.x, 2010a.
Björkman, M. P., Morgner, E., Cooper, E. J., Elberling, B., Klemedtsson, L., and Björk, R. G.: Winter carbon dioxide effluxes from Arctic ecosystems: An overview and comparison of methodologies: Winter CO2 effluxes from arctic soils, Global Biogeochem. Cy., 24, GB3010, https://doi.org/10.1029/2009gb003667, 2010b.
Bond-Lamberty, B., Christianson, D. S., Malhotra, A., Pennington, S. C., Sihi, D., AghaKouchak, A., Anjileli, H., Altaf Arain, M., Armesto, J. J., Ashraf, S., Ataka, M., Baldocchi, D., Andrew Black, T., Buchmann, N., Carbone, M. S., Chang, S.-C., Crill, P., Curtis, P. S., Davidson, E. A., Desai, A. R., Drake, J. E., El-Madany, T. S., Gavazzi, M., Görres, C.-M., Gough, C. M., Goulden, M., Gregg, J., Gutiérrez Del Arroyo, O., He, J.-S., Hirano, T., Hopple, A., Hughes, H., Järveoja, J., Jassal, R., Jian, J., Kan, H., Kaye, J., Kominami, Y., Liang, N., Lipson, D., Macdonald, C. A., Maseyk, K., Mathes, K., Mauritz, M., Mayes, M. A., McNulty, S., Miao, G., Migliavacca, M., Miller, S., Miniat, C. F., Nietz, J. G., Nilsson, M. B., Noormets, A., Norouzi, H., O'Connell, C. S., Osborne, B., Oyonarte, C., Pang, Z., Peichl, M., Pendall, E., Perez-Quezada, J. F., Phillips, C. L., Phillips, R. P., Raich, J. W., Renchon, A. A., Ruehr, N. K., Sánchez-Cañete, E. P., Saunders, M., Savage, K. E., Schrumpf, M., Scott, R. L., Seibt, U., Silver, W. L., Sun, W., Szutu, D., Takagi, K., Takagi, M., Teramoto, M., Tjoelker, M. G., Trumbore, S., Ueyama, M., Vargas, R., Varner, R. K., Verfaillie, J., Vogel, C., Wang, J., Winston, G., Wood, T. E., Wu, J., Wutzler, T., Zeng, J., Zha, T., Zhang, Q., and Zou, J.: COSORE: A community database for continuous soil respiration and other soil-atmosphere greenhouse gas flux data, Glob. Change Biol., 26, 7268–7283, https://doi.org/10.1111/gcb.15353, 2020.
Box, J. E., Colgan, W. T., Christensen, T. R., Schmidt, N. M., Lund, M., Parmentier, F.-J. W., Brown, R., Bhatt, U. S., Euskirchen, E. S., Romanovsky, V. E., Walsh, J. E., Overland, J. E., Wang, M., Corell, R. W., Meier, W. N., Wouters, B., Mernild, S., Mård, J., Pawlak, J., and Olsen, M. S.: Key indicators of Arctic climate change: 1971–2017, Environ. Res. Lett., 14, 045010, https://doi.org/10.1088/1748-9326/aafc1b, 2019.
Cahoon, S. M. P., Sullivan, P. F., and Post, E.: Greater Abundance of Betula nana and Early Onset of the Growing Season Increase Ecosystem CO2 Uptake in West Greenland, Ecosystems, 19, 1149–1163, https://doi.org/10.1007/s10021-016-9997-7, 2016.
Chu, H., Luo, X., Ouyang, Z., Chan, W. S., Dengel, S., Biraud, S. C., Torn, M. S., Metzger, S., Kumar, J., Arain, M. A., Arkebauer, T. J., Baldocchi, D., Bernacchi, C., Billesbach, D., Black, T. A., Blanken, P. D., Bohrer, G., Bracho, R., Brown, S., Brunsell, N. A., Chen, J., Chen, X., Clark, K., Desai, A. R., Duman, T., Durden, D., Fares, S., Forbrich, I., Gamon, J. A., Gough, C. M., Griffis, T., Helbig, M., Hollinger, D., Humphreys, E., Ikawa, H., Iwata, H., Ju, Y., Knowles, J. F., Knox, S. H., Kobayashi, H., Kolb, T., Law, B., Lee, X., Litvak, M., Liu, H., Munger, J. W., Noormets, A., Novick, K., Oberbauer, S. F., Oechel, W., Oikawa, P., Papuga, S. A., Pendall, E., Prajapati, P., Prueger, J., Quinton, W. L., Richardson, A. D., Russell, E. S., Scott, R. L., Starr, G., Staebler, R., Stoy, P. C., Stuart-Haëntjens, E., Sonnentag, O., Sullivan, R. C., Suyker, A., Ueyama, M., Vargas, R., Wood, J. D., and Zona, D.: Representativeness of Eddy-Covariance flux footprints for areas surrounding AmeriFlux sites, Agr. Forest Meteorol., 301–302, 108350, https://doi.org/10.1016/j.agrformet.2021.108350, 2021.
Desai, A. R., Richardson, A. D., Moffat, A. M., Kattge, J., Hollinger, D. Y., Barr, A., Falge, E., Noormets, A., Papale, D., Reichstein, M., and Stauch, V. J.: Cross-site evaluation of eddy covariance GPP and RE decomposition techniques, Agr. Forest Meteorol., 148, 821–838, https://doi.org/10.1016/j.agrformet.2007.11.012, 2008.
Didan, K.: MOD13A3 MODIS/Terra Vegetation Indices Monthly L3 Global 1 km SIN Grid V006, NASA EOSDIS Land Processes DAAC, https://doi.org/10.5067/MODIS/MOD13A3.006, 2015.
Dinerstein, E., Olson, D., Joshi, A., Vynne, C., Burgess, N. D., Wikramanayake, E., Hahn, N., Palminteri, S., Hedao, P., Noss, R., Hansen, M., Locke, H., Ellis, E. C., Jones, B., Barber, C. V., Hayes, R., Kormos, C., Martin, V., Crist, E., Sechrest, W., Price, L., Baillie, J. E. M., Weeden, D., Suckling, K., Davis, C., Sizer, N., Moore, R., Thau, D., Birch, T., Potapov, P., Turubanova, S., Tyukavina, A., de Souza, N., Pintea, L., Brito, J. C., Llewellyn, O. A., Miller, A. G., Patzelt, A., Ghazanfar, S. A., Timberlake, J., Klöser, H., Shennan-Farpón, Y., Kindt, R., Lillesø, J.-P. B., van Breugel, P., Graudal, L., Voge, M., Al-Shammari, K. F., and Saleem, M.: An Ecoregion-Based Approach to Protecting Half the Terrestrial Realm, Bioscience, 67, 534–545, https://doi.org/10.1093/biosci/bix014, 2017.
Eckhardt, T., Knoblauch, C., Kutzbach, L., Holl, D., Simpson, G., Abakumov, E., and Pfeiffer, E.-M.: Partitioning net ecosystem exchange of CO2 on the pedon scale in the Lena River Delta, Siberia, Biogeosciences, 16, 1543–1562, https://doi.org/10.5194/bg-16-1543-2019, 2019.
Etzold, S., Buchmann, N., and Eugster, W.: Contribution of advection to the carbon budget measured by eddy covariance at a steep mountain slope forest in Switzerland, Biogeosciences, 7, 2461–2475, https://doi.org/10.5194/bg-7-2461-2010, 2010.
Euskirchen, E. S., Bret-Harte, M. S., Scott, G. J., Edgar, C., and Shaver, G. R.: Seasonal patterns of carbon dioxide and water fluxes in three representative tundra ecosystems in northern Alaska, Ecosphere, 3, art4, https://doi.org/10.1890/es11-00202.1, 2012.
Fox, A. M., Huntley, B., Lloyd, C. R., Williams, M., and Baxter, R.: Net ecosystem exchange over heterogeneous Arctic tundra: Scaling between chamber and eddy covariance measurements, Global Biogeochem. Cy., 22, GB2027, https://doi.org/10.1029/2007GB003027, 2008.
Gorham, E.: Northern Peatlands: Role in the Carbon Cycle and Probable Responses to Climatic Warming, Ecol. Appl., 1, 182–195, https://doi.org/10.2307/1941811, 1991.
Hari, P., Nikinmaa, E., Pohja, T., Siivola, E., Bäck, J., Vesala, T., and Kulmala, M.: Station for Measuring Ecosystem–Atmosphere Relations: SMEAR, in: Physical and Physiological Forest Ecology, edited by: Hari, P., Heliövaara, K., and Kulmala, L., Springer Netherlands, Dordrecht, 471–487, https://doi.org/10.1007/978-94-007-5603-8_9, 2013.
Hayes, D. J., Kicklighter, D. W., David McGuire, A., Chen, M., Zhuang, Q., Yuan, F., Melillo, J. M., and Wullschleger, S. D.: The impacts of recent permafrost thaw on land–atmosphere greenhouse gas exchange, Environ. Res. Lett., 9, 045005, https://doi.org/10.1088/1748-9326/9/4/045005, 2014.
Heiskanen, L., Tuovinen, J.-P., Räsänen, A., Virtanen, T., Juutinen, S., Lohila, A., Penttilä, T., Linkosalmi, M., Mikola, J., Laurila, T., and Aurela, M.: Carbon dioxide and methane exchange of a patterned subarctic fen during two contrasting growing seasons, Biogeosciences, 18, 873–896, https://doi.org/10.5194/bg-18-873-2021, 2021.
Helbig, M., Wischnewski, K., Gosselin, G. H., Biraud, S. C., Bogoev, I., Chan, W. S., Euskirchen, E. S., Glenn, A. J., Marsh, P. M., Quinton, W. L., and Sonnentag, O.: Addressing a systematic bias in carbon dioxide flux measurements with the EC150 and the IRGASON open-path gas analyzers, Agr. Forest Meteorol., 228–229, 349–359, https://doi.org/10.1016/j.agrformet.2016.07.018, 2016.
Heliasz, M., Johansson, T., Lindroth, A., Mölder, M., Mastepanov, M., Friborg, T., Callaghan, T. V., and Christensen, T. R.: Quantification of C uptake in subarctic birch forest after setback by an extreme insect outbreak, Geophys. Res. Lett., 38, L01704, https://doi.org/10.1029/2010gl044733, 2011.
Hermle, S., Lavigne, M. B., Bernier, P. Y., Bergeron, O., and Paré, D.: Component respiration, ecosystem respiration and net primary production of a mature black spruce forest in northern Quebec, Tree Physiol., 30, 527–540, https://doi.org/10.1093/treephys/tpq002, 2010.
Hugelius, G., Strauss, J., Zubrzycki, S., Harden, J. W., Schuur, E. A. G., Ping, C.-L., Schirrmeister, L., Grosse, G., Michaelson, G. J., Koven, C. D., O'Donnell, J. A., Elberling, B., Mishra, U., Camill, P., Yu, Z., Palmtag, J., and Kuhry, P.: Estimated stocks of circumpolar permafrost carbon with quantified uncertainty ranges and identified data gaps, Biogeosciences, 11, 6573–6593, https://doi.org/10.5194/bg-11-6573-2014, 2014.
Hugelius, G., Loisel, J., Chadburn, S., Jackson, R. B., Jones, M., MacDonald, G., Marushchak, M., Olefeldt, D., Packalen, M., Siewert, M. B., Treat, C., Turetsky, M., Voigt, C., and Yu, Z.: Large stocks of peatland carbon and nitrogen are vulnerable to permafrost thaw, P. Natl. Acad. Sci. USA, 117, 20438–20446, https://doi.org/10.1073/pnas.1916387117, 2020.
Järveoja, J., Nilsson, M. B., Gažovič, M., Crill, P. M., and Peichl, M.: Partitioning of the net CO 2 exchange using an automated chamber system reveals plant phenology as key control of production and respiration fluxes in a boreal peatland, Glob. Change Biol., 24, 3436–3451, 2018.
Järveoja, J., Nilsson, M. B., Crill, P. M., and Peichl, M.: Bimodal diel pattern in peatland ecosystem respiration rebuts uniform temperature response, Nat. Commun., 11, 4255, https://doi.org/10.1038/s41467-020-18027-1, 2020.
Jentzsch, K., Schulz, A., Pirk, N., Foken, T., Crewell, S., and Boike, J.: High levels of CO2 exchange during synoptic-scale events introduce large uncertainty into the arctic carbon budget, Geophys. Res. Lett., 48, e2020GL092256, https://doi.org/10.1029/2020gl092256, 2021.
Jian, J., Vargas, R., Anderson-Teixeira, K., Stell, E., Herrmann, V., Horn, M., Kholod, N., Manzon, J., Marchesi, R., Paredes, D., and Bond-Lamberty, B.: A restructured and updated global soil respiration database (SRDB-V5), Earth Syst. Sci. Data, 13, 255–267, https://doi.org/10.5194/essd-13-255-2021, 2021.
Keenan, T. F. and Williams, C. A.: The Terrestrial Carbon Sink, Annu. Rev. Environ. Resour., 43, 219–243, https://doi.org/10.1146/annurev-environ-102017-030204, 2018.
Keenan, T. F., Migliavacca, M., Papale, D., Baldocchi, D., Reichstein, M., Torn, M., and Wutzler, T.: Widespread inhibition of daytime ecosystem respiration, Nature Ecology & Evolution, 3, 407–415, https://doi.org/10.1038/s41559-019-0809-2, 2019.
Kittler, F., Eugster, W., Foken, T., Heimann, M., Kolle, O., and Göckede, M.: High-quality eddy-covariance CO2budgets under cold climate conditions: Arctic Eddy-Covariance CO2Budgets, J. Geophys. Res.-Biogeo., 122, 2064–2084, https://doi.org/10.1002/2017jg003830, 2017a.
Kittler, F., Heimann, M., Kolle, O., Zimov, N., Zimov, S., and Göckede, M.: Long-term drainage reduces CO2 uptake and CH4 emissions in a Siberian permafrost ecosystem, Global Biogeochem. Cy., 31, 1704–1717, 2017b.
Lafleur, P. M., Humphreys, E. R., St Louis, V. L., Myklebust, M. C., Papakyriakou, T., Poissant, L., Barker, J. D., Pilote, M., and Swystun, K. A.: Variation in peak growing season net ecosystem production across the Canadian Arctic, Environ. Sci. Technol., 46, 7971–7977, https://doi.org/10.1021/es300500m, 2012.
Laine, A., Sottocornola, M., Kiely, G., Byrne, K. A., Wilson, D., and Tuittila, E.-S.: Estimating net ecosystem exchange in a patterned ecosystem: Example from blanket bog, Agr. Forest Meteorol., 138, 231–243, https://doi.org/10.1016/j.agrformet.2006.05.005, 2006.
Lamarche, C., Bontemps, S., Verhegghen, A., Radoux, J., Vanbogaert, E., Kalogirou, V., Seifert, F. M., Arino, O., and Defourny, P.: Characterizing The Surface Dynamics For Land Cover Mapping: Current Achievements Of The ESA CCI Land Cover, Proc. ESA Living Planet Symposium 2013, 9–13 September 2013, Edinburgh, UK, ESA SP-722, 72279, 2013.
Lasslop, G., Reichstein, M., Papale, D., Richardson, A. D., Arneth, A., Barr, A., Stoy, P., and Wohlfahrt, G.: Separation of net ecosystem exchange into assimilation and respiration using a light response curve approach: critical issues and global evaluation: Separation of nee into gpp and reco, Glob. Change Biol., 16, 187–208, https://doi.org/10.1111/j.1365-2486.2009.02041.x, 2010.
López-Blanco, E., Lund, M., Williams, M., Tamstorf, M. P., Westergaard-Nielsen, A., Exbrayat, J.-F., Hansen, B. U., and Christensen, T. R.: Exchange of CO2 in Arctic tundra: impacts of meteorological variations and biological disturbance, Biogeosciences, 14, 4467–4483, https://doi.org/10.5194/bg-14-4467-2017, 2017.
López-Blanco, E., Jackowicz-Korczynski, M., Mastepanov, M., Skov, K., Westergaard-Nielsen, A., Williams, M., and Christensen, T. R.: Multi-year data-model evaluation reveals the importance of nutrient availability over climate in arctic ecosystem C dynamics, Environ. Res. Lett., 15, 094007, https://doi.org/10.1088/1748-9326/ab865b, 2020.
Luyssaert, S., Inglima, I., Jung, M., Richardson, A. D., Reichstein, M., Papale, D., Piao, S. L., Schulze, E.-D., Wingate, L., Matteucci, G., Aragao, L., Aubinet, M., Beer, C., Bernhofer, C., Black, K. G., Bonal, D., Bonnefond, J.-M., Chambers, J., Ciais, P., Cook, B., Davis, K. J., Dolman, A. J., Gielen, B., Goulden, M., Grace, J., Granier, A., Grelle, A., Griffis, T., Grünwald, T., Guidolotti, G., Hanson, P. J., Harding, R., Hollinger, D. Y., Hutyra, L. R., Kolari, P., Kruijt, B., Kutsch, W., Lagergren, F., Laurila, T., Law, B. E., Le Maire, G., Lindroth, A., Loustau, D., Malhi, Y., Mateus, J., Migliavacca, M., Misson, L., Montagnani, L., Moncrieff, J., Moors, E., Munger, J. W., Nikinmaa, E., Ollinger, S. V., Pita, G., Rebmann, C., Roupsard, O., Saigusa, N., Sanz, M. J., Seufert, G., Sierra, C., Smith, M.-L., Tang, J., Valentini, R., Vesala, T., and Janssens, I. A.: CO2 balance of boreal, temperate, and tropical forests derived from a global database, Glob. Change Biol., 13, 2509–2537, https://doi.org/10.1111/j.1365-2486.2007.01439.x, 2007.
Marushchak, M. E., Kiepe, I., Biasi, C., Elsakov, V., Friborg, T., Johansson, T., Soegaard, H., Virtanen, T., and Martikainen, P. J.: Carbon dioxide balance of subarctic tundra from plot to regional scales, Biogeosciences, 10, 437–452, https://doi.org/10.5194/bg-10-437-2013, 2013.
McGuire, A. D., Christensen, T. R., Hayes, D., Heroult, A., Euskirchen, E., Kimball, J. S., Koven, C., Lafleur, P., Miller, P. A., Oechel, W., Peylin, P., Williams, M., and Yi, Y.: An assessment of the carbon balance of Arctic tundra: comparisons among observations, process models, and atmospheric inversions, Biogeosciences, 9, 3185–3204, https://doi.org/10.5194/bg-9-3185-2012, 2012.
McGuire, A. D., Koven, C., Lawrence, D. M., Clein, J. S., Xia, J., Beer, C., Burke, E., Chen, G., Chen, X., Delire, C., Jafarov, E., MacDougall, A. H., Marchenko, S., Nicolsky, D., Peng, S., Rinke, A., Saito, K., Zhang, W., Alkama, R., Bohn, T. J., Ciais, P., Decharme, B., Ekici, A., Gouttevin, I., Hajima, T., Hayes, D. J., Ji, D., Krinner, G., Lettenmaier, D. P., Luo, Y., Miller, P. A., Moore, J. C., Romanovsky, V., Schädel, C., Schaefer, K., Schuur, E. A. G., Smith, B., Sueyoshi, T., and Zhuang, Q.: Variability in the sensitivity among model simulations of permafrost and carbon dynamics in the permafrost region between 1960 and 2009, Global Biogeochem. Cy., 30, 1015–1037, https://doi.org/10.1002/2016GB005405, 2016.
Merbold, L., Kutsch, W. L., Corradi, C., Kolle, O., Rebmann, C., Stoy, P. C., Zimov, S. A., and Schulze, E.-D.: Artificial drainage and associated carbon fluxes (CO2/CH4) in a tundra ecosystem, Glob. Change Biol., 15, 2599–2614, https://doi.org/10.1111/j.1365-2486.2009.01962.x, 2009.
Mishra, U., Hugelius, G., Shelef, E., Yang, Y., Strauss, J., Lupachev, A., Harden, J. W., Jastrow, J. D., Ping, C.-L., Riley, W. J., Schuur, E. A. G., Matamala, R., Siewert, M., Nave, L. E., Koven, C. D., Fuchs, M., Palmtag, J., Kuhry, P., Treat, C. C., Zubrzycki, S., Hoffman, F. M., Elberling, B., Camill, P., Veremeeva, A., and Orr, A.: Spatial heterogeneity and environmental predictors of permafrost region soil organic carbon stocks, Sci. Adv., 7, eaaz5236, https://doi.org/10.1126/sciadv.aaz5236, 2021.
Natali, S. M., Watts, J. D., Rogers, B. M., Potter, S., Ludwig, S. M., Selbmann, A.-K., Sullivan, P. F., Abbott, B. W., Arndt, K. A., Birch, L., Björkman, M. P., Bloom, A. A., Celis, G., Christensen, T. R., Christiansen, C. T., Commane, R., Cooper, E. J., Crill, P., Czimczik, C., Davydov, S., Du, J., Egan, J. E., Elberling, B., Euskirchen, E. S., Friborg, T., Genet, H., Göckede, M., Goodrich, J. P., Grogan, P., Helbig, M., Jafarov, E. E., Jastrow, J. D., Kalhori, A. A. M., Kim, Y., Kimball, J. S., Kutzbach, L., Lara, M. J., Larsen, K. S., Lee, B.-Y., Liu, Z., Loranty, M. M., Lund, M., Lupascu, M., Madani, N., Malhotra, A., Matamala, R., McFarland, J., McGuire, A. D., Michelsen, A., Minions, C., Oechel, W. C., Olefeldt, D., Parmentier, F.-J. W., Pirk, N., Poulter, B., Quinton, W., Rezanezhad, F., Risk, D., Sachs, T., Schaefer, K., Schmidt, N. M., Schuur, E. A. G., Semenchuk, P. R., Shaver, G., Sonnentag, O., Starr, G., Treat, C. C., Waldrop, M. P., Wang, Y., Welker, J., Wille, C., Xu, X., Zhang, Z., Zhuang, Q., and Zona, D.: Large loss of CO2 in winter observed across the northern permafrost region, Nat. Clim. Change, 9, 852–857, https://doi.org/10.1038/s41558-019-0592-8, 2019a.
Natali, S., Watts, J. D., Potter, S., Rogers, B. M., Ludwig, S., Selbmann, A., Sullivan, P., Abbott, B., Arndt, K., Bloom, A. A., Celis, G., Christensen, T., Christiansen, C., Commane, R., Cooper, E., Crill, P. M., Czimczik, C. I., Davydov, S., Du, J., Egan, J., Elberling, B., Euskirchen, S. E., Friborg, T., Genet, H., Goodrich, J., Grogan, P., Helbig, M., Jafarov, E., Jastrow, J., Kalhori, A., Kim, Y., Kimball, J. S., Kutzbach, L., Lara, M., Larsen, K., Lee, B., Liu, Z., Loranty, M. M., Lund, M., Lupascu, M., Madani, N., Malhotra, A., Matamala, R., Mcfarland, J., Mcguire, A., Michelsen, A., Minions, C., Oechel, W., Olefeldt, D., Parmentier, F., Pirk, N., Poulter, B., Quinton, W., Rezanezhad, F., Risk, D., Sachs, T., Schaefer, K., Schmidt, N., Schuur, E., Semenchuk, P., Shaver, G., Sonnentag, O., Starr, G., Treat, C., Waldrop, M., Wang, Y., Welker, J., Wille, C., Xu, X., Zhang, Z., Zhuang, Q., and Zona, D.: Synthesis of winter in situ soil CO2 flux in pan-arctic and boreal regions, 1989–2017, ORNL DAAC, Oak Ridge, Tennessee, USA [data set], https://doi.org/10.3334/ORNLDAAC/1692, 2019b.
Natural Earth Data: Free vector and raster map data at 1:10 m, 1:50 m, and 1:110 m scales, available at: https://www.naturalearthdata.com/, last access: 12 February 2021.
Nobrega, S. and Grogan, P.: Landscape and ecosystem-level controls on net carbon dioxide exchange along a natural moisture gradient in Canadian low arctic tundra, Ecosystems, 11, 377–396, https://doi.org/10.1007/s10021-008-9128-1, 2008.
Novick, K. A., Biederman, J. A., Desai, A. R., Litvak, M. E., Moore, D. J. P., Scott, R. L., and Torn, M. S.: The AmeriFlux network: A coalition of the willing, Agr. Forest Meteorol., 249, 444–456, https://doi.org/10.1016/j.agrformet.2017.10.009, 2018.
Nykänen, H., Heikkinen, J. E. P., Pirinen, L., Tiilikainen, K., and Martikainen, P. J.: Annual CO2 exchange and CH4 fluxes on a subarctic palsa mire during climatically different years, Global Biogeochem. Cy., 17, 2003.
Oechel, W. C., Vourlitis, G. L., Hastings, S. J., Zulueta, R. C., Hinzman, L., and Kane, D.: Acclimation of ecosystem CO2 exchange in the Alaskan Arctic in response to decadal climate warming, Nature, 406, 978–981, https://doi.org/10.1038/35023137, 2000.
Pallandt, M., Kumar, J., Mauritz, M., Schuur, E., Virkkala, A.-M., Celis, G., Hoffman, F., and Göckede, M.: Representativeness assessment of the pan-Arctic eddy-covariance site network, and optimized future enhancements, Biogeosciences Discuss. [preprint], https://doi.org/10.5194/bg-2021-133, in review, 2021.
Papale, D., Reichstein, M., Aubinet, M., Canfora, E., Bernhofer, C., Kutsch, W., Longdoz, B., Rambal, S., Valentini, R., Vesala, T., and Yakir, D.: Towards a standardized processing of Net Ecosystem Exchange measured with eddy covariance technique: algorithms and uncertainty estimation, Biogeosciences, 3, 571–583, https://doi.org/10.5194/bg-3-571-2006, 2006.
Paris, J.-D., Ciais, P., Rivier, L., Chevallier, F., Dolman, H., Flaud, J.-M., Garrec, C., Gerbig, C., Grace, J., Huertas, E., Johannessen, T., Jordan, A., Levin, I., Papale, D., Valentini, R., Watson, A., Vesala, T., and ICOS-PP Consortium: Integrated Carbon Observation System, Geophys. Res. Abstr., 14, EGU2012-12397, 2012.
Parker, T. C., Subke, J.-A., and Wookey, P. A.: Rapid carbon turnover beneath shrub and tree vegetation is associated with low soil carbon stocks at a subarctic treeline, Glob. Change Biol., 21, 2070–2081, https://doi.org/10.1111/gcb.12793, 2015.
Parmentier, F.-J., Sonnentag, O., Mauritz, M., Virkkala, A.-M., and Schuur, E.: Is the northern permafrost zone a source or a sink for carbon?, Eos, 100, https://doi.org/10.1029/2019eo130507, 2019.
Pastorello, G., Trotta, C., Canfora, E., Chu, H., Christianson, D., Cheah, Y.-W., Poindexter, C., Chen, J., Elbashandy, A., Humphrey, M., Isaac, P., Polidori, D., Ribeca, A., van Ingen, C., Zhang, L., Amiro, B., Ammann, C., Arain, M. A., Ardö, J., Arkebauer, T., Arndt, S. K., Arriga, N., Aubinet, M., Aurela, M., Baldocchi, D., Barr, A., Beamesderfer, E., Marchesini, L. B., Bergeron, O., Beringer, J., Bernhofer, C., Berveiller, D., Billesbach, D., Black, T. A., Blanken, P. D., Bohrer, G., Boike, J., Bolstad, P. V., Bonal, D., Bonnefond, J.-M., Bowling, D. R., Bracho, R., Brodeur, J., Brümmer, C., Buchmann, N., Burban, B., Burns, S. P., Buysse, P., Cale, P., Cavagna, M., Cellier, P., Chen, S., Chini, I., Christensen, T. R., Cleverly, J., Collalti, A., Consalvo, C., Cook, B. D., Cook, D., Coursolle, C., Cremonese, E., Curtis, P. S., D'Andrea, E., da Rocha, H., Dai, X., Davis, K. J., De Cinti, B., de Grandcourt, A., De Ligne, A., De Oliveira, R. C., Delpierre, N., Desai, A. R., Di Bella, C. M., di Tommasi, P., Dolman, H., Domingo, F., Dong, G., Dore, S., Duce, P., Dufrêne, E., Dunn, A., Dušek, J., Eamus, D., Eichelmann, U., ElKhidir, H. A. M., Eugster, W., Ewenz, C. M., Ewers, B., Famulari, D., Fares, S., Feigenwinter, I., Feitz, A., Fensholt, R., Filippa, G., Fischer, M., Frank, J., Galvagno, M., Gharun, M., Gianelle, D., et al.: The FLUXNET2015 dataset and the ONEFlux processing pipeline for eddy covariance data, Sci. Data, 7, 225, https://doi.org/10.1038/s41597-020-0534-3, 2020.
Pavelka, M., Acosta, M., Kiese, R., Altimir, N., Brümmer, C., Crill, P., Darenova, E., Fuß, R., Gielen, B., Graf, A., Klemedtsson, L., Lohila, A., Longdoz, B., Lindroth, A., Nilsson, M., Marañon-Jimenez, S., Merbold, L., Montagnani, L., Peichl, M., Pihlatie, M., Pumpanen, J., Ortiz, P. S., Silvennoinen, H., Skiba, U., Vestin, P., Weslien, P., Janouš, D., and Kutsch, W.: Standardisation of chamber technique for CO2, N2O and CH4 fluxes measurements from terrestrial ecosystems, Int. Agrophys., 32, 569–587, https://doi.org/10.1515/intag-2017-0045, 2018.
Phillips, C. L., Bond-Lamberty, B., Desai, A. R., Lavoie, M., Risk, D., Tang, J., Todd-Brown, K., and Vargas, R.: The value of soil respiration measurements for interpreting and modeling terrestrial carbon cycling, Plant Soil, 413, 1–25, https://doi.org/10.1007/s11104-016-3084-x, 2017.
Pirk, N., Sievers, J., Mertes, J., Parmentier, F.-J. W., Mastepanov, M., and Christensen, T. R.: Spatial variability of CO2 uptake in polygonal tundra: assessing low-frequency disturbances in eddy covariance flux estimates, Biogeosciences, 14, 3157–3169, https://doi.org/10.5194/bg-14-3157-2017, 2017.
Raynolds, M. K., Walker, D. A., Balser, A., Bay, C., Campbell, M., Cherosov, M. M., Daniëls, F. J. A., Eidesen, P. B., Ermokhina, K. A., Frost, G. V., Jedrzejek, B., Jorgenson, M. T., Kennedy, B. E., Kholod, S. S., Lavrinenko, I. A., Lavrinenko, O. V., Magnússon, B., Matveyeva, N. V., Metúsalemsson, S., Nilsen, L., Olthof, I., Pospelov, I. N., Pospelova, E. B., Pouliot, D., Razzhivin, V., Schaepman-Strub, G., Šibík, J., Telyatnikov, M. Y., and Troeva, E.: A raster version of the Circumpolar Arctic Vegetation Map (CAVM), Remote Sens. Environ., 232, 111297, https://doi.org/10.1016/j.rse.2019.111297, 2019.
Reichstein, M., Falge, E., Baldocchi, D., Papale, D., Aubinet, M., Berbigier, P., Bernhofer, C., Buchmann, N., Gilmanov, T., Granier, A., Grunwald, T., Havrankova, K., Ilvesniemi, H., Janous, D., Knohl, A., Laurila, T., Lohila, A., Loustau, D., Matteucci, G., Meyers, T., Miglietta, F., Ourcival, J.-M., Pumpanen, J., Rambal, S., Rotenberg, E., Sanz, M., Tenhunen, J., Seufert, G., Vaccari, F., Vesala, T., Yakir, D., and Valentini, R.: On the separation of net ecosystem exchange into assimilation and ecosystem respiration: review and improved algorithm, Glob. Change Biol., 11, 1424–1439, https://doi.org/10.1111/j.1365-2486.2005.001002.x, 2005.
Riutta, T., Laine, J., Aurela, M., Rinne, J., Vesala, T., Laurila, T., Haapanala, S., Pihlatie, M., and Tuittila, E.-S.: Spatial variation in plant community functions regulates carbon gas dynamics in a boreal fen ecosystem, Tellus B, 59, 838–852, https://doi.org/10.1111/j.1600-0889.2007.00302.x, 2007.
Ryan, M. G., Lavigne, M. B., and Gower, S. T.: Annual carbon cost of autotrophic respiration in boreal forest ecosystems in relation to species and climate, J. Geophys. Res., 102, 28871–28883, https://doi.org/10.1029/97jd01236, 1997.
Schneider, J., Kutzbach, L., and Wilmking, M.: Carbon dioxide exchange fluxes of a boreal peatland over a complete growing season, Komi Republic, NW Russia, Biogeochemistry, 111, 485–513, https://doi.org/10.1007/s10533-011-9684-x, 2012.
Schuur, E. A. G., McGuire, A. D., Schädel, C., Grosse, G., Harden, J. W., Hayes, D. J., Hugelius, G., Koven, C. D., Kuhry, P., Lawrence, D. M., Natali, S. M., Olefeldt, D., Romanovsky, V. E., Schaefer, K., Turetsky, M. R., Treat, C. C., and Vonk, J. E.: Climate change and the permafrost carbon feedback, Nature, 520, 171–179, https://doi.org/10.1038/nature14338, 2015.
Sellers, P. J., Hall, F. G., Kelly, R. D., Black, A., Baldocchi, D., Berry, J., Ryan, M., Ranson, K. J., Crill, P. M., Lettenmaier, D. P., Margolis, H., Cihlar, J., Newcomer, J., Fitzjarrald, D., Jarvis, P. G., Gower, S. T., Halliwell, D., Williams, D., Goodison, B., Wickland, D. E., and Guertin, F. E.: BOREAS in 1997: Experiment overview, scientific results, and future directions, J. Geophys. Res., 102, 28731–28769, https://doi.org/10.1029/97jd03300, 1997.
Shaver, G. R., Street, L. E., Rastetter, E. B., Van Wijk, M. T., and Williams, M.: Functional Convergence in Regulation of Net CO2 Flux in Heterogeneous Tundra Landscapes in Alaska and Sweden, J. Ecol., 95, 802–817, 2007.
Siewert, M. B., Hanisch, J., Weiss, N., Kuhry, P., Maximov, T. C., and Hugelius, G.: Comparing carbon storage of Siberian tundra and taiga permafrost ecosystems at very high spatial resolution: Ecosystem Carbon in Taiga and Tundra, J. Geophys. Res.-Biogeo., 120, 1973–1994, https://doi.org/10.1002/2015jg002999, 2015.
Soloway, A. D., Amiro, B. D., Dunn, A. L., and Wofsy, S. C.: Carbon neutral or a sink? Uncertainty caused by gap-filling long-term flux measurements for an old-growth boreal black spruce forest, Agr. Forest Meteorol., 233, 110–121, https://doi.org/10.1016/j.agrformet.2016.11.005, 2017.
Tarnocai, C., Canadell, J. G., Schuur, E. A. G., Kuhry, P., Mazhitova, G., and Zimov, S.: Soil organic carbon pools in the northern circumpolar permafrost region, Global Biogeochem. Cy., 23, GB2023, https://doi.org/10.1029/2008GB003327, 2009.
Tramontana, G., Migliavacca, M., Jung, M., Reichstein, M., Keenan, T. F., Camps-Valls, G., Ogee, J., Verrelst, J., and Papale, D.: Partitioning net carbon dioxide fluxes into photosynthesis and respiration using neural networks, Glob. Change Biol., 26, 5235–5253, https://doi.org/10.1111/gcb.15203, 2020.
Valentini, R.: EUROFLUX: An Integrated Network for Studying the Long-Term Responses of Biospheric Exchanges of Carbon, Water, and Energy of European Forests, in: Fluxes of Carbon, Water and Energy of European Forests, edited by: Valentini, R., Springer, Berlin, Heidelberg, 1–8, https://doi.org/10.1007/978-3-662-05171-9_1, 2003.
Virkkala, A.-M., Virtanen, T., Lehtonen, A., Rinne, J., and Luoto, M.: The current state of CO2 flux chamber studies in the Arctic tundra: A review, Prog. Phys. Geog., 42, 162–184, https://doi.org/10.1177/0309133317745784, 2018.
Virkkala, A.-M., Abdi, A. M., Luoto, M., and Metcalfe, D. B.: Identifying multidisciplinary research gaps across Arctic terrestrial gradients, Environ. Res. Lett., 14, 124061, https://doi.org/10.1088/1748-9326/ab4291, 2019.
Virkkala, A.-M., Aalto, J., Rogers, B. M., Tagesson, T., Treat, C. C., Natali, S. M., Watts, J. D., Potter, S., Lehtonen, A., Mauritz, M., Schuur, E. A. G., Kochendorfer, J., Zona, D., Oechel, W., Kobayashi, H., Humphreys, E., Goeckede, M., Iwata, H., Lafleur, P. M., Euskirchen, E. S., Bokhorst, S., Marushchak, M., Martikainen, P. J., Elberling, B., Voigt, C., Biasi, C., Sonnentag, O., Parmentier, F.-J. W., Ueyama, M., Celis, G., St Loius, V. L., Emmerton, C. A., Peichl, M., Chi, J., Järveoja, J., Nilsson, M. B., Oberbauer, S. F., Torn, M. S., Park, S.-J., Dolman, H., Mammarella, I., Chae, N., Poyatos, R., López-Blanco, E., Røjle Christensen, T., Jung Kwon, M., Sachs, T., Holl, D., and Luoto, M.: Statistical upscaling of ecosystem CO2 fluxes across the terrestrial tundra and boreal domain: regional patterns and uncertainties, Glob. Change Biol., 27, 4040–4059, https://doi.org/10.1111/gcb.15659, 2021a.
Virkkala, A.-M., Natali, S., Rogers, B. M., Watts, J. D., Savage, K., Connon, S. J., Mauritz-tozer, M. E., Schuur, E. A. G., Peter, D. L., Minions, C., Nojeim, J., Commane, R., Emmerton, C. A., Goeckede, M., Helbig, M., Holl, D., Iwata, H., Kobayashi, H., Kolari, P., Lopez-blanco, E., Marushchak, M. E., Mastepanov, M., Merbold, L., Peichl, M., Sonnentag, O., Sachs, T., Ueyama, M., Voigt, C., Aurela, M., Boike, J., Celis, G., Chae, N., Christensen, T., Bret-Harte, S., Dengel, S., Dolman, H., Edgar, C., Elberling, B., Euskirchen, S. E., Grelle, A., Hatakka, J., Humphreys, E. R., Jaerveoja, J., Kotani, A., Kutzbach, L., Laurila, T., Lohila, A., Mammarella, I., Matsuura, Y., Meyer, G., Nilsson, M. B., Oberbauer, S. F., Park, S. J., Parmentier, F. J. W., Petrov, R., Prokushkin, A. S., Zyrianov, S., Schulze, C., St. Louis, V. L., Tuittila, E. S., Tuovinen, J. P., Quinton, W., Varlagin, A., Zona, D., and Zyryanov, V. I.: The ABCflux Database: Arctic-Boreal CO2 Flux and Site Environmental Data, 1989–2020, ORNL DAAC, Oak Ridge, Tennessee, USA [data set], https://doi.org/10.3334/ORNLDAAC/1934, 2021b.
Voigt, C., Lamprecht, R. E., Marushchak, M. E., Lind, S. E., Novakovskiy, A., Aurela, M., Martikainen, P. J., and Biasi, C.: Warming of subarctic tundra increases emissions of all three important greenhouse gases – carbon dioxide, methane, and nitrous oxide, Glob. Change Biol., 23, 3121–3138, https://doi.org/10.1111/gcb.13563, 2017.
Walker, D. A., Raynolds, M. K., Daniels, F. J. A., Einarsson, E., Elvebakk, A., Gould, W. A., Katenin, A. E., Kholod, S. S., Markon, C. J., Melnikov, E. S., Moskalenko, N. G., Talbot, S. S., and Yurtsev, B. A.: The Circumpolar Arctic vegetation map, J. Veg. Sci., 16, 267–282, https://doi.org/10.1111/j.1654-1103.2005.tb02365.x, 2005.
Wang, K., Liu, C., Zheng, X., Pihlatie, M., Li, B., Haapanala, S., Vesala, T., Liu, H., Wang, Y., Liu, G., and Hu, F.: Comparison between eddy covariance and automatic chamber techniques for measuring net ecosystem exchange of carbon dioxide in cotton and wheat fields, Biogeosciences, 10, 6865–6877, https://doi.org/10.5194/bg-10-6865-2013, 2013.
Wang, L., Lee, X., Wang, W., Wang, X., Wei, Z., Fu, C., Gao, Y., Lu, L., Song, W., Su, P., and Lin, G.: A Meta-Analysis of Open-Path Eddy Covariance Observations of Apparent CO2 Flux in Cold Conditions in FLUXNET, J. Atmos. Ocean. Technol., 34, 2475–2487, https://doi.org/10.1175/JTECH-D-17-0085.1, 2017.
Watts, J. D., Natali, S., Potter, S., and Rogers, B. M.: Gridded Winter Soil CO2 Flux Estimates for pan-Arctic and Boreal Regions, 2003–2100, ORNL DAAC, Oak Ridge, Tennessee, USA [data set], https://doi.org/10.3334/ORNLDAAC/1683, 2019.
Wutzler, T., Lucas-Moffat, A., Migliavacca, M., Knauer, J., Sickel, K., Šigut, L., Menzer, O., and Reichstein, M.: Basic and extensible post-processing of eddy covariance flux data with REddyProc, Biogeosciences, 15, 5015–5030, https://doi.org/10.5194/bg-15-5015-2018, 2018.