the Creative Commons Attribution 4.0 License.
the Creative Commons Attribution 4.0 License.
 | 05 Apr 2022
Global GOSAT, OCO-2, and OCO-3 solar-induced chlorophyll fluorescence datasets
Thomas P. Kurosu
Nicholas Parazoo
Philipp Köhler
Yujie Wang
Christian Frankenberg
The retrieval of solar-induced chlorophyll fluorescence (SIF) from space is a relatively new advance in Earth observation science, having only become feasible within the last decade. Interest in SIF data has grown exponentially, and the retrieval of SIF and the provision of SIF data products has become an important and formal component of spaceborne Earth observation missions. Here, we describe the global Level 2 SIF Lite data products for the Greenhouse Gases Observing Satellite (GOSAT), the Orbiting Carbon Observatory-2 (OCO-2), and Orbiting Carbon Observatory-3 (OCO-3) platforms, which are provided for each platform in daily netCDF files (Frankenberg, 2022, https://doi.org/10.22002/D1.8771; OCO-2 Science Team et al., 2020, https://doi.org/10.5067/XO2LBBNPO010; OCO-3 Science Team et al., 2020, https://doi.org/10.5067/NOD1DPPBCXSO). We also outline the methods used to retrieve SIF and estimate uncertainty, describe all the data fields, and provide users with the background information necessary for the proper use and interpretation of the data, such as considerations of retrieval noise, sun sensor geometry, the indirect relationship between SIF and photosynthesis, and differences among the three platforms and their respective data products. OCO-2 and OCO-3 have the highest spatial resolution of spaceborne SIF retrievals to date, and the target and snapshot area mode observation modes of OCO-2 and OCO-3 are unique. These modes provide hundreds to thousands of SIF retrievals at biologically diverse global target sites during a single overpass, and provide an opportunity to better inform our understanding of canopy-scale vegetation SIF emission across biomes.
- Article
(9539 KB) - Full-text XML
-
Supplement
(470 KB) - BibTeX
- EndNote


Chlorophyll fluorescence is light that is emitted from chlorophyll after the absorption of photosynthetically active radiation (PAR), which covers the spectral range of roughly 400 to 700 nm and corresponds to the range of light visible to the human eye (Müller, 1874). The fluorescence emission occurs in the range of ∼650 to 800 nm during the light reaction of photosynthesis, where energy absorbed by leaf pigments is converted into the chemical energy that is needed by the dark reactions for fixing atmospheric carbon dioxide into sugars. The absorption of a photon by chlorophyll excites an electron, and the excitation energy has the following three main pathways: photochemistry, non-photochemical quenching or heat, and chlorophyll fluorescence. Most of the excitation energy is used for photochemistry when vegetation is not stressed, but at all times only a small fraction (∼0.5 %–2 %) is emitted as chlorophyll fluorescence (Porcar-Castell et al., 2014; Maxwell and Johnson, 2000).
Chlorophyll fluorescence has been a research tool for studying photosynthesis for nearly 150 years (Müller, 1874), but only recently have spaceborne retrievals of solar-induced chlorophyll fluorescence (SIF) been realized (Guanter et al., 2007; Joiner et al., 2011; Frankenberg et al., 2011b). The number of spaceborne platforms from which SIF can be retrieved continues to grow, and the SIF temporal record continues to lengthen. Spaceborne SIF data have generated much excitement in a plethora of fields within the biological, biogeochemical cycle, climate, and Earth system science communities. Chlorophyll fluorescence has long been a key component of the plant physiological and ecophysiological research communities (Maxwell and Johnson, 2000) and has traditionally been studied in vivo at the subcellular level and in situ using pulse amplitude modulated (PAM) fluorometry (Schreiber et al., 1986).
Most recently, remote sensing techniques have enabled the canopy- and ecosystem-level retrieval of SIF from towers, aircraft, and satellites. The evolution in our ability to retrieve SIF infrequently at the leaf level to frequent canopy-level retrievals across regional to global scales continues to greatly advance our understanding of plant and ecosystem function and carbon cycling.
Here, we describe, compare, and discuss the Level 2 SIF Lite version 9 (v9) data produced from the Greenhouse Gases Observing Satellite (GOSAT; Frankenberg, 2022) and Level 2 SIF Lite version 10 (v10) data from the Orbiting Carbon Observatory-2 (OCO-2) and Orbiting Carbon Observatory-3 (OCO-3; OCO-2 Science Team et al., 2020; OCO-3 Science Team et al., 2020). Our data description goes beyond previous documentation and publications via our description of the SIF Lite files and our presentation and comparison of the SIF data from the three platforms. Also, our discussions on SIF are intended to help the data user community to access and apply the data for scientific research and prevent misinterpretation.
The retrieval of SIF from space requires high spectral resolution and a high signal-to-noise ratio (SNR), as solar Fraunhofer lines are very narrow, and SIF is a relatively weak signal (Frankenberg et al., 2011b). Coincidentally, the spaceborne spectrometers that have been used for retrieving Earth's atmospheric carbon dioxide and methane concentrations include spectral channels covering Fraunhofer lines in the vicinity of the oxygen A-band where the atmospheric mass is retrieved with high spectral resolution (<0.2 nm), enabling SIF retrievals with a mean single measurement precision of around ∼0.5 W m−2 sr−1 µm−1 (as fully described in Sect. 4.2). Thus, the retrieval of SIF from space has been pioneered by the atmospheric science community (Guanter et al., 2007; Joiner et al., 2011; Frankenberg et al., 2011b), and spaceborne SIF retrievals and data products have historically been a by-product of missions that have aimed to monitor Earth's atmospheric trace gases.
2.1 GOSAT
GOSAT (also known as IBUKI) was developed by the Japan Aerospace Exploration Agency (JAXA) and launched in January 2009. In fact, the first global satellite SIF observations came from GOSAT (Joiner et al., 2011; Frankenberg et al., 2011b). On board the satellite is the greenhouse gas observation sensor (Thermal And Near-infrared Sensor for carbon Observation – Fourier Transform Spectrometer – TANSO-FTS), which has a spectral resolution of 0.012 nm (0.2 cm−1). The sensor has the following four bands: 0.758–0.775, 1.56–1.72, 1.92–2.08, and 5.56–14.3 µm. It has a sun-synchronous, descending orbit with an overpass time of 13:00 LT at the Equator, a 3 d repeat cycle, and a circular footprint of ∼82 km2 per sounding (∼10 km diameter; Kuze et al., 2009).
2.2 OCO-2 and OCO-3
OCO-2 is a NASA satellite that was launched in July 2014, and OCO-3 is a duplicate of the OCO-2 grating spectrometer attached to the Japanese Experiment Module Exposed Facility (JEM-EF) on the International Space Station (ISS) in May 2019 (Eldering et al., 2019). Each platform houses a three-channel grating spectrometer, with a spectral resolving power of (Crisp et al., 2017; Eldering et al., 2019), centered around the following wavelengths: an oxygen A band at 0.765 µm and carbon dioxide bands at 1.61 and 2.06 µm. The swath widths are ∼10 km with eight measurements across-track. The spatial resolution at nadir is slightly different for OCO-2 and OCO-3, at about 1.3 km×2.25 km and 1.6 km×2.2 km (across × along track), respectively.
OCO-2 has a 98.8 min orbit with a 13:36 nodal crossing time and a 16 d ground-track repeat cycle (Crisp, 2015). The ISS has a precessing low-inclination orbit that allows OCO-3 to view Earth at absolute latitudes less than ∼52∘. The ISS orbits the Earth ∼15.5 times a day, and data acquisition is halted during ISS maintenance and docking; thus, overpass times, revisit periods, and data availability are relatively irregular. Validation of the OCO-2 SIF retrievals was conducted by Sun et al. (2017) by comparing OCO-2 SIF to coordinated airborne measurements using the Chlorophyll Fluorescence Imaging Spectrometer (Frankenberg et al., 2018).

Figure 1Annual (2020) and June 2020 mean daily SIF757 for GOSAT, OCO-2, and OCO-3. The annual and monthly nadir-mode coverage of GOSAT, OCO-2, and OCO-3 is presented here as the mean daily SIF at 757 nm (SIF757) at a gridded resolution of 0.5∘ for visualization. Included are soundings from all measurement modes flagged as best and good quality and clear of clouds. At nadir, the diameter of the GOSAT soundings is ∼10 km, and the widths of the OCO-2 and OCO-3 swaths are about 10 and 13 km, respectively. Thus, the data gaps shown here are larger than depicted and are not to scale.
2.3 Observation modes
GOSAT observation modes are described as observation mode 1 in the sunshine (OB1D), observation mode 2 in the sunshine (OB2D), and specific observation mode in the sunshine (SPOD). OB1D is the routine observation mode, whereas OB2D is a non-routine mode in which the thermal-infrared observation and pointing mechanism is stopped during low power supply. Over land, SPOD is a target observation mode designed to observe specific sites. The Thermal And Near-infrared Sensor for carbon Observation – Fourier Transform Spectrometer (TANSO-FTS) sensor has a setting for low, medium, and high gain. The medium gain data are recommended for scenes that are bright, such as deserts. Since the data used for SIF retrievals are filtered to exclude bright scenes due to deserts, ice, snow, and cloud cover, the high gain data are used for SIF retrievals.
Nadir, glint, target, and transition observation modes are common to each OCO platform. The OCO-2 target mode provides repeated spatial sampling of a given target, such as an emission source or tower site. Target mode data for OCO-2 are absent from the v10 SIF Lite files but will be included in the v11 update.
The OCO-3 target mode is a sequence of adjacent and partially overlapping segments that allow for increased spatial sampling. The target modes for both platforms provide over 103 soundings. OCO-3 has an additional observation mode using its pointing mirror assembly (PMA), which allows for snapshot area mapping (SAM) of targets of interest. SAMs are a series of scans of a target that are nearly adjacent and can cover an area of ∼80 km2 in about 2 min. The SAMs and their target locations, which include volcanoes, various vegetation land cover types, and point sources of fossil fuel emissions, can be viewed at https://ocov3.jpl.nasa.gov/sams/index.php (last access: 7 March 2022). Target- and SAM-mode scans are prioritized and scheduled several days in advance of an overpass of the ISS over the target (Taylor et al., 2020).
The target and SAM observation modes offer a unique, spatially resolved acquisition of a target during a single overpass at different sun sensor geometries, as solar illumination is relatively fixed during overpasses, and soundings are acquired over a range of viewing angles as the sensors pass over their targets. For SIF applications, these measurements can be averaged to obtain SIF estimates with a reduced standard error or be binned by sun sensor geometries to investigate the effect of observation geometry on the retrieved SIF values, as we demonstrate below.

Figure 2Annual (2020) and June 2020 mean daily SIF757 for GOSAT, OCO-2, and OCO-3 for the contiguous U.S. (CONUS). These panels are magnifications of the CONUS from Fig. 1.
3.1 SIF Lite file structure and content
Level 2 data are ungridded (vector) data that contain geophysical variables that are of interest and use to the broader scientific community and are at same spatial and temporal resolution of the Level 0 and Level 1 data. Level 0 data, which are data obtained as-is from the sensor (Level 0), to which and ancillary information, such as radiometric and geometric calibration coefficients and georeferencing parameters, are appended to Level 0 data to form (Level 1) data, such as radiometric and geometric calibration coefficients and georeferencing parameters. Level 3 products refer to gridded (raster) data, which can be found at https://climatesciences.jpl.nasa.gov/sif/download-data/level-3/ (last access: 7 March 2022).
The annual and monthly spatial distribution of the GOSAT and OCO Level 2 data for the globe and the continental U.S. are presented in Figs. 1 and 2 for visualization. These data are produced by the OCO-2 and OCO-3 projects at the Jet Propulsion Laboratory (Frankenberg et al., 2014), quality controlled by NASA's Making Earth System data records for Use in Research Environments (MEaSUREs) SIF team, and are publicly available on the NASA Goddard Earth Sciences Data and Information Services Center (GES DISC) website (https://disc.gsfc.nasa.gov/, last access: 7 March 2022). Recent efforts by the OCO and MEaSUREs team have focused on harmonizing the processing pipeline, attributes, and file structures of the GOSAT and OCO SIF products (Parazoo et al., 2019). Here, we present a first analysis of these harmonized products and demonstrate for the user community their key commonalities and differences.
Table 1Level 2 GOSAT, OCO-2, and OCO-3 SIF Lite netCDF file global attributes, dimensions, and variables. Units for SIF and continuum-level radiance variables are in Watts per square meter, steradian, and micrometers (hereafter W m−2 sr−1 µm−1), geolocation variables are in decimal degrees, angles are in degrees, and the units for the meteorological variables are in the table below. For GOSAT, data are provided for both the P and S polarizations as a two-dimensional array. Note that there are different measurement mode and orbit ID descriptions for GOSAT, and some root-level variables are duplicated in the geolocation and science group.
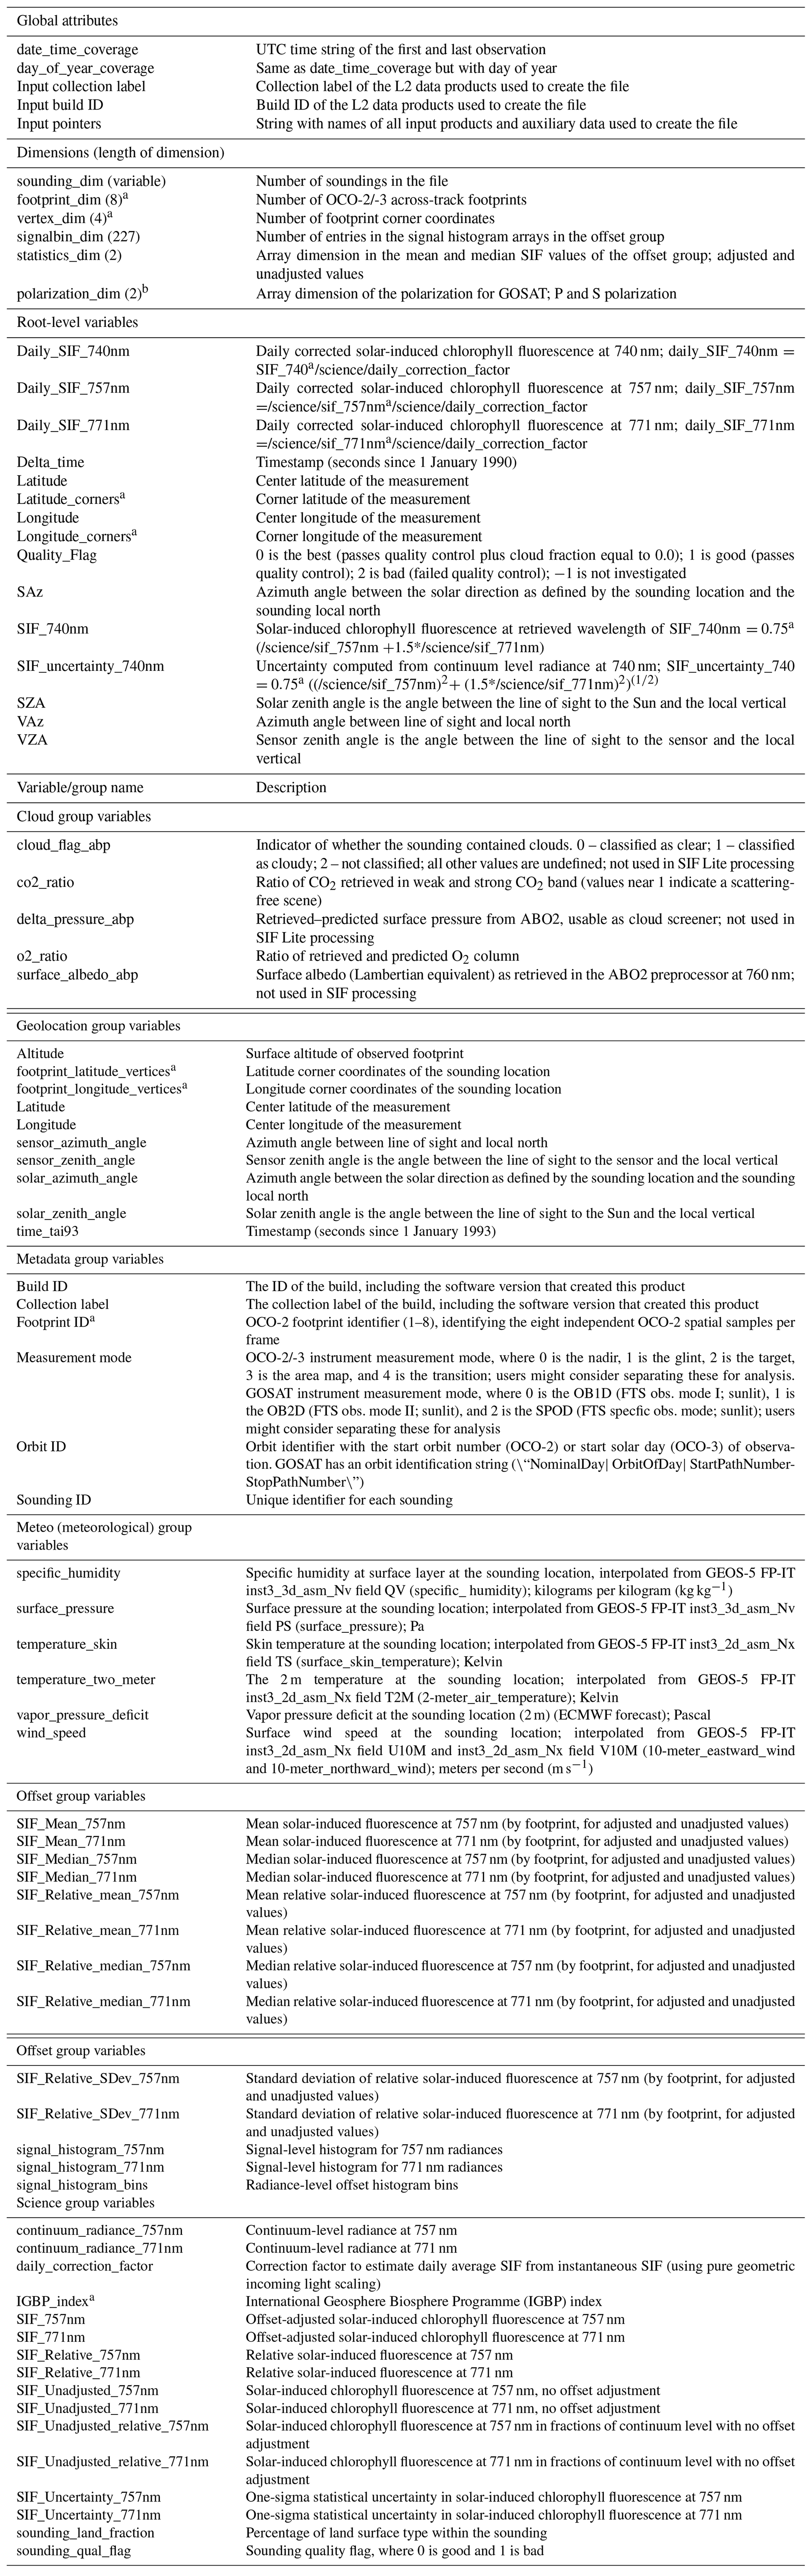
a Denotes the variable or dimension is only applicable to OCO-2 and OCO-3. b Denotes that the dimension is only applicable to GOSAT.
The ungridded Level 2 SIF Lite data are provided in netCDF-4 format and contain information for each sounding from which a SIF retrieval was made. For each of the three satellite platforms, there is one file for each day in which there is at least one sounding, and each file contains information for all soundings acquired on that day, including all measurement modes (glint, nadir, and target). The SIF Lite files can be read by, but are not limited to, MATLAB, Python, R, and Julia, using their respective netCDF4 or HDF5 libraries. The filename convention is, using the filename “oco2_LtSIF_200201_20210129t071949z.nc4” as an example, platform (oco2), data product (LtSIF), date (YYMMDD), and file creation date (YYYYMMDD) and time (tHHMMSS). The SIF Lite netCDF global attributes, dimensions, variables, and variable groups are described below and listed in Table 1.
3.1.1 Global attributes and dimensions
The global attributes provide file-level metadata information, the most important of which for data users are the citation, contact information, and the time range of the data in the file. The times listed in the global attributes can be used in instances where the file names may have been changed. A netCDF dimension is an integer that specifies the shape of the multi-dimensional variables, and these are also described in Table 1. For the OCO-2 and OCO-3 data, there are dimensions for the footprint vertices (vertex_dim) and across-track footprint (footprint_dim), which are not applicable for GOSAT. The polarization dimension (polarization_dim) is used for GOSAT's P and S (path radiance and surface reflected radiance, respectively) polarizations. The only variable dimension is the sounding_dim, which is the number of soundings in the file.
3.1.2 Variables
The primary variables of interest in the SIF Lite files are the SIF, Daily_SIF, and SIF_Uncertainty variables, which are available for SIF retrievals at 757 and 771 nm and estimated SIF at 740 nm. The variables for GOSAT differ from those of OCO-2 and OCO-3 in that GOSAT has two polarizations, P and S, and thus retrieval-related variables are provided as a two-dimensional (2D) array.
3.1.3 Variable groups
Most of the variables have been grouped, as listed in Table 1. The ungrouped, root-level variables are those that are most used, and some of these variables are duplicated in the geolocation and science groups. The cloud group contains cloud and surface albedo variables from the L2ABP product, which are used in the assignment of the quality flag. The geolocation group contains variables related to the geolocation of the sounding footprint, sun sensor geometry, altitude, and acquisition time. GOSAT sounding footprints are circular and have a radius of 5 km, in contrast to the OCO-2 and OCO-3 soundings, which are rhomboidal and are described with coordinates for each of their four vertices. Thus, the GOSAT SIF Lite files do not contain the footprint latitude and longitude vertices, whereas the OCO-2/-3 SIF Lite files do.
The metadata group houses variables with sounding-level metadata information, including the build version of the data, unique orbit and sounding identifiers, and measurement mode.
The meteo group contains meteorological forecast variables which were obtained from the GEOS-5 FP-IT 3 h forecast (Lucchesi, 2015) and are provided as-is without validation. The offset group is a collection of variables of the bias/offset adjustments and statistics. These include the mean, median, and standard deviations of the adjusted and unadjusted SIF values separated by cross-track footprint. These data are reported on a grid of signal level bins with a range of 3.0–229.0 W m−2 sr−1 µm−1 and follow the SIF bias correction scheme outlined by Frankengberg et al. (2011b).
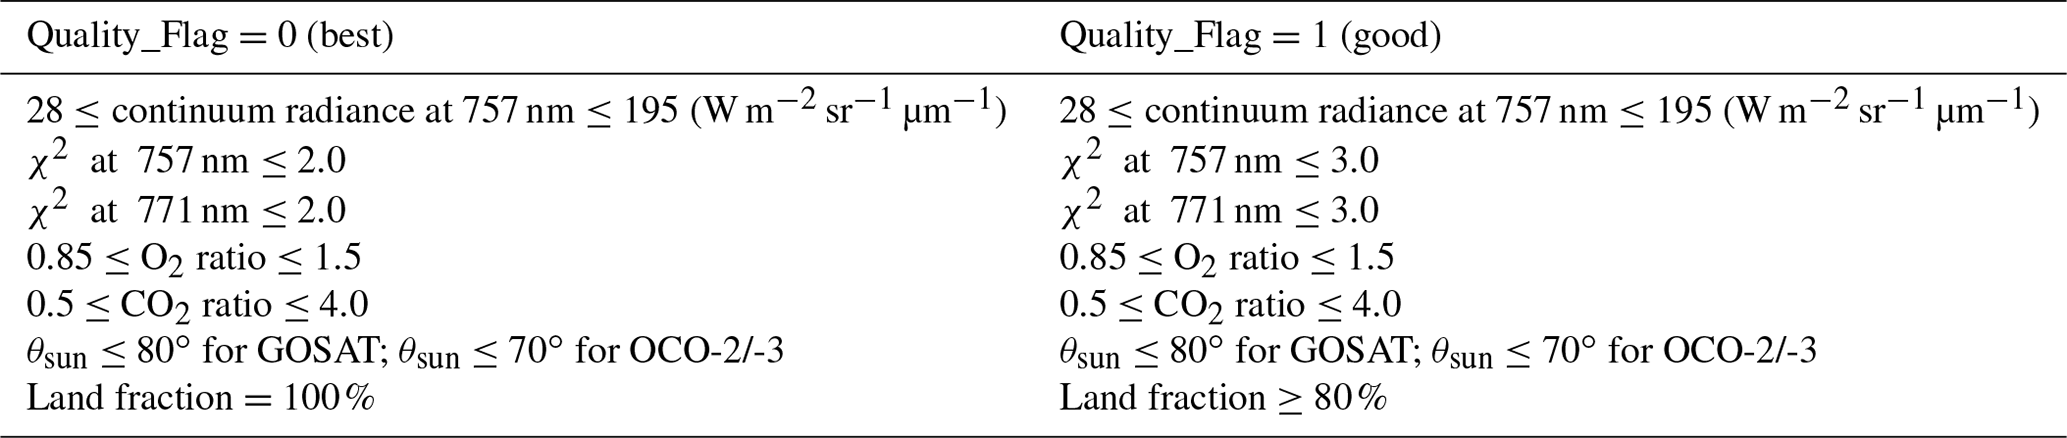
Table 2Criterion of quality flags, with best and good for the Level 2 GOSAT, OCO-2, and OCO-3 data. Soundings that do not meet either set of criteria are flagged as having failed (2).
3.2 Quality flag criteria and rationale
The Quality_Flag variable indicates the quality of the data for each sounding as being best (0), good (1), or failed (2). We recommend using a combination of best and good for scientific analysis. The criteria for the best and good quality flags are listed in Table 2, and soundings that do not meet either set of criteria are flagged as having failed. The rationale for the criterion is as follows: reduced chi-squared (χ2) thresholds exclude fits that do not represent the spectrum well, continuum-level radiance excludes scenes with brightness that is too high or low, solar zenith angle (θ) excludes retrievals with extreme solar zenith angles, which are more likely affected by rotational Raman scattering, and the O2 and CO2 thresholds exclude most cloudy scenes.
4.1 SIF retrieval
The SIF values provided in the SIF Lite files are based on spectral fits covering Fraunhofer lines, as SIF reduces the fractional depth of the Fraunhofer lines (Plascyk, 1975). The SIF retrieval methodologies are fully explained by Frankenberg et al. (2011b, a) and SIF is retrieved using the identical method for GOSAT and the OCO platforms at 757 and 771 nm. In brief, the main retrieval quantity in the retrieval state vector is the fractional contribution of SIF to the continuum level radiance or relative fluorescence (SIF_Relative_757nm and SIF_Relative_771nm). The absolute SIF values (SIF_757nm and SIF_771nm) are generated during post-processing in W m−2 sr−1 µm−1.
It is important to note that although the SIF values have traditionally been loosely labeled as being retrieved at 757 and 771 nm, the retrieval fit windows used to produce the SIF Lite data are centered at 758.7 and 770.1 for OCO-2 and OCO-3 and at 758 and 771 for GOSAT. However, we retain the 757 and 771 nomenclature to remain consistent with previous publications and to avoid confusion. We estimated SIF at 740 nm for each sounding using both retrieval windows as described in more detail below.
4.2 SIF retrieval uncertainty
The determination of single sounding retrieval uncertainty is covered in great detail by Sun et al. (2018) and Frankenberg et al. (2014) and is provided in the SIF Lite files as SIF_Uncertainty_740nm, SIF_Uncertainty_757nm, and SIF_Uncertainty_771nm. Briefly, these values are the 1 sigma (σ) estimated single sounding measurement precision and represent the random component of the retrieval errors. It is derived through standard least-square fitting by evaluating the error covariance matrix as follows:
where K is the Jacobian matrix of the least-squares fit, and S0 is the measurement error covariance matrix which characterizes the instrument noise per detector pixel.
For the OCO-2/-3 data, the uncertainty for SIF757 usually ranges between 0.3 and 0.5 W m−2 sr−1 µm−1 or ∼15 %–50 % of the absolute SIF value. Uncertainties for SIF771 are slightly higher due to less fluorescence and a relatively lower reduction in the fractional depth of the radiance at 771 nm. Uncertainty for SIF740 is calculated from using the general formula for error propagation and the partial derivatives for the uncertainties for SIF757 and SIF771 as follows:
4.3 SIF 740 nm and intersensor comparisons
The spectral window in which SIF retrievals are made depends on the wavelength bands of the platform. Assuming the spectral shape of SIF is known and invariant, one can convert SIF to a standard reference wavelength. Here, we use 740 nm as a reference as it corresponds to the second SIF peak and is not as strongly affected by chlorophyll re-absorption as red SIF, thus showing a relatively stable shape at wavelengths above 740 nm (Magney et al., 2019; Parazoo et al., 2019). The differences in the retrieval windows complicate the comparison of SIF retrievals from different sensors; thus, it is useful to provide SIF at a well-defined reference wavelength.
Although the range of the wavelengths used to retrieve SIF from the various sensors is small (740–771 nm), absolute fluorescence can vary greatly, depending on the spectral window used to retrieve SIF (Joiner et al., 2013; Köhler et al., 2018; Sun et al., 2018). However, reference far-red SIF emission spectra at the leaf level indicate that far-red fluorescence spectral shapes are consistent across species (Magney et al., 2019). Thus, we provide an estimate of absolute SIF740 (SIF_740nm) in the GOSAT and OCO-2/-3 SIF Lite files derived from the empirical relationship between SIF at 740 nm and SIF at 758.7 and 770.1 nm (denoted as 757 and 771 nm; Eq. 2). The rationale for including SIF740 in the SIF Lite files is to allow for more consistent and robust comparisons of SIF and SIF-based analyses across sensors (Parazoo et al., 2019) and to reduce the retrieval error by a factor of (Sun et al., 2018). We stress that the reported SIF740 values are not retrieved but are estimated under the assumption that the spectral shape of SIF is invariant.
The ratios used in Eq. (3) were based on leaf-level measurements conducted by Magney et al. (2019); however, we observed a median ratio of 1.45 from OCO-2 over vegetated areas for 2015–2019 (Fig. S1 in the Supplement). The reason for this difference has not yet been discerned and requires further analysis, but the small potential bias introduced by the use of the empirical ratio does not infringe on the utility of the SIF740 data.
4.4 Bias/offset correction
Biases in retrieved SIF can occur due to uncertainties in the exact instrument line shape per footprint or slight uncertainties in detector linearity. To correct for biases, we use reference targets that are non-fluorescent surfaces barren of vegetation, similar to the method described by Frankenberg et al. (2011b). In short, the background signal over reference targets is subtracted from all relative SIF values. We calculate the background signal for each day as the mean SIF over all barren surfaces within a 31 d window centered on the current day for GOSAT and a 3 d window for OCO-2/-3. These windows were chosen to obtain a robust background signal, given their respective spatiotemporal resolution. Here, we identify barren surfaces using a combination of the MODIS MCD12Q1 land cover data product (Friedl and Sulla-Menashe, 2019) and the Vegetation Photosynthesis Model (VPM; Xiao et al., 2004; Zhang et al., 2017) from the year 2018. The native spatial resolution of these datasets is 500 m, but we aggregated the data to a global 0.20∘ grid so that the barren surface reference targets had a coarser resolution than the soundings. We classified barren surfaces as those grid cells which were 100 % barren and/or snow and ice by MCD12Q1 and had zero (0) annual gross primary production, as estimated by the VPM. We also excluded coastal grid cells that overlapped with water using a global coastline shapefile and a buffer.
4.5 Daily average SIF and the daily correction factor
We provide an estimate of daily average SIF (Daily_SIF), which is instantaneous SIF scaled entirely upon the geometry of incoming solar radiation over a day. Instantaneous SIF is the absolute value of SIF for any given sounding and is a strong function of the illumination of the canopy at that instant in time. The differences in the illumination geometry of soundings at different overpass times and latitudes complicate direct comparisons of SIF at different points of Earth's surface and comparisons of SIF to other data that are more temporally coarse, such as daily estimates of gross primary production (GPP).
Downwelling solar radiation scales linearly with cos (θ) under clear-sky conditions when ignoring Rayleigh scattering and gas absorption. As described by Frankenberg et al. (2011b) and Köhler et al. (2018), a first-order approximation of daily average SIF (SIFDaily) can be written as follows:
where SIFt0 is absolute instantaneous SIF, θ(t0) is the solar zenith angle θ at the time of measurement t0 with a heaviside function H to zero out negative values of cos (θ), and the integral is computed numerically in 10 min time steps (dt). In terms of the SIF Lite file variable names, this equation can be written for SIF at any wavelength as .
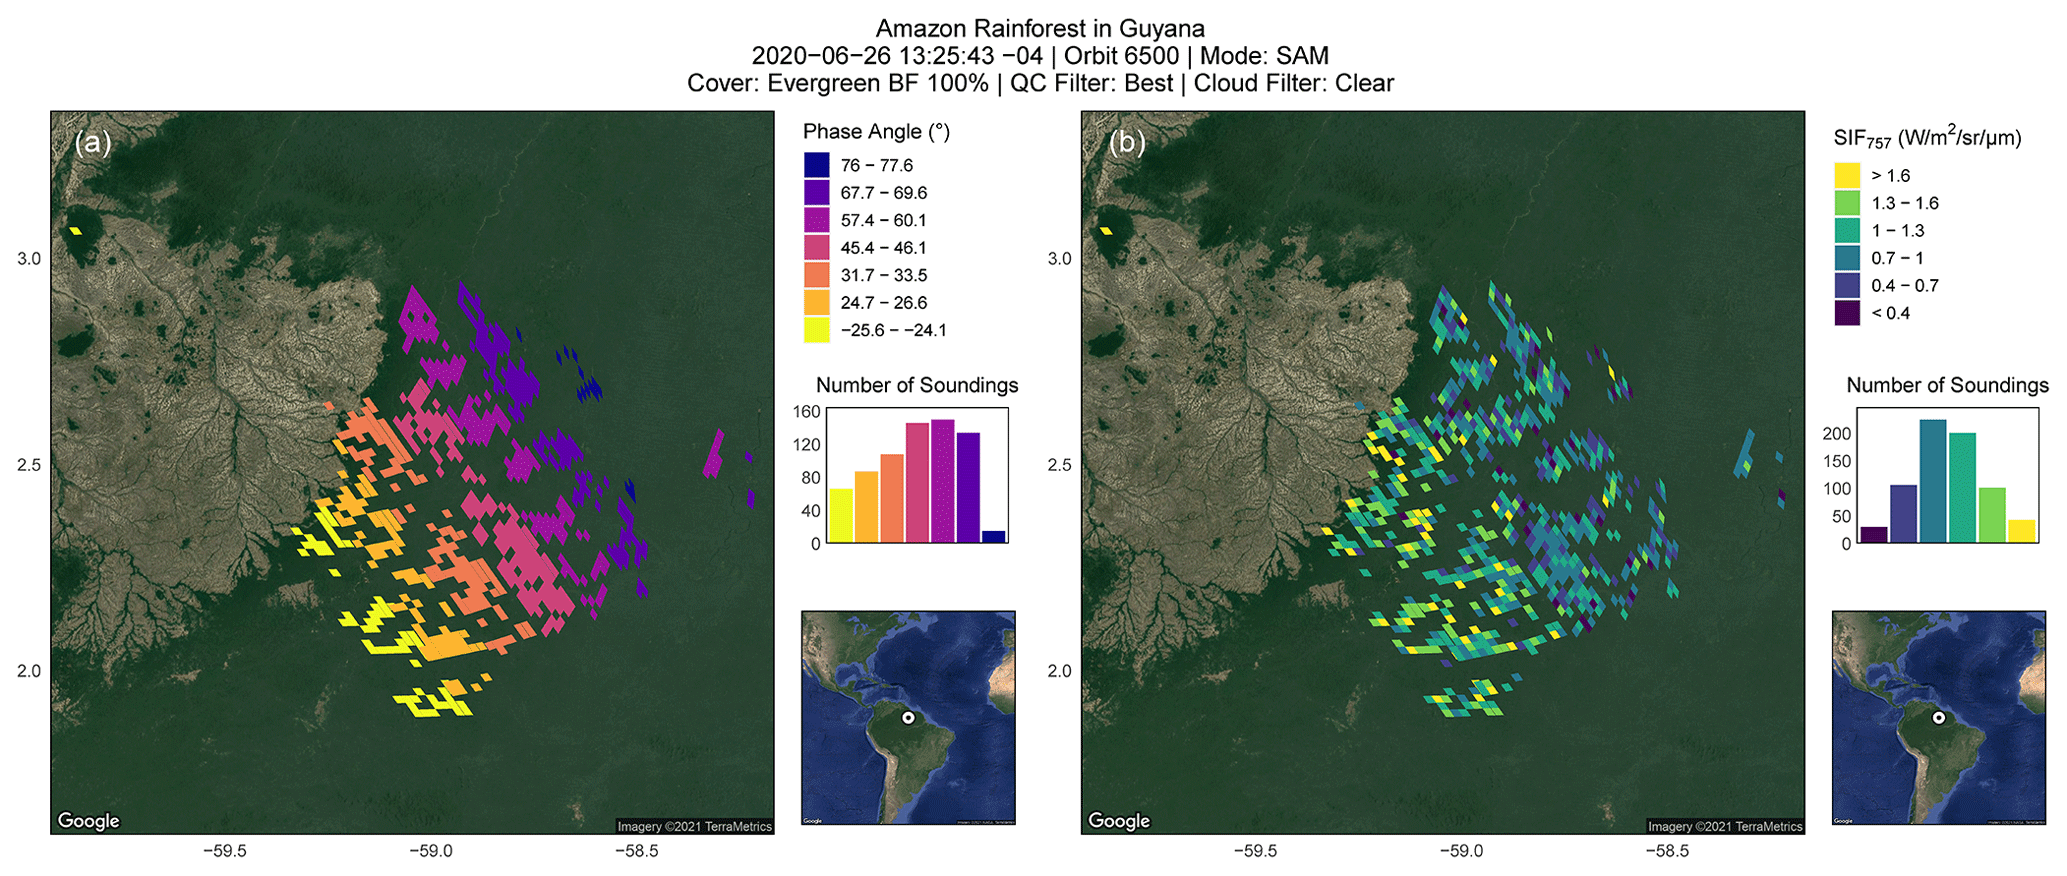
Figure 3Phase angle and SIF757 for an OCO-3 SAM-mode scan over the Amazon rainforest in Guyana. OCO-3 SAMs are composed of several scans of a target, whereby the eight-sounding-wide segment is offset adjacent to the previous scan. Each segment has a distinctive, small range of phase angles, as seen in panel (a). SIF has higher values at lower phase angles, which is apparent in panel (b), where the higher SIF values occur for the soundings in the southwestern portion of the SAM where phase angles are lowest.
5.1 Scaling of SIF to GPP
We should note that SIF is, to first order, only a proxy for the electron transfer rate in the light reaction of photosystem II. However, SIF is oblivious to the light-independent reactions that fix CO2. Nevertheless, many studies have reported on the linearity of SIF and GPP at bi-weekly or monthly timescales and at coarse spatial resolutions (Verma et al., 2017; Doughty et al., 2019; Yang et al., 2015). The seasonality of SIF and GPP tend to match well at such coarse temporal resolutions because both SIF and GPP are driven by changes in canopy structure, the amount chlorophyll in the canopy, and the amount of sunlight (photosynthetically active radiation; PAR) being absorbed by canopy chlorophyll (APARchl; Magney et al., 2020; Doughty et al., 2021; Dechant et al., 2019). The SIF–GPP relationship can also become more linear at the canopy scale due to the contribution of total canopy SIF by sunlit, shaded, stressed, and non-stressed leaves (Magney et al., 2019). SIF and GPP have an indirect relationship through non-photochemical quenching and the electron transport rate (Porcar-Castell et al., 2014; Gu et al., 2019), which can sometimes simultaneously downregulate photosynthesis and SIF, as has been seen in evergreen needleleaf ecosystems, but not always (Magney et al., 2019).
At the leaf level, GPP saturates before SIF in response to APAR, such that we could see increased SIF without any response in GPP at high levels of APAR (Gu et al., 2019). Conversely, vegetation stress can cause a near- or total cessation of GPP via stomatal closure with little or no change in SIF. This decoupling has been seen at the leaf scale during the forced stomatal closure of deciduous tree species (Marrs et al., 2020) and a 1-month drought experiment with eastern cottonwood (Populus deltoides) (Helm et al., 2020). However, these studies, and others of deciduous vegetation and croplands, have repeatedly found a better correlation between SIF and APAR than SIF and GPP (Yang et al., 2018; Miao et al., 2018). For SIF to be a reliable proxy of APAR, SIFyield (ratio of SIF to APAR) would need to remain constant. For a detailed inquiry into SIF and photosynthesis, see Porcar-Castell et al. (2014), and a review of SIF remote sensing applications and challenges from the leaf, tower, and satellite scale by Magney et al. (2020) and Mohammed et al. (2019).
5.2 Negative SIF values
Data users are likely to find negative SIF values, which are due to retrieval noise, but these values should generally not be discarded. The 1σ uncertainty in retrieved SIF values (SIF_Uncertainty) can be substantial, but negative values are plausible in a retrieval sense although not in physical terms (the actual SIF emission cannot be negative). Discarding negative values will introduce a high bias when averaging. Nevertheless, extremely negative values may indicate a problem with the retrieval. We recommend the following guidelines for filtering negative SIF values: accept if SIF uncertainty ≥0; questionable if SIF uncertainty <0 and SIF uncertainty ≥0; and reject if SIF uncertainty <0. These thresholds have not been incorporated into the Quality_Flag variable of the SIF Lite data.
5.3 Sun sensor geometry
Users of SIF data from any source should be aware that sun sensor geometry plays a role in the absolute values of SIF, in addition to vegetation canopy characteristics (Joiner et al., 2020; Köhler et al., 2018). Absolute SIF values increase rapidly when the phase angle approaches 0∘ (when the Sun and sensor are aligned), but the effect of sun sensor geometry has been shown to be small when the phase angle is greater than 20∘ (Köhler et al., 2018; Doughty et al., 2019). Thus, retrieved SIF values from target- or SAM-mode scans during a single overpass can vary greatly, despite homogeneous vegetation cover, due to changing sun sensor geometries during data acquisition. Figure 3 illustrates the phase angle and SIF757 for a SAM acquired over the Amazon rainforest, where the vegetation canopy is very homogenous. The figure also illustrates how the phase angle changes during an OCO-3 SAM scan, and that the sun sensor geometries for each individual swath are rather distinct from each other (Fig. 3a). Mean SIF for each swath is also distinctively different (Fig. 3b), despite the fact that the canopy was experiencing the same illumination geometry and environmental conditions during the 2 min in which this SAM was acquired. The effect of sun sensor geometry is also illustrated in Fig. 4, which shows the relationship between SIF for individual OCO-2 soundings and phase angle for two target scans in the Amazon. A distinctive change in the absolute values of retrieved SIF were observed due to sun sensor geometry.
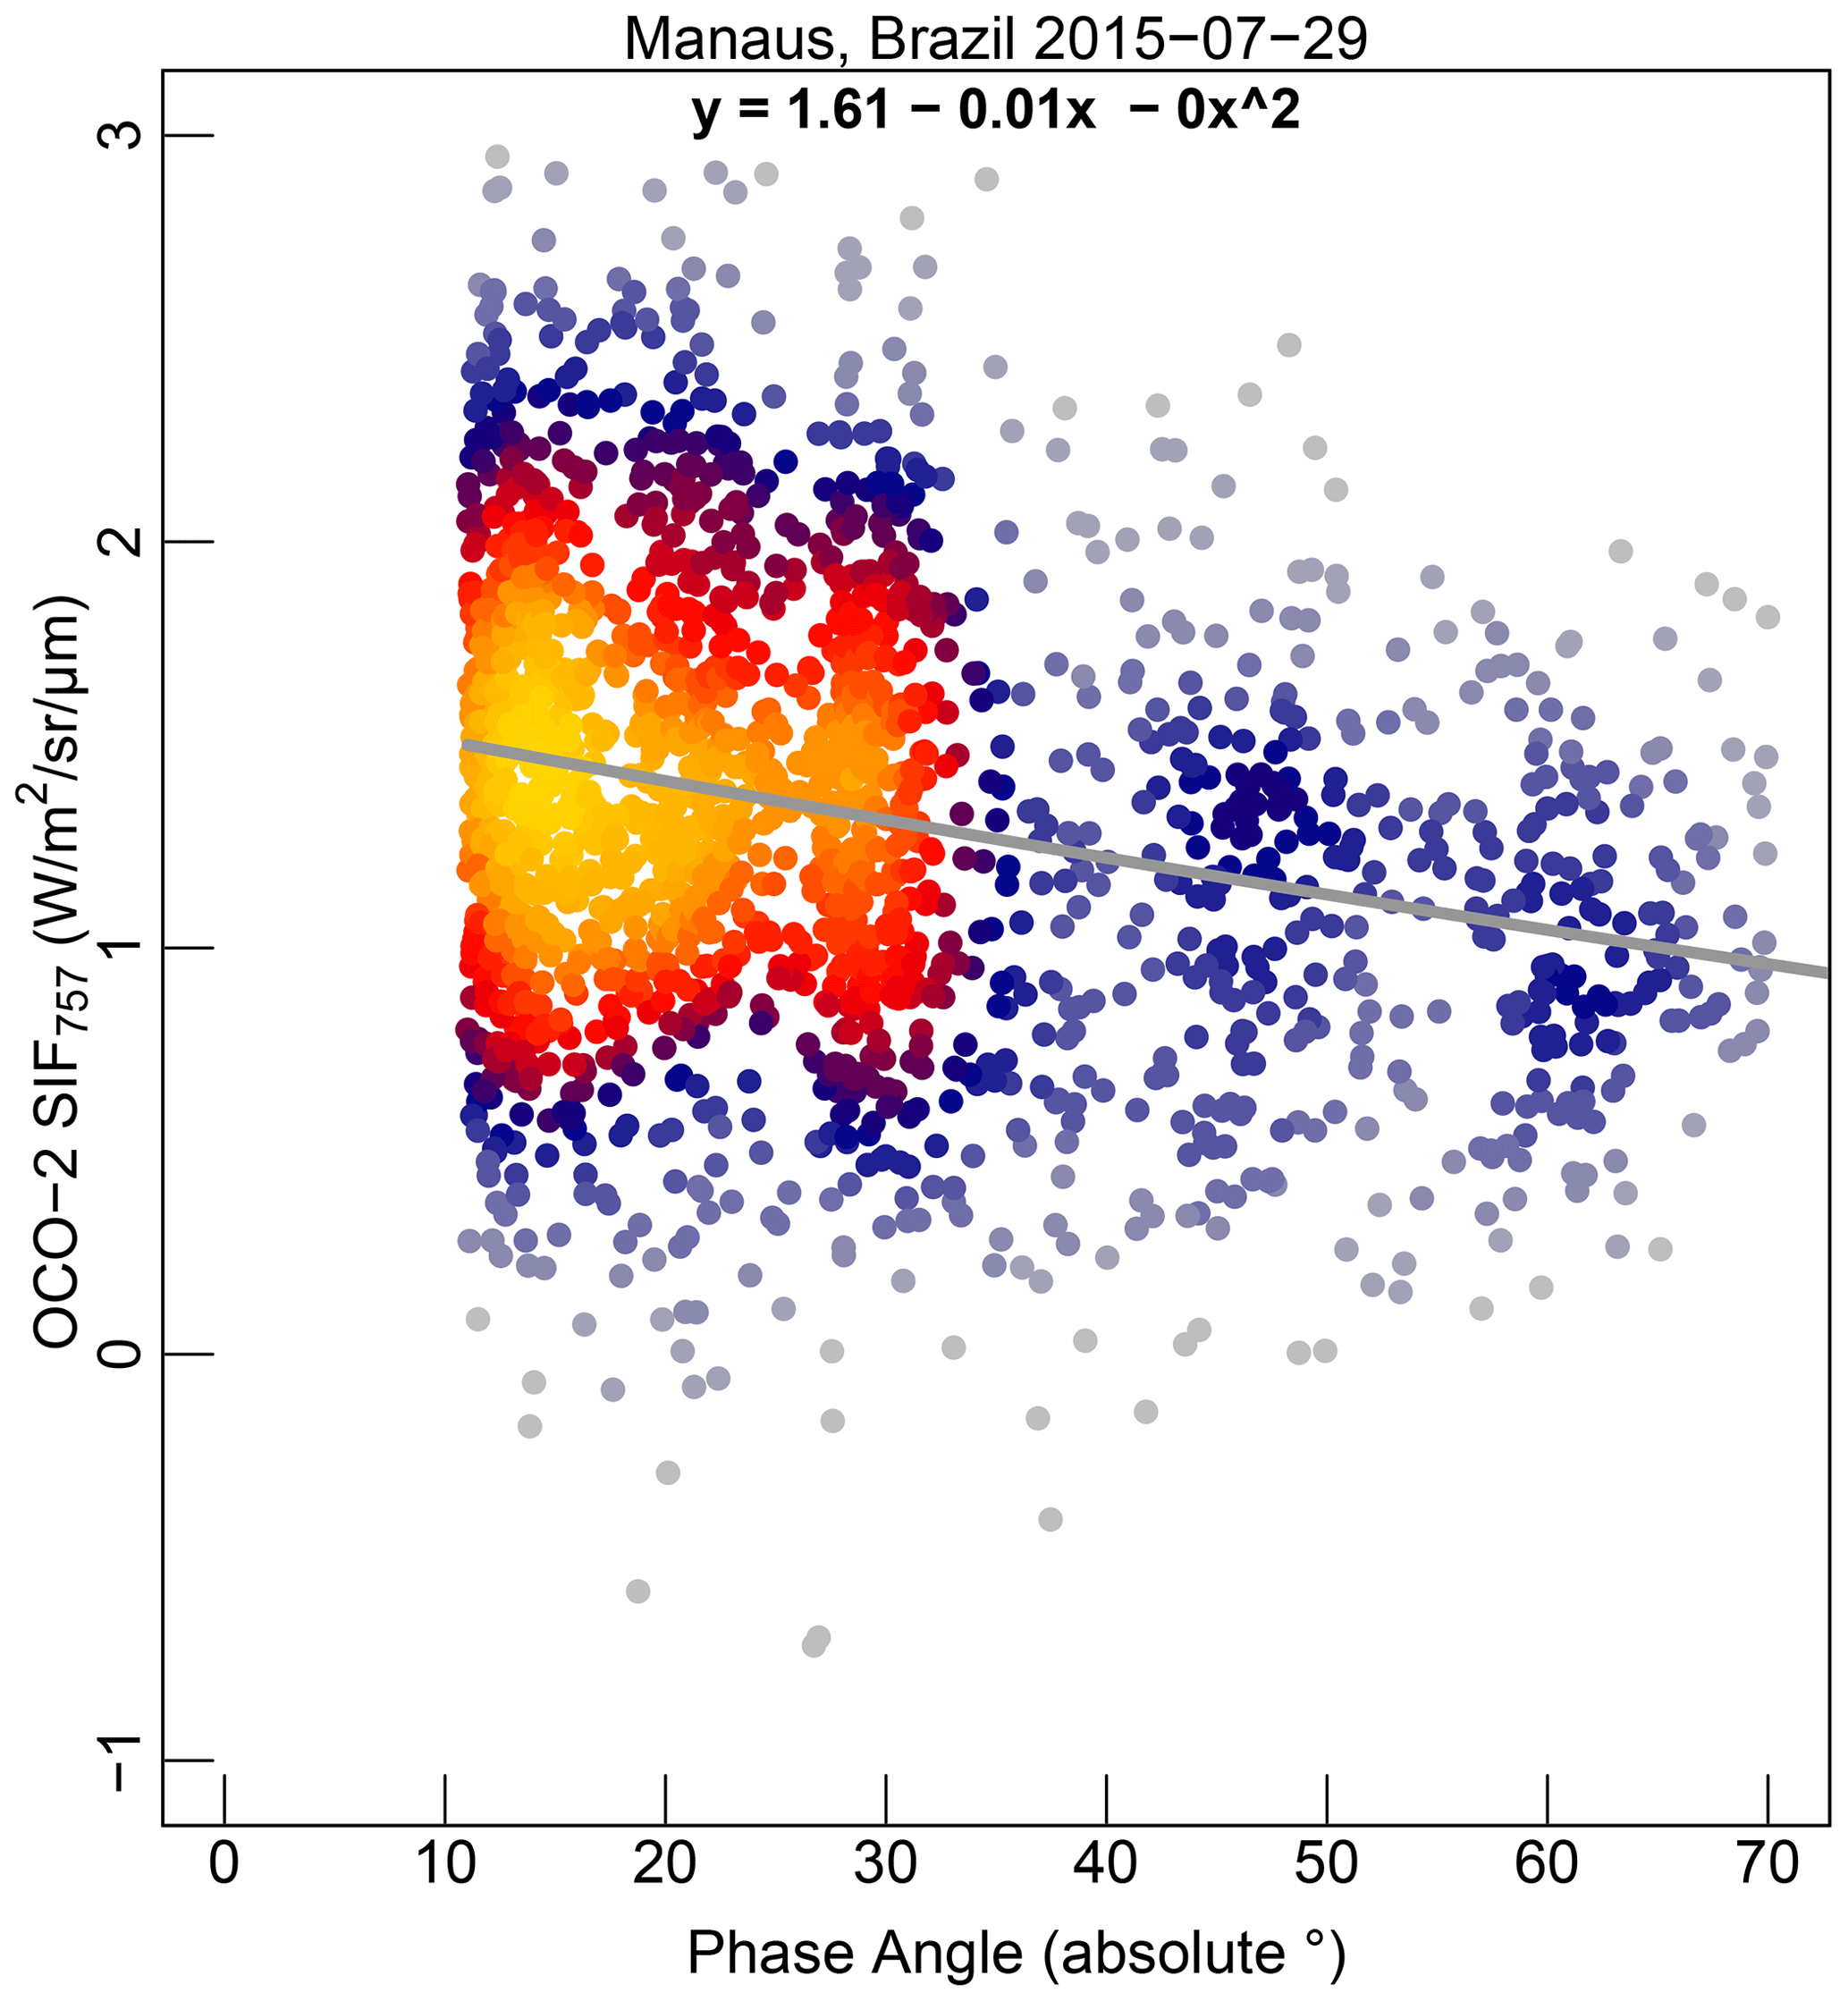
Figure 4Absolute phase angle and SIF757 for an OCO-2 target-mode scan over evergreen broadleaf forest in Manaus, Brazil. As this figure demonstrates, retrieved SIF values increase as the phase angle approaches 0∘.
5.4 Averaging over space and time to reduce retrieval uncertainty
There are the following two main challenges to working with all spaceborne SIF data: (1) the inherently large uncertainties for individual soundings due to retrieval noise, and (2) the effect of differences in sun sensor geometry on retrieved SIF values. Thus, we advise against using single soundings for analysis. However, averaging soundings across space and time can reduce the retrieval noise by a factor of , with n being the number of soundings comprising the average (Frankenberg et al., 2014). For platforms with a wide swath, like the TROPOspheric Monitoring Instrument (TROPOMI), the effect of sun sensor geometry can be accounted for by averaging soundings for a point of interest over the entire repeat cycle (16 d for TROPOMI), as demonstrated by Doughty et al. (2019, 2021). In the case of OCO-2/-3, as we demonstrate in Fig. 3 and in Braghiere et al. (2021), soundings can be grouped by phase angle and then averaged to reduce retrieval uncertainty. Thus, retrieval uncertainty and sun sensor geometry effects can be substantially minimized. For GOSAT, we recommend averaging SIF retrieved from both the P and S polarizations, as demonstrated in Fig. 5.
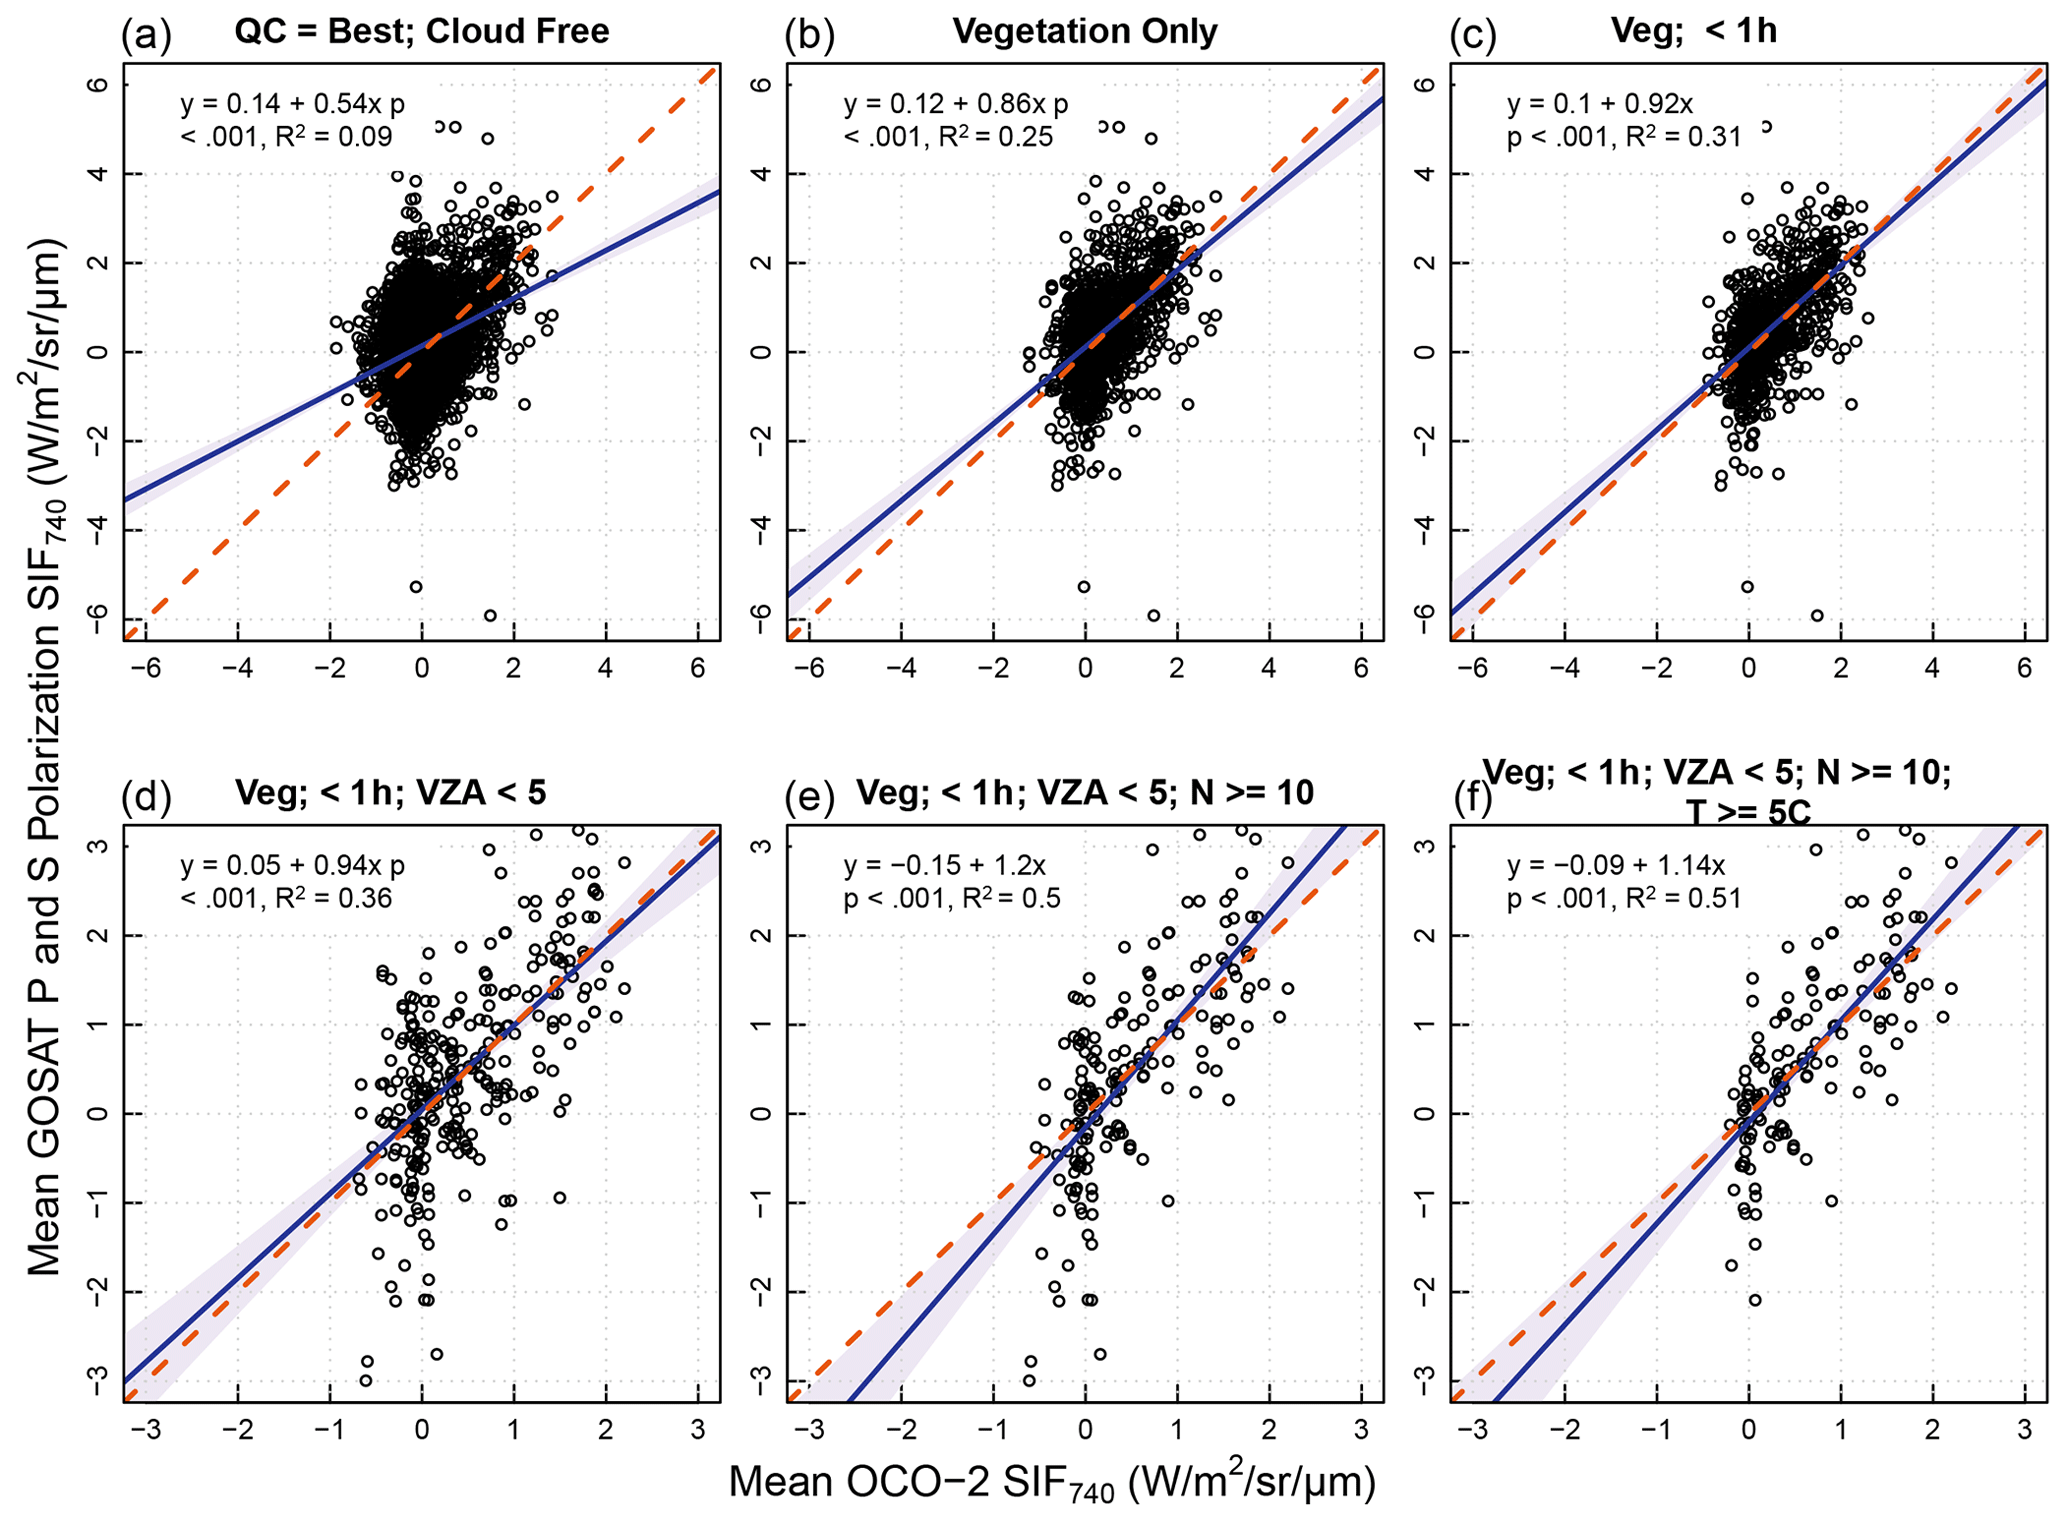
Figure 5Relationships of SIF740 from OCO-2 and GOSAT using progressively conservative data filters and Deming regression. The x-axis values are the mean of all OCO-2 soundings (∼1.3 km × by 2.25 km) that fall within the corresponding GOSAT sounding footprint (∼10 km in diameter). The y-axis values represent the mean of SIF retrieved from P and S polarizations for a single GOSAT sounding. A total of 6 years of data (2015–2020) were used to identify soundings that overlapped on the same day. (a) Soundings flagged as best quality and cloud free. (b) Same as panel (a) but filtered as being over vegetation using the International Geosphere Biosphere Programme (IGBP) flag in the OCO-2 SIF Lite file. (c) Same as panel (b) but filtered for data that were acquired from GOSAT and OCO-2 within 1 h of each other. (d) Same as panel (c) but with viewing zenith angles (VZAs) for both platforms. (e) Same as panel (d) but with the number (N) of OCO-2 soundings within a GOSAT sounding being ≥10. (f) Same as panel (e) but with skin temperature ≥5 ∘C.
Users should also keep in mind that, when conducting analyses at large spatial scales, gridding the data prior to analysis is largely unnecessary as the ungridded Level 2 data can be used directly (Doughty et al., 2019). Doing so will allow the users to retain sounding-level information that may aid in the interpretation of the results, which would otherwise be lost when merely gridding the SIF values. For instance, as demonstrated by Doughty et al. (2019), ungridded Level 2 SIF data were used to calculate mean SIF for the entire Amazon basin at different phase angles to show that the seasonality of SIF in the Amazon basin was consistent across sun sensor geometries. Such an analysis would not have been possible with gridded data because, after gridding, it is impossible to group the data by sounding-level attributes, such as phase angle or cloud fraction.
5.5 The use of SIF at 740, 757, and 771 nm
It is important to note that in areas where the SIF signal is near zero, the use of SIF at 757 nm would be more appropriate, as the SIF signal is stronger at this wavelength. In areas where vegetation is sparse or SIFyield is low due to vegetation responses to environmental conditions or canopy leaf physiology, SIF at 771 nm could be within the noise range due to its relatively far distance from the far-red peak at 740 nm. In these cases, we advise the use of SIF at 757 nm. Since SIF at 771 nm is used to compute SIF at 740 nm in the SIF Lite files, diligence should likewise be used when using SIF at 740 nm in analyses.
5.6 Comparison of GOSAT, OCO-2, and OCO-3
OCO-3 SIF has been shown to have a very high correlation (r>0.9) with OCO-2 (Taylor et al., 2020). Here, we present the first comparisons between GOSAT and OCO-2 Level 2 data. Currently, there are not enough coincident soundings for GOSAT and OCO-3 to provide a robust analysis, but given that OCO-2 and OCO-3 compare very well, we expect a comparison between GOSAT and OCO-3 to mimic the findings from our GOSAT and OCO-2 comparison.
Although the data records for GOSAT and OCO-2 overlap 6 years, only a small percentage of soundings flagged as best quality and cloud free from GOSAT and OCO-2 overlap on the same day (Fig. 5a). Despite this filter, the mean SIF values may differ widely on the same day due to differences in overpass time (and thus solar illumination angle and environmental conditions), viewing geometry, and the number of OCO-2 soundings comprising the mean. We progressively filtered the data, as illustrated in Fig. 5, to ensure the soundings were of a vegetated land surface and had similar sun sensor geometries, environmental and atmospheric conditions, and that the temperature was high enough for photosynthesis to occur, as indicated by the temperature_skin variable in the SIF Lite data.
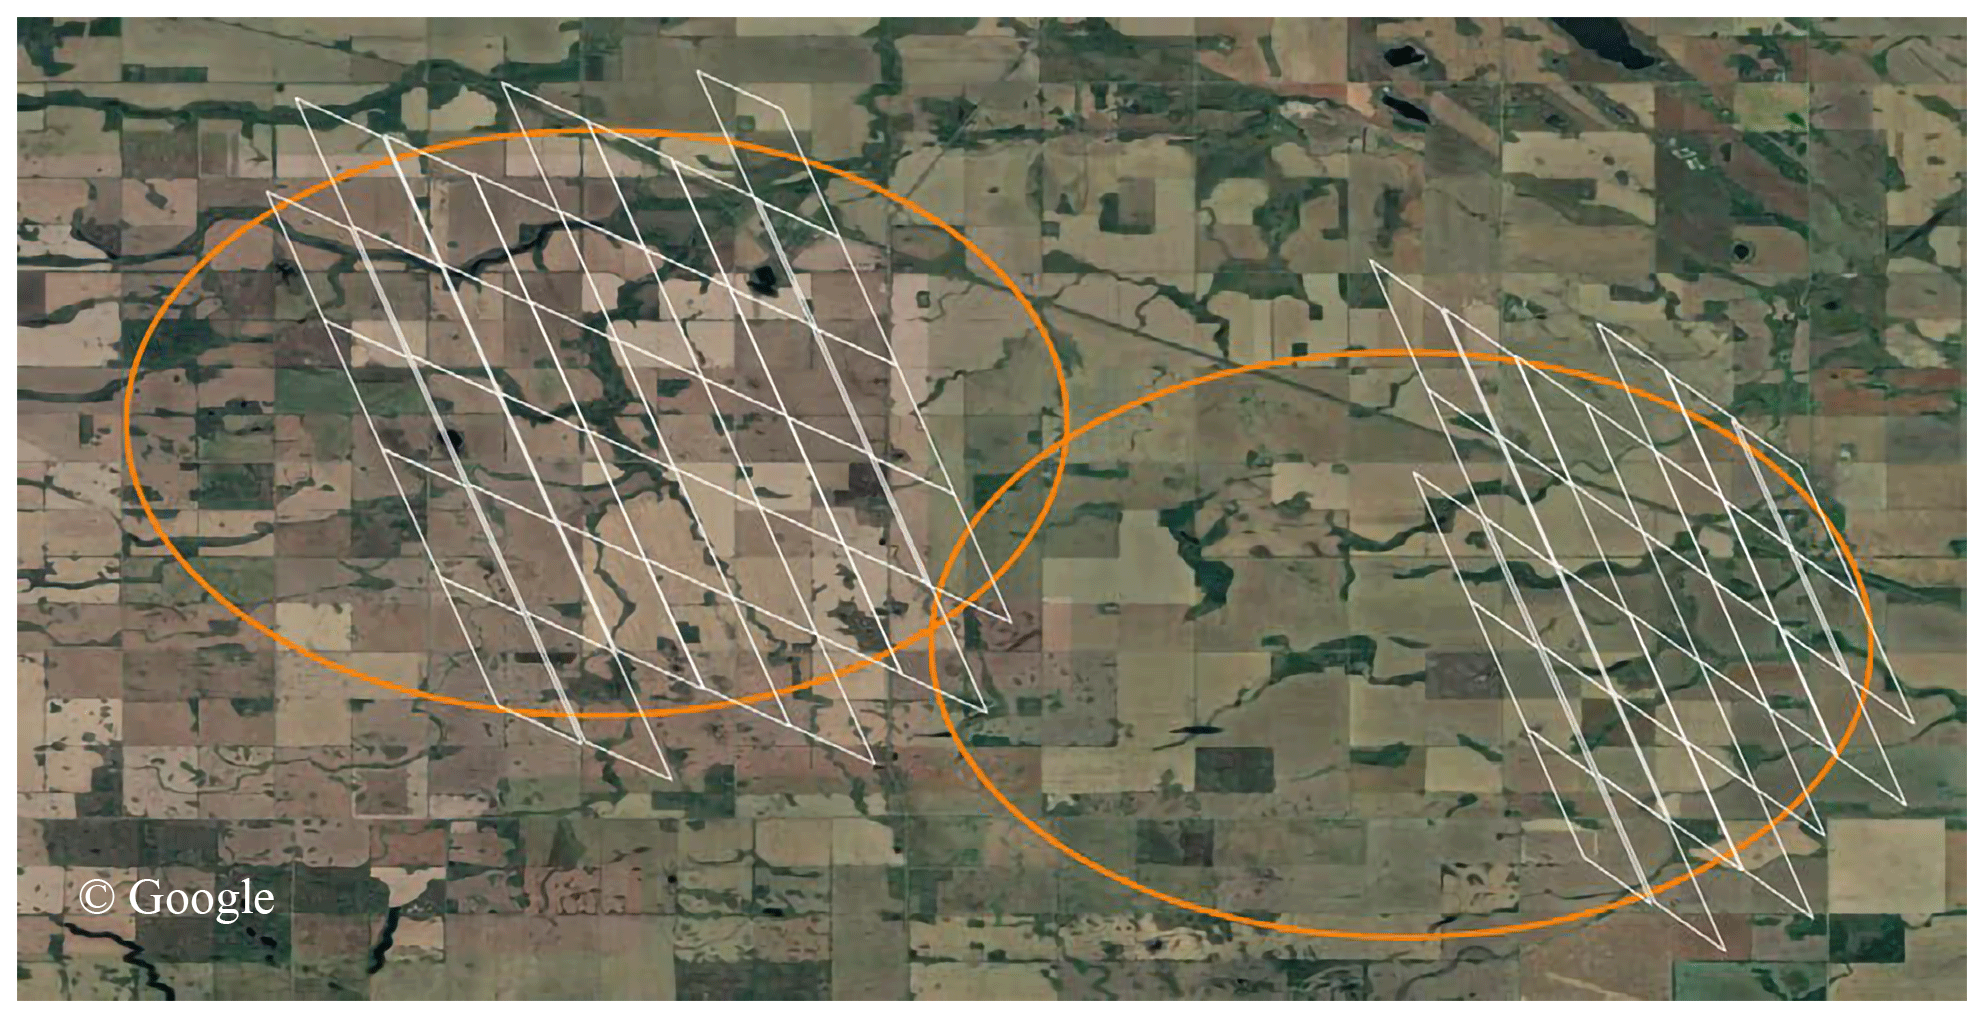
Figure 6Overlapping GOSAT and OCO-2 soundings near Quill Lakes, Saskatchewan, Canada. Orange circles are GOSAT sounding footprints (∼10 km), and the white rhomboids are OCO-2 sounding footprints (∼1.3 km × by 2.25 km) acquired on the same day as the GOSAT soundings in which they fall. The GOSAT and OCO-2 soundings on the left were acquired in February 2019, and the soundings on the right were acquired in July 2017. The base map is a © Google satellite image.
We found that the correlation and slope improved with a more conservative filtering of the data, and that the comparison between GOSAT SIF and OCO-2 SIF was reasonable. However, it is important to note that any comparison between GOSAT and OCO data will inevitably be affected by spatial sampling bias, as the swath width for both OCO platforms is smaller than the diameter of the GOSAT sounding footprints (Fig. 6; left footprints). Also, it could be the case that only a small portion of the GOSAT footprint is sampled by OCO (Fig. 6; right footprints). Our filter of ≥10 OCO-2 soundings within a GOSAT footprint aimed to reduce this potential sampling bias in addition to reducing the uncertainty of the OCO-2 SIF retrievals. It must also be remembered that, in this comparison, we do not have the luxury to average several GOSAT soundings to reduce the uncertainty as we did with OCO-2, so the uncertainties of the GOSAT SIF is much higher than that for OCO-2.
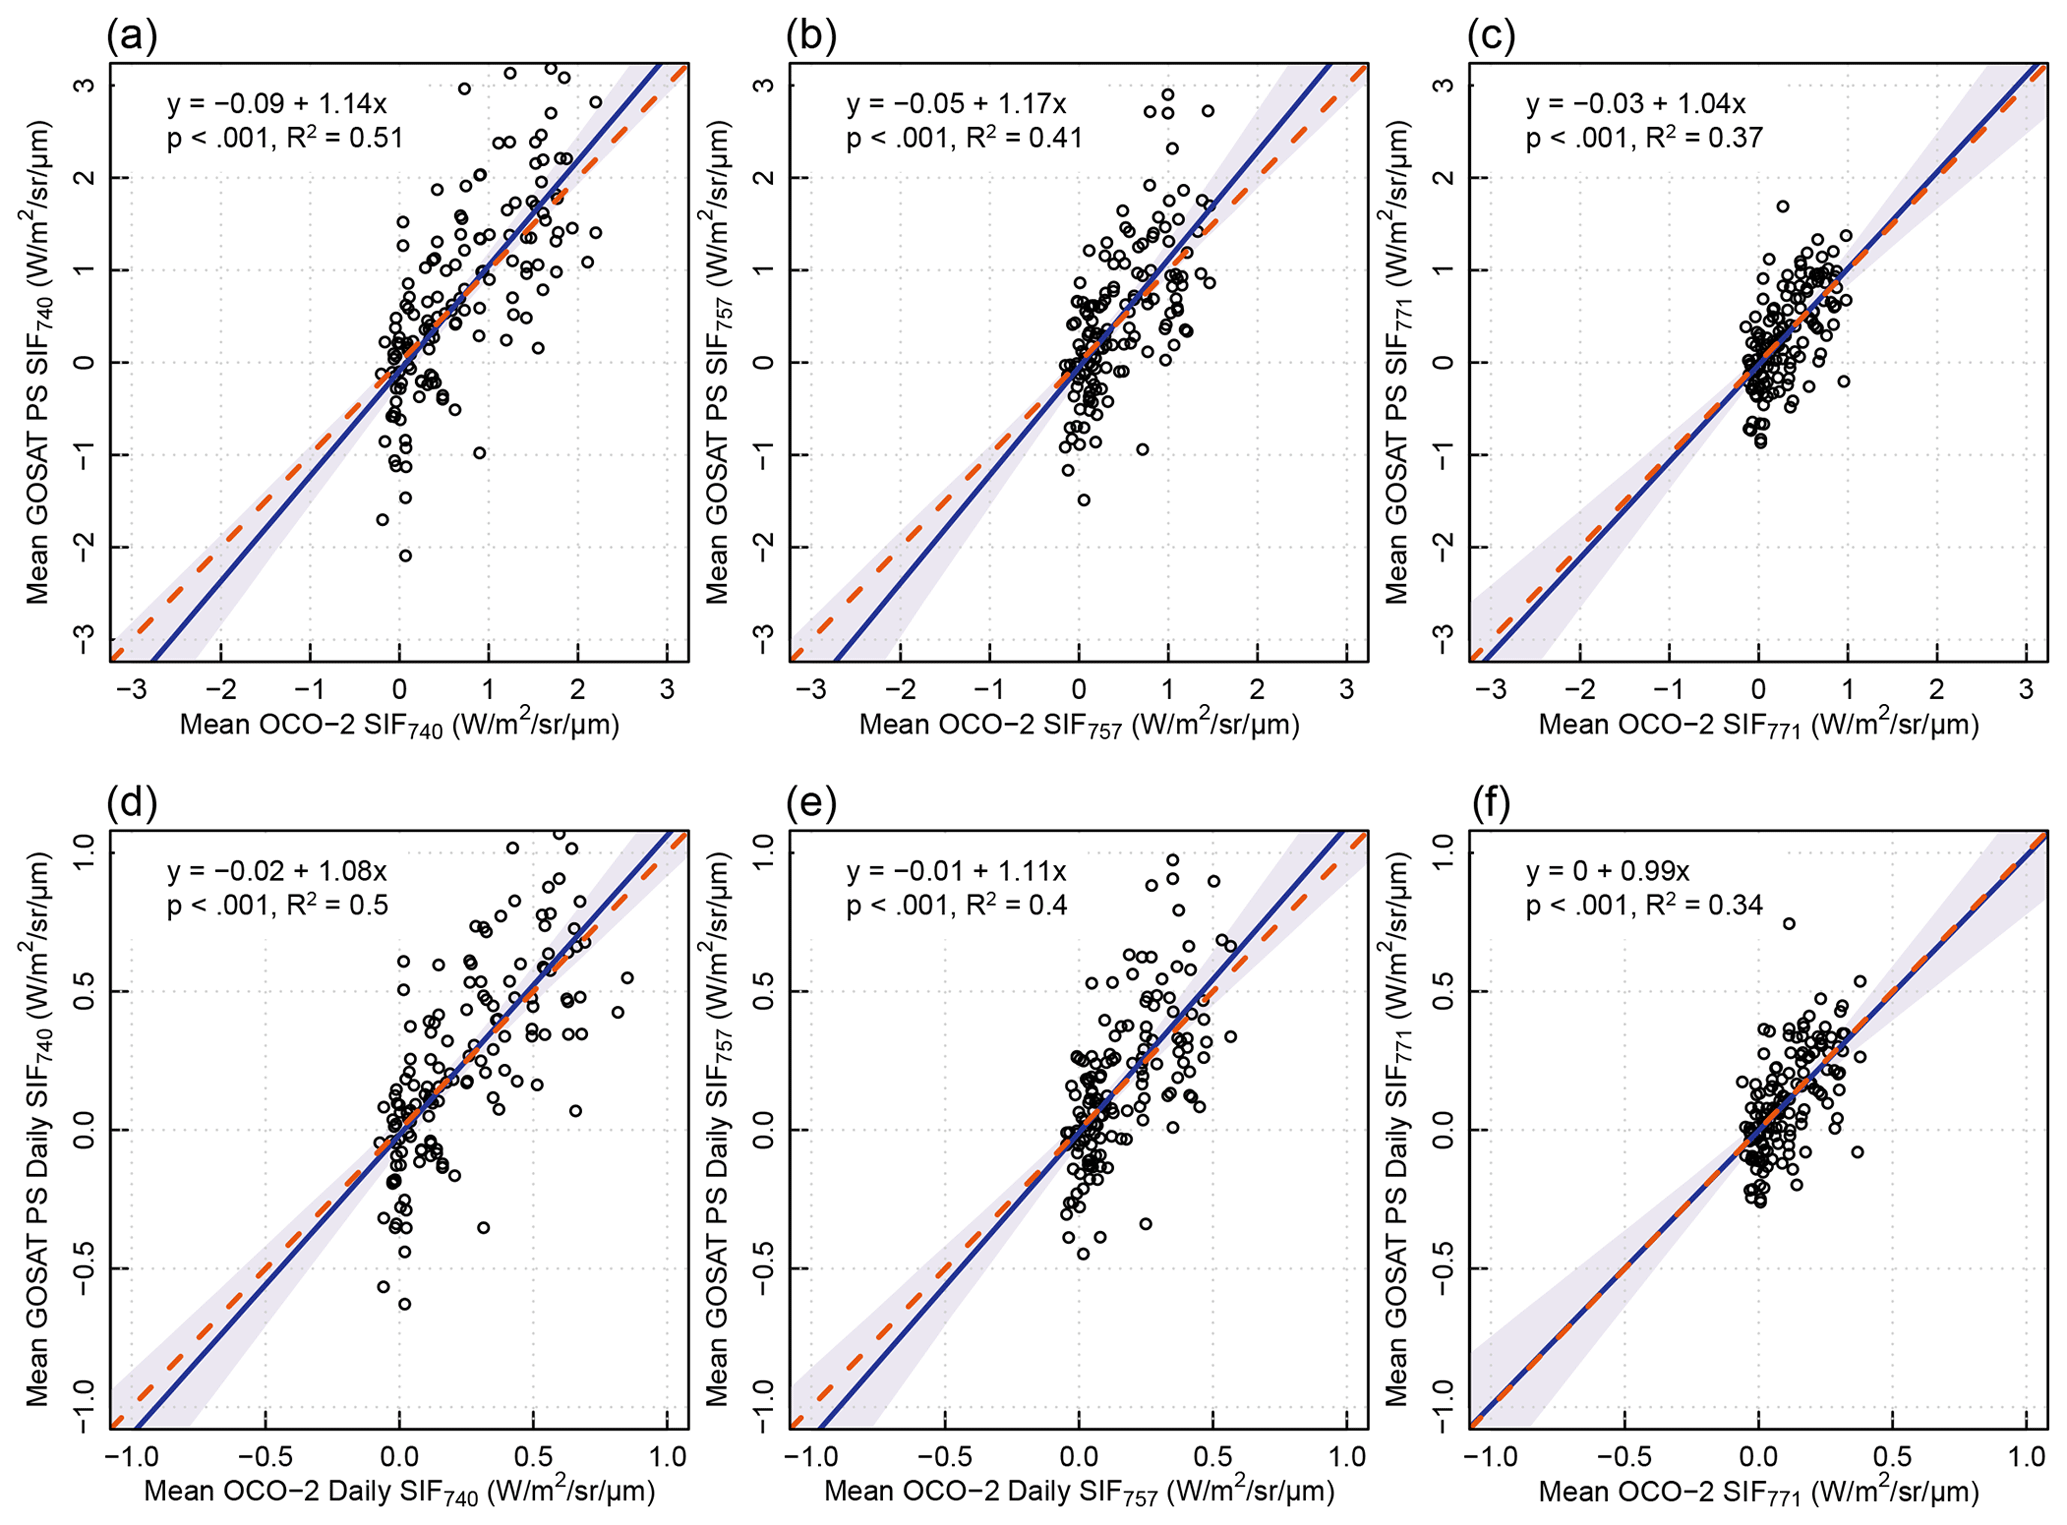
Figure 7Relationships between instantaneous (a, b, c) and daily (d, e, f) SIF740, SIF757, and SIF771 from GOSAT and OCO-2 using the Deming regression. The soundings presented here were those presented in main text and in Fig. 5f, which were data that had the most conservative filter, i.e., best quality and cloud-free vegetation, co-occurring within 1 h, at a viewing zenith angle of , with the number of OCO-2 soundings within a GOSAT footprint at ≥10, and a skin temperature of ≥5 ∘C.
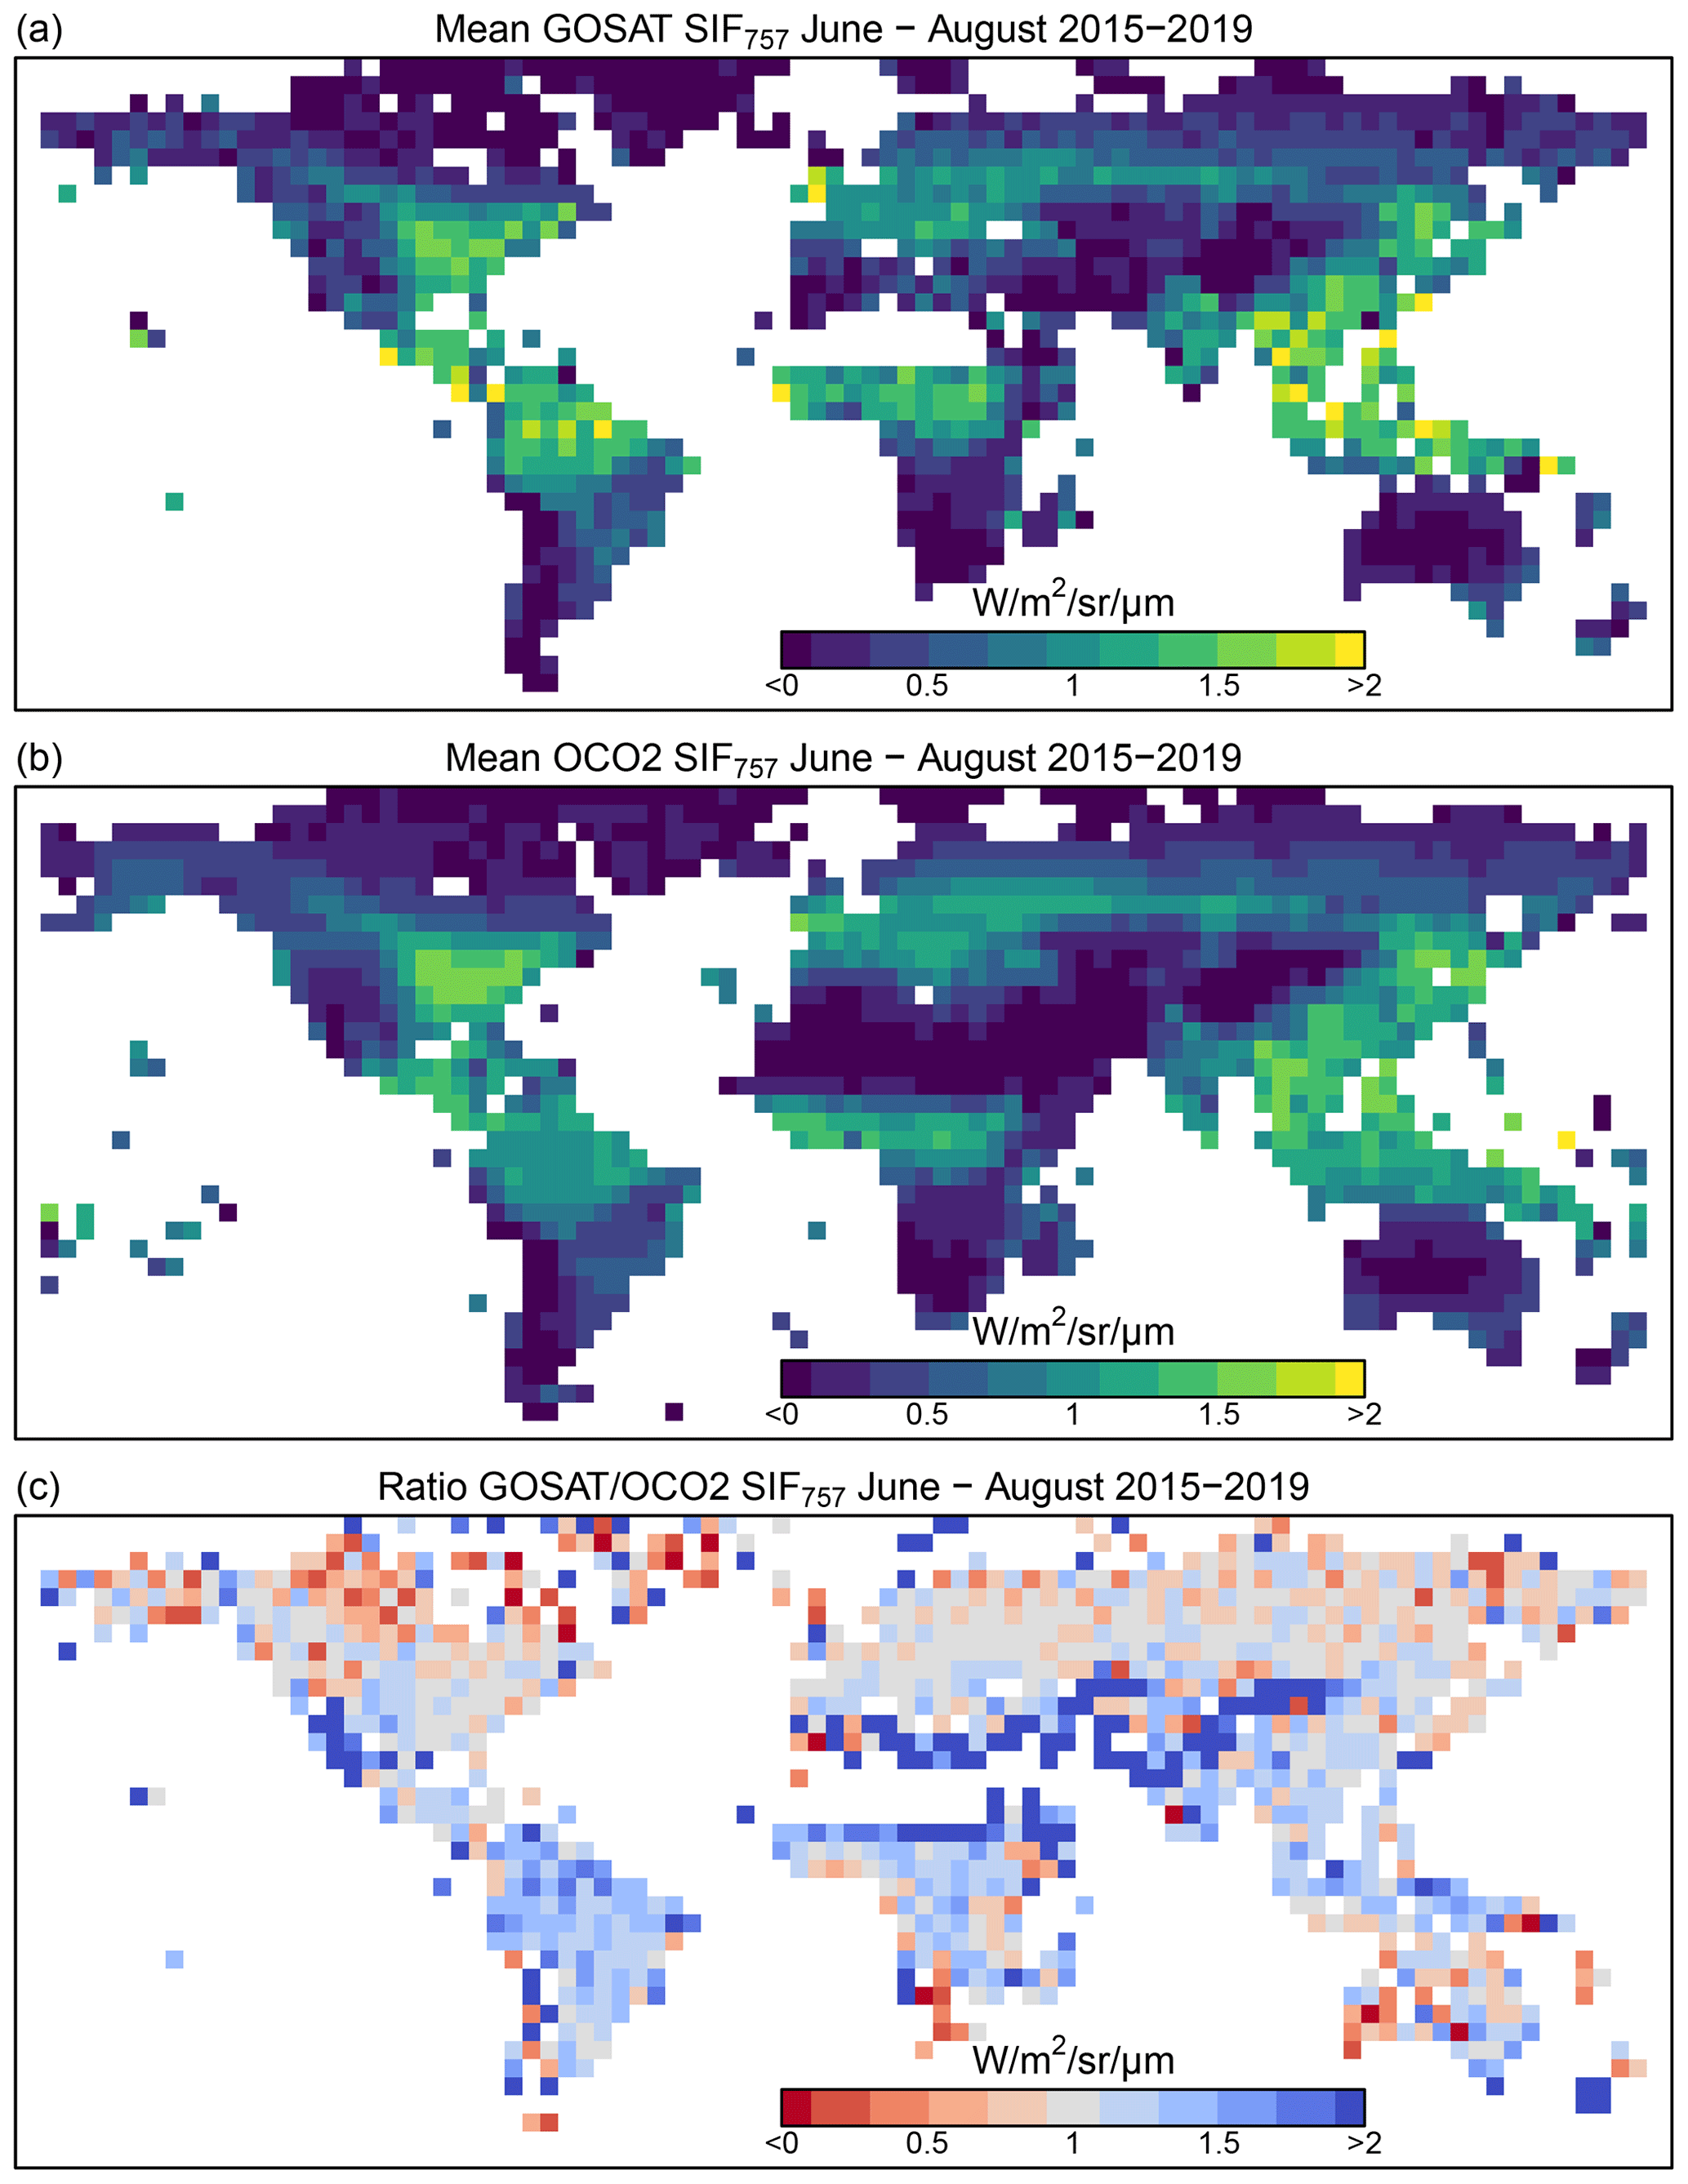
Figure 8Mean GOSAT to OCO-2 SIF740 and their ratio at 4.0∘ for June–August in 2015–2019.
Upon a more detailed comparison of GOSAT and OCO-2 SIF at 740, 757, and 771 nm, using the strictest filter we applied in Fig. 5f, we found SIF740 from the two platforms to have higher correlations than for SIF757 and SIF771 alone (Fig. 7). We also noticed that GOSAT and OCO-2 soundings most frequently overlap in the boreal winter, which corresponds to a period of little or no photosynthesis at mid- and high latitudes (Figs. S2 and S3). Thus, the direct comparison of GOSAT and OCO-2 SIF is severely restricted by the relatively infrequent overlap of the two platforms during the growing season.
In addition to the sounding level comparisons, we found that mean annual SIF757 for GOSAT and OCO-2 to compare reasonably well at the global scale during the boreal summer (Fig. 8). The relatively large differences in SIF illustrated at the grid cell level in Fig. 8c are due to differences in the spatial and temporal sampling of the two platforms. We presented the comparison here at 4.0∘ spatial resolution to improve the sampling by GOSAT (Fig. 1a).
5.7 Collocating soundings with their targets
Currently, the target and SAM soundings are not collated to the target to which they correspond, but variables will be added to upcoming versions (e.g., v11) of the SIF Lite files that will collocate the target and SAM soundings with their intended target site. For OCO-3, some of the target sites are in close proximity to each other, and thus, a target site may fall within the scan of another target. For these sites, users may also want to check scans that were intended for target sites adjacent to their target of interest. The OCO-3 targets, the dates of their scans, and scan maps are available at https://ocov3.jpl.nasa.gov/sams/index.php (last access: 7 March 2022). A list of target locations for OCO-2 and OCO-3 are available in Tables S1 and S2 in the Supplement, respectively.
OCO-2 SIF Lite files can be accessed at https://doi.org/10.5067/XO2LBBNPO010 (OCO-2 Science Team et al., 2020), and OCO-3 data can be accessed at https://doi.org/10.5067/NOD1DPPBCXSO (OCO-3 Science Team et al., 2020). GOSAT SIF Lite files can be accessed at https://doi.org/10.22002/D1.8771 (Frankenberg, 2022).
Here, we have presented and described the Level 2 SIF Lite files for GOSAT, OCO-2, and OCO-3, which have been standardized in the same netCDF format to maximize their interoperability and accessibility by the data user community and allow for intersensor comparisons. Users of remote sensing data are more accustomed to using Level 3 gridded data for analyses, but we incentivize data users to also exploit the Level 2 data we have presented in the SIF Lite files. The OCO-2 and OCO-3 platforms provide the highest spatial resolution of spaceborne SIF data, and the target and SAM observation modes are unique to these platforms. The observation scheme for the OCO platforms allow for time series to be constructed for the target locations, and the repeated target and SAM scans allow for the investigation of the directionality and escape of SIF at varying sun sensor geometries across many biomes in different seasons.
We have demonstrated how users can break target and SAM observations into phase angles for analysis and have described how the effect of sun sensor geometry and retrieval noise can be mitigated through the averaging of the data. The OCO platforms also provide a rich resource for the validation of radiative transfer models, which is currently underutilized. Upcoming spaceborne platforms with frequent revisits and/or high spatial resolution, such as the European Space Agency's FLuorescence EXplorer (FLEX) and NASA's Geostationary Carbon Cycle Observatory (GeoCarb), are expected to further our understanding of changes in vegetation structure and function (Drusch et al., 2016; Polonsky et al., 2014; Moore et al., 2018).
The supplement related to this article is available online at: https://doi.org/10.5194/essd-14-1513-2022-supplement.
RD and CF conceived this paper. TPK prepared and provided the data, and RD performed the analysis. RD prepared the paper, with contributions from all co-authors.
The contact author has declared that neither they nor their co-authors have any competing interests.
Publisher's note: Copernicus Publications remains neutral with regard to jurisdictional claims in published maps and institutional affiliations.
Reference herein to any specific commercial product, process, or service by trade name, trademark, manufacturer, or otherwise does not constitute or imply its endorsement by the United States Government or the Jet Propulsion Laboratory, California
Institute of Technology.
We thank Lan Dang, for helping to process the GOSAT data, Annmarie Eldering, for helping coordinate the publication of the SIF Lite files at the GES DISC, and Yi Yin, for publishing the GOSAT data on the Caltech data repository. Part of this research was carried out at the Jet Propulsion Laboratory, California Institute of Technology, under a contract with the National Aeronautics and Space Administration.
This research has been supported by NASA Making Earth System data Records for Use in Research Environments (MEaSUREs) Program (grant no. 17-MEASURES-0032) and the NASA OCO Science Team (grant no. 80NSSC18K0895).
This paper was edited by Yuyu Zhou and reviewed by three anonymous referees.
Braghiere, R. K., Wang, Y., Doughty, R., Sousa, D., Magney, T., Widlowski, J.-L., Longo, M., Bloom, A. A., Worden, J., and Gentine, P.: Accounting for canopy structure improves hyperspectral radiative transfer and sun-induced chlorophyll fluorescence representations in a new generation Earth System model, Remote Sens. Environ., 261, 112497, https://doi.org/10.1016/j.rse.2021.112497, 2021.
Crisp, D.: Measuring atmospheric carbon dioxide from space with the Orbiting Carbon Observatory-2 (OCO-2), Proc. SPIE 9607, Earth Observing Systems XX, 960702, https://doi.org/10.1117/12.2187291, 2015.
Crisp, D., Pollock, H. R., Rosenberg, R., Chapsky, L., Lee, R. A. M., Oyafuso, F. A., Frankenberg, C., O'Dell, C. W., Bruegge, C. J., Doran, G. B., Eldering, A., Fisher, B. M., Fu, D., Gunson, M. R., Mandrake, L., Osterman, G. B., Schwandner, F. M., Sun, K., Taylor, T. E., Wennberg, P. O., and Wunch, D.: The on-orbit performance of the Orbiting Carbon Observatory-2 (OCO-2) instrument and its radiometrically calibrated products, Atmos. Meas. Tech., 10, 59–81, https://doi.org/10.5194/amt-10-59-2017, 2017.
Dechant, B., Ryu, Y., Badgley, G., Zeng, Y., Berry, J. A., Zhang, Y., Goulas, Y., Li, Z., Zhang, Q., and Kang, M.: Canopy structure explains the relationship between photosynthesis and sun-induced chlorophyll fluorescence in crops, Remote Sen. Environ., 241, 111733, https://doi.org/10.1016/j.rse.2020.111733, 2019.
Doughty, R., Köhler, P., Frankenberg, C., Magney, T. S., Xiao, X., Qin, Y., Wu, X., and Moore, B.: TROPOMI reveals dry-season increase of solar-induced chlorophyll fluorescence in the Amazon forest, P. Natl. Acad. Sci. USA, 116, 22393–22398, https://doi.org/10.1073/pnas.1908157116, 2019.
Doughty, R., Xiao, X., Köhler, P., Frankenberg, C., Qin, Y., Wu, X., Ma, S., and Moore III, B.: Global-scale consistency of spaceborne vegetation indices, chlorophyll fluorescence, and photosynthesis, J. Geophys. Res.-Biogeo., 126, e2020JG006136, https://doi.org/10.1029/2020JG006136, 2021.
Drusch, M., Moreno, J., Del Bello, U., Franco, R., Goulas, Y., Huth, A., Kraft, S., Middleton, E. M., Miglietta, F., and Mohammed, G.: The fluorescence explorer mission concept–ESA's earth explorer 8, IEEE T. Geosci. Remote, 55, 1273–1284, 2016.
Eldering, A., Taylor, T. E., O'Dell, C. W., and Pavlick, R.: The OCO-3 mission: measurement objectives and expected performance based on 1 year of simulated data, Atmos. Meas. Tech., 12, 2341–2370, https://doi.org/10.5194/amt-12-2341-2019, 2019.
Frankenberg, C.: GOSAT Solar-Induced Chlorophyll Fluorescence Datasets, https://doi.org/10.22002/D1.8771, CaltechDATA [data set], 2022.
Frankenberg, C., Butz, A., and Toon, G. C.: Disentangling chlorophyll fluorescence from atmospheric scattering effects in O2 A-band spectra of reflected sun-light, Geophys. Res. Lett., 38, https://doi.org/10.1029/2010GL045896, 2011a.
Frankenberg, C., Fisher, J. B., Worden, J., Badgley, G., Saatchi, S. S., Lee, J.-E., Toon, G. C., Butz, A., Jung, M., and Kuze, A.: New global observations of the terrestrial carbon cycle from GOSAT: Patterns of plant fluorescence with gross primary productivity, Geophys. Res. Lett., 38, Volume 28, https://doi.org/10.1029/2011GL048738, 2011b.
Frankenberg, C., O'Dell, C., Berry, J., Guanter, L., Joiner, J., Köhler, P., Pollock, R., and Taylor, T. E.: Prospects for chlorophyll fluorescence remote sensing from the Orbiting Carbon Observatory-2, Remote Sens. Environ., 147, 1–12, 2014.
Frankenberg, C., Köhler, P., Magney, T. S., Geier, S., Lawson, P., Schwochert, M., McDuffie, J., Drewry, D. T., Pavlick, R., and Kuhnert, A.: The Chlorophyll Fluorescence Imaging Spectrometer (CFIS), mapping far red fluorescence from aircraft, Remote Sens. Environ., 217, 523–536, 2018.
Friedl, M. and Sulla-Menashe, D.: MCD12Q1 MODIS/Terra+ aqua land cover type yearly L3 global 500m SIN grid V006, NASA EOSDIS Land Process. DAAC [data set], 10, https://doi.org/10.5067/MODIS/MCD12Q1.006, 2019.
Gu, L., Han, J., Wood, J. D., Chang, C. Y.-Y., and Sun, Y.: Sun-induced Chl fluorescence and its importance for biophysical modeling of photosynthesis based on light reactions, New Phytol., 223, 1179–1191, 2019.
Guanter, L., Alonso, L., Gómez-Chova, L., Amorós-López, J., Vila, J., and Moreno, J.: Estimation of solar-induced vegetation fluorescence from space measurements, Geophys. Res. Lett., 34, https://doi.org/10.1029/2007GL029289, 2007.
Helm, L. T., Shi, H., Lerdau, M. T., and Yang, X.: Solar-induced chlorophyll fluorescence and short-term photosynthetic response to drought, Ecol. Appl., 30, e02101, https://doi.org/10.1002/eap.2101, 2020.
Joiner, J., Yoshida, Y., Vasilkov, A. P., Yoshida, Y., Corp, L. A., and Middleton, E. M.: First observations of global and seasonal terrestrial chlorophyll fluorescence from space, Biogeosciences, 8, 637–651, https://doi.org/10.5194/bg-8-637-2011, 2011.
Joiner, J., Guanter, L., Lindstrot, R., Voigt, M., Vasilkov, A. P., Middleton, E. M., Huemmrich, K. F., Yoshida, Y., and Frankenberg, C.: Global monitoring of terrestrial chlorophyll fluorescence from moderate-spectral-resolution near-infrared satellite measurements: methodology, simulations, and application to GOME-2, Atmos. Meas. Tech., 6, 2803–2823, https://doi.org/10.5194/amt-6-2803-2013, 2013.
Joiner, J., Yoshida, Y., Köehler, P., Campbell, P., Frankenberg, C., van der Tol, C., Yang, P., Parazoo, N., Guanter, L., and Sun, Y.: Systematic Orbital Geometry-Dependent Variations in Satellite Solar-Induced Fluorescence (SIF) Retrievals, Remote Sens., 12, 2346, https://doi.org/10.3390/rs12152346, 2020.
Köhler, P., Frankenberg, C., Magney, T. S., Guanter, L., Joiner, J., and Landgraf, J.: Global retrievals of solar induced chlorophyll fluorescence with TROPOMI: first results and inter-sensor comparison to OCO-2, Geophys. Res. Lett., 45, 10456–10463, https://doi.org/10.1029/2018GL079031, 2018.
Kuze, A., Suto, H., Nakajima, M., and Hamazaki, T.: Thermal and near infrared sensor for carbon observation Fourier-transform spectrometer on the Greenhouse Gases Observing Satellite for greenhouse gases monitoring, Appl. Opt., 48, 6716–6733, 2009.
Lucchesi, R.: File Specification for GEOS-5 FP-IT, GMAO Office Note No. 2 (Version 1.3), 60 pp., http://gmao.gsfc.nasa.gov/pubs/office_notes (last access: 7 March 2022), 2015.
Magney, T. S., Frankenberg, C., Köhler, P., North, G., Davis, T. S., Dold, C., Dutta, D., Fisher, J. B., Grossmann, K., and Harrington, A.: Disentangling changes in the spectral shape of chlorophyll fluorescence: Implications for remote sensing of photosynthesis, J. Geophys. Res.-Biogeo., 124, 1491–1507, 2019.
Magney, T. S., Barnes, M. L., and Yang, X.: On the covariation of chlorophyll fluorescence and photosynthesis across scales, Geophys. Res. Lett., 47, e2020GL091098, https://doi.org/10.1029/2020GL091098, 2020.
Marrs, J. K., Reblin, J. S., Logan, B. A., Allen, D. W., Reinmann, A. B., Bombard, D. M., Tabachnik, D., and Hutyra, L. R.: Solar-Induced Fluorescence Does Not Track Photosynthetic Carbon Assimilation Following Induced Stomatal Closure, Geophys. Res. Lett., 47, e2020GL087956, https://doi.org/10.1029/2020GL087956, 2020.
Maxwell, K. and Johnson, G. N.: Chlorophyll fluorescence – a practical guide, J. Exp. Bot., 51, 659–668, 2000.
Miao, G., Guan, K., Yang, X., Bernacchi, C. J., Berry, J. A., DeLucia, E. H., Wu, J., Moore, C. E., Meacham, K., and Cai, Y.: Sun-induced chlorophyll fluorescence, photosynthesis, and light use efficiency of a soybean field from seasonally continuous measurements, J. Geophys. Res.-Biogeo., 123, 610–623, 2018.
Mohammed, G. H., Colombo, R., Middleton, E. M., Rascher, U., van der Tol, C., Nedbal, L., Goulas, Y., Pérez-Priego, O., Damm, A., and Meroni, M.: Remote sensing of solar-induced chlorophyll fluorescence (SIF) in vegetation: 50 years of progress, Remote Sens. Environ., 231, 111177, https://doi.org/10.1016/j.rse.2019.04.030, 2019.
Moore, B., Crowell, S., Rayner, P., Kumer, J., O'Dell, C., O'Brien, D., Utembe, S., Polonsky, I., Schimel, D., and Lemen, J.: The potential of the geostationary carbon cycle observatory (GeoCarb) to provide multi-scale constraints on the carbon cycle in the Americas, Front. Environ. Sci., 6, 109, https://doi.org/10.3389/fenvs.2018.00109, 2018.
Müller, N. J. C.: Beziehungen zwischen assimilation, absorption und fluoreszenz im chlorophyll des lebenden blattes, Jahrb. Wiss. Bot., 9, 42–49, 1874.
OCO-2 Science Team, Gunson, M., and Eldering, A.: OCO-2 Level 2 bias-corrected solar-induced fluorescence and other select fields from the IMAP-DOAS algorithm aggregated as daily files, Retrospective processing VEarlyR, Goddard Earth Sci. Data Inf. Serv. Cent. GES DISC [data set], https://doi.org/10.5067/XO2LBBNPO010, 2020.
OCO-3 Science Team, Gunson, M., and Eldering, A.: OCO-3 Level 2 bias-corrected solar-induced fluorescence and other select fields from the IMAP-DOAS algorithm aggregated as daily files, Retrospective processing VEarlyR, Goddard Earth Sci. Data Inf. Serv. Cent. GES DISC [data set], https://doi.org/10.5067/NOD1DPPBCXSO, 2020.
Parazoo, N. C., Frankenberg, C., Köhler, P., Joiner, J., Yoshida, Y., Magney, T., Sun, Y., and Yadav, V.: Towards a harmonized long-term spaceborne record of far-red solar-induced fluorescence, J. Geophys. Res.-Biogeo., 124, 2518–2539, 2019.
Plascyk, J. A.: The MK II Fraunhofer line discriminator (FLD-II) for airborne and orbital remote sensing of solar-stimulated luminescence, Opt. Eng., 14, 144339, https://doi.org/10.1117/12.7971842, 1975.
Polonsky, I. N., O'Brien, D. M., Kumer, J. B., O'Dell, C. W., and the geoCARB Team: Performance of a geostationary mission, geoCARB, to measure CO2, CH4 and CO column-averaged concentrations, Atmos. Meas. Tech., 7, 959–981, https://doi.org/10.5194/amt-7-959-2014, 2014.
Porcar-Castell, A., Tyystjärvi, E., Atherton, J., Van der Tol, C., Flexas, J., Pfündel, E. E., Moreno, J., Frankenberg, C., and Berry, J. A.: Linking chlorophyll a fluorescence to photosynthesis for remote sensing applications: mechanisms and challenges, J. Exp. Bot., 65, 4065–4095, 2014.
Schreiber, U., Schliwa, U., and Bilger, W.: Continuous recording of photochemical and non-photochemical chlorophyll fluorescence quenching with a new type of modulation fluorometer, Photosynth. Res., 10, 51–62, 1986.
Sun, Y., Frankenberg, C., Wood, J. D., Schimel, D. S., Jung, M., Guanter, L., Drewry, D. T., Verma, M., Porcar-Castell, A., and Griffis, T. J.: OCO-2 advances photosynthesis observation from space via solar-induced chlorophyll fluorescence, Science, 358, eaam5747, https://doi.org/10.1126/science.aam5747, 2017.
Sun, Y., Frankenberg, C., Jung, M., Joiner, J., Guanter, L., Köhler, P., and Magney, T.: Overview of Solar-Induced chlorophyll Fluorescence (SIF) from the Orbiting Carbon Observatory-2: Retrieval, cross-mission comparison, and global monitoring for GPP, Remote Sens. Environ., 209, 808–823, 2018.
Taylor, T. E., Eldering, A., Merrelli, A., Kiel, M., Somkuti, P., Cheng, C., Rosenberg, R., Fisher, B., Crisp, D., and Basilio, R.: OCO-3 early mission operations and initial (vEarly) XCO2 and SIF retrievals, Remote Sens. Environ., 251, 112032, https://doi.org/10.1016/j.rse.2020.112032, 2020.
Verma, M., Schimel, D., Evans, B., Frankenberg, C., Beringer, J., Drewry, D. T., Magney, T., Marang, I., Hutley, L., and Moore, C.: Effect of environmental conditions on the relationship between solar-induced fluorescence and gross primary productivity at an OzFlux grassland site, J. Geophys. Res.-Biogeo., 122, 716–733, 2017.
Xiao, X., Hollinger, D., Aber, J., Goltz, M., Davidson, E. A., Zhang, Q., and Moore, B.: Satellite-based modeling of gross primary production in an evergreen needleleaf forest, Remote Sens. Environ., 89, 519–534, 2004.
Yang, K., Ryu, Y., Dechant, B., Berry, J. A., Hwang, Y., Jiang, C., Kang, M., Kim, J., Kimm, H., and Kornfeld, A.: Sun-induced chlorophyll fluorescence is more strongly related to absorbed light than to photosynthesis at half-hourly resolution in a rice paddy, Remote Sens. Environ., 216, 658–673, 2018.
Yang, X., Tang, J., Mustard, J. F., Lee, J.-E., Rossini, M., Joiner, J., Munger, J. W., Kornfeld, A., and Richardson, A. D.: Solar-induced chlorophyll fluorescence that correlates with canopy photosynthesis on diurnal and seasonal scales in a temperate deciduous forest, Geophys. Res. Lett., 42, 2977–2987, 2015.
Zhang, Y., Xiao, X., Wu, X., Zhou, S., Zhang, G., Qin, Y., and Dong, J.: A global moderate resolution dataset of gross primary production of vegetation for 2000–2016, Sci. Data, 4, 170165, https://doi.org/10.1038/sdata.2017.165, 2017.