the Creative Commons Attribution 4.0 License.
the Creative Commons Attribution 4.0 License.
 | 22 Dec 2021
Deployment of the C-band radar Poldirad on Barbados during EUREC4A
Florian Ewald
Silke Groß
Lothar Oswald
David A. Farrell
Marvin Forde
Manuel Gutleben
Johann Heumos
Jens Reimann
Eleni Tetoni
Gregor Köcher
Eleni Marinou
Christoph Kiemle
Rebecca Chewitt-Lucas
Alton Daley
Delando Grant
Kashawn Hall
The German polarimetric C-band weather radar Poldirad (Polarization Diversity Radar) was deployed for the international field campaign EUREC4A (Elucidating the role of clouds–circulation coupling in climate) on the island of Barbados where it was operated from February until August 2020. Focus of the installation was monitoring clouds and precipitation in the trade wind region east of Barbados. Different scanning modes were used with a temporal sequence of 5 min and a maximum range of 375 km. In addition to built-in quality control performed by the radar signal processor, it was found that the copoloar correlation coefficient ρHV can be used to remove contamination of radar products by sea clutter. Radar images were available in real time for all campaign participants and aboard research aircraft. Examples of mesoscale precipitation patterns, rain rate accumulation, diurnal cycle, and vertical distribution are given to show the potential of the radar measurements for further studies on the life cycle of precipitating shallow cumulus clouds and other related aspects. Poldirad data from the EUREC4A campaign are available on the EUREC4A AERIS database: https://doi.org/10.25326/218 (Hagen et al., 2021a) for raw data and https://doi.org/10.25326/217 (Hagen et al., 2021b) for gridded data.
- Article
(4880 KB) - Full-text XML
- BibTeX
- EndNote


Clouds and precipitation play an important role in the Earth radiation budget. Predictions for future climate scenarios show large uncertainties in the contribution of clouds on the overall radiation budget. One considerable uncertainty can be attributed to shallow maritime cumulus clouds as they are frequently observed over tropical oceans. Long-term continuous observations are rare, and only a limited number of detailed measurements are available to foster understanding of their development, life cycle, and organization. Satellite observations can provide the structure of cloud patterns – mainly through high-resolution visible images during daytime – but rarely can describe the thermodynamic and dynamic environment in which the cloud pattern does exist. Because of the lack of continuous observations, various field campaigns have been performed in the Atlantic trade wind region to investigate in detail the role of shallow maritime cumuli and their relation to air–sea interaction and global circulation: BOMEX 1969 (e.g., Fleagle, 1972; Holland and Rasmusson, 1973), GATE 1974 (e.g., Kuettner et al., 1974; Kuettner and Parker, 1976), ASTEX 1992 (Albrecht et al., 1995), and RICO 2004/05 (e.g., Rauber et al., 2007). In order to further elucidate the thermodynamic and dynamic environment of maritime clouds and their organization, the EUREC4A (Elucidating the role of clouds–circulation coupling in climate) campaign was planned (Bony et al., 2017) and performed in January and February 2020 in the trade wind zone east of Barbados (Stevens et al., 2021).
One property of maritime cumulus clouds in the tropics is a rapid initiation of rain in the shallow cloud systems with cloud top heights in the range of 2.5 to 5 km (e.g., Rauber et al., 2007). The development of a cumulus cloud to a raining convective cloud occurs within a time span of about 30 min (e.g., Saunders, 1965). Detailed radar studies were conducted during the RICO campaign (e.g., Nuijens et al., 2009; Snodgrass et al., 2009; Trivej and Stevens, 2010) and showed the importance of long-range surveillance radar observations with high spatial and temporal resolution. With this in mind the full polarimetric C-band research radar system Poldirad (Schroth et al., 1988) was deployed for EUREC4A on the island of Barbados. The non-polarimetric S-band radar of the Barbados Meteorological Service was out of service during the EUREC4A campaign. Thus Poldirad was the only radar system which could provide an overview over precipitation fields during the campaign.
The EUREC4A campaign, its scope, and the role of Poldirad is introduced in Sect. 2. Poldirad and data processing is described in Sect. 3. Section 4 gives some measurement examples. Section 5 describes the data available on the EUREC4A AERIS database, and Sect. 6 concludes the study.
EUREC4A is an international initiative in the scope of the World Climate Research Programme's Grand Challenge on Clouds, Circulation and Climate Sensitivity. The field phase of EUREC4A took place between 20 January and 20 February 2020 in the region east of Barbados (Bony et al., 2017; Stevens et al., 2021).
EUREC4A aims to advance the understanding of the interplay between clouds, convection, and circulation and their role in climate change. Scientific questions are the following (see Bony et al., 2017). (i) How resilient or sensitive is the shallow cumulus cloud amount to variations in the strength of convective mixing, surface turbulence, and large-scale circulations? (ii) How do the radiative effects of water vapor and clouds influence shallow circulations and convection? (iii) To what extent do mesoscale patterns of convective organization condition the response of clouds to perturbations? (iv) What are the implications of all of the above for how clouds respond to warming?
In order to respond to those questions, remote sensing and in situ observations on various scales were performed to investigate clouds and precipitation and their atmospheric and oceanic environment (Stevens et al., 2021). Four research vessels, four research aircraft, a large number of autonomous boats, and aircraft were involved. Additionally measurements were taken on the island of Barbados.
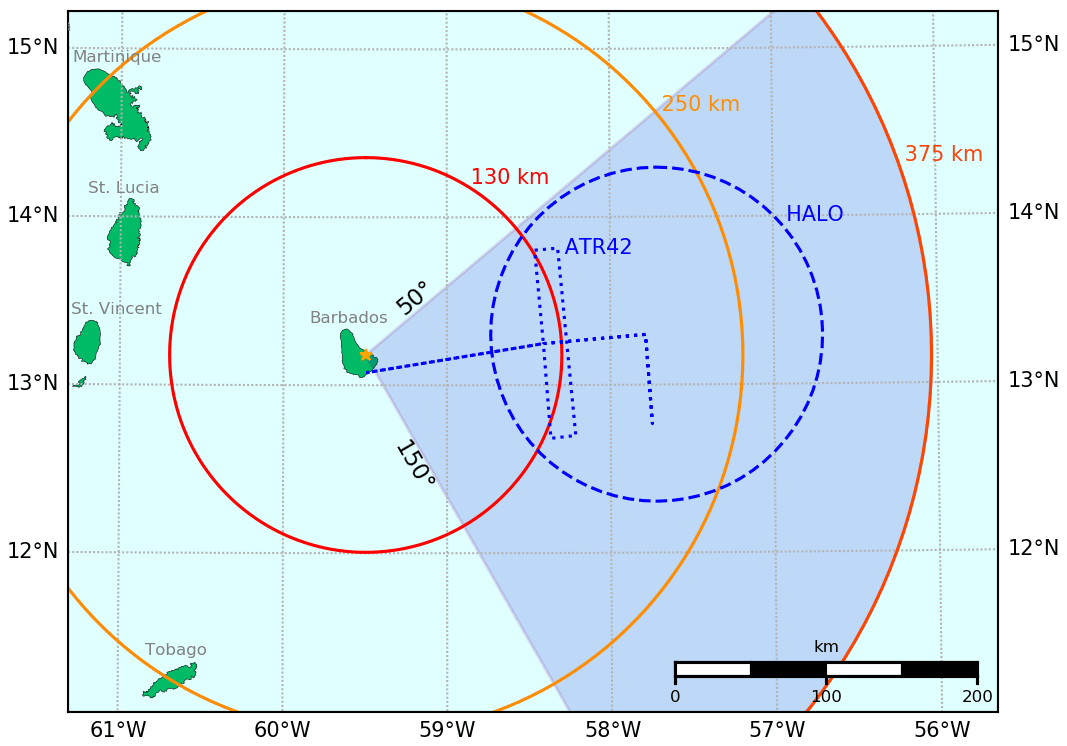
Figure 1Coverage of the EUREC4A experimental area by Poldirad (blue shaded sector). Blue lines represent the typical flight pattern of the German HALO (dashed) and French ATR-42 (dotted) research aircraft.
In this context the mission and the contribution of the dual-polarization Doppler weather radar Poldirad were
-
to provide an overview for research aircraft and vessels in the experimental area east of Barbados (see Fig. 1),
-
to investigate the life cycle of the precipitation cells approaching Barbados and in particular those passing over the Barbados Cloud Observatory (BCO Stevens et al., 2016), and
-
to investigate the possibilities about cloud microphysics retrieval when combining C-band (wavelength 5.5 cm) measurements with profiles from the Ka-band (wavelength 8 mm) radar at BCO.
To support the first item, Poldirad images and data were transferred in real time to the Barbados Meteorological Service and incorporated into the Caribbean Radar Composite. Real-time images were available through the Atmosphere Planet software system (http://www.atmosphere.aero/products-services/planet, last access: 27 April 2021) aboard the German HALO (Hight Altitude and Long Range Research Aircraft) and French ATR-42 research aircraft and for ground staff. Radar images were also of importance for the flight crew of the French remote-controlled unmanned aerial vehicle Boréal, which should avoid flying into precipitation.
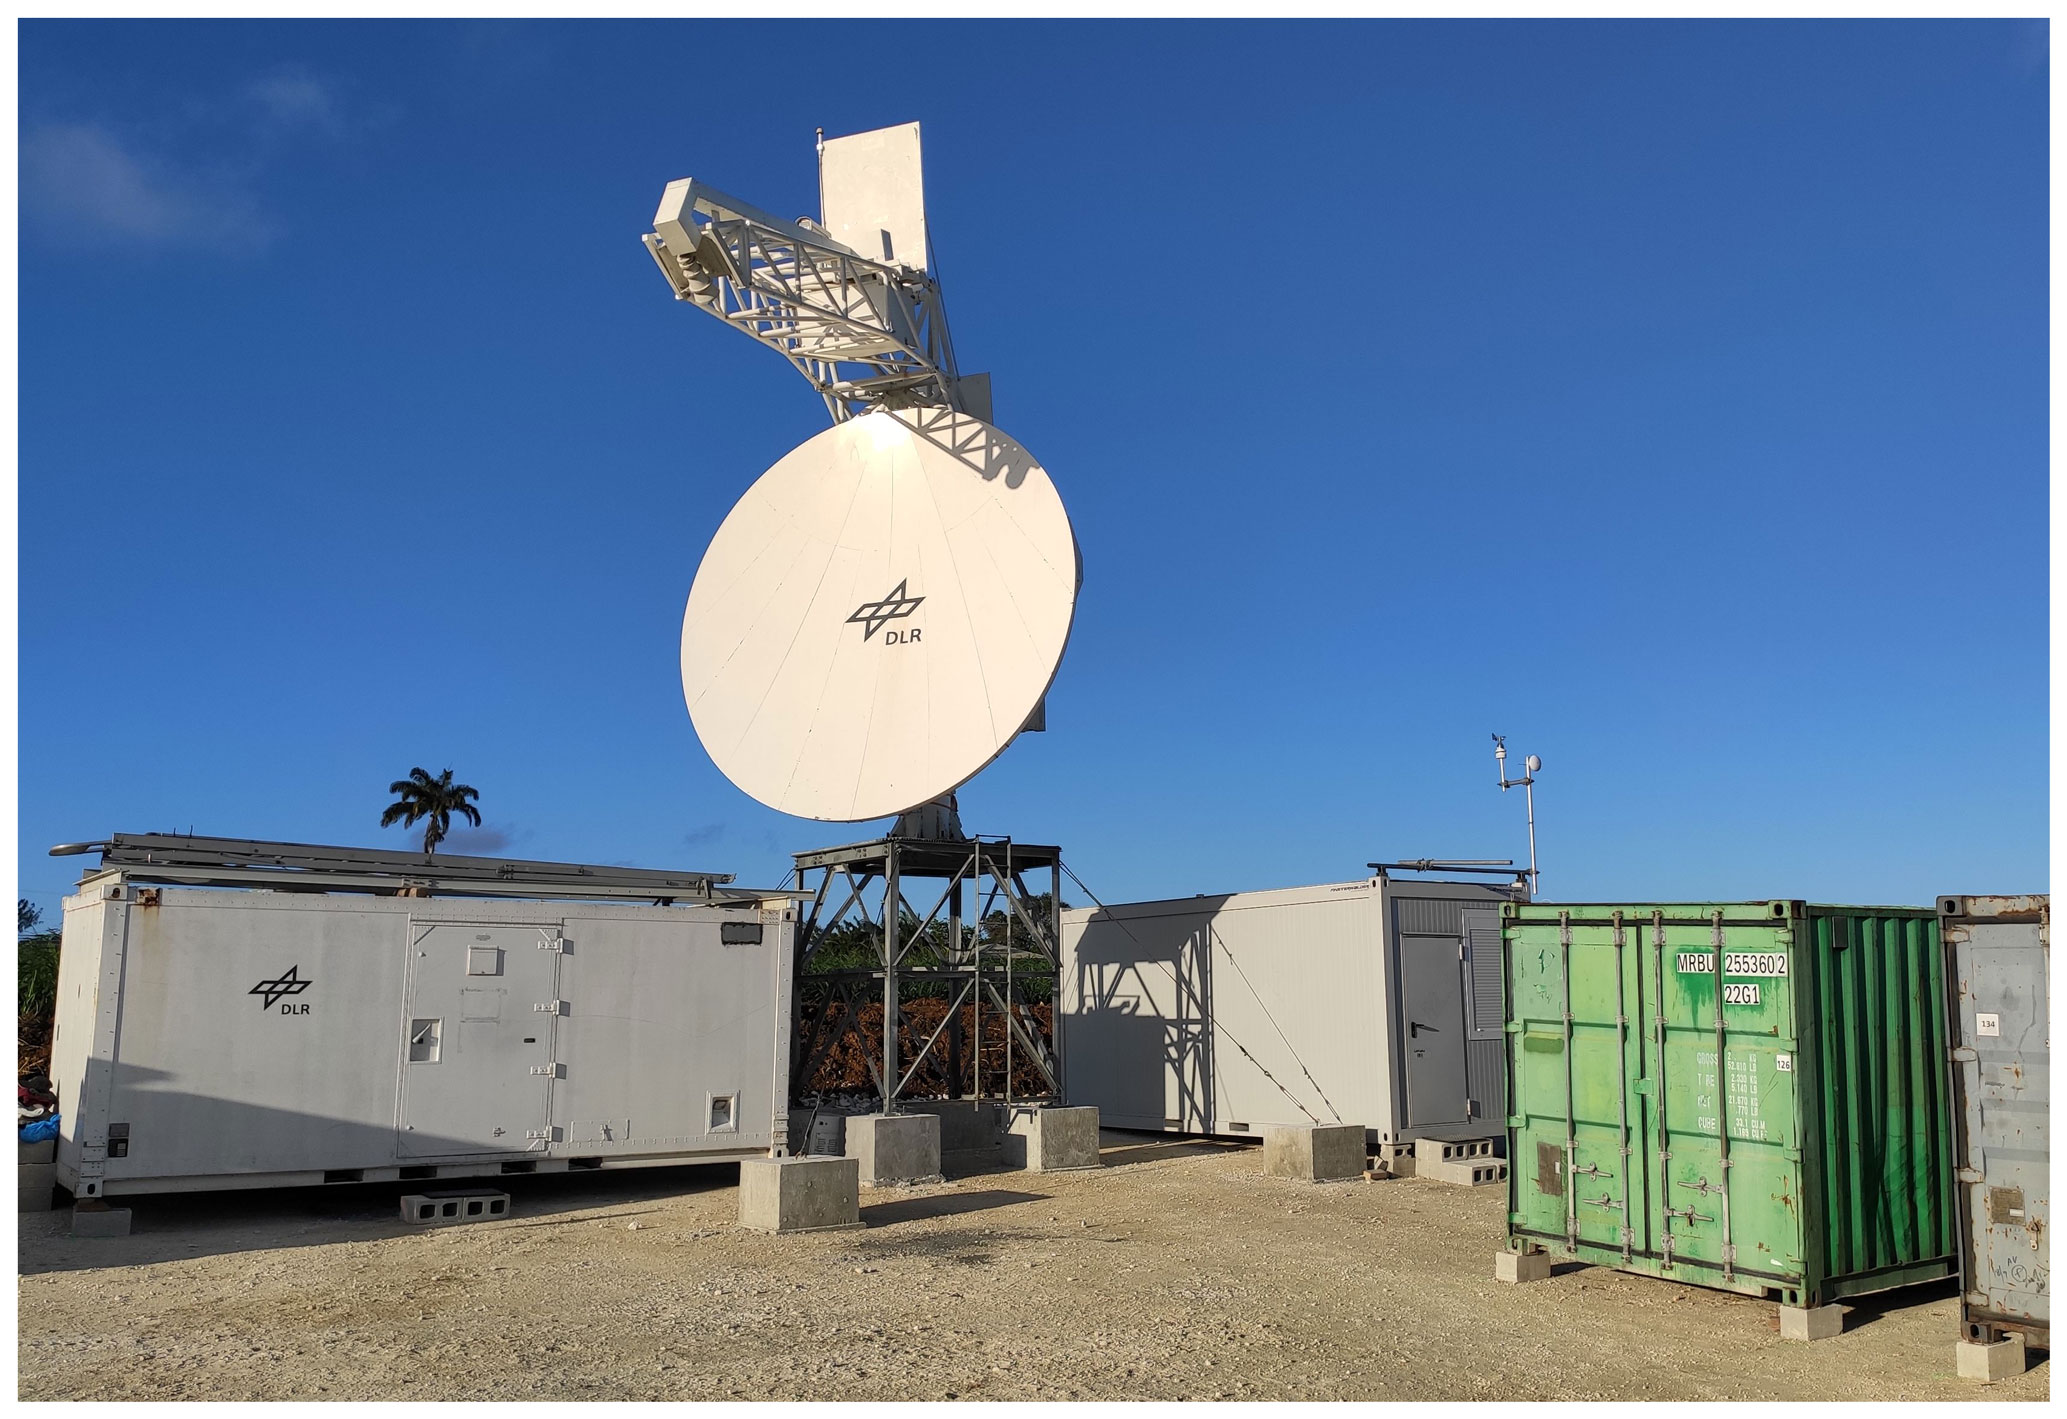
The C-band polarimetric weather radar Poldirad (Polarization Diversity Radar, Schroth et al., 1988, Fig. 2) was deployed on Barbados for the EUREC4A campaign. Due to unforeseeable long delays during shipping from Germany, custom handling, and local permissions, the radar was ready for operation on 5 February with a 2-week delay for the campaign. Originally, it was planned to operate the radar after the campaign with a reduced schedule until June 2020. However, due to the rapid outbreak of the SARS-CoV-2 virus and the restriction in traveling, operation was stopped in March 2020. A limited radar operation was resumed mid-May 2020 until a major failure of the antenna drive at the beginning of August 2020.
3.1 Radar system
Poldirad was installed in 1986 at the DLR (Deutsches Zentrum für Luft und Raumfahrt – German Aerospace Center) site Oberpfaffenhofen (Germany) as one of the first polarimetric weather radars in Europe and is presently – after some major upgrades – up to date (Table 1). Its unique and fast ferrite polarization network allows for any kind of polarization basis – even elliptical ones. The polarization basis can be independent for transmit and receive and can be changed from pulse to pulse. During EUREC4A two modes were used: (i) the hybrid or STAR (simultaneous transmit and receive) mode and (ii) the alternate HV mode (horizontal vertical). In the hybrid mode a linear polarized pulse with an orientation of 45∘ is transmitted, and on reception the signal is received simultaneously with linear horizontal and vertical polarization. In the alternate HV mode the polarization on transmit is alternating from pulse to pulse from linear horizontal to linear vertical polarization. On reception, both the linear horizontal and vertical polarization are always recorded. Only the latter mode allows measuring the full backscattering matrix and hence the depolarization signal (LDR: linear depolarization ratio).
Table 1Technical specifications of Poldirad. Note the different settings for the long-range and short-range modes.

In contrast to most other C-band weather radar systems, Poldirad is equipped with an offset antenna and the antenna is not sheltered by a radome. With an offset design the antenna feed does not cause blockage of the antenna beam and cannot create additional cross-polar signal, making it better suitable for depolarization measurements. During the development of Poldirad it was decided to design the radar without a protective radome, since it was not appraisable how much a radome (especially a wet one) will influence polarization purity.
For the mobile deployment of Poldirad the antenna can be installed on a 3 m high tower. Radar control electronics are housed in one 20 ft (6.1 m) container, while another 20 ft office container is used for radar operation (Fig. 2). Two additional 20 ft containers are used for transportation of the equipment.
The sensitivity or lowest observable reflectivity, named minimum detectable signal (MDS), Zm is a function of range r:
with Z0 as MDS in dBz at a range of 1 km, r the range in kilometers (km), and Ka the two-way atmospheric attenuation in decibels per kilometer (dB km−1). Z0 is −47.5 dBz for the long-range mode and −39 dBz for the short-range mode (Fig. 3). Poldirad's signal processor uses Ka = 0.019 dB km−1 as an estimation of the two-way atmospheric attenuation at the C band. See also the discussion in Sect. 4.3 for the impact of MDS on long-range measurements. The actual sensitivity is slightly varying within ca. 0.5 dB since the transmit power is varying during the course of the scanning cycle in dependency of the transmitter temperature. Note that due to internal settings in the signal processor, the lowest recorded reflectivity value is −31.5 dBz. This limitation is only relevant for the first 6.2 km in long-range mode and 2.4 km in short-range mode, respectively.
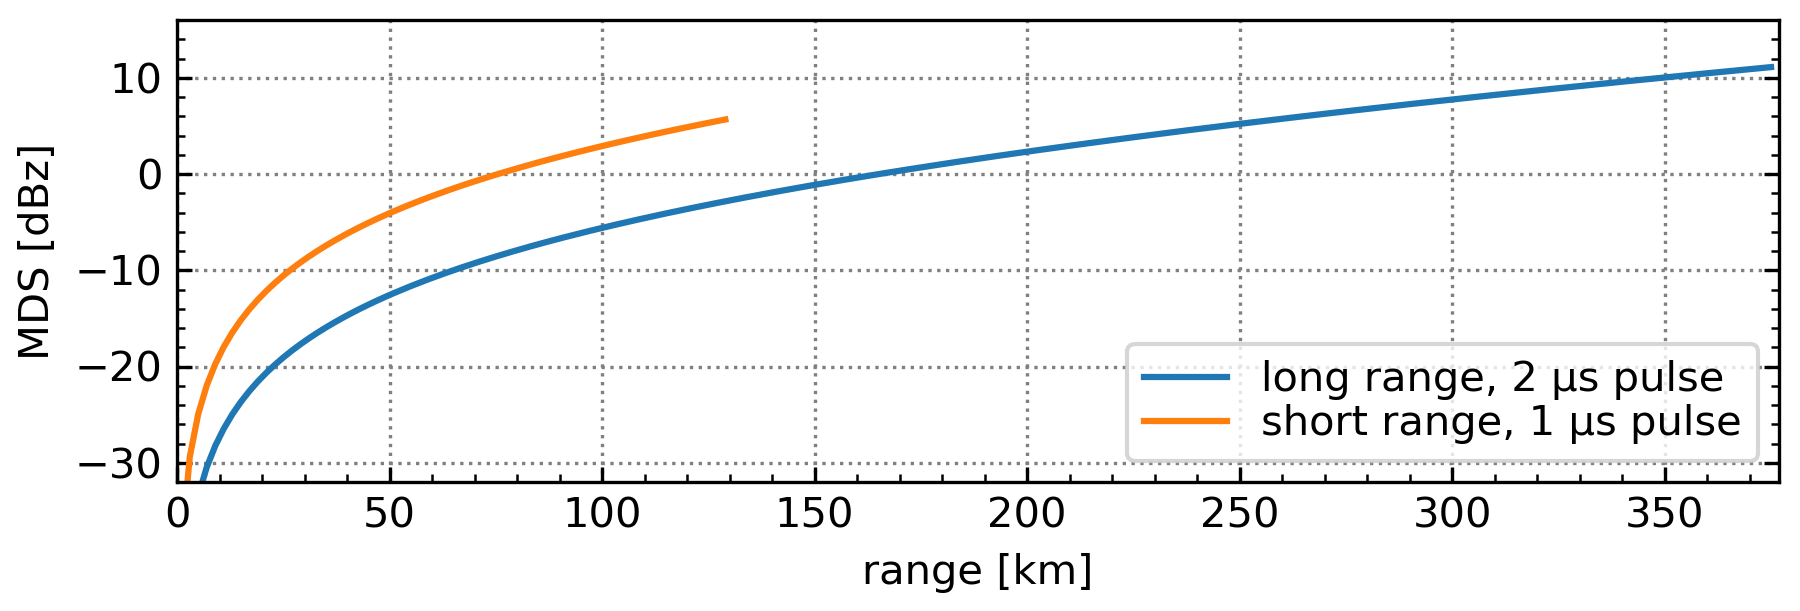
Figure 3Minimum detectable signal (MDS) for long- and short-range modes.
3.2 Location
The main mission of Poldirad during EUREC4A was the provision of precipitation information in the trade wind region east of Barbados. Therefore the radar location needed an unobscured view towards the experimental area. Logistical limitations were (i) road access for trucks carrying four 20 ft sea containers, (ii) a three-phase power line nearby, (iii) and internet access possible by land line or over the air.
A suitable location (13.18043∘ N, 59.49650∘ W, altitude approximate 240 ) was found near St. John's church, St. John (Fig. 4), next to highway H. The site provides free view to the east; however, due to the village nearby and C-band installations near Barbados Grantley Adams International Airport (BGI) and next to Gunn Hill signal station, radar scanning was limited towards the east sector.
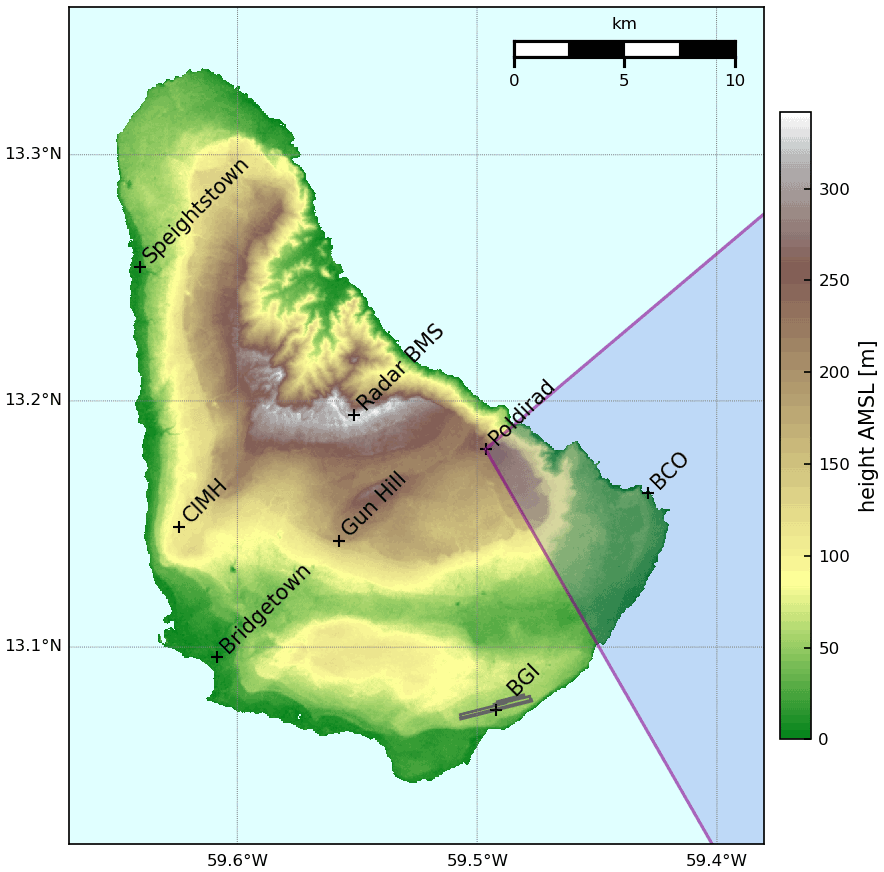
Figure 4Location of Poldirad on Barbados. Shaded region shows scanning sector. BCO: Barbados Cloud Observatory; BGI: Barbados Grantley Adams International Airport; BMS: Barbados Meteorological Service; CIMH: Caribbean Institute for Meteorology and Hydrology. SRTM 1 arcsec digital elevation model provided by U.S. Geological Survey.
3.3 Scan modus
The radar system is designed for research applications and allows highly flexible definition of scanning patterns. During the campaign a 5 min schedule with a long-range surveillance PPI (plan position indicator) scan in hybrid polarization mode up to 375 km at an elevation angle of 0.3∘, a short-range volume PPI scan in alternate HV polarization mode up to 130 km with the elevation angle sequence (0.0, 0.5, 1.0, 1.5, 2.0, 2.5, 3.0∘), and a short-range RHI (range height indicator) scan in alternate HV polarization mode up to 130 km were performed. The PPI scans were limited towards the east between 50 and 150∘ from the north.
RHI scans were towards BCO at Deebles Point with an azimuth of 105∘ (distance 7.6 km) and an additional RHI towards 100∘ to capture precipitation cells approaching from the east towards BCO. Occasionally, targeted RHI scans were performed to track individual moving cells or precipitation near research aircraft.
Figure 5 shows in the upper panel the temporal sequence of the three scans. Depending on various factors, the three scans can take more than 5 min. In this case, the scheduling algorithm omits the RHI scan from time to time. The gaps between the scans are used for positioning the antenna and for noise sampling. The lower panel shows the beam propagation relative to sea surface of the PPI scans in long- and short-range mode.
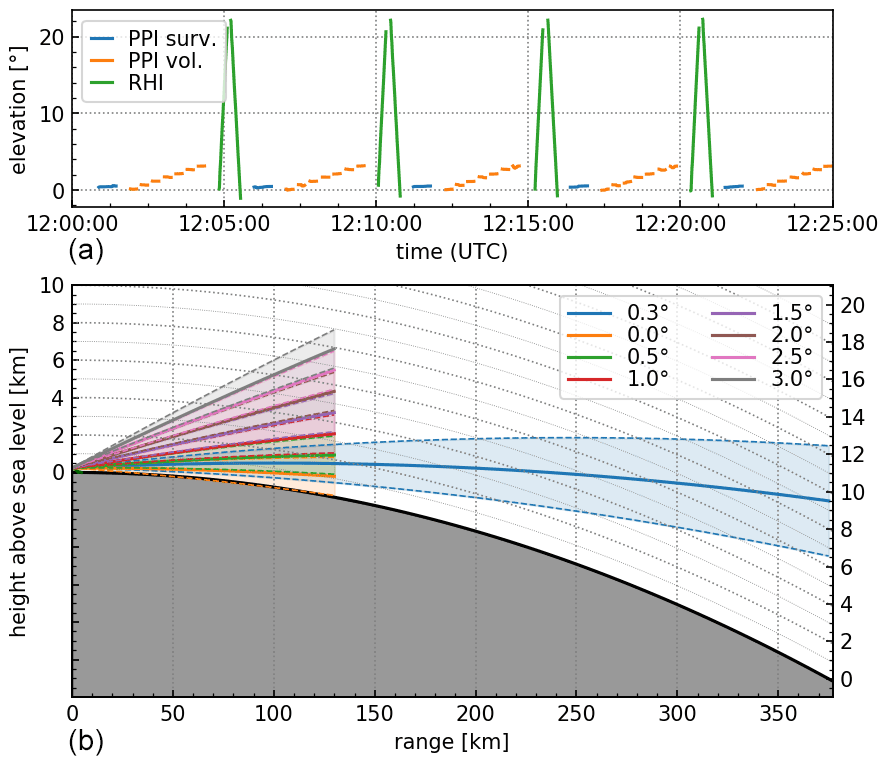
Figure 5(a) Sample of temporal sequence of long-range surveillance PPI (blue), short-range volume PPI (orange), and short-range RHI towards BCO (green). (b) Beam propagation relative to sea surface for long-range (blue) and short-range PPIs. Shaded area represents 1∘ beamwidth.
3.4 Data quality
Several aspects are related to the quality of radar data: (i) calibration, (ii) antenna pointing direction, (iii) sanity checks, and (iv) polarization purity. Most important is the calibration of the radar system. An absolute calibration can only be done using a target with well-known backscatter properties lifted into the air. Normally a metal sphere with a diameter which is large compared to the wavelength is used for that purpose. This is hardly achievable in the field. The architecture of Poldirad is that the transmitter is located in the radar cabinet on the ground, whereas the polarization network and the receivers are mounted on the rotating antenna. The transmit power is measured for each pulse by the receiver. During the deployment at Barbados the signal path from the antenna feed horn to the receiver was not changed. For these reasons the calibration parameters determined during the latest system upgrade are kept for the campaign. In order to account for temporal variations of the receiver chain, a noise sample is taken before each scan. Additionally an offset calibration is performed using a single frequency signal with defined power injected at the receiver frontend.
Verifying the antenna pointing direction and the alignment of the pedestal is frequently done by using the sun as radiative source (e.g., Huuskonen and Holleman, 2007; Altube et al., 2015). The initial alignment was done with dedicated solar scans (Reimann and Hagen, 2016, and Appendix A). Solar hits during the regular scan sequence were used to verify the antenna pointing. Measurements after sunrise and as long as the sun was within the volume PPI or RHI scan revealed that elevation error was less than 0.1∘ and that azimuth error was about 0.5∘ to the left.
The radar signal processor (Selex GDRX©) performs quality checks, ground clutter filtering, and second-trip echo removal. Data with a low signal quality index (SQI), i.e., with too large a standard deviation, are disregarded, and no further radar moments are calculated. A ground clutter filter operating in frequency domain is applied by default to Poldirad radar parameters. Second-trip echoes are considered if reflectivity is above noise level, but no phase coherence can be achieved within the sampling interval.
The ferrite polarization network of Poldirad allows for a high flexibility in defining the polarization base for transmission and reception (Schroth et al., 1988). However, the required settings for power division and phase delay need calibration. This was done by Reimann (2013), and it was not possible to repeat this procedures in the field. A simple way to check the polarization configuration is the assumption that for light rain the differential reflectivity ZDR should be close to zero (e.g., Gourley et al., 2006) and LDR much below −30 dB. Occasionally setting the polarization fails, which becomes visible in data where reflectivity is much less compared to the previous or following scan. These data should be omitted.
During the warm-up phase of the magnetron (about 1 h after switching on the transmitter), the nominal frequency is not yet reached, and the receiver may fail to lock to the stabilized local oscillator (STALO) frequency. This occurs mainly for the long-range PPI scans and becomes visible in the data when reflectivity and other products are empty and the raw data files are much smaller than the others. These data should not be used for further processing.
3.5 Sea clutter identification
The backscatter from sea surface can considerably contaminate radar observations if a weather radar is located close to the coast. Reflectivity from sea clutter was observed up to 35 dBz for Poldirad scans at 0∘ elevation and up to 15 dBz for 0.5∘ elevation (Fig. 6a). Ground clutter from land surface is removed using Doppler filters for stationary targets. However, since the sea surface is in motion, ground clutter filters will fail and additional filters have to be applied.
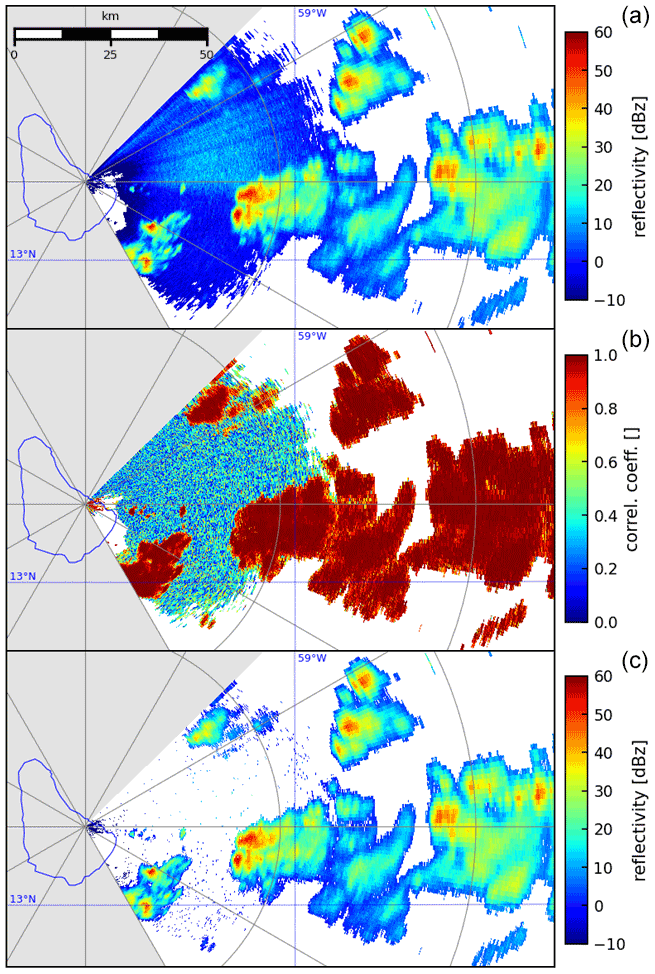
Figure 6PPI scan with elevation 0.5∘ on 11 February 2020 at 12:07:25 UTC. (a) Reflectivity horizontal polarization ZH. (b) Copolar correlation coefficient ρHV. (c) Reflectivity ZH, where ρHV > 0.7.
Various algorithms do exist to identify hydrometeors using polarimetric radar data (e.g., Vivekanandan et al., 1999; Park et al., 2009). The separation of meteorological targets from non-meteorological targets is a further aspect of some classification techniques (e.g., Giuli et al., 1991; Berenguer et al., 2006) and more recently by Kilambi et al. (2018) or Overeem et al. (2020). Besides some other properties observed in polarimetric parameters, like the texture of differential reflectivity ZDR or differential propagation phase ϕDP, the copolar correlation coefficient ρHV is one of the most promising parameters to identify sea clutter. Meteorological echoes have a high correlation between reflectivities from horizontal and vertical polarization. Ryzhkov et al. (2002) proposed to use a threshold of ρHV = 0.7 to discriminate between meteorological echoes and sea clutter. Figure 6 shows the observed reflectivity factor, copolar correlation coefficient, and the filtered reflectivity factor using a threshold of 0.7 for ρHV. Some speckles are not removed, but some weak echoes at the edges of precipitation cells are removed. The latter is caused by non-uniform beam filling while scanning across the edges of precipitation. For further processing of Poldirad data, this threshold will be applied.
3.6 Availability of Poldirad measurements
Figure 7 shows the radar operation during February 2020 (blue bars) together with rain events (any non-zero 10 s rain intensity) recorded at BCO (green ticks) and HALO flight times (red). The flight on 18 February was the return flight to Germany. The radar is designed for research application and is not suited for unattended operation. During the campaign a 24 h operation was envisaged. Failures and limited personal resources caused gaps in a continuous operation during EUREC4A and afterwards.
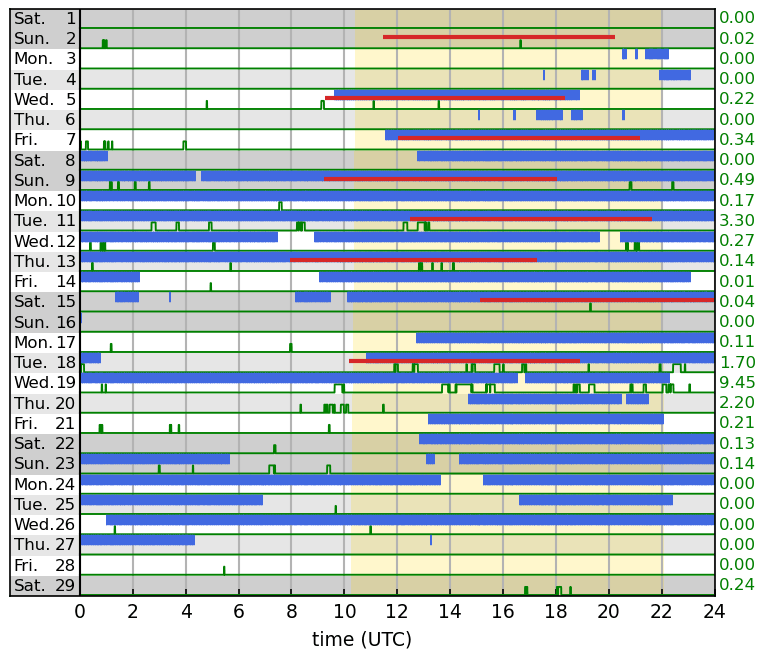
Figure 7Availability of Poldirad data during February 2020 (blue bars) with rain events at BCO (green ticks) and HALO flight times (red lines). Green numbers to the right give daily precipitation sums (in mm) at BCO. Yellow shaded area indicates daylight time at Barbados.
Further measurements, only during daytime, were performed from mid-May until the beginning of August. During the nearby passage of the Tropical Storm Gonzalo (23 to 25 July) and Tropical Storm Isaias (28 to 29 July), Poldirad was operated continuously also during nighttime.
3.7 Data format
Poldirad raw data are stored in HDF5 format (Hierarchical Data Format version 5) following the ODIM 2.0.1 specifications (Michelson et al., 2010). This data
structure was developed by the weather radar operators group of European meteorological services to ease the international exchange of weather radar
data. Some additions and modifications to the ODIM specification had been necessary, since Poldirad offers more flexibility and options than
operational weather radar systems. Each surveillance PPI, volume PPI, or RHI scan is stored as one file with an approximate size of 2 to
12 MB. Each file consists of general metadata, metadata for each sweep or sub-scan (named dataset1
to datasetn), and metadata for each radar product (named data1 to datan). Details on the
structure and the attributes (metadata) can be found in Michelson et al. (2010). Depending on the scanning mode, up to 22 radar products are defined. The
available radar products are listed in Appendix B.
3.8 Gridded dataset
To ease the usage of Poldirad data within the EUREC4A community, a two-dimensional gridded dataset was generated from the long-range surveillance
scans. The sector scans were interpolated on a 1 km by 1 km grid with a size of
400 km × 400 km. Interpolation was done using the griddata routine from the Python SciPy
package. For each grid point reflectivity factor Z, rainfall rate R, longitudinal (x) distance from radar, meridional (y) distance from radar,
longitude, latitude, and approximate height above sea level is provided. Sea clutter was removed according to the procedure outlined in
Sect. 3.5.
Conversion from reflectivity to rainfall rate was done by the commonly used empirical z–R relation z = 200R1.6 (Marshall et al., 1955) with R in millimeters (mm) per hour and z in mm6 m−3. There are only a few z–R relations attributed to shallow trade wind showers, e.g., Stout and Mueller (1968) (z = 126R1.47) or Snodgrass et al. (2009) (z = 88R1.6). However, they are based on small sample sizes and thus might not be representative for the events observed during EUREC4A. When using these relations, the estimated rainfall rate would be about twice as high as when using z = 200R1.6.
In this section we will show some example measurements from the Poldirad observations during the EUREC4A campaign. Synergies with other observations are expected in future evaluation of the EUREC4A campaign. An example of synergy can be found in Stevens et al. (2021) (their Fig. 11). Comparisons with further radar observations (e.g., Acquistapace et al., 2021; Konow et al., 2021) are anticipated. All observational system which were available during the campaign are described in Stevens et al. (2021).
4.1 Precipitation patterns
One of the main objectives of the EUREC4A campaign is to investigate the mesoscale cloud patterns and the life cycle of shallow convection in the trade wind zone east of Barbados. According to Stevens et al. (2020) and Bony et al. (2020) sugar, fish, gravel, and flower type cloud patterns can be classified from satellite images. Precipitation patterns observed by Poldirad are related to these cloud patterns. Due to the wavelength, clouds can be observed by Poldirad only at very close range. At far range only precipitation can be observed. Therefore, the term precipitation, rain patterns, or cells will be used in the following when describing radar echoes.
Figure 8a shows a maximum display from 5 February 2020 at 12:03 UTC. This kind of display gives the horizontal distribution of precipitation as well as the vertical extent of the cells. The two side views are the maximum projection through the three-dimensional volume from south to north and from west to east, respectively. Some speckles of not completely removed sea clutter are visible with reflectivity values below ca. −5 dBz. That day was classified by the EUREC4A community as being dominated by gravel type cloud patterns. The size of the rain cells are on the order of 15 km, their height is 3 to 4 km, and the distribution is random with some clustering.
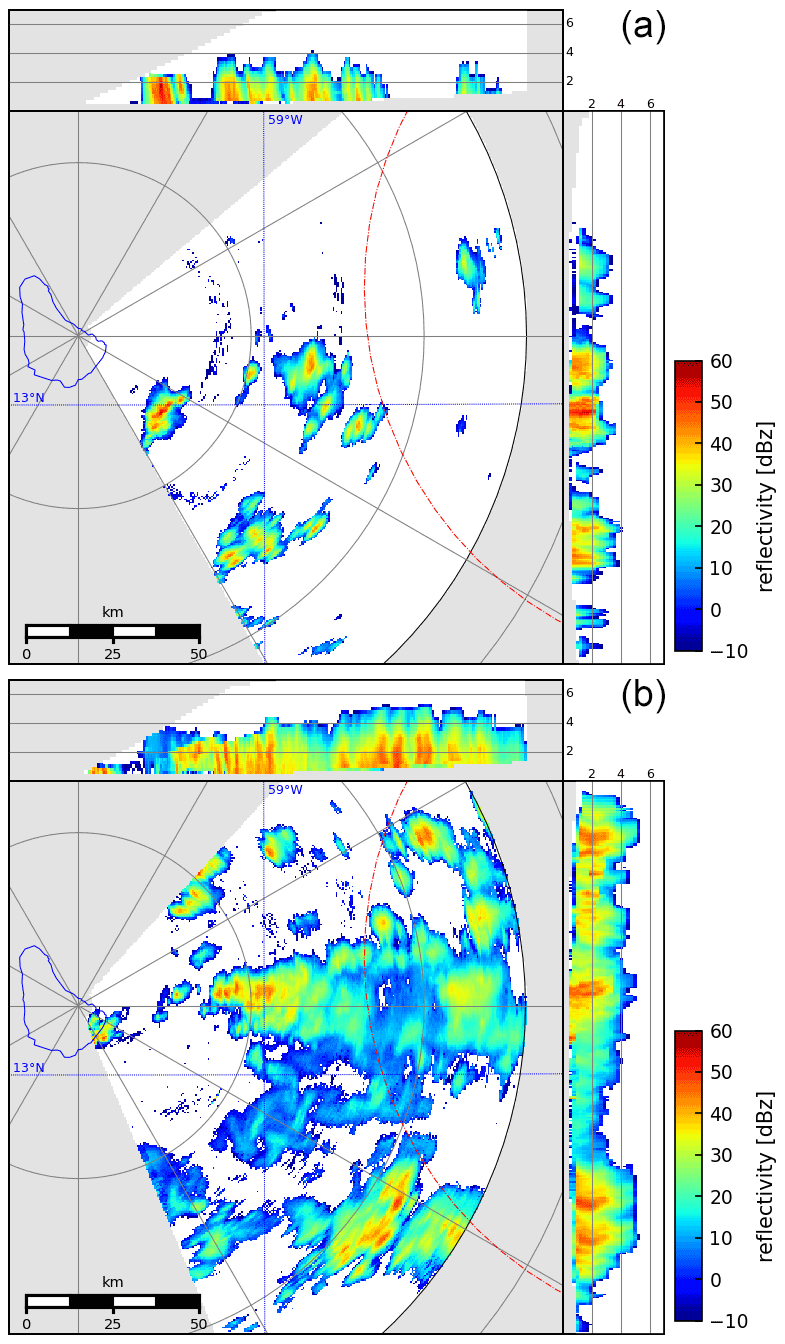
Figure 8Maximum display (for details see text) of reflectivity. Red dot-dashed line shows HALO circle pattern. Heights of side projections are in kilometers (km). (a) 5 February 2020, 12:03 UTC; (b) 11 February 2020 07:27 UTC.
On 11 February 2020 precipitation systems were larger and widespread (Fig. 8b), and they reached heights of 4 to 5 km. The precipitation patterns had a structure with multiple cores of heavier precipitation. Cloud patterns on that day were classified as flowers. With the limited view of the volume scan the whole flower pattern is not visible.
4.2 Daily accumulated precipitation and daily cycle
With long-range surveillance scans, about every 5 min daily rainfall accumulations can be generated, and the diurnal cycle of precipitation can be studied.
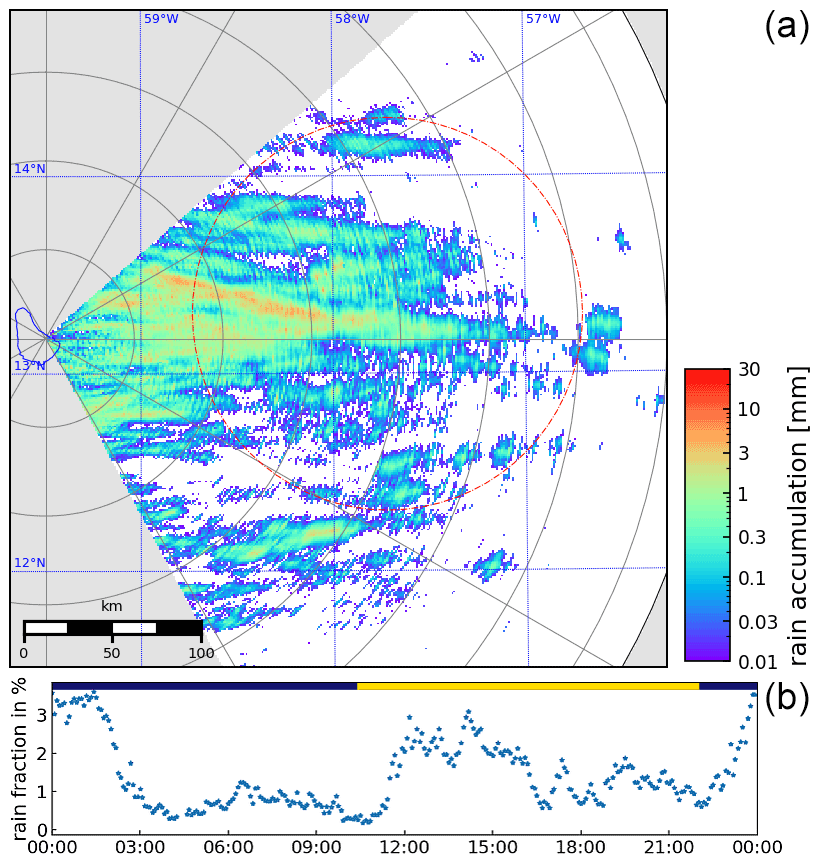
Figure 99 February 2020. (a) Daily rain accumulation; red circle denotes the HALO circle pattern. (b) Percentage of precipitation area within the HALO circle pattern; times are in UTC. Blue/yellow bar on top indicates night/day at Barbados.
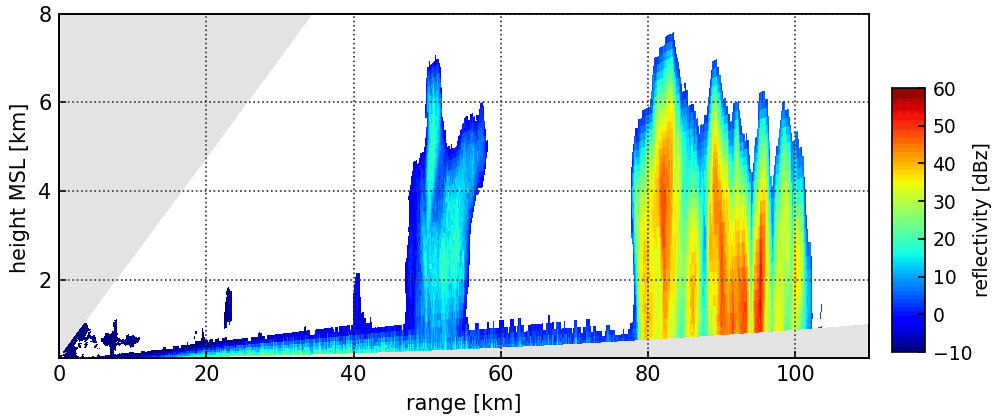
Figure 10RHI scan on 9 February 2020 at 16:19 UTC towards 71∘. Note that the shallow layer with low reflectivity is sea clutter.
Figure 9a shows the daily accumulated rainfall pattern for 9 February 2020 derived from the gridded datasets. The average daily precipitation amount within the HALO circle was 0.18 mm. Traces of individual cells can be located throughout the day. Beyond the approximate 250 km range, fewer cells are observed. Only a few cells were observed further out. This can be attributed to the vertical extent of the majority of the cells and height of the radar beam in dependence with range (see Fig. 5b). In general, stronger precipitation is observed closer to the radar where the radar beam intersects within the more intense part of the precipitation cores of the cells (see Fig. 10). In Fig. 9b the diurnal cycle of precipitation fraction within the HALO circle flight pattern (red circle in Fig. 9a) is shown. For that day, only a weak diurnal cycle of precipitation can be identified.
On 11 February the situation was different (Fig. 11): more precipitation was observed in the area. The average daily precipitation amount was 0.95 mm within the HALO circle. The cells were more widespread and more frequent. Vertical extent of the precipitation was up to approximately 4 km (Fig. 12) and thus lower than on 5 February. The rain fraction within the HALO circle shows a pronounced daily cycle. Up to 20 % was observed in the morning hours and almost no precipitation during daytime. This agrees well with the simulations and long-term observations by Vial et al. (2019).
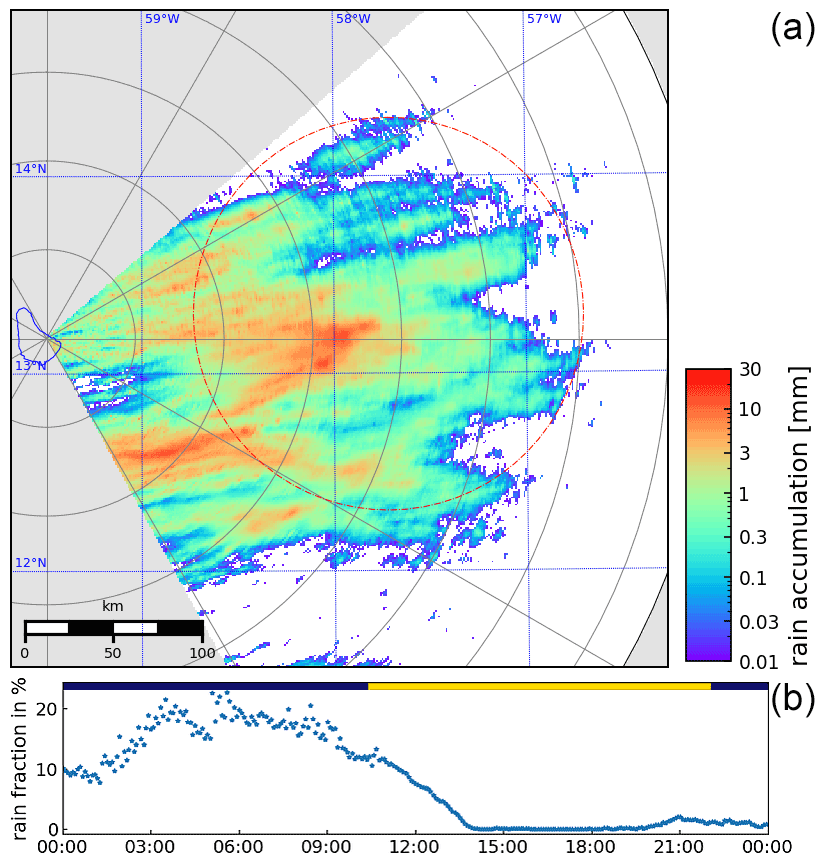

Figure 12RHI scan on 11 February 2020 at 07:30 UTC towards 86∘. Note that the shallow layer with low reflectivity is sea clutter.
4.3 Long-range reflectivity observations
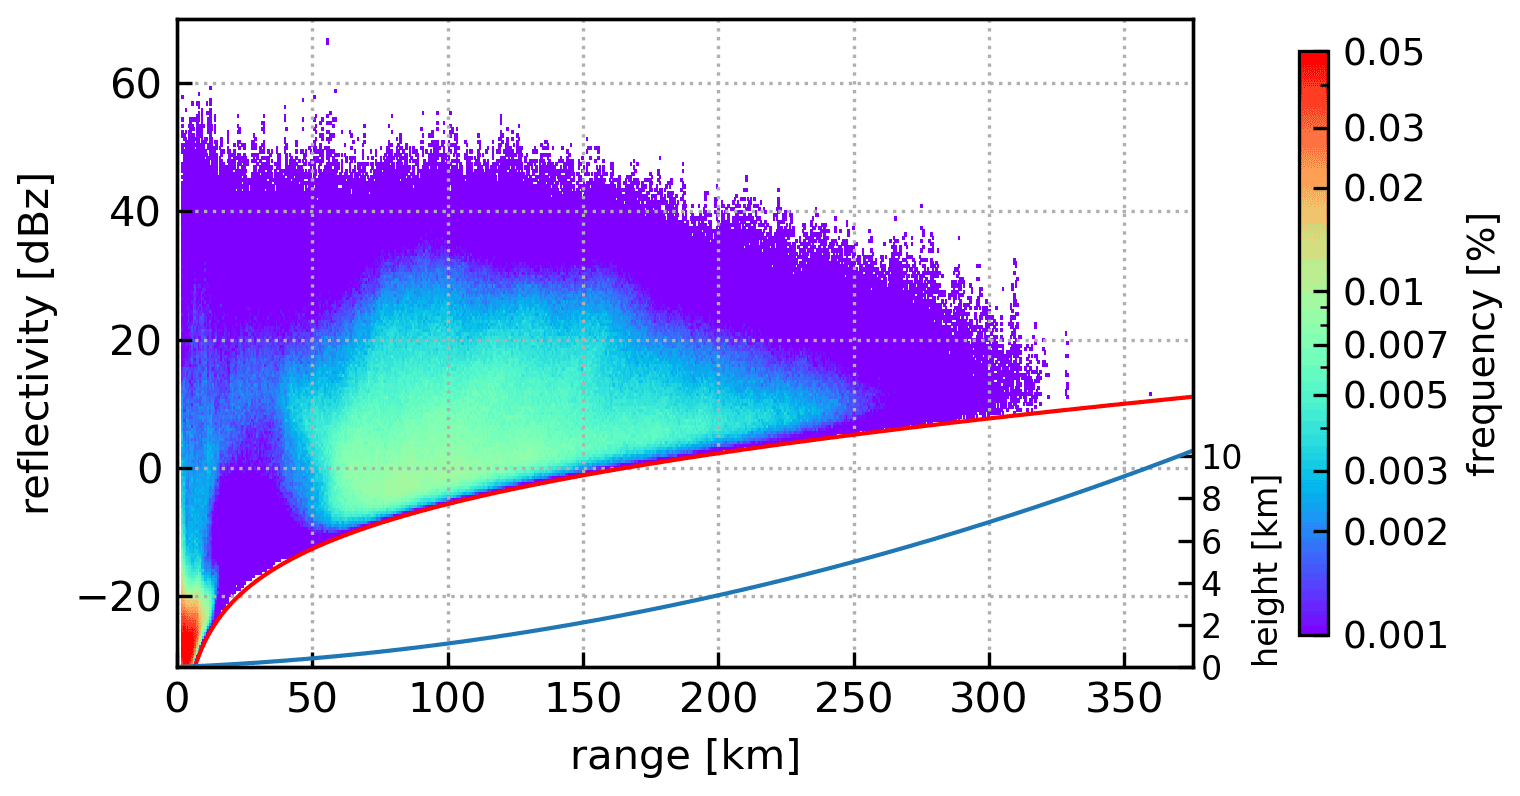
As shown above, long-range reflectivity observations are limited by a number of factors: (i) earth curvature and the height of the radar beam above ground, (ii) broadening of the radar beam and loss of horizontal and vertical resolution, and (iii) the limitations by the minimum detectable signal (MDS). In Fig. 13 we show the frequency of observed reflectivity values with range for all long-range measurements on 11 February 2020. The red line indicates MDS according to Eq. (1) with Z0 = −47.5 dBz. Sea clutter has been removed. Frequent low reflectivity values (Z < −20 dBz) at short ranges indicate non-precipitating cloud observations. The notch in the range from ca. 10 to 50 km is attributed to the masking of low-level meteorological radar echoes by sea clutter. The frequency of echoes with reflectivity above 40 dBz stays fairly constant up to about 150 km, indicating that probably most of the high reflectivity precipitation cores can be observed up to that range. At further ranges the radar beam is only partially filled with echoes since only the upper part of the cells reach partly into the radar beam. This results in reduced reflectivity values since the radar equation always assumes a completely filled measurement volume. For that day no more precipitation echoes were recorded beyond 320 km.
4.4 Vertical reflectivity distribution
Contoured frequency by altitude diagrams (CFADs) are often used to investigate vertical structures of radar observables from precipitation systems (Yuter and Houze, 1995) or to compare measurements with numerical simulations. Here we use the frequent RHI scans towards BCO or other directions to derive reflectivity CFADs. In contrast to CFADs derived from vertical pointing radars, we have to consider the range-dependent minimum detectable signal, as well as the inability to take measurements close to the surface at far ranges, the limited altitude range of RHI scans for short ranges, and the broadening of the radar beam with range (see Fig. 5).
Figure 14 shows CFADs for 11 and 15 February 2020. For the above-mentioned reasons, CFADs are split into three range sets, namely 0–20, 20–60, and 60–130 km. Only at the first range interval, shallow cumulus clouds with reflectivity values below −10 dBz are observed on both days. At longer ranges, mainly rain showers are observed on 11 February. As also seen in Fig. 12, cells did to not exceed 5 km in altitude. The height of the 0 ∘C isotherm was derived from the soundings at BCO on those days (Stephan et al., 2021).
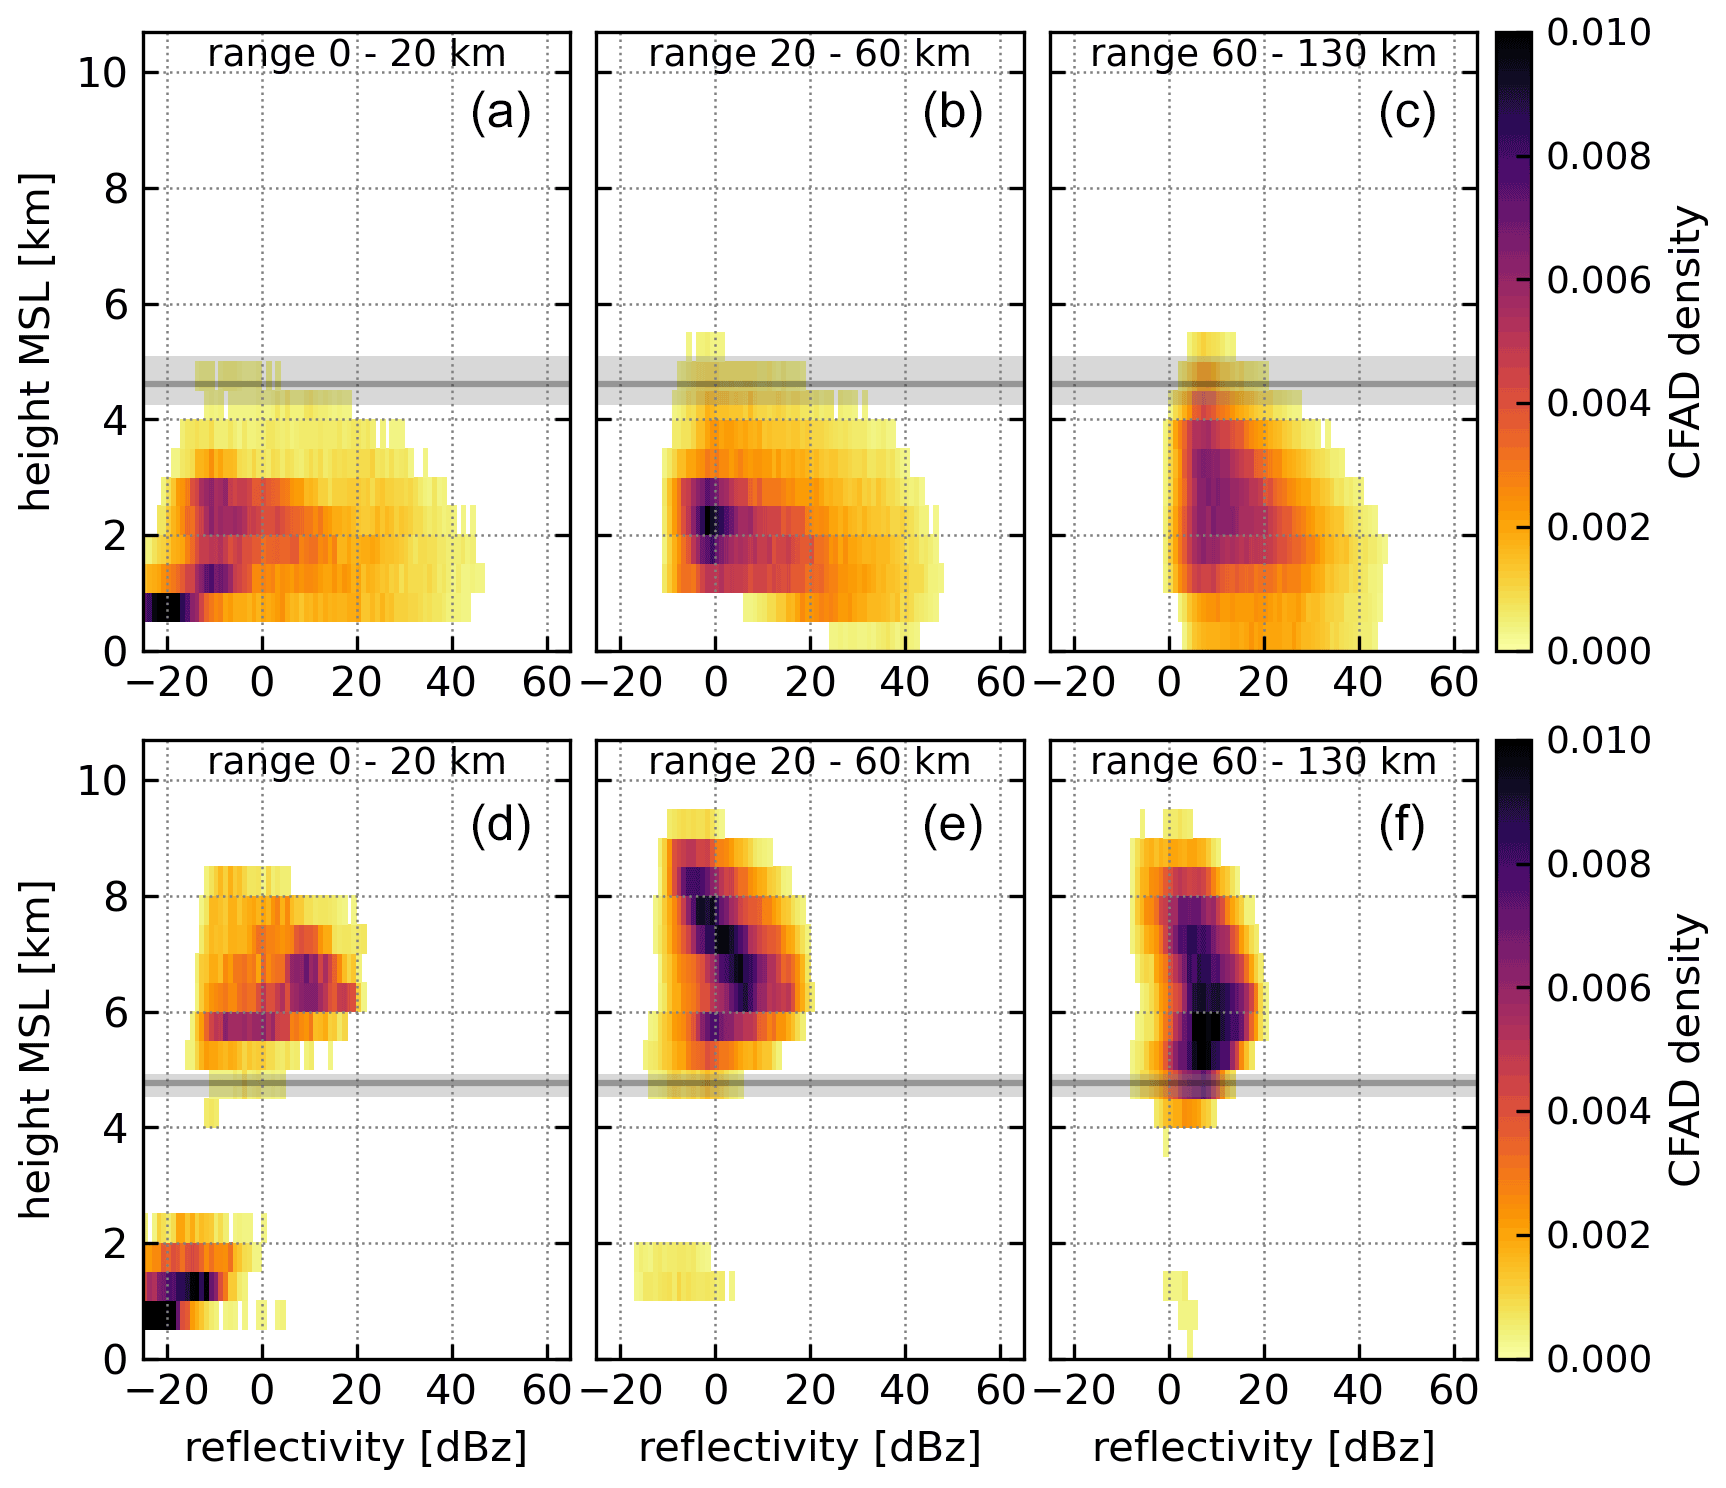
Figure 14CFADs for 11 February (a) and 15 February 2020 (b). Range intervals are 0–20, 20–60, and 60–130 km. Horizontal gray bar and line indicate height range and mean value of the 0 ∘C isotherm on those days.
On 15 February, elevated moisture transport (Villiger et al., 2021) leads to a widespread stratiform cloud layer in the altitude range 4 to 9 km (Fig. 15). The cloud layer is visible in all three CFAD range intervals. Low-level clouds are visible mainly in the short-range interval. Beam broadening at far ranges overestimates the vertical extent in both the RHI and CFADs.
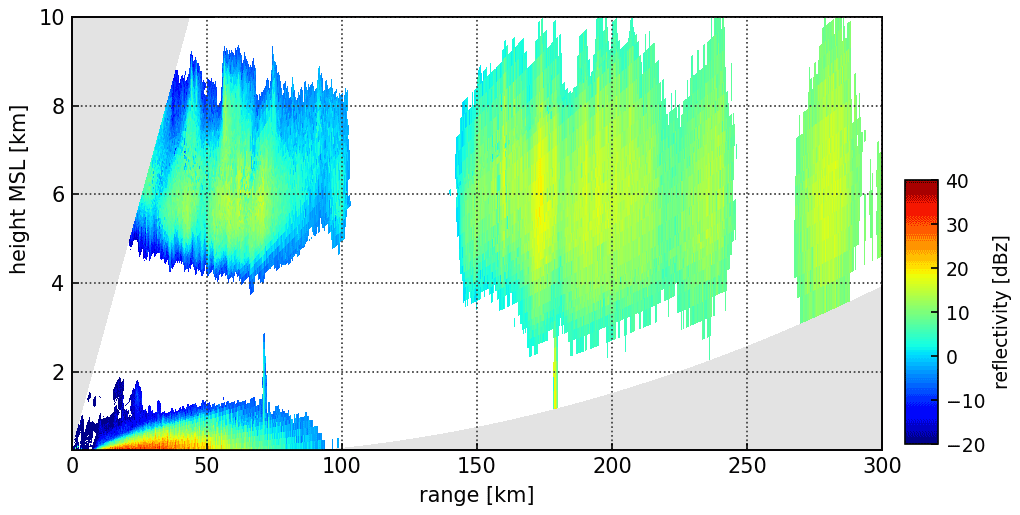
Figure 15RHI scan on 15 February 2020 at 22:40 UTC towards 105∘. Note that the shallow layer up to 95 km in range is sea clutter.
Figure 16 shows the CFAD from the HALO cloud radar (Mech et al., 2014; Ewald et al., 2019; Konow et al., 2021) while HALO was flying on its standard circle (Fig. 1) at an altitude of 11.2 km between 21:50 and 23:30 UTC. The airborne cloud radar has a high vertical resolution (ca. 31 m) and a much higher sensitivity (ca. −38 dBz at a range of 5 km) compared to Poldirad (ca. 2 dBz at a range of 120 km). The structure of the CFADs shows good agreement in the vertical extent of the cloud layer. The agreement in the maximum observed reflectivity (ca. 20 dBz) confirms in a way the calibration of Poldirad since the HALO radar has been calibrated by independent means (Ewald et al., 2019; Konow et al., 2021).
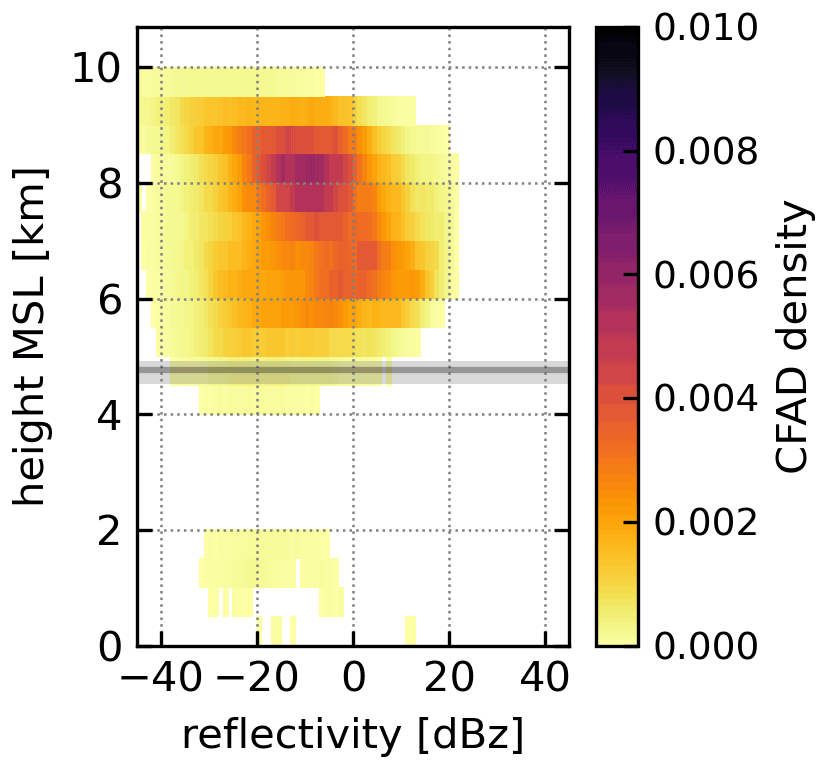
Figure 16CFAD from HALO cloud radar for 15 February at 21:50–23:30 UTC. Horizontal gray bar and line indicate height range and mean value of the 0 ∘C isotherm on that day.
All data are currently considered preliminary since calibration and data quality are based on best knowledge (see Sect. 3.4) and have not been validated so far. Raw data are available on the EUREC4A AERIS database via digital object identifier (DOI) https://doi.org/10.25326/218 (Hagen et al., 2021a). Gridded data (Sect. 3.8) are available via https://doi.org/10.25326/217 (Hagen et al., 2021b).
5.1 Poldirad level 1 raw data
Poldirad raw (level 1) data are stored in HDF5 format following the ODIM 2.0.1 specifications (Michelson et al., 2010). Additional details are given in Sect. 3.7. The data are as they have been generated in real time by the radar signal processor. A description of the radar parameters is given in Appendix B.
Data folders are named according to the type and object of the scan.PPI_PCP/ indicates PPI the long-range surveillance precipitation scan.PPI_VOL/ indicates the PPI short-range volume scan.RHI_BCO/ indicates the RHI short-range scan towards BCO.RHI_TAR/ indicates the RHI scan towards a moving target like precipitation cells or aircraft.
Files are stored in daily directories labeled YYYY/YYYY-MM-DD, with YYYY indicating the year (2020), MM the month, and DD the day.
Files are named according to date (YYYYMMDD), time (hours HH, minutes MM, seconds SS), type and object as defined above,
angles, range, and a reference number, with the following format:
POLDIRAD_TYPE_OBJECT_YYYMMDD_HHMMSS_
STARTANG_STOPANG_MAXR_REFNUM_
preliminary.hdf5,
with STARTANG / STOPANG indicating the start and stop angles
(for PPI the start/stop elevation angle is in tenths of degrees and
for RHI the start/stop azimuth angle is in degrees),
MAXR indicating the maximum scan range in kilometers,
and REFNUM indicating the internal reference number to raw data directory and file structure (SSSIIII,
where SSS indicates the storm number and IIII indicates the scan number).
5.2 Poldirad level 2 gridded data
The gridded (level 2) data are retrieved as described in Sect. 3.8 from the PPI_PCP dataset and stored in NetCDF format with
the same file name convention.
Two versions are currently available:/PPI_PCP_L2GRID/ (version 0) and /PPI_PCP_L2GRID_v1/ (version 1).
Version 1 has, in addition to the data fields of version 0, longitude and latitude of the grid points and the height of the radar beam above sea level.
Quicklooks of gridded rain rate are available:/PPI_PCP_L2GRID_QL/ (quicklooks version 0) and /PPI_PCP_L2GRID_QL_v1/ (quicklooks version 1).
After some initial delay during the first 2 weeks of the EUREC4A campaign, Poldirad was able to capture various precipitation systems during the remainder of the field campaign (starting 5 February 2020) and during summer 2020. Radar images have been used for flight planning through real-time image transfer (example shown in Fig. 17), which was available aboard research aircraft and for campaign participants on the ground. Additionally, the radar images were incorporated in real time into the Caribbean Radar Mosaic.
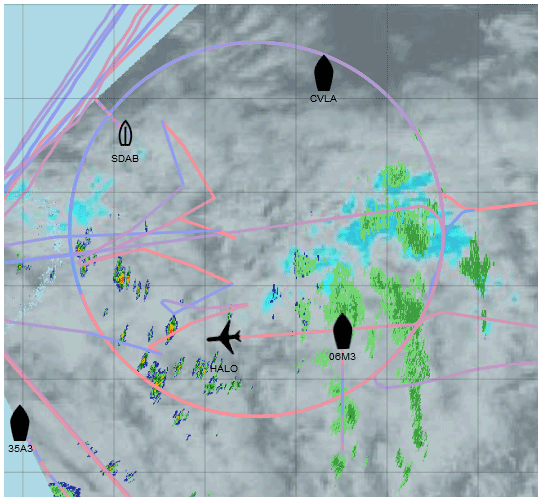
Figure 17Screenshot example of the Planet software display for 15 February 2020 at 23:48 UTC showing Poldirad image (colors from green to red), GOES-East infrared image (gray and light blue), tracks from research vessels, and the flight tracks from the German HALO (circle pattern and excursions) and the British Twin Otter aircraft (zigzag-like pattern), as well as commercial air traffic in and out of Barbados (straight diagonal lines on the upper and lower left side).
Data processing and quality control is performed by the implemented receiver and signal processor. Using dual-polarization correlation coefficient ρHV with a threshold of 0.7 proved to be a suitable parameter to eliminate contamination of radar data by sea clutter. A preliminary comparison with observations from the HALO cloud radar shows that the calibration of Poldirad is reliable; details will be the subject of further studies. Processed data are available as HDF5 files (Hagen et al., 2021a), as well as gridded reflectivity and rain rate fields (Hagen et al., 2021b).
Poldirad adds a valuable contribution to the multifaceted data gathered during the EUREC4A campaign. Preliminary analyses of reflectivity distribution show that Poldirad could capture rain cells up to a range of 250 to 300 km. The typical vertical extent of shallow rain cells is in the range of 3 to 6 km, and their size is on the order of 10 to 20 km. On 11 February a pronounced diurnal cycle as described by Vial et al. (2019) of precipitation was observed. On other days either no diurnal cycle or only a weak diurnal cycle was observed, or the radar observations did not cover the full day (cf. Fig. 7). The high temporal and spacial frequency of long-range and volume PPI scans will allow for ongoing and further detailed studies of the life cycle of shallow cumulus clouds in the trade wind region east of Barbados.
For transportation, Poldirad's antenna has to be disassembled into four panels (faintly visible in Fig. 2). Reassembling is performed with high accuracy on the ground before lifting the antenna to the pedestal. Even though the supporting structure is very rigid, it cannot be guaranteed that the antenna will be mounted in the very same shape it had on a factory antenna range in December 1984. The shape of the parabolic reflector defines the shape of the radar beam. Initial measurements show a nearly circular beam pattern with a half-power beamwidth of approximately 1∘ (see Fig. 3 in Schroth et al., 1988). Detailed measurements of the shape of the radar beam were performed in 2012 by Reimann and Hagen (2016) using the sun and an external signal source.
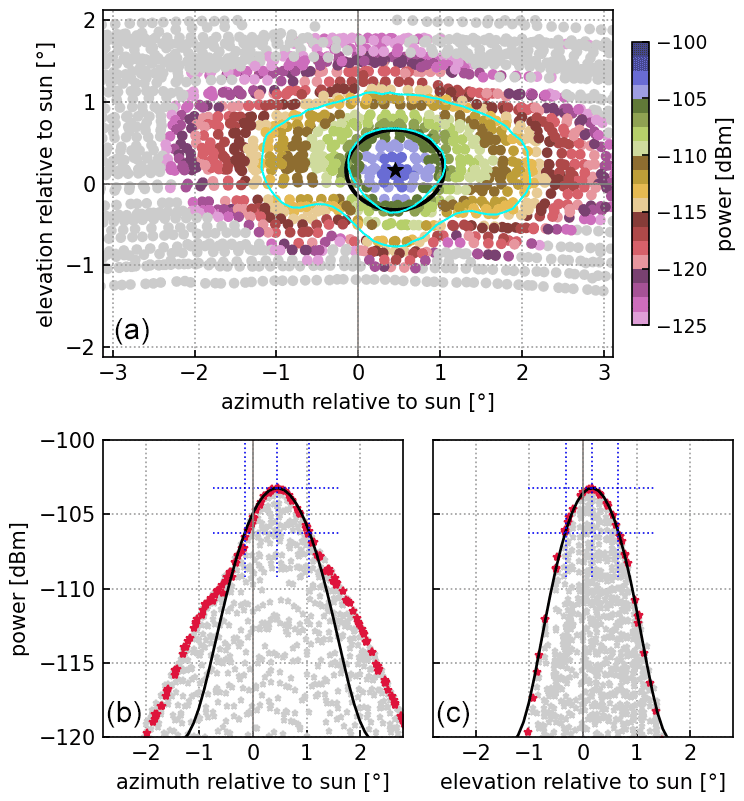
Figure A1Power received from the sun on 3 February 2020 from 13:37 until 14:29 UTC. Average sun azimuth is 132∘ and elevation is 46∘. (a) Received power; light blue lines indicate the −3 and −10 dB power isolines, and black line indicates the −3 dB power isoline from the Gaussian fit. (b) Azimuth and (c) elevation projection; red dots are within ± 0.1∘ of the beam center. For further details see text.

Figure A2Simulated effect of broadening of a circular rain cell when observed by a radar. (a) Simulated rain cell; (b) observed with a radar with beamwidth 1∘; (c) as center image, but with Poldirad beam. Range rings are shown every 5 km and radials every 2∘.
Dedicated solar scans were repeated after the setup of the radar on Barbados. Figure A1 shows the measurements on 3 February 2020 similar to Fig. 4 in Reimann and Hagen (2016). The top image shows the individual measurement points during the scan, and the azimuth and elevation angles have been corrected for high-elevation angles as described by Reimann and Hagen (2016). Maximum received power was −103.2 dBm. Using a two-dimensional least-square fit to the Gaussian shape of the main lobe (Huuskonen and Holleman, 2007) gives a half-power beamwidth of 1.2∘ in azimuth and 1.0∘ in elevation (black lines in Fig. A1). The pointing offset is 0.45∘ in azimuth and 0.17∘ in elevation, respectively (black star). The light blue lines indicate the −3 and −10 dB power isolines from the peak of the measured power. The two notches at the lower side are probably caused by the boom carrying the feed horn. The two lower images show a horizontal projection along azimuth (left) and a vertical one along elevation (right) with gray points. Red points are within ± 0.1∘ of the beam center. Black line is the shape from the least-square fit. Dotted blue lines indicate the maximum and −3 dB power as well as the beamwidth and the offset. It becomes clear that the beam shape is following the Gaussian approximation in elevation, while in azimuth a considerable deviation starts about −5 dB below the maximum power level.
While the central part of the radar beam is nearly circular, the outer part has an elliptical shape which is much wider in azimuth. The reasons for this deformation are not clear. The implication of the deformation is that observed precipitation patterns appear to be stretched in azimuthal direction. Figure A2 shows a simulated circular rain cell centered at a range of 100 km and an azimuth of 60∘ which is observed by a radar. Only the main lobe (no side lobes) has been considered in the radar simulation. Range effects, i.e., non-rectangular pulse shape, are ignored. The left image shows the “true” reflectivity pattern, and the central image shows the broadening as it would be observed by a radar having an azimuthal beamwidth of 1∘ (like most weather radars). The right image shows a Gaussian approximation (central part with beamwidth 1.2∘, outer part with beamwidth 2.3∘ with an offset of −4 dB) of the Poldirad beam (see Fig. A1, lower left). The consequence of the broad radar beam is that the size of rain cells will be overestimated, while their maximum rain rate will be underestimated. Table A1 gives an estimation for the effect on maximum reflectivity, maximum rain rate, area where reflectivity is greater 7 dBz (rain rate greater 0.1 mm h−1), and mean rain rate of the cell.
Table A1Effect of azimuthal beamwidth on a simulated rain cell.
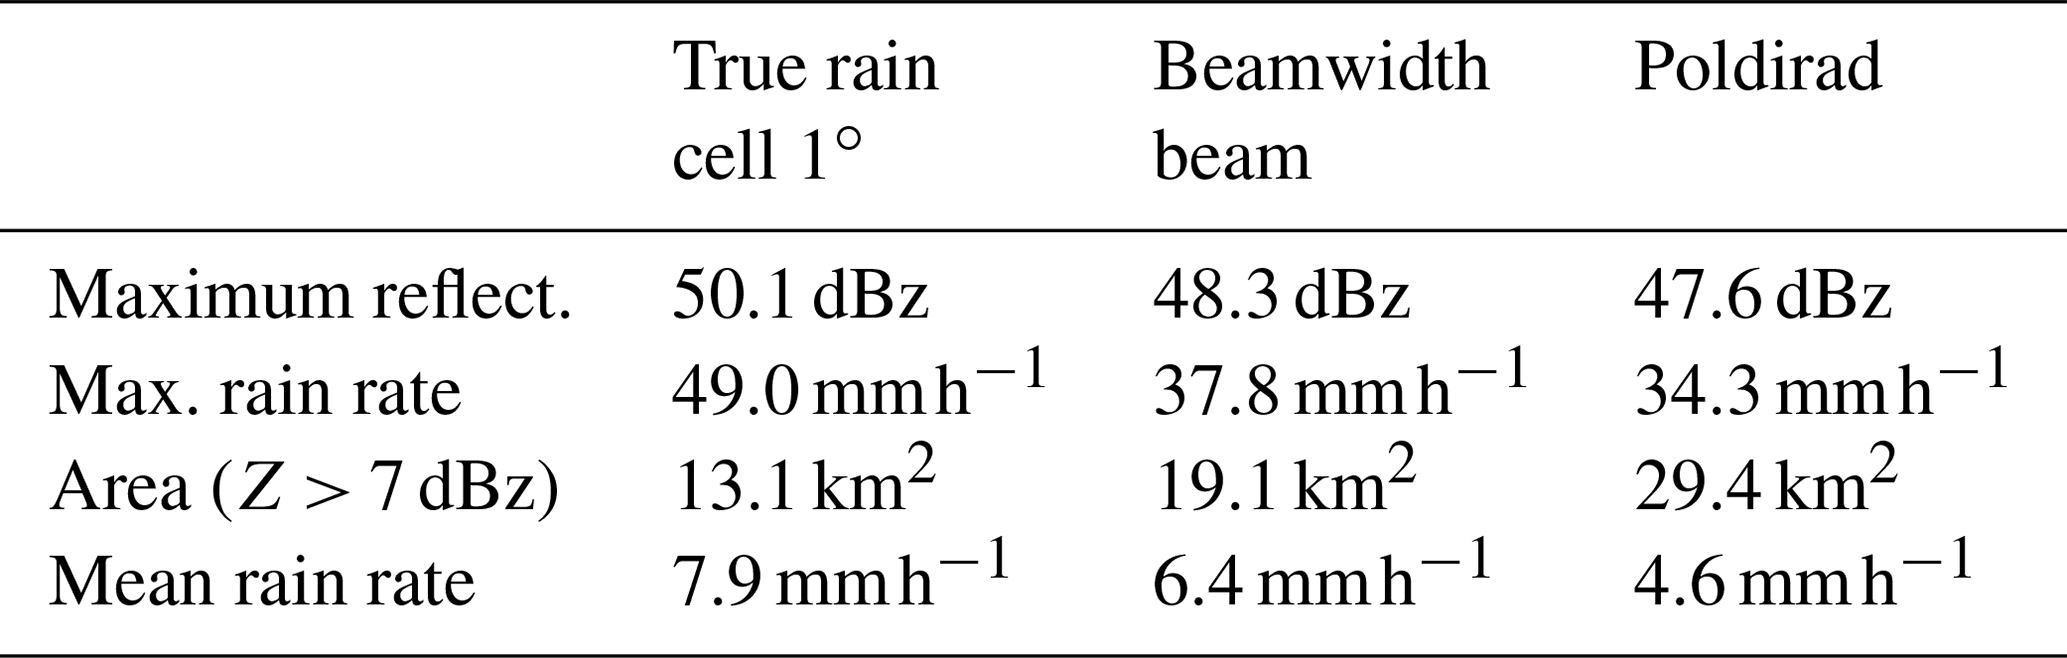
Table B1 gives a short description of radar product identifiers used in the HDF5 files. The two different polarization modes require different signal processing, and thus different radar products are generated. Physical details of radar products and their interpretation can be found in text books such as Bringi and Chandrasekar (2001).
Table B1Poldirad radar products and their HDF5 identifiers. Correlation coefficients and signal quality indices are dimensionless.

MH, FE, and SG are the lead investigators for the deployment; LO cared for all technical aspects; DF and MF provided all administrative, logistical, and scientific support on the island of Barbados. MG, JH, JR, EM, and ET supported the technical installation; JR additionally cared for the radar software refinements. GM, CK, QL, RCL, AD, DG, and KH additionally supported the measurements during EUREC4A and after the campaign.
The contact author has declared that neither they nor their co-authors have any competing interests.
Publisher's note: Copernicus Publications remains neutral with regard to jurisdictional claims in published maps and institutional affiliations.
This article is part of the special issue “Elucidating the role of clouds–circulation coupling in climate: datasets from the 2020 (EUREC4A) field campaign”. It is not associated with a conference.
We are deeply grateful to the Max Planck Institute for Meteorology, Hamburg, Germany, namely Bjorn Stevens, Lutz Hirsch, and Friedhelm Jansen for logistic support and gathering considerable financial funding by the Supporting Members of the Max Planck Society for the deployment of Poldirad at Barbados. We thank Daison Lowe and Ryan White from CIMH for their technical assistance. Samuel Estwick (Sammy) cared sedulously for electricity at the site. A large number of EUREC4A participants helped us set up the radar dish and tower on the “barn rising day”, 25 January 2020. The Barbados Meteorological Service established the internet connection during the installation phase and initiated the data transfer to the Caribbean Radar Composite.
The Supporting Members of the Max Planck Society provided a considerable amount of funding for the deployment of Poldirad at Barbados. EUREC4A is funded with support of the European Research Council (ERC), the Max Planck Society (MPG), the German Research Foundation (DFG), the German Meteorological Weather Service (DWD), and the German Aerospace Center (DLR).
This paper was edited by Helene Brogniez and reviewed by Alan Blyth and one anonymous referee.
Acquistapace, C., Coulter, R., Crewell, S., Garcia-Benadi, A., Gierens, R. T., Labbri, G., Myagkov, A., Risse, N., and Schween, J. H.: EUREC4A 's Maria S. Merian ship-based cloud and micro rain radar observations of clouds and precipitation, Earth Syst. Sci. Data Discuss. [preprint], https://doi.org/10.5194/essd-2021-265, in review, 2021. a
Albrecht, B. A., Bretherton, C. S., Johnson, D., Scubert, W. H., and Frisch, A. S.: The Atlantic Stratocumulus Transition Experiment – ASTEX, B. Am. Meteorol. Soc., 76, 889–904, https://doi.org/10.1175/1520-0477(1995)076<0889:TASTE>2.0.CO;2 1995. a
Altube, P., Bech, J., Argemí, O., and Rigo, T.: Quality control of antenna alignment and receiver calibration using the sun: adaptation to midrange weather radar observations at low elevation angles, J. Atmos. Ocean Tech., 32, 927–942, https://doi.org/10.1175/JTECH-D-14-00116.1, 2015. a
Berenguer, M., Sempere-Torres, D., Corral, C., and Sánchez-Diezma, R.: A fuzzy logic technique for identifying nonprecipitating echoes in radar scans, J. Atmos. Ocean Tech., 23, 1157–1180, https://doi.org/10.1175/JTECH1914.1, 2006. a
Bony, S., Stevens, B., Ament, F., Bigorre, S., Chazette, P., Crewell, S., Delanoë, J., Emanuel, K., Farrell, D., Flamant, C., Gross, S., Hirsch, L., Karstensen, J., Mayer, B., Nuijens, L., Ruppert, J. H., Sandu, I., Siebesma, P., Speich, S., Szczap, F., Totems, J., Vogel, R., Wendisch, M., and Wirth, M.: EUREC4A: A field campaign to elucidate the couplings between clouds, convection and circulation, Surv. Geophys. 38, 1529–1568, https://doi.org/10.1007/s10712-017-9428-0, 2017. a, b, c
Bony, S., Schulz, H., Vial, J., and Stevens, B.: Sugar, Gravel, Fish and Flowers: Dependence of mesoscale patterns of trade-wind clouds on environmental conditions, Geophys. Res. Lett., 48, e2019GL085988, https://doi.org/10.1029/2019GL085988, 2020. a
Bringi, V. N. and Chandrasekar V.: Polarimetric Doppler weather radar, Cambridge University Press, Cambridge, UK, 636 pp., https://doi.org/10.1017/CBO9780511541094, 2001. a
Ewald, F., Groß, S., Hagen, M., Hirsch, L., Delanoë, J., and Bauer-Pfundstein, M.: Calibration of a 35 GHz airborne cloud radar: lessons learned and intercomparisons with 94 GHz cloud radars, Atmos. Meas. Tech., 12, 1815–1839, https://doi.org/10.5194/amt-12-1815-2019, 2019. a, b
Fleagle, R. G.: BOMEX: An appraisal of results, Science, 179, 1079–1084, https://doi.org/10.1126/science.176.4039.1079, 1972. a
Giuli, D., Gherardelli, M., Freni, A., and Seliga, T. A.: Rainfall and clutter discrimination by means of dual-linear polarization radar measurements, J. Atmos. Ocean Tech., 8, 777–789, https://doi.org/10.1175/1520-0426(1991)008<0777:RACDBM>2.0.CO;2, 1991. a
Gourley, J. J., Tabary, P., and Parent du Chatelet, J.: Data quality of the Meteo-France C-band polarimetric radar, J. Atmos. Ocean Tech., 23, 1340–1356, https://doi.org/10.1175/JTECH1912.1, 2006. a
Hagen, M., Ewald, F., Groß, S., Oswald, L., Farrell, D., Forde, M., Gutleben, M., Heumos, J., Reimann, J., Tetoni, E., Marinou, E., Möller, G., Kiemle, C., and Li, Q.: Poldirad measurements on Barbados during EUREC4A – Raw data, Aeris [data set], https://doi.org/10.25326/218, 2021a. a, b, c
Hagen, M., Ewald, F., Groß, S., Oswald, L., Farrell, D., Forde, M., Gutleben, M., Heumos, J., Reimann, J., Tetoni, E., Marinou, E., Möller, G., Kiemle, C., and Li, Q.: Poldirad measurements on Barbados during EUREC4A – Gridded data, Aeris [data set], https://doi.org/10.25326/217, 2021b. a, b, c
Holland, J. Z. and Rasmusson, E. M.: Measurements of the atmospheric mass, energy, and momentum budgets over a 500-kilometer square of tropical ocean, Mon. Weather Rev., 101, 1, 44–55, https://doi.org/10.1175/1520-0493(1973)101<0044:MOTAME>2.3.CO;2>, 1973. a
Huuskonen, A. and Holleman, I.: Determining weather radar antenna pointing using signals detected from the sun at low antenna elevations, J. Atmos. Ocean Tech., 24, 476–483, https://doi.org/10.1175/JTECH1978.1, 2007. a, b
Kilambi, A., Fabry, F., and Meunier, V.: A simple and effective method for separating meteorological from nonmeteorological targets using dual-polarization data, J. Atmos. Ocean Tech., 35, 1415–1424, https://doi.org/10.1175/JTECH-D-17-0175.1, 2018. a
Konow, H., Ewald, F., George, G., Jacob, M., Klingebiel, M., Kölling, T., Luebke, A. E., Mieslinger, T., Pörtge, V., Radtke, J., Schäfer, M., Schulz, H., Vogel, R., Wirth, M., Bony, S., Crewell, S., Ehrlich, A., Forster, L., Giez, A., Gödde, F., Groß, S., Gutleben, M., Hagen, M., Hirsch, L., Jansen, F., Lang, T., Mayer, B., Mech, M., Prange, M., Schnitt, S., Vial, J., Walbröl, A., Wendisch, M., Wolf, K., Zinner, T., Zöger, M., Ament, F., and Stevens, B.: EUREC4A's HALO, Earth Syst. Sci. Data, 13, 5545–5563, https://doi.org/10.5194/essd-13-5545-2021, 2021. a, b, c
Kuettner, J. P. and Parker, D. E.: GATE: Report on the field phase, B. Am. Meteorol. Soc., 57, 11–30, https://doi.org/10.1175/1520-0477-57.1.11, 1976. a
Kuettner, J. P., Parker, D. E., Rodenhuis, D. R., Hoeber, H., Kraus, H., and Philander, G.: GATE: final international scientific plans, B. Am. Meteorol. Soc., 55, 711–744, https://doi.org/10.1175/1520-0477(1974)055<0711:G>2.0.CO;2, 1974. a
Marshall, J. S., Hitschfeld, W., and Gunn, K. L. S.: Advances in radar weather, Adv. Geophys., 2, 1–56, https://doi.org/10.1016/S0065-2687(08)60310-6, 1955. a
Mech, M., Orlandi, E., Crewell, S., Ament, F., Hirsch, L., Hagen, M., Peters, G., and Stevens, B.: HAMP – the microwave package on the High Altitude and LOng range research aircraft (HALO), Atmos. Meas. Tech., 7, 4539–4553, https://doi.org/10.5194/amt-7-4539-2014, 2014. a
Michelson, D. B., Lewandowski, R., Szewczykowski, M., and Beekhuis, H.: EUMETNET OPERA weather radar information model for implementation with the HDF5 file format, OPERA Working Document WD_2008_03, available at: https://www.eumetnet.eu/wp-content/uploads/2019/05/OPERA-ODIM_H5-v2.01.pdf (last access: 27 April 2021), 2010. a, b, c
Nuijens, L., Stevens, B., and Siebesma, A. P.: The environment of precipitating shallow cumulus convection, J. Atmos. Sci., 66, 1962–1979, https://doi.org/10.1175/2008JAS2841.1, 2009. a
Overeem, A., Uijlenhoet, R., and Leijnse, H.: Full-year evaluation of nonmeteorological echo removal with dual-polarization fuzzy logic for two C-band radars in a temperate climate, J. Atmos. Ocean Tech., 37, 1643–1660, https://doi.org/10.1175/JTECH-D-19-0149.1, 2020. a
Park, H. S., Ryzhkov, A. V., Zrnić, D. S., and Kim, K. E.: The hydrometeor classification algorithm for the polarimetric WSR-88D: Description and application to an MCS, Weather Forecast., 24, 730–748, https://doi.org/10.1175/2008WAF2222205.1, 2009. a
Rauber, R. M., Stevens, B., Ochs, H. T., III, Knight, C., Albrecht, B. A., Blyth, A. M., Fairall, C. W., Jensen, J. B., Lasher-Trapp, S. G., Mayol-Bracero, O. L., Vali, G., Anderson, J. R., Baker, B. A., Bandy, A. R., Burnet, E., Brenguier, J.-L., Brewer, W. A., Brown, P. R. A., Chuang, R., Cotton, W. R., Di Girolamo, L., Geerts, B., Gerber, H., Göke, S., Gomes, L., Heikes, B. G., Hudson, J. G., Kollias, P., Lawson, R. R., Krueger, S. K., Lenschow, D. H., Nuijens, L., O'Sullivan, D. W., Rilling, R. A., Rogers, D. C., Siebesma, A. P., Snodgrass, E., Stith, J. L., Thornton, D. C., Tucker, S., Twohy, C. H., and Zuidema, P.: Rain in shallow cumulus over the ocean: The RICO campaign, B. Am. Meteorol. Soc., 88, 1912–1928, https://doi.org/10.1175/BAMS-88-12-1912, 2007. a, b
Reimann, J.: On fast, polarimetric non-reciprocal calibration and multipolarization measurements on weather radars, PhD dissertation, available at: http://nbn-resolving.de/urn:nbn:de:bsz:ch1-qucosa-132088 (last access: 27 April 2021), Technische Universität Chemnitz, Chemnitz, 161 pp., 2013. a
Reimann, J. and Hagen, M.: Antenna pattern measurements of weather radars using the sun and a point source, J. Atmos. Ocean Tech., 33, 891–898, https://doi.org/10.1175/JTECH-D-15-0185.1, 2016. a, b, c, d
Ryzhkov, A., Zhang, P., Doviak, R., and Kessinger, C.: Discrimination between weather and sea clutter using Doppler and dual-polarization weather radars, in: Proceedings of the 27th General Assembly of the International Union of Radio Science (URSI), Maastricht, the Netherlands, 17–24 August 2002, available at: https://www.ursi.org/proceedings/procGA02/papers/p1383.pdf (last access: 27 April 2021), 2002. a
Saunders, P. M.: Some characteristics of tropical marine showers, J. Atmos. Sci., 22, 167–175, https://doi.org/10.1175/1520-0469(1965)022<0167:SCOTMS>2.0.CO;2, 1965. a
Schroth, A. C., Chandra, M. S., and Meischner, P. F.: A C-Band coherent polarimetric radar for propagation and cloud physics research, J. Atmos. Ocean Tech., 2, 803–822, https://doi.org/10.1175/1520-0426(1988)005<0803:ABCPRF>2.0.CO;2, 1988. a, b, c, d
Snodgrass, E. R., Di Girolamo, L., and Rauber, R. M.: Precipitation characteristics of trade wind clouds during RICO derived from radar, satellite, and aircraft measurements, J. Appl. Meteorol. Clim., 48, 464–483, https://doi.org/10.1175/2008JAMC1946.1, 2009. a, b
Stephan, C. C., Schnitt, S., Schulz, H., Bellenger, H., de Szoeke, S. P., Acquistapace, C., Baier, K., Dauhut, T., Laxenaire, R., Morfa-Avalos, Y., Person, R., Quiñones Meléndez, E., Bagheri, G., Böck, T., Daley, A., Güttler, J., Helfer, K. C., Los, S. A., Neuberger, A., Röttenbacher, J., Raeke, A., Ringel, M., Ritschel, M., Sadoulet, P., Schirmacher, I., Stolla, M. K., Wright, E., Charpentier, B., Doerenbecher, A., Wilson, R., Jansen, F., Kinne, S., Reverdin, G., Speich, S., Bony, S., and Stevens, B.: Ship- and island-based atmospheric soundings from the 2020 EUREC4A field campaign, Earth Syst. Sci. Data, 13, 491–514, https://doi.org/10.5194/essd-13-491-2021, 2021. a
Stevens, B., Farrell, D., Hirsch, L., Jansen, F., Nuijens, L., Serikov, I., Brügmann, B., Forde, M., Linne, H., Lonitz, K., and Prospero, J. M.: The Barbados Cloud Observatory: Anchoring Investigations of Clouds and Circulation on the Edge of the ITCZ. B. Am. Meteorol. Soc., 97, 787–801, https://doi.org/10.1175/BAMS-D-14-00247.1, 2016. a
Stevens, B., Bony, S., Brogniez, H., Hentgen, L., Hohenegger, C., Kiemle, C., L'Ecuyer, T. S., Naumann, A. K., Schulz, H., Siebesma, P. A., Vial, J., Winker, D. M., and Zuidema, P.: Sugar, gravel, fish and flowers: Mesoscale cloud patterns in the trade winds, Q. J. Roy. Meteor. Soc., 146, 141–152, https://doi.org/10.1002/qj.3662, 2020. a
Stevens, B., Bony, S., Farrell, D., Ament, F., Blyth, A., Fairall, C., Karstensen, J., Quinn, P. K., Speich, S., Acquistapace, C., Aemisegger, F., Albright, A. L., Bellenger, H., Bodenschatz, E., Caesar, K.-A., Chewitt-Lucas, R., de Boer, G., Delanoë, J., Denby, L., Ewald, F., Fildier, B., Forde, M., George, G., Gross, S., Hagen, M., Hausold, A., Heywood, K. J., Hirsch, L., Jacob, M., Jansen, F., Kinne, S., Klocke, D., Kölling, T., Konow, H., Lothon, M., Mohr, W., Naumann, A. K., Nuijens, L., Olivier, L., Pincus, R., Pöhlker, M., Reverdin, G., Roberts, G., Schnitt, S., Schulz, H., Siebesma, A. P., Stephan, C. C., Sullivan, P., Touzé-Peiffer, L., Vial, J., Vogel, R., Zuidema, P., Alexander, N., Alves, L., Arixi, S., Asmath, H., Bagheri, G., Baier, K., Bailey, A., Baranowski, D., Baron, A., Barrau, S., Barrett, P. A., Batier, F., Behrendt, A., Bendinger, A., Beucher, F., Bigorre, S., Blades, E., Blossey, P., Bock, O., Böing, S., Bosser, P., Bourras, D., Bouruet-Aubertot, P., Bower, K., Branellec, P., Branger, H., Brennek, M., Brewer, A., Brilouet , P.-E., Brügmann, B., Buehler, S. A., Burke, E., Burton, R., Calmer, R., Canonici, J.-C., Carton, X., Cato Jr., G., Charles, J. A., Chazette, P., Chen, Y., Chilinski, M. T., Choularton, T., Chuang, P., Clarke, S., Coe, H., Cornet, C., Coutris, P., Couvreux, F., Crewell, S., Cronin, T., Cui, Z., Cuypers, Y., Daley, A., Damerell, G. M., Dauhut, T., Deneke, H., Desbios, J.-P., Dörner, S., Donner, S., Douet, V., Drushka, K., Dütsch, M., Ehrlich, A., Emanuel, K., Emmanouilidis, A., Etienne, J.-C., Etienne-Leblanc, S., Faure, G., Feingold, G., Ferrero, L., Fix, A., Flamant, C., Flatau, P. J., Foltz, G. R., Forster, L., Furtuna, I., Gadian, A., Galewsky, J., Gallagher, M., Gallimore, P., Gaston, C., Gentemann, C., Geyskens, N., Giez, A., Gollop, J., Gouirand, I., Gourbeyre, C., de Graaf, D., de Groot, G. E., Grosz, R., Güttler, J., Gutleben, M., Hall, K., Harris, G., Helfer, K. C., Henze, D., Herbert, C., Holanda, B., Ibanez-Landeta, A., Intrieri, J., Iyer, S., Julien, F., Kalesse, H., Kazil, J., Kellman, A., Kidane, A. T., Kirchner, U., Klingebiel, M., Körner, M., Kremper, L. A., Kretzschmar, J., Krüger, O., Kumala, W., Kurz, A., L'Hégaret, P., Labaste, M., Lachlan-Cope, T., Laing, A., Landschützer, P., Lang, T., Lange, D., Lange, I., Laplace, C., Lavik, G., Laxenaire, R., Le Bihan, C., Leandro, M., Lefevre, N., Lena, M., Lenschow, D., Li, Q., Lloyd, G., Los, S., Losi, N., Lovell, O., Luneau, C., Makuch, P., Malinowski, S., Manta, G., Marinou, E., Marsden, N., Masson, S., Maury, N., Mayer, B., Mayers-Als, M., Mazel, C., McGeary, W., McWilliams, J. C., Mech, M., Mehlmann, M., Meroni, A. N., Mieslinger, T., Minikin, A., Minnett, P., Möller, G., Morfa Avalos, Y., Muller, C., Musat, I., Napoli, A., Neuberger, A., Noisel, C., Noone, D., Nordsiek, F., Nowak, J. L., Oswald, L., Parker, D. J., Peck, C., Person, R., Philippi, M., Plueddemann, A., Pöhlker, C., Pörtge, V., Pöschl, U., Pologne, L., Posyniak, M., Prange, M., Quiñones Meléndez, E., Radtke, J., Ramage, K., Reimann, J., Renault, L., Reus, K., Reyes, A., Ribbe, J., Ringel, M., Ritschel, M., Rocha, C. B., Rochetin, N., Röttenbacher, J., Rollo, C., Royer, H., Sadoulet, P., Saffin, L., Sandiford, S., Sandu, I., Schäfer, M., Schemann, V., Schirmacher, I., Schlenczek, O., Schmidt, J., Schröder, M., Schwarzenboeck, A., Sealy, A., Senff, C. J., Serikov, I., Shohan, S., Siddle, E., Smirnov, A., Späth, F., Spooner, B., Stolla, M. K., Szkółka, W., de Szoeke, S. P., Tarot, S., Tetoni, E., Thompson, E., Thomson, J., Tomassini, L., Totems, J., Ubele, A. A., Villiger, L., von Arx, J., Wagner, T., Walther, A., Webber, B., Wendisch, M., Whitehall, S., Wiltshire, A., Wing, A. A., Wirth, M., Wiskandt, J., Wolf, K., Worbes, L., Wright, E., Wulfmeyer, V., Young, S., Zhang, C., Zhang, D., Ziemen, F., Zinner, T., and Zöger, M.: EUREC4A, Earth Syst. Sci. Data, 13, 4067–4119, https://doi.org/10.5194/essd-13-4067-2021, 2021. a, b, c, d, e
Stout, G. E. and Mueller, E. A.: Survey of relationships between rainfall rate and radar reflectivity in the measurement of precipitation, J. Appl. Meteorol., 7, 465–474, https://doi.org/10.1175/1520-0450(1968)007<0465:SORBRR>2.0.CO;2, 1968. a
Trivej, P. and Stevens, B.: The echo size distribution of precipitating shallow cumuli, J. Atmos. Sci., 67, 788–804, https://doi.org/10.1175/2009JAS3178.1, 2010. a
Vial, J., Vogel, R., Bony, S., Stevens, B., Winker, D. M., Cai, X., Hohenegger, C., Naumann, A. K., and Brogniez, H.: A new look at the daily cycle of trade wind cumuli, J. Adv. Model. Earth Sy., 11, 3148–3166, https://doi.org/10.1029/2019MS001746, 2019. a, b
Villiger, L., Wernli, H., Boettcher, M., Hagen, M., and Aemisegger, F.: Lagrangian formation pathways of moist anomalies in the trade-wind region during the dry season: two case studies from EUREC4A, Weather Clim. Dynam. Discuss. [preprint], https://doi.org/10.5194/wcd-2021-42, in review, 2021. a
Vivekanandan, J., Ellis, S. M., Oye, R., Zrnić, D. S., Ryzhkov, A. V., and Straka, J.: Cloud microphysics retrieval using S-band dual-polarization radar measurements, B. Am. Meteorol. Soc., 80, 381–388, https://doi.org/10.1175/1520-0477(1999)080<0381:CMRUSB>2.0.CO;2, 1999. a
Yuter, S. E. and Houze Jr., R. A.: Three-dimensional kinematic and microphysical evolution of Florida cumulonimbus. Part II: Frequency distributions of vertical velocity, reflectivity, and differential reflectivity, Mon. Weather Rev., 123, 1941–1963, https://doi.org/10.1175/1520-0493(1995)123<1941:TDKAME>2.0.CO;2, 1995. a
- Abstract
- Introduction
- EUREC4A campaign
- Poldirad on Barbados
- Examples from Poldirad measurements
- Data availability
- Conclusions
- Appendix A: Measurement of antenna pattern
- Appendix B: Radar products
- Author contributions
- Competing interests
- Disclaimer
- Special issue statement
- Acknowledgements
- Financial support
- Review statement
- References