the Creative Commons Attribution 4.0 License.
the Creative Commons Attribution 4.0 License.
 | 20 Dec 2021
Global patterns and drivers of soil total phosphorus concentration
Xianjin He
Laurent Augusto
Daniel S. Goll
Bruno Ringeval
Yingping Wang
Julian Helfenstein
Yuanyuan Huang
Kailiang Yu
Zhiqiang Wang
Yongchuan Yang
Soil represents the largest phosphorus (P) stock in terrestrial ecosystems. Determining the amount of soil P is a critical first step in identifying sites where ecosystem functioning is potentially limited by soil P availability. However, global patterns and predictors of soil total P concentration remain poorly understood. To address this knowledge gap, we constructed a database of total P concentration of 5275 globally distributed (semi-)natural soils from 761 published studies. We quantified the relative importance of 13 soil-forming variables in predicting soil total P concentration and then made further predictions at the global scale using a random forest approach. Soil total P concentration varied significantly among parent material types, soil orders, biomes, and continents and ranged widely from 1.4 to 9630.0 (median 430.0 and mean 570.0) mg kg−1 across the globe. About two-thirds (65 %) of the global variation was accounted for by the 13 variables that we selected, among which soil organic carbon concentration, parent material, mean annual temperature, and soil sand content were the most important ones. While predicted soil total P concentrations increased significantly with latitude, they varied largely among regions with similar latitudes due to regional differences in parent material, topography, and/or climate conditions. Soil P stocks (excluding Antarctica) were estimated to be 26.8 ± 3.1 (mean ± standard deviation) Pg and 62.2 ± 8.9 Pg (1 Pg = 1 × 10¹⁵ g) in the topsoil (0–30 cm) and subsoil (30–100 cm), respectively. Our global map of soil total P concentration as well as the underlying drivers of soil total P concentration can be used to constraint Earth system models that represent the P cycle and to inform quantification of global soil P availability. Raw datasets and global maps generated in this study are available at https://doi.org/10.6084/m9.figshare.14583375 (He et al., 2021).
- Article
(3812 KB) - Full-text XML
-
Supplement
(2406 KB) - BibTeX
- EndNote


In terrestrial ecosystems, to a depth of 1 m from the land surface, most of the P is found in the soil (Zhang et al., 2021). The amount and form of P determine the supply of soil P to plants, which further regulates the structure and function of global terrestrial ecosystems (Vitousek et al., 2010; Hou et al., 2020; Elser et al., 2007; Hou et al., 2021). Moreover, the amount or total concentration of P in soils determines P concentration in all major forms in soils (Hou et al., 2018a; Turner and Engelbrecht, 2011). Therefore, it is important to determine the total concentration of P in soils, which varies by up to 3 orders of magnitude across the globe (Yanai, 1998; Augusto et al., 2010; Zhang et al., 2021). Despite the large variation in soil total P concentration, its global patterns and drivers remain poorly resolved, and improving this knowledge gap is needed to better represent the P cycle in Earth system models (Fleischer et al., 2019; Goll et al., 2017; Reed et al., 2015; Wang et al., 2015; Wieder et al., 2015; Zhang et al., 2011; Achat et al., 2016a).
Soil total P concentration is the outcome of climatic, biotic, and landscape processes interacting over time on soil parent material (Dokuchaev, 1883; Jenny, 1941; Buendía et al., 2010). Each of these factors may be characterized by a few variables; for example, climate may be characterized by mean annual temperature (MAT) and precipitation (MAP). Relationships between soil total P concentration and variables such as parent material type and P concentration, MAT, MAP, site slope, and soil organic carbon (SOC) have been reported in previous studies but mostly at local to regional scales (Brédoire et al., 2016; Cheng et al., 2018; Li et al., 2019; Porder and Chadwick, 2009; Wang et al., 2009). Few studies have quantified the relative importance of these variables for predicting soil total P concentration at a global scale (Delgado-Baquerizo et al., 2020; Augusto et al., 2017; Yang et al., 2013). Such an understanding can guide the management of the soil P supply in agroecosystems of different regions (Ringeval et al., 2017) and is crucial for both mapping soil total P concentration in natural terrestrial ecosystems (Reed et al., 2015) and simulating ecosystem functioning (Achat et al., 2016a).
While each soil-forming factor can determine soil total P concentration, the roles of some factors (e.g., climate and vegetation) are less understood than other factors (e.g., parent material and soil age). Since P in soil is derived mainly from parent materials, the control of parent material on soil total P concentration has been well recognized (Augusto et al., 2017; Porder and Ramachandran, 2013). Soil chronosequences provide a unique opportunity to isolate the effect of soil age from other soil-forming factors on soil P dynamics and have shown that soil age negatively impacts soil total P concentration (Wardle et al., 2004; Delgado-Baquerizo et al., 2020; Vitousek et al., 2010; Walker and Syers, 1976). Due to climate change, there is an increasing interest in how climate impacts soil total P concentration (Augusto et al., 2017; Vitousek and Chadwick, 2013; Hou et al., 2018a). Yet the effects of climate, vegetation, and topography on soil total P concentration remain largely unknown. Recently, Delgado-Baquerizo et al. (2020) surveyed 32 ecosystem properties, including soil total P concentration, in 16 soil chronosequences globally. They found that climate, vegetation, topography, and soil age together explained only about 60 % of the variation in soil total P concentration, despite examining 30 predictors and considering all possible interactions among predictors. This finding reflects our incomplete understanding of the controls of soil total P concentration.
Several pressing global issues, such as mitigating climate change, increasing food security, and reducing nutrient runoff to bodies of water, rely on accurate soil P maps (Alewell et al., 2020; Ringeval et al., 2017; Beusen et al., 2015; Wang et al., 2010). While several maps of soil total P concentration have been produced (Viscarra Rossel and Bui, 2016; Ballabio et al., 2019; Hengl et al., 2017a; Delmas et al., 2015), to our knowledge, there are only two published maps of soil total P concentration in natural terrestrial ecosystems (Shangguan et al., 2014; Yang et al., 2013). These two maps have been used to explore global patterns of soil P supply (Yang et al., 2013), to estimate P limitation on future terrestrial C sequestration (Sun et al., 2017), and as baseline information to quantify P supply in agricultural ecosystems (Ringeval et al., 2017). They are also used frequently in land surface models to benchmark soil P modules (Yang et al., 2014; Goll et al., 2012). However, the two maps may suffer from large uncertainties due to the limited numbers of predictors used and/or low spatial coverage of global soils. First, for example, Yang et al. (2013) mapped soil total P concentration based only on parent material and soil chronosequence measurements. The map by Shangguang et al. (2014) was based on a database that had poor coverage of many parts of the world (e.g., high latitudes, Africa, South America). Second, both maps only focus on the surface layers of soils, though subsoils are known to contribute to the P nutrition of plants and P leaching to groundwater (Rodionov et al., 2020; Andersson et al., 2013).
To address these issues, we constructed a global database of total P concentration of 5275 (semi-)natural soils from 761 published studies. We defined (semi-)natural ecosystems as ecosystems without any documented significant anthropogenic activities such as tillage, fertilization, and heavy grazing. We then used random forest algorithms to quantify the relative importance of soil-forming variables for predicting soil total P concentration and further predicted it at the global scale. In our predicted map, we did not remove cropland or other heavily influenced areas (e.g., cities and roads), so the predicted map represents a potential natural background without direct anthropogenic influence. With our enlarged dataset and our map of global soil P distribution, we addressed the following research questions: (1) which factors are the most important for predicting the spatial variation in soil total P concentration in the top 1 m of soil? (2) How does soil total P concentration differ among regions and soil layers? (3) How large is the global total P stock in the top 1 m of soil?
2.1 Data source and processing
Given massive measurements of soil total P concentration in the literature, it is practically infeasible to collect all the measurements in the literature. Therefore, we collected soil total P concentration measurements in (semi-)natural terrestrial ecosystems mainly from existing global or regional databases, as well as from literature with a focus on the underrepresented regions identified in global databases, to ensure a good coverage of global terrestrial ecosystems. We defined (semi-)natural ecosystems as ecosystems without any documented significant anthropogenic activities such as tillage, fertilization, and heavy grazing. Forests with a stand age greater than 10 years were considered (semi-)natural ecosystems. We carefully checked the description of soil sampling in every cited paper for any anthropogenic activities such as tillage, fertilization, and heavy grazing and excluded such samples. Despite our efforts to exclude soils affected by anthropogenic activities, some soils in our database might be influenced by undocumented anthropogenic activities (e.g., P fertilization in reforested lands), particularly in western Europe and the eastern USA (e.g., De Schrijver et al., 2012). We compiled the database in four steps, which are described as follows.
First, we searched existing global or regional databases that may include soil total P concentration measurements in (semi-)natural ecosystems in the Web of Science using keywords “global OR terrestrial OR meta-analysis” AND “soil phosphorus” NOT “crop OR agriculture” in the topic search field. This search returned 714 papers up to 15 September 2020. After excluding site-level studies and studies with artificial treatments (e.g., treatment with fertilizer, elevated temperature, or elevated CO2), 163 papers were retained. We then checked the main text and the supplementary files, if available, of the 163 papers to identify databases with soil total P concentration measurements. Seven databases with soil total P measures from seven studies were selected. As observations in two databases (i.e., Li et al., 2014; Xu et al., 2013) were included in another database (i.e., Wang et al., 2021), we finally used five databases (i.e., Wang et al., 2021; Hou et al., 2020, 2018b; Deng et al., 2017; Augusto et al., 2017) and found 2591 observations in this step, as described in detail in Table S1 in the Supplement.
Second, we used “soil phosphorus” as keywords to search global or regional databases stored in public data repositories on 10 October 2020, including Figshare (https://figshare.com/categories/Earth andEnvironmental Sciences/33, last access: 15 December 2021), Earthdata (https://earthdata.nasa.gov/, last access: 15 December 2021), PANGAEA (https://www.pangaea.de/, last access: 15 December 2021), data.world (https://data.world/, last access: 15 December 2021), Dryad (https://datadryad.org/stash/, last access: 15 December 2021), and Zenodo (https://zenodo.org/, last access: 15 December 2021). We firstly screened the databases by titles and then picked out 80 potentially useful databases which were checked further by looking into the databases. There were nine databases with soil total P concentration in (semi-)natural terrestrial ecosystems. Among the nine databases, five (Ji et al., 2018; Tipping et al., 2016; McGroddy, 2012; Baribault et al., 2012; Cross, 2013) were excluded, due to a lack of specific site coordinates (i.e., longitude and latitude), which are needed to fill missing values of predictors from their global maps. In this step, 210 observations from four databases (i.e., Adams et al., 2020; Deiss et al., 2018; Yan et al., 2018; Gama-Rodrigues et al., 2014) were collected.
Third, we included 1693 measurements of soil total P concentration in a global database of soil extractable P concentration (Hou et al., unpublished) and 262 measurements of soil total P concentration in a global database of soil P fractions (He et al., unpublished). Original data sources of the two databases are given in Text S1 in the Supplement. After step 3, we combined measurements collected in steps 1–3 and deleted 22 duplicated ones (i.e., measurements with the same site coordinates and soil total P concentration), resulting in a total of 4734 site-level measurements of soil total P concentration from the 11 databases listed in Table S1.
Fourth, we searched additional soil total P concentration measurements from underrepresented regions identified in steps 1–3 from the Web of Science using keywords of “soil phosphorus” along with the keywords of the underrepresented regions (listed in detail in Table S2). According to the criteria above, we only collected soil total P concentration measurements in (semi-)natural terrestrial ecosystems. In this step, we collected 541 additional site-level measurements of soil total P concentrations from 60 additional papers (Table S2, Text S1).
Following these steps, our database included 5275 measurements of soil total P concentration at 1894 sites from 761 studies (Text S1 and Fig. S1), with 4536 measurements in the top 30 cm of soil and 739 measurements in deeper soil (depth > 30 cm). Besides soil total P concentration and site coordinates, we also included climate variables (i.e., MAT and MAP), vegetation type, and soil physiochemical properties (e.g., SOC, soil clay and sand contents, soil pH) in our database whenever available.
Table 1Summary of training data used to predict soil total P concentration. P10 and P90 indicate the percentile ranks of 10 % and 90 %.

MAT: mean annual temperature; MAP: mean annual precipitation; SOC: soil organic carbon; NPP: net primary production. a PFL: proportion from the literature. b PFGM: proportion from the gridded map.
Soil total P concentration is thought to be influenced by five soil-forming factors, which are parent material, climate, vegetation productivity, topography, and soil age (Delgado-Baquerizo et al., 2020; Jenny, 1941; Dokuchaev, 1883). Four of the five factors were directly considered here (Table 1): parent material, climate (i.e., mean annual temperature (MAT), mean annual precipitation (MAP), and biome), vegetation (i.e., net primary production (NPP)), and topography (e.g., slope and elevation). As soil age was rarely reported, we used USDA (United States Department of Agriculture) soil orders as a proxy for age with three classes: slightly, intermediately, and strongly weathered (Yang et al., 2013; Smeck, 1985). Among the 12 USDA soil orders, Entisols, Inceptisols, Histosols, Andisols, and Gelisols are classified as slightly weathered soils. Alfisols, Mollisols, Aridisols, and Vertisols are classified as intermediately weathered soils. Oxisols, Ultisols, and Spodosols are classified as strongly weathered soils (Yang et al., 2013; Smeck, 1985). Moreover, we have classified each soil in our database according to soil types of the World Reference Base for Soil Resources (WRB) (Table S3). We extracted the WRB soil type of each site from a global WRB soil type map (Hengl et al., 2017b) based on geographical coordinates.
In addition to predictors of soil total P concentration related to soil-forming factors, we collected information about the properties of the soils (e.g., soil organic carbon (SOC), soil pH, soil clay content (Clay) and soil sand content (Sand), and soil depth (Depth); Table 1). These soil properties were used as additional predictors. We extracted predictors from each original publication when available. In cases where information on predictors was not reported, we extracted the missing data from gridded datasets (Table S3) based on the geographical coordinates of the measurement sites.
In the random forest model, correlated predictors can be substituted for each other so that the importance of correlated predictors will be shared, making the estimated importance smaller than the true value (Strobl et al., 2008). Thus, we did not include soil total nitrogen content as it is correlated with SOC (), nor did we include the aridity index as it is strongly correlated with MAP (). We also did not include variables that were rarely reported in the referenced studies (e.g., soil extractable aluminum and iron concentrations).
2.2 Statistical modeling
Among the 5275 soil total P measurements, there were 15 extremely high values (> 4000 mg kg−1) (Fig. 1b). These high values were likely derived in exceptional geological contexts (Porder and Ramachandran, 2013) or special soils (e.g., very young volcanic soils). We reported these extremely high values while summarizing the database, for example, in Tables 2 and 3. However, we excluded these 15 measurements from model training and correlation analyses to avoid their possibly large influences on the overall relationships between soil total P concentration and other variables.
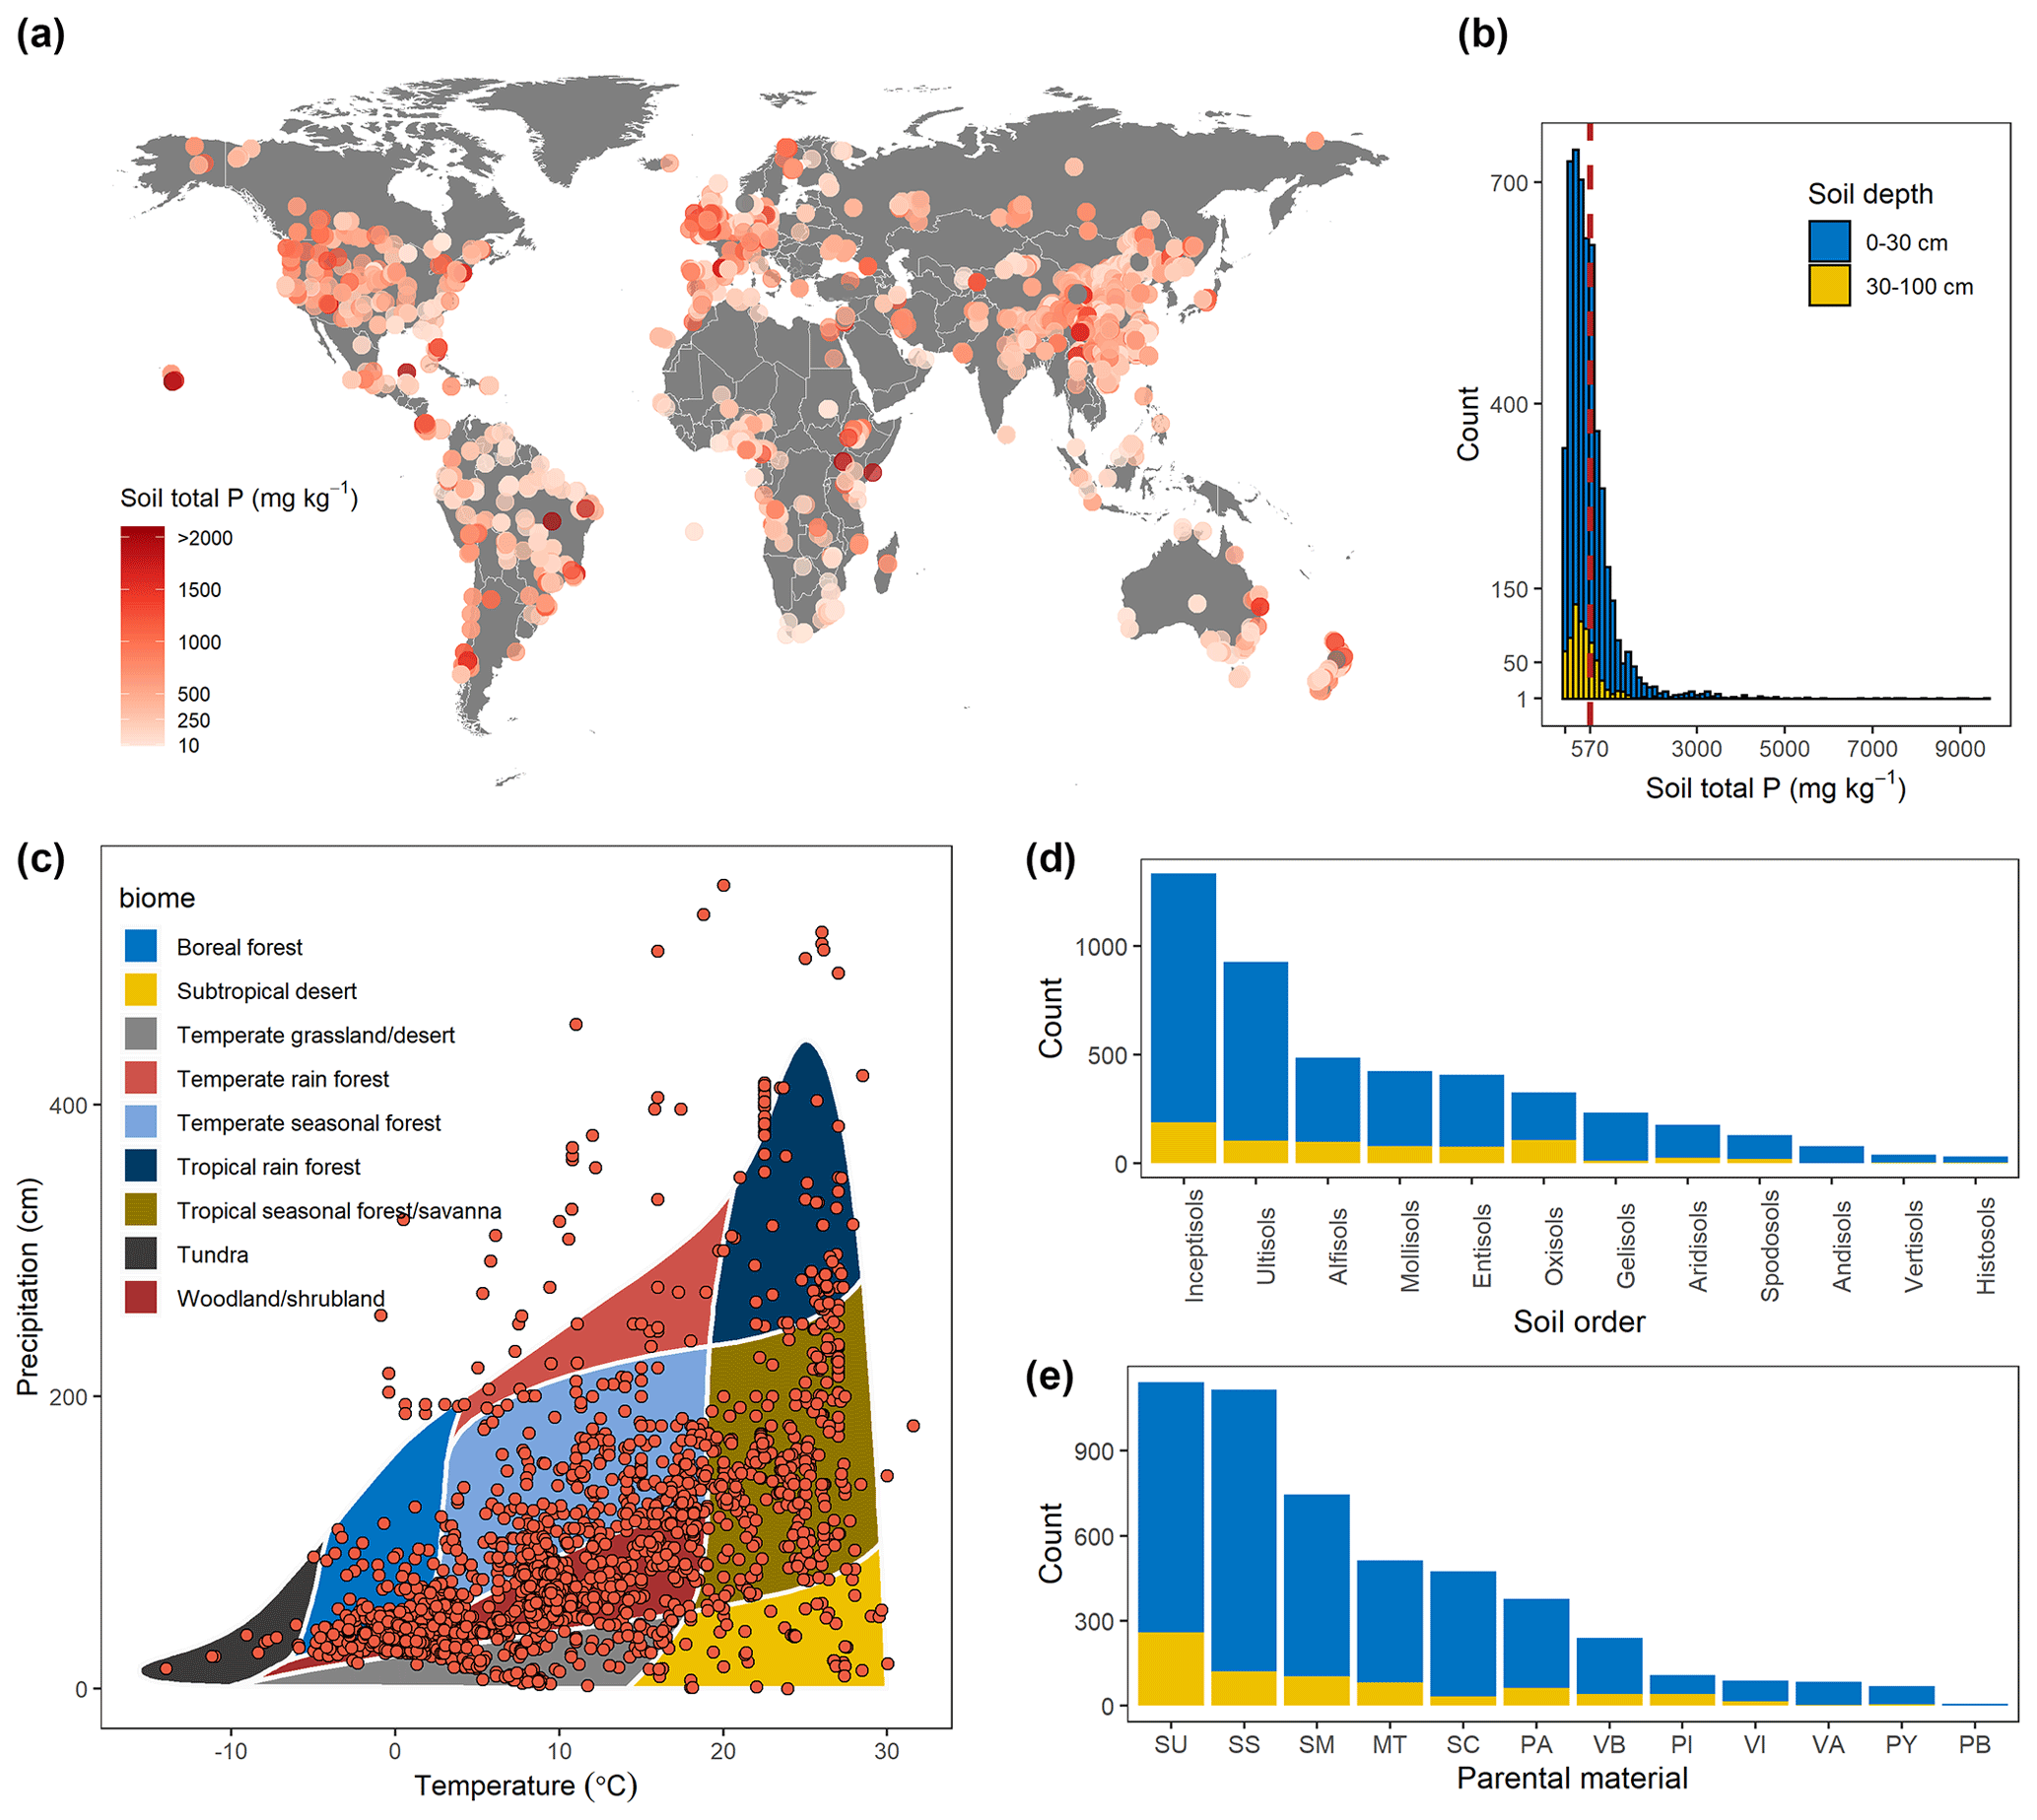
Figure 1The distribution of our site-level training data. The database contains 5275 observations (a, b) covering all major terrestrial biomes (c), 12 soil orders (d), and 12 parent materials (e). The dashed red line in panel (b) indicates the arithmetic mean of the soil total P concentration (570 mg kg−1). The abbreviations in panel (e) represent the following: SU, unconsolidated sediments; SS, siliciclastic sedimentary; SM, mixed sedimentary; MT, metamorphics; SC, carbonate sedimentary; PA, acid plutonic; VB, basic volcanic; PI, intermediate plutonic; VI, intermediate volcanic; VA, acid volcanic; PY, pyroclastics; PB, basic plutonic.
Table 2Soil total P concentration (mg kg−1) in natural ecosystems for major biomes at 0–30 and 0–100 cm depth. Results are based on our site-level database. P10, P25, P75, and P90 indicate the percentile ranks of 10 %, 25 %, 75 %, and 90 %.
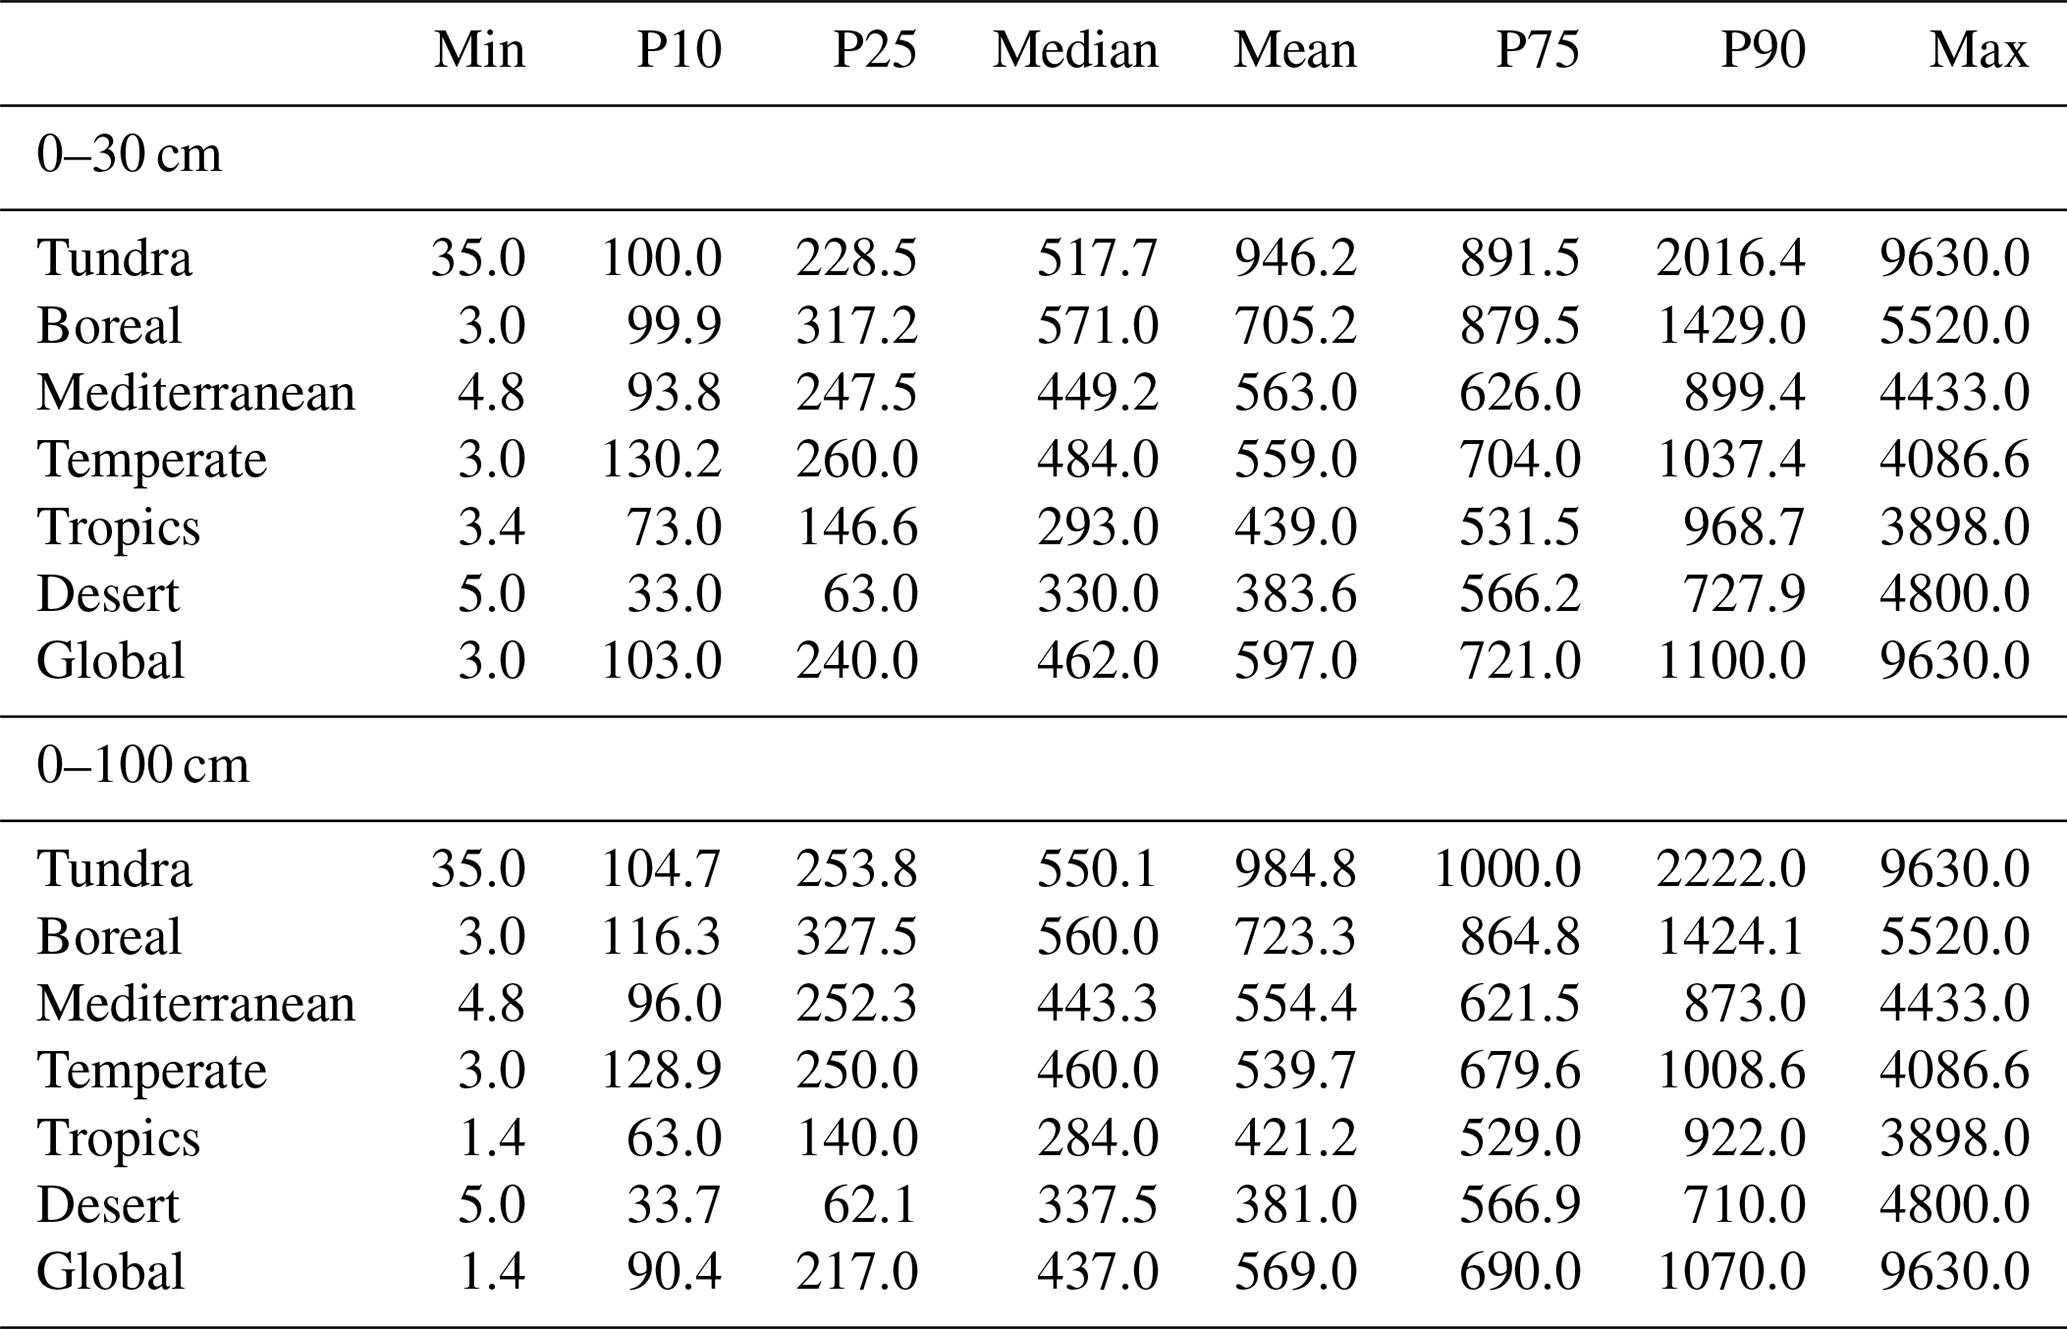
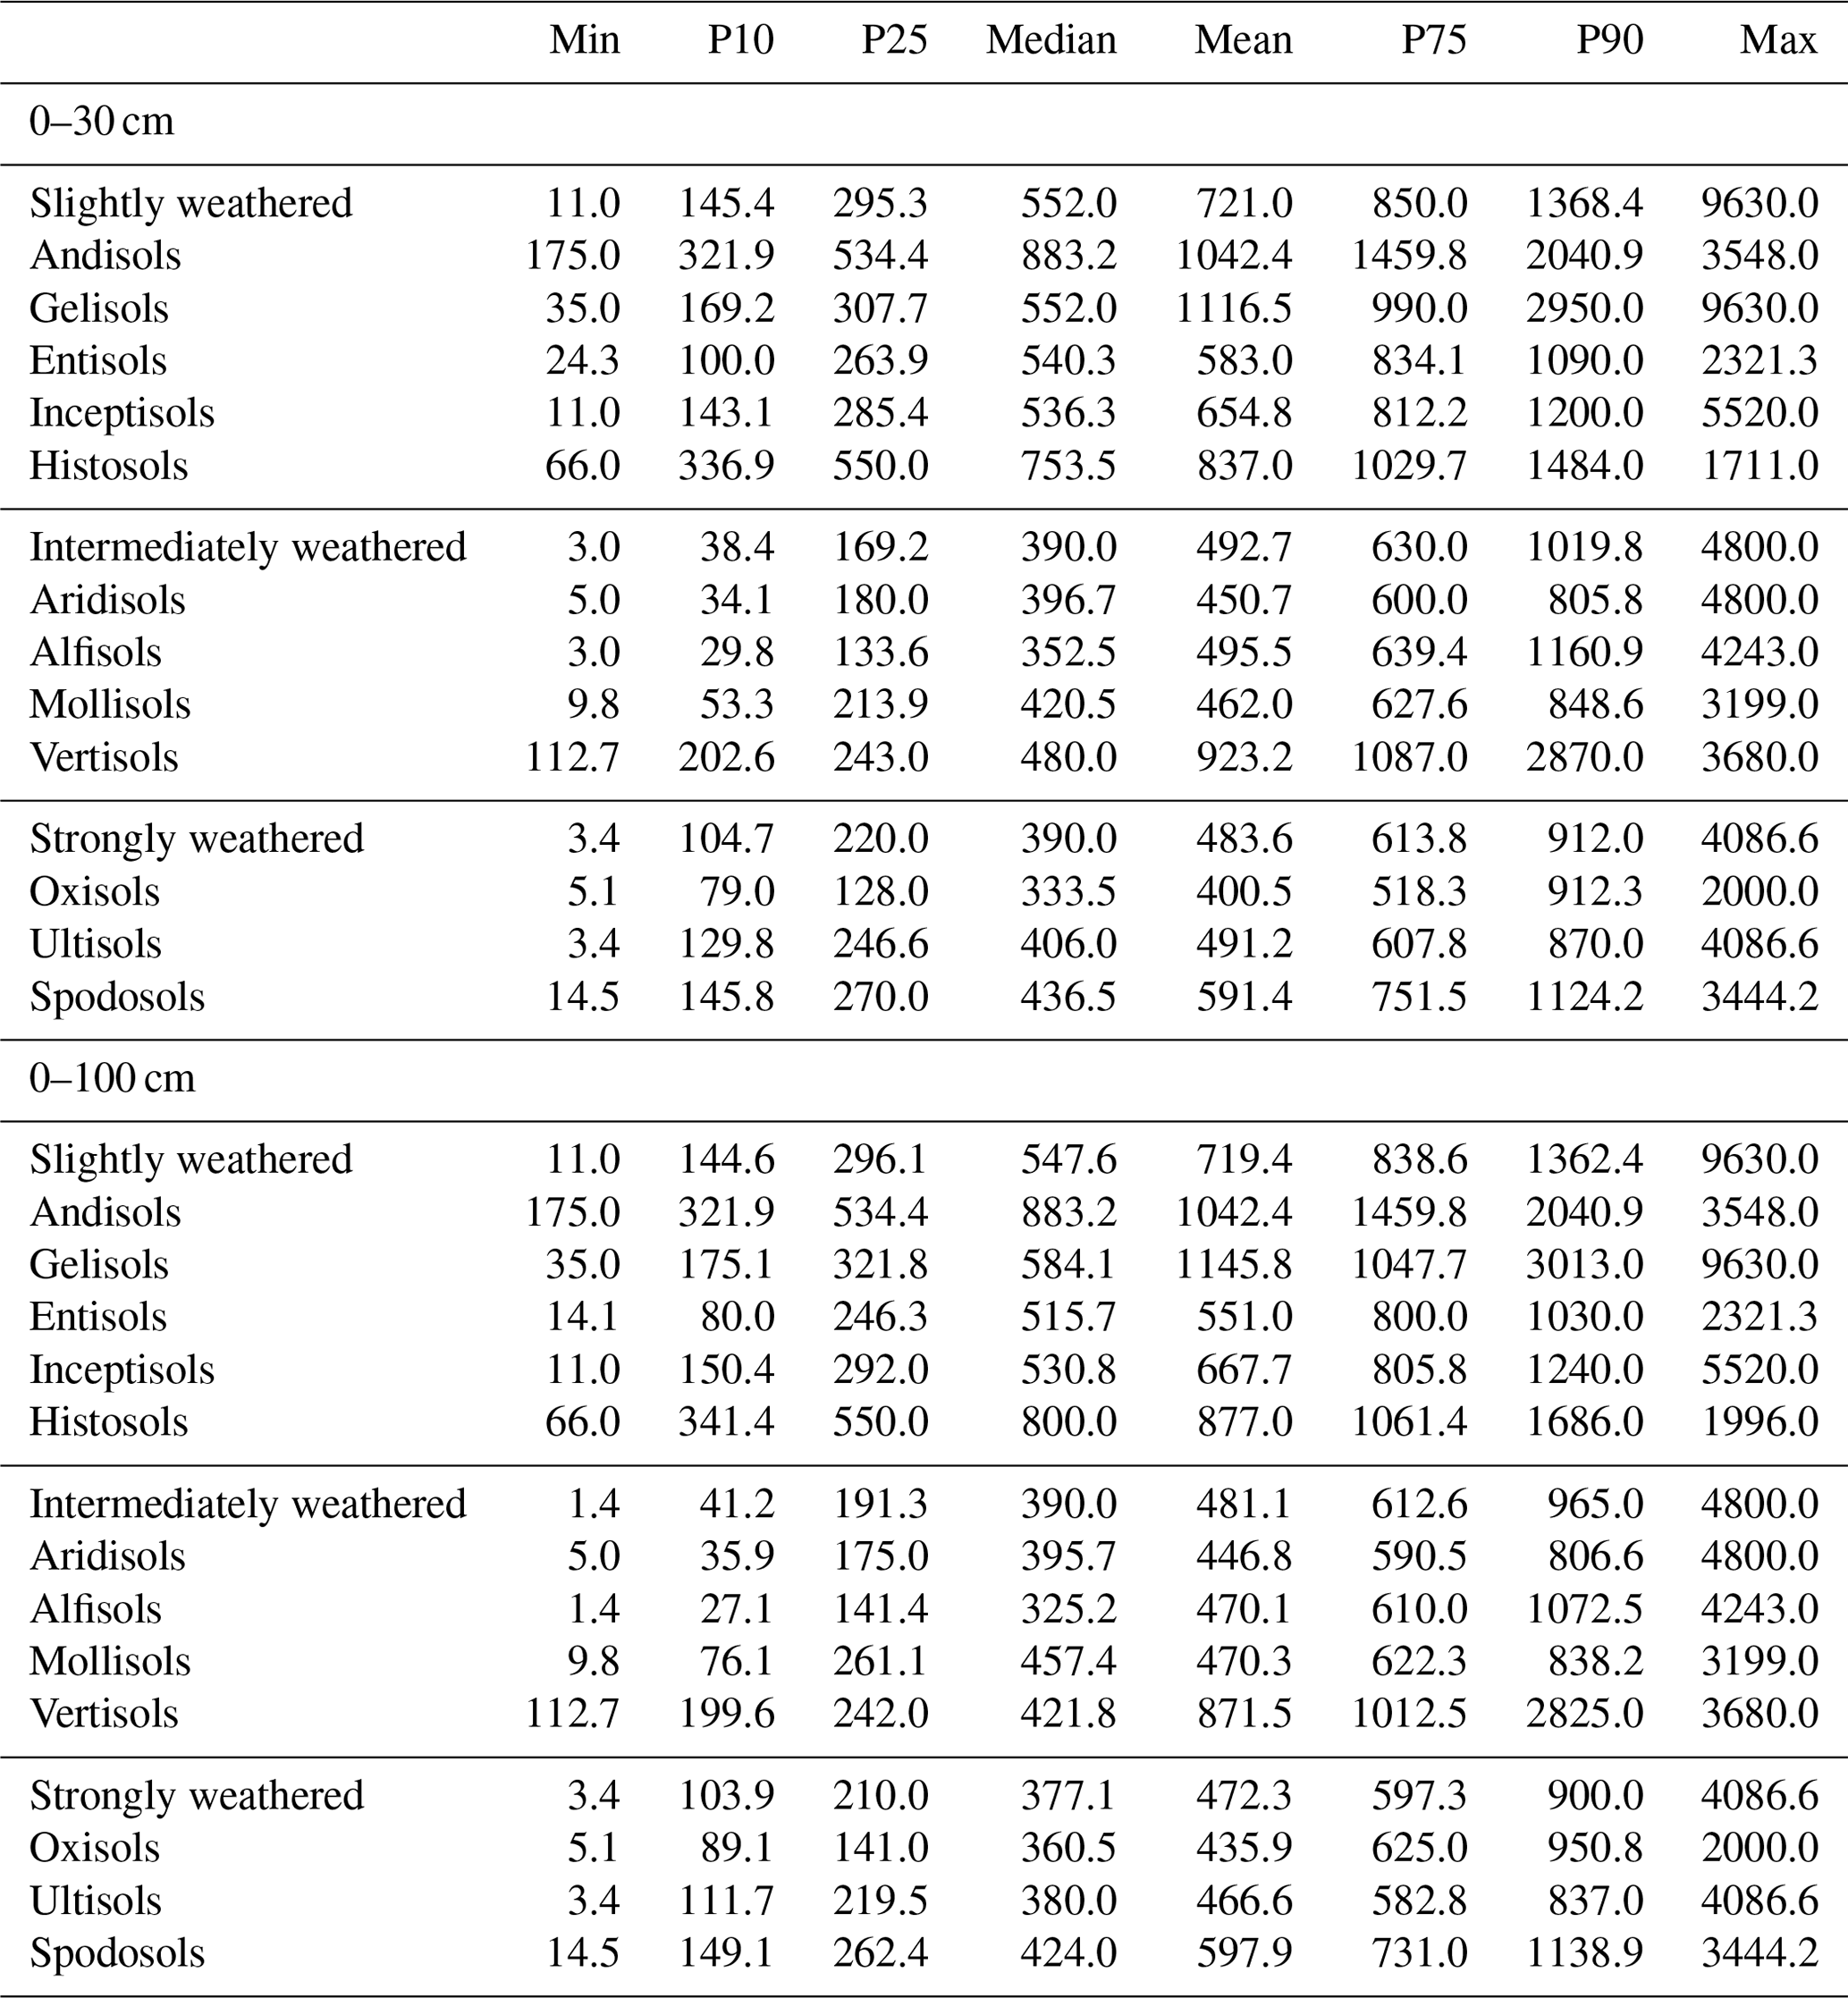
Table 3Soil total P concentration (mg kg−1) in 12 USDA soil orders and three weathering stages at 0–30 and 0–100 cm depth. Results are based on our database. P10, P25, P75, and P90 indicate the percentile ranks of 10 %, 25 %, 75 %, and 90 %.
We compared a suite of algorithms against the aforementioned 13 predictors which included three generalized linear models: a cubist model, a boosted tree model, and a random forest model (Table S4). Model performance was compared in terms of R2 and root mean square error (RMSE) (Malone et al., 2017). A 5-fold cross-validation method was used to evaluate the performance of the models. In this method, the whole dataset was randomly split into five folds, each of which contained 20 % of the data. One fold of data was used as test data, while the other four folds were used as training data. Then another fold of data was used as test data and the remaining ones as training data and so on and so forth for a total of five times. Averages of five sets of R2 and RMSE were used as the model R2 and RMSE, respectively. Based on the 5-fold cross-validation method, the random forest algorithm performed the best (R2=0.65) among all five algorithms (Table S4) and was therefore selected for follow-up analyses. The 5-fold cross-validation was performed using the R package “caret” (v. 6.0-86) (Kuhn, 2020). Random forest analysis was performed with the R package caret by applying the embedded R package “randomForest” version 3.1 (Liaw and Wiener, 2002) with an automated ”mtry” parameter. The mean decrease in accuracy (%IncMSE) was used to indicate the relative importance of each variable for predicting soil total P concentration. Partial dependence plots showed the marginal effect of each continuous predictor on soil total P concentration.
Finally, we applied the above trained model to global databases of the 13 predictors to generate a global map of soil total P concentration. The gridded driver variables used for the global prediction were all re-gridded to a spatial resolution of 0.05∘ × 0.05∘ (the original resolution can be found in Table S3). We did not remove cropland or other heavily influenced areas (e.g., cities, roads), so the predicted map can be used to represent an initial state without direct anthropogenic influence. Here we assume that cropland and other heavily influenced areas in their native states had the same set of relationships as for (semi-)natural lands.
Soil depth was used as a covariate so that the models could predict soil total P concentration for any given depth (Hengl et al., 2017b). The partial dependence plot indicated that soil total P concentration approximately linearly decreased with soil depth in the top 30 cm and there was no apparent trend with depth in the subsoil (∼ 30–100 cm). Given this, we predicted global soil total P concentration at 5, 15, 25, and 65 cm to represent the soil total P concentration in the 0–10, 10–20, 20–30, and 30–100 cm layers, respectively. Averages in other depth intervals (e.g., 0–30 cm or 0–100 cm) can be derived by taking a weighted average of the predictions within the depth interval (Hengl et al., 2017b). We used global gridded soil depth data (Shangguan et al., 2017) to correct the soil depth when it was less than 100 cm in any cell. The global soil P stock maps for 0–10, 10–20, 20–30, and 30–100 cm layers were calculated from the soil total P concentrations predicted here and the soil bulk density in corresponding layers predicted by Hengl et al. (2017b).
The prediction uncertainty of each cell in the global gridded map was assessed using bootstrap samples with the quantile regression forest technique (Meinshausen, 2006). Standard deviation was calculated to represent the uncertainty using the quantregForest function in the “quantregForest” R package (Meinshausen, 2017). Individual predictions of each tree in the random forest model (n = 500) were returned to assess the variation in predicted global mean soil total P concentration, and these results were used to assess the standard deviation of the estimated global soil P stock.
All statistical analyses and plotting were performed in the R environment (v. 4.0.2) (R Core Team, 2018).
3.1 Characteristics of soil total P concentration across the world
Our soil total P concentration database included 5275 measurements from 1894 geographically distinct sites and covered 6 continents, all major biomes, and all 12 USDA soil orders in terrestrial ecosystems (Fig. 1a–d and Table S5). The database was highly right-skewed (Fig. 1b) and revealed that the soil total P concentration in natural soils of terrestrial ecosystems varied from 1.4 to 9636.0 mg kg−1, with a mean, median, and standard deviation of 570.0, 430.0, and 646.5 mg kg−1, respectively (Table 2). The database included soil total P concentration measurements from the topsoil to 100 cm depth, with 84.4 % of the measurements from the topsoil (e.g., 0–30 cm). The average soil total P concentration in our database was 583.7 and 495.2 mg kg−1 in the topsoil (0–30 cm) and subsoil (30–100 cm), respectively.
The database revealed that soil total P concentration varied within and among biomes. The soil from tundra and boreal biomes had the highest soil total P concentrations. Mediterranean and temperate soils had intermediate soil total P concentrations. Soils in the desert and tropics had relatively lower soil total P concentrations (Table 2 and Fig. 2b). Soil total P concentration also varied with different soil orders (Table 3). Soil total P concentration decreased from slightly weathered soil (mean value 719.4 mg kg−1) to intermediately and strongly weathered soils (mean values of 481.1 and 472.3 mg kg−1, respectively) (Fig. 2c). The declining trend of soil total P during soil development supports the Walker and Syers (1976) conceptual model of phosphorus dynamics during long-term ecosystem development. And this pattern is consistent with previous studies (i.e., Cross and Schlesinger, 1995; Yang et al., 2013). The relationship between soil total P concentration and different World Reference Base for Soil Resources (WRB) soil types can be found in the Supplement (Table S6).
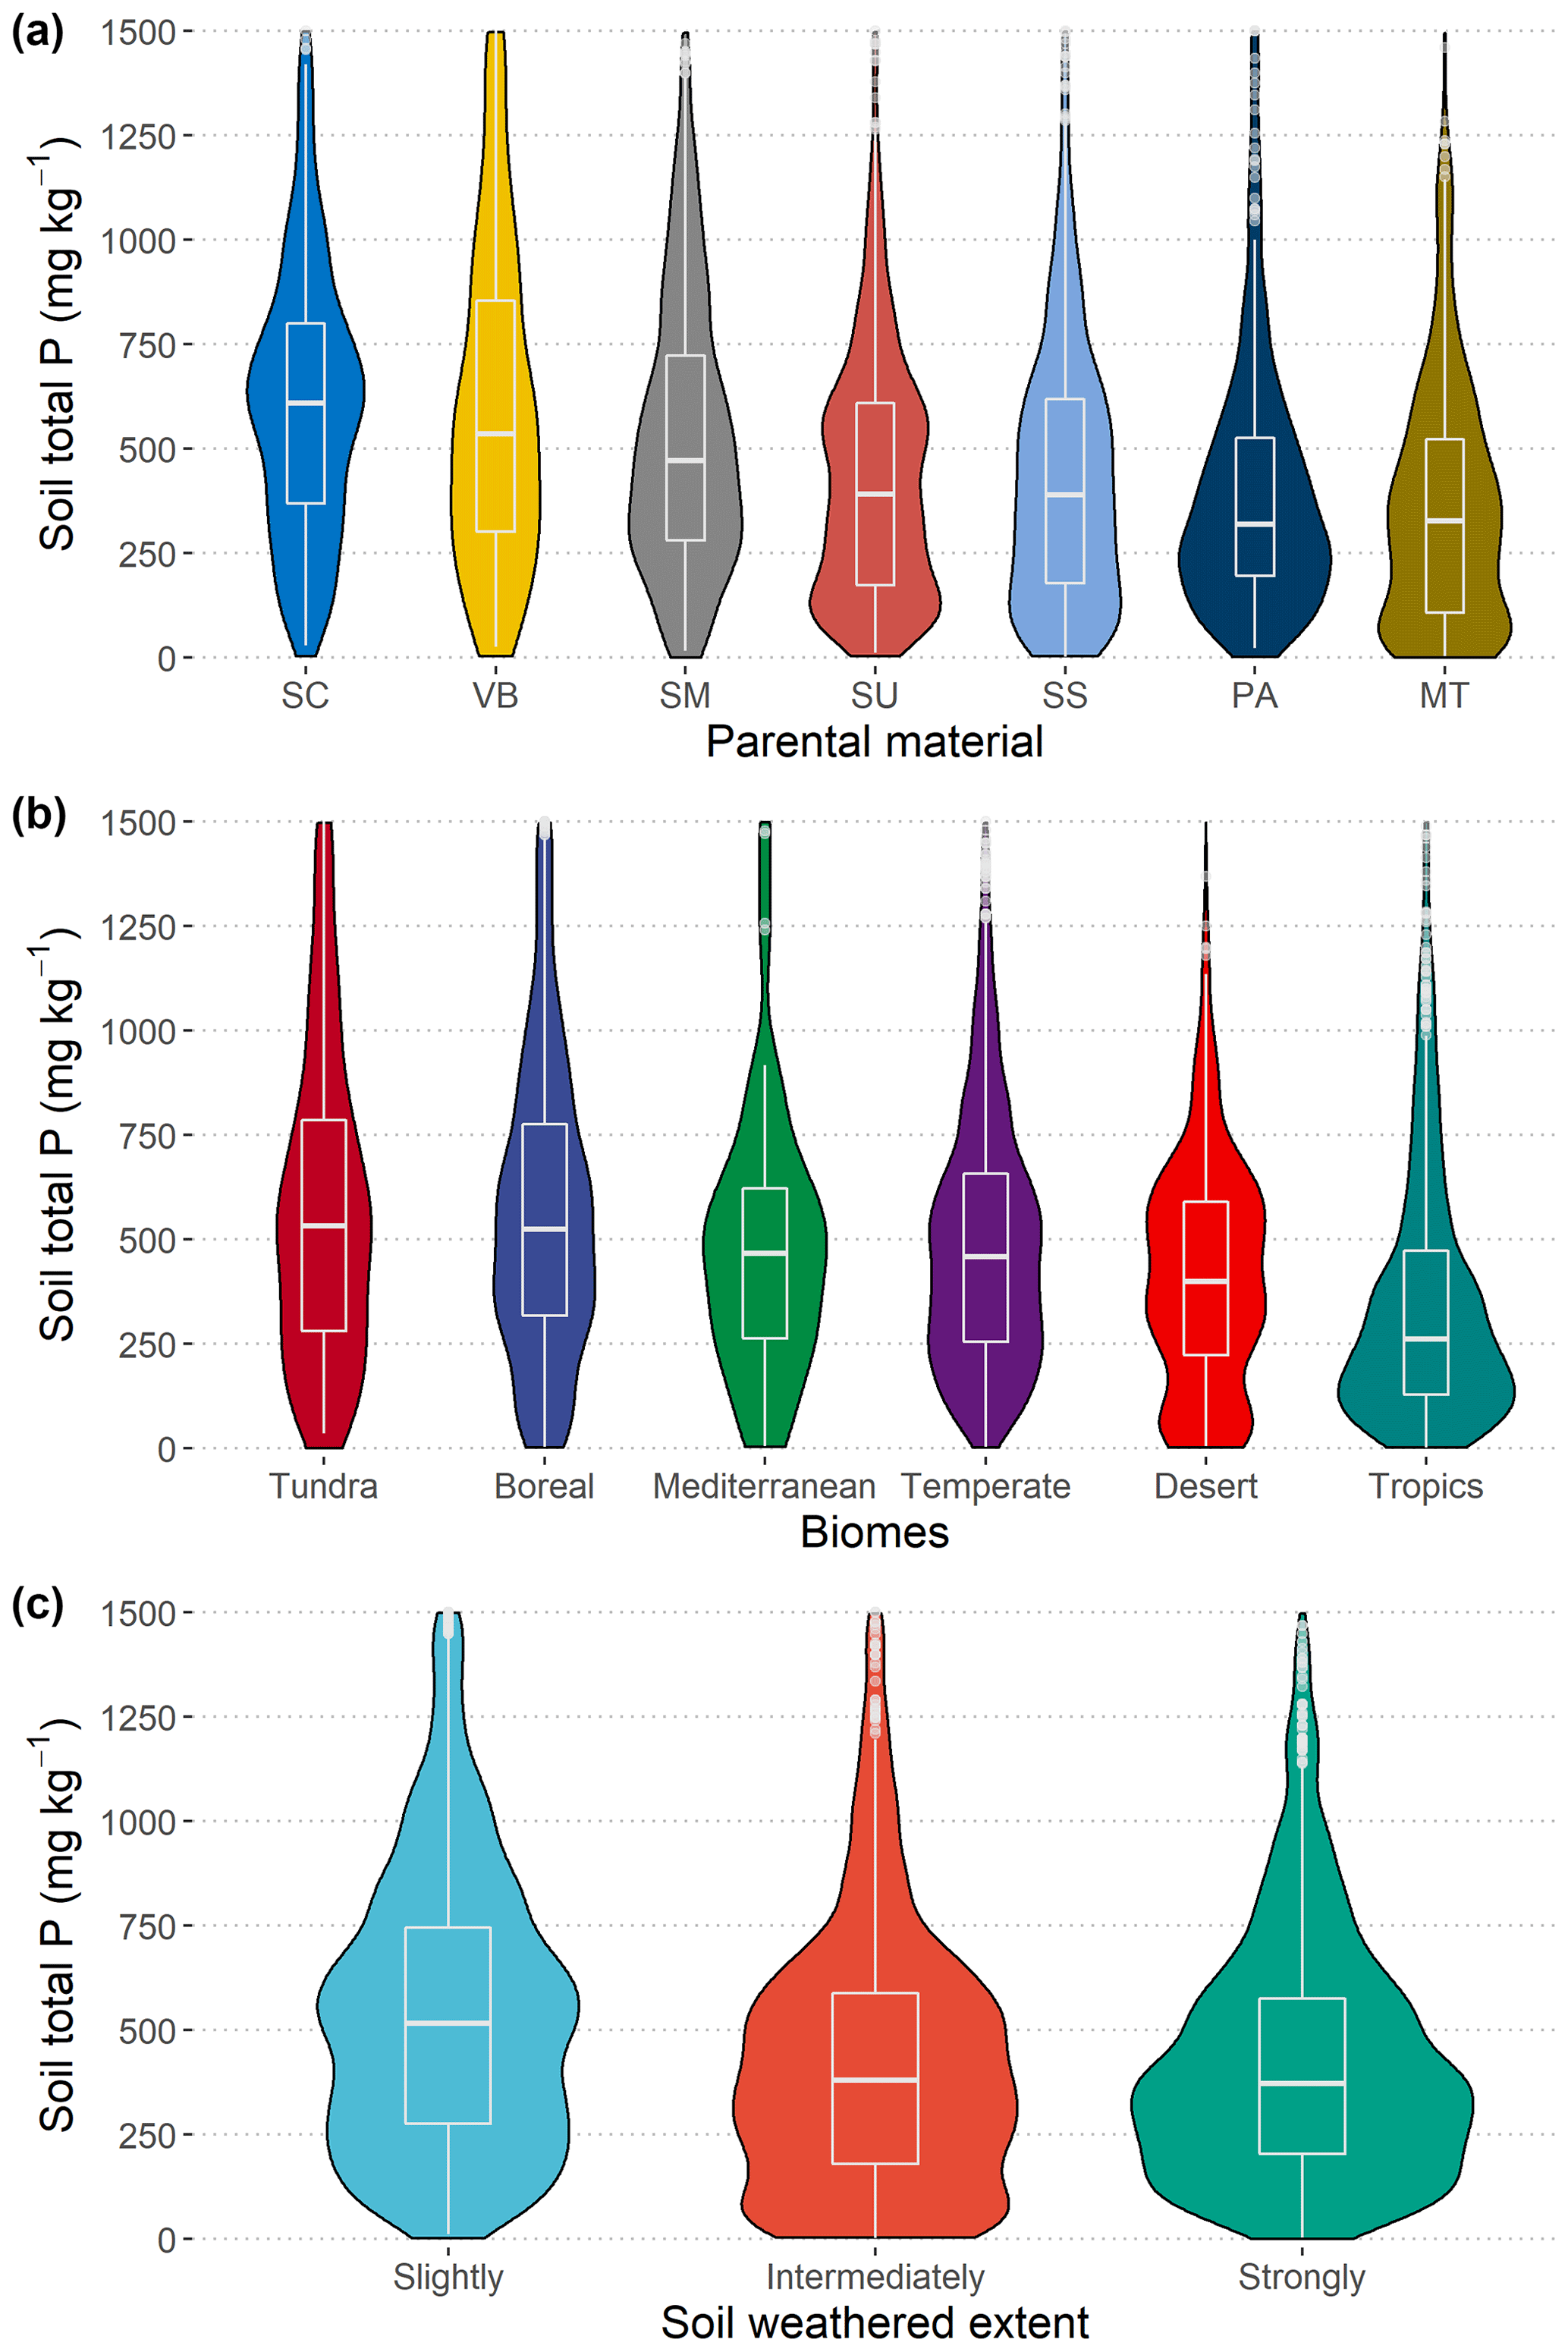
Figure 2Soil total P concentration in relation to parent material, biome, and soil weathering extent. For visualization, we chose to limit the y axis to 1500 mg kg−1; and in panel (a), only parent material types with more than 100 measurements in our database were shown; the abbreviations in panel (a) represent the following: SC, carbonate sedimentary; VB, basic volcanic; SM, mixed sedimentary; SU, unconsolidated sediments; SS, siliciclastic sedimentary; PA, acid plutonic; MT, metamorphics.
3.2 Model performance and drivers of soil total P concentration
The random forest regression model explained 65 % of soil total P concentration variability across all sites, with an RMSE of 288.8 mg kg−1 (Fig. 3b and Table S4). The random forest model revealed that the two most important predictors of soil total P concentration were SOC content and parent material. The remaining predictors showed a lower but non-negligible influence, with MAT and soil sand content having the most noticeable influence (Fig. 3a). Although soil order, biome, elevation, slope, depth, NPP, and pH showed significant influences on soil total P concentration (Figs. 2 and S3), their relative importance was lower than the above four predictors. Partial dependent plots (Fig. 4) revealed similar results to Pearson correlation analysis (Fig. S3). The partial dependent plots indicated a significant and positive relationship between soil total P concentration and SOC at a global scale; soil total P concentration was significantly and negatively correlated with MAT and soil sand content (Fig. S4). The Pearson correlation indicated the correlation coefficients between soil total P concentration, and the top three continuous predictors MAT, SOC, and soil sand content were −0.23, 0.19, and −0.18, respectively (Fig. S3).
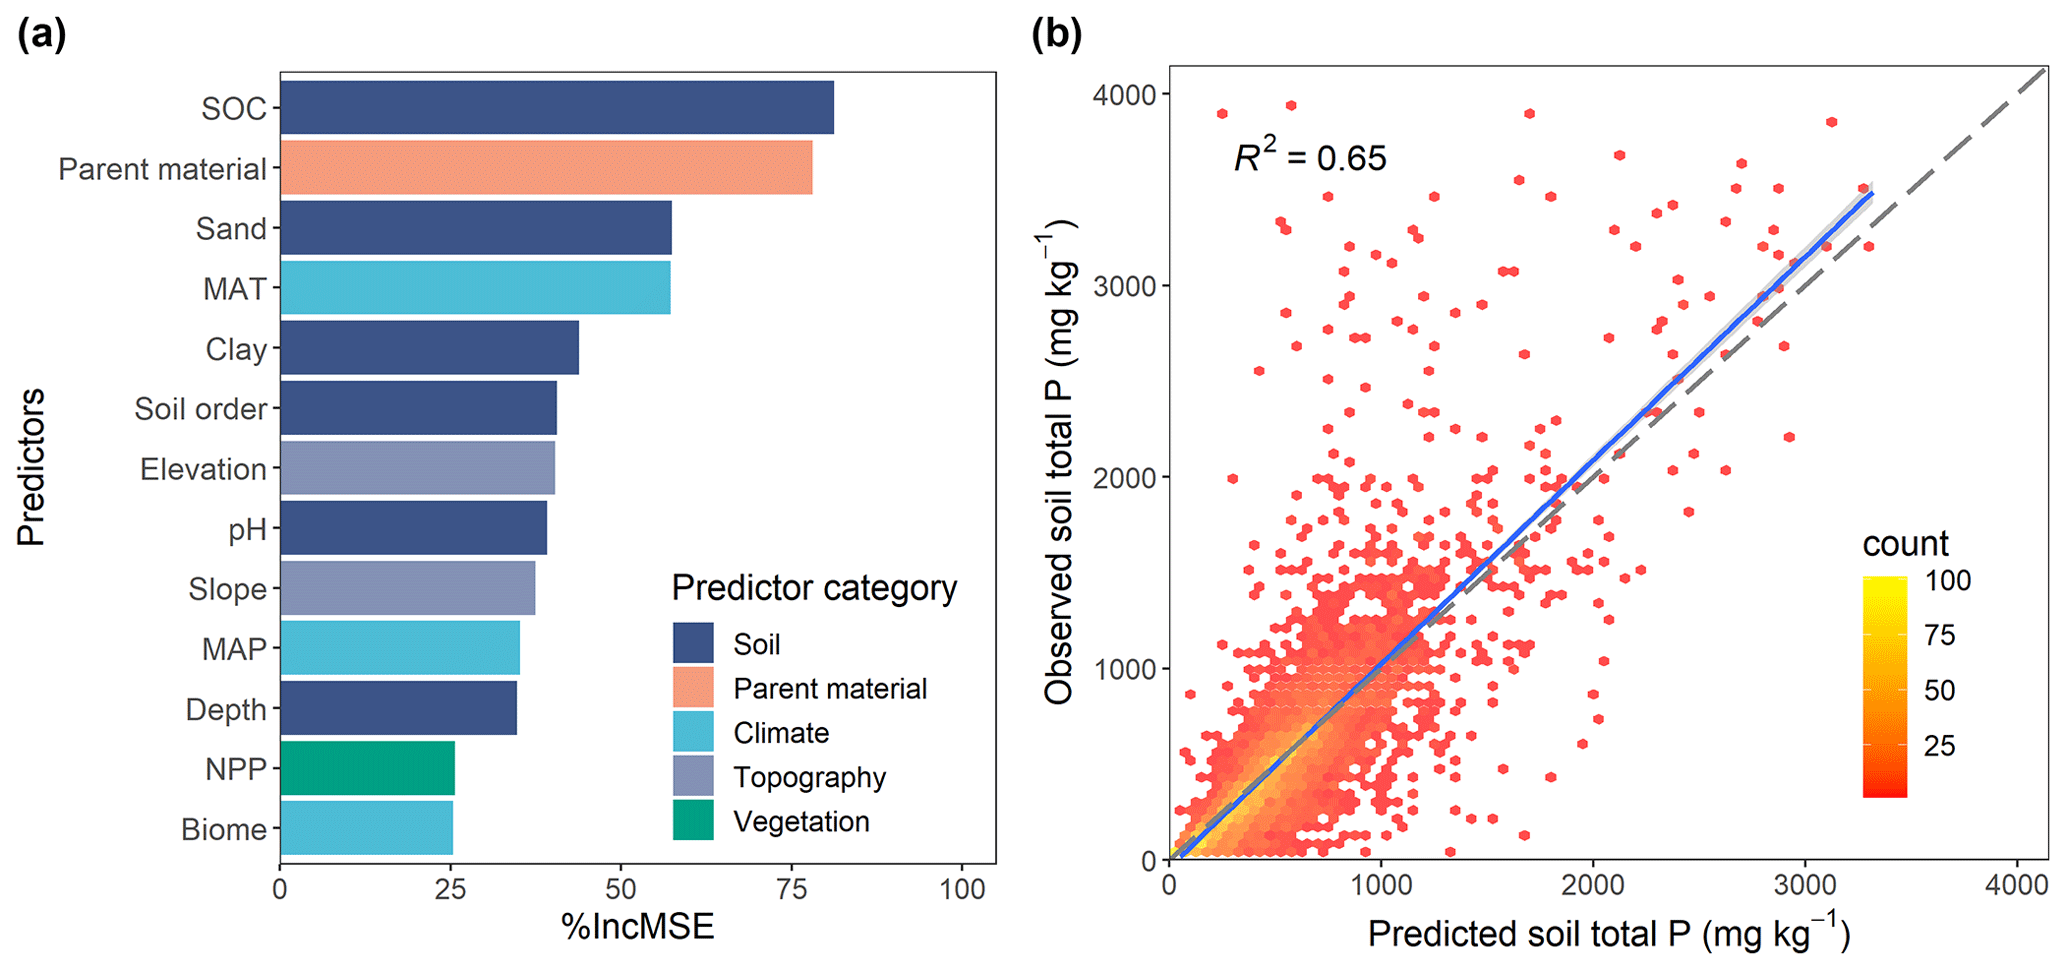
Figure 3Results of the random forest model predicting soil total P concentration. (a) The relative importance of predictors in the model. (b) Predicted vs. observed soil total P concentration; the dashed line indicates the 1 : 1 line; the blue line indicates the regression line between predicted and observed values.
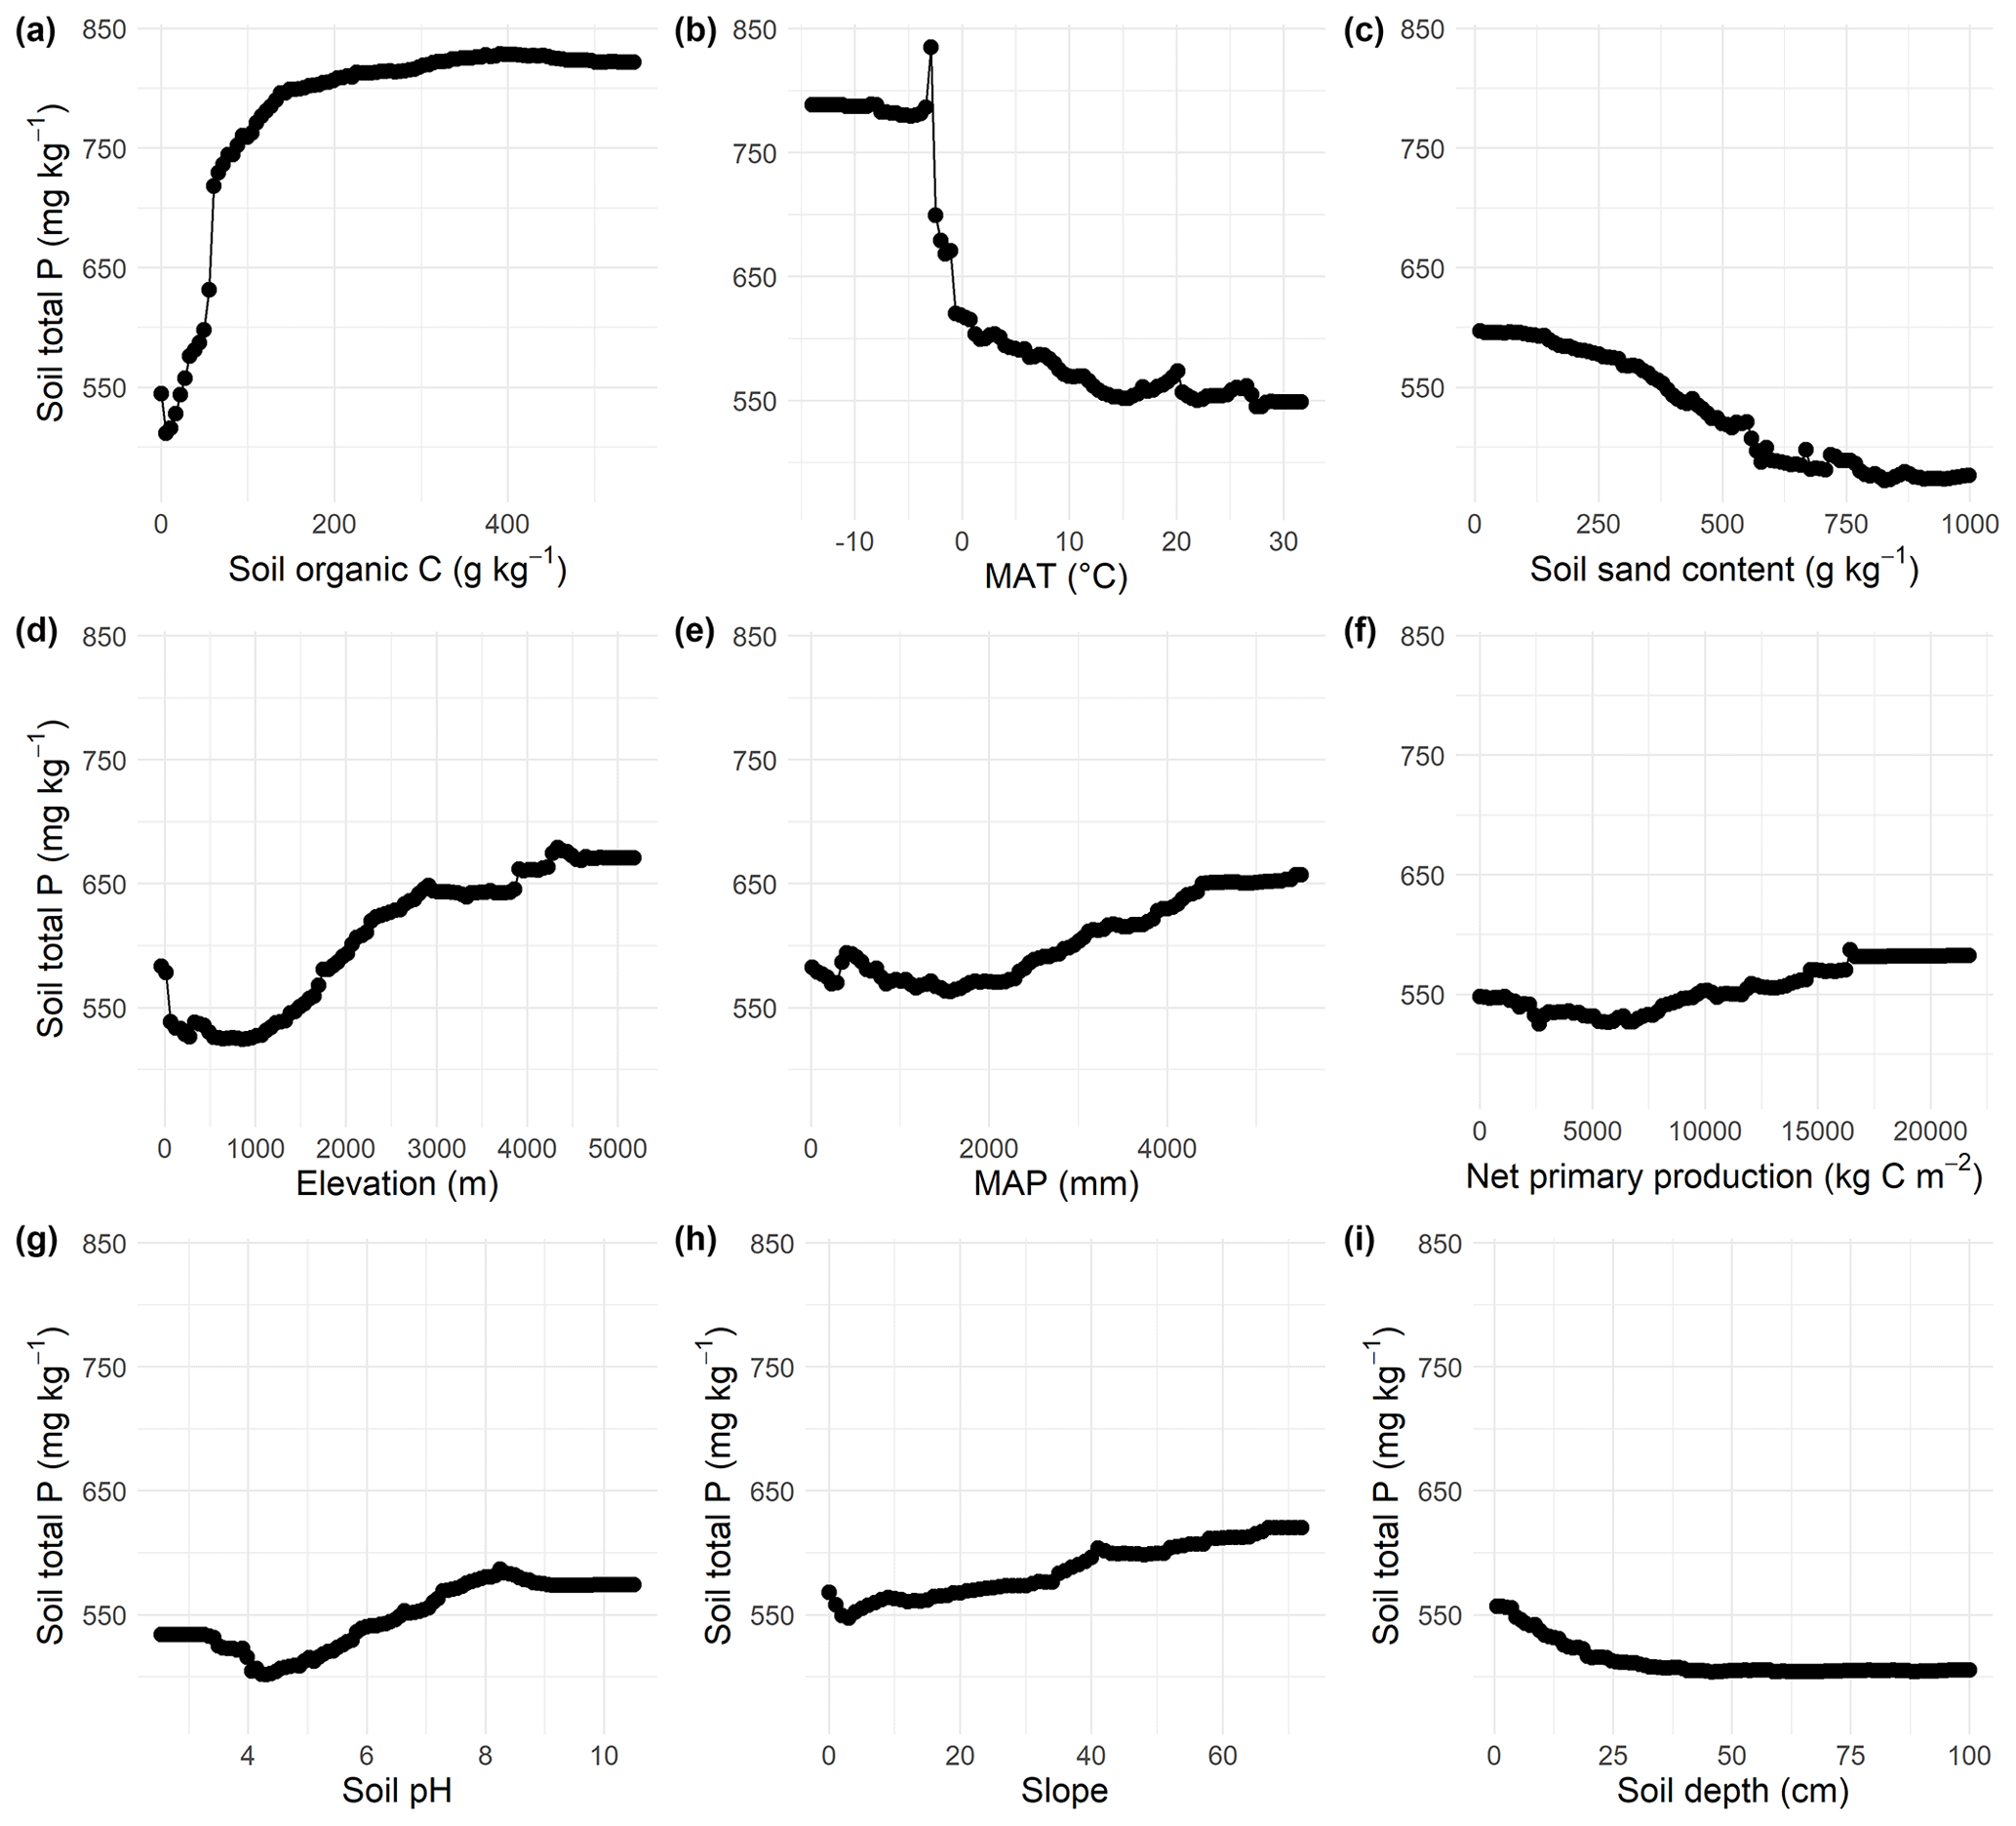
Figure 4Partial dependence plots showing the dependence of soil total P concentration on predictors. Soil total P concentration in relation to (a) SOC concentration, (b) MAT, (c) soil sand content, (d) elevation, (e) MAP, (f) net primary production, (g) soil pH, (h) slope, and (i) soil depth.
3.3 Global patterns of soil total P
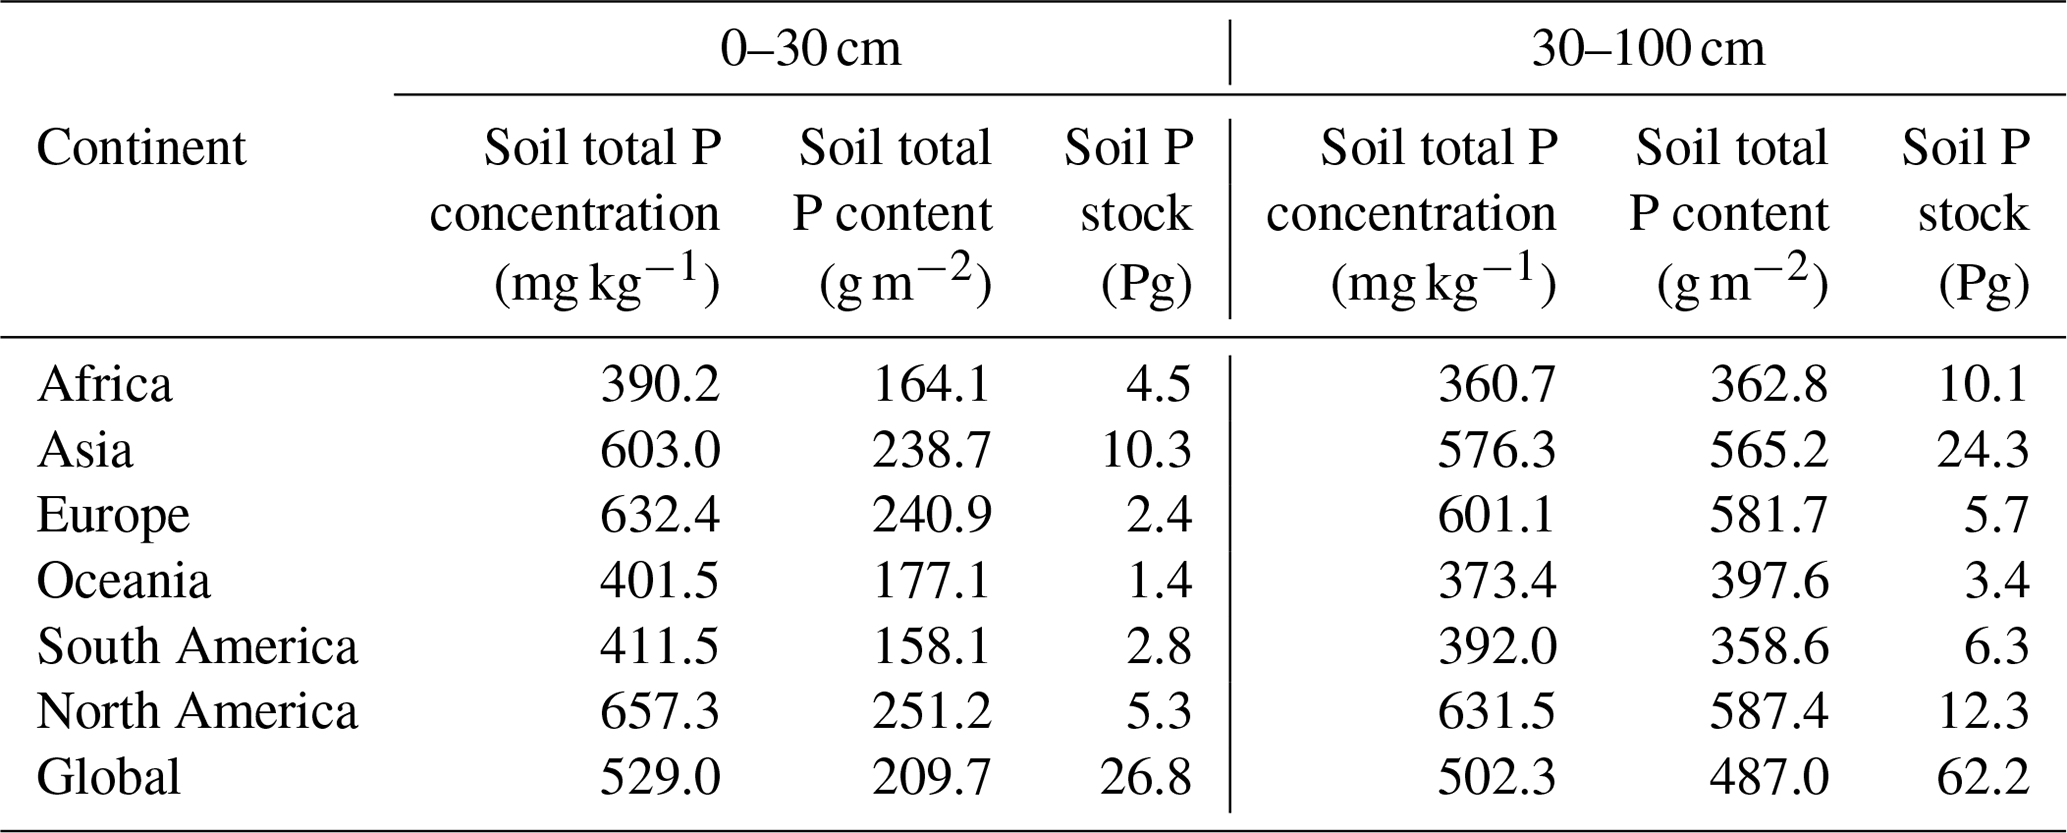
In our predicted global map (Fig. 5), we did not remove cropland or other heavily influenced areas (e.g., cities and roads), so the predicted map can be used to represent a natural background without direct anthropogenic influence. The predicted soil total P indicated that the total global P stocks in the topsoil (0–30 cm) and subsoil (30–100 cm) were 26.8 (standard deviation 3.1) Pg and 62.2 (standard deviation 8.9) Pg, respectively (excluding Antarctica; Table 4). Estimated area-weighted average soil total P concentrations in the topsoil and subsoil were 529.0 and 502.3 mg kg−1, respectively. Estimated area-weighted average soil total P content in the topsoil and subsoil were 209.7 and 487.0 g cm−2, respectively.
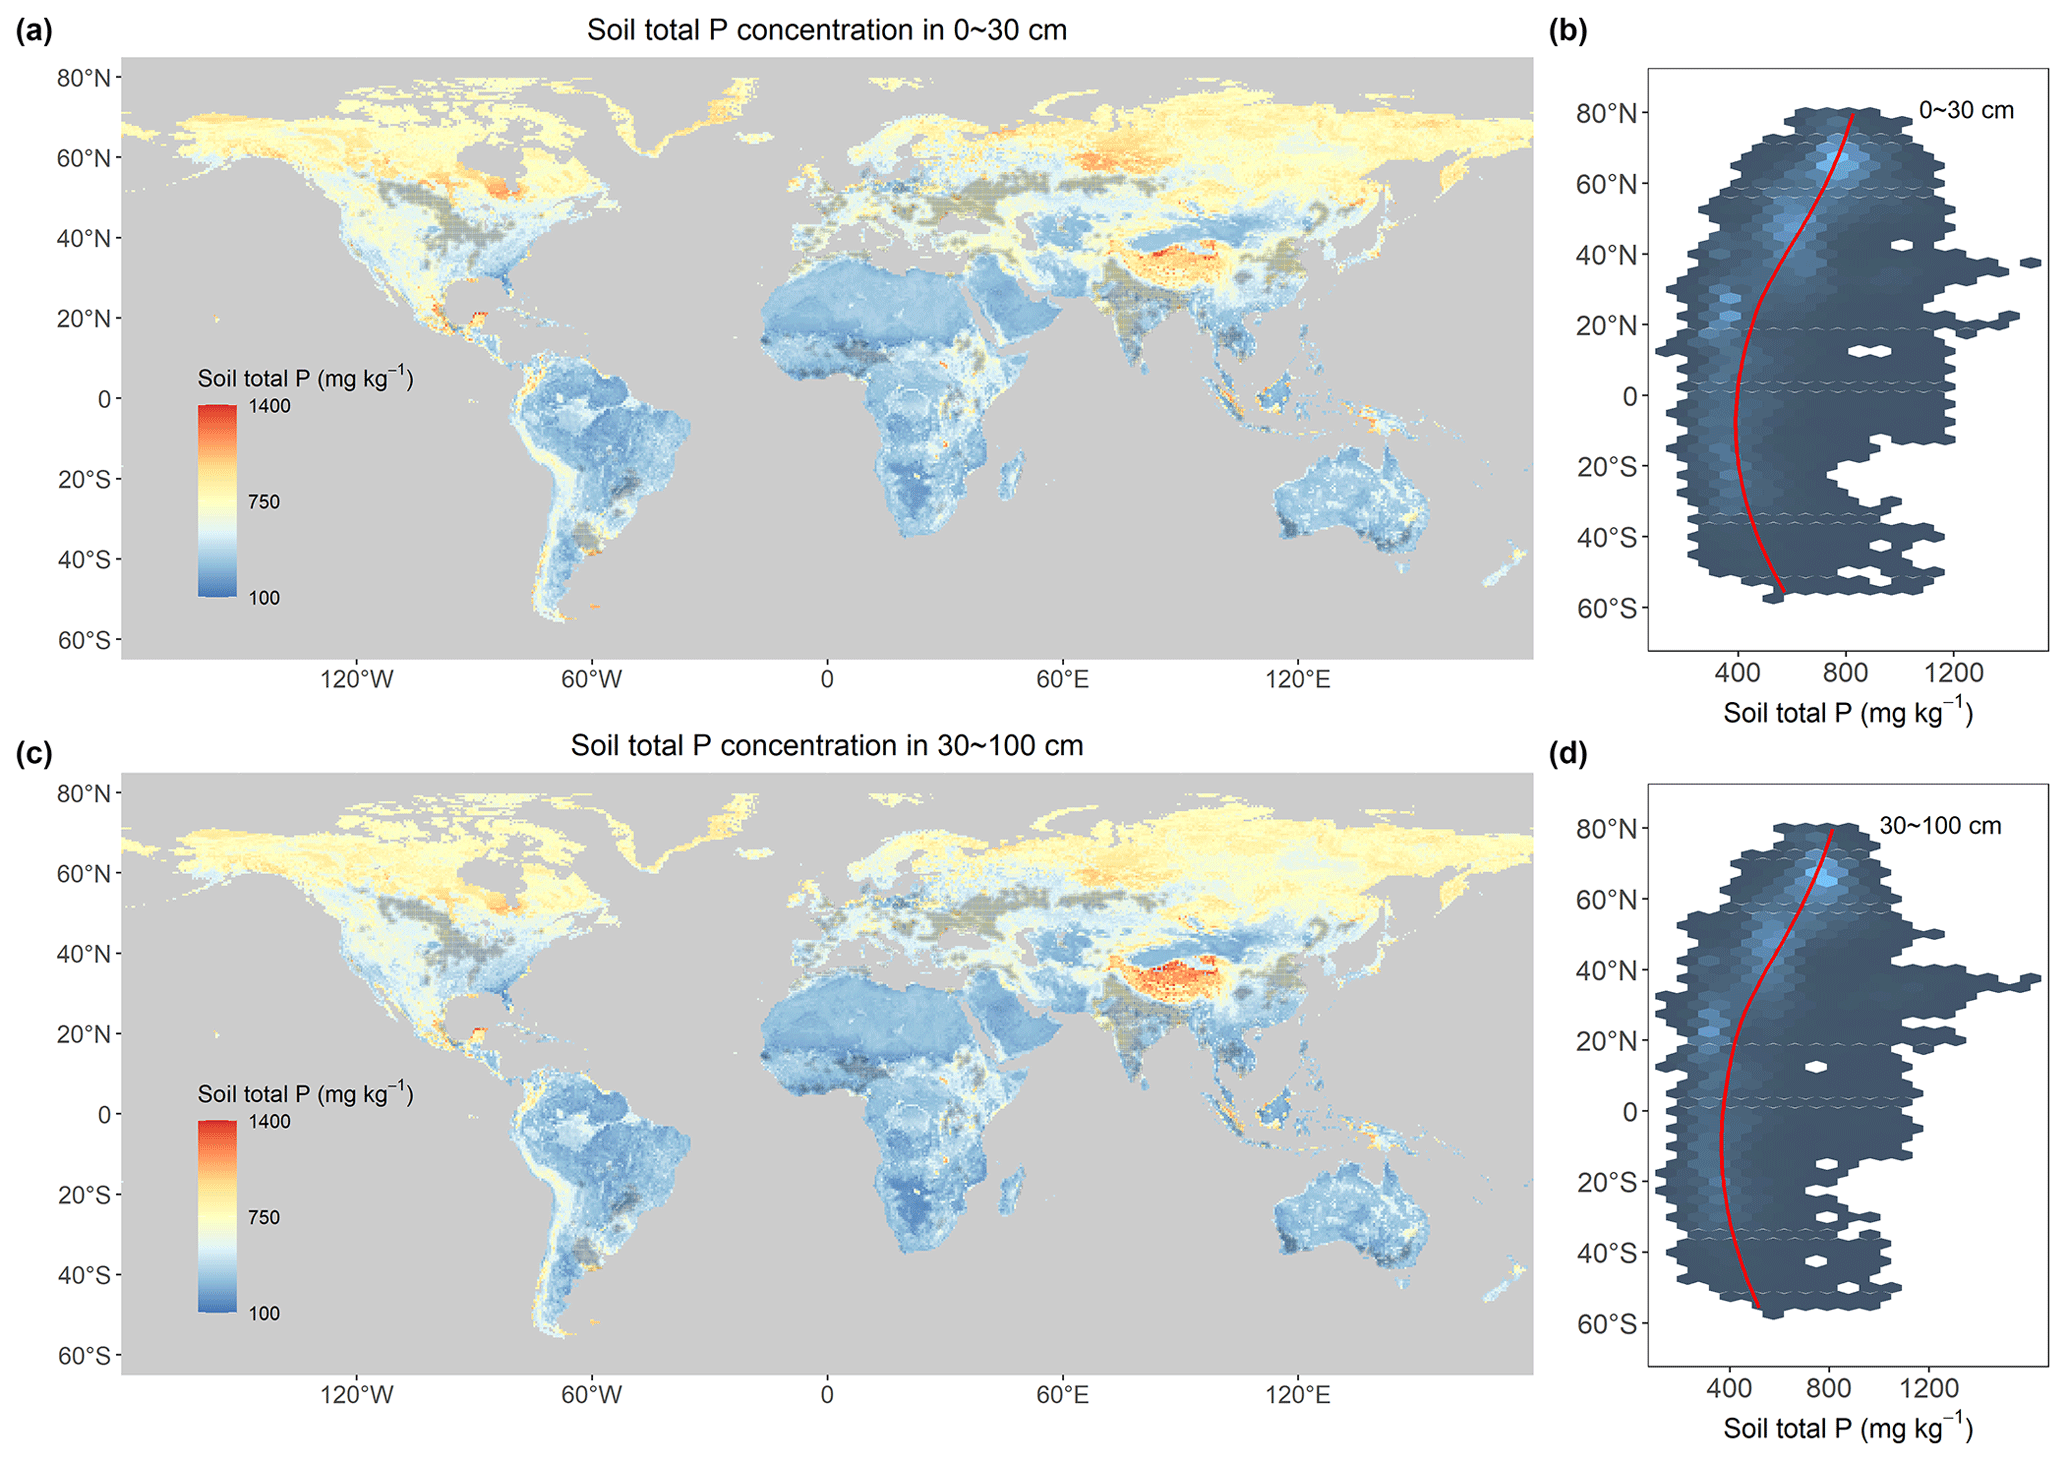
Figure 5Global maps of total P concentration in the 0–30 and 30–100 cm layers of soils. Panels (a) and (b) are maps of topsoil (0–30 cm) total P concentration and the latitudinal patterns, respectively. Panels (c) and (d) are maps of subsoil (30–100 cm) total P concentration and the latitudinal patterns, respectively. Red lines in panels (b) and (d) indicate the locally weighted regressions between latitude and soil total P concentration in the precited global map. Note that we did not remove cropland or any other heavily influenced areas from the predicted maps, so they can be used to represent soils without essential anthropogenic activities. In this figure, we used gray cells to indicate grid cells with more than 50 % of areas comprising cropland. A map without the cropland symbols is visible in Fig. S7.
Table 4Analysis of the predicted global map of soil total P. The area-weighted average soil total P concentration was calculated based on our predicted map. Converting soil total P concentration to soil total P content and stock used the soil bulk density (Hengl et al., 2017b) and land area.
The estimated global map of soil total P concentration revealed latitudinal patterns (Fig. 5), which were also found from analysis of the site-level data (Fig. S4k). Soil total P concentration significantly increased from the Equator to the poles in both hemispheres (P < 0.001). The latitudinal pattern of soil total P concentration was not found in earlier work aiming at extrapolating global soil P measurements to a global scale (Yang et al., 2013; Shangguan et al., 2014). Our predicted soil total P concentrations were weakly correlated, though significantly, with earlier predicted maps, i.e., Yang et al. (2013) and Shangguan et al. (2014) (Fig. S6).
Highlands and mountains at low latitudes (e.g., the Tibetan Plateau, Andes, Africa highlands, west India) had high soil total P concentrations. Our map also indicated some regional difference in soil total P; for example, central Australia was low in soil total P compared with east and west Australia. On a larger scale, South America, Oceania, and Africa had the lowest soil total P concentration, while soil total P concentration was highest in Europe, North America, and Asia (Table 4). The estimated soil total P concentrations in the subsoil showed similar patterns to those found in the topsoil (Fig. 5a, c).
With our soil total P concentration dataset, we quantified soil total P concentration in natural ecosystems, identified its key drivers, and predicted it for terrestrial ecosystems globally. Our work goes beyond previous studies (Delmas et al., 2015; Hengl et al., 2017a; Shangguan et al., 2014; Viscarra Rossel and Bui, 2016; Yang et al., 2013; Cheng et al., 2016), which used limited data that did not represent the heterogeneous conditions found on Earth well and did not separate natural soils from human-managed soils and therefore may not be able to distinguish natural drivers from anthropogenic factors (e.g., land use type, mineral fertilizer). In addition, we mapped soil total P concentration by considering more predictors and multiple soil depths.
4.1 Characteristics of soil total P concentration
Given the larger number of measurements that we considered, the range of total P concentration in our study (1.4–9630.0 mg kg−1) is wider than that reported in Cleveland and Liptzin (2007) (83.7–2746.6 mg kg−1; n = 186), Xu et al. (2013) (12.7–8400.1 mg kg−1; n = 536), Li et al. (2014) (30–2744 mg kg−1; n = 178), and Hou et al. (2018b) (4.8–2157.0 mg kg−1; n = 254). The average soil total P concentration in our site-level database (570.0 mg kg−1) was within the range of previous estimates by Cleveland and Liptzin (2007) (721.1 mg kg−1), Xu et al. (2013) (756.4 mg kg−1), Li et al. (2014) (463.6 mg kg−1), and Hou et al. (2018b) (471.9 mg kg−1).
4.2 Soil total P concentration in relation to its predictors
In agreement with previous studies, soil total P concentration was largely predicted by parent material type (Deiss et al., 2018; Augusto et al., 2017; Porder and Ramachandran, 2013). This result supports the use of parent material to map soil total P concentration at the global scale (Yang et al., 2013). Parent material can affect soil total P concentration both directly and indirectly. Some parent materials tend to have higher P concentrations, which then translate into higher total soil P (Mage and Porder, 2013; Dieter et al., 2010; Kitayama et al., 2000). Additionally, parent material also affects soil total P indirectly via the influence of soil physiochemical properties such as soil texture, pH, and Al and Fe oxides (Siqueira et al., 2021; Mehmood et al., 2018). For example, the retention of P in soil can be influenced by the soil content of clay, soluble calcium, and Fe oxyhydroxides (Delgado-Baquerizo et al., 2020; Mehmood et al., 2018; Achat et al., 2016b). As such, parent material type is a critical predictor of soil total P from local to global scales.
Interestingly, we found that SOC was one of the two most important predictors of soil total P concentration. The positive relationship between soil total P and SOC has two possible explanations. First, this relationship may reflect the coupling between P and C in soils (Hou et al., 2018a) given that soil organic matter is characterized by a rather narrow range of C : P ratio values (Cleveland and Liptzin, 2007; Spohn, 2020; Tipping et al., 2016). Second, P and organic C are stabilized and retained through similar processes in soil (Doetterl et al., 2015). For example, reactive minerals can simultaneously stabilize both P and organic C in soil (Helfenstein et al., 2018). As such, the strong relationship between SOC and total P at the global scale confirms that SOC is an integrated measure of biotic (e.g., soil microbial activity) and abiotic (e.g., cation exchangeable capacity) factors that regulate soil total P (Spohn, 2020; Wang et al., 2020).
Consistent with a recent global synthesis that focused on soil P fractions (Hou et al., 2018a), our result indicated that MAT was a more important predictor of soil total P concentration than MAP. The negative relationship could be because soils under low MAT are often found at high latitudes where soils were eroded during the last glaciation. These soils tend to be much younger compared to soils at low latitudes with high MAT and thus have experienced less loss of P (Vitousek et al., 2010). In addition, high MAT and MAP generally promote soil weathering as well as plant growth and P uptake, resulting in the depletion of soil P (Huston and Wolverton, 2009; Arenberg and Arai, 2019; Huston, 2012).
Further, we provide two explanations for the negative relationship between soil total P concentration and sand content. First, soil sand content is a surrogate for quartz content (Bui and Henderson, 2013), and the rock content in quartz is usually negatively correlated with the total P content of siliceous rocks (Hahm et al., 2014; Vitousek et al., 2010). Second, soil sand is worse at retaining nutrients including P than other soil fractions (Augusto et al., 2017). For example, loamy soils regularly lose 0.3–0.5 kg P ha−1 yr−1 by leaching, while coarse sandy soils lose up to 2.0 kg P ha−1 yr−1 (Amberger, 1996).
4.3 Global patterns of soil total P
Based on our predicted global map, we estimated that the area-weighted global average of soil total P concentration was 529.0 and 502.3 mg kg−1 in the topsoil (0–30 cm) and subsoil (30–100 cm), respectively. Our estimate of the area-weighted average soil total P in the topsoil was higher than previous estimates by Yang et al. (2013) (374.7 mg kg−1) and Shangguan et al. (2014) (484.7 mg kg−1) but was very close to the estimate by Xu et al. (2013) (514.6 mg kg−1). Our estimate of the global soil P stock in the top 30 cm of soil (26.8 Pg, excluding Antarctica) was in line with the estimate of Shuanguan et al. (2014) (26.7 Pg in the top 30 cm) but was higher than the estimates of Yang et al. (2013) (24.4 Pg in the top 30 cm), Wang et al. (2010) (18.2 Pg in the top 30 cm), and Smil (2000) (24 Pg). Additionally, our estimate was much lower than a much earlier estimate by Butcher et al. (1992) (about 120 Pg in the top 30 cm).
Our predicted soil total P concentrations decreased significantly with decreasing latitude in both hemispheres. This result is consistent with our theoretical understanding of the evolution of soils in soil chronosequences (Walker and Syres, 1976) and the stark differences in soil age and weathering intensity between low- and high-latitude regions. And this result is in agreement with a recent meta-analysis that revealed P limitation to plant growth decreased significantly with latitude (Hou et al., 2021). Lowland tropical soils tend to be more weathered compared to soils at high latitudes due to warmer and more humid climate which promotes weathering (Hou et al., 2018a). Moreover, the last glaciation could have eroded soils at more northern higher latitudes and have caused relatively young and P-enriched soils (Vitousek et al., 2010; Reich and Oleksyn, 2004). Our result is consistent with Xu et al. (2013); by comparing soil total P concentration across the major biomes, the authors found the highest soil total P concentration in the tundra and the lowest in the tropical and subtropical forest. Previous global maps of soil total P concentration were not able to capture the latitudinal trend of soil total P concentrations (Yang et al., 2013; Shangguan et al., 2014), likely due to poorer spatial coverage of their measurements. For example, their measurements were mostly from the USA and China, with a very small proportion of measurements from high latitudes.
While we found a latitudinal gradient in soil total P concentration, heterogeneity in soil total P concentration at the regional and local scales was large. For example, consistent with Brédoire et al. (2016), we found that the soil total P concentration was higher in Siberia than in northern Europe, both of which have similar latitudes. First, this difference may be due to the fact that glaciation was more regular and intense in Siberia than in northern Europe (Wassen et al., 2021), leading to a more intensive rejuvenation of soils. Second, the warmer and wetter climate in northern Europe may promote weathering which releases P from parent material (Goll et al., 2014) and makes it subject to loss (Fig. S8). Regional variation in soil total P concentration may also be attributable to regional variation in parent material. For example, higher soil total P concentration in eastern Australia than in central Australia was probably due to P-enriched basaltic lithologies in eastern Australia (6500–8700 mg kg−1) (Viscarra Rossel and Bui, 2016). Moreover, regional differences in soil total P concentration may be related to topography conditions. For example, higher soil total P concentration in the Tibetan Plateau than in eastern China may be the result of higher elevation and lower MAT in the Tibetan Plateau (Zhang et al., 2005).
4.4 Limitation and prediction uncertainty
Despite our unprecedented effort to construct a database and perform global predictions, our study has some limitations. First, some regions were still underrepresented, e.g., northern Canada, Russia, middle Asia, and inner Australia, which may result in a low accuracy of predicted values in these regions (Ploton et al., 2020). Further, our assumption that soils which are or have been in agricultural use can be characterized in their native state by the same relationships as (semi-)natural soils might not hold true. For example, fertile soils are preferred in agriculture and forestry. Second, subsoils (> 30 cm depth) were not well represented in our dataset (14 %), and therefore predicted P concentrations of subsoils may suffer from larger uncertainties than those of topsoils (< 30 cm depth). Third, some predictors were largely missing. Map-filled values suffer from large uncertainties, especially for the soil variables. This may cause some uncertainties in the predicted soil total P concentration. Finally, 36 % of the variation in soil total P concentration was not explained, despite the inclusion of 13 predictors using an advanced machine learning approach. This result may be because of measurement errors and/or methodological constraints. These limitations highlight the need for more measurements of subsoil total P concentration and closely associated variables, especially from the underrepresented regions, as well as more advanced statistical methods for spatial predictions.
Raw datasets, R code, and global maps generated in this study are available at https://doi.org/10.6084/m9.figshare.14583375 (He et al., 2021).
By constructing a database of total P concentration globally, we quantified the relative importance of multiple soil-forming variables for predicting soil total P concentration and further estimated it at the global scale. Our results indicated that no single variable can be used to predict soil total P concentration. Instead, a combination of variables are needed to reliably predict soil total P concentration, among which SOC, parent material, MAT, and soil sand content are the most important predictors. Soil total P concentration was positively correlated with SOC and negatively correlated with both MAT and soil sand content. Our predicted map captures the latitudinal gradient in potential soil total P concentration expected from our theoretical understanding. We estimated that P stocks in the topsoil (0–30 cm) and subsoil (30–100 cm) of soil of natural ecosystems (excluding Antarctica) were 26.8 and 62.2 Pg, respectively. Our improved global map of soil total P will be an important resource for future work which aims to tackle issues related to P cycling, including predicting future land carbon sink potential and P losses to aquatic and marine ecosystems as well as modeling the P needs of crops to increase food security.
The supplement related to this article is available online at: https://doi.org/10.5194/essd-13-5831-2021-supplement.
XH and EH designed this study. XH, EH, LA, ZW, and YY collected the data. XH, EH, LA, DSG, BR, YW, JH, YH, and KY discussed analyzing methods. XH conducted the analysis and drafted the manuscript. All authors discussed the results and contributed to the manuscript.
The contact author has declared that neither they nor their co-authors have any competing interests.
Publisher’s note: Copernicus Publications remains neutral with regard to jurisdictional claims in published maps and institutional affiliations.
We would like to thank Morgan Furze at Yale University for his assistance with English language and grammatical editing.
This research has been supported by the National Natural Science Foundation of China (grant nos. 32071652 and 31870464), the China Postdoctoral Science Foundation (grant no. 2020M673123), the Chongqing Technology Innovation and Application Demonstration Major Theme Special Project (grant no. cstc2018jszx-zdyfxmX0007), and the ANR CLAND Convergence Institute.
This paper was edited by Martin Schultz and reviewed by Christine Alewell and Tom Bruulsema.
Achat, D. L., Augusto, L., Gallet-Budynek, A., and Loustau, D.: Future challenges in coupled C-N-P cycle models for terrestrial ecosystems under global change: a review, Biogeochemistry, 131, 173–202, https://doi.org/10.1007/s10533-016-0274-9, 2016a.
Achat, D. L., Pousse, N., Nicolas, M., Brédoire, F., and Augusto, L.: Soil properties controlling inorganic phosphorus availability: general results from a national forest network and a global compilation of the literature, Biogeochemistry, 127, 255–272, https://doi.org/10.1007/s10533-015-0178-0, 2016b.
Adams, J., Tipping, E., Thacker, S. A., and Quinton, J. N.: Phosphorus, carbon and nitrogen concentrations in UK soil mineral fractions, 2013–2014, NERC Environmental Information Data Centre, https://doi.org/10.5285/e6e9a85c-b537-4110-899f-2c1498bc826c, 2020.
Alewell, C., Ringeval, B., Ballabio, C., Robinson, D. A., Panagos, P., and Borrelli, P.: Global phosphorus shortage will be aggravated by soil erosion, Nat. Commun., 11, 4546, https://doi.org/10.1038/s41467-020-18326-7, 2020.
Amberger, A.: Pflanzenernährung. Ökologische und physiologische Grundlagen, Dynamik und Stoffwechsel der Nährelemente, 4th edn., Eugen Ulmer, Stuttgart, Germany, 1996 (in German).
Andersson, H., Bergström, L., Djodjic, F., Ulén, B., and Kirchmann, H.: Topsoil and Subsoil Properties Influence Phosphorus Leaching from Four Agricultural Soils, J. Environ. Qual., 42, 455–463, https://doi.org/10.2134/jeq2012.0224, 2013.
Arenberg, M. R. and Arai, Y.: Uncertainties in soil physicochemical factors controlling phosphorus mineralization and immobilization processes, Adv. Agron., 154, 153–200, https://doi.org/10.1016/bs.agron.2018.11.005, 2019.
Augusto, L., Bakker, M. R., Morel, C., Meredieu, C., Trichet, P., Badeau, V., Arrouays, D., Plassard, C., Achat, D. L., Gallet-Budynek, A., Merzeau, D., Canteloup, D., Najar, M., and Ranger, J.: Is “grey literature” a reliable source of data to characterize soils at the scale of a region? A case study in a maritime pine forest in southwestern France, Eur. J. Soil Sci., 61, 807–822, https://doi.org/10.1111/j.1365-2389.2010.01286.x, 2010.
Augusto, L., Achat, D. L., Jonard, M., Vidal, D., and Ringeval, B.: Soil parent material – A major driver of plant nutrient limitations in terrestrial ecosystems, Glob. Change Biol., 23, 3808–3824, https://doi.org/10.1111/gcb.13691, 2017.
Ballabio, C., Lugato, E., Fernández-Ugalde, O., Orgiazzi, A., Jones, A., Borrelli, P., Montanarella, L., and Panagos, P.: Mapping LUCAS topsoil chemical properties at European scale using Gaussian process regression, Geoderma, 355, 113912, https://doi.org/10.1016/j.geoderma.2019.113912, 2019.
Baribault, T. W., Kobe, R. K., and Finley, A. O.: Data from: Tropical tree growth is correlated with soil phosphorus, potassium, and calcium, though not for legumes, Dryad [data set], https://doi.org/10.5061/dryad.r9p70, 2012.
Beusen, A. H. W., Van Beek, L. P. H., Bouwman, A. F., Mogollón, J. M., and Middelburg, J. J.: Coupling global models for hydrology and nutrient loading to simulate nitrogen and phosphorus retention in surface water – description of IMAGE–GNM and analysis of performance, Geosci. Model Dev., 8, 4045–4067, https://doi.org/10.5194/gmd-8-4045-2015, 2015.
Brédoire, F., Bakker, M. R., Augusto, L., Barsukov, P. A., Derrien, D., Nikitich, P., Rusalimova, O., Zeller, B., and Achat, D. L.: What is the P value of Siberian soils? Soil phosphorus status in south-western Siberia and comparison with a global data set, Biogeosciences, 13, 2493–2509, https://doi.org/10.5194/bg-13-2493-2016, 2016.
Buendía, C., Kleidon, A., and Porporato, A.: The role of tectonic uplift, climate, and vegetation in the long-term terrestrial phosphorous cycle, Biogeosciences, 7, 2025–2038, https://doi.org/10.5194/bg-7-2025-2010, 2010.
Bui, E. N. and Henderson, B. L.: C:N:P stoichiometry in Australian soils with respect to vegetation and environmental factors, Plant Soil, 373, 553–568, https://doi.org/10.1007/s11104-013-1823-9, 2013.
Butcher, S. S., Charlson, R. J., Orians, G. H., and Wolfe, G. V.: Global Biogeochemical Cycles, Academic Press (Harcourt Brace Jovanovich), London, UK, 1992.
Cheng, Y., Li, P., Xu, G., Li, Z., Cheng, S., and Gao, H.: Spatial distribution of soil total phosphorus in Yingwugou watershed of the Dan River, China, Catena, 136, 175–181, https://doi.org/10.1016/j.catena.2015.02.015, 2016.
Cheng, Y., Li, P., Xu, G., Li, Z., Yu, K., Cheng, S., Zhao, B., and Wang, F.: Factors that influence soil total phosphorus sources on dam fields that are part of ecological construction programs on the Loess Plateau, China, Catena, 171, 107–114, https://doi.org/10.1016/j.catena.2018.07.006, 2018.
Cleveland, C. C. and Liptzin, D.: C : N : P stoichiometry in soil: is there a “Redfield Ratio” for the microbial biomass?, Biogeochemistry, 85, 235–252, https://doi.org/10.1007/s10533-007-9132-0, 2007.
Cross, A.: Phosphorus Fractions in Grassland and Shrubland Soils at the Sevilleta National Wildlife Refuge, New Mexico (1989) ver 154704, Environmental Data Initiative [data set], https://doi.org/10.6073/pasta/5986a5885f621dd9659da99576341f5b, 2013.
Cross, A. F. and Schlesinger, W. H.: A literature review and evaluation of the. Hedley fractionation: Applications to the biogeochemical cycle of soil phosphorus in natural ecosystems, Geoderma, 64, 197–214, https://doi.org/10.1016/0016-7061(94)00023-4, 1995.
Deiss, L., de Moraes, A., and Maire, V.: Environmental drivers of soil phosphorus composition in natural ecosystems, Biogeosciences, 15, 4575–4592, https://doi.org/10.5194/bg-15-4575-2018, 2018.
Delgado-Baquerizo, M., Reich, P. B., Bardgett, R. D., Eldridge, D. J., Lambers, H., Wardle, D. A., Reed, S. C., Plaza, C., Png, G. K., Neuhauser, S., Berhe, A. A., Hart, S. C., Hu, H., He, J., Bastida, F., Abades, S., Alfaro, F. D., Cutler, N. A., Gallardo, A., García-Velázquez, L., Hayes, P. E., Hseu, Z., Pérez, C. A., Santos, F., Siebe, C., Trivedi, P., Sullivan, B. W., Weber-Grullon, L., Williams, M. A., and Fierer, N.: The influence of soil age on ecosystem structure and function across biomes, Nat. Commun., 11, 4721–4721, https://doi.org/10.1038/s41467-020-18451-3, 2020.
Delmas, M., Saby, N., Arrouays, D., Dupas, R., Lemercier, B., Pellerin, S., and Gascuel-Odoux, C.: Explaining and mapping total phosphorus content in French topsoils, Soil Use Manage, 31, 259–269, https://doi.org/10.1111/sum.12192, 2015.
Deng, Q., McMahon, D. E., Xiang, Y., Yu, C. L., Jackson, R. B., and Hui, D.: A global meta-analysis of soil phosphorus dynamics after afforestation, New Phytol., 213, 181–192, https://doi.org/10.1111/nph.14119, 2017.
De Schrijver, A., Vesterdal, L., Hansen, K., De Frenne, P., Augusto, L., Achat, D. L., Staelens, J., Baeten, L., De Keersmaeker, L., De Neve, S., and Verheyen, K.: Four decades of post-agricultural forest development have caused major redistributions of soil phosphorus fractions, Oecologia, 169, 221–234, https://doi.org/10.1007/s00442-011-2185-8, 2012.
Dieter, D., Elsenbeer, H., and Turner, B. L.: Phosphorus fractionation in lowland tropical rainforest soils in central Panama, Catena, 82, 118–125, https://doi.org/10.1016/j.catena.2010.05.010, 2010.
Doetterl, S., Stevens, A., Six, J., Merckx, R., Van Oost, K., Casanova Pinto, M., Casanova-Katny, A., Muñoz, C., Boudin, M., Zagal Venegas, E., and Boeckx, P.: Soil carbon storage controlled by interactions between geochemistry and climate, Nat. Geosci., 8, 780–783, https://doi.org/10.1038/ngeo2516, 2015.
Dokuchaev, V. V.: The Russian chernozem, Report to the Free Economic Society, Imperial Univ. of St. Petersburg, St. Petersburg, Russia, 1883 (in Russian).
Elser, J. J., Bracken, M. E. S., Cleland, E. E., Gruner, D. S., Harpole, W. S., Hillebrand, H., Ngai, J. T., Seabloom, E. W., Shurin, J. B., and Smith, J. E.: Global analysis of nitrogen and phosphorus limitation of primary producers in freshwater, marine and terrestrial ecosystems, Ecol. Lett., 10, 1135–1142, https://doi.org/10.1111/j.1461-0248.2007.01113.x, 2007.
Fleischer, K., Rammig, A., Kauwe, D. M. G., Walker, A. P., Domingues, T. F., Fuchslueger, L., Garcia, S., Goll, D. S., Grandis, A., Jiang, M., Haverd, V., Hofhansl, F., Holm, J. A., Kruijt, B., Leung, F., Medlyn, B. E., Mercado, L. M., Norby, R. J., Pak, B., Randow, V. C., Quesada, C. A., Schaap, K. J., Valverde-Barrantes, O. J., Wang, Y. P., Yang, X., Zaehle, S., Zhu, Q., Lapola, D. M., and Oak Ridge National Lab: Amazon forest response to CO2 fertilization dependent on plant phosphorus acquisition, Nat. Geosci., 12, 736–741, https://doi.org/10.1038/s41561-019-0404-9, 2019.
Gama-Rodrigues, A. C., Sales, M. V. S., Silva, P. S. D., Comerford, N. B., Cropper, W. P., and Gama-Rodrigues, E. F.: An exploratory analysis of phosphorus transformations in tropical soils using structural equation modeling, Biogeochemistry, 118, 453–469, https://doi.org/10.1007/s10533-013-9946-x, 2014.
Goll, D. S., Brovkin, V., Parida, B. R., Reick, C. H., Kattge, J., Reich, P. B., van Bodegom, P. M., and Niinemets, Ü.: Nutrient limitation reduces land carbon uptake in simulations with a model of combined carbon, nitrogen and phosphorus cycling, Biogeosciences, 9, 3547–3569, https://doi.org/10.5194/bg-9-3547-2012, 2012.
Goll, D. S., Moosdorf, N., Hartmann, J., and Brovkin, V.: Climate-driven changes in chemical weathering and associated phosphorus release since 1850: Implications for the land carbon balance, Geophys. Res. Lett., 41, 3553–3558, https://doi.org/10.1002/2014GL059471, 2014.
Goll, D. S., Vuichard, N., Maignan, F., Jornet-Puig, A., Sardans, J., Violette, A., Peng, S., Sun, Y., Kvakic, M., Guimberteau, M., Guenet, B., Zaehle, S., Penuelas, J., Janssens, I., and Ciais, P.: A representation of the phosphorus cycle for ORCHIDEE (revision 4520), Geosci. Model Dev., 10, 3745–3770, https://doi.org/10.5194/gmd-10-3745-2017, 2017.
Hahm, W. J., Riebe, C. S., Lukens, C. E., and Araki, S.: Bedrock composition regulates mountain ecosystems and landscape evolution, P. Natl. Acad. Sci. USA, 111, 3338–3343, https://doi.org/10.1073/pnas.1315667111, 2014.
He, X., Augusto, L., Goll, D. S., Ringeval, B., Wang, Y., Helfenstein, J., Huang, Y., Yu, K., Wang, Z., Yang, Y., and Hou, E.: Global patterns and drivers of soil total phosphorus concentration, figshare [data set], https://doi.org/10.6084/m9.figshare.14583375, 2021.
Helfenstein, J., Tamburini, F., von Sperber, C., Massey, M. S., Pistocchi, C., Chadwick, O. A., Vitousek, P. M., Kretzschmar, R., and Frossard, E.: Combining spectroscopic and isotopic techniques gives a dynamic view of phosphorus cycling in soil, Nat. Commun., 9, 3226, https://doi.org/10.1038/s41467-018-05731-2, 2018.
Hengl, T., Leenaars, J. G. B., Shepherd, K. D., Walsh, M. G., Heuvelink, G. B. M., Mamo, T., Tilahun, H., Berkhout, E., Cooper, M., Fegraus, E., Wheeler, I., and Kwabena, N. A.: Soil nutrient maps of Sub-Saharan Africa: assessment of soil nutrient content at 250 m spatial resolution using machine learning, Nutr. Cycl. Agroecosys., 109, 77–102, https://doi.org/10.1007/s10705-017-9870-x, 2017a.
Hengl, T., Mendes, D. J. J., Heuvelink, G. B., Ruiperez, G. M., Kilibarda, M., Blagotic, A., Shangguan, W., Wright, M. N., Geng, X., Bauer-Marschallinger, B., Guevara, M. A., Vargas, R., MacMillan, R. A., Batjes, N. H., Leenaars, J. G., Ribeiro, E., Wheeler, I., Mantel, S., and Kempen, B.: SoilGrids250m: Global gridded soil information based on machine learning, PLoS One, 12, e0169748, https://doi.org/10.1371/journal.pone.0169748, 2017b.
Hou, E., Chen, C., Luo, Y., Zhou, G., Kuang, Y., Zhang, Y., Heenan, M., Lu, X., and Wen, D.: Effects of climate on soil phosphorus cycle and availability in natural terrestrial ecosystems, Glob. Change Biol., 24, 3344–3356, https://doi.org/10.1111/gcb.14093, 2018a.
Hou, E., Tan, X., Heenan, M., and Wen, D.: A global dataset of plant available and unavailable phosphorus in natural soils derived by Hedley method, Scientific Data, 5, 180166, https://doi.org/10.1038/sdata.2018.166, 2018b.
Hou, E., Luo, Y., Kuang, Y., Chen, C., Lu, X., Jiang, L., Luo, X., and Wen, D.: Global meta-analysis shows pervasive phosphorus limitation of aboveground plant production in natural terrestrial ecosystems, Nat. Commun., 11, 637, https://doi.org/10.1038/s41467-020-14492-w, 2020.
Hou, E., Wen, D., Jiang, L., Luo, X., Kuang, Y., Lu, X., Chen, C., Allen, K. T., He, X., Huang, X., and Luo, Y.: Latitudinal patterns of terrestrial phosphorus limitation over the globe, Ecol. Lett., 24, 1420–1431, https://doi.org/10.1111/ele.13761, 2021.
Huston, M. A.: Precipitation, soils, NPP, and biodiversity: resurrection of Albrecht's curve, Ecol. Monogr., 82, 277–296, https://doi.org/10.1890/11-1927.1, 2012.
Huston, M. A. and Wolverton, S.: The global distribution of net primary production: resolving the paradox, Ecol. Monogr., 79, 343–377, https://doi.org/10.1890/08-0588.1, 2009.
Jenny, H.: Factors of soil formation; a system of quantitative pedology, McGraw-Hill, New York, USA, 1941.
Ji, H., Wen, J., Du, B., Sun, N., Berg, B., and Liu, C.: Comparison of the nutrient resorption stoichiometry of Quercus variabilis Blume growing in two sites contrasting in soil phosphorus content, Ann. Forest Sci., 75, 59, https://doi.org/10.1007/s13595-018-0727-5, 2018.
Kitayama, K., Majalap-Lee, N., and Aiba, S.: Soil Phosphorus Fractionation and Phosphorus-Use Efficiencies of Tropical Rainforests along Altitudinal Gradients of Mount Kinabalu, Borneo, Oecologia, 123, 342–349, https://doi.org/10.1007/s004420051020, 2000.
Kuhn, M.: caret: Classification and Regression Training, R package version 6.0-86, available at: https://github.com/topepo/caret/ (last access: 15 December 2021), 2020.
Li, P., Yang, Y., Han, W., and Fang, J.: Global patterns of soil microbial nitrogen and phosphorus stoichiometry in forest ecosystems, Global Ecol. Biogeogr., 23, 979–987, https://doi.org/10.1111/geb.12190, 2014.
Li, X., Li, Y., Peng, S., Chen, Y., and Cao, Y.: Changes in soil phosphorus and its influencing factors following afforestation in Northern China, Land Degrad. Dev., 30, 1655–1666, https://doi.org/10.1002/ldr.3345, 2019.
Liaw, A. and Wiener, M.: Classification and Regression by randomForest, R News, 2, 18–22, 2002.
Mage, S. M. and Porder, S.: Parent Material and Topography Determine Soil Phosphorus Status in the Luquillo Mountains of Puerto Rico, Ecosystems, 16, 284–294, https://doi.org/10.1007/s10021-012-9612-5, 2013.
Malone, B. P., Minasny, B., and McBratney, A. B.: Using R for Digital Soil Mapping, Springer, Cham, Switzerland, https://doi.org/10.1007/978-3-319-44327-0, 2017.
McGroddy, M. E.: LBA-ECO TG-07 Forest Soil P, C, and N Pools, km 83 Site, Tapajos National Forest, Oak Ridge National Laboratory Distributed Active Archive Center, Oak Ridge, Tennessee, USA [data set], https://doi.org/10.3334/ORNLDAAC/1085, 2012.
Mehmood, A., Akhtar, M. S., Imran, M., and Rukh, S.: Soil apatite loss rate across different parent materials, Geoderma, 310, 218–229, https://doi.org/10.1016/j.geoderma.2017.09.036, 2018.
Meinshausen, N.: Quantile Regression Forests, J. Mach. Learn. Res., 7, 983–999, 2006.
Meinshausen, N.: quantregForest: Quantile Regression Forests, available at: https://CRAN.R-project.org/package=quantregForest (last access: 15 December 2021), 2017.
Ploton, P., Mortier, F., Réjou-Méchain, M., Barbier, N., Picard, N., Rossi, V., Dormann, C., Cornu, G., Viennois, G., Bayol, N., Lyapustin, A., Gourlet-Fleury, S., and Pélissier, R.: Spatial validation reveals poor predictive performance of large-scale ecological mapping models, Nat. Commun., 11, 4540, https://doi.org/10.1038/s41467-020-18321-y, 2020.
Porder, S. and Chadwick, O. A.: Climate and Soil-Age Constraints on Nutrient Uplift and Retention by Plants, Ecology, 90, 623–636, https://doi.org/10.1890/07-1739.1, 2009.
Porder, S. and Ramachandran, S.: The phosphorus concentration of common rocks – a potential driver of ecosystem P status, Plant Soil, 367, 41–55, https://doi.org/10.1007/s11104-012-1490-2, 2013.
R Core Team: R: A language and environment for statistical computing, R Foundation for Statistical Computing, Vienna, Austria, available at: https://www.R-project.org/ (last access: 15 December 2021), 2018.
Reed, S. C., Yang, X., and Thornton, P. E.: Incorporating phosphorus cycling into global modeling efforts: a worthwhile, tractable endeavor, New Phytol., 208, 324–329, https://doi.org/10.1111/nph.13521, 2015.
Reich, P. B. and Oleksyn, J.: Global patterns of plant leaf N and P in relation to temperature and latitude, P. Natl. Acad. Sci. USA, 101, 11001–11006, https://doi.org/10.1073/pnas.0403588101, 2004.
Ringeval, B., Augusto, L., Monod, H., van Apeldoorn, D., Bouwman, L., Yang, X., Achat, D. L., Chini, L. P., Van Oost, K., Guenet, B., Wang, R., Decharme, B., Nesme, T., and Pellerin, S.: Phosphorus in agricultural soils: drivers of its distribution at the global scale, Glob. Change Biol., 23, 3418–3432, https://doi.org/10.1111/gcb.13618, 2017.
Rodionov, A., Bauke, S. L., von Sperber, C., Hoeschen, C., Kandeler, E., Kruse, J., Lewandowski, H., Marhan, S., Mueller, C. W., Simon, M., Tamburini, F., Uhlig, D., von Blanckenburg, F., Lang, F., and Amelung, W.: Biogeochemical cycling of phosphorus in subsoils of temperate forest ecosystems, Biogeochemistry, 150, 313–328, https://doi.org/10.1007/s10533-020-00700-8, 2020.
Shangguan, W., Dai, Y., Duan, Q., Liu, B., and Yuan, H.: A global soil data set for earth system modeling, J. Adv. Model. Earth Syst., 6, 249–263, https://doi.org/10.1002/2013MS000293, 2014.
Shangguan, W., Hengl, T., Mendes De Jesus, J., Yuan, H., and Dai, Y.: Mapping the global depth to bedrock for land surface modeling, J. Adv. Model. Earth Syst., 9, 65–88, https://doi.org/10.1002/2016MS000686, 2017.
Siqueira, R. G., Schaefer, C. E. G. R., Fernandes Filho, E. I., Corrêa, G. R., Francelino, M. R., Souza, J. J. L. L., and Rocha, P. D. A.: Weathering and pedogenesis of sediments and basaltic rocks on Vega Island, Antarctic Peninsula, Geoderma, 382, 114707, https://doi.org/10.1016/j.geoderma.2020.114707, 2021.
Smeck, N. E.: Phosphorus dynamics in soils and landscapes, Geoderma, 36, 185–199, https://doi.org/10.1016/0016-7061(85)90001-1, 1985.
Smil, V.: Phosphorus in the environment: natural flows and human interferences, Annu. Rev. Energ. Env., 25, 53–88, https://doi.org/10.1146/annurev.energy.25.1.53, 2000.
Spohn, M.: Increasing the organic carbon stocks in mineral soils sequesters large amounts of phosphorus, Glob. Change Biol., 26, 4169–4177, https://doi.org/10.1111/gcb.15154, 2020.
Strobl, C., Boulesteix, A., Kneib, T., Augustin, T., and Zeileis, A.: Conditional variable importance for random forests, BMC Bioinformatics, 9, 307, https://doi.org/10.1186/1471-2105-9-307, 2008.
Sun, Y., Peng, S., Goll, D. S., Ciais, P., Guenet, B., Guimberteau, M., Hinsinger, P., Janssens, I. A., Peñuelas, J., Piao, S., Poulter, B., Violette, A., Yang, X., Yin, Y., and Zeng, H.: Diagnosing phosphorus limitations in natural terrestrial ecosystems in carbon cycle models, Earth's Future, 5, 730–749, https://doi.org/10.1002/2016EF000472, 2017.
Tipping, E., Somerville, C. J., and Luster, J.: The C:N:P:S stoichiometry of soil organic matter, Biogeochemistry, 130, 117–131, https://doi.org/10.1007/s10533-016-0247-z, 2016.
Turner, B. L. and Engelbrecht, B. M. J.: Soil organic phosphorus in lowland tropical rain forests, Biogeochemistry, 103, 297–315, https://doi.org/10.1007/s10533-010-9466-x, 2011.
Viscarra Rossel, R. A. and Bui, E. N.: A new detailed map of total phosphorus stocks in Australian soil, Sci. Total Environ., 542, 1040–1049, https://doi.org/10.1016/j.scitotenv.2015.09.119, 2016.
Vitousek, P. M. and Chadwick, O. A.: Pedogenic Thresholds and Soil Process Domains in Basalt-Derived Soils, Ecosystems, 16, 1379–1395, https://doi.org/10.1007/s10021-013-9690-z, 2013.
Vitousek, P. M., Porder, S., Houlton, B. Z., and Chadwick, O. A.: Terrestrial phosphorus limitation: mechanisms, implications, and nitrogen–phosphorus interactions, Ecol. Appl., 20, 5–15, https://doi.org/10.1890/08-0127.1, 2010.
Walker, T. W. and Syers, J. K.: The fate of phosphorus during pedogenesis, Geoderma, 15, 1–19, https://doi.org/10.1016/0016-7061(76)90066-5, 1976.
Wang, Y., Zhang, X., and Huang, C.: Spatial variability of soil total nitrogen and soil total phosphorus under different land uses in a small watershed on the Loess Plateau, China, Geoderma, 150, 141–149, https://doi.org/10.1016/j.geoderma.2009.01.021, 2009.
Wang, Y., Zhang, Q., Pitman, A. J., and Dai, Y.: Nitrogen and phosphorous limitation reduces the effects of land use change on land carbon uptake or emission, Environ. Res. Lett., 10, 14001, https://doi.org/10.1088/1748-9326/10/1/014001, 2015.
Wang, Y. P., Law, R. M., and Pak, B.: A global model of carbon, nitrogen and phosphorus cycles for the terrestrial biosphere, Biogeosciences, 7, 2261–2282, https://doi.org/10.5194/bg-7-2261-2010, 2010.
Wang, Z., Tian, H., Yang, J., Shi, H., Pan, S., Yao, Y., Banger, K., and Yang, Q.: Coupling of Phosphorus Processes With Carbon and Nitrogen Cycles in the Dynamic Land Ecosystem Model: Model Structure, Parameterization, and Evaluation in Tropical Forests, J. Adv. Model. Earth Syst., 12, e2020MS002123, https://doi.org/10.1029/2020MS002123, 2020.
Wang, Z., Wang, M., Yu, K., Hu, H., Yang, Y., Ciais, P., Ballantyne, A. P., Niklas, K. J., Huang, H., Yao, B., and Wright, S. J.: Global synthesis for the scaling of soil microbial nitrogen to phosphorus in terrestrial ecosystems, Environ. Res. Lett., 16, 044034, https://doi.org/10.1088/1748-9326/abed78, 2021.
Wardle, D. A., Walker, L. R., Bardgett, R. D., and Sveriges, L.: Ecosystem Properties and Forest Decline in Contrasting Long-Term Chronosequences, Science, 305, 509–513, https://doi.org/10.1126/science.1098778, 2004.
Wassen, M. J., Schrader, J., van Dijk, J., and Eppinga, M. B.: Phosphorus fertilization is eradicating the niche of northern Eurasia's threatened plant species, Nature Ecology & Evolution, 5, 67–73, https://doi.org/10.1038/s41559-020-01323-w, 2021.
Wieder, W. R., Cleveland, C. C., Smith, W. K., and Todd-Brown, K.: Future productivity and carbon storage limited by terrestrial nutrient availability, Nat. Geosci., 8, 441–444, https://doi.org/10.1038/ngeo2413, 2015.
Xu, X., Thornton, P. E., and Post, W. M.: A global analysis of soil microbial biomass carbon, nitrogen and phosphorus in terrestrial ecosystems, Global Ecol. Biogeogr., 22, 737–749, https://doi.org/10.1111/geb.12029, 2013.
Yan, T., Zhu, J., and Yang, K.: Leaf nitrogen and phosphorus resorption of woody species in response to climatic conditions and soil nutrients: a meta-analysis, J. Forestry Res., 29, 905–913, https://doi.org/10.1007/s11676-017-0519-z, 2018.
Yanai, R. D.: The effect of whole-tree harvest on phosphorus cycling in a northern hardwood forest, Forest Ecol. Manag., 104, 281–295, https://doi.org/10.1016/S0378-1127(97)00256-9, 1998.
Yang, X., Post, W. M., Thornton, P. E., and Jain, A.: The distribution of soil phosphorus for global biogeochemical modeling, Biogeosciences, 10, 2525–2537, https://doi.org/10.5194/bg-10-2525-2013, 2013.
Yang, X., Thornton, P. E., Ricciuto, D. M., and Post, W. M.: The role of phosphorus dynamics in tropical forests – a modeling study using CLM-CNP, Biogeosciences, 11, 1667–1681, https://doi.org/10.5194/bg-11-1667-2014, 2014.
Zhang, C., Tian, H., Liu, J., Wang, S., Liu, M., Pan, S., and Shi, X.: Pools and distributions of soil phosphorus in China, Global Biogeochem. Cy., 19, GB1020, https://doi.org/10.1029/2004GB002296, 2005.
Zhang, Q., Wang, Y. P., Pitman, A. J., and Dai, Y. J.: Limitations of nitrogen and phosphorous on the terrestrial carbon uptake in the 20th century, Geophys. Res. Lett., 38, L22701, https://doi.org/10.1029/2011GL049244, 2011.
Zhang, Y.-W., Guo, Y., Tang, Z., Feng, Y., Zhu, X., Xu, W., Bai, Y., Zhou, G., Xie, Z., and Fang, J.: Patterns of nitrogen and phosphorus pools in terrestrial ecosystems in China, Earth Syst. Sci. Data, 13, 5337–5351, https://doi.org/10.5194/essd-13-5337-2021, 2021.