the Creative Commons Attribution 4.0 License.
the Creative Commons Attribution 4.0 License.
 | 26 Oct 2021
Ground-based vertical profile observations of atmospheric composition on the Tibetan Plateau (2017–2019)
Chengzhi Xing
Hongyu Wu
Jinan Lin
Fan Wang
Shuntian Wang
The Tibetan Plateau (TP) plays an essential role in modulating regional and global climate, and its influence on climate is also affected by human-related processes, including changes in atmospheric composition. However, observations of atmospheric composition, especially vertical profile observations, remain sparse and rare on the TP, due to extremely high altitude, topographical heterogeneity and the grinding environment. Accordingly, the forcing and feedback of atmospheric composition from rapidly changing surrounding regions to regional environmental and climate change in the TP remains poorly understood. This paper introduces a high-time-resolution (∼15 min) vertical profile observational dataset of atmospheric composition (aerosols, NO2, HCHO and HONO) on the TP for more than 1 year (2017–2019) using a passive remote sensing technique. The diurnal pattern, vertical distribution and seasonal variations of these pollutants are documented here in detail. The sharing of this dataset would benefit the scientific community in exploring source–receptor relationships and the forcing and feedback of atmospheric composition on the TP to the regional and global climate. It also provides potential to improve satellite retrievals and to facilitate the development and improvement of models in cold regions. The dataset is freely available at Zenodo (https://doi.org/10.5281/zenodo.5336460; Xing, 2021).
- Article
(2432 KB) - Full-text XML
-
Supplement
(561 KB) - BibTeX
- EndNote


The Tibetan Plateau (TP) and the surrounding Hindu Kush Himalayan mountains are referred to as the world's “Third Pole” due to their vast wealth of areas and glaciers (Qiu, 2008). The TP is the highest and largest plateau in the world with a ∼4000 m average elevation. Headwaters of six major rivers in Asia start on the TP (Kang et al., 2010; Cheng and Jin, 2013), and it thus acts the role of the “Water Tower of Asia”, determining the survival and development of more than 2 billion people (Xu et al., 2008; Immerzeel et al., 2010; J. Gao et al., 2019; Kang et al., 2019). A number of studies have suggested that the TP is an important driving force to thermally and dynamically affect global and regional climate (Yanai et al., 1992; Liu et al., 2007; Boos and Kuang, 2010). In contrast to the surrounding cold middle troposphere, the TP receives strong solar radiation at the surface owing to its topographic characteristics, leading to its critical role in the evolution and variability of South Asian and East Asian monsoons (Wu et al., 2007, 2012). It also acts as a natural barrier that inhibits northward moisture transport (Dong et al., 2017) and splits subtropical westerlies (Bolin, 1950). The TP is usually regarded as one of the most sensitive areas responding to global environmental and climate change (Peng et al., 2012) and can amplify the changes to a global scale (Kang et al., 2010).
Recent decades have witnessed increased warming, together with the retreat of glaciers and early melting of snow, on the TP (He et al., 2003; Lau et al., 2010; Xu et al., 2016), leading to serious side issues, including soil erosion, floods, etc. (Shrestha et al., 1999). As the warming rate of the TP is much faster than the greenhouse warming rate, it has been argued that other factors besides greenhouse warming might have resulted in accelerated warming over the TP (Kang et al., 2000; Ramanathan et al., 2007). The TP was usually considered a background region of atmospheric composition due to low population density and less intense human activities. However, studies in the past decade have suggested that transport of pollutants from South Asia, East Asia and Southeast Asia cannot be ignored (Cong et al., 2009; Yao et al., 2012; Zhang et al., 2015; Kang et al., 2019). Ample evidence has demonstrated the significance of atmospheric composition in influencing the retreat of glaciers on the TP (Xu et al., 2009), while large uncertainties remain in understanding the sources, mainly owing to lack of long-term observations that have been obstructed by complex topography and a harsh environment (Cong et al., 2015a; Barnett et al., 2005; Pu et al., 2007; Bolch et al., 2012; Kang et al., 2016).
To fill these gaps, a series of field campaigns have been carried out in recent years to unveil the features of weather and atmospheric composition over the TP, especially after the “second comprehensive scientific expedition to the Qinghai–Tibet Plateau” plan (Wang et al., 2021; Che and Zhao, 2021; H. Liu et al., 2021). The Institute of Tibetan Plateau Research, Chinese Academy of Sciences (ITP, CAS), established six long-term stations to measure both meteorological and micrometeorological variables over the TP (Ma et al., 2020a, b). The China National Environmental Monitoring Center (CNEMC) has also established an atmospheric composition monitoring network (Gao et al., 2020b; Liang et al., 2017) on the TP that has continuously monitored the ground-level concentrations of PM2.5, PM10, NO2, SO2, O3 and CO since 2013, covering Lhasa, Shigatse, Qamdo, Nyingchi, Shannan, Nagqu and Ngari. Satellite retrievals (i.e., OMI, MODIS and CALIPSO) have also been widely applied to elucidate the spatial and temporal variation in atmospheric processes over the TP (Zhu et al., 2019; Li et al., 2020). Although the vertical profiles of aerosols were revealed with CALIPSO (Huang et al., 2007), the relatively long revisiting time (∼16 d) hinders understanding of processes at smaller scales. Accordingly, the current atmospheric composition monitoring platforms and freely available datasets are inadequate to fully understand the sources and impacts of atmospheric composition on the TP, as the formation, aging and transport processes also occur above the ground (Hindman and Upadhyay, 2002; Duo et al., 2018; Huang et al., 2007). If we use only satellite column or ground-level observations to infer transport fluxes of atmospheric trace gases, the relative significance of local and transport contributions could be overvalued/downplayed (Hu et al., 2020; Liu et al., 2021a). In addition, the low air density, land surface heterogeneity, relatively cold temperature and strong solar radiation on the TP cause a relatively high planetary boundary layer (PBL) compared to over its surrounding lowlands (Yang et al., 2003; Seidel et al., 2010). The conditions promote the exchange of atmosphere between the PBL and stratosphere, which has important impacts on atmospheric chemistry (Škerlak et al., 2014). The lack of sufficient vertical profile observation data limits the understanding of atmospheric composition on the TP and its impact on the global climate.
Limited field experiments have been conducted using balloon and lidar on the TP in recent years (Wu et al., 2016; Dai et al., 2018; Fang et al., 2019; Zhang et al., 2020). The instruments used are costly, and very limited atmospheric composition species (mostly O3) can be measured. Additionally, these observations are not open for sharing or have very limited availability upon request (i.e., only data during specified periods are provided). The coarse temporal resolution of these data is not sufficient for evaluations of chemical transport modeling and climate modeling (Gao et al., 2020a). Multi-axis differential optical absorption spectroscopy (MAX-DOAS) uses scattered sunlight as the signal source, enabling it to achieve low-cost and continuous measurement of vertical profiles of atmospheric composition.
Here we describe and provide access to a high-time-resolution dataset of vertical profiles of atmospheric composition over the TP for more than 1 year. This database will play a critical role in improving satellite retrievals and numerical modeling of atmospheric composition over the TP. The uncertainties in the air mass factor (AMF) caused by the high surface albedo and the absence of an a priori profile on the TP could lead to large uncertainties in satellite retrievals of trace gases. Previously, we have demonstrated that using the AMF calculated with MAX-DOAS-measured NO2 vertical profiles could remarkably improve the accuracy of retrievals of NO2 column densities (VCDs) (Liu et al., 2016; Xing et al., 2017). On top of that, due to complex terrain and weather conditions, uncertainties in emission inventories, and imperfect model parameterization, chemical transport models face difficulties in capturing the vertical structures of atmospheric composition on the TP (Yang et al., 2018b), the uncertainties of which could be constrained through the assimilation of observations from this dataset. Section 2 describes the observation site, MAX-DOAS instrument and retrieval algorithms. The vertical profiles of aerosols, NO2, HCHO and HONO and their diurnal and monthly variations are introduced in Sect. 3. Sections 4 and 5 present the availability of this dataset (Xing et al., 2021) and a summary, respectively.
2.1 Description of the monitoring site
The MAX-DOAS instrument was set up at the Qomolangma Atmospheric and Environmental Observation and Research Station, CAS (QOMS) (4276 m a.s.l.; 28.21∘ N, 86.56∘ E), which is located at the bottom of the lower Rongbuk valley (Fig. 1). The geomorphic setting of this station is mainly alpine covered by sandy soil, and sparse vegetation exists. During the summer monsoon season, abundant moisture from the Indian Ocean prevails at CAS (QOMS), increasing humidity and precipitation there. The maximum humidity was observed from July to August, and lower values usually appeared from December to February (Zhang et al., 2018; Chen et al., 2018). To the south of the measurement site is the South Asian subcontinent, covering Nepal, India and Bangladesh. The South Asian subcontinent is currently one of the most polluted regions in the world. Averaged spatial distributions of satellite-monitored aerosol optical depth (AOD), NO2 and HCHO from December 2017 to March 2019 are displayed in Fig. S1 in the Supplement. Elevated AOD, NO2 and HCHO values are found in the southern foothills of the Himalayas compared to those on the Tibetan Plateau. Local circulations, such as valley winds, closely connect the near-surface atmosphere with the free atmosphere on the north side of Mt. Everest, and the South Asia summer monsoon could drive pollutants from the South Asian subcontinent to influence atmospheric composition over the TP. Accordingly, the CAS (QOMS) site acts as a terrific location to monitor the vertical distribution of atmospheric composition and to explore the sources and impacts of these pollutants.
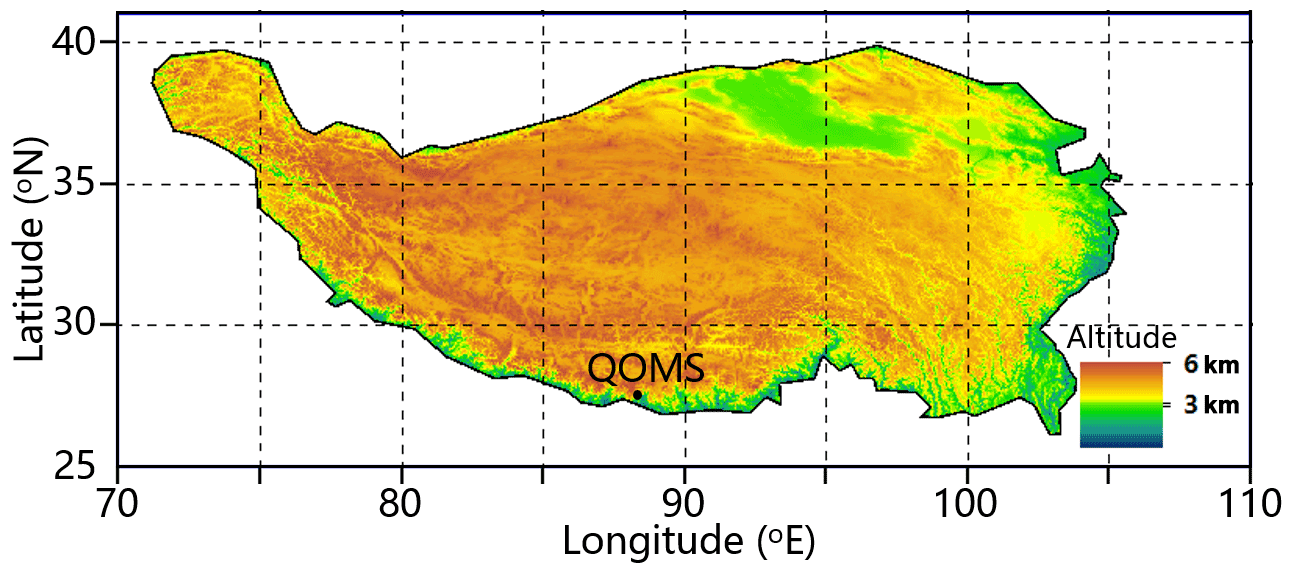
Figure 1Elevation map of the TP and location of the CAS (QOMS) monitoring site.
2.2 Description of the MAX-DOAS instrument
The MAX-DOAS instrument at CAS (QOMS) was operated from December 2017 to March 2019. It consisted of two key parts, namely the telescope scanner unit and the spectrometer unit (Fig. 2). Temperature stabilization of both spectrometers; USB communication and control electronics for additional sensors to record temperature, pressure and inclination; and the telescope elevation stepper motor were also incorporated.
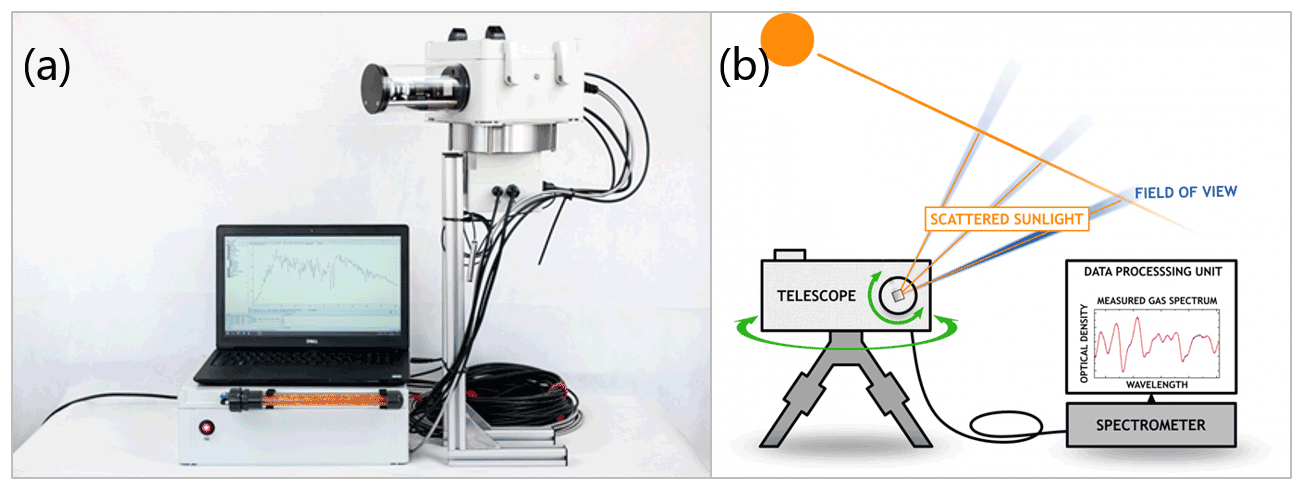
The telescope unit contained motor, electronics, a MEMS inclination sensor and optical components. A quartz-glass tube was used to protect the rotating prism, which reflected the light through a lens onto the fiber at the end of an adjustable tube. This unit was controlled by a stepping motor to collect the scattered sunlight at different elevation angles, which was then transmitted via a glass fiber bundle to the spectrometer unit. The stepping motor had a precision of 0.01∘, and the field of view (FOV) of the telescope was less than 0.3∘. The telescope scanner unit covered elevation angles from −10 to 180∘, with an angle accuracy of <0.1∘. Moreover, an azimuth motor covering 0–180∘ was installed in the telescope scanner unit to observe atmospheric composition at different azimuth angles. In this study, we set the elevation angle sequence to 1, 2, 3, 4, 5, 6, 8, 10, 15, 30 and 90∘ and exposure time of each individual spectrum to 1 min. The telescope unit was pointed to an azimuth angle of 53∘.
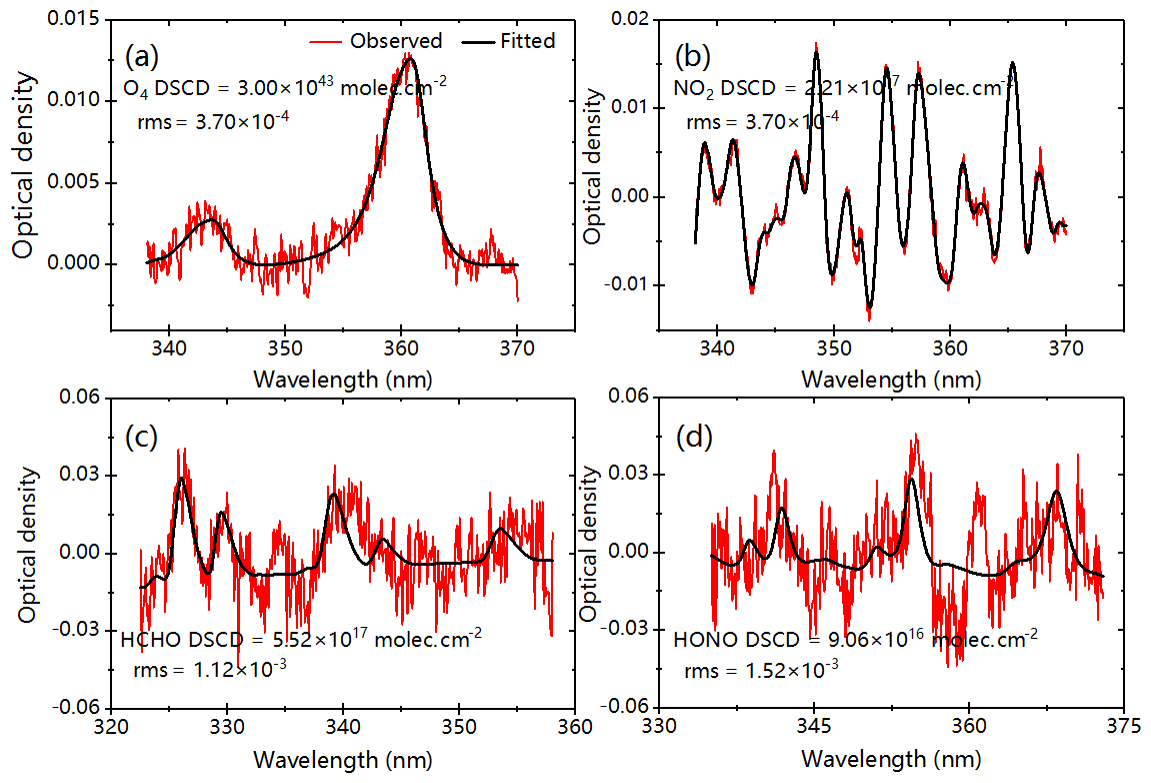
Figure 3Examples of DOAS fits for O4, NO2, HCHO and HONO (∼ 13:30 LST on 22 May 2018; SZA and elevation angle (EVA) values were 52.53 and 15∘, respectively).
The spectrometer unit included two AvaSpec-ULS2048L spectrometers (UV 300–460 nm, visible 460–630 nm) with a 0.6 nm spectral resolution. A cooling unit was used to control the spectrometer temperature. Typical instrumental stray light was <0.05 %, with a root mean square (rms) of (visible) and (UV) for ∼1000 scans around noon (11:00–13:00, UTC+8). A Peltier element was mounted on the spectrometer housing to cool and heat the spectrometer, and the temperature was stabilized at 20 ∘C with low fluctuations of <0.05 ∘C. We also equipped a charge-coupled device camera (Sony ILX511 with 2048 pixels) to the spectrometer to convert the analog signal to a digital signal. Moreover, the dark current and electric offset were recorded at night to correct the observed spectra. To avoid the strong absorption of the stratosphere, this study analyzed only spectra collected when the solar zenith angle (SZA) was less than 75∘.
2.3 Spectral retrieval
This study used the QDOAS software developed by the Royal Belgian Institute for Space Aeronomy (BIRA-IASB) (http://uv-vis.aeronomie.be/software/QDOAS/, last access: 26 April 2021) to retrieve differential slant column densities (DSCDs) of the oxygen dimer (O4), NO2, HCHO and HONO. A sequential zenith spectrum, estimated from interpolation of two zenith spectra recorded before and after an elevation sequence, was selected as the Frauenhofer reference spectrum. The retrieval configuration settings followed Xing et al. (2020, 2021) and the configurations used in the CINDI intercomparison campaign as well (Roscoe et al., 2010; Kreher et al., 2020; Y. Wang et al., 2020) (details are listed in Table 1). Figure 3 illustrates the DOAS fits of the above four species, and reasonably good fitting with tiny values of the rms can be found. Retrieved data with rms values larger than , , and for O4, NO2, HCHO and HONO, respectively, were filtered out. We also calculated the color index (CI), defined as the ratio of spectral intensities at 330 nm to those at 390 nm, to remove the cloud effects (Wagner et al., 2016). We filtered out data when the CI was less than 10 % of the threshold that was obtained through fitting a fifth-order polynomial to CI data (Ryan et al., 2018). After these processes, 90.17 %, 86.41 %, 83.22 % and 80.19 %, respectively, of the original DSCDs data were marked as qualified.
Table 1Detailed retrieval settings of O4, NO2, HCHO and HONO.
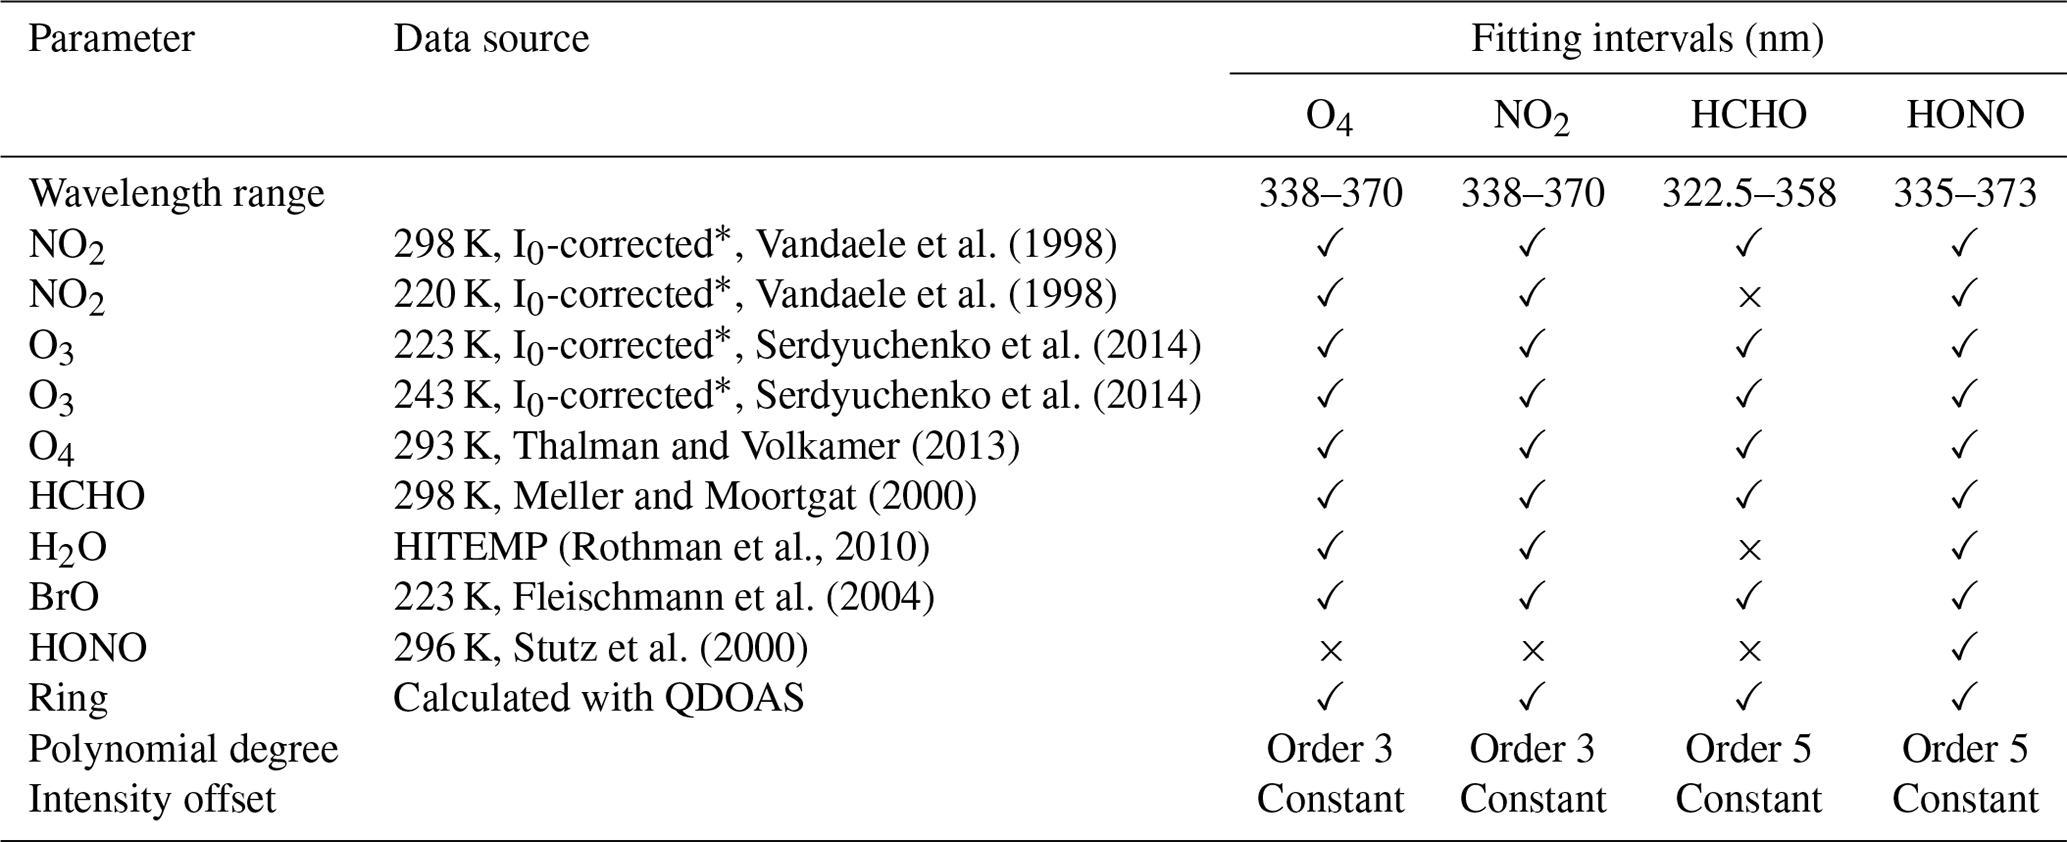
* Solar I0 correction, Aliwell et al. (2002).
2.4 Vertical profile retrieval algorithm
The vertical profiles of aerosol extinction and volume mixing ratios (VMRs) of trace gases (i.e., NO2, HCHO and HONO) were retrieved using the optimal estimation method (OEM)-based algorithm. The radiative transfer model VLIDORT (Spurr, 2006) was used as the forward model. The maximum posteriori state vector x was determined through optimizing the following cost function χ2.
where F(x,b) denotes the measurement vector y (DSCDs measured at different elevation angles) as a function of the state vector x (pollutant profiles) and the true atmospheric meteorological parameters (profiles of temperature and pressure, albedo, and aerosol phase function). xa stands for the a priori state vector. Sε and Sa represent the covariance matrices of y and xa, respectively. During the retrieval process, an exponentially decreasing shape was assumed as the initial a priori vertical profile shape of aerosols and trace gases, and the corresponding WRF-Chem-simulated AOD and VCDs were also used as input a priori information. The inversion strategy used a Gauss–Newton (GN) scheme (Wedderburn, 1974). The iterative weighting function K was calculated using the Jacobians of DSCDs. The inversion consisted of two steps. The aerosol vertical profile was retrieved first and then fed into the forward model to retrieve the trace gases' profile.
In this study, we derived the vertical profiles of aerosols and trace gases at 30 vertical layers, covering from 0.0 to 3.0 km, and a 1.0 km correlation length was chosen. For forward simulations, the surface albedo and surface altitude were set as 0.08 and 4.2 km, respectively. In addition, a fixed single-scattering albedo (SSA) of 0.85 and an aerosol phase function with an asymmetry parameter of 0.65 were selected, due to the low uncertainties in retrieved aerosols with a fixed SSA and asymmetry parameter (Irie et al., 2008). The profiles of aerosols and trace gases were filtered out when the degree of freedom (df) was less than 1.0 and the retrieved relative error larger than 100 %.
Figure 4 illustrates the monthly data integrity of vertical profiles of aerosols, NO2, HCHO and HONO at CAS (QOMS). The value of 100 indicates completely continuous observations. Better data integrity occurred mostly in autumn, and serious missingness happened mainly in summer. Missing data were largely associated with power outages of the instrument or the measurement station, technical problems of the instrument, poor data quality under unfavorable weather conditions (i.e., rain or high cloud coverage), and retrieval failure (i.e., high retrieval error or low df's). Considering the heterogeneity of atmospheric composition in the vertical direction, the resolutions of vertical profiles within 0–1.0 and 1.0–3.0 km were set to 0.1 and 0.2 km, respectively. During the day, the PBL over the TP could reach as high as 1–3 km (Chen et al., 2016; Xu et al., 2019). We thus used three representative layers, namely 0–100, 500–600 and 900–1000 m, to represent the bottom, middle and upper boundary layers.

3.1 Aerosols
As indicated in Fig. 5, the maximum AOD over the TP occurred in August (1.19), which was almost double the minimum that happened in April (0.57). However, the high levels of AOD in summer might have been overestimated due to the poor integrity of AOD data in summer (Fig. 4, 12.91 % in July and 22.58 % in August). Relatively enhanced levels of AOD started from September and persisted till February. Such an enrichment was likely to be associated with both the increased anthropogenic emissions due to tourism and the transported pollution plume from South Asia. The ground surface of CAS (QOMS) is exposed continually throughout the year and is rarely covered by ice, snow or vegetation. Valley and mountain winds in this region began to strengthen from October, and strong winds persisted throughout the whole winter to blow soil and dust particles into the atmosphere (Xu et al., 2015; Liu et al., 2017; Chen et al., 2018).
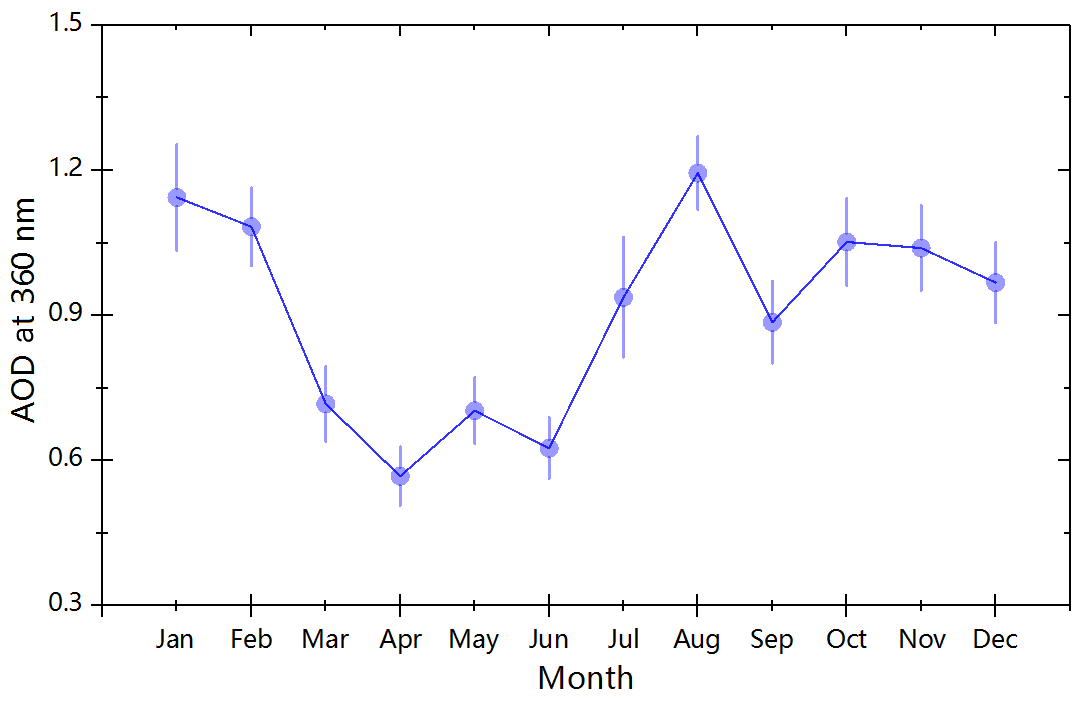
Figure 6a shows the time series of the hourly averaged aerosol extinction coefficient at layers of 0–100, 500–600 and 900–1000 m from December 2017 to February 2019. It suggests that the elevated abundance of aerosols was mainly concentrated in the lower layer and aerosol loadings decreased with height. Consistent with the seasonality shown in Fig. 5, high aerosol extinction coefficients appeared frequently in autumn and winter. Figure 6a also indicates that strong aerosol extinction coefficients occurred occasionally in the middle layer, associated with the long-range transport of particles (Zhang et al., 2018; Chen et al., 2018). The total-averaged and seasonally averaged vertical profiles of aerosol extinction are displayed in Fig. 7. All averaged profiles exhibit an exponentially decreasing shape with maximum values occurring near the surface. The aerosol extinction coefficient in the lower layer varied with seasons, with a maximum in autumn (1.55 km−1) and minimum in spring (1.00 km−1). The ratios of aerosol extinction coefficients in the middle layer to those in the lower boundary layer were 44.96 %, 41.11 %, 44.35 %, 40.01 % and 52.31 % for the total-averaged, spring-averaged, summer-averaged, autumn-averaged and winter-averaged aerosol profiles, respectively. These numbers decreased to 24.81 %, 22.72 %, 25.87 %, 21.29 % and 30.02 % for the upper layer. Relatively high levels of aerosols above ground during winter are associated with strong mountain-valley breeze, which can blow dust on the ground surface into high layers (Liu et al., 2017). Aerosol pollution is also more severe in winter in South Asia (M. Gao et al., 2019) and can be transported as an important source of aerosols over the TP (Xia et al., 2011; Lu et al., 2012; Cong et al., 2015a, b; Li et al., 2016; Chen et al., 2018; Zhang et al., 2018).
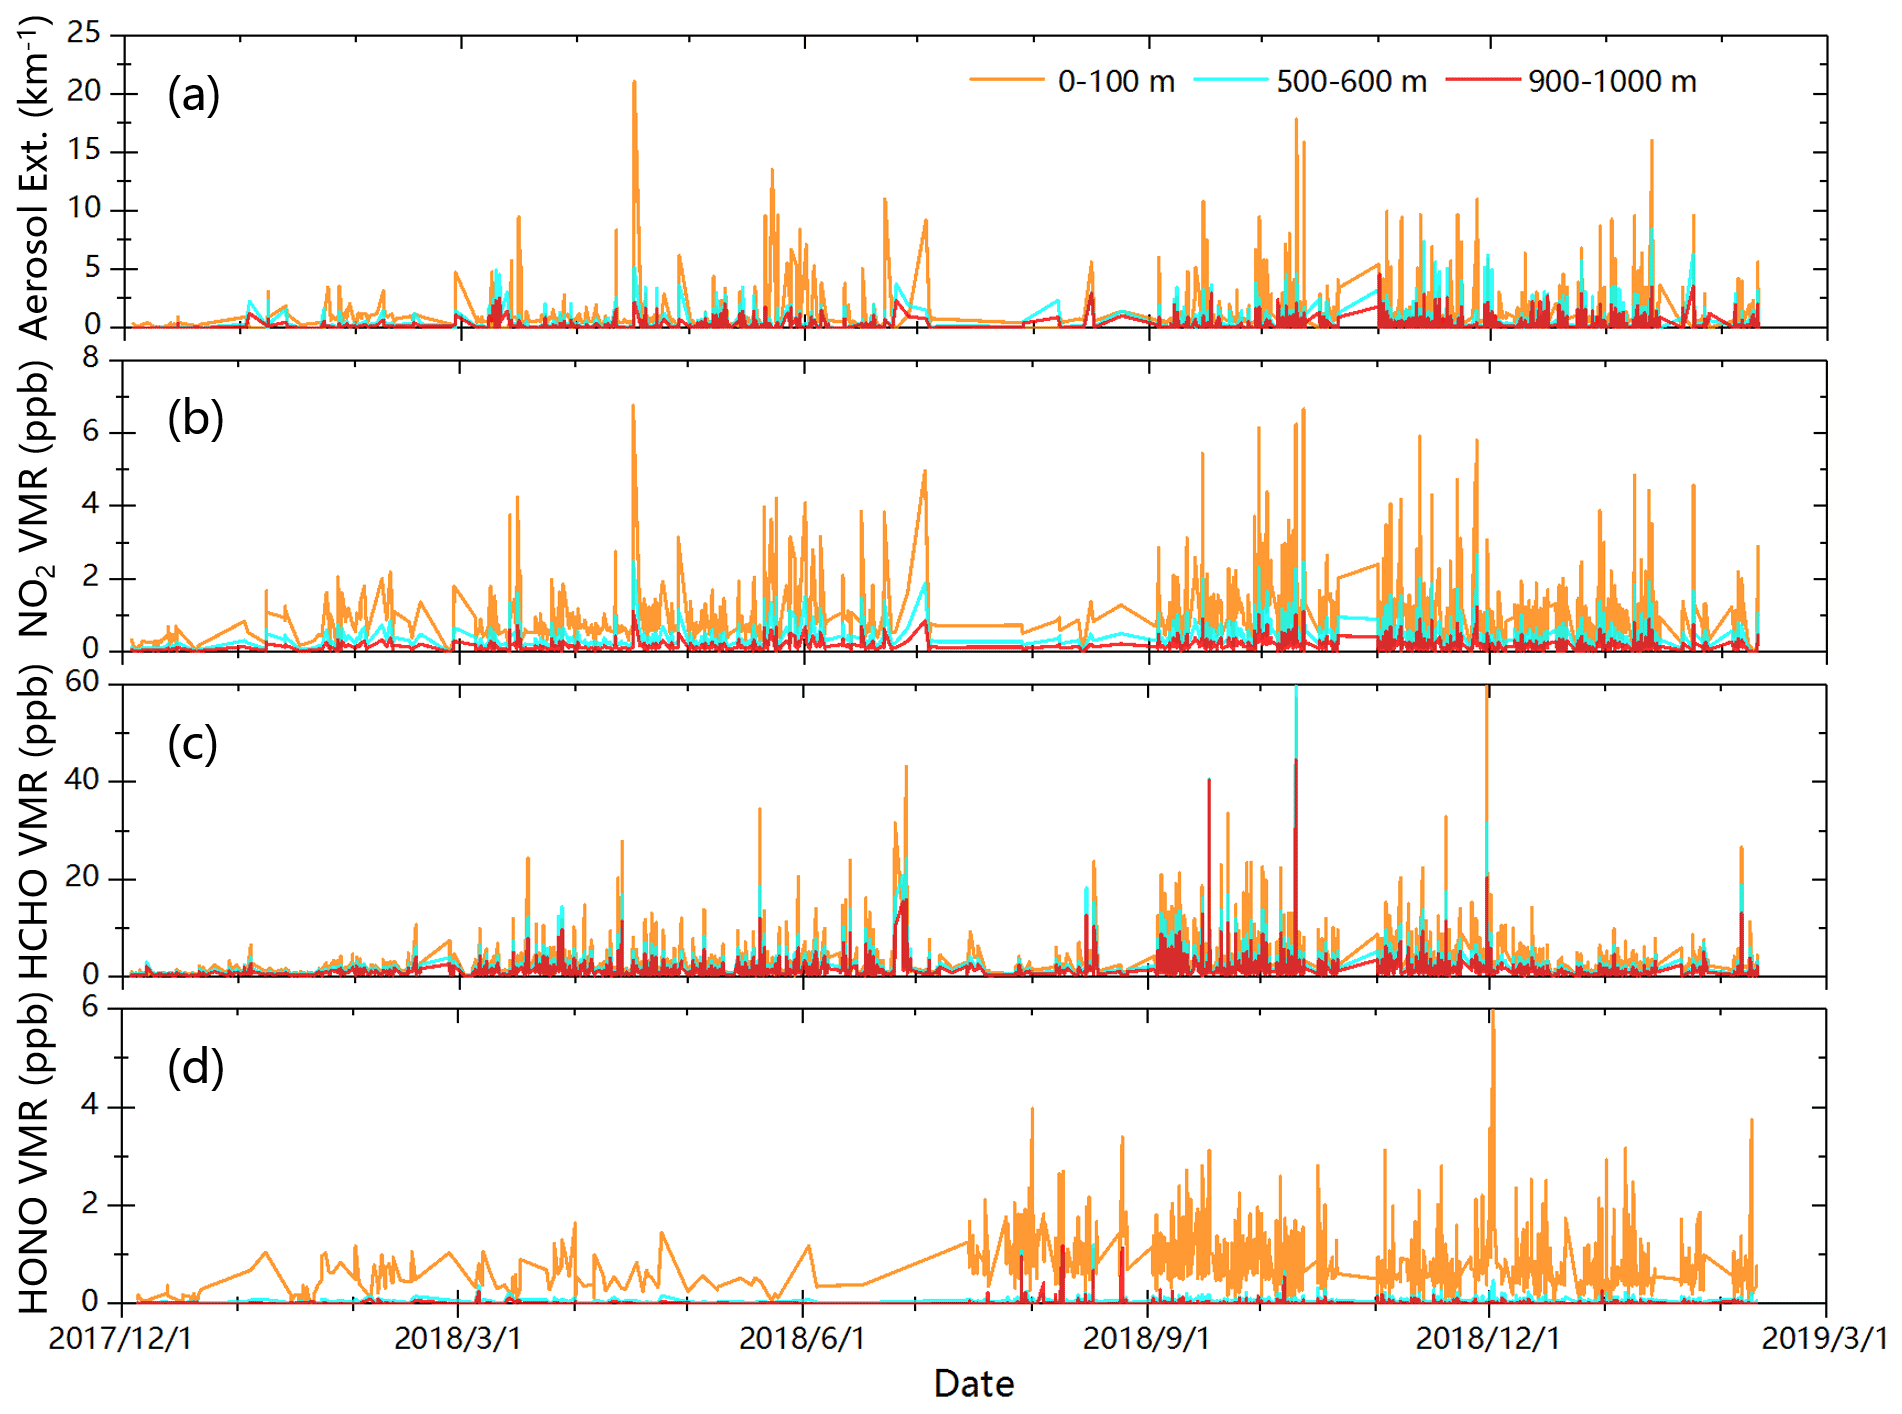
Figure 6Time series of hourly averaged (a) aerosol extinction, (b) NO2, (c) HCHO and (d) HONO from December 2017 to February 2019 at CAS (QOMS).
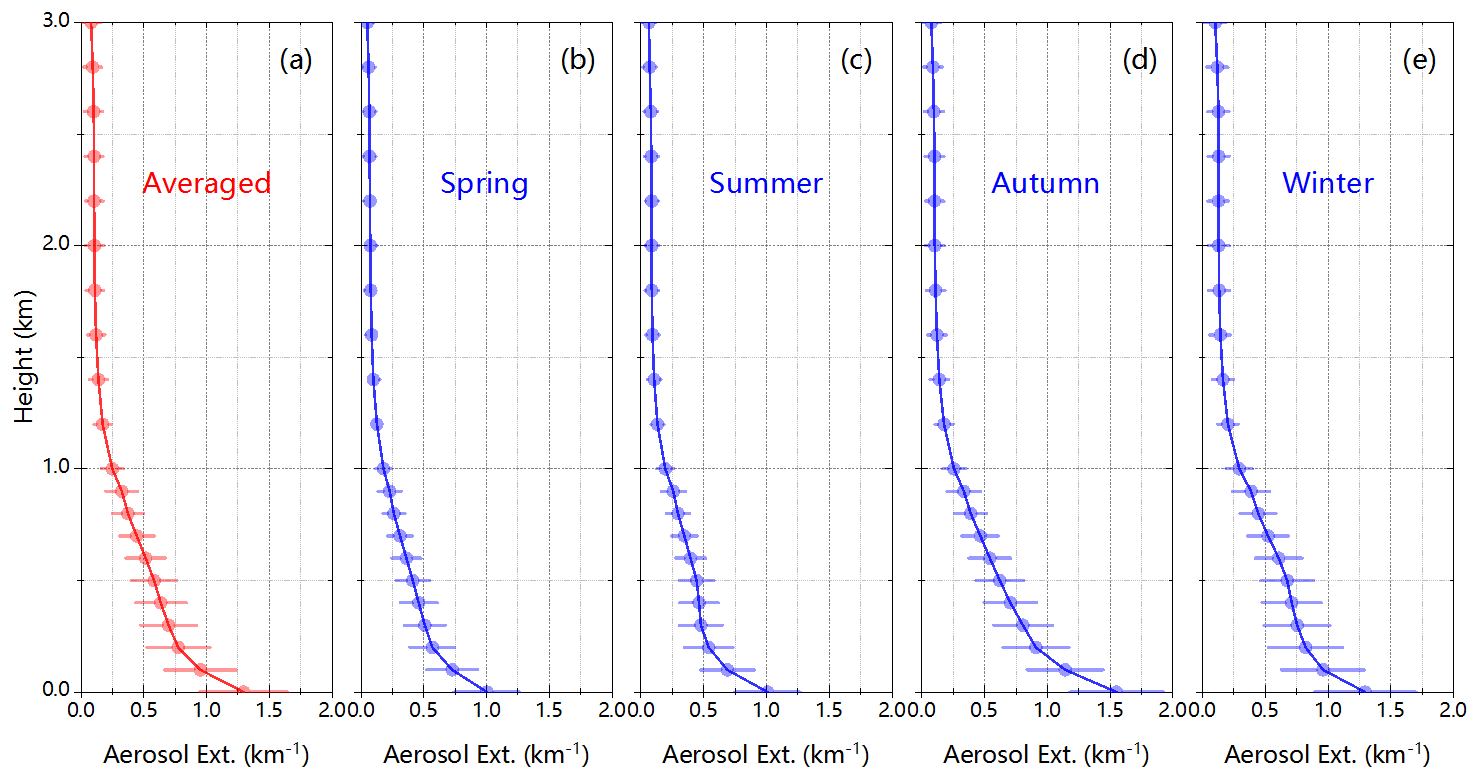
Figure 7(a) Total-averaged, (b) spring-averaged, (c) summer-averaged, (d) autumn-averaged and (e) winter-averaged aerosol extinction vertical profiles from December 2017 to February 2019 at CAS (QOMS).
Figure 8a–e illustrate the diurnal variations in aerosol vertical profiles for different seasons. Lower aerosol extinction mainly occurred before 10:00 BJT, and it gradually increased and spread to higher altitudes with the rise of the planetary boundary layer (PBL) height after 10:00 BJT. Moreover, aerosol extinction showed bi-peak patterns in all four seasons. One peak appeared between 10:30–12:30 BJT, and the other one occurred after 14:00 BJT. This bi-peak pattern was in line with previous investigation by Liu et al. (2017), dominated by the effects of local aerosol emissions, local dust geomorphology and mountain-valley breeze (Liu et al., 2017). We observed also that the diffusion height of aerosols exhibited a maximum in summer and minimum in winter, mainly due to differences in PBL height driven by temperature in four seasons.

Figure 8Diurnal variations in the total-averaged and seasonally averaged aerosol extinction profiles (a–e), NO2 profiles (f–j), HCHO profiles (k–o) and HONO profiles (p–t) from December 2017 to February 2019 at CAS (QOMS).
3.2 Nitrogen dioxide (NO2)
Figure 6b presents the time series of hourly NO2 concentration at 0–100, 500–600 and 900–1000 m layers from December 2017 to February 2019. Abundance of NO2 in the lower, middle and upper boundary layers exhibited clearly different levels, and elevated levels were concentrated in the lower levels. Higher NO2 concentrations were observed in May and September–December (Chen et al., 2019), which was likely associated with enhanced vehicle emissions due to the arrival of the tourist season in Tibet from May. Additionally, the transmission of NO2 emitted from the Indo-Gangetic Plain (Chen et al., 2017; Yang et al., 2018a) and the enhanced local anthropogenic emissions (i.e., heating using cow dung as fuel) in cold periods also caused the relatively high NO2 levels.
The vertical structure of NO2 also presented an exponentially decreasing shape, with the highest concentration located in the lower layer (Fig. 9). NO2 concentrations in the lower layer peaked in autumn (1.28 ppb), and a minimum happened in spring (0.82 ppb). The ratios of NO2 concentrations in the middle layer to those in the lower boundary layer were 39.50 %, 38.14 %, 40.19 %, 40.16 % and 39.39 % for the total-averaged, spring-averaged, summer-averaged, autumn-averaged and winter-averaged aerosol profiles, respectively. These numbers declined to 18.10 %, 17.36 %, 18.50 %, 18.44 % and 18.07 % for the upper layer. Differently from aerosol extinction, higher levels of NO2 above ground occurred mainly in summer, instead of winter, which might be associated with stronger mixing within the PBL in summer.
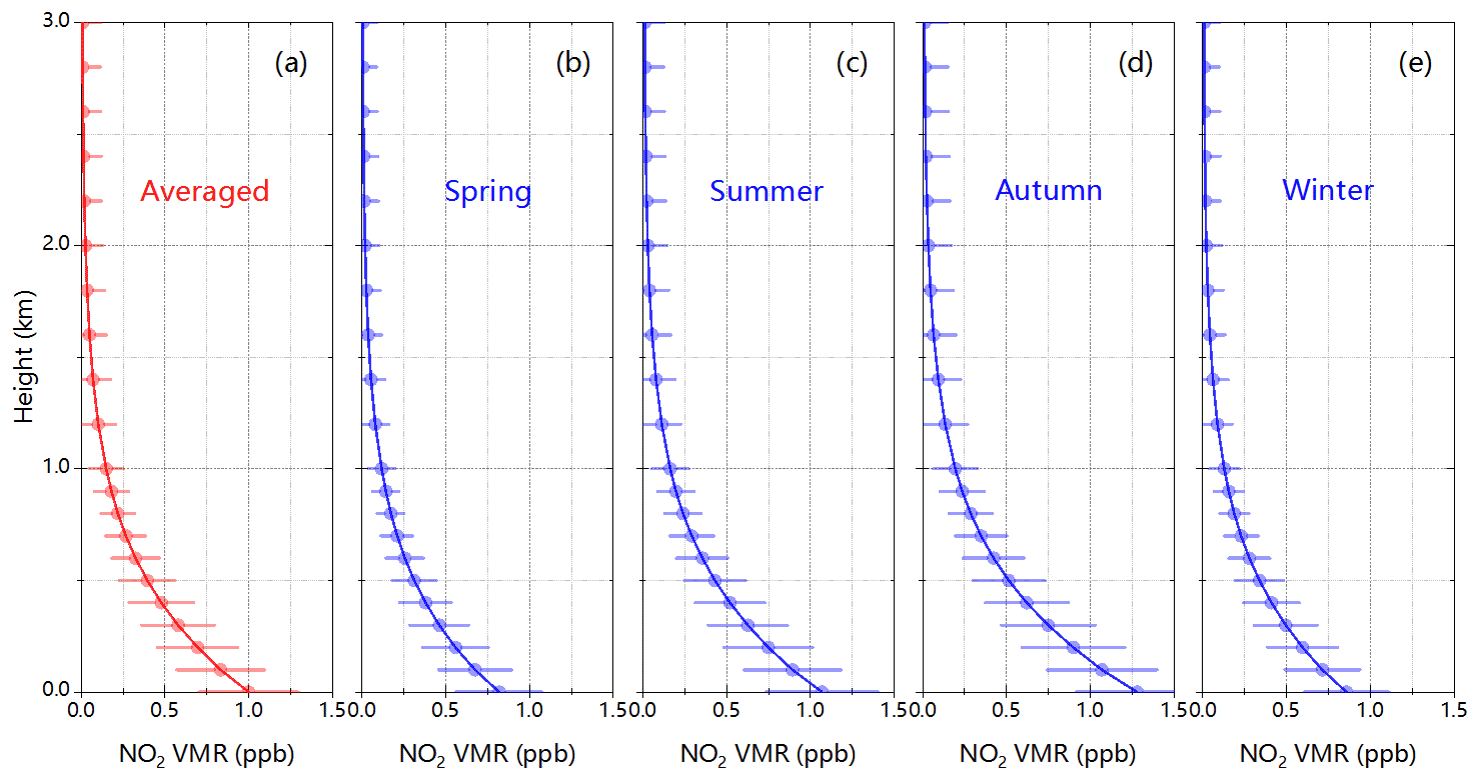
Figure 9(a) Total-averaged, (b) spring-averaged, (c) summer-averaged, (d) autumn-averaged and (e) winter-averaged NO2 vertical profiles from December 2017 to February 2019 at CAS (QOMS).
The diurnal variation in NO2 in spring, summer and winter also exhibited a bi-peak pattern (Fig. 8f–j), with one peak within 11:00–13:00 BJT and the other after 16:00 BJT. These two periods are usually accompanied by a low PBL height. Lower NO2 concentration in the morning (before 10:00 BJT) can be attributed to fewer vehicle emissions (Wang et al., 2011). The elevated PBL height was conducive to the diffusion and dilution of NO2 and led to lower NO2 concentrations from 13:00 to 16:00 BJT. In autumn, another two NO2 peaks values were observed between 14:00–16:00 BJT, which were likely to be related to tourist traffic.
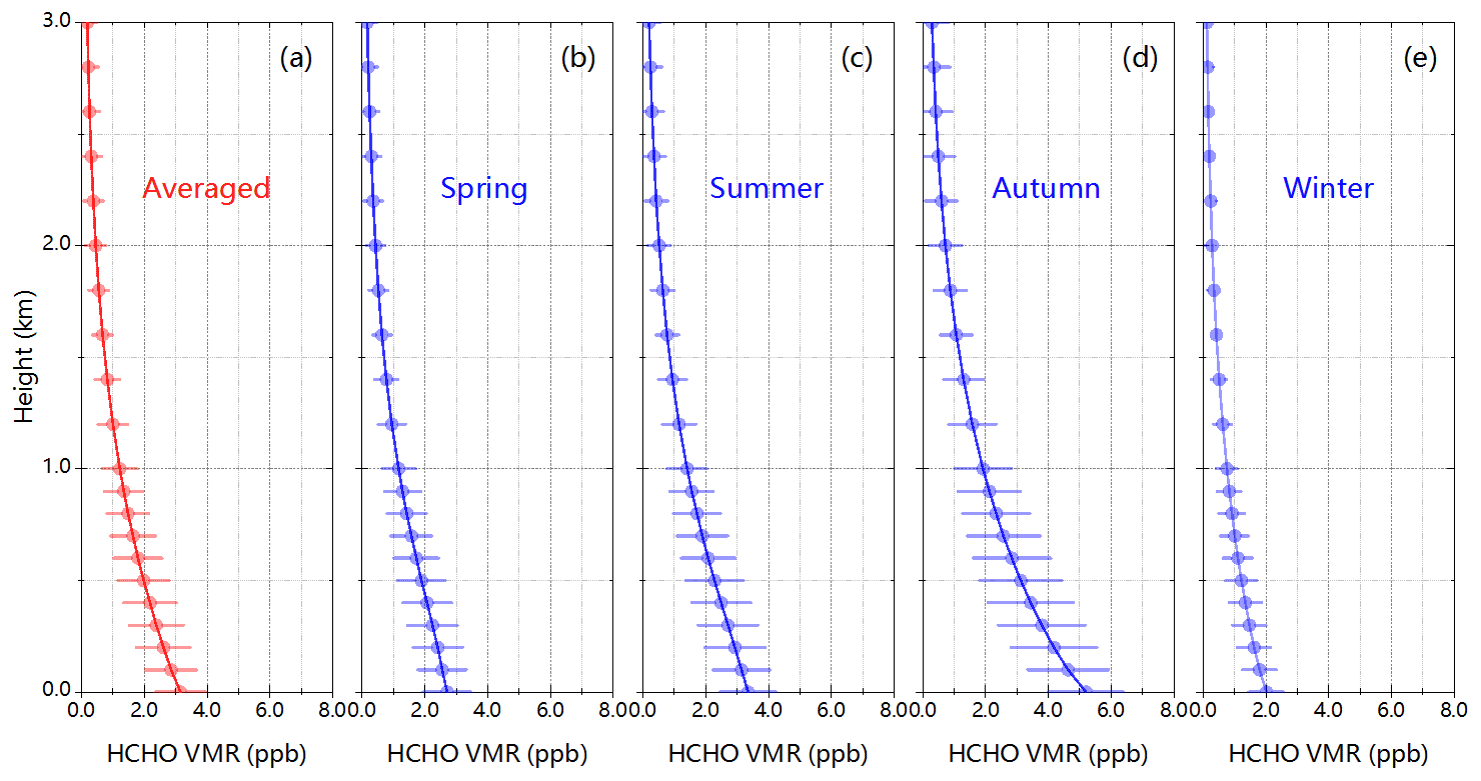
Figure 10(a) Total-averaged, (b) spring-averaged, (c) summer-averaged, (d) autumn-averaged and (e) winter-averaged HCHO vertical profiles from December 2017 to February 2019 at CAS (QOMS).
3.3 Formaldehyde (HCHO)
Formaldehyde (HCHO) is one of the most abundant volatile organic compounds (VOCs) in the atmosphere, and it strongly correlates with peroxy radicals (Kleinman et al., 2001; Ling et al., 2017). HCHO plays a critical role in atmospheric photochemistry to strongly drive ozone (O3) formation (Luecken et al., 2012; Hassan et al., 2018). It comes from both primary sources (i.e., fossil fuel combustion, biomass burning, traffic and industrial activities) and secondary production (i.e., the oxidation of biogenic VOCs). Figure 6c displays the time series of hourly averaged HCHO concentration at 0–100, 500–600 and 900–1000 m layers from December 2017 to February 2019. We found HCHO at CAS (QOMS) was mainly distributed in the lower boundary layer; its concentrations decreased with height, similarly to NO2. The highest HCHO concentrations mainly appeared in September–November, and the lowest HCHO concentrations occurred in December–February. The highest amount of vegetation appeared in autumn at CAS (QOMS), and isoprene along with other active VOCs emitted from vegetation can accumulate near the surface and be oxidized to form high levels of HCHO (Mu et al., 2007). On the other hand, local outdoor biomass burning is active in this season (Chen et al., 2018). The incomplete combustion could emit methane and non-methane volatile organic compounds (NMVOCs) to enhance HCHO concentrations (Gonzi et al., 2011). Fewer primary and secondary sources of HCHO were observed in winter.
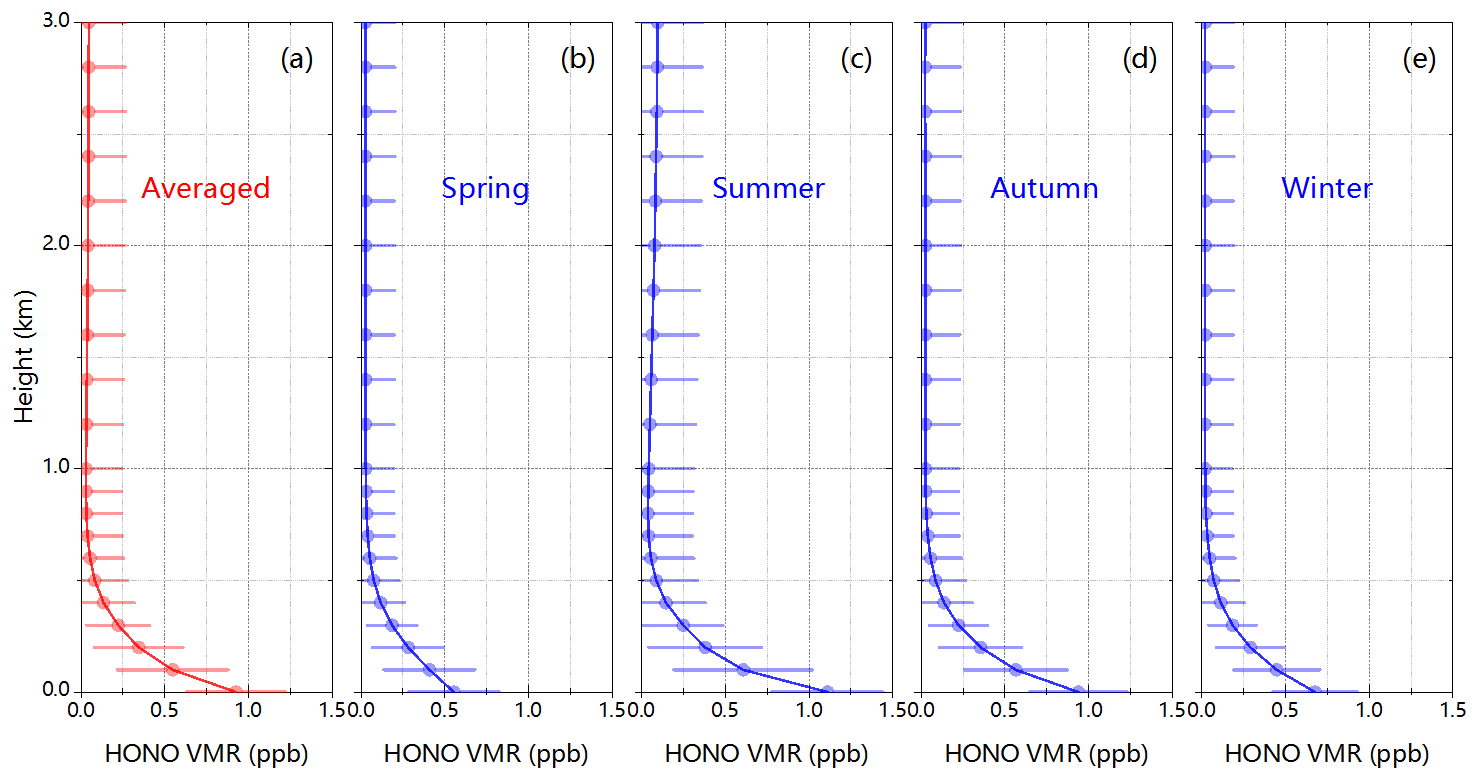
Figure 11(a) Total-averaged, (b) spring-averaged, (c) summer-averaged, (d) autumn-averaged and (e) winter-averaged HONO vertical profiles from December 2017 to February 2019 at CAS (QOMS).
Figure 10 provides the total-averaged and seasonally averaged vertical profiles of HCHO. Similarly to NO2, vertical profiles of HCHO in all seasons an displayed exponentially decreasing shape, with the highest concentration in the lower boundary layer (total-averaged value being 3.15 ppb). The HCHO concentrations in the lower layer peaked in autumn (5.20 ppb) and dropped in winter (2.01 ppb). However, the vertical gradient of HCHO was smaller than that of NO2. The ratios of HCHO concentrations in the middle layer to those in the lower boundary layer were 62.86 %, 69.74 %, 68.06 %, 60.00 % and 60.20 % for the total-averaged, spring-averaged, summer-averaged, autumn-averaged and winter-averaged aerosol profiles, respectively. These numbers dropped to 42.86 %, 47.60 %, 46.27 %, 40.77 % and 41.14 % for the upper layer. The vertical gradient of HCHO in autumn was larger than that in the other three seasons, which was partially associated with stronger surface HCHO sources in autumn.
On the diurnal variations in vertical profiles of HCHO, lower concentrations were observed before 10:00 BJT, but the abundance gradually increased with sunrise and the elevation of temperature (Fig. 8k–o). HCHO peaked within 10:00–16:00 BJT in spring and winter, while peak values of HCHO also appeared after 16:00 BJT due to the prolonged daytime in summer and autumn. The maximum and minimum diffusion heights of HCHO appeared in summer and winter, respectively, associated with PBL height.
3.4 Nitrous acid (HONO)
The photolysis of nitrous acid (HONO) is a significant source of the hydroxyl (OH) radical. HONO mainly originates from primary emissions from vehicles, ships, biomass burning and soil, the photolysis of nitrate particles (), the homogeneous reaction of NO with OH radical, and the heterogeneous reaction of NO2 on several types of surfaces (Wang et al., 2015; Fu et al., 2019). As shown in Fig. 6d, elevated HONO was mostly distributed in the lower boundary layer, and higher HONO concentrations appeared from July 2018 to February 2019. Enhanced levels after summer were likely connected with elevated direct emissions from vehicles, biomass burning and soil (Wang et al., 2015; Fu et al., 2019). We find high aerosol extinction, NO2 and HONO concentrations simultaneously in Fig. 8d, i and s, suggesting that the heterogeneous reaction of NO2 on aerosol surfaces might be another important source of HONO over the TP.
Figure 11 shows that the vertical profiles of HONO in all seasons exhibited an exponential shape, with the highest concentration (0.93 ppb) in the lower boundary layer. HONO concentrations in the lower layer peaked in summer (1.11 ppb) and dropped in spring (0.56 ppb) (Fig. 11). Differently from aerosols, NO2 and HCHO, HONO concentrations in the middle and upper layers were extremely low. The proportions of HONO concentrations in the middle layer to those in the lower boundary layer were 8.86 %, 13.68 %, 7.82 %, 9.05 % and 10.44 % for the total-averaged, spring-averaged, summer-averaged, autumn-averaged and winter-averaged aerosol profiles, respectively. These numbers decreased to 3.14 %, 5.30 %, 3.52 %, 2.72 % and 3.06 % for the upper layer. On the diurnal variations in vertical profiles of HONO, we found that HONO concentrations were, consistently in all four seasons, lower before 10:00 BJT and peaked around 10:00–14:00 BJT. This pattern in the monitoring site was different from that in other low-altitude cities (Wang et al., 2013, 2017; Lee et al., 2016; Xing et al., 2021).
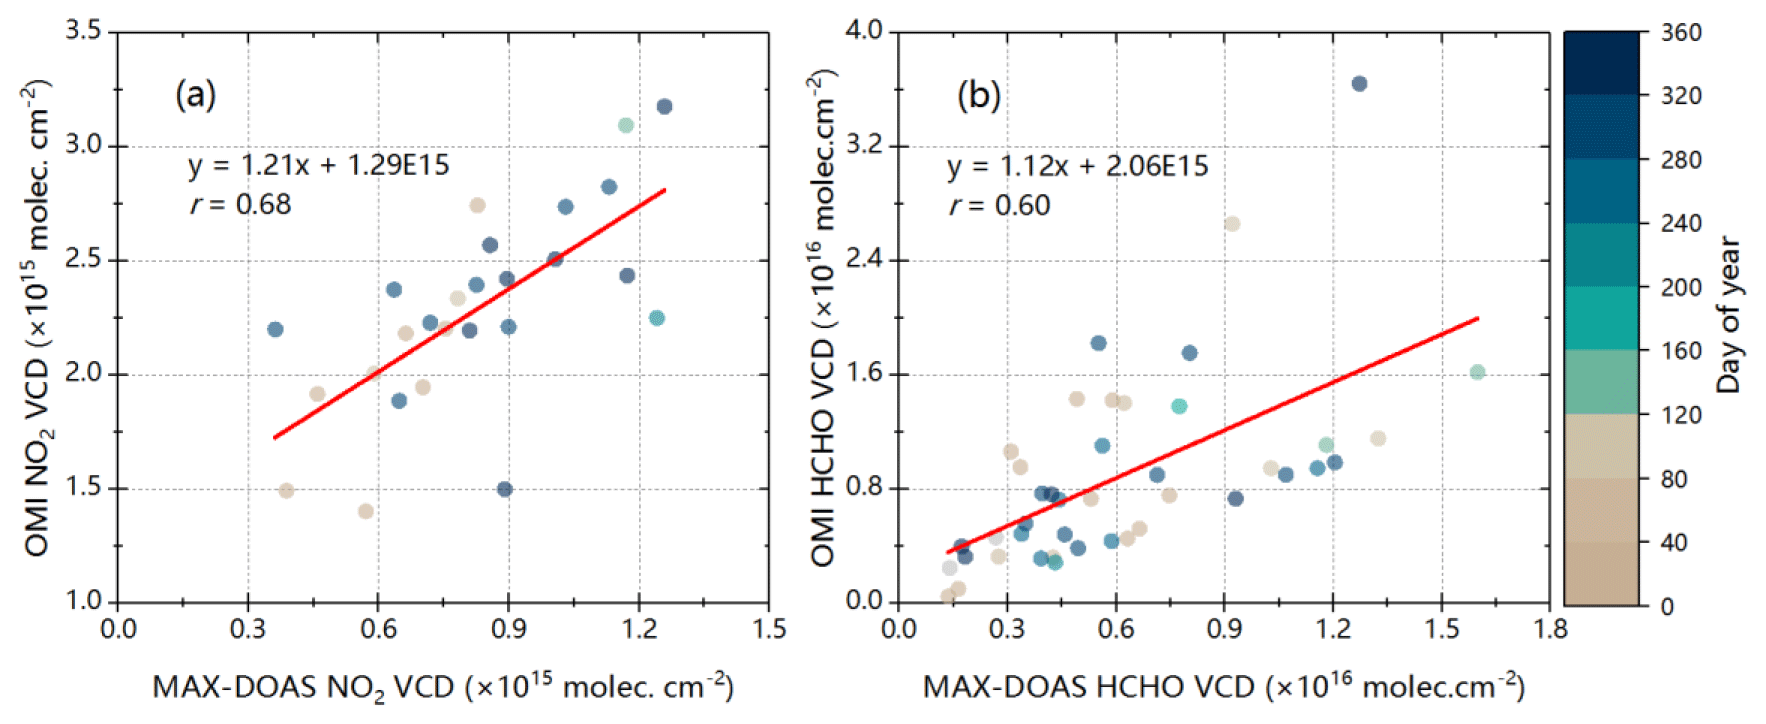
Figure 12Linear regression plots (a) of the tropospheric NO2 VCDs measured by OMI and MAX-DOAS and (b) of the tropospheric HCHO VCDs measured by OMI and MAX-DOAS.
3.5 Validations against satellite retrievals
In this study, OMI NO2 and HCHO products were used to validate the described dataset. For better comparison, MAX-DOAS data were averaged over the OMI overpass time (from 06:30 to 08:30 BJT) in the region that covers CAS (QOMS). OMI data were spatially averaged over the 15 km grid cells around the MAX-DOAS site, as the spatial resolution of OMI is 15 km × 15 km. The VCDs of NO2 and HCHO were derived by vertical integrations of their vertical profiles. The linear association between MAX-DOAS and OMI measurements are shown in Fig. 12. We found reasonably good correlations between MAX-DOAS and OMI observations, with Pearson correlation coefficients (r) of 0.68 and 0.60 (regression coefficients (R) of 1.21 and 1.12, offset of 1.29×10¹⁵ and 2.06×10¹⁵ molec. cm−2) for NO2 and HCHO, respectively. OMI NO2 and HCHO VCDs were systematically lower than MAX-DOAS NO2 and HCHO VCDs, which is different from previous comparisons applied in lower-altitude areas (Liu et al., 2016; Xing et al., 2017). This might be caused by the large-area averaging effect of OMI and uncertainties in OMI products introduced by cloud cover and high surface albedo.
We also observed that the correlations between MAX-DOAS and OMI observations exhibited significant differences across seasons. The highest correlation appeared in autumn, followed by winter (Table S1 in the Supplement). High correlation in these two seasons was associated with increased tourism vehicle emissions, regional transport of NO2 and enhanced photochemical formation of HCHO. Failed linear regression analysis mainly appeared in spring and summer, due to high cloud coverage from March to September on the TP (Chen and Dong, 2006).
Ground-based vertical profile observations of atmospheric composition on the Tibetan Plateau introduced here are available in .txt format at Zenodo (https://doi.org/10.5281/zenodo.5336460; Xing, 2021).
In situ observations, especially profile observations, are scarce but essential in polar regions, including the TP, the so-called Third Pole. The sources of atmospheric composition over the TP and how the species interact with regional and global climate remain unclear, mainly owing to lack of observations. Large uncertainties also remain in the chemical transport and climate modeling of cold-region processes, without observational constraints. The presented dataset offers high-time-resolution vertical profile observations of aerosols, NO2, HCHO and HONO for more than 1 year on the TP. Distinct features were found in the diurnal variations, vertical distributions and seasonality of these atmospheric composition species. Data products were also validated with satellite retrievals.
The limitations of this data are described as follows. (1) MAX-DOAS in ultraviolet and visible spectral ranges are typically affected by photon shot noise, and the retrieval errors usually increase under heavy haze or cloudy conditions. The data with relative retrieval errors larger than 50 % were filtered out in this study. (2) Only the daytime vertical profiles of aerosols, NO2, HCHO and HONO were retrieved since MAX-DOAS relies on scattered sunlight. The spectral data collected when solar zenith angles (SZAs) were larger than 75∘ were filtered out to avoid the strong absorption of the stratosphere (Xing et al., 2017). (3) The vertical resolution of 100 m is the highest resolution at present but still needs to be improved with the development of hardware and algorithms in the future. This dataset provides better temporal coverage and fills the gaps in the vertical direction. It has potential to both improve satellite retrievals and reduce uncertainties in chemical transport modeling over the TP, particularly in the vertical direction. We expect this dataset can be used to understand the sources and dynamic evolution of air pollutants over the TP, to assess the impacts of chemical forcers on the climate system at multiple scales, and to facilitate the development and improvement of models in cold regions. The potential applications of this dataset include the following. (1) Performances of chemical transport models are commonly poor when applied over the Tibetan Plateau due to complex topography, complex meteorology, etc. This dataset can be used to reduce the uncertainties in these models, especially in the vertical direction (Liu et al., 2021a). (2) This dataset can assist in the source apportionments of atmospheric composition at different altitudes over the Tibetan Plateau. (3) Observed atmospheric composition over the TP is a valuable input for box models to understand atmospheric oxidation capacity at different altitudes on the Tibetan Plateau.
The supplement related to this article is available online at: https://doi.org/10.5194/essd-13-4897-2021-supplement.
All the authors were involved in the generation of the introduced dataset. CX, CL and MG wrote the manuscript with contributions from all the other authors.
The contact author has declared that neither they nor their co-authors have any competing interests.
Publisher's note: Copernicus Publications remains neutral with regard to jurisdictional claims in published maps and institutional affiliations.
We would like to thank the Institute of Tibetan Plateau Research, Chinese Academy of Sciences (Zhiyuan Cong's group), for help with the experimental setup at the CAS monitoring station.
This research is supported by grants from the National Key Research and Development Program of China (grant nos. 2018YFC0213104, 2017YFC0210002, 2016YFC0203302 and 2017YFC0212800), National Natural Science Foundation of China (grant nos. 41722501, 91544212, 51778596, 41575021, 41977184 and 41875043), Anhui Science and Technology Major Project (grant no. 18030801111), Strategic Priority Research Program of the Chinese Academy of Sciences (grant no. XDA23020301), National Key Project for Causes and Control of Heavy Air Pollution (grant nos. DQGG0102 and DQGG0205), National High-Resolution Earth Observation Project of China (grant no. 05-Y30B01-9001-19/20-3), and Civil Aerospace Technology Advance Research Project (grant no. Y7K00100KJ).
This paper was edited by Qingxiang Li and reviewed by two anonymous referees.
Aliwell, S. R., Van Roozendael, M., Johnston, P. V., Richter, A., Wagner, T., Arlander, D. W., Burrows, J. P., Fish, D. J., Jones, R. L., Tørnkvist, K. K., Lambert, J. C., Pfeilsticker, K., and Pundt, I.: Analysis for BrO in zenith-sky spectra: an intercomparison exercise for analysis improvement, J. Geophys. Res., 107, ACH 10-1–ACH 10-20, https://doi.org/10.1029/2001JD000329, 2002.
Barnett, T. P., Adam, J. C., and Lettenmaier, D. P.: Potential impacts of a warming climate on water availability in snow-dominated regions, Nature, 438, 303–309, 2005.
Bolch, T., Kulkarni, A., Kaab, A., Huggel, C., Paul, F., Cogley, J. G., Frey, H., Kargel, J. S., Fujita, K., Scheel, M., Bajracharya, S., and Stoffel, M.: The State and Fate of Himalayan Glaciers, Science, 336, 310–314, 2012.
Bolin, B.: On the influence of the earth's orography on the general character of the westerlies, Tellus, 2, 184–195, https://doi.org/10.1111/j.2153-3490.1950.tb00330.x, 1950.
Boos, W. R. and Kuang, Z.: Dominant control of the South Asian monsoon by orographic insulation versus plateau heating, Nature, 463, 218–222, 2010.
Che, J. and Zhao, P.: Characteristics of the summer atmospheric boundary layer height over the Tibetan Plateau and influential factors, Atmos. Chem. Phys., 21, 5253–5268, https://doi.org/10.5194/acp-21-5253-2021, 2021.
Chen, P., Kang, S., Yang, J., Pu, T., Li, C., Guo, J., and Tripathee, L.: Spatial and temporal variations of gaseous and particulate pollutants in six sites in Tibet, China, during 2016–2017, Aerosol Air Qual. Res., 16, 516–527, https://doi.org/10.4209/aaqr.2018.10.0360, 2019.
Chen, P. F., Li, C. L., Kang, S. C., Rupakheti, M., Panday, A. K., Yan, F. P., Li, Q. L., Zhang, Q. G., Guo, J. M., Ji, Z. M., Rupakheti, D., and Luo, W.: Characteristics of particulate-phase polycyclic aromatic hydrocarbons (PAHs) in the atmosphere over the central Himalayas, Aerosol Air Qual. Res., 17, 2942–2954, 2017.
Chen, S. and Dong, A.: Climatic change and stability of total cloud amount over the Qinghai-Tibetan plateau, Arid Zone Res., 23, 327–333, https://doi.org/10.1016/S1003-6326(06)60040-X, 2006.
Chen, X., Škerlak, B., Rotach, M. W., Añel, J. A., Su, Z., Ma, Y., and Li, M.: Reasons for the extremely high-ranging planetary boundary layer over the western Tibetan Plateau in winter, J. Atmos. Sci., 73, 2021–2038, 2016.
Chen, X., Kang, S., Cong, Z., Yang, J., and Ma, Y.: Concentration, temporal variation, and sources of black carbon in the Mt. Everest region retrieved by real-time observation and simulation, Atmos. Chem. Phys., 18, 12859–12875, https://doi.org/10.5194/acp-18-12859-2018, 2018.
Cheng, G. and Jin, H.: Permafrost and groundwater on the Qinghai Tibet Plateau and in northeast China, Hydrogeol. J., 21, 5–23, 2013.
Cong, Z., Kang, S., Kawamura, K., Liu, B., Wan, X., Wang, Z., Gao, S., and Fu, P.: Carbonaceous aerosols on the south edge of the Tibetan Plateau: concentrations, seasonality and sources, Atmos. Chem. Phys., 15, 1573–1584, https://doi.org/10.5194/acp-15-1573-2015, 2015a.
Cong, Z., Kawamura, K., Kang, S., and Fu, P.: Penetration of biomass-burning emissions from South Asia through the Himalayas: new insights from atmospheric organic acids, Sci. Rep., 5, 9580, https://doi.org/10.1038/srep09580, 2015b.
Cong, Z. Y., Kang, S. C., Smirnov, A., and Holben, B.: Aerosol optical properties at Nam Co, a remote 6 site in central Tibetan Plateau, Atmos. Res., 92, 42–48, 2009.
Dai, G., Wu, S., and Song, X.: Depolarization Ratio Profiles Calibration and Observations of Aerosol and Cloud in the Tibetan Plateau Based on Polarization Raman Lidar, Remote Sens., 10, 378, https://doi.org/10.3390/rs10030378, 2018.
Dong, W., Lin, Y., Wright, J. S., Xie, Y., Xu, F., Xu, W., and Wang, Y.: Indian monsoon low-pressure systems feed up-and-over moisture transport to the southwestern Tibetan Plateau, J. Geophys. Res-Atmos., 122, 140–151, https://doi.org/10.1002/2017JD027296, 2017.
Duo, B., Cui, L., Wang, Z., Li, R., Zhang, L., Fu, H., Chen, J., Zhang, H., and Qiong, A.: Observations of atmospheric pollutants at Lahsa during 2014–2015: Pollution status and the influence of meteorological factors, J. Environ. Sci., 63, 28–42, 2018.
Fang, X., Li, T., Ban, C., Wu, Z., Li, J., Li, F., Cen, Y., and Tian, B.: A mobile differential absorption lidar for simultaneous observations of tropospheric and stratospheric ozone over Tibet, Opt. Express, 27, 4126–4139, 2019.
Fleischmann, O. C., Hartmann, M., Burrows, J. P., and Orphal, J.: New ultraviolet absorption cross-sections of BrO at atmospheric temperatures measured by time-windowing Fourier transform spectroscopy, J. Photoch. Photobio. A, 168, 117–132, 2004.
Fu, X., Wang, T., Zhang, L., Li, Q., Wang, Z., Xia, M., Yun, H., Wang, W., Yu, C., Yue, D., Zhou, Y., Zheng, J., and Han, R.: The significant contribution of HONO to secondary pollutants during a severe winter pollution event in southern China, Atmos. Chem. Phys., 19, 1–14, https://doi.org/10.5194/acp-19-1-2019, 2019.
Gao, J., Yao, T., Masson-Delmotte, V., Steen-Larsen, H. C., and Wang, W.: Collapsing glaciers threaten Asia's water supplies, Nature, 565, 19–21, 2019.
Gao, M., Sherman, P., Song, S., Yu, Y., Wu, Z., and McElroy, M. B.: Seasonal prediction of Indian wintertime aerosol pollution using the ocean memory effect, Science Adv., 5, eaav4157, https://doi.org/10.1126/sciadv.aav4157, 2019.
Gao, M., Liu, Z., Zheng, B., Ji, D., Sherman, P., Song, S., Xin, J., Liu, C., Wang, Y., Zhang, Q., Xing, J., Jiang, J., Wang, Z., Carmichael, G. R., and McElroy, M. B.: China's emission control strategies have suppressed unfavorable influences of climate on wintertime PM2.5 concentrations in Beijing since 2002, Atmos. Chem. Phys., 20, 1497–1505, https://doi.org/10.5194/acp-20-1497-2020, 2020a.
Gao, M., Gao, J., Zhu, B., Kumar, R., Lu, X., Song, S., Zhang, Y., Jia, B., Wang, P., Beig, G., Hu, J., Ying, Q., Zhang, H., Sherman, P., and McElroy, M. B.: Ozone pollution over China and India: seasonality and sources, Atmos. Chem. Phys., 20, 4399–4414, https://doi.org/10.5194/acp-20-4399-2020, 2020b.
Gonzi, S., Palmer, P. I., Barkley, M. P., De Smedt, I., and Van Roozendael, M.: Biomass burning emission estimates inferred from satellite column measurements of HCHO: Sensitivity to co-emitted aerosol and injection height, Geophys. Res. Lett., 38, L14807, https://doi.org/10.1029/2011GL047890, 2011.
Hassan, S. M., El-Abssawy, A. A., and Khoder, M. I.: Effect of Seasonal Variation on the Levels and Behaviours of Formaldehyde in the Atmosphere of a Suburban Area in Cairo, Egypt, Asian J. Atmos. Environ., 12, 4, 356–368, https://doi.org/10.5572/ajae.2018.12.4.356, 2018.
He, Y., Zhang, Z., Theakstone, W. H., Chen, T., Yao, T., and Pang, H.: Changing features of the climate and glaciers in China's monsoonal temperate glacier region, J. Geophys. Res., 108, 4530, https://doi.org/10.1029/2002JD003365, 2003.
Hindman, E. E. and Upadhyay, B. P.: Air pollution transport in the Himalayas of Nepal and Tibet during the 1995–1996 dry season, Atmos. Environ., 36, 727–739, 2002.
Hu, Q., Liu, C., Ji, X., Liu, T., and Zhu, Y.: Vertical structure of the transport fluxes of aerosol and its precursors on the southwest transport pathway in the Beijing-Tianjin-Hebei region, in: EGU General Assembly 2020, online, EGU, EGU2020-4967, https://doi.org/10.5194/egusphere-egu2020-4967, 2020.
Huang, J., Minnis, P., Yi, Y., Tang, Q., Wang, X., Hu, Y., Liu, Z., Ayers, K., Trepte, C., and Winker, D.: Summer dust aerosols detected from CALIPSO over the Tibetan Plateau, Geophys. Res. Lett., 34, L18805, https://doi.org/10.1029/2007GL029938, 2007.
Immerzeel, W. W., van Beek, L. P. H., and Bierkens, M. F. P.: Climate Change Will Affect the Asian Water Towers, Science, 328, 1382–1385, 2010.
Irie, H., Kanaya, Y., Akimoto, H., Iwabuchi, H., Shimizu, A., and Aoki, K.: First retrieval of tropospheric aerosol profiles using MAX-DOAS and comparison with lidar and sky radiometer measurements, Atmos. Chem. Phys., 8, 341–350, https://doi.org/10.5194/acp-8-341-2008, 2008.
Kang, S., Cameron, P. W., Qin, D., Paul, A. M., and Yao, T.: Monsoon and dust signals recorded in Dasuopu glacier, Tibetan Plateau, J. Glaciol., 46, 222–226, 2000.
Kang, S., Xu, Y., You, Q., Flügel, W. A., Pepin, N., and Yao, T.: Review of climate and cryospheric change in the Tibetan Plateau, Environ. Res. Lett., 5, 015101, https://doi.org/10.1088/1748-9326/5/1/015101, 2010.
Kang, S. C., Huang, J., Wang, F. Y., Zhang, Q. G., Zhang, Y. L., Li, C. L., Wang, L., Chen, P. F., Sharma, C. M., Li, Q., Sillanpaa, M., Hou, J. Z., Xu, B. Q., and Guo, J. M.: Atmospheric Mercury Depositional Chronology Reconstructed from Lake Sediments and Ice Core in the Himalayas and Tibetan Plateau, Environ. Sci. Technol., 50, 2859–2869, 2016.
Kang, S. C., Zhang, Q. G., Qian, Y., Ji, Z. M., Li, C. L., Cong, Z. Y., Zhang, Y. L., Guo, J. M., Du, W. T., Huang, J., You, Q. L., Panday, A. K., Rupakheti, M., Chen, D. L., Gustafsson, O., Thiemens, M. H., and Qin, D. H.: Linking atmospheric pollution to cryospheric change in the Third Pole region: current progress and future prospects, Natl. Sci. Rev., 6, 796–809, 2019.
Kleinman, L. I., Daum, P. H., Lee, Y.-N., Nunnermacker, L. J., Springston, S. R., Weinstein-Lloyd, J., and Rudolph, J.: Sensitivity of ozone production rate to ozone precursors, Geophys. Res. Lett., 15, 2903–2906, 2001.
Kreher, K., Van Roozendael, M., Hendrick, F., Apituley, A., Dimitropoulou, E., Frieß, U., Richter, A., Wagner, T., Lampel, J., Abuhassan, N., Ang, L., Anguas, M., Bais, A., Benavent, N., Bösch, T., Bognar, K., Borovski, A., Bruchkouski, I., Cede, A., Chan, K. L., Donner, S., Drosoglou, T., Fayt, C., Finkenzeller, H., Garcia-Nieto, D., Gielen, C., Gómez-Martín, L., Hao, N., Henzing, B., Herman, J. R., Hermans, C., Hoque, S., Irie, H., Jin, J., Johnston, P., Khayyam Butt, J., Khokhar, F., Koenig, T. K., Kuhn, J., Kumar, V., Liu, C., Ma, J., Merlaud, A., Mishra, A. K., Müller, M., Navarro-Comas, M., Ostendorf, M., Pazmino, A., Peters, E., Pinardi, G., Pinharanda, M., Piters, A., Platt, U., Postylyakov, O., Prados-Roman, C., Puentedura, O., Querel, R., Saiz-Lopez, A., Schönhardt, A., Schreier, S. F., Seyler, A., Sinha, V., Spinei, E., Strong, K., Tack, F., Tian, X., Tiefengraber, M., Tirpitz, J.-L., van Gent, J., Volkamer, R., Vrekoussis, M., Wang, S., Wang, Z., Wenig, M., Wittrock, F., Xie, P. H., Xu, J., Yela, M., Zhang, C., and Zhao, X.: Intercomparison of NO2, O4, O3 and HCHO slant column measurements by MAX-DOAS and zenith-sky UV–visible spectrometers during CINDI-2, Atmos. Meas. Tech., 13, 2169–2208, https://doi.org/10.5194/amt-13-2169-2020, 2020.
Lau, W. K., Kim, M. K., Kim, K. M., and Lee, W. S.: Enhanced surface warming and accelerated snow melt in the Himalayas and Tibetan Plateau induced by absorbing aerosols, Environ. Res. Lett., 5, 025204, https://doi.org/10.1088/1748-9326/5/2/025204, 2010.
Lee, J. D., Whalley, L. K., Heard, D. E., Stone, D., Dunmore, R. E., Hamilton, J. F., Young, D. E., Allan, J. D., Laufs, S., and Kleffmann, J.: Detailed budget analysis of HONO in central London reveals a missing daytime source, Atmos. Chem. Phys., 16, 2747–2764, https://doi.org/10.5194/acp-16-2747-2016, 2016.
Li, C., Bosch, C., Kang, S., Andersson, A., Chen, P., Zhang, Q., Cong, Z., Chen, B., Qin, D., and Gustafsson, O.: Sources of black carbon to the Himalayan-Tibetan Plateau glaciers, Nat. Commun., 7, 12574, https://doi.org/10.1038/ncomms12574, 2016.
Li, R., Zhao, Y., Zhou, W., Meng, Y., Zhang, Z., and Fu, H.: Developing a novel hybrid model for the estimation of surface 8 h ozone (O3) across the remote Tibetan Plateau during 2005–2018, Atmos. Chem. Phys., 20, 6159–6175, https://doi.org/10.5194/acp-20-6159-2020, 2020.
Liang, F., Gao, M., Xiao, Q., Carmichael, G. R., Pan, X., and Liu, Y.: Evaluation of a data fusion approach to estimate daily PM2.5 levels in North China, Environ. Res., 158, 54–60, https://doi.org/10.1016/j.envres.2017.06.001, 2017.
Ling, Z. H., Zhao, J., Fan, S. J., and Wang, X. M.: Sources of formaldehyde and their contributions to photochemical O3 formation at an urban site in the Pearl River Delta, southern China, Chemosphere, 168, 1293–1301, https://doi.org/10.1016/j.chemosphere.2016.11.140, 2017.
Liu, B., Cong, Z., Wang, Y., Xin, J., Wan, X., Pan, Y., Liu, Z., Wang, Y., Zhang, G., Wang, Z., Wang, Y., and Kang, S.: Background aerosol over the Himalayas and Tibetan Plateau: observed characteristics of aerosol mass loading, Atmos. Chem. Phys., 17, 449–463, https://doi.org/10.5194/acp-17-449-2017, 2017.
Liu, C., Gao, M., Hu, Q., Brasseur, G. P., and Carmichael, G. R.: Stereoscopic Monitoring: A Promising Strategy to Advance Diagnostic and Prediction of Air Pollution, B. Am. Meteorol. Soc., E730–E737, https://doi.org/https://doi.org/10.1175/BAMS-D-20-0217.1, 2021a.
Liu, C., Xing, C., Hu, Q., Li, Q., Liu, H., Hong, Q., Tan, W., Ji, X., Lin, H., Lu, C., Lin, J., Liu, H., Wei, S., Chen, J., Yang, K., Wang, S., Liu, T., and Chen, Y.: Ground-based hyperspectral stereoscopic remote sensing network: A promising strategy to learn coordinated control of O3 and PM2.5 over China, Engineering, https://doi.org/10.1016/j.eng.2021.02.019, in press, 2021b.
Liu, H., Liu, C., Xie, Z., Li, Y., Huang, X., Wang, S., Xu, J., and Xie, P.: A paradox for air pollution controlling in China revealed by “APEC Blue” and “Parade Blue”, Sci. Rep., 6, 34408, https://doi.org/10.1038/srep34408, 2016.
Liu, H., Wang, Q., Xing, L., Zhang, Y., Zhang, T., Ran, W., and Cao, J.: Measurement report: quantifying source contribution of fossil fuels and biomass-burning black carbon aerosol in the southeastern margin of the Tibetan Plateau, Atmos. Chem. Phys., 21, 973–987, https://doi.org/10.5194/acp-21-973-2021, 2021.
Liu, Y., Hoskins, B., and Blackburn, M.: Impact of Tibetan Orography and Heating on the Summer Flow over Asia, J. Meteorol. Soc. Jpn. Ser. II, 85B, 1–19, 2007.
Lu, Z., Streets, D. G., Zhang, Q., and Wang, S.: A novel back trajectory analysis of the origin of black carbon transported to the Himalayas and Tibetan Plateau during 1996–2010, Geophys. Res. Lett., 39, L01809, https://doi.org/10.1029/2011GL049903, 2012.
Luecken, D. J., Hutzell, W. T., Strum, M. L., and Pouliot, G. A.: Regional sources of atmospheric formaldehyde and acetaldehyde, and implications for atmospheric modeling, Atmos. Environ., 47, 477–490, 2012.
Ma, Y., Hu, Z., Xie, Z., Ma, W., Wang, B., Chen, X., Li, M., Zhong, L., Sun, F., Gu, L., Han, C., Zhang, L., Liu, X., Ding, Z., Sun, G., Wang, S., Wang, Y., and Wang, Z.: A long-term (2005–2016) dataset of integrated land-atmosphere interaction observations on the Tibetan Plateau, V1, Science Data Bank, 2020a.
Ma, Y., Hu, Z., Xie, Z., Ma, W., Wang, B., Chen, X., Li, M., Zhong, L., Sun, F., Gu, L., Han, C., Zhang, L., Liu, X., Ding, Z., Sun, G., Wang, S., Wang, Y., and Wang, Z.: A long-term (2005–2016) dataset of hourly integrated land–atmosphere interaction observations on the Tibetan Plateau, Earth Syst. Sci. Data, 12, 2937–2957, https://doi.org/10.5194/essd-12-2937-2020, 2020b.
Meller, R. and Moortgat, G. K.: Temperature dependence of the absorption cross sections of formaldehyde between 223 and 323 K in the wavelength range 225–375 nm, J. Geophys. Res., 105, 7089–7101, 2000.
Mu, Y., Pang, X., Quan, J., and Zhang, X.: Atmospheric carbonyl compounds in Chinese background area: A remote mountain of the Qinghai-Tibetan Plateau, J. Geophys. Res.-Atmos., 112, D22302, https://doi.org/10.1029/2006JD008211, 2007.
Peng, J., Liu, Z., Liu, Y., Wu, J., and Han, Y.: Trend analysis of vegetation dynamics in Qinghai–Tibet Plateau using Hurst Exponent, Ecol. Indic., 14, 28–39, 2012.
Pu, Z. X., Xu, L., and Salomonson, V. V.: MODIS/Terra observed seasonal variations of snow cover over the Tibetan Plateau, Geophys. Res. Lett., 34, L06706, https://doi.org/10.1029/2007GL029262, 2007.
Qiu, J.: China: the third pole, Nature, 454, 393–396, 2008.
Ramanathan, V., Ramana, M. V., Roberts, G., Kim, D., Corrigan, C. E., Chung, C. E., and Winker, D.: Warming trends in Asia amplified by brow cloud solar absorption, Nature, 448, 575–578, https://doi.org/10.1038/nature06019, 2007.
Roscoe, H. K., Van Roozendael, M., Fayt, C., du Piesanie, A., Abuhassan, N., Adams, C., Akrami, M., Cede, A., Chong, J., Clémer, K., Friess, U., Gil Ojeda, M., Goutail, F., Graves, R., Griesfeller, A., Grossmann, K., Hemerijckx, G., Hendrick, F., Herman, J., Hermans, C., Irie, H., Johnston, P. V., Kanaya, Y., Kreher, K., Leigh, R., Merlaud, A., Mount, G. H., Navarro, M., Oetjen, H., Pazmino, A., Perez-Camacho, M., Peters, E., Pinardi, G., Puentedura, O., Richter, A., Schönhardt, A., Shaiganfar, R., Spinei, E., Strong, K., Takashima, H., Vlemmix, T., Vrekoussis, M., Wagner, T., Wittrock, F., Yela, M., Yilmaz, S., Boersma, F., Hains, J., Kroon, M., Piters, A., and Kim, Y. J.: Intercomparison of slant column measurements of NO2 and O4 by MAX-DOAS and zenith-sky UV and visible spectrometers, Atmos. Meas. Tech., 3, 1629–1646, https://doi.org/10.5194/amt-3-1629-2010, 2010.
Rothman, L. S., Gordon, I. E., Barbe, A., Benner, D. C., Bernath, P. F., Birk, M., Boudon, V., Brown, L. R., Campargue, A., Champion, J. P., Chance, K., Coudert, L. H., Dana, V., Devi, V. M., Fally, S., Flaud, J. M., Gamache, R. R., Goldman, A., Jacquemart, D., Kleiner, I., Lacome, N., Lafferty, W. J., Mandin, J. Y., Massie, S. T., Mikhailenko, S. N., Miller, C. E., Moazzen-Ahmadi, N., Naumenko, O. V., Nikitin, A. V., Orphal, J., Perevalov, V. I., Perrin, A., Predoi-Cross, A., Rinsland, C. P., Rotger, M., Šimečková, M., Smith, M. A. H., Sung, K., Tashkun, S. A., Tennyson, J., Toth, R. A., Vandaele, A. C., and Vander Auwera, J.: The HITRAN 2008 molecular spectroscopic database, J. Quant. Spectrosc. Ra., 110, 533–572, https://doi.org/10.1016/j.jqsrt.2009.02.013, 2010.
Ryan, R. G., Rhodes, S., Tully, M., Wilson, S., Jones, N., Frieß, U., and Schofield, R.: Daytime HONO, NO2 and aerosol distributions from MAX-DOAS observations in Melbourne, Atmos. Chem. Phys., 18, 13969–13985, https://doi.org/10.5194/acp-18-13969-2018, 2018.
Seidel, D. J., Ao, C. O., and Li, K.: Estimating climatological planetary boundary layer heights from radiosonde observations: Comparison of methods and uncertainty analysis, J. Geophys. Res., 115, D16113, https://doi.org/10.1029/2009JD013680, 2010.
Serdyuchenko, A., Gorshelev, V., Weber, M., Chehade, W., and Burrows, J. P.: High spectral resolution ozone absorption cross-sections – Part 2: Temperature dependence, Atmos. Meas. Tech., 7, 625–636, https://doi.org/10.5194/amt-7-625-2014, 2014.
Shrestha, A. B., Wake, C. P., Mayewski, P. A., and Dibb, J. E.: Maximum temperature trends in the Himalaya and its vicinity: an analysis based on temperature records from Nepal for the period 1971–94, J. Climate, 12, 2775–2786, 1999.
Škerlak, B., Sprenger, M., and Wernli, H.: A global climatology of stratosphere–troposphere exchange using the ERA-Interim data set from 1979 to 2011, Atmos. Chem. Phys., 14, 913–937, https://doi.org/10.5194/acp-14-913-2014, 2014.
Spurr, R. J. D.: VLIDORT: A linearized pseudo-spherical vector discrete ordinate radiative transfer code for forward model and retrieval studies in multilayer multiple scattering media, J. Quant. Spectrosc. Ra., 102, 316–342, 2006.
Stutz, J., Kim, E. S., Platt, U., Bruno, P., Perrino, C., and Febo, A.: UV-visible absorption cross sections of nitrous acid, J. Geophys. Res.-Atmos., 105, 14585–14592, 2000.
Thalman, R. M. and Volkamer, R.: Temperature dependent absorption cross-sections of O2-O2 collision pairs between 340 and 630 nm and at atmospherically relevant pressure, Phys. Chem. Chem. Phys. 15, 15371–15381, 2013.
Vandaele, A. C., Hermans, C., Simon, P. C., Carleer, M., Colin, R., Fally, S., Mérienne, M.-F., Jenouvrier, A., and Coquart, B.: Measurements of the NO2 absorption cross section from 42 000 cm−1 to 10 000 cm−1 (238–1000 nm) at 220 K and 294 K, J. Quant. Spectrosc. Ra., 59, 171–184, 1998.
Wagner, T., Beirle, S., Remmers, J., Shaiganfar, R., and Wang, Y.: Absolute calibration of the colour index and O4 absorption derived from Multi AXis (MAX-)DOAS measurements and their application to a standardised cloud classification algorithm, Atmos. Meas. Tech., 9, 4803–4823, https://doi.org/10.5194/amt-9-4803-2016, 2016.
Wang, F., Lin, W., Wang, J., and Zhu, T.: NOx release from snow and ice covered surface in polar regions and the Tibetan Plateau, Adv. Clim. Change Res., 2, 141–148, 2011.
Wang, K., Hattori, S., Lin, M., Ishino, S., Alexander, B., Kamezaki, K., Yoshida, N., and Kang, S.: Isotopic constraints on atmospheric sulfate formation pathways in the Mt. Everest region, southern Tibetan Plateau, Atmos. Chem. Phys., 21, 8357–8376, https://doi.org/10.5194/acp-21-8357-2021, 2021.
Wang, L., Wen, L., Xu, C., Chen, J., Wang, X., Yang, L., Wang, W., Yang, X., Sui, X., Yao, L., and Zhang, Q.: HONO and its potential source particulate nitrite at an urban site in North China during the cold season, Sci. Total Environ., 538, 93–101, https://doi.org/10.1016/j.scitotenv.2015.08.032, 2015.
Wang, S., Zhou, R., Zhao, H., Wang, Z., Chen, L., and Zhou, B.: Long-term observation of atmospheric nitrous acid (HONO) and its implication to local NO2 levels in Shanghai, China, Atmos. Environ., 77, 718–724, 2013.
Wang, Y., Beirle, S., Hendrick, F., Hilboll, A., Jin, J., Kyuberis, A. A., Lampel, J., Li, A., Luo, Y., Lodi, L., Ma, J., Navarro, M., Ortega, I., Peters, E., Polyansky, O. L., Remmers, J., Richter, A., Puentedura, O., Van Roozendael, M., Seyler, A., Tennyson, J., Volkamer, R., Xie, P., Zobov, N. F., and Wagner, T.: MAX-DOAS measurements of HONO slant column densities during the MAD-CAT campaign: inter-comparison, sensitivity studies on spectral analysis settings, and error budget, Atmos. Meas. Tech., 10, 3719–3742, https://doi.org/10.5194/amt-10-3719-2017, 2017.
Wang, Y., Apituley, A., Bais, A., Beirle, S., Benavent, N., Borovski, A., Bruchkouski, I., Chan, K. L., Donner, S., Drosoglou, T., Finkenzeller, H., Friedrich, M. M., Frieß, U., Garcia-Nieto, D., Gómez-Martín, L., Hendrick, F., Hilboll, A., Jin, J., Johnston, P., Koenig, T. K., Kreher, K., Kumar, V., Kyuberis, A., Lampel, J., Liu, C., Liu, H., Ma, J., Polyansky, O. L., Postylyakov, O., Querel, R., Saiz-Lopez, A., Schmitt, S., Tian, X., Tirpitz, J.-L., Van Roozendael, M., Volkamer, R., Wang, Z., Xie, P., Xing, C., Xu, J., Yela, M., Zhang, C., and Wagner, T.: Inter-comparison of MAX-DOAS measurements of tropospheric HONO slant column densities and vertical profiles during the CINDI-2 campaign, Atmos. Meas. Tech., 13, 5087–5116, https://doi.org/10.5194/amt-13-5087-2020, 2020.
Wang, Z., Chan, K. L., Heue, K.-P., Doicu, A., Wagner, T., Holla, R., and Wiegner, M.: A multi-axis differential optical absorption spectroscopy aerosol profile retrieval algorithm for high-altitude measurements: application to measurements at Schneefernerhaus (UFS), Germany, Atmos. Meas. Tech., 13, 1835–1866, https://doi.org/10.5194/amt-13-1835-2020, 2020.
Wedderburn, R. W. M.: Quasi-likelihood functions, generalized linear models, and the Gauss–Newton method, Biometrika, 61, 439–447, https://doi.org/10.1093/biomet/61.3.439, 1974.
Wu, G., Liu, Y., Zhang, Q., Duan, A., Wang, T., Wan, R., Liu, X., Li, W., Wang, Z., and Liang, X.: The Influence of Mechanical and Thermal Forcing by the Tibetan Plateau on Asian Climate, J. Hydrometeorol., 8, 770–789, 2007.
Wu, G., Liu, Y., He, B., Bao, Q., Duan, A., and Jin, F.-F.: Thermal Controls on the Asian Summer Monsoon, Sci. Rep., 2, 404, https://doi.org/10.1038/srep00404, 2012.
Wu, S., Dai, G., Song, X., Liu, B., and Liu, L.: Observations of water vapor mixing ratio profile and flux in the Tibetan Plateau based on the lidar technique, Atmos. Meas. Tech., 9, 1399–1413, https://doi.org/10.5194/amt-9-1399-2016, 2016.
Xia, X. G., Zong, X. M., Cong, Z. Y., Chen, H. B., Kang, S. C., and Wang, P. C.: Baseline continental aerosol over the central Tibetan plateau and a case study of aerosol transport from South Asia, Atmos. Environ., 45, 7370–7378, 2011.
Xing, C.: Ground-based vertical observations of atmospheric composition from field campaign on the Tibetan Plateau, Zenodo [data set], https://doi.org/10.5281/zenodo.5336460, 2021.
Xing, C., Liu, C., Wang, S., Chan, K. L., Gao, Y., Huang, X., Su, W., Zhang, C., Dong, Y., Fan, G., Zhang, T., Chen, Z., Hu, Q., Su, H., Xie, Z., and Liu, J.: Observations of the vertical distributions of summertime atmospheric pollutants and the corresponding ozone production in Shanghai, China, Atmos. Chem. Phys., 17, 14275–14289, https://doi.org/10.5194/acp-17-14275-2017, 2017.
Xing, C., Liu, C., Hu, Q., Fu, Q., Lin, H., Wang, S., Su, W., Wang, W., Javed, Z., and Liu, J.: Identifying the wintertime sources of volatile organic compounds (VOCs) from MAX-DOAS measured formaldehyde and glyoxal in Chongqing, southwest China, Sci. Total Environ., 715, 136258, https://doi.org/10.1016/j.scitotenv.2019.136258, 2020.
Xing, C., Liu, C., Hu, Q., Fu, Q., Wang, S., Lin, Hua, Zhu, Y., Wang, S., Wang, W., Javed, Z., Ji, X., and Liu, J.: Vertical distributions of wintertime atmospheric nitrogenous compounds and the corresponding OH radicals production in Leshan, southwest China, J. Environ. Sci., 105, 44–55, 2021.
Xu, B., Cao, J., Hansen, J., Yao, T., Joswia, D. R., Wang, N., Wu, G., Wang, M., Zhao, H., Yang, W., Liu, X., and He, J.: Black soot and the survival of Tibetan glaciers, P. Natl. Acad. Sci. USA, 106, 22114–22118, https://doi.org/10.1073/pnas.0910444106, 2009.
Xu, C., Ma, Y. M., You, C., and Zhu, Z. K.: The regional distribution characteristics of aerosol optical depth over the Tibetan Plateau, Atmos. Chem. Phys., 15, 12065–12078, https://doi.org/10.5194/acp-15-12065-2015, 2015.
Xu, L., Liu, H., Du, Q., and Xu, X.: The assessment of the planetary boundary layer schemes in WRF over the central Tibetan Plateau, Atmos. Res., 230, 104644, https://doi.org/10.1016/j.atmosres.2019.104644, 2019.
Xu, X. D., Lu, C. G., Shi, X. H., and Gao, S. T.: World water tower: An atmospheric perspective, Geophys. Res. Lett., 35, L20815, https://doi.org/10.1029/2008GL035867, 2008.
Xu, Y., Ramanathan, V., and Washington, W. M.: Observed high-altitude warming and snow cover retreat over Tibet and the Himalayas enhanced by black carbon aerosols, Atmos. Chem. Phys., 16, 1303–1315, https://doi.org/10.5194/acp-16-1303-2016, 2016.
Yanai, M., Li, C., and Song, Z.: Seasonal Heating of the Tibetan Plateau and Its Effects on the Evolution of the Asian Summer Monsoon, J. Meteorol. Soc. Jpn. Ser. II, 70, 319–351, 1992.
Yang, J. H., Kang, S.C., Ji, Z. M., and Chen, D. L.: Modeling the origin of anthropogenic black carbon and its climatic effect over the Tibetan Plateau and surrounding regions, J. Geophys. Res., 123, 671–692, 2018a.
Yang, J., Kang, S., and Ji, Z.: Sensitivity analysis of chemical mechanisms in the WRF-chem model in reconstructing aerosol concentrations and optical properties in the Tibetan plateau, Aerosol Air Qual. Res., 18, 505–521, https://doi.org/10.4209/aaqr.2017.05.0156, 2018b.
Yang, K., Koike, T., and Yang, D.: Surface flux parameterization in the Tibetan Plateau, Bound.-Lay. Meteorol., 106, 245–262, 2003.
Yao, T. D., Thompson, L., Yang, W., Yu, W. S., Gao, Y., Guo, X. J., Yang, X. X., Duan, K. Q., Zhao, H. B., Xu, B. Q., Pu, J. C., Lu, A. X., Xiang, Y., Kattel, D. B., and Joswiak, D.: Different glacier status with atmospheric circulations in Tibetan Plateau and surroundings, Nat. Clim. Change, 2, 663–667, 2012.
Zhang, J., Xia, X., and Wu, X.: First in situ UV profile across the UTLS accompanied by ozone measurement over the Tibetan Plateau, J. Environ., Sci., 98, 71–76, 2020.
Zhang, R., Wang, H., Qian, Y., Rasch, P. J., Easter, R. C., Ma, P.-L., Singh, B., Huang, J., and Fu, Q.: Quantifying sources, transport, deposition, and radiative forcing of black carbon over the Himalayas and Tibetan Plateau, Atmos. Chem. Phys., 15, 6205–6223, https://doi.org/10.5194/acp-15-6205-2015, 2015.
Zhang, X., Xu, J., Kang, S., Liu, Y., and Zhang, Q.: Chemical characterization of long-range transport biomass burning emissions to the Himalayas: insights from high-resolution aerosol mass spectrometry, Atmos. Chem. Phys., 18, 4617–4638, https://doi.org/10.5194/acp-18-4617-2018, 2018.
Zhu, J., Xia, X., Che, H., Wang, J., Cong, Z., Zhao, T., Kang, S., Zhang, X., Yu, X., and Zhang, Y.: Spatiotemporal variation of aerosol and potential long-range transport impact over the Tibetan Plateau, China, Atmos. Chem. Phys., 19, 14637–14656, https://doi.org/10.5194/acp-19-14637-2019, 2019.