the Creative Commons Attribution 4.0 License.
the Creative Commons Attribution 4.0 License.
 | 20 Aug 2021
An integrated observation dataset of the hydrological and thermal deformation in permafrost slopes and engineering infrastructure in the Qinghai–Tibet Engineering Corridor
Yanli Zhuang
Mingyi Zhang
Zhongqiong Zhang
Wei Ma
Wenzhi Zhao
Li Wang
Yanmei Shi
Ze Zhang
Quntao Duan
Deyu Tian
Qingguo Zhou
Across the Qinghai–Tibet Plateau (QTP) there is a narrow engineering corridor with widely distributed slopes called the Qinghai–Tibet Engineering Corridor (QTEC), where a variety of important infrastructures are concentrated. These facilities are transportation routes for people, materials, energy, etc. from inland China to the Tibet Autonomous Region. From Golmud to Lhasa, the engineering corridor covers 632 km of permafrost containing the densely developed Qinghai–Tibet Railway and Qinghai–Tibet Highway, as well as power and communication towers. Slope failure in permafrost regions, caused by permafrost degradation, ground ice melting, etc., affects the engineering construction and permafrost environments in the QTEC. We implement a variety of sensors to monitor the hydrological and thermal deformation between permafrost slopes and permafrost engineering projects in the corridor. In addition to soil temperature and moisture sensors, the global navigation satellite system (GNSS), terrestrial laser scanning (TLS), and unmanned aerial vehicles (UAVs) were adopted to monitor the spatial distribution and changes in thermal deformation. An integrated dataset of hydrological and thermal deformation in permafrost engineering and slopes in the QTEC from the 1950s to 2020, including meteorological and ground observations, TLS point cloud data, and RGB and thermal infrared (TIR) images, can be of great value for estimating the hydrological and thermal impact and stability between engineering and slopes under the influence of climate change and engineering disturbance. The dataset and code were uploaded to the Zenodo repository and can be accessed through https://zenodo.org/communities/qtec (last access: 23 June 2021), including meteorological and ground observations at https://doi.org/10.5281/zenodo.5009871 (Luo et al., 2020d), TLS measurements at https://doi.org/10.5281/zenodo.5009558 (Luo et al., 2020a), UAV RGB and TIR images at https://doi.org/10.5281/zenodo.5016192 (Luo et al., 2020b), and R code for permafrost indices and visualisation at https://doi.org/10.5281/zenodo.5002981 (Luo et al., 2020c).
- Article
(35030 KB) - Full-text XML
-
Supplement
(911 KB) - BibTeX
- EndNote


Permafrost is frozen soil or rock containing ice, where organic material remains at or below 0 ∘C for at least 2 consecutive years, and it occurs mostly in the northern extreme of Northern Hemisphere, Alaska, and the Qinghai–Tibet Plateau (QTP) (Wang et al., 2018; Zhang et al., 1999). As a typical mountain permafrost region, permafrost slopes occur widely across the QTP. There exists a narrow engineering corridor on the QTP, where a variety of important infrastructures are concentrated, called the Qinghai–Tibet Engineering Corridor (QTEC) (Luo et al., 2018b; Zhang et al., 2015). These facilities are transportation routes for people, materials, energy, etc. from inland China to the Tibet Autonomous Region, and the QTEC is several hundred metres to several kilometres wide. From Golmud to Lhasa across the QTP, more than 1120 km of the engineering corridor contains the densely developed Qinghai–Tibet Highway (QTH), Golmud–Lhasa pipeline, Lanzhou–Xining–Lhasa fibre-optic cable, Qinghai–Tibet Railway (QTR), and 440 kV Qinghai–Tibet DC networking system, which were completed and opened in 1954, 1977, 1997, 2006, and 2013, respectively (Jin et al., 2008). There are more than six major linear projects in the QTEC, covering 632 km of permafrost and approximately 550 km of continuous permafrost with widely distributed slopes (Luo et al., 2018b). Inevitably, parts of this infrastructure are built on these slopes (Luo et al., 2018c; Jin et al., 2008).
Against the background of global climate change and increasing human activities, permafrost degradation is remarkable, resulting in an increase in the number of permafrost disasters (Huggel et al., 2010; Streletskiy et al., 2019; Bessette-Kirton and Coe, 2020; Patton et al., 2019). In engineering around permafrost slopes, permafrost disasters have widely occurred (Ma et al., 2006; Guo and Sun, 2015; Yu et al., 2020). Slope-instability-type disasters tend to occur frequently, thereby causing direct or potential harm to the engineering projects in this region, which has become the main problem affecting the safe operation and service performance of these engineering projects while increasing the difficulty and cost of engineering maintenance (Niu et al., 2015; Wirz et al., 2015). Engineering in permafrost areas will inevitably destroy the surface energy and water balance, resulting in higher temperatures at the top of the permafrost (TTOP) and a lower permafrost table (Zhang et al., 2020; Liu et al., 2020; Zhao et al., 2020). Permafrost engineering occurs on slopes, which changes the circulation of surface water and supra-permafrost groundwater, causing thermal erosion (Mu et al., 2018; Chang et al., 2015). Permafrost is affected not only by the construction and operation of engineering but also by the long-term heat impact of climate change (Wicky and Hauck, 2017; Gruber and Haeberli, 2007). In particular, high temperatures and highly ice-rich permafrost with a mean annual air temperature (MAAT) above −1.0 ∘C and an ice volume content higher than 25 % are more sensitive to climate change and disturbances in engineering activities (Wu and Zhang, 2008; Patton et al., 2019). In the past 60 years, the MAAT of the seasonal and island permafrost areas along the QTEC has increased by 0.3 to 0.5 ∘C, and the MAAT in the continuous permafrost area has increased by 0.1 to 0.3 ∘C (Obu et al., 2019; Luo et al., 2018c; Wu et al., 2007). The QTP is a large-scale amplifier of global change, experiencing warming above the global average. If the air temperature rises to 2.6 ∘C, permafrost with a mean annual ground temperature (MAGT) higher than −1.0 ∘C will degrade to seasonal frozen soil after 50 years (Luo et al., 2018c; Wu et al., 2002). Furthermore, the permafrost slope in the freezing (thawing) process is subject to frost heave (thawing subsidence), which leads to deformation and even destruction of the foundation of engineering facilities, thereby affecting the normal use of these engineering facilities (Streletskiy et al., 2019; Yu et al., 2020; Ma et al., 2017). Warming of the climate and operation of permafrost projects around slopes have caused the ground temperature to rise. On ice-rich slopes, melting underground ice due to rising temperatures reduces the cohesion and angle of internal friction between the active layer and underground ice and becomes extremely unstable under the influence of gravity (Yuan et al., 2017). The locations of these slopes near permafrost engineering projects, such as railways and highways, thaw slumps, frost heaves, landslides, rockfalls, may cause serious damage to permafrost engineering (Niu et al., 2015; Luo et al., 2018a).
The Chinese National Highway Network Plan, released in 2004, is aimed at building the Beijing–Lhasa Expressway, which will be the only expressway to enter Tibet. The Beijing–Tibet Expressway will also be built within this narrow QTEC and will run parallel to or cross-positioned with the already crowded corridor (Ma et al., 2017). The interaction between the dense layout of various permafrost engineering facilities and permafrost slopes cannot be ignored. The stability and potential disaster of permafrost slopes constitute an area of increased interest of the international permafrost community, but studies on the spatiotemporal dynamics on unstable permafrost slopes in the QTEC are still lacking. A thorough understanding of the impact of a variety of the permafrost engineering infrastructure (QTH, QTR, power and communication towers, etc.) that is densely distributed on or around permafrost slopes is lacking (Wang et al., 2020; Ma et al., 2019). Therefore, it is important to evaluate the interaction and influence between permafrost slopes and permafrost engineering by integrating hydrological and thermal deformation monitoring (Luo et al., 2018a).
Terrestrial laser scanning (TLS) with the global navigation satellite system (GNSS) was used to monitor the deformation of permafrost slopes (Luo et al., 2017; Arenson et al., 2016) and steep bedrock permafrost (Weber et al., 2019) to construct a high-resolution digital terrain model of the permafrost region (Boike et al., 2019). GNSS can be used as the datum point and control point of TLS, helping TLS point cloud data establish a georeferenced coordinate system and improving the accuracy of comparative analysis of multiple TLS data. Unmanned aerial vehicles (UAVs) can be equipped with visible digital, thermal infrared (TIR), and multispectral sensors. In addition to obtaining the topographic and landform features of the two frozen soil slopes, it can also estimate the spatial distribution of the ground surface temperature on permafrost slopes and evaluate the thermal influence of nearby engineering infrastructure (Luo et al., 2018a). UAVs can be used to monitor vegetation and terrain information in permafrost regions (Léger et al., 2019). Sluijs et al. (2018) also adopted UAVs to quantify the deformation of thaw slumps and to estimate the transfer volumes of sediment.
We provide an integrated dataset of the hydrological and thermal deformation covering permafrost engineering and slope areas in the QTEC. In addition to using soil temperature and moisture sensors to monitor in situ hydrothermal changes, GNSS, TLS, and UAVs were also adopted to observe the spatial distribution of thermal deformation. This synthesis dataset for permafrost engineering and slopes includes measured air and ground temperatures and moisture, MAAT, mean annual ground surface temperature (MAGST), TLS point cloud data, and RGB and TIR images. To fully understand and leverage existing datasets and to allow for full transparency and repeatability, we provide comprehensive information and metadata, including complete documentation of the dataset and technical methods.
The study area is located in the Kunlun Mountain Pass (KMP) in the QTEC, where the QTH, QTR, and power and communication towers are crisscrossed (Luo et al., 2018a). They are densely situated across a width of 200 m, and a variety of projects occur on permafrost slopes, connected by supporting bridges or laying towers, or directly on roadbeds. The KMP is located in the hinterland of the QTP and in the middle of the East Kunlun Mountains, adjacent to the giant main fault in the northern part of the plateau that controls its formation and development (Wu et al., 2017). In the KMP, thick early Quaternary sediments were deposited, and the sedimentary strata recorded the history of tectonic evolution in the northern part of the QTP. The MAAT in the KMP is −4 ∘C, and the MAGST ranges from −2.4 to 3.2 ∘C at a depth of approximately 15 m below the ground surface. The monthly air temperature ranges from a minimum of −28 ∘C in winter to a maximum of 18 ∘C in summer. The mean annual total precipitation ranges from 300 to 500 mm, and precipitation occurs most frequently from May to September, accounting for 80 % of the annual total precipitation, with the highest precipitation occurring from July to August. Permafrost is well developed with a high ice content, and the active layer thickness (ALT) is more than 3 m, which is generally present above 4200 m in the region. Permafrost can be found in mountains and basins, but most of the valleys do not contain permafrost. Through drilling data near the study area, the permafrost thickness ranges from 46 to 112 m, the temperature gradient within the frozen soil is 3.45 ∘C/100 m, and the geothermal gradient below the frozen soil is 3.9 ∘C/100 m (Luo et al., 2019; Yang et al., 2017).
Two slopes (slopes A and B) within the KMP were selected (Fig. 1). Slope A (35∘39′4′′ N, 94∘03′46′′ E, 4759 m a.s.l.) is located along the side of the QTH, while the QTR, supported by bridges, runs across slope B (35∘38′45′′ N, 94∘03′48′′ E, 4770 m a.s.l.), and the QTH is next to slope B. A large number of similar permafrost slopes have been found along the QTEC, but a few projects are densely distributed on permafrost slopes. Therefore, the study area is considered to be an excellent place for observing the interaction of hydrological and thermal deformation effects between engineering operations and permafrost slopes.
The active layer is mainly composed of clay from the top of the soil to a depth of 270 cm, including wet silty clay from 0 to 50 cm, loose silty clay from 50 to 120 cm, compacted clay from 120 to 180 cm, saturated clay mud from 180 to 230 cm, loose silty clay with gravel from 230 to 250 cm, and thick underground ice from 250 to 270 cm. According to the soil profile, the types of permafrost on the above two slopes can be classified as ice-rich permafrost. The vegetation type in this area is a typical alpine desert steppe. The vegetation on slope A is sparse, at a coverage lower than 5 %, and most of the vegetation is gathered at the top of the slope, while slope B contains almost no vegetation.
From 2014–2017, four deformation monitoring campaigns using TLS with GNSS and soil hydrothermal in situ monitoring were deployed. Moreover, a UAV system equipped with RGB and TIR sensors was adopted to monitor the spatiotemporal changes in the ecological environment and ground surface temperature of the slopes. The deployment of these instruments provides an integrated dataset for hydrological and thermal deformation monitoring of permafrost slopes and the various frozen soil projects (QTR, QTH, and power and communication towers) located on or near them.

Figure 1Geography of the study area, including the two permafrost slopes A and B, the Qinghai–Tibet Highway and Qinghai–Tibet Railway, and power and communication towers.
3.1 Meteorological observations
Observation of meteorological factors was conducted at two permanent meteorological stations (Golmud and Wudaoliang) and one field meteorological station (Xidatan) (Table 1), which were retrieved from the National Meteorological Information Center (NMIC, http://data.cma.cn, last access: 22 June 2021). The two weather stations are located on the north and south sides of the two slopes and are also the closest national weather stations to the two slopes. The meteorological database includes the daily mean, maximum (max), and minimum (min) air temperatures; wind speed; observed and corrected precipitation; evaporation; air humidity; atmospheric pressure; sunshine duration; daily mean, max, and min ground surface temperatures; and the soil temperature at different depths (i.e., 5, 10, 15, 20, 40, 50, 80, 160, and 320 cm) from the 1950s to 2020. Golmud and Wudaoliang are two national reference meteorological stations in China, while Xidatan is a national general field station. Although these two national meteorological stations are far from the above two slopes, the data obtained from these meteorological stations are very valuable in this harsh environment. Their data can be combined with the data obtained from the Xidatan field station (Zhao, 2018) to analyse the spatiotemporal dynamics of the permafrost slopes in the corridor.
Meteorological station Golmud (36∘25′ N, 94∘54′ E, 2808 m a.s.l.) is located in the urban area of Golmud, south of the two slopes, with few surrounding buildings. This weather station area is located in the seasonal frozen soil zone. The distance between the station and the two slopes is approximately 115 km.
The meteorological station Xidatan (35∘43′ N, 94∘08′ E, 4538 m a.s.l.) is located in the northern part of the two slopes and is the closest field weather station to the two slopes. The distance between the station and the two slopes is approximately 9.7 km. The Xidatan field station is 300 m away from the QTH and is located at the northernmost end of the permafrost in the QTEC. The vegetation type on the underlying surface is an alpine meadow. Figure 2 shows the data for this station. Observation data were retrieved from the National Tibetan Plateau Data Center (NTPDC, https://data.tpdc.ac.cn/, last access: 22 June 2021).
The meteorological station Wudaoliang (35∘13′ N, 93∘05′ E, 4612 m a.s.l.) is located to the north of the two slopes in a continuous permafrost zone, next to the 109 National Highway along the QTH. The distance between the station and the two slopes is approximately 101 km.
Table 1List of meteorological observation data, where n/a indicates not applicable. Automated observations were conducted at the Golmud and Wudaoliang stations in 2000 and 2001, respectively.
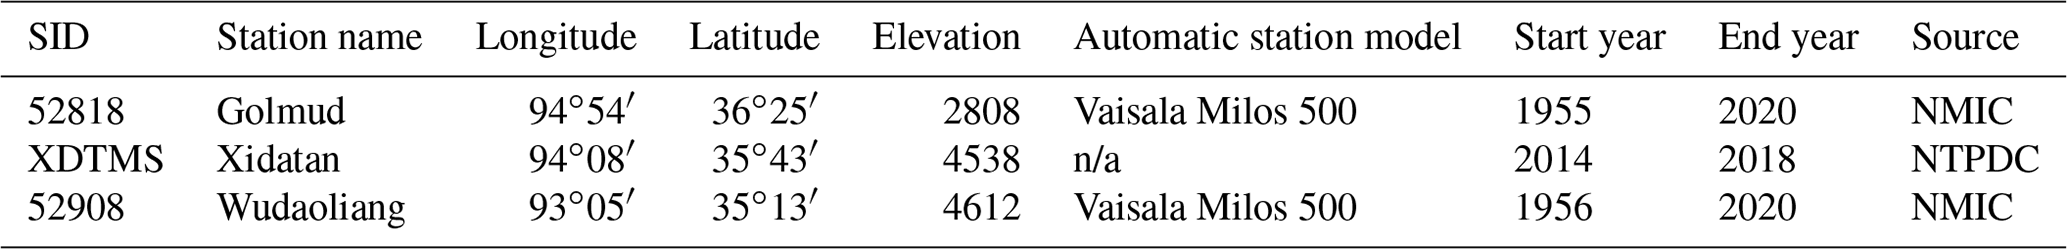

Figure 2Time series (daily mean values) of the Xidatan field station from 2014 to 2018: (a–e) meteorological observation data.
3.2 Ground observations
Changes in soil temperature and humidity can be used to indicate water and heat transfer processes, which will strongly affect the physical and mechanical properties of frozen soil and will further affect the stability of slopes. The ground temperature and moisture data from near the surface to within 270 cm in the study area were recorded. In situ ground observations were deployed starting in July 2013 in the active layer of slope A at 11 depths (1, 30, 63, 80, 100, 123, 140, 175, 205, 235, and 260 cm) using thermocouple probes (105T, Campbell Scientific) to measure the soil temperature and using 11 time domain reflectometer (TDR) probes (model CS615-L, Campbell Scientific) at 11 depths (10, 20, 48, 74, 91, 110, 135, 157, 190, 220, 245, and 270 cm) to measure the soil volumetric water content from 2014 to 2019 (Fig. 3). The TDR probes were mounted horizontally along the soil profile next to the temperature probes at the different soil depths, and measurements were recorded once per hour. Since the soil undergoes a freezing period from refilling to compaction, the 2013 data are not analysed. A Campbell Scientific CR1000 data logger is used to connect the ground temperature and volumetric water content probes. Figure 4 shows the kriging interpolation data of the soil temperature and volumetric water content at the different depths from 2014 to 2019 in the study area. The two permanent meteorological stations also contain ground observation data. Soil moisture with a soil temperature below 0 ∘C is beyond the scope of instrument monitoring. Monitoring soil moisture under frozen conditions has always been a technical difficulty. Therefore, soil moisture data below 0 ∘C are not available.
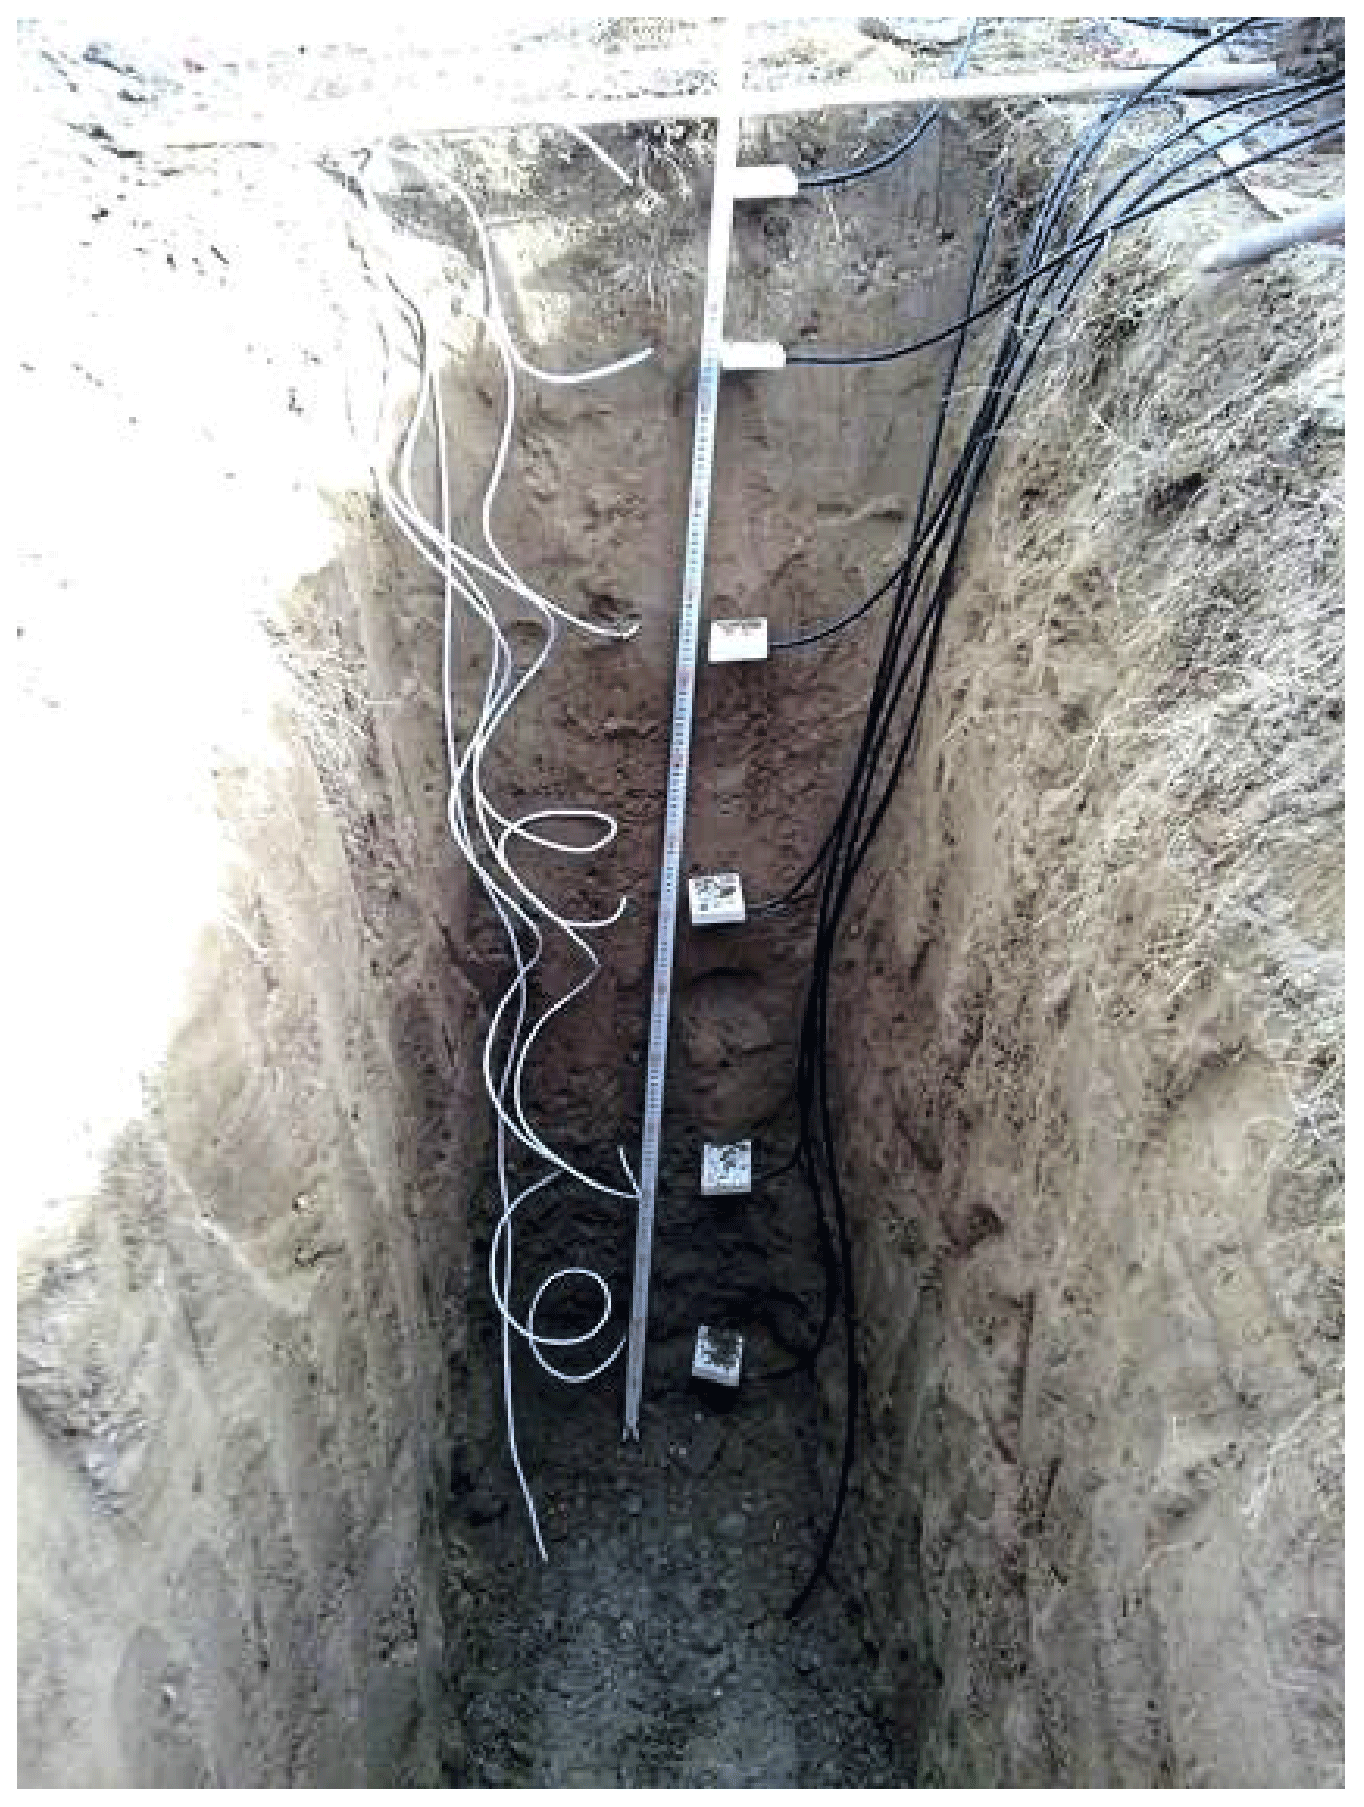

Figure 4Soil temperature and volumetric water content from 2014 to 2019: (a) soil temperature (∘C) and (b) soil moisture (%).
3.3 TLS and GNSS
Deformation monitoring was performed through TLS with a network real-time kinematic (RTK) service provided by the National Geodetic Control Network (NGCN) for the China Geodetic Coordinate System 2000 (CGCS 2000) at permanent reference stations for the GNSS (Fig. 5a and b). A FARO Focus3D X130 3D laser scanner and six Trimble 5700 GNSS systems were deployed at the study site between May 2014 and October 2015. Two GNSSs were adopted as datum points 30 km outside the study area (Fig. 5c and d), and another four GNSSs were deployed as reference points around one of the slopes. According to the manufacturer's specifications, the FARO TLS instrument measures 3D coordinates with a distance accuracy up to ±1 mm, and the ranging error is ±2 mm. The Trimble 5700 GNSS systems achieve a measurement accuracy of ±5 mm + 0.5 ppm root mean square (rms) horizontally and ±5 mm + 1 ppm rms vertically for static and FastStatic GPS surveying, respectively.

Figure 5TLS observation with the GNSS from 2014 to 2015: (a) datum station of the GNSS, (b) TLS observation with the GNSS and white reference sphere set, (c) datum station 454F, and (d) datum station 455F.
Since May and October are the transition periods of the freeze–thaw cycle, we conducted monitoring campaigns in the months of May and October between May 2014 and October 2015. The successive three freeze–thaw phases are referred to as the first thaw (2 May to 10 October 2014), first freeze (10 October 2014 to 3 May 2015), and second thaw (3 May to 4 October 2015). The above two slopes mainly manifested melting collapse during thawing and frost heave during freezing, but frost heave dominated after several freeze–thaw cycles (Figs. 6 and 7). A full slope scan requires approximately 30 scan positions to generate 3D point cloud data. Each scan requires the placement of six white reference spheres at the study site, and they are visible at all scan locations. Two to three of these reference spheres are moved for the next scan. Six reference sphere data points can be combined with the GNSS data to georeference, register, align, and mosaic the point cloud data of the TLS instrument with FARO SCENE and Geomagic Studio software. TLS monitoring data show that during the thawing period, the slopes were dominated by subsidence, while during the freezing period, the slopes were dominated by frost heave. After multiple thawing cycles and one freezing cycle, the slopes also exhibit frost heave characteristics (Luo et al., 2019).
As a supplement to the TLS point cloud data, we prepared Sentinel-1 deformation data during the freeze–thaw stages in the study area from 2014 to 2020 using interferometric synthetic aperture radar (InSAR) technology.
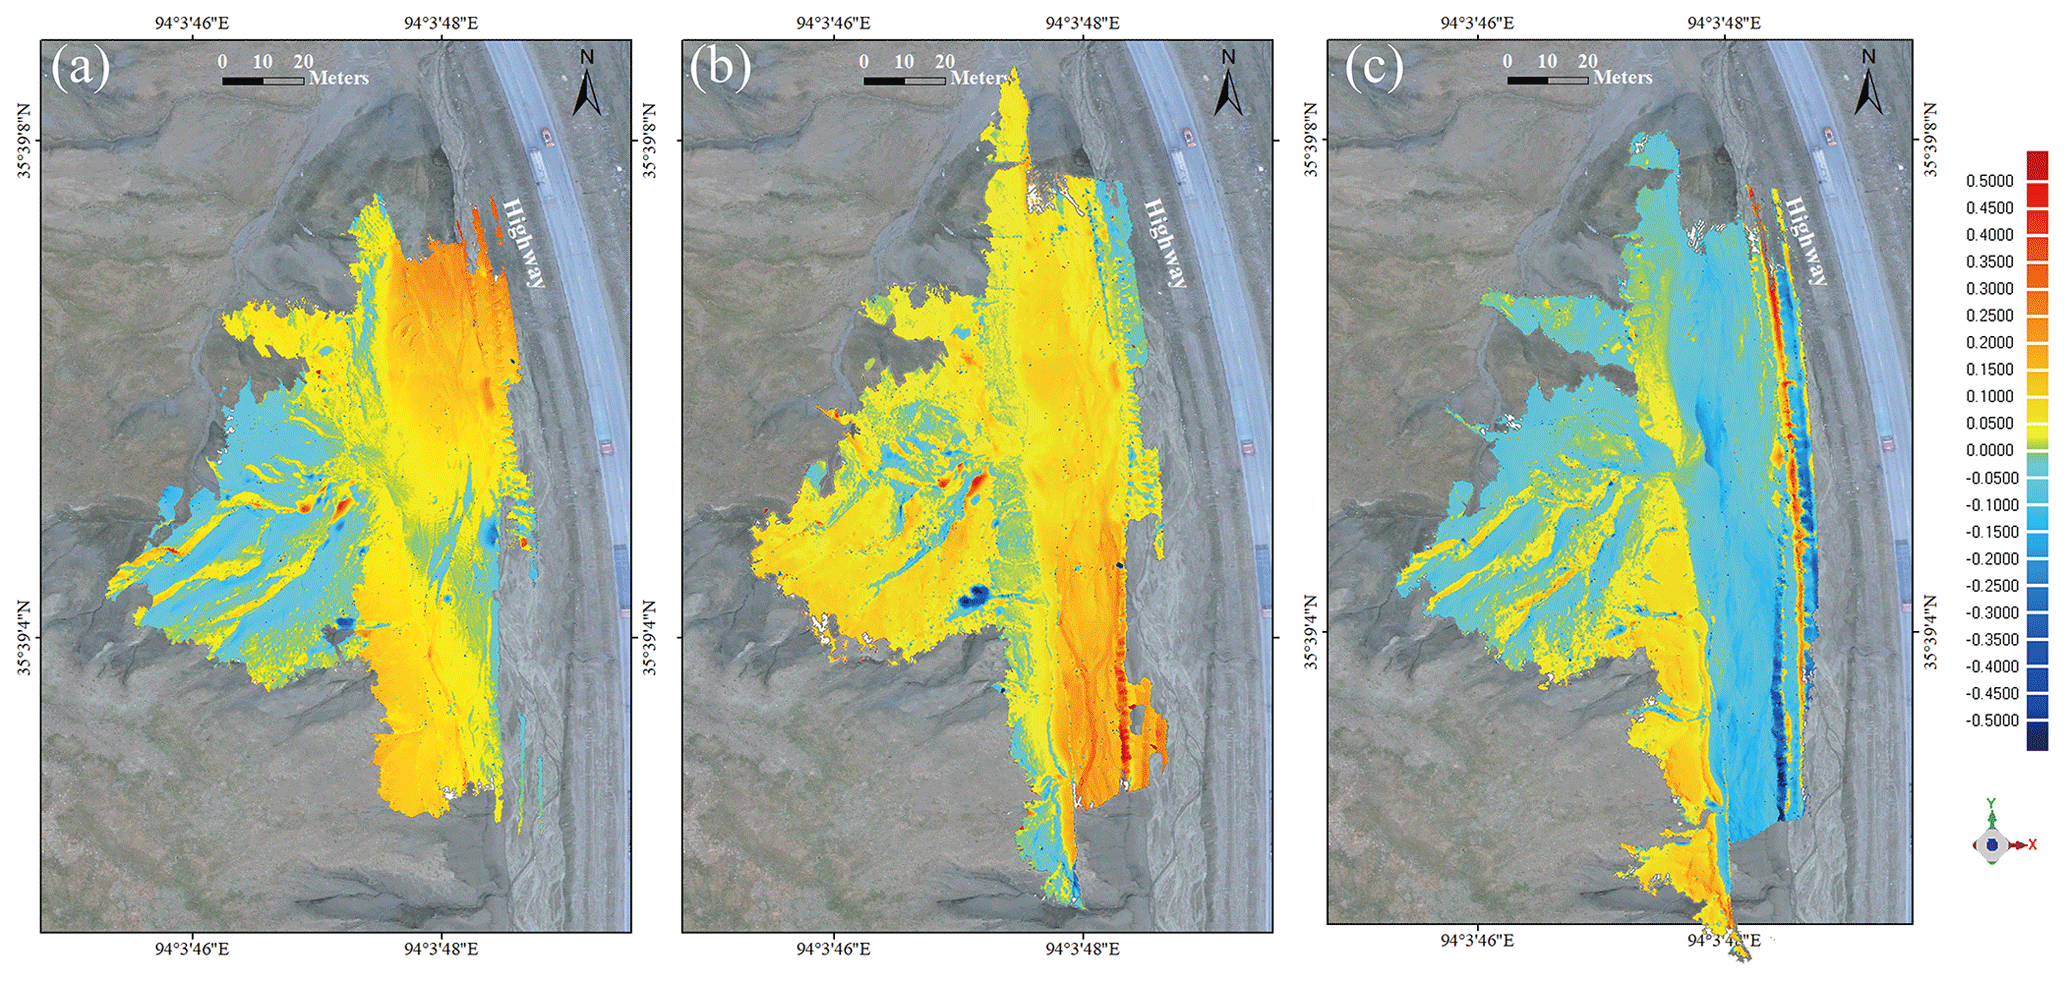
Figure 6Deformation of slope A during the first thaw, first freeze, and second thaw: (a) first thaw, (b) first freeze, and (c) second thaw.
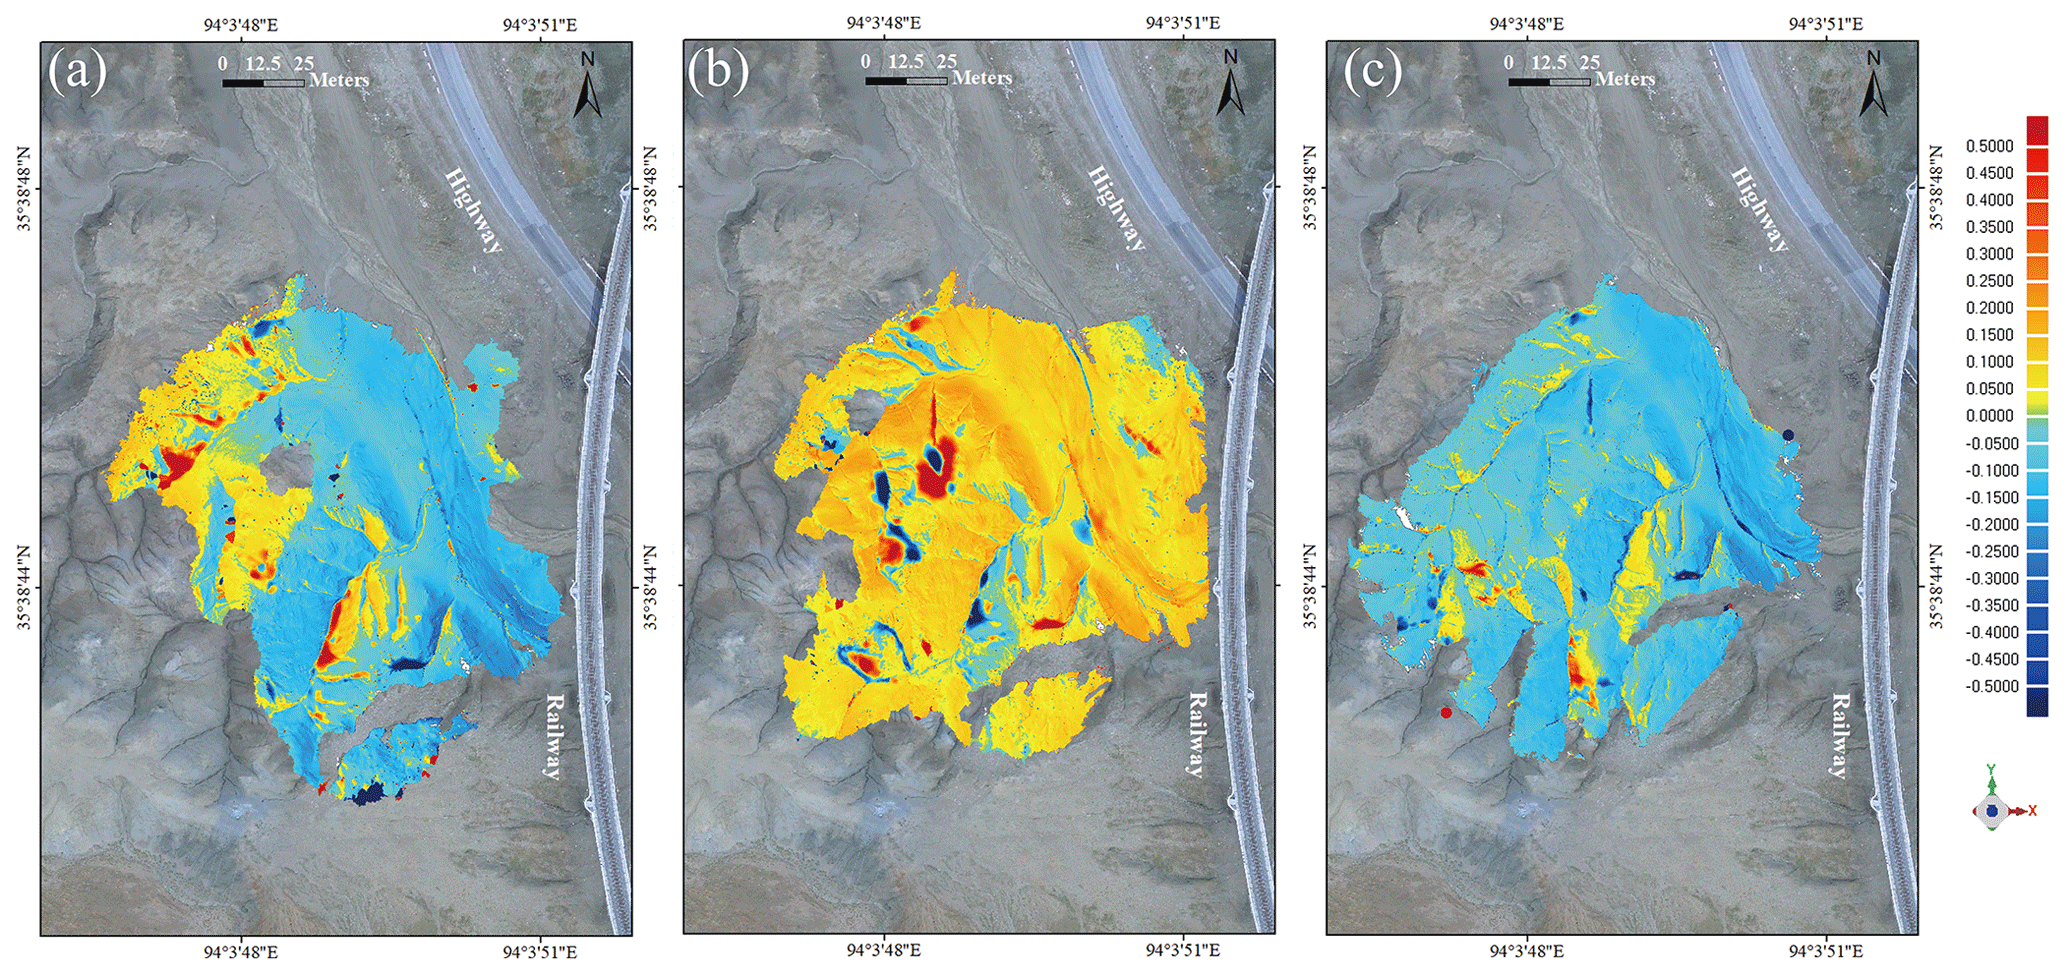
Figure 7Deformation of slope B during the first thaw, first freeze, and second thaw: (a) first thaw, (b) first freeze, and (c) second thaw.
3.4 UAV with multisensors
The change in frozen soil is greatly affected by the temperature. To monitor the heat exchange between the two slopes and the engineering infrastructure around them, a UAV system with mounted RGB and TIR sensors was adopted (Luo et al., 2018a). The DJI Inspire 1 UAV system (DJI, Inc., Shenzhen, China) weighs approximately 2.85 kg, including propellers and batteries, and is equipped with a Zenmuse X3 RGB camera and a Zenmuse XT TIR sensor. The camera and sensor weigh 221 and 270 g, respectively. The UAV is also equipped with GPS and an inertial measurement unit (IMU) to measure the geographical and flight positions, respectively. The TIR sensor has a resolution of 336 × 256 pixels, a thermal sensitivity of <0.05 ∘C at , a field of view of 17∘ (H) × 13∘ (V), a focal length of 19 mm, and a spectral response in the electromagnetic spectrum. The above TIR sensor has a range from 7.5 to 13.5 µm. A mobile phone equipped with a flight control system app is used to control the flight of the UAV, in addition to DJI GO and Pix4D capture software. Both instruments adopt vertical angles to capture images, with RGB overlap rates above 75 % and TIR overlap rates above 80 %.
Figure 8 shows the UAV flight path over the slopes. The two permafrost slopes were subjected to four flight experiments with UAV-mounted RGB and TIR sensors in 2016 and 2017. The TIR flight experiments lasted from morning to afternoon, with intervals of 1 to 2 h (Table 2). The RGB datasets were processed with pix4dmapper software to generate digital surface model (DSM) and orthorectification images. The TIR images were processed with the software program FLIR Tools (FLIR System Inc., USA) (Fig. 9), and ground surface temperature differences were analysed to determine the effects of the different permafrost engineering operations on the slopes (Fig. 10). This study analyses the thermal impact of engineering operations on permafrost slopes. The projects and the slope were divided according to a width of 2 m, and then the surface temperature of the project and the temperature between different zones of the surrounding slope were compared. When these temperature differences appear at the first break point, this is the largest thermal impact of the project on the slope. The distance between the heat-affected zone and the project is the maximum range of thermal influence (Luo et al., 2018a). The results show that the QTH has the greatest thermal impact on permafrost slopes, followed by the QTR and finally the power and communication towers.
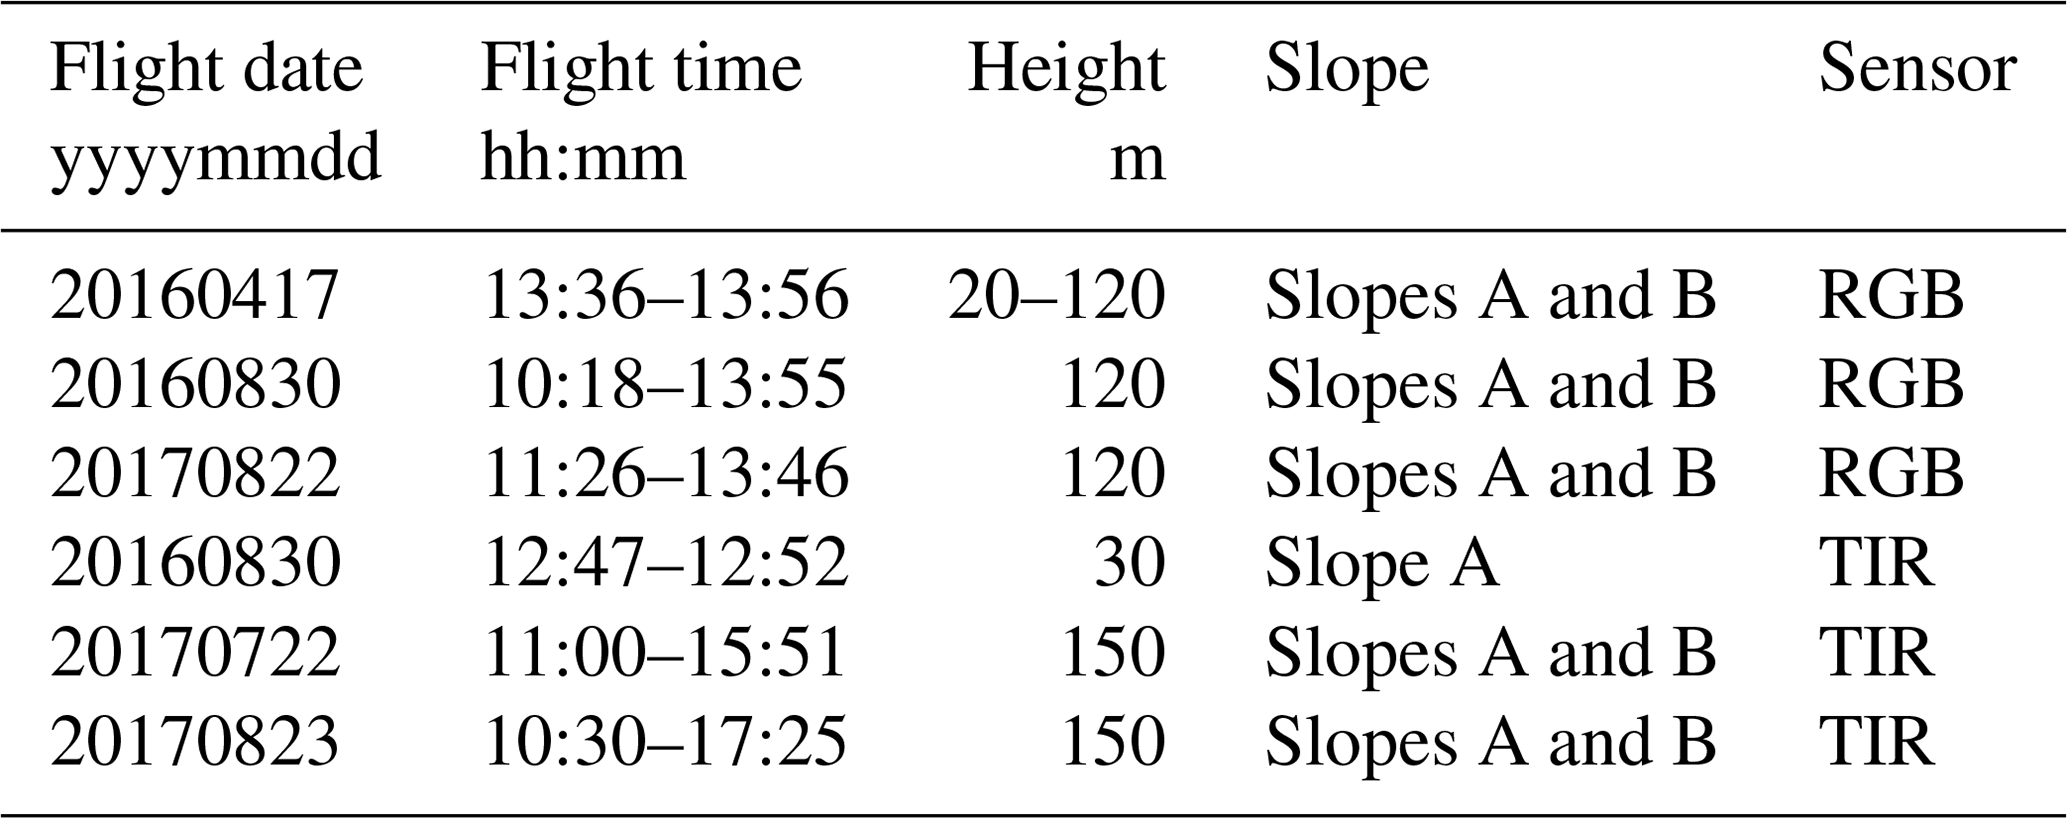
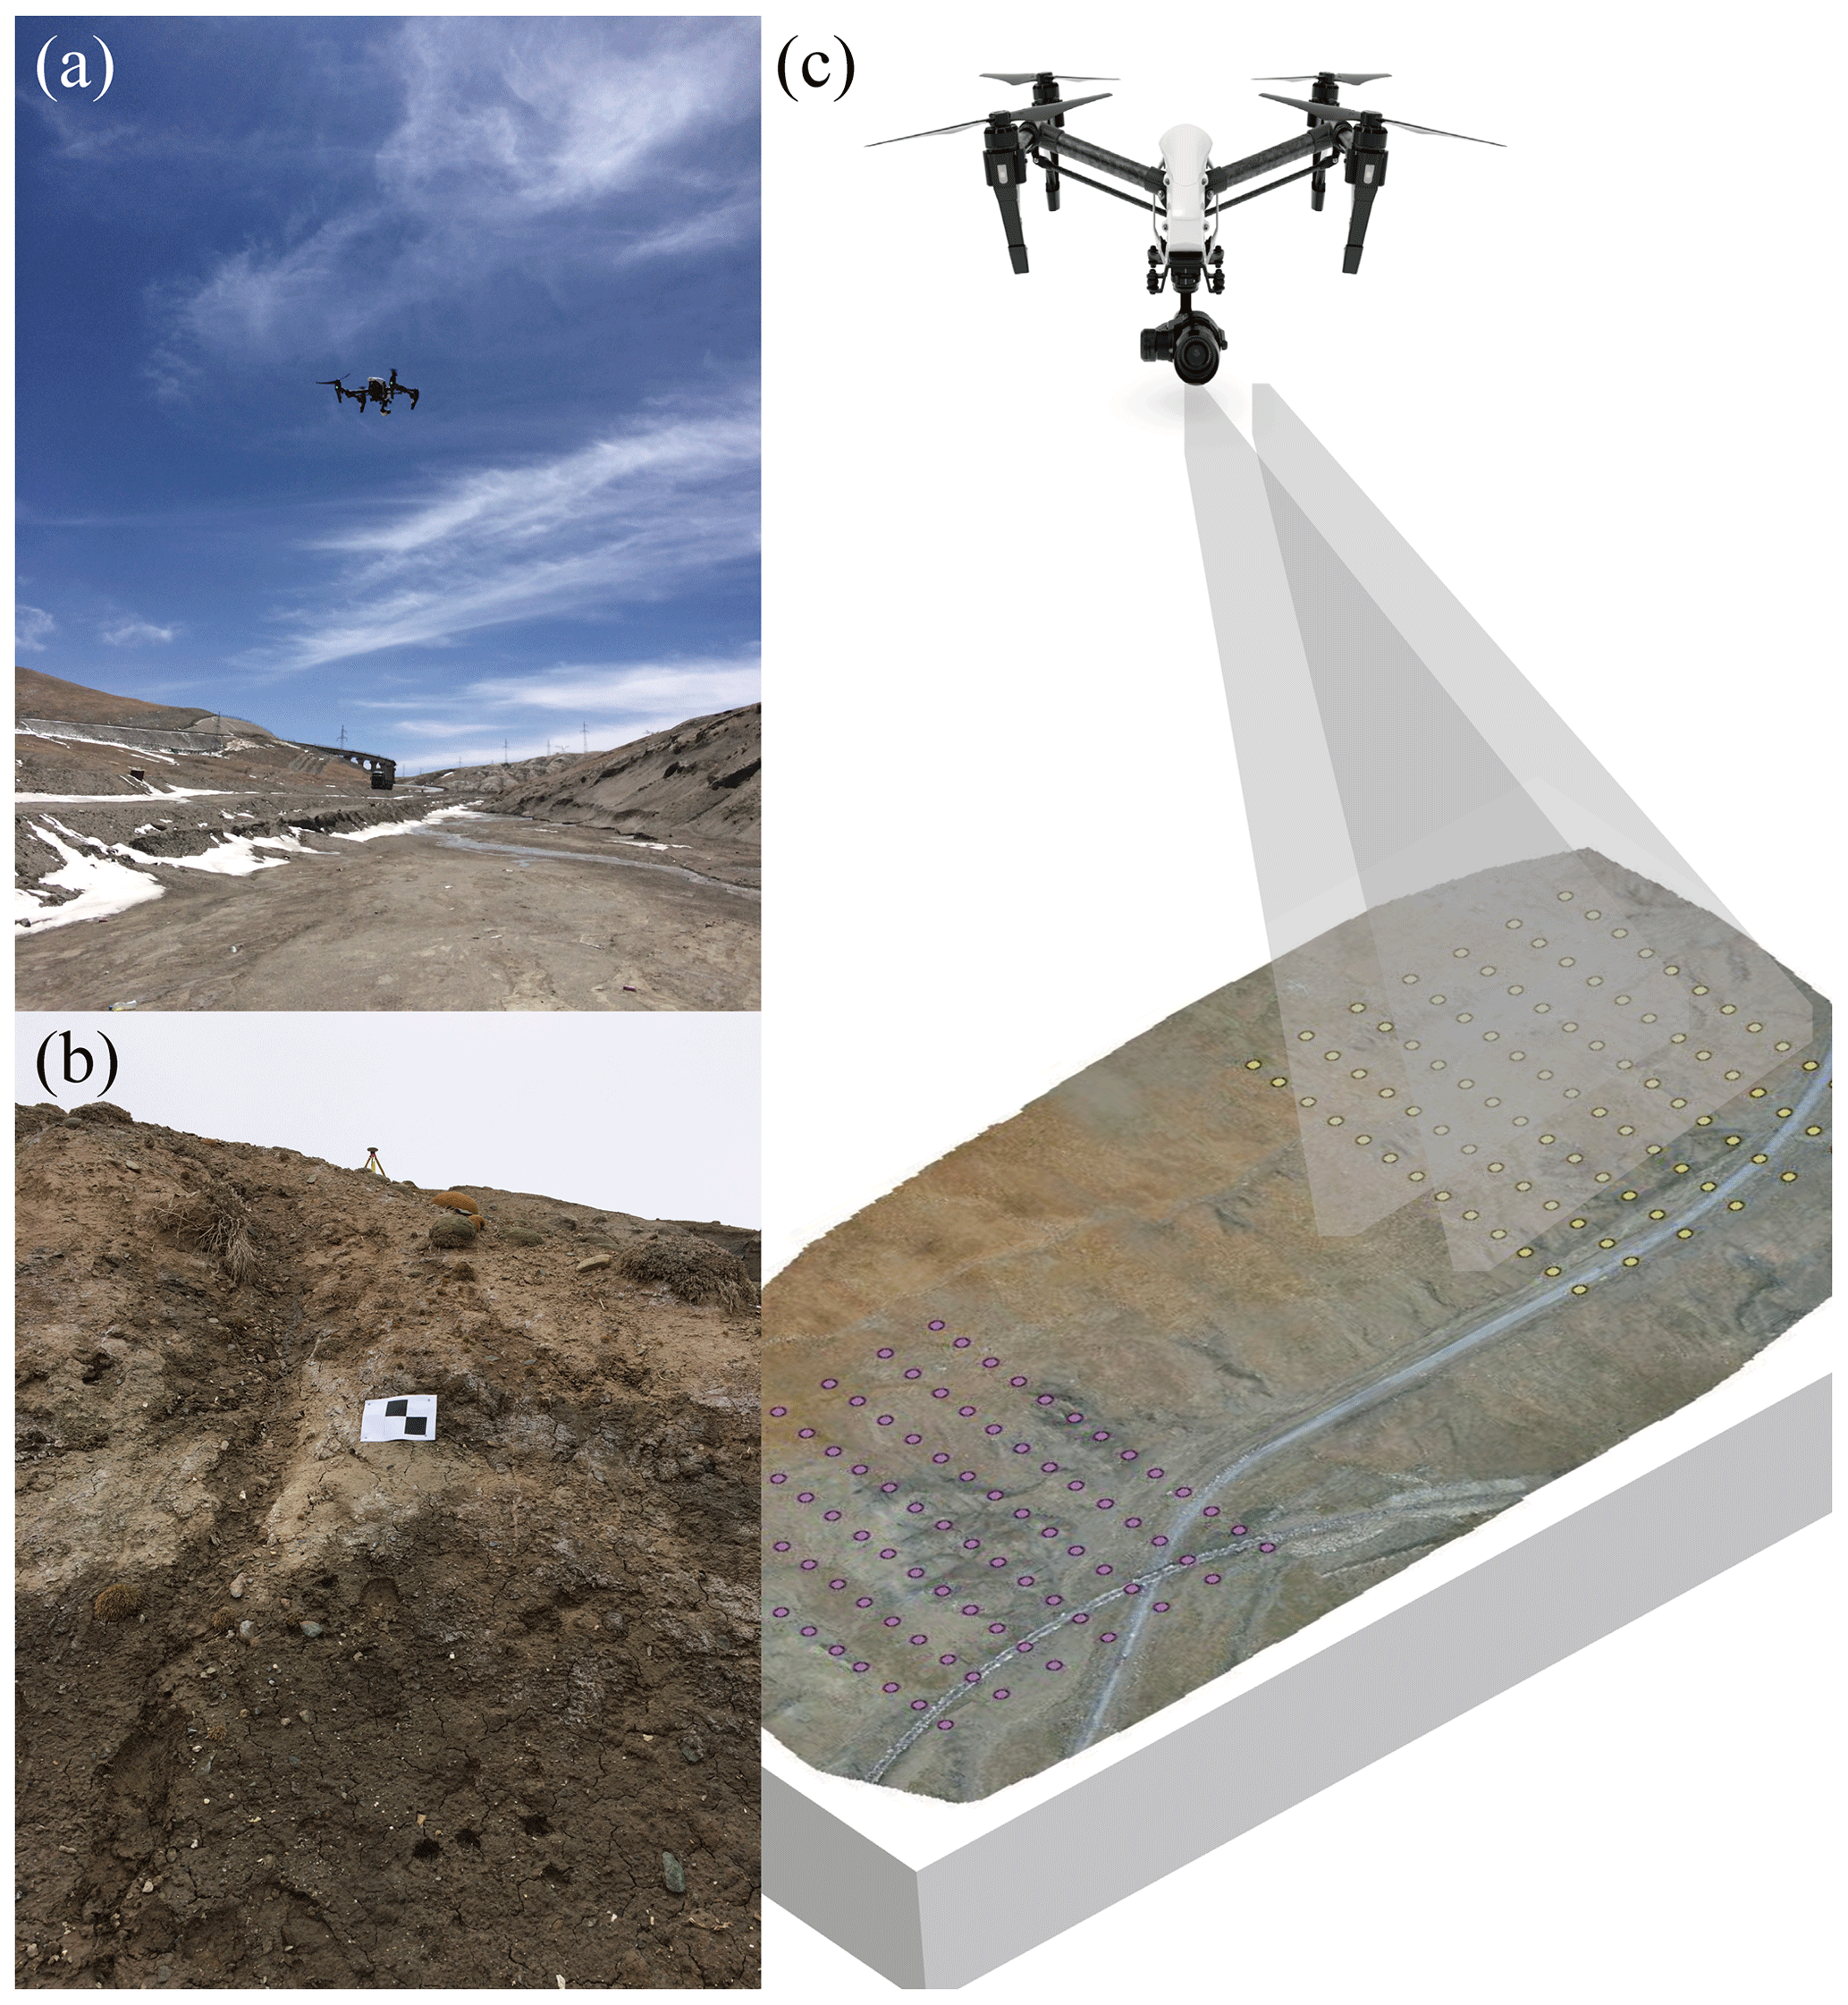
Figure 8UAV field observations from 2016 to 2017: (a) UAV under observation, (b) GNSS and rectangular white and black cardboard, and (c) UAV flight path over the two permafrost slopes.
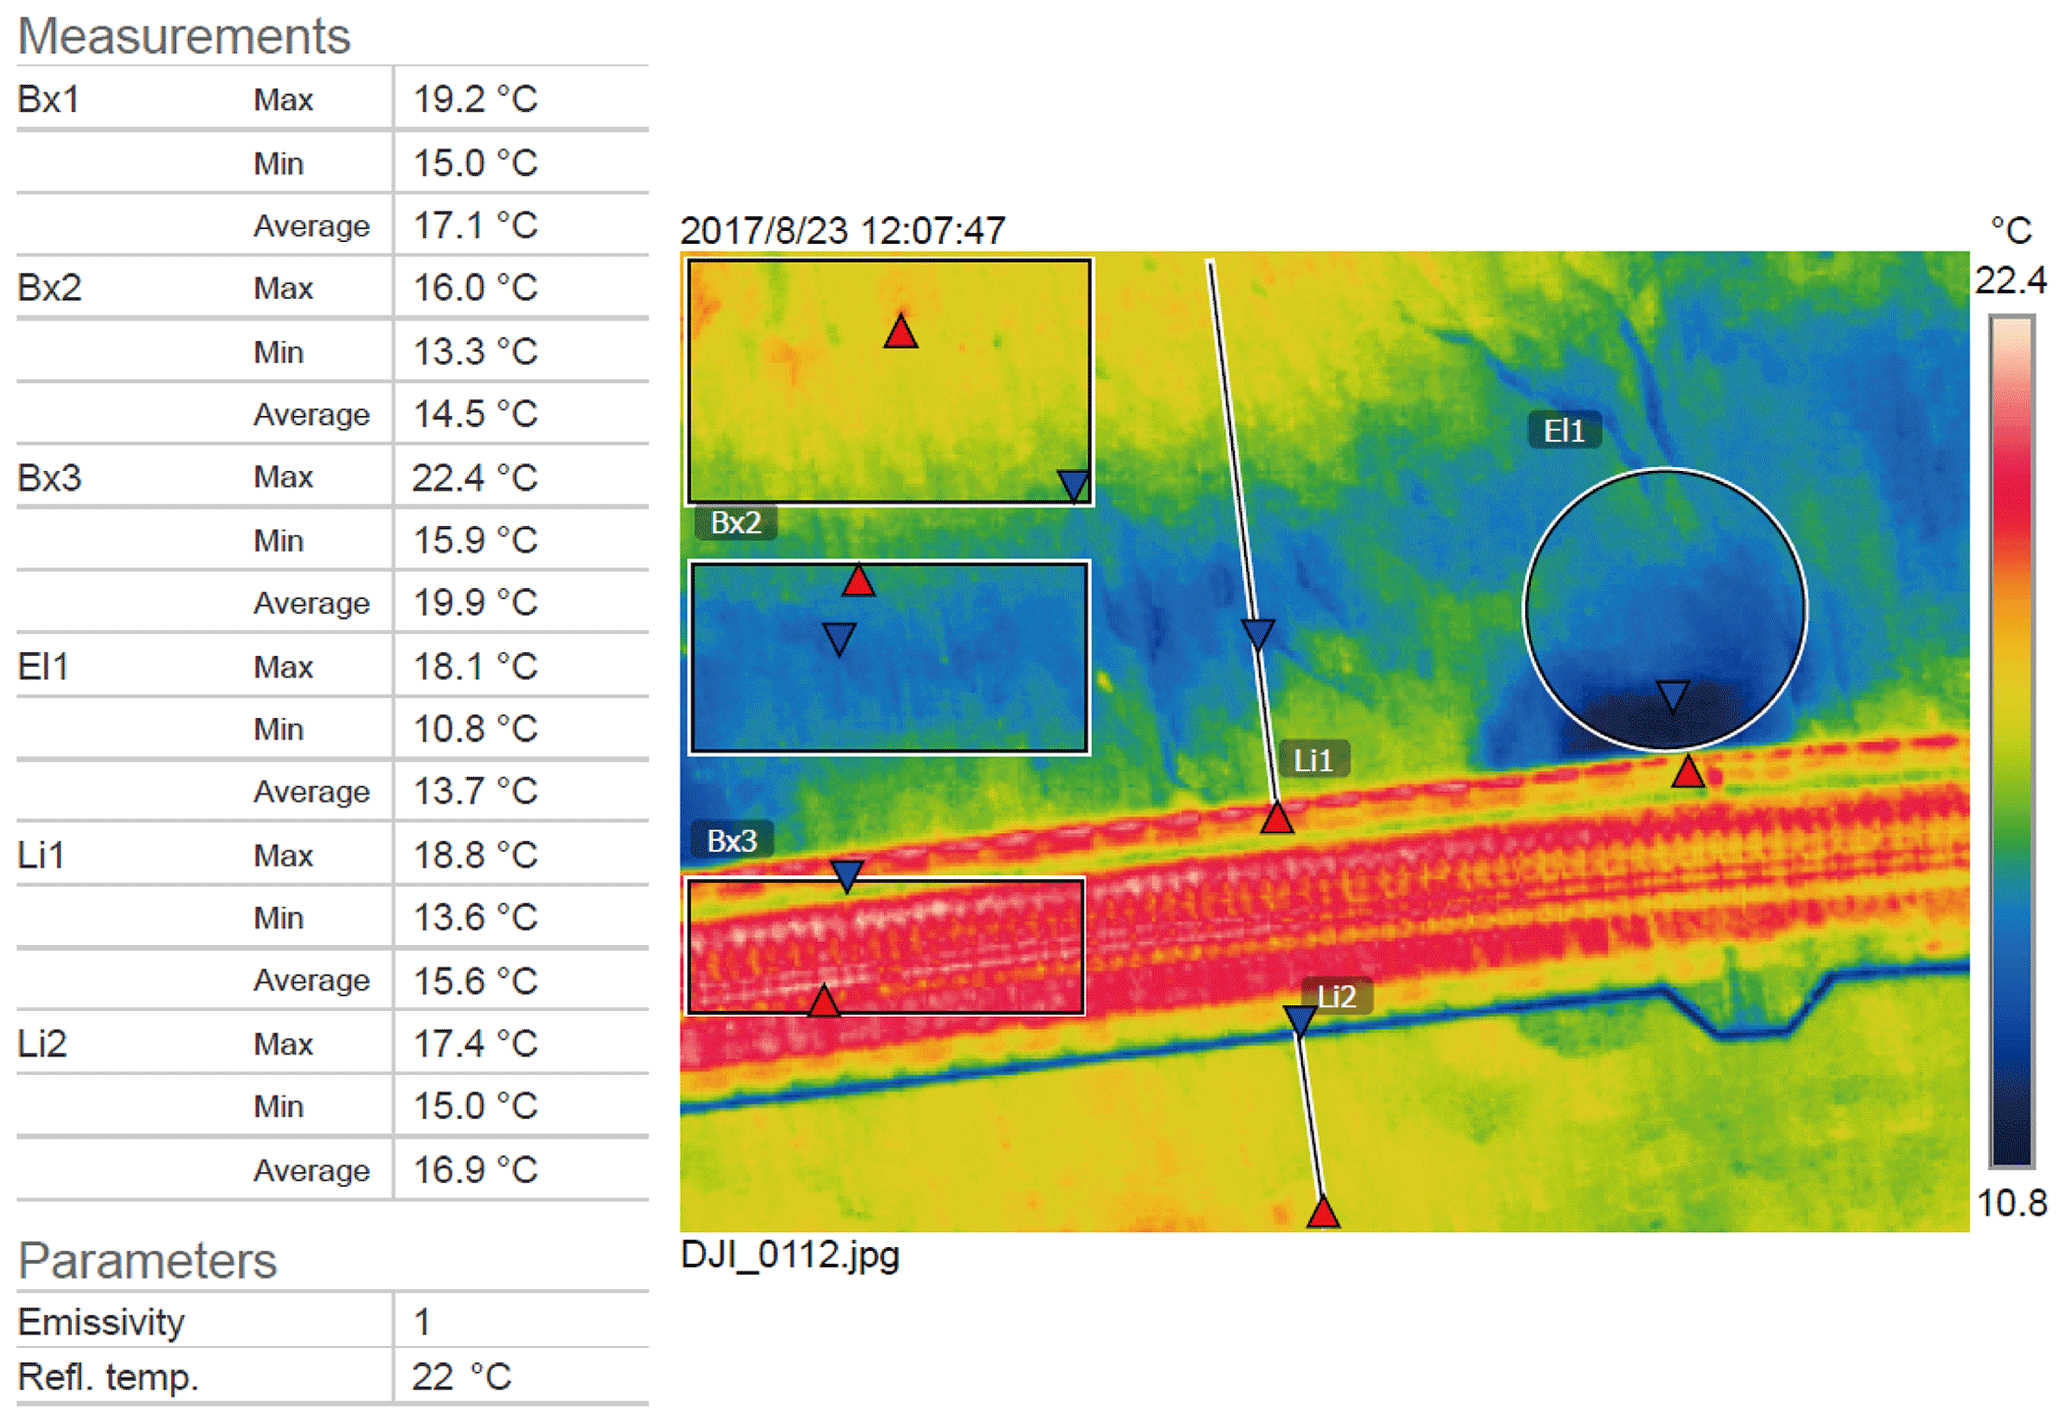
Figure 9Analysis of the ground surface temperature using UAVs with TIR sensors, with the Qinghai–Tibet Railway as an example.
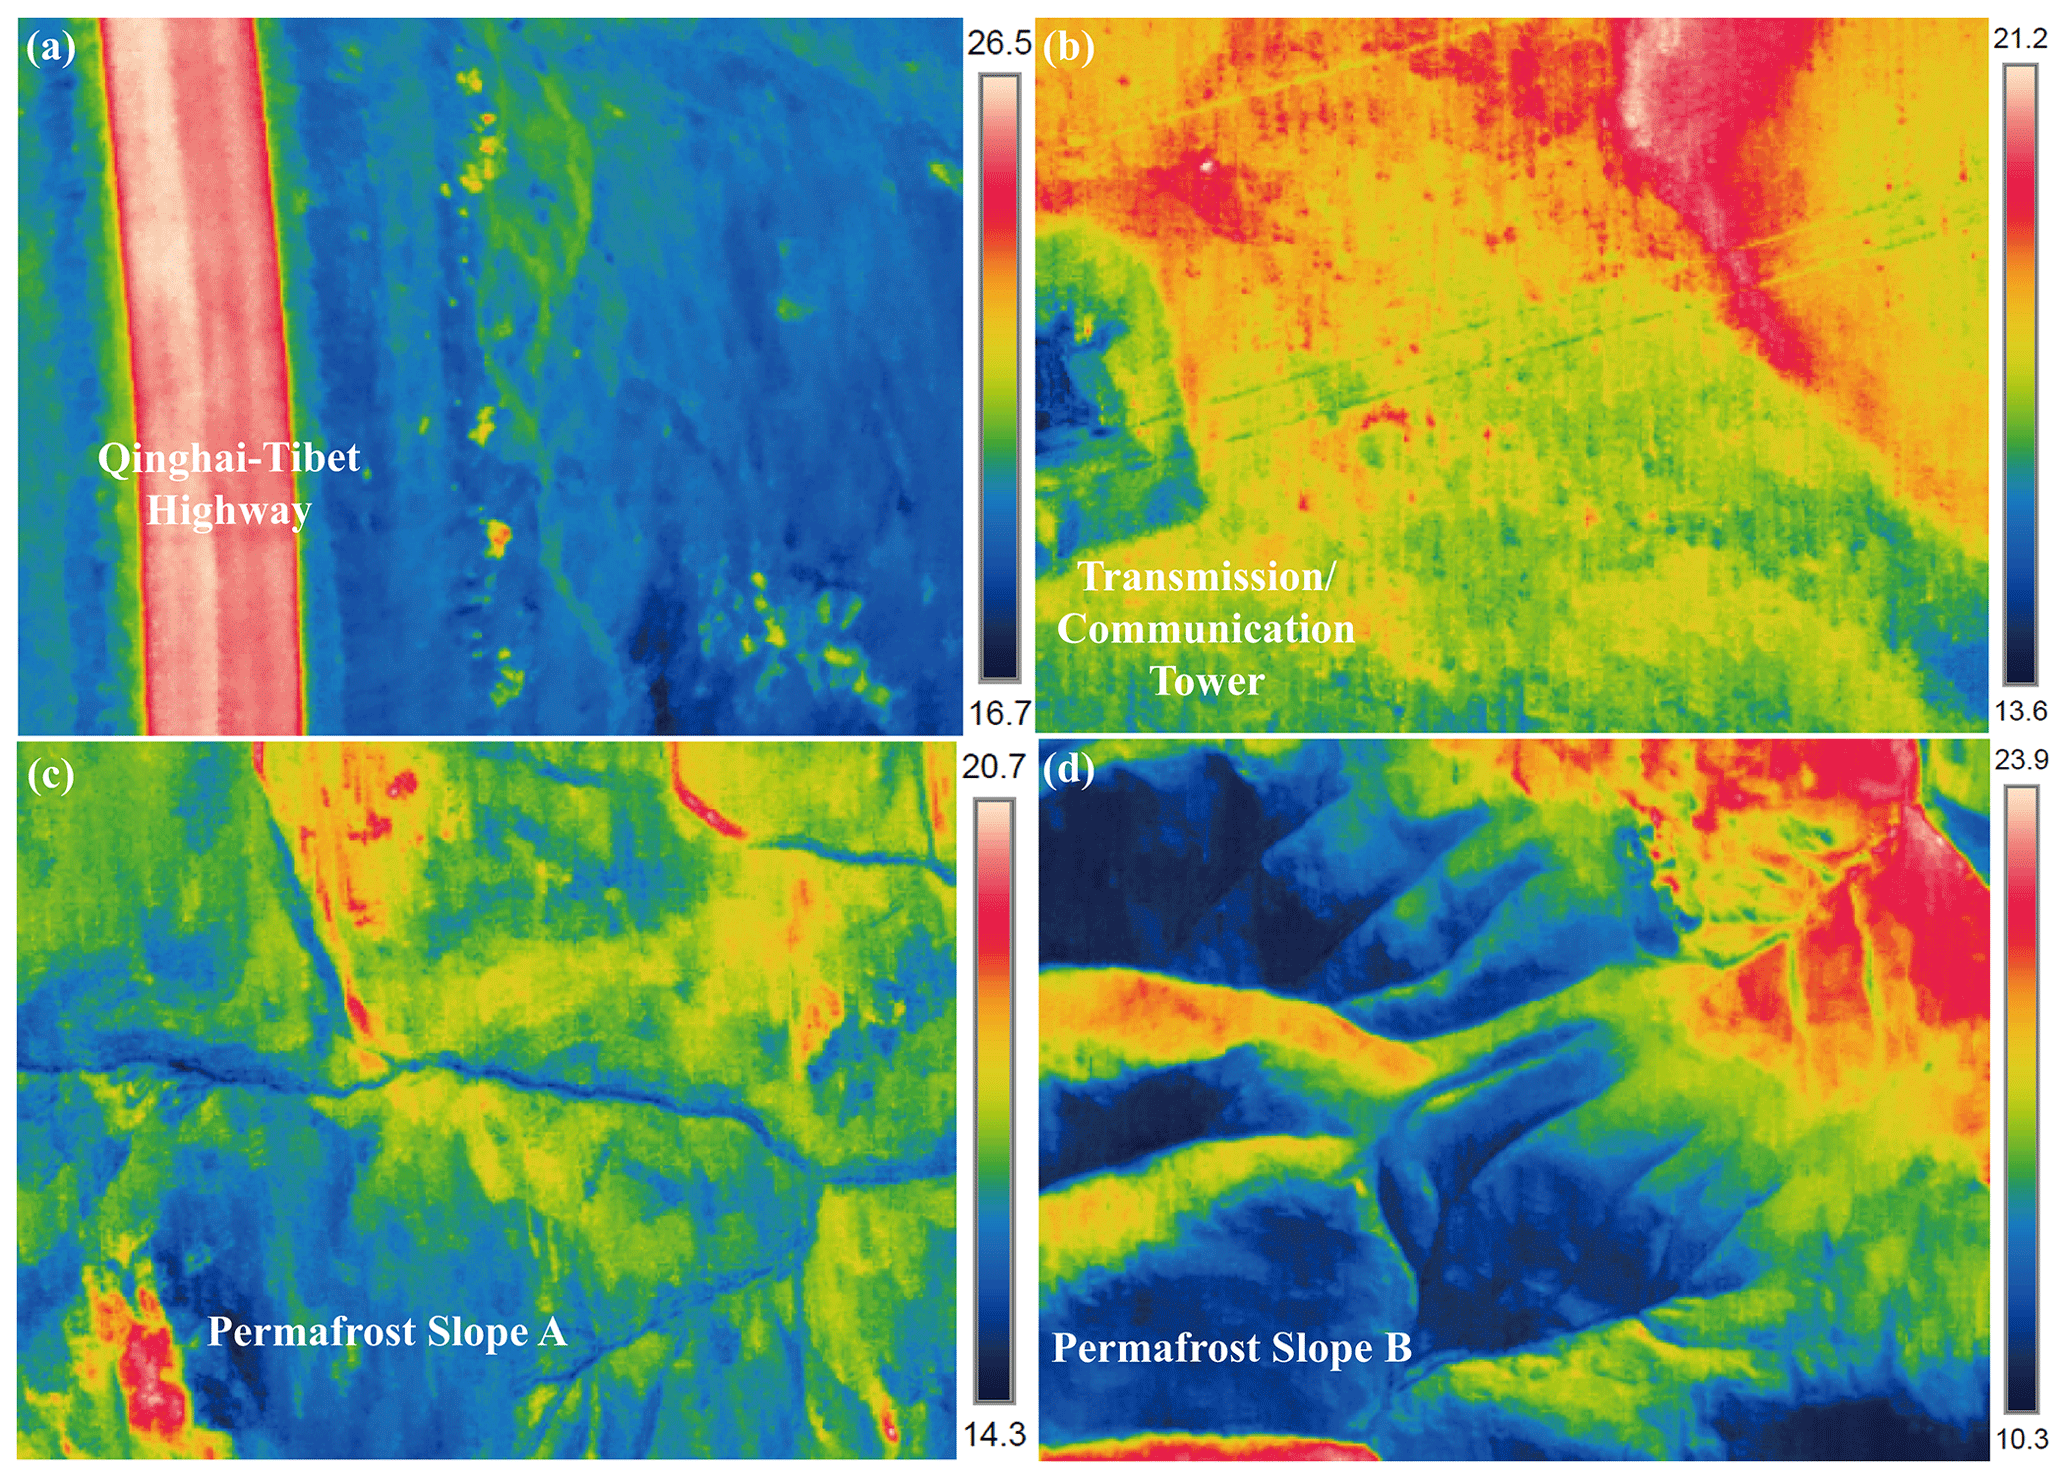
Figure 10Ground surface temperature using UAVs with TIR sensors: (a) Qinghai–Tibet Highway, (b) power and communication tower, (c) slope A, and (d) slope B.
The meteorological data have undergone quality control. First, all suspicious and incorrect data were manually re-examined and corrected. For example, a new column of “Corrected_P” has been added to the precipitation data based on the original data, and this column of data is the result of the manual revision. Ultimately, all feature data are marked with a quality control code (Table 3). In terms of the instantaneous meteorological values, if data are missing due to collector or communication issues, the terminal directly generates missing data when the terminal commands the data input, and the corresponding quality control identifier is 8. If there are no missing data, the quality control is assessed to be incorrect at the terminal. When the command data are output, values are still generated, and the corresponding quality control identifier is 2, but the erroneous data do not participate in the subsequent related calculations or statistics. After quality control, the availability of the various weather elements is usually higher than 99 %, and the correct data transmission rate approaches 100 %. However, the meteorological data of Xidatan field station and the ground data of the study area are manually sorted and verified, and no standardised quality control is adopted.
The use of GNSS and white reference spheres can improve the accuracy of TLS monitoring, while the use of GNSS and rectangular white and black cardboard can improve the accuracy of UAV monitoring (Luo et al., 2019). By measuring the ground reference and control points of the TLS, the GNSS is used to ensure the orientation and registration of the different 3D datasets in the common coordinate system. The spherical shape achieves the maximum scanning efficiency in all directions and has proven to be the most effective laser scanning target, which can be used in conjunction with the GNSS datum points (454F and 455F) and control points to register, align, and mosaic the TLS data. These GNSS instruments collect data on the ground reference points to ensure maximum geospatial accuracy, and they are subject to stringent ground controls to reference and calibrate the 3D FARO laser scanner. Moreover, the 3D laser scanner and GNSS obtain continuous, high-precision spatial deformation data on the slopes, and we can compare the spatial changes over time through the GNSS network. These targets are used for registration and as georeferences and checkpoints. Therefore, their positioning accuracy directly affects the accuracy of the data processing results. Data preprocessing is proposed to determine the scope of the slope, filter any noise points, and repair data gaps. Semiautomatic and manual processing is conducted to filter the noise points and repair the gaps in the point cloud datasets (Luo et al., 2019). Due to the high moisture content in the lower part of the slope, monitoring is easily disturbed by vibrations, resulting in noise. At the top of slope A, large wild animals such as wild donkeys were observed. Therefore, the deformation of the slope is also affected by the trampling of wild animals and should be taken into account in the analysis.
Table 3Quality control codes for the meteorological station data. The variable names are suffixed with _QC.

All data and R code presented in this paper are available from Zenodo (https://zenodo.org/communities/qtec; last access for all Zenodo links: 23 June 2021), which provides a dataset view and download statistics. The data and code are open access (including links to the subsets) and can be found on either repository via the following links:
-
Meteorological and ground observations:
https://doi.org/10.5281/zenodo.5009871 (Luo et al., 2020d);
-
TLS measurements:
https://doi.org/10.5281/zenodo.5009558 (Luo et al., 2020a);
-
UAV RGB and TIR images:
https://doi.org/10.5281/zenodo.5016192 (Luo et al., 2020b);
-
R code of permafrost indices and visualisation:
https://doi.org/10.5281/zenodo.5002981 (Luo et al., 2020c).
Slope failure in permafrost regions, caused by permafrost degradation and ground ice melting, affects the engineering infrastructure and permafrost environment in the QTEC. Most of the current studies are based on the interaction between individual engineering projects and permafrost slopes by means of multipoint monitoring, interpolation, or simulation, but the dense layout of the various projects and the fragile and sensitive permafrost slopes in the corridor have rarely been previously studied as a whole. The permafrost slopes and various projects (QTR, QTH, and power and communication towers) located in the corridor are chosen as the research objects, and 3D terrain change monitoring technology using TLS and GNSS, low-altitude remote sensing technology using UAV-based visible and TIR, and in situ monitoring technology were deployed, combined with image mosaics, three-dimensional modelling, and spatial analysis. This dataset contains both site and space features on both the surface and underground horizons, including the ground hydrothermal state, spatial ground surface temperature, slope deformation, and meteorological data, thus establishing a comprehensive monitoring dataset for the QTP permafrost slopes and their surroundings (QTR, QTH, etc.). The dataset will be of great value to examine the hydrological and thermal deformation of permafrost slopes under the influence of climate change and engineering disturbances, as well as to reveal the mutual feedback between the slopes and engineering infrastructure, evaluate the potential hazards of long-term stability and safety operation of the engineering infrastructure and slopes, and provide data support for the safety range and layout of the proposed permafrost engineering infrastructure.
| CGCS | China Geodetic Coordinate System |
| DSM | Digital surface model |
| GNSS | Global navigation satellite system |
| InSAR | Interferometric synthetic aperture radar |
| KMP | Kunlun Mountain Pass |
| MAAT | Mean annual air temperature |
| MAGST | Mean annual ground surface temperature |
| MAGT | Mean annual ground temperature |
| NGCN | National Geodetic Control Network |
| NMIC | National Meteorological Information Center |
| QTEC | Qinghai–Tibet Engineering Corridor |
| QTH | Qinghai–Tibet Highway |
| QTP | Qinghai–Tibet Plateau |
| QTR | Qinghai–Tibet Railway |
| RTK | Real-time kinematic |
| TDR | Time domain reflectometry |
| TIR | Thermal infrared |
| TLS | Terrestrial laser scanning |
| TTOP | Temperature at the top of the permafrost |
| UAV | Unmanned aerial vehicle |
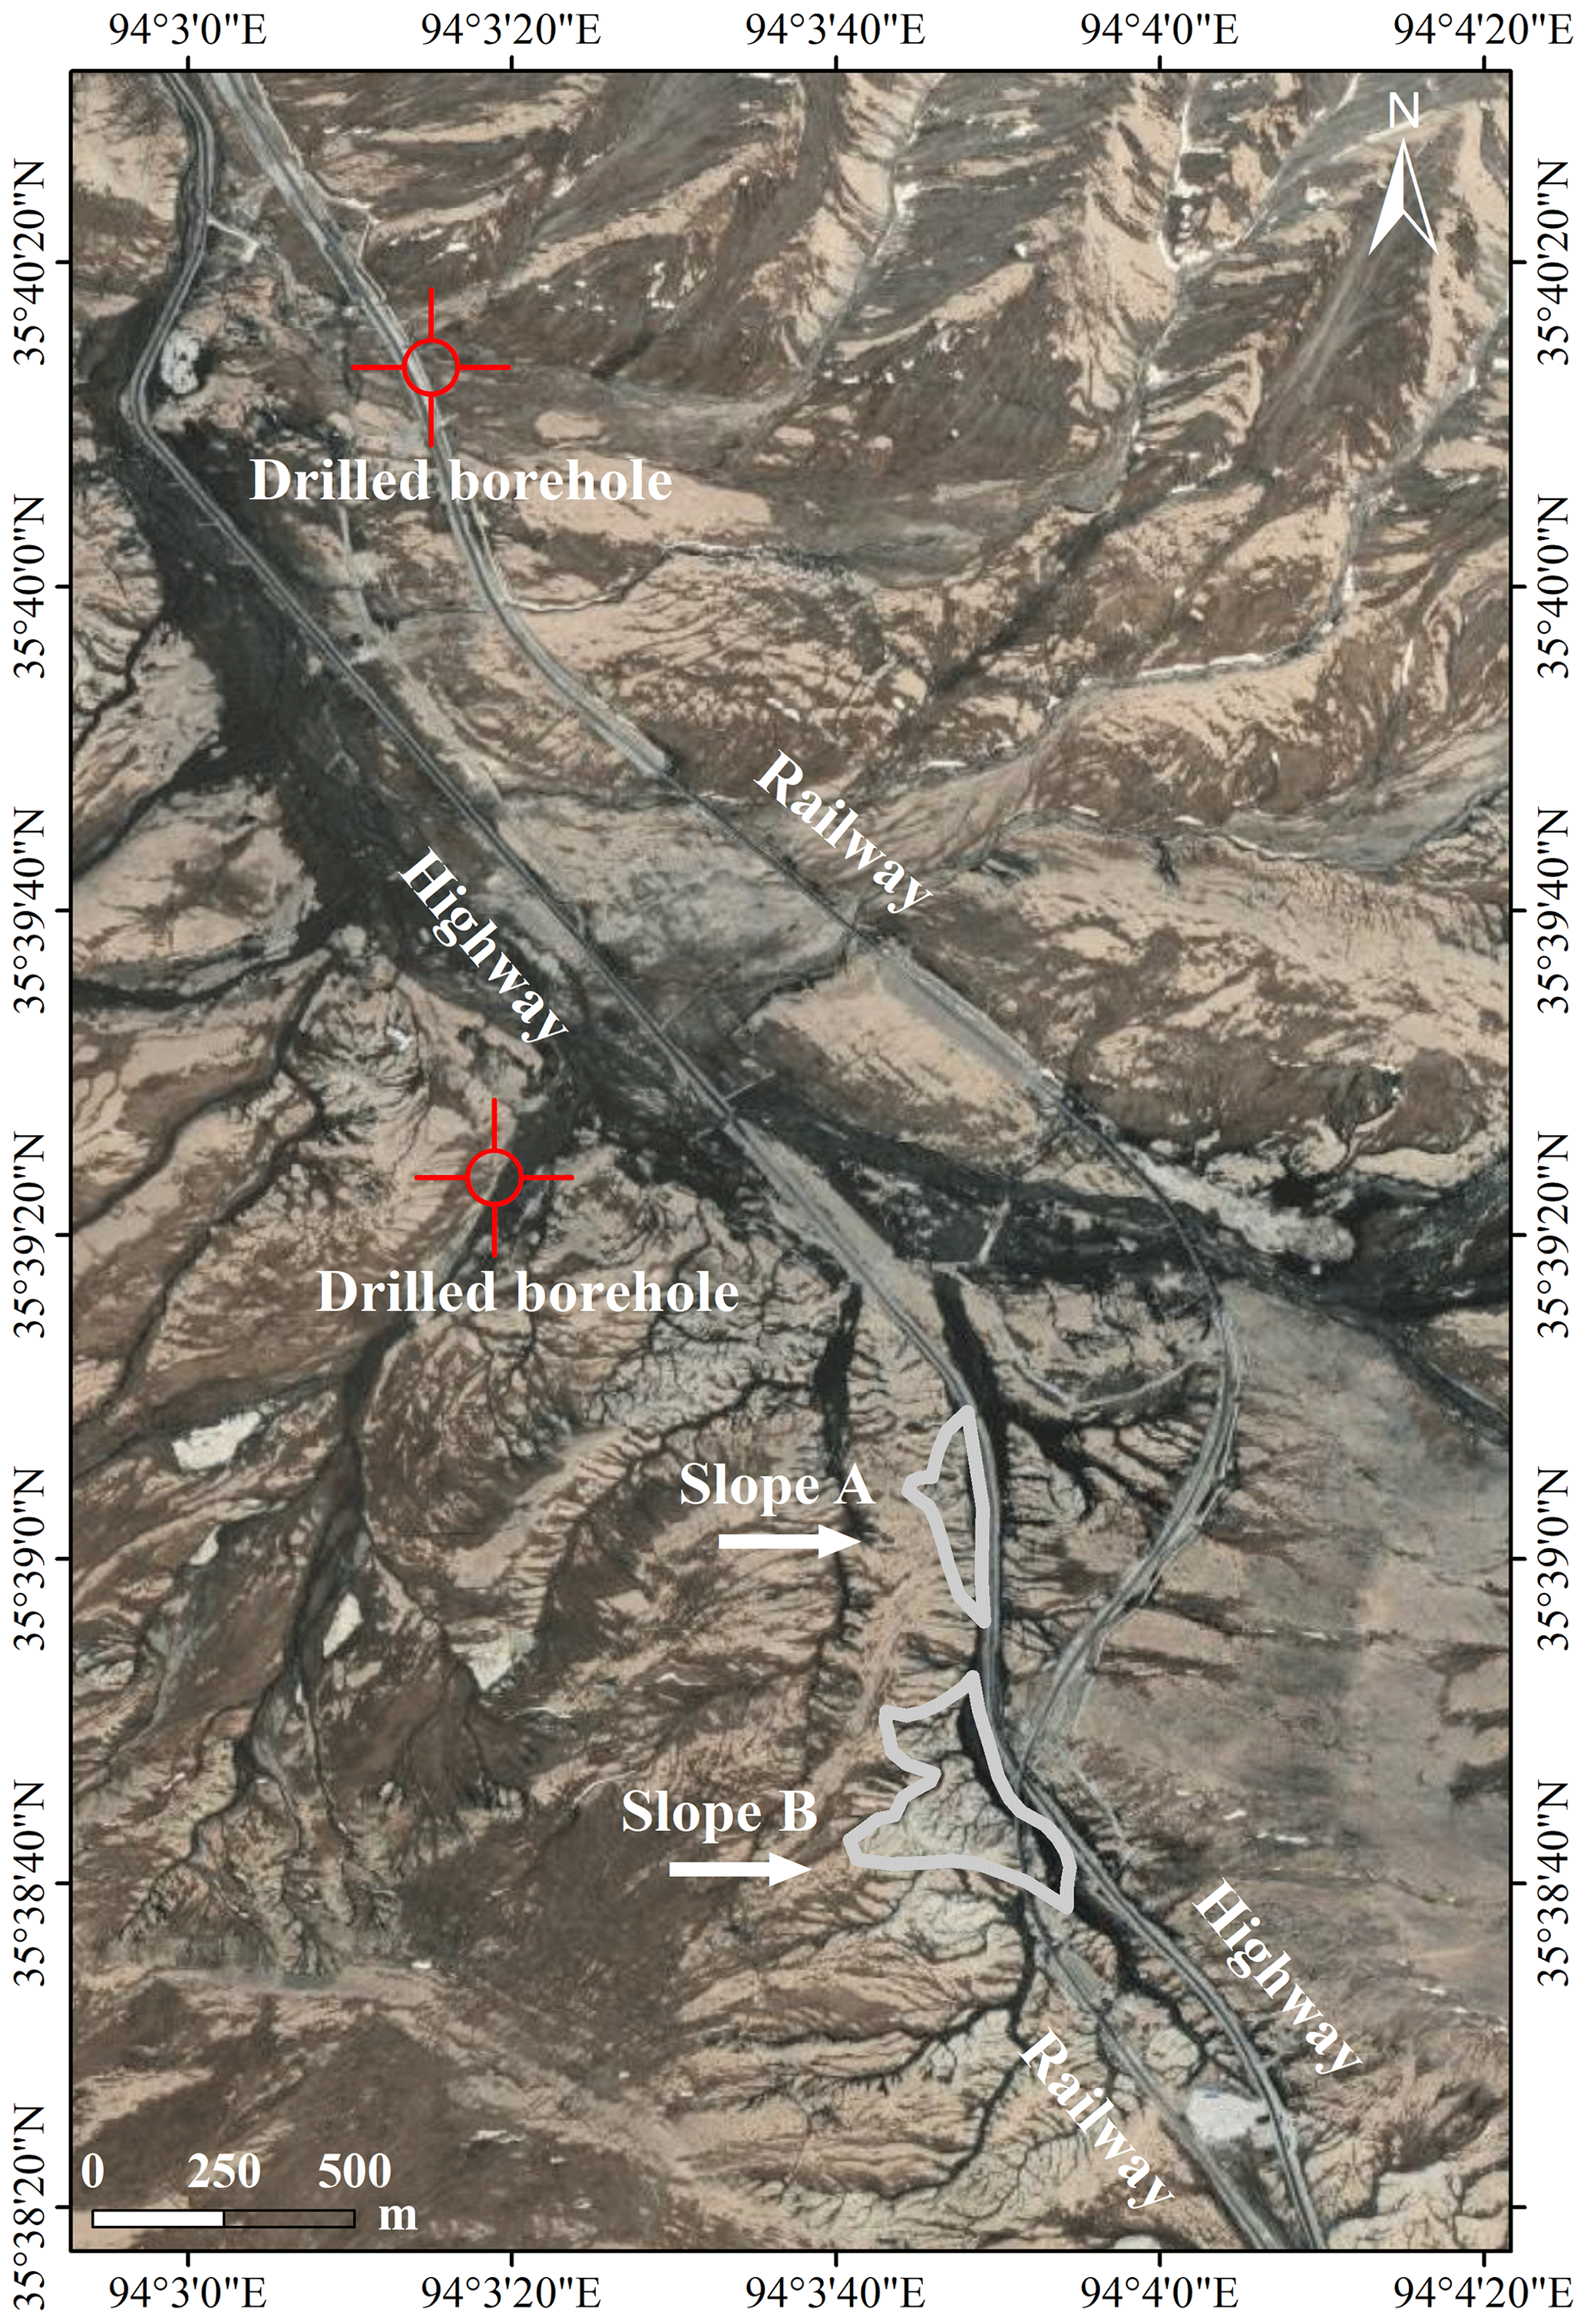
Figure B1The location of two drilled boreholes.
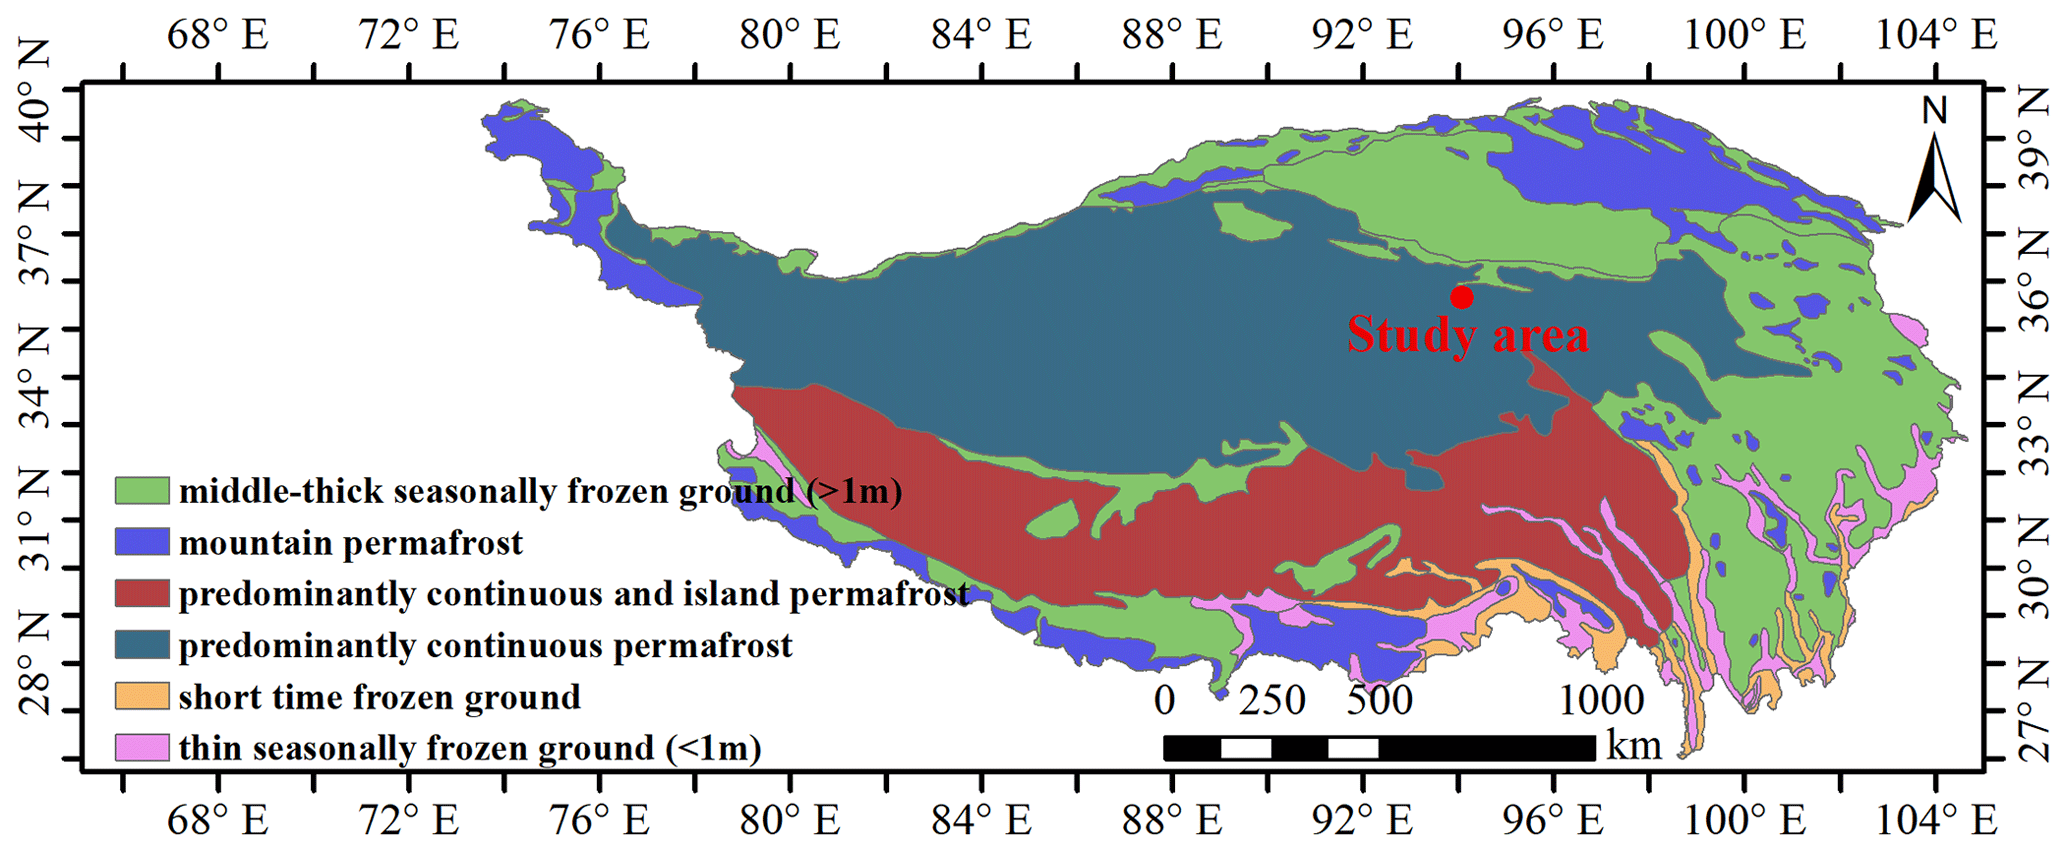
Figure C1The frozen soil distribution in the study area.
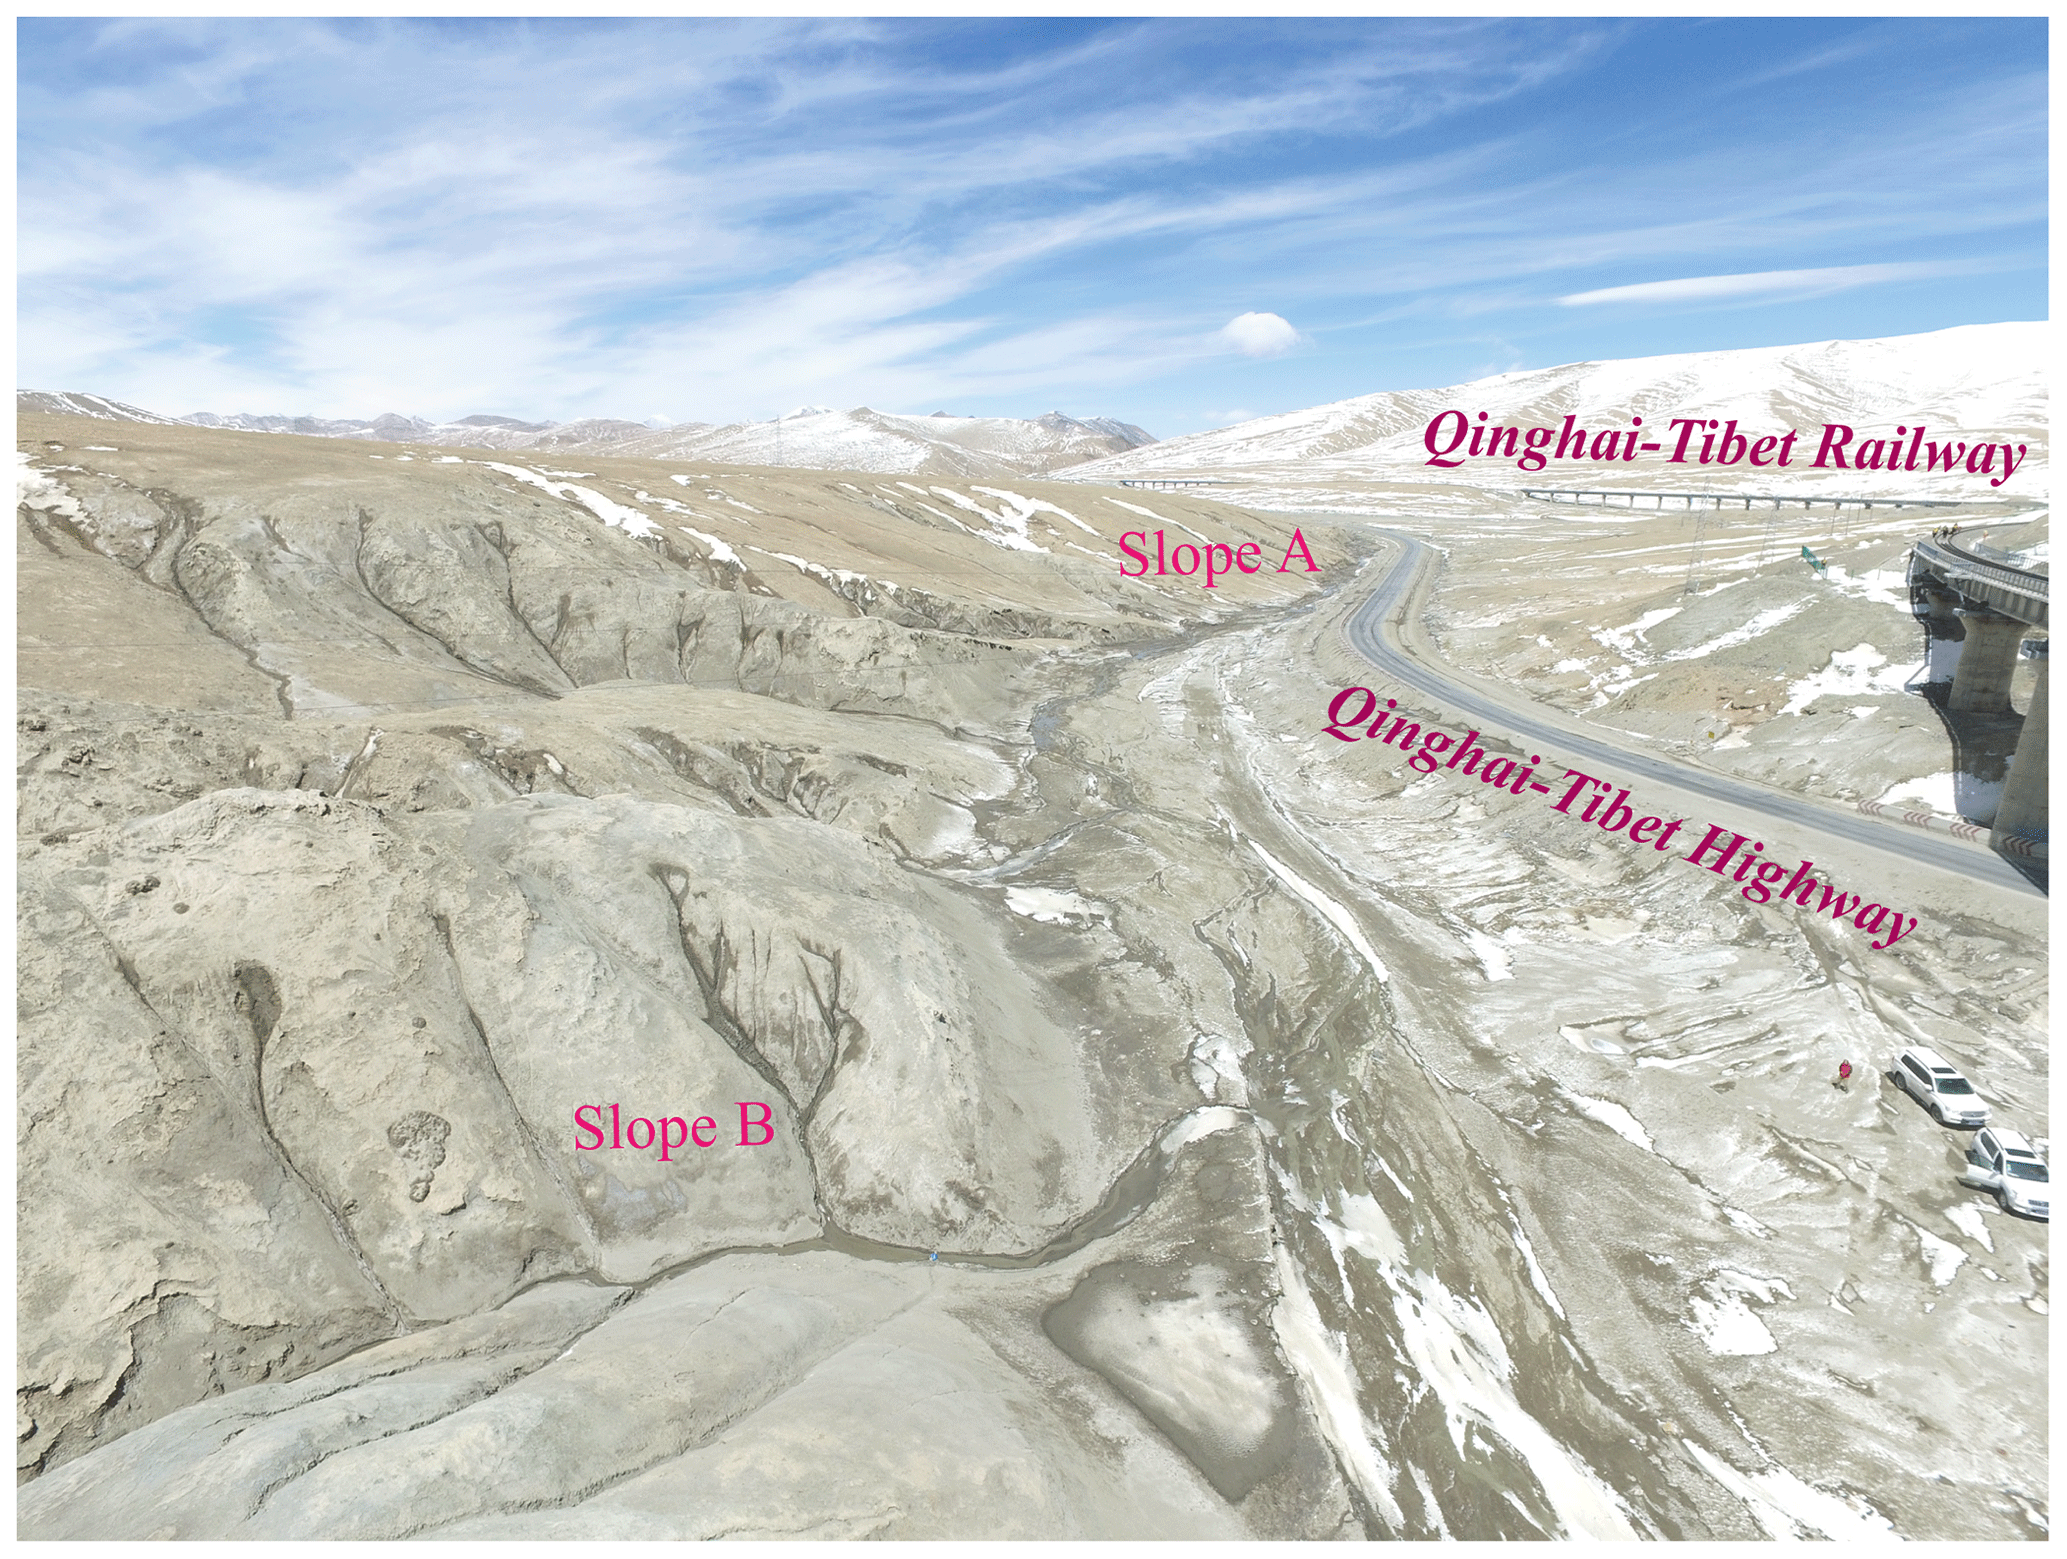
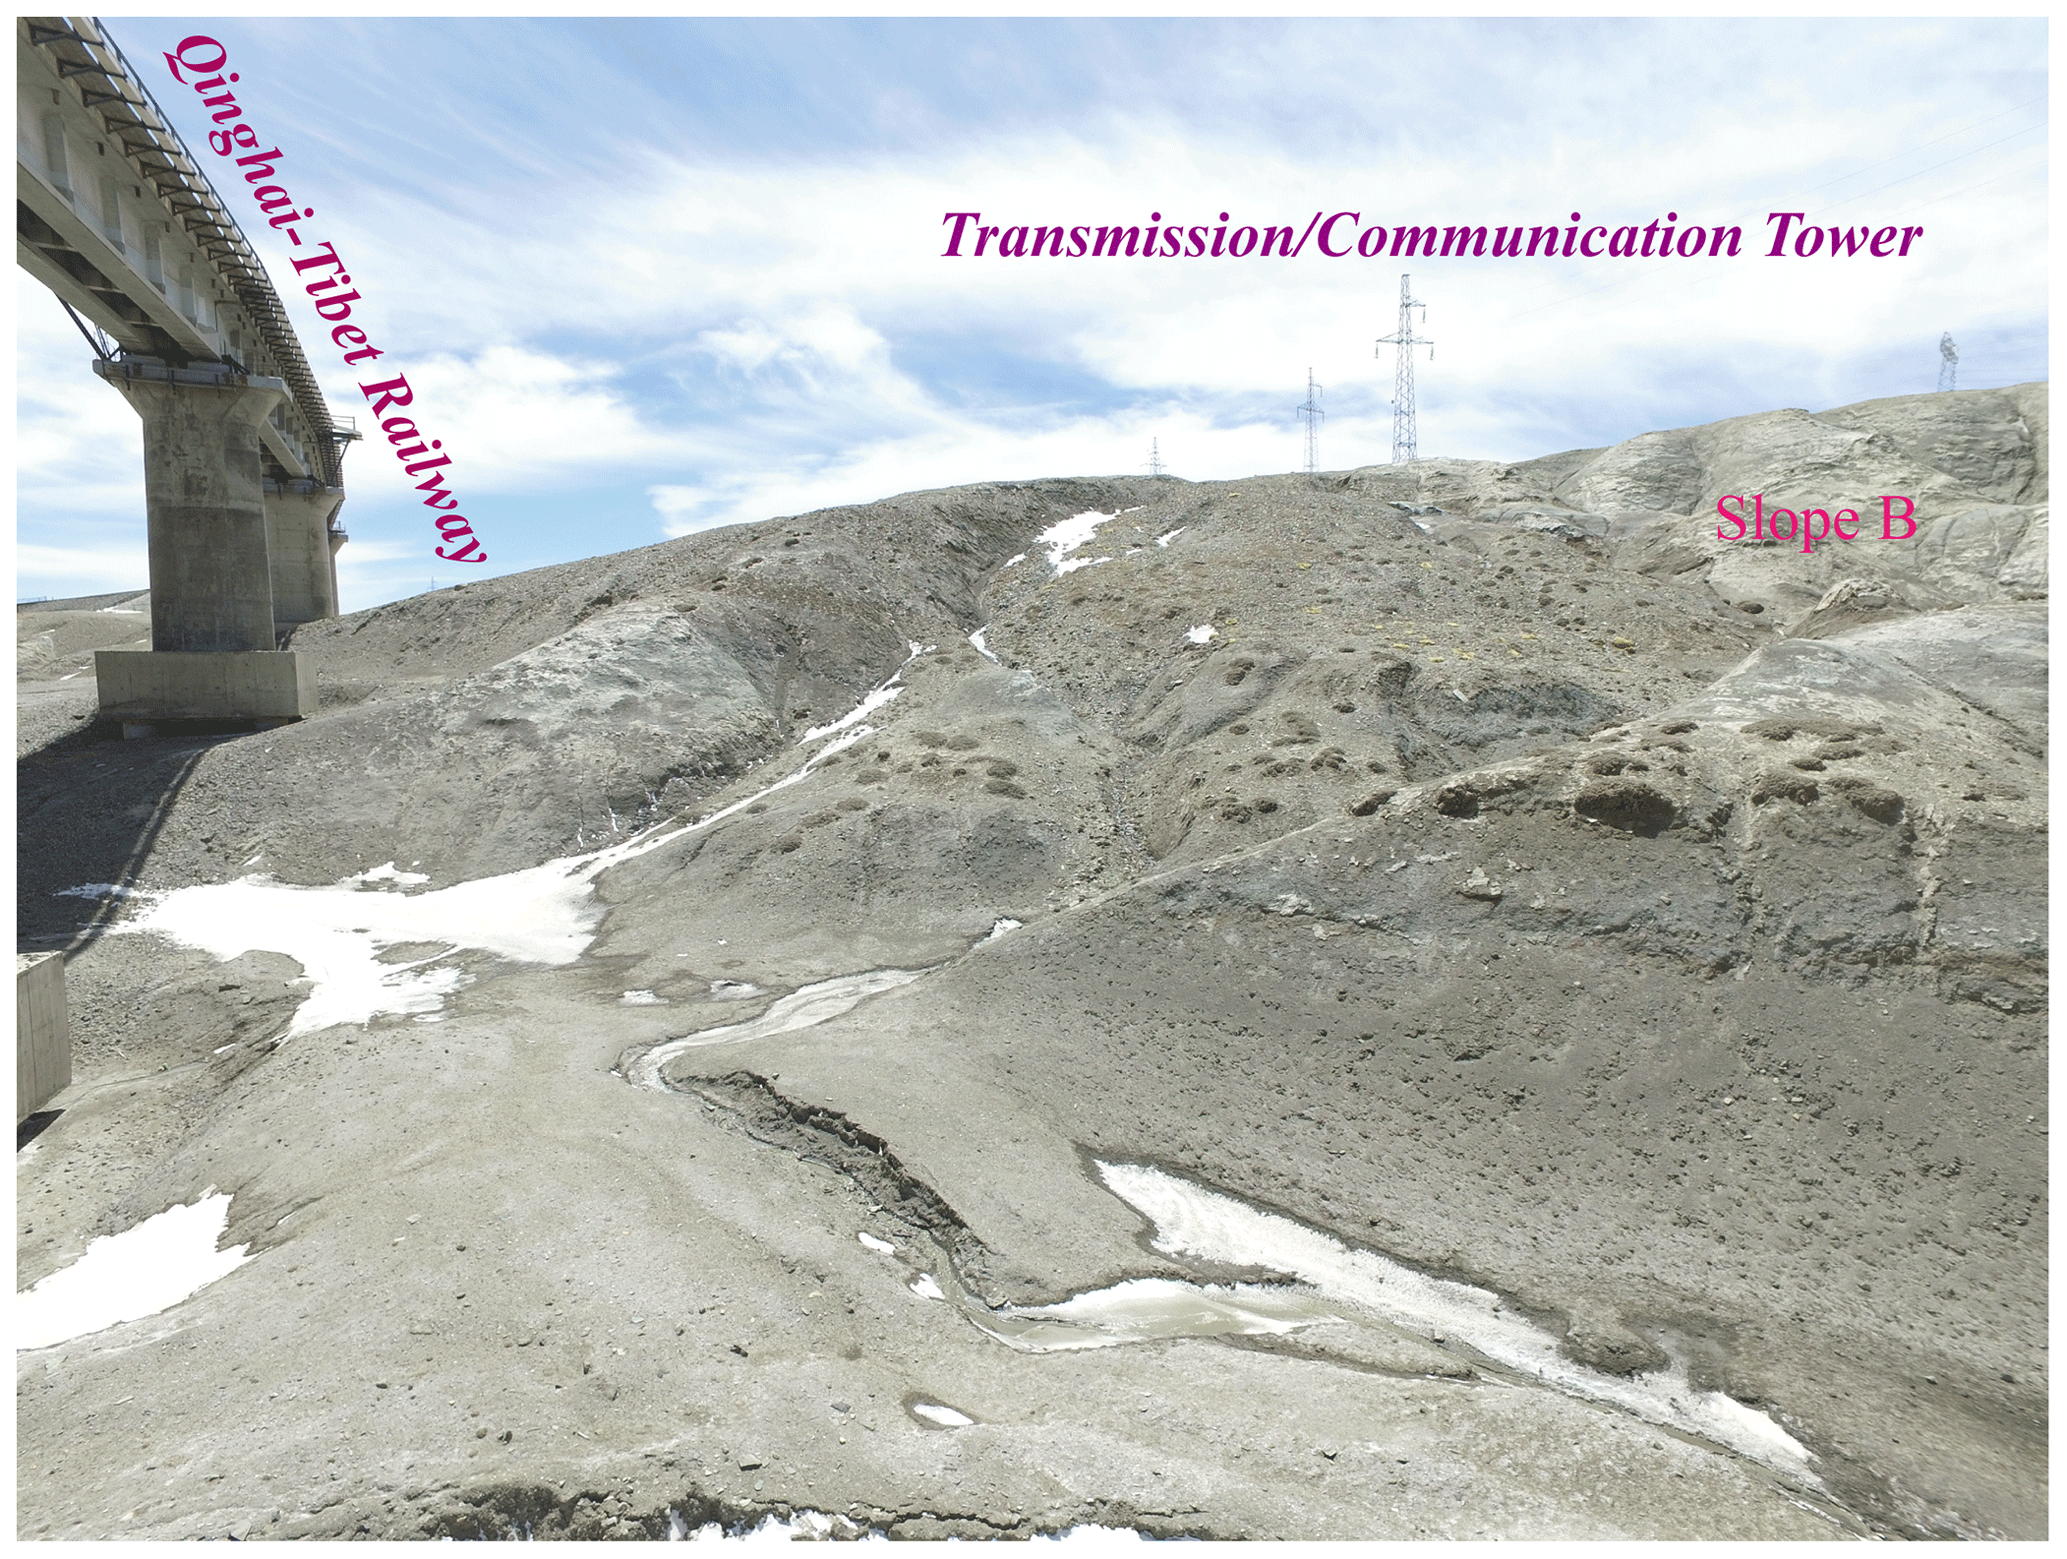

Table F1Overview of the meteorological and ground observation data. The suffixes _MIN, _MAX, _AVG, and _QC indicate the minimum, maximum, average value, and quality control code of the variable, respectively, while 32766, NA, and NAN indicate null values. The suffix of TotalPrecip with “20_8”, “8_20”, and “20_20” are the total precipitation from 20:00 to 08:00 UTC/GMT+8 the next day, 08:00 to 20:00, and 20:00 to 20:00 the next day, respectively. The suffixes of evaporation with “SmallEvaporators” and “LargeEvaporators” are the data monitored by the small and large evaporator, respectively. The suffix GT with a number indicates the ground temperature in centimetres.
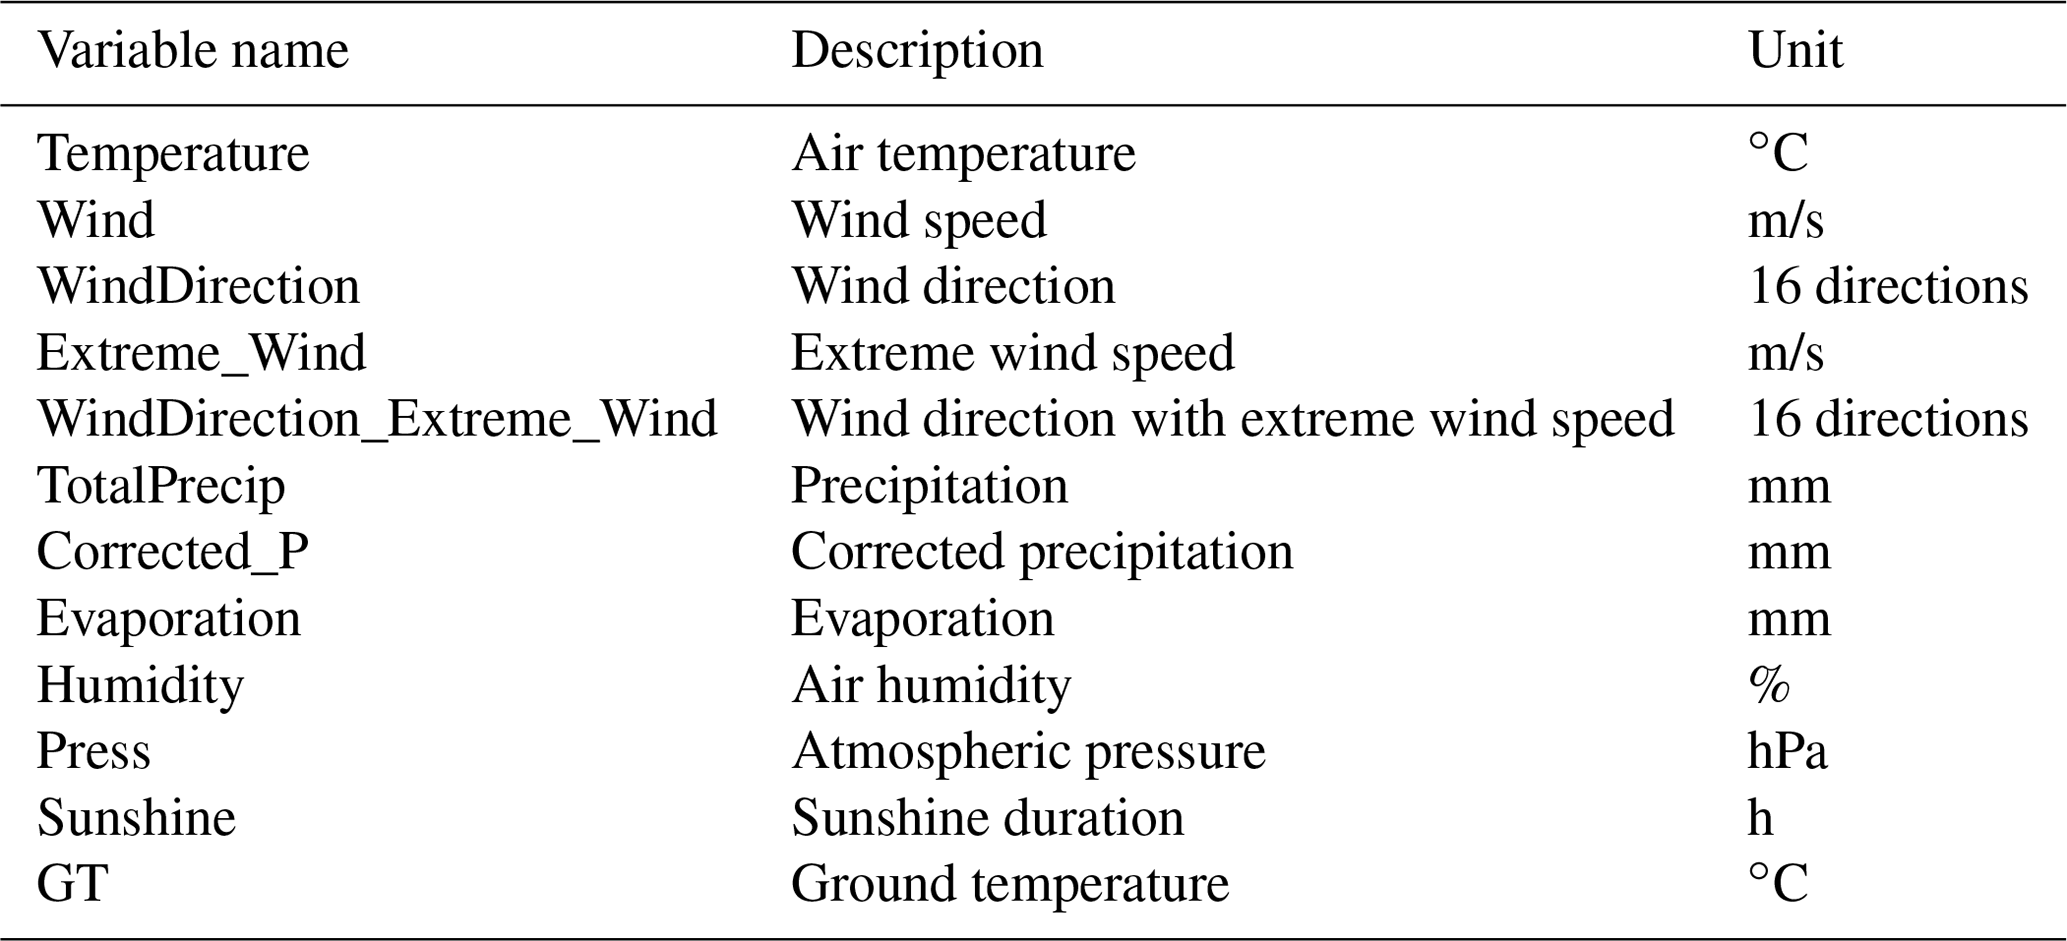
Table G1Physical parameters of the engineering infrastructure near the permafrost slopes. Two types of foundations are applied in the construction of the power and communication towers. a The cone cylinder spread footing. b The drilled shaft.
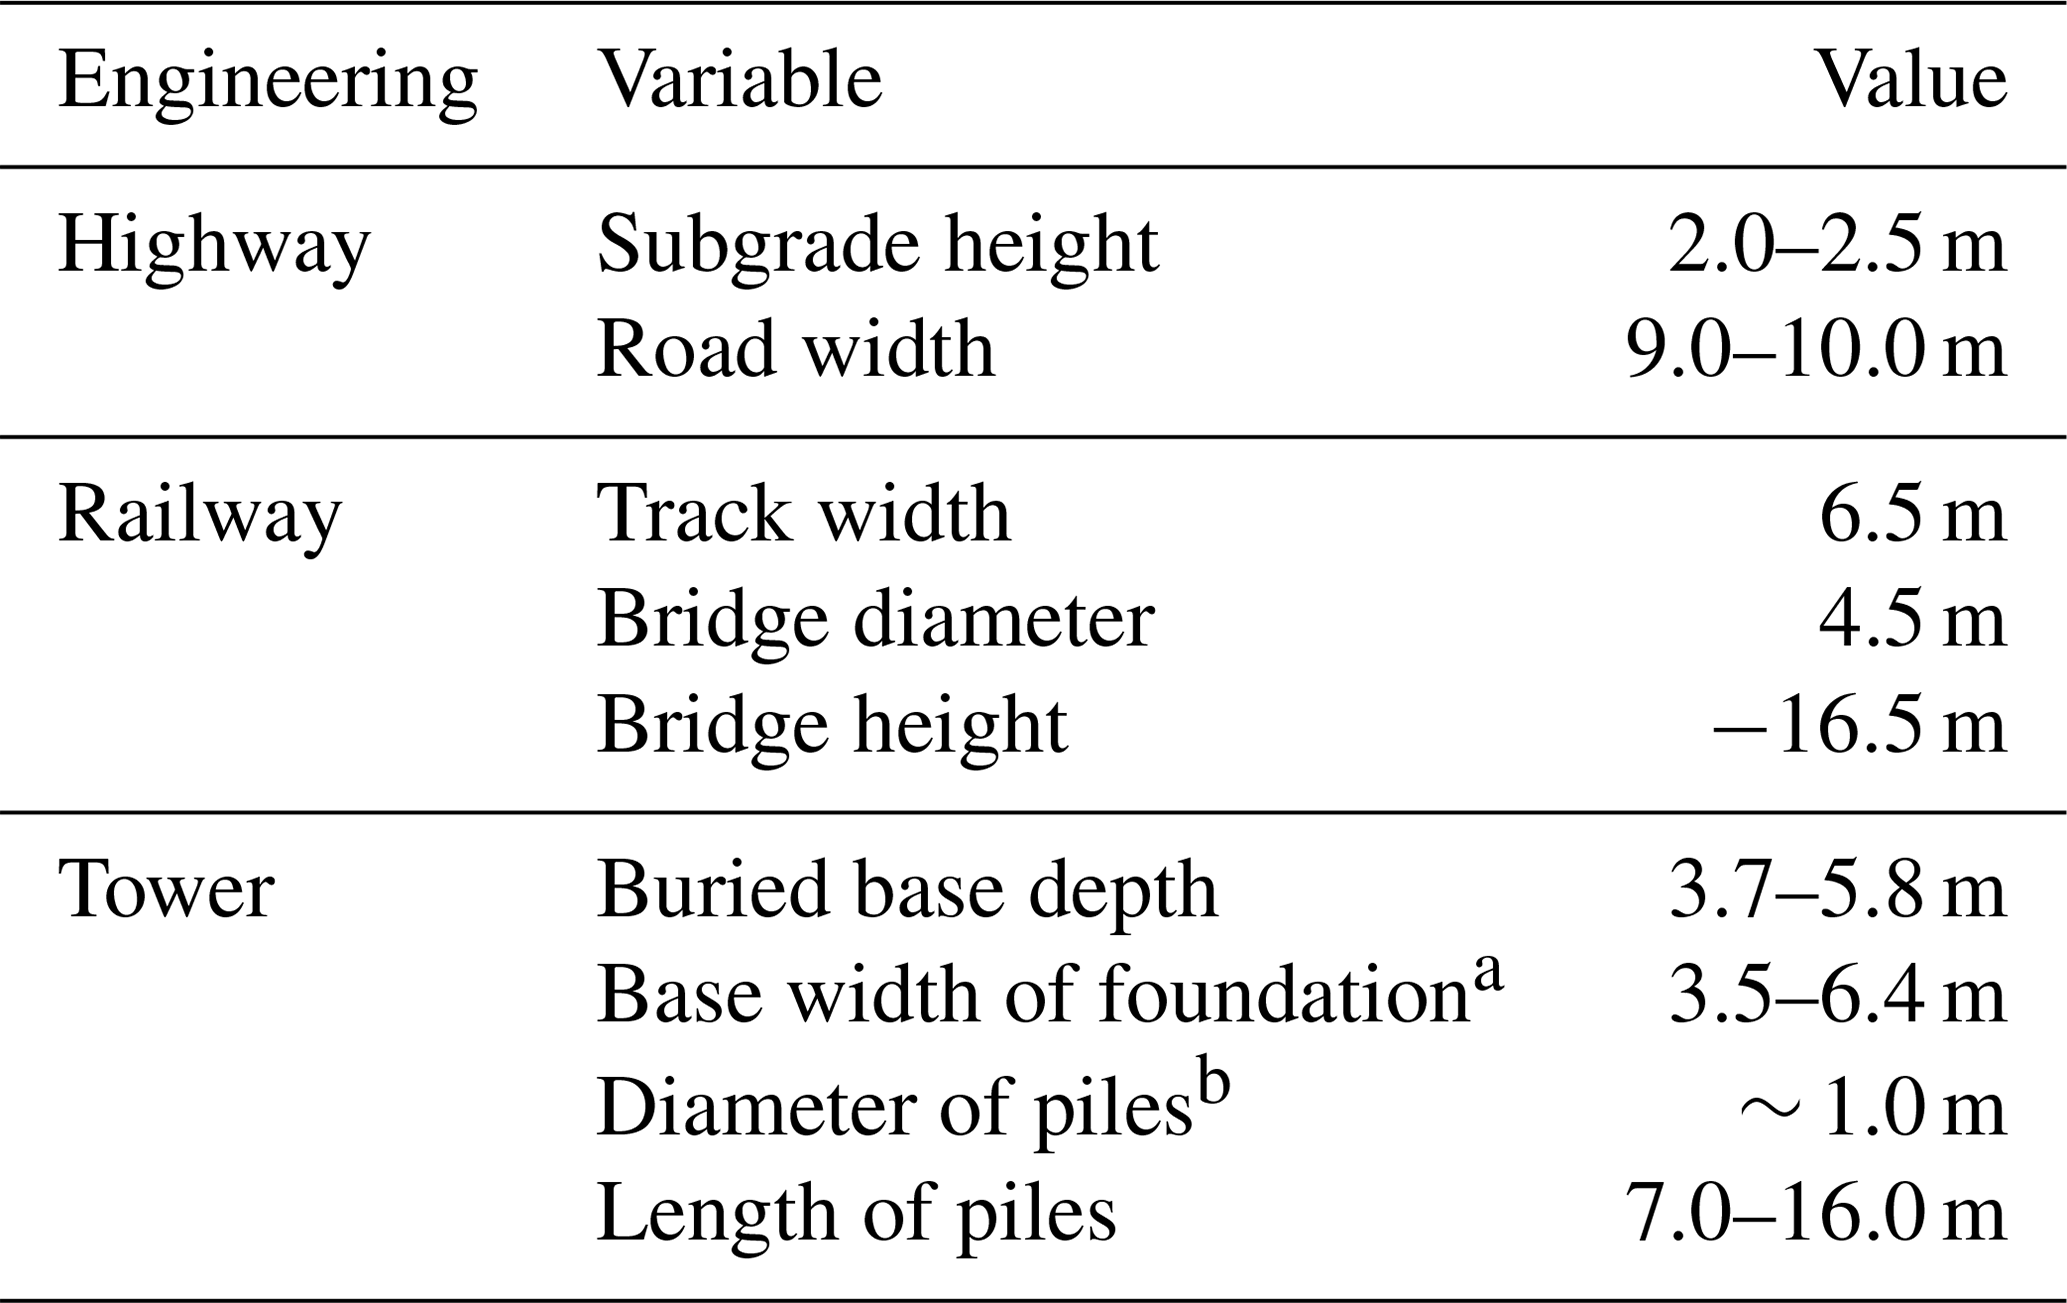
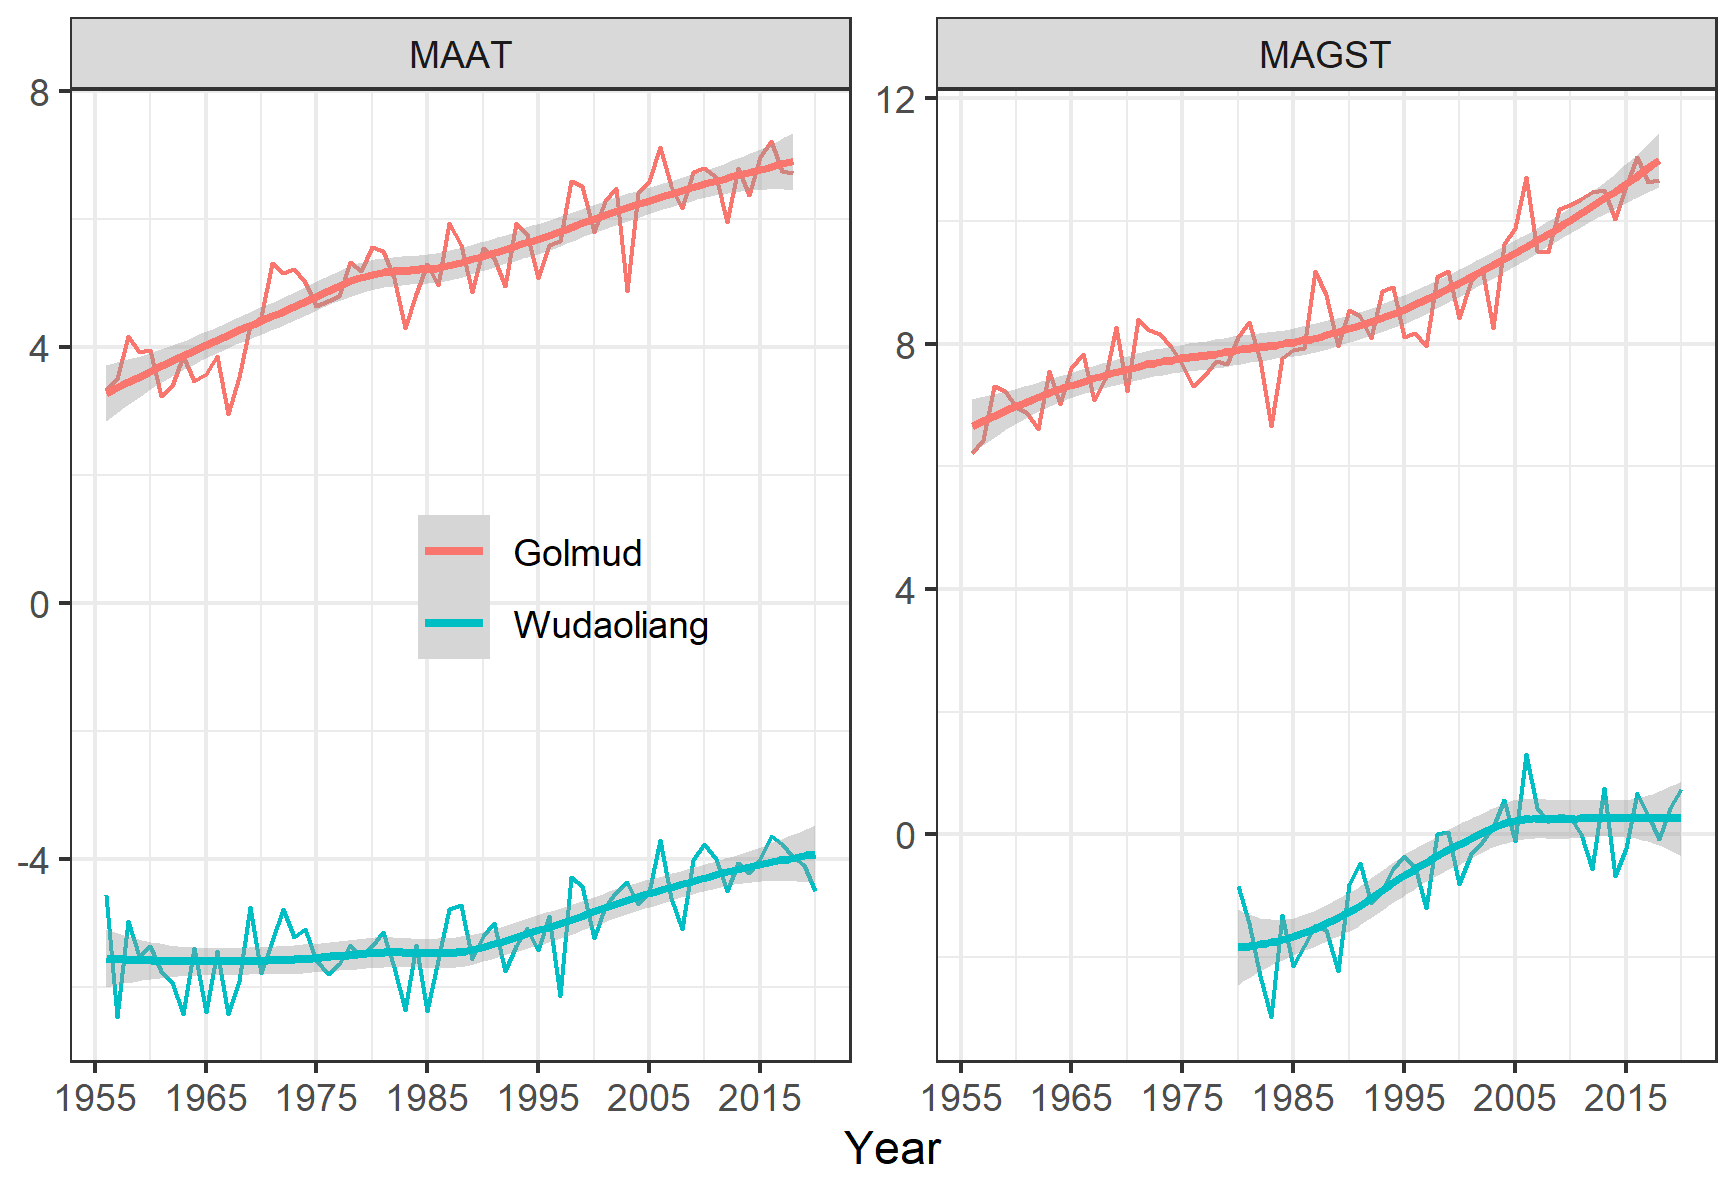
Figure H1Mean annual air temperature (MAAT, ∘) and mean annual ground surface temperature (MAGST, ∘) at the meteorological stations Golmud and Wudaoliang.
The supplement related to this article is available online at: https://doi.org/10.5194/essd-13-4035-2021-supplement.
LL, YZ, YS, and LW initiated and set up the ground observation, TLS, GNSS, and UAV field experiments. LL, YZ, and ZZ compiled the database, performed the analysis, generated the figures, and wrote the paper. All authors contributed to the database compilation and assisted in writing the paper.
The authors declare that they have no conflict of interest.
Publisher's note: Copernicus Publications remains neutral with regard to jurisdictional claims in published maps and institutional affiliations.
The authors acknowledge the Hoh Xil National Nature Reserve for their support and permission to undertake this project. Reviews from Jan Beutel and an anonymous referee provided valuable comments that helped to improve the paper substantially. We thank the handling editor Kirsten Elger for constructive feedback and suggestions.
This research has been supported by the National Natural Science Foundation of China (grant no. 41871065), the National Science Fund for Distinguished Young Scholars (grant no. 41825015), the Key Research Project of Frontier Science of Chinese Academy of Sciences (grant no. QYZDJ-SSW-DQC040), the Strategic Priority Research Program of the Chinese Academy of Sciences (grant no. XDA19090122), and the CAS “Light of West China” Program.
This paper was edited by Kirsten Elger and reviewed by Jan Beutel and one anonymous referee.
Arenson, L. U., Kääb, A., and O'Sullivan, A.: Detection and Analysis of Ground Deformation in Permafrost Environments, Permafrost Periglac., 27, 339–351, https://doi.org/10.1002/ppp.1932, 2016.
Bessette-Kirton, E. K. and Coe, J. A.: A 36-Year Record of Rock Avalanches in the Saint Elias Mountains of Alaska, With Implications for Future Hazards, Front. Earth Sc., 8, https://doi.org/10.3389/feart.2020.00293, 2020.
Boike, J., Nitzbon, J., Anders, K., Grigoriev, M., Bolshiyanov, D., Langer, M., Lange, S., Bornemann, N., Morgenstern, A., Schreiber, P., Wille, C., Chadburn, S., Gouttevin, I., Burke, E., and Kutzbach, L.: A 16-year record (2002–2017) of permafrost, active-layer, and meteorological conditions at the Samoylov Island Arctic permafrost research site, Lena River delta, northern Siberia: an opportunity to validate remote-sensing data and land surface, snow, and permafrost models, Earth Syst. Sci. Data, 11, 261–299, https://doi.org/10.5194/essd-11-261-2019, 2019.
Chang, J., Wang, G., Li, C., and Mao, T.: Seasonal dynamics of suprapermafrost groundwater and its response to the freeing-thawing processes of soil in the permafrost region of Qinghai-Tibet Plateau, Sci. China Earth Sci., 58, 727–738, https://doi.org/10.1007/s11430-014-5009-y, 2015.
Gruber, S. and Haeberli, W.: Permafrost in steep bedrock slopes and its temperature-related destabilization following climate change, J. Geophys. Res., 112, F02S18, https://doi.org/10.1029/2006jf000547, 2007.
Guo, D., and Sun, J.: Permafrost Thaw and Associated Settlement Hazard Onset Timing over the Qinghai-Tibet Engineering Corridor, Int. J. Disast. Risk Sc., 6, 347–358, https://doi.org/10.1007/s13753-015-0072-3, 2015.
Huggel, C., Salzmann, N., Allen, S., Caplan-Auerbach, J., Fischer, L., Haeberli, W., Larsen, C., Schneider, D., and Wessels, R.: Recent and future warm extreme events and high-mountain slope stability, Philos. T. Roy. Soc. A, 368, 2435–2459, https://doi.org/10.1098/rsta.2010.0078, 2010.
Jin, H.-J., Yu, Q.-H., Wang, S.-L., and Lü, L.-Z.: Changes in permafrost environments along the Qinghai–Tibet engineering corridor induced by anthropogenic activities and climate warming, Cold Reg. Sci. Technol., 53, 317–333, https://doi.org/10.1016/j.coldregions.2007.07.005, 2008.
Léger, E., Dafflon, B., Robert, Y., Ulrich, C., Peterson, J. E., Biraud, S. C., Romanovsky, V. E., and Hubbard, S. S.: A distributed temperature profiling method for assessing spatial variability in ground temperatures in a discontinuous permafrost region of Alaska, The Cryosphere, 13, 2853–2867, https://doi.org/10.5194/tc-13-2853-2019, 2019.
Liu, G., Xie, C., Zhao, L., Xiao, Y., Wu, T., Wang, W., and Liu, W.: Permafrost warming near the northern limit of permafrost on the Qinghai–Tibetan Plateau during the period from 2005 to 2017: A case study in the Xidatan area, Permafrost Periglac., 32, 323–334, https://doi.org/10.1002/ppp.2089, 2020.
Luo, L., Ma, W., Zhang, Z., Zhuang, Y., Zhang, Y., Yang, J., Cao, X., Liang, S., and Mu, Y.: Freeze/Thaw-Induced Deformation Monitoring and Assessment of the Slope in Permafrost Based on Terrestrial Laser Scanner and GNSS, Remote Sens.-Basel, 9, 198, https://doi.org/10.3390/rs9030198, 2017.
Luo, L., Ma, W., Zhao, W., Zhuang, Y., Zhang, Z., Zhang, M., Ma, D., and Zhou, Q.: UAV-based spatiotemporal thermal patterns of permafrost slopes along the Qinghai–Tibet Engineering Corridor, Landslides, 15, 2161–2172, https://doi.org/10.1007/s10346-018-1028-7, 2018a.
Luo, L., Ma, W., Zhuang, Y., Zhang, Y., Yi, S., Xu, J., Long, Y., Ma, D., and Zhang, Z.: The impacts of climate change and human activities on alpine vegetation and permafrost in the Qinghai-Tibet Engineering Corridor, Ecol. Indic., 93, 24–35, https://doi.org/10.1016/j.ecolind.2018.04.067, 2018b.
Luo, L., Zhang, Z., Ma, W., Yi, S., and Zhuang, Y.: PIC v1.3: comprehensive R package for computing permafrost indices with daily weather observations and atmospheric forcing over the Qinghai–Tibet Plateau, Geosci. Model Dev., 11, 2475–2491, https://doi.org/10.5194/gmd-11-2475-2018, 2018c.
Luo, L., Ma, W., Zhang, Z., Zhuang, Y., Yang, J., Cao, X., Liang, S., and Yi, S.: Integration of terrestrial laser scanning and soil sensors for deformation and hydrothermal monitoring of frost mounds, Measurement, 131, 513–523, https://doi.org/10.1016/j.measurement.2018.09.020, 2019.
Luo, L., Zhuang, Y., Zhang, M., Zhang, Z., Ma, W., Zhao, W., Zhao, L., Wang, L., Shi, Y., Zhang, Z., Duan, Q., Tian, D., and Zhou, Q.: TLS measurements in the Qinghai-Tibet Engineering Corridor, Zenodo [data set], https://doi.org/10.5281/zenodo.5009558, 2020a.
Luo, L., Zhuang, Y., Zhang, M., Zhang, Z., Ma, W., Zhao, W., Zhao, L., Wang, L., Shi, Y., Zhang, Z., Duan, Q., Tian, D., and Zhou, Q.: UAV RGB and TIR images in the Qinghai-Tibet Engineering Corridor, Zenodo [data set], https://doi.org/10.5281/zenodo.5016192, 2020b.
Luo, L., Zhuang, Y., Zhang, M., Zhang, Z., Ma, W., Zhao, W., Zhao, L., Wang, L., Shi, Y., Zhang, Z., Duan, Q., Tian, D., and Zhou, Q.: R code of permafrost indices in the Qinghai-Tibet Engineering Corridor, Zenodo [code], https://doi.org/10.5281/zenodo.5002981, 2020c.
Luo, L., Zhuang, Y., Zhang, M., Zhang, Z., Ma, W., Zhao, W., Zhao, L., Wang, L., Shi, Y., Zhang, Z., Duan, Q., Tian, D., and Zhou, Q.: Meteorological and ground observations in the Qinghai-Tibet Engineering Corridor, Zenodo [data set], https://doi.org/10.5281/zenodo.5009871, 2020d.
Ma, W., Niu, F., Akagawa, S., and Jin, D.: Slope instability phenomena in permafrost regions of Qinghai-Tibet Plateau, China, Landslides, 3, 260–264, https://doi.org/10.1007/s10346-006-0045-0, 2006.
Ma, W., Mu, Y., Xie, S., Mao, Y., and Chen, D.: Thermal-mechanical Influences and Environmental Effects of Expressway Construction on the Qinghai-Tibet Permafrost Engineering Corridor, Adv. Earth Sci., 32, 459–464, https://doi.org/10.11867/j.issn.1001-8166.2017.05.0459, 2017.
Ma, W., Mu, Y., Zhang, J., Yu, W., Zhou, Z., and Chen, T.: Lateral thermal influences of roadway and railway embankments in permafrost zones along the Qinghai-Tibet Engineering Corridor, Transportation Geotechnics, 21, 100285, https://doi.org/10.1016/j.trgeo.2019.100285, 2019.
Mu, Y., Ma, W., Li, G., Niu, F., Liu, Y., and Mao, Y.: Impacts of supra-permafrost water ponding and drainage on a railway embankment in continuous permafrost zone, the interior of the Qinghai-Tibet Plateau, Cold Reg. Sci. Technol., 154, 23–31, https://doi.org/10.1016/j.coldregions.2018.06.007, 2018.
Niu, F., Luo, J., Lin, Z., Fang, J., and Liu, M.: Thaw-induced slope failures and stability analyses in permafrost regions of the Qinghai-Tibet Plateau, China, Landslides, 13, 55–65, https://doi.org/10.1007/s10346-014-0545-2, 2015.
Obu, J., Westermann, S., Bartsch, A., Berdnikov, N., Christiansen, H. H., Dashtseren, A., Delaloye, R., Elberling, B., Etzelmüller, B., Kholodov, A., Khomutov, A., Kääb, A., Leibman, M. O., Lewkowicz, A. G., Panda, S. K., Romanovsky, V., Way, R. G., Westergaard-Nielsen, A., Wu, T., Yamkhin, J., and Zou, D.: Northern Hemisphere permafrost map based on TTOP modelling for 2000–2016 at 1 km2 scale, Earth-Sci. Rev., 193, 299–316, https://doi.org/10.1016/j.earscirev.2019.04.023, 2019.
Patton, A. I., Rathburn, S. L., and Capps, D. M.: Landslide response to climate change in permafrost regions, Geomorphology, 340, 116–128, https://doi.org/10.1016/j.geomorph.2019.04.029, 2019.
Sluijs, J., Kokelj, S., Fraser, R., Tunnicliffe, J., and Lacelle, D.: Permafrost Terrain Dynamics and Infrastructure Impacts Revealed by UAV Photogrammetry and Thermal Imaging, Remote Sens.-Basel, 10, 1734, https://doi.org/10.3390/rs10111734, 2018.
Streletskiy, D. A., Suter, L. J., Shiklomanov, N. I., Porfiriev, B. N., and Eliseev, D. O.: Assessment of climate change impacts on buildings, structures and infrastructure in the Russian regions on permafrost, Environ Res Lett, 14, 025003, https://doi.org/10.1088/1748-9326/aaf5e6, 2019.
Wang, K., Jafarov, E., Overeem, I., Romanovsky, V., Schaefer, K., Clow, G., Urban, F., Cable, W., Piper, M., Schwalm, C., Zhang, T., Kholodov, A., Sousanes, P., Loso, M., and Hill, K.: A synthesis dataset of permafrost-affected soil thermal conditions for Alaska, USA, Earth Syst. Sci. Data, 10, 2311–2328, https://doi.org/10.5194/essd-10-2311-2018, 2018.
Wang, S., Niu, F., Chen, J., and Dong, Y.: Permafrost research in China related to express highway construction, Permafrost Periglac., 31, 406–416, https://doi.org/10.1002/ppp.2053, 2020.
Weber, S., Beutel, J., Da Forno, R., Geiger, A., Gruber, S., Gsell, T., Hasler, A., Keller, M., Lim, R., Limpach, P., Meyer, M., Talzi, I., Thiele, L., Tschudin, C., Vieli, A., Vonder Mühll, D., and Yücel, M.: A decade of detailed observations (2008–2018) in steep bedrock permafrost at the Matterhorn Hörnligrat (Zermatt, CH), Earth Syst. Sci. Data, 11, 1203–1237, https://doi.org/10.5194/essd-11-1203-2019, 2019.
Wicky, J. and Hauck, C.: Numerical modelling of convective heat transport by air flow in permafrost talus slopes, The Cryosphere, 11, 1311–1325, https://doi.org/10.5194/tc-11-1311-2017, 2017.
Wirz, V., Geertsema, M., Gruber, S., and Purves, R. S.: Temporal variability of diverse mountain permafrost slope movements derived from multi-year daily GPS data, Mattertal, Switzerland, Landslides, 13, 67–83, https://doi.org/10.1007/s10346-014-0544-3, 2015.
Wu, Q. and Zhang, T.: Recent permafrost warming on the Qinghai-Tibetan Plateau, J. Geophys. Res., 113, D13108, https://doi.org/10.1029/2007jd009539, 2008.
Wu, Q., Liu, Y., Zhang, J., and Tong, C.: A review of recent frozen soil engineering in permafrost regions along Qinghai-Tibet Highway, China, Permafrost Periglac., 13, 199–205, https://doi.org/10.1002/ppp.420, 2002.
Wu, Q., Dong, X., Liu, Y., and Jin, H.: Responses of Permafrost on the Qinghai-Tibet Plateau, China, to Climate Change and Engineering Construction, Arct. Antarct. Alp. Res., 39, 682–687, https://doi.org/10.1657/1523-0430(07-508)[wu]2.0.Co;2, 2007.
Wu, Y., Yang, Q., Jiang, G., and Zhang, P.: Stable Isotopic Stratification and Growth Patterns of Ground Ice in Permafrost on the Qinghai-Tibet Plateau, China, Permafrost Periglac., 28, 119–129, https://doi.org/10.1002/ppp.1892, 2017.
Yang, Y., Wu, Q., Jiang, G., and Zhang, P.: Stable Isotopic Stratification and Growth Patterns of Ground Ice in Permafrost on the Qinghai-Tibet Plateau, China, Permafrost Periglac., 28, 119–129, https://doi.org/10.1002/ppp.1892, 2017.
Yu, W., Zhang, T., Lu, Y., Han, F., Zhou, Y., and Hu, D.: Engineering risk analysis in cold regions: State of the art and perspectives, Cold Reg. Sci. Technol., 171, 102963, https://doi.org/10.1016/j.coldregions.2019.102963, 2020.
Yuan, C., Yu, Q., You, Y., and Guo, L.: Deformation mechanism of an expressway embankment in warm and high ice content permafrost regions, Appl. Therm. Eng., 121, 1032–1039, https://doi.org/10.1016/j.applthermaleng.2017.04.128, 2017.
Zhang, M., Pei, W., Zhang, X., and Lu, J.: Lateral thermal disturbance of embankments in the permafrost regions of the Qinghai-Tibet Engineering Corridor, Nat. Hazards, 78, 2121–2142, https://doi.org/10.1007/s11069-015-1823-6, 2015.
Zhang, T., Barry, R. G., Knowles, K., Heginbottom, J. A., and Brown, J.: Statistics and characteristics of permafrost and ground-ice distribution in the Northern Hemisphere1, Polar Geography, 23, 132–154, https://doi.org/10.1080/10889379909377670, 1999.
Zhang, Z., Yu, Q., You, Y., Guo, L., Wang, X., Liu, G., and Wu, G.: Cooling effect analysis of temperature-controlled ventilated embankment in Qinghai-Tibet testing expressway, Cold Reg. Sci. Technol., 173, https://doi.org/10.1016/j.coldregions.2020.103012, 2020.
Zhao, L.: Meteorological Datasets of Xidatan station (XDT) on the Tibetan Plateau in 2014–2018, National Tibetan Plateau Data Center [data set], https://doi.org/10.11888/Meteoro.tpdc.270084, 2018.
Zhao, L., Zou, D., Hu, G., Du, E., Pang, Q., Xiao, Y., Li, R., Sheng, Y., Wu, X., Sun, Z., Wang, L., Wang, C., Ma, L., Zhou, H., and Liu, S.: Changing climate and the permafrost environment on the Qinghai–Tibet (Xizang) plateau, Permafrost Periglac., 31, 396–405, https://doi.org/10.1002/ppp.2056, 2020.
- Abstract
- Introduction
- Site description
- Data description
- Data quality control
- Code and data availability
- Summary and outlook
- Appendix A: Abbreviations
- Appendix B: Drilling data source
- Appendix C: Classification of frozen soil
- Appendix D: Pictures of the field site and selected instrument details
- Appendix E: Digital surface model of the study area Using RGB images
- Appendix F: Names of the variables and units for the data files
- Appendix G: Physical Parameters of Engineering Infrastructure
- Appendix H: Permafrost Indices From 1955 to 2020
- Author contributions
- Competing interests
- Disclaimer
- Acknowledgements
- Financial support
- Review statement
- References
- Supplement