the Creative Commons Attribution 4.0 License.
the Creative Commons Attribution 4.0 License.
 | 29 Jul 2021
FLUXNET-CH4: a global, multi-ecosystem dataset and analysis of methane seasonality from freshwater wetlands
Sara Helen Knox
Avni Malhotra
Etienne Fluet-Chouinard
Gavin McNicol
Sarah Feron
Zutao Ouyang
Dario Papale
Carlo Trotta
Eleonora Canfora
You-Wei Cheah
Danielle Christianson
Ma. Carmelita R. Alberto
Pavel Alekseychik
Mika Aurela
Dennis Baldocchi
Sheel Bansal
David P. Billesbach
Gil Bohrer
Rosvel Bracho
Nina Buchmann
David I. Campbell
Gerardo Celis
Jiquan Chen
Weinan Chen
Housen Chu
Higo J. Dalmagro
Sigrid Dengel
Ankur R. Desai
Matteo Detto
Han Dolman
Elke Eichelmann
Eugenie Euskirchen
Daniela Famulari
Kathrin Fuchs
Mathias Goeckede
Sébastien Gogo
Mangaliso J. Gondwe
Jordan P. Goodrich
Pia Gottschalk
Scott L. Graham
Martin Heimann
Manuel Helbig
Carole Helfter
Kyle S. Hemes
Takashi Hirano
David Hollinger
Lukas Hörtnagl
Hiroki Iwata
Adrien Jacotot
Gerald Jurasinski
Minseok Kang
Kuno Kasak
John King
Janina Klatt
Franziska Koebsch
Ken W. Krauss
Derrick Y. F. Lai
Annalea Lohila
Ivan Mammarella
Luca Belelli Marchesini
Giovanni Manca
Jaclyn Hatala Matthes
Trofim Maximov
Lutz Merbold
Bhaskar Mitra
Timothy H. Morin
Eiko Nemitz
Mats B. Nilsson
Shuli Niu
Walter C. Oechel
Patricia Y. Oikawa
Keisuke Ono
Matthias Peichl
Olli Peltola
Michele L. Reba
Andrew D. Richardson
William Riley
Benjamin R. K. Runkle
Youngryel Ryu
Torsten Sachs
Ayaka Sakabe
Camilo Rey Sanchez
Edward A. Schuur
Karina V. R. Schäfer
Oliver Sonnentag
Jed P. Sparks
Ellen Stuart-Haëntjens
Cove Sturtevant
Ryan C. Sullivan
Daphne J. Szutu
Jonathan E. Thom
Margaret S. Torn
Eeva-Stiina Tuittila
Jessica Turner
Masahito Ueyama
Alex C. Valach
Rodrigo Vargas
Andrej Varlagin
Alma Vazquez-Lule
Joseph G. Verfaillie
Timo Vesala
George L. Vourlitis
Eric J. Ward
Christian Wille
Georg Wohlfahrt
Guan Xhuan Wong
Zhen Zhang
Donatella Zona
Lisamarie Windham-Myers
Benjamin Poulter
Robert B. Jackson
Methane (CH4) emissions from natural landscapes constitute roughly half of global CH4 contributions to the atmosphere, yet large uncertainties remain in the absolute magnitude and the seasonality of emission quantities and drivers. Eddy covariance (EC) measurements of CH4 flux are ideal for constraining ecosystem-scale CH4 emissions due to quasi-continuous and high-temporal-resolution CH4 flux measurements, coincident carbon dioxide, water, and energy flux measurements, lack of ecosystem disturbance, and increased availability of datasets over the last decade. Here, we (1) describe the newly published dataset, FLUXNET-CH4 Version 1.0, the first open-source global dataset of CH4 EC measurements (available at https://fluxnet.org/data/fluxnet-ch4-community-product/, last access: 7 April 2021). FLUXNET-CH4 includes half-hourly and daily gap-filled and non-gap-filled aggregated CH4 fluxes and meteorological data from 79 sites globally: 42 freshwater wetlands, 6 brackish and saline wetlands, 7 formerly drained ecosystems, 7 rice paddy sites, 2 lakes, and 15 uplands. Then, we (2) evaluate FLUXNET-CH4 representativeness for freshwater wetland coverage globally because the majority of sites in FLUXNET-CH4 Version 1.0 are freshwater wetlands which are a substantial source of total atmospheric CH4 emissions; and (3) we provide the first global estimates of the seasonal variability and seasonality predictors of freshwater wetland CH4 fluxes. Our representativeness analysis suggests that the freshwater wetland sites in the dataset cover global wetland bioclimatic attributes (encompassing energy, moisture, and vegetation-related parameters) in arctic, boreal, and temperate regions but only sparsely cover humid tropical regions. Seasonality metrics of wetland CH4 emissions vary considerably across latitudinal bands. In freshwater wetlands (except those between 20∘ S to 20∘ N) the spring onset of elevated CH4 emissions starts 3 d earlier, and the CH4 emission season lasts 4 d longer, for each degree Celsius increase in mean annual air temperature. On average, the spring onset of increasing CH4 emissions lags behind soil warming by 1 month, with very few sites experiencing increased CH4 emissions prior to the onset of soil warming. In contrast, roughly half of these sites experience the spring onset of rising CH4 emissions prior to the spring increase in gross primary productivity (GPP). The timing of peak summer CH4 emissions does not correlate with the timing for either peak summer temperature or peak GPP. Our results provide seasonality parameters for CH4 modeling and highlight seasonality metrics that cannot be predicted by temperature or GPP (i.e., seasonality of CH4 peak). FLUXNET-CH4 is a powerful new resource for diagnosing and understanding the role of terrestrial ecosystems and climate drivers in the global CH4 cycle, and future additions of sites in tropical ecosystems and site years of data collection will provide added value to this database. All seasonality parameters are available at https://doi.org/10.5281/zenodo.4672601 (Delwiche et al., 2021). Additionally, raw FLUXNET-CH4 data used to extract seasonality parameters can be downloaded from https://fluxnet.org/data/fluxnet-ch4-community-product/ (last access: 7 April 2021), and a complete list of the 79 individual site data DOIs is provided in Table 2 of this paper.
Please read the corrigendum first before continuing.
-
Notice on corrigendum
The requested paper has a corresponding corrigendum published. Please read the corrigendum first before downloading the article.
-
Article
(4370 KB)
-
The requested paper has a corresponding corrigendum published. Please read the corrigendum first before downloading the article.
- Article
(4370 KB) - Full-text XML
- Corrigendum
- BibTeX
- EndNote


Methane (CH4) has a global warming potential that is 28 times larger than carbon dioxide (CO2) on a 100-year timescale (Myhre et al., 2013), and its atmospheric concentration has increased by > 1000 ppb since 1800 (Etheridge et al., 1998). While atmospheric CH4 concentrations are substantially lower than those of CO2, CH4 has contributed 20 %–25 % as much radiative forcing as CO2 since 1750 (Etminan et al., 2016). Despite its importance to global climate change, natural CH4 sources and sinks remain poorly constrained and with uncertain attribution to the various biogenic and anthropogenic sources (Saunois et al., 2016, 2020). Bottom-up and top-down estimates differ by 154 Tg yr−1 (745 versus 591 Tg yr−1, respectively); much of this difference arises from natural sources (Saunois et al., 2020). Vegetated wetlands and inland water bodies account for most natural CH4 emissions, as well as the majority of uncertainty in bottom-up emission estimates (Saunois et al., 2016). Better diagnosis and prediction of terrestrial CH4 sources to the atmosphere requires high frequency and continuous measurements of CH4 exchange across a continuum of time (hours to years) and space (meters to kilometers) scales.
Tower-based eddy covariance (EC) measurements providing ecosystem-scale CH4 fluxes at high temporal resolution across years are coupled with measurements of key CH4 drivers such as temperature, water, and recent substrate input (inferred from CO2 flux) and thus help constrain bottom-up CH4 budgets and improve CH4 predictions. Although EC towers began measuring CO2 fluxes in the late 1970s (Desjardins, 1974; Anderson et al., 1984), and some towers began measuring CH4 in the 1990s (Verma et al., 1992), most CH4 flux EC measurements began within the last decade (2010s). Given that many EC CH4 sites are relatively new, the flux community has only recently compiled them for global synthesis efforts (e.g., Chang et al., 2021) and is still working to standardize CH4 flux measurements and establish gap-filling protocols (Nemitz et al., 2018; Knox et al., 2019). Furthermore, the growth of EC networks for CH4 fluxes has sometimes taken place in a relatively ad hoc fashion, often at sites that were already measuring CO2 fluxes or where higher CH4 fluxes were expected, potentially introducing bias. The representativeness and spatial distribution of CO2 flux tower networks have been assessed to evaluate their ability to upscale fluxes regionally (Hargrove et al., 2003; Hoffman et al., 2013; Papale et al., 2015; Villarreal et al., 2018, 2019) and globally (Jung et al., 2009, 2020). However, a relatively sparse coverage of CH4 flux towers prompts the question of how well the current observation network provides a sufficient sampling of global or ecosystem-specific bioclimatic conditions.
Broad-scale wetland CH4 seasonality estimates, such as when fluxes increase, peak, and decrease and the predictors of seasonality, remain relatively unconstrained across wetlands globally. These key seasonality metrics vary considerably across high-emitting systems such as wetlands and other aquatic systems (Desjardins, 1974; Dise, 1992; Melloh and Crill, 1996; Wik et al., 2013; Zona et al., 2016; Treat et al., 2018). The few continuous CH4 flux datasets across representative site years make it difficult to establish trends in seasonal dynamics, though monthly or annually aggregated estimates of CH4 fluxes from different seasons do exist for high latitudes (Zona et al., 2016; Treat et al., 2018). Seasonal variability in freshwater wetland CH4 fluxes is expected to be driven by changes in air (TA) and soil temperature (ST), soil moisture (including water table dynamics), and recent carbon substrate availability, which influence the rates of CH4 production and consumption (Lai, 2009; Bridgham et al., 2013; Dean et al., 2018). Temperature has widely been found to strongly affect CH4 flux (Chu et al., 2014; Yvon-Durocher et al., 2014; Sturtevant et al., 2016), but the relationship is complex (Chang et al., 2020) and varies seasonally (Koebsch et al., 2015; Helbig et al., 2017). CH4 flux is also driven by inundation depth since anoxic conditions are typically necessary for methanogenesis (Lai, 2009; Bridgham et al., 2013), though CH4 production under bulk-oxic conditions has been observed (Angle et al., 2017). Substrate availability influences CH4 production potential and is linked with gross primary productivity (GPP) because recent photosynthate fuels methanogenesis, though this relationship can vary by ecosystem type, plant functional type, and biome (Megonigal et al., 1999; Chanton et al., 2008; Hatala et al., 2012; Lai et al., 2014; Malhotra and Roulet, 2015; Sturtevant et al., 2016). In process models, the seasonality of CH4 emissions from wetlands globally is primarily constrained by inundation (Poulter et al., 2017) with secondary within-wetland influences from temperature and availability of carbon (C) substrates (Melton et al., 2013; Castro-Morales et al., 2018). Bottom-up and top-down global CH4 estimates continue to disagree on total CH4 flux magnitudes and seasonality, including the timing of annual peak emissions (Spahni et al., 2011; Saunois et al., 2020). Thus, the variability in and predictors of wetland CH4 seasonality globally remain a knowledge gap that high-frequency and long-term EC data can help fill.
Here, we first describe version 1.0 of the FLUXNET-CH4 dataset (available at https://fluxnet.org/data/fluxnet-ch4-community-product/, last access: 7 April 2021). Version 1.0 of the dataset expands and formalizes the publication of data scattered among regional flux networks as described previously in Knox et al. (2019). FLUXNET-CH4 includes half-hourly and daily gap-filled and non-gap-filled aggregated CH4 fluxes and meteorological data from 79 sites globally: 42 freshwater wetlands, 6 brackish and saline wetlands, 7 formerly drained ecosystems, 7 rice paddy sites, 2 lakes, and 15 upland ecosystems. FLUXNET-CH4 includes an additional two wetland sites (RU-Vrk and SE-St1), but they are not available under the CC BY 4.0 data policy and thus are excluded from this analysis. Since the majority of sites in FLUXNET-CH4 Version 1.0 (hereafter referred to solely as “FLUXNET-CH4”) are freshwater wetlands, which are a substantial source of total atmospheric CH4 emissions, we use the subset of data from freshwater wetlands to evaluate the representativeness of freshwater wetland coverage in the FLUXNET-CH4 dataset relative to wetlands globally, and we provide the first assessment of global variability in and predictors of freshwater wetland CH4 flux seasonality. We quantify a suite of CH4 seasonality metrics and evaluate temperature and GPP (a proxy for recent substrate input) as predictors of seasonality across four latitudinal bands (northern, temperate, subtropical, and tropical). Due to a lack of high-temporal-resolution water table data at all sites, our analyses are unable to evaluate the critical role of water table on CH4 seasonality. Here we provide parameters for better understanding and modeling seasonal variability in freshwater wetland CH4 fluxes and generate new hypotheses and data resources for future syntheses.
2.1 FLUXNET-CH4 dataset
2.1.1 History and data description
The FLUXNET-CH4 dataset was initiated by the Global Carbon Project (GCP) in 2017 to better constrain the global CH4 budget (https://www.globalcarbonproject.org/methanebudget/index.htm, last access: 6 July 2021). Beginning with a kick-off meeting in May 2018 in Washington DC, hosted by Stanford University, we coordinated with the AmeriFlux Management Project, the European Ecosystem Fluxes Database, and the Integrated Carbon Observation System Ecosystem Thematic Centre (ICOS-ETC) to avoid duplication of efforts as most sites are part of different regional networks (albeit with different data products). We collected and standardized data for FLUXNET-CH4 with assistance from the regional flux networks, AmeriFlux's “Year of Methane”, FLUXNET, the EU's Readiness of ICOS for Necessities of Integrated Global Observations (RINGO) project, and a US Geological Survey Powell Center working group. FLUXNET-CH4 is a community-led project, so while we developed it with assistance from FLUXNET, we do not necessarily use standard FLUXNET data variables, formats, or methods.
FLUXNET-CH4 includes gap-filled half-hourly CH4 fluxes and meteorological variables. Gaps in meteorological variables (TA – air temperature; SW_IN – incoming shortwave radiation; LW_IN – incoming longwave radiation; VPD – vapor pressure deficient; PA – pressure; P – precipitation; WS – wind speed) were filled with the ERA-Interim (ERA-I) reanalysis product (Vuichard and Papale, 2015). We used the REddyProc package (Wutzler et al., 2018) to filter flux values with low friction velocity (u∗) based on relating nighttime u∗ to fill gaps in CO2, latent heat, and sensible heat fluxes and to partition net CO2 fluxes into gross primary production (GPP) and ecosystem respiration (RECO) using both the daytime (Lasslop et al., 2010) and nighttime (Reichstein et al., 2005) approaches. Data gaps of CH4 flux were filled using artificial neural network (ANN) methods first described in Knox et al. (2015, 2019) and summarized here in Sect. 2.1.2. Gap-filled data for gaps exceeding 2 months are provided and flagged for quality. Please see Table B1 for variable description and units, as well as quality flag information. For the seasonality analysis in this paper we excluded data from gaps exceeding 2 months, and we encourage future users of FLUXNET-CH4 to critically evaluate gap-filled values from long data gaps before including them in analyses (Dengel et al., 2013; Kim et al., 2020).
In addition to half-hourly data, the FLUXNET-CH4 Version 1.0 release also contains a full set of daily mean values for all parameters except wind direction and precipitation. Daily precipitation is included as the daily sum of the half-hourly data, and daily average wind direction is not included.
2.1.2 Gap-filling methods and uncertainty estimates
As described in Knox et al. (2015, 2019), the ANN routine used to gap-fill the CH4 data was optimized for generalizability and representativeness. To avoid biasing the ANN toward environmental conditions with typically better data coverage (e.g., summertime and daytime measurements), the explanatory data were divided into a maximum of 15 clusters using a k-means clustering algorithm. Data used to train, test, and validate the ANN were proportionally sampled from these clusters. For generalizability, the simplest ANN architecture with good performance (< 5 % gain in model accuracy for additional increases in architecture complexity) was selected for 20 extractions of the training, test, and validation data. Within each extraction, each tested ANN architecture was reinitialized 10 times, and the initialization with the lowest root-mean-square error was selected to avoid local minima. The median of the 20 predictions was used to fill each gap. A standard set of variables available across all sites was used to gap-fill CH4 fluxes (Dengel et al., 2013), which included the previously mentioned meteorological variables TA, SW_IN, WS, and PA and sine and cosine functions to represent seasonality. These meteorological variables were selected for their relevance to CH4 exchange and were gap-filled using the ERA-I reanalysis data. Other variables related to CH4 flux (e.g., water table depth, WTD, and soil temperature, TS) were not included as explanatory variables as they were not available across all sites or had large gaps that could not be filled using the ERA-I reanalysis data (Knox et al., 2019). The ANN gap-filling was performed using MATLAB (Mathworks 2018a, version 9.4.0).
While the median of the 20 predictions was used to fill each gap, the spread of the predictions was used to provide a measure of uncertainty resulting from the ANN gap-filling procedure. Specifically, the combined annual gap-filling and random uncertainty was calculated from the variance of the cumulative sums of the 20 ANN predictions (Knox et al., 2015; Anderson et al., 2016; Oikawa et al., 2017). The (non-cumulative) variance of the 20 ANN predictions was also used to provide gap-filling uncertainty for each half-hourly gap-filled value. While this output is useful for data–model comparisons, it cannot be used to estimate cumulative annual gap-filling error because gap-filling error is not random, which is why the cumulative sums of the 20 ANN predictions are used to estimate annual gap-filling error.
Random errors in EC fluxes follow a double exponential (Laplace) distribution with the standard deviation varying with flux magnitude (Richardson et al., 2006, 2012). For half-hourly CH4 flux measurements, random error was estimated using the residuals of the median ANN predictions, providing a conservative “upper limit” estimate of the random flux uncertainty (Moffat et al., 2007; Richardson et al., 2008). The annual cumulative uncertainty at 95 % confidence was estimated by adding the cumulative gap-filling and random measurement uncertainties in quadrature (Richardson and Hollinger, 2007; Anderson et al., 2016). Annual uncertainties in CH4 flux for individual site years are provided in Table B2. Throughout this paper, we include uncertainties on individual site years when discussing single years of data. In sites with multiple years of data, we report the standard deviation of the multiple years.
2.1.3 Dataset structure and site metadata
FLUXNET-CH4 contains two comma-separated data files per site at half-hourly and daily resolutions which are available for download at https://fluxnet.org/data/fluxnet-ch4-community-product/ (last access: 7 April 2021), along with a file containing select site metadata. Each site has a unique FLUXNET-CH4 DOI. All data from the 79 sites used in this analysis are available under CC BY 4.0 (https://creativecommons.org/licenses/by/4.0/, last access: 6 July 2021) copyright license (FLUXNET-CH4 has an additional two sites available under the FLUXNET Tier 2 license (https://fluxnet.org/data/data-policy/, last access: 6 July 2021), though these sites are not included in our analysis).
Metadata (Table B3) include site coordinates, ecosystem classification based on site literature, presence/absence and dominance for specific vegetation types, and DOI link, as well as calculated data such as annual and quarterly CH4 flux values. FLUXNET-CH4 Version 1.0 sites were classified based on site-specific literature as fen, bog, swamp, marsh, salt marsh, lake, mangrove, rice paddy field, wet tundra, upland, or drained ecosystems that previously could have been wetlands, seasonally flooded pastures, or agricultural areas. To the extent possible, we followed classification systems of previous wetland CH4 syntheses (Olefeldt et al., 2013; Turetsky et al., 2014; Treat et al., 2018). Drained systems are former wetlands that have subsequently been drained but may maintain a relatively shallow water table, which can contribute to occasional methane emissions, although we do not have specific water table depth information at all drained sites. Upland ecosystems are further divided into alpine meadows, grasslands, needleleaf forests, mixed forest, crops, tundra, and urban. Freshwater wetland classifications follow hydrological definitions of bog (ombrotrophic), fen (minerotrophic), wet tundra, marshes, and swamps and were designated as per the primary literature on the site. For all sites, vegetation was classified for the presence or absence of brown mosses (all species from the division Bryophyta except those in the class Sphagnopsida), Sphagnum mosses (any species from class Sphagnopsida), ericaceous shrubs, trees (of any height), and aerenchymatous species (mostly order Poales but includes exceptions). These categories closely follow Treat et al. (2018) except that aerenchymatous species had to be expanded beyond Cyperaceae to incorporate wetlands globally. Presence/absence of vegetation groups was designated based on species lists in primary literature from the site. Out of the vegetation groups present, the dominant (most abundant) group is also reported and is based on information provided by lead site investigators.
In addition to the variable description table (Table B1) and the site metadata (Table B3), we provide several more tables to complement our analysis. Table B4 includes the climatic data used in the representativeness analysis. Table B5 provides seasonality parameters for CH4 flux, air temperature, soil temperature (from the probe closest to the ground surface), and GPP. For sites with multiple soil temperature probes, the full set of soil temperature parameters are in Table B6. Table B7 contains the soil temperature probe depths. Table B2 contains the annual CH4 flux and uncertainty. All Appendix B tables are also available at https://doi.org/10.5281/zenodo.4672601 (Delwiche et al., 2021).
2.1.4 Annual CH4 fluxes
Annual CH4 fluxes were calculated from gap-filled data for site years with data gaps shorter than 2 consecutive months or for sites above 20∘ N where > 2-month data gaps occurred outside of the highest CH4-emission months of 1 May through 31 October. Since we did not sum gap-filled values for > 2 month-gaps during the winter, annual sums from these years will be an underestimate since winter fluxes can be important (Zona et al., 2016; Treat et al., 2018). Several sites had less than 1 year of data, and we report gap-filled CH4 flux annual sums for sites with between 6 months and 1 year of data (BW-Gum = 228 d, CH-Oe2 = 200 d, JP-Swl = 210 d, and US-EDN = 182 d). While these sums will be an underestimate of annual CH4 flux since they do not span a full year (and we therefore do not use them in the seasonality analysis), their relative magnitude can still be informative. For example, site JP-SWL is a lake site, and even with less than 1 year of data the summed CH4 flux of 66 g C m−2 is relatively high (Taoka et al., 2020). In addition to sites with short time series, the annual CH4 sum for site ID-Pag represents 365 d spanning June 2016 to June 2017.
2.1.5 Subset analysis on freshwater wetland CH4 flux
In addition to the FLUXNET-CH4-wide description of site class distributions and annual CH4 fluxes, we also include a subset analysis on freshwater wetlands given that it is the dominant ecosystem type in our dataset and an important global CH4 source (Saunois et al., 2016). First, we analyze freshwater wetland representativeness and subsequently the seasonality of their CH4 emissions. Freshwater wetlands included in the seasonality and representativeness analysis are indicated in Table B3, column “IN_SEASONALITY_ANALYSIS”.
2.2 Wetland representativeness
2.2.1 Principal component analysis
To compare the FLUXNET-CH4 site distribution to the global wetland distribution, we evaluated their representativeness in the entire global wetland cover along four bioclimatic gradients. Only freshwater wetland sites were included in this analysis. Coastal sites were excluded because salinity, an important control on CH4 production, could not be evaluated across the tower network due to a lack of global gridded salinity data (Bartlett et al., 1987; Poffenbarger et al., 2011). The four bioclimatic variables used were mean annual air temperature (MAT), latent heat flux (LE), enhanced vegetation index (EVI), and simple ratio water index (SRWI; data sources in Table B4). We use EVI because it is a more direct measurement than GPP from global gridded products and is considered a reasonable proxy for GPP (Sims et al., 2006). Together, these environmental variables account for, or are, proxies for key controls of CH4 production, oxidation at the surface, and transport (Bridgham et al., 2013). We use a principal components analysis (PCA) to visualize the site distribution across the four environmental drivers at once. For this analysis, we consider the annual average bioclimatic conditions over 2003–2015. In the PCA output, we evaluate the coverage of the 42 freshwater sites over 0.25∘ grid cells containing > 5 % wetland mean cover in Wetland Area and Dynamics for Methane Modeling (WAD2M; Zhang et al., 2020, 2021) for the same time period.
2.2.2 Global dissimilarity and constituency analysis
To further identify geographical gaps in the coverage of the FLUXNET-CH4 Version 1.0 network, we quantified the dissimilarity of global wetlands from the tower network, using a similar approach to that taken for CO2 flux towers (Meyer and Pebesma, 2020). We calculated the 4-dimensional Euclidean distance from the four bioclimatic variables between every point at the land surface to every tower location at the FLUXNET-CH4 network. We then divided these distances by the average distance between towers to produce a dissimilarity index. Dissimilarity scores < 1 represent areas whose nearest tower is closer than the average distance among towers, while areas with scores > 1 are more distant. Lastly, we identified the importance of an individual tower in the network by estimating the geographical area to which it is most analogous in bioclimate space. We divided the world's land surface according to closest towers in bioclimatic space. The area to which each tower is nearest is defined as the tower's constituency.
2.3 Wetland CH4 seasonality
To examine freshwater wetland CH4 seasonality across the global range of sites in FLUXNET-CH4, we extracted seasonality parameters for CH4, temperature, and GPP using TIMESAT, a software package designed to analyze seasonality of environmental systems (Jönsson and Eklundh, 2002, 2004; Eklundh and Jönsson, 2015). TIMESAT calculates several seasonality parameters, including baseline flux, peak flux, and the slope of spring flux increase and fall decrease (Fig. 1). We also calculate parameters such as amplitude (peak flux minus baseline, which is the average of spring and fall baselines; “e” − ((“a” + “b”)) in Fig. 1) and relative peak timing ((“g” − “f”)(“h” − “f”) in Fig. 1). TIMESAT uses a double-logistic fitting function to create a series of localized fits centered on data minima and maxima. Localized fits are determined by minimizing a merit function with the Levenberg–Marquardt method (Madsen et al., 2004; Nielsen, 1999). These localized fits are then merged using a global function to create a smooth fit over the full time interval. To fit CH4 time series in TIMESAT, we used gap-filled data after removing gaps exceeding 2 months. We do not report TIMESAT parameters when large gaps occur during the spring CH4 emissions' increase, peak, or fall decrease.
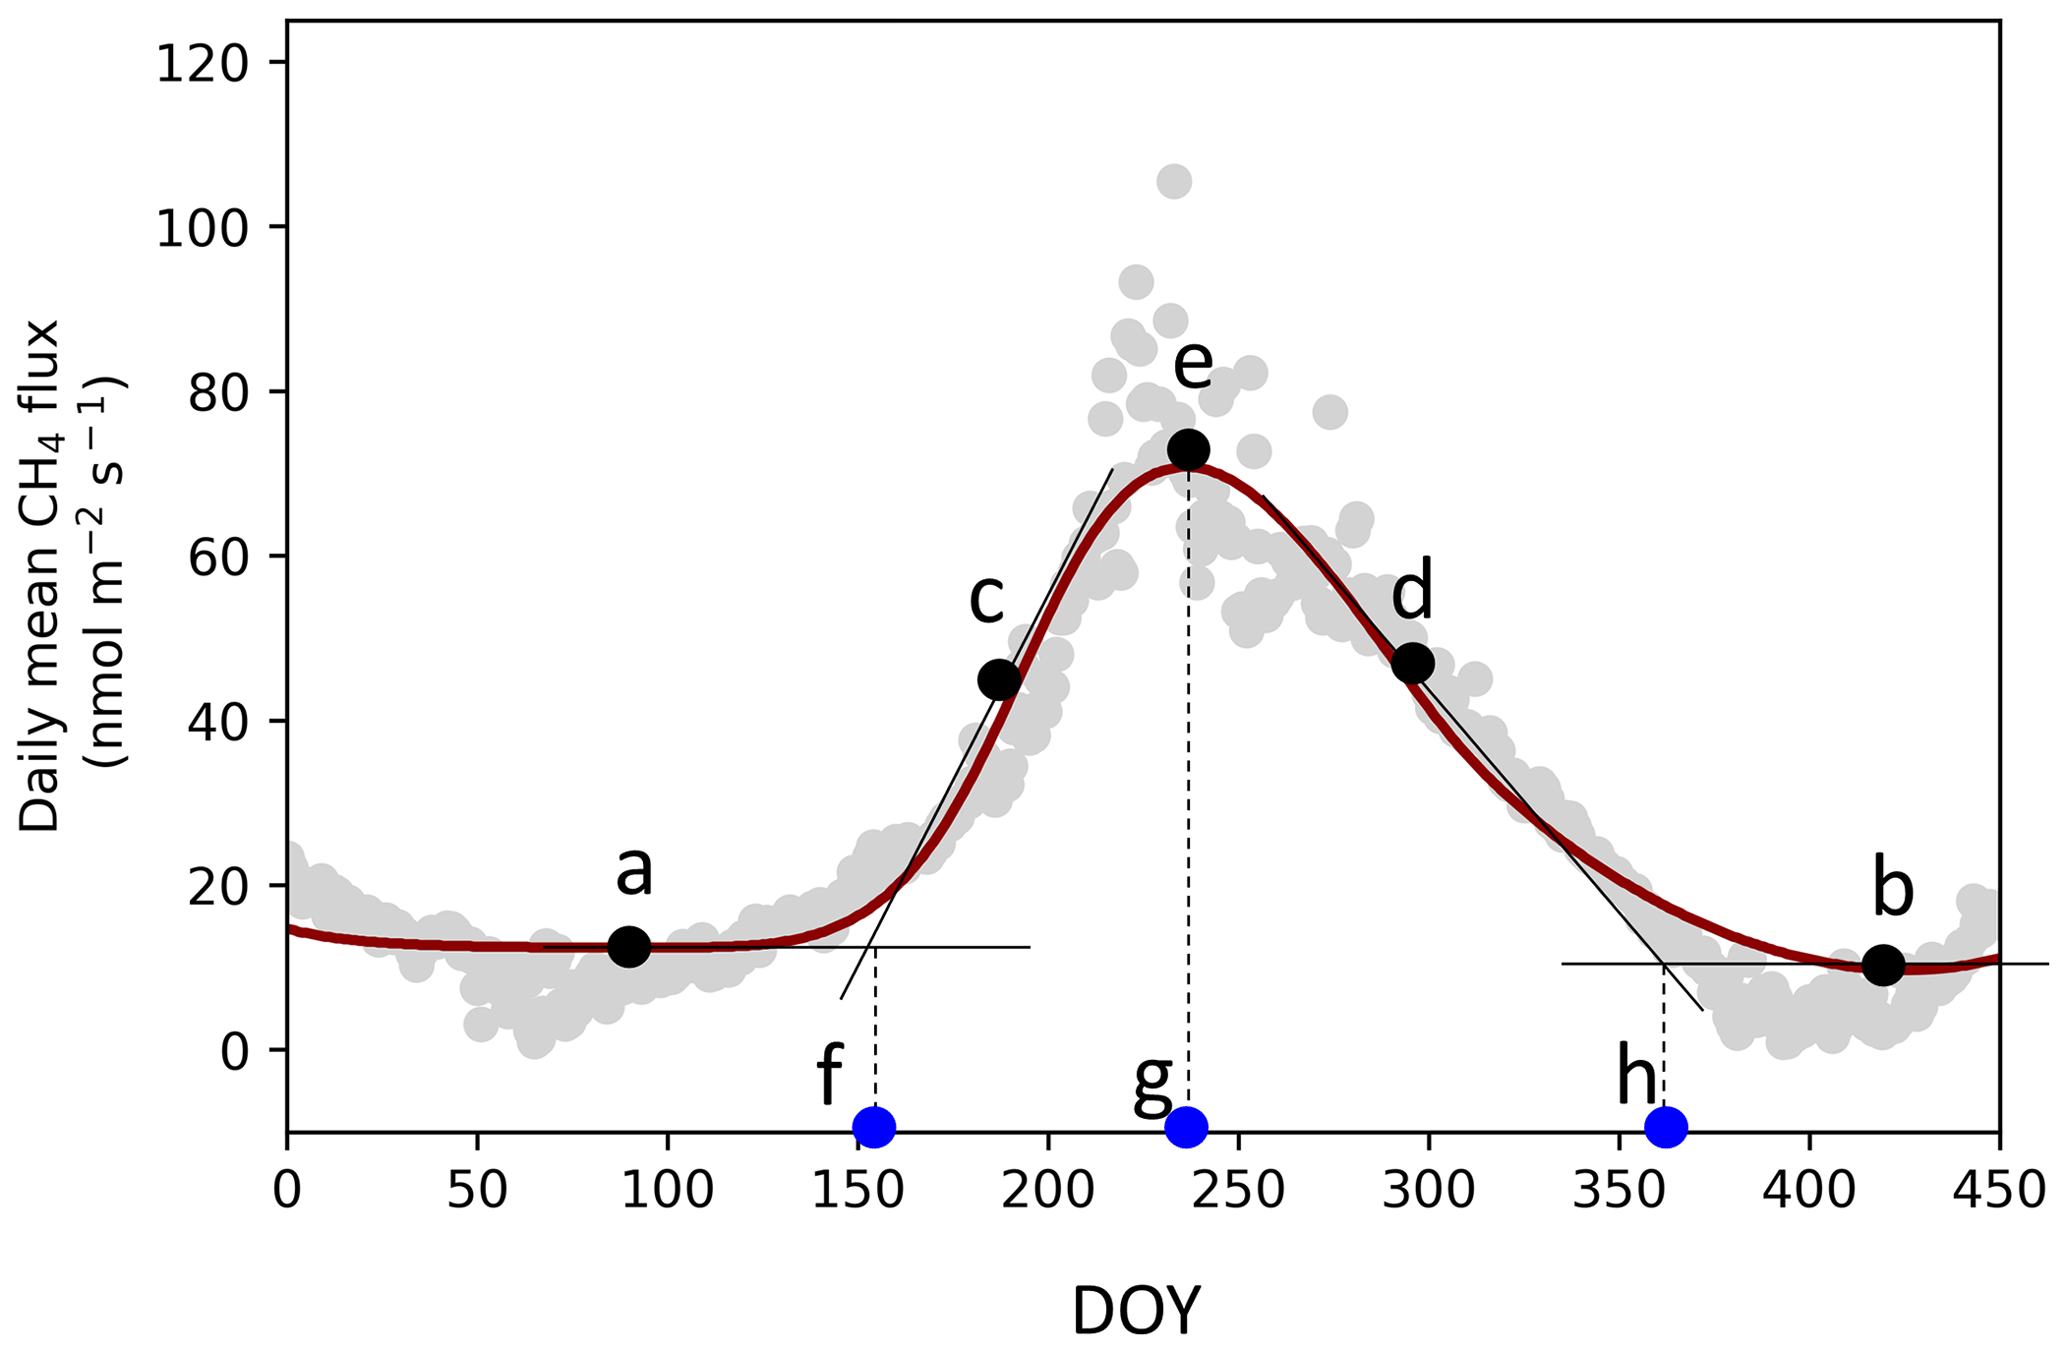
Figure 1TIMESAT parameter description. (a, b) Base values (TIMESAT reports the average of these two values), (c, d) slopes of seasonal curves (lines drawn between 20 % and 80 % of the amplitude), (e) peak value, and day of year (DOY) for the start (f), peak (g), and end (h) of the elevated methane (CH4) emission season. Data points are the mean daily gap-filled CH4 fluxes from site JP-Bby in 2015.
We estimate “start of elevated emission season” when CH4 emissions begin to increase in the spring ( “f” in Fig. 1), and “end of elevated emission season” when the period of elevated CH4 flux ends in the fall (“h” in Fig. 1), as the intercept between the TIMESAT fitted baseline parameter and shoulder-season slope (similar to Gu et al., 2009). To extract seasonality parameters with TIMESAT, sites need a sufficiently pronounced seasonality, a sufficiently long time period, and minimal data gaps (we note that while TIMESAT is capable of fitting two peaks per year, all the freshwater wetland sites have a single annual peak). We excluded site years in restored wetlands when wetlands were still under construction. Of the 42 freshwater wetland sites in FLUXNET-CH4 Version 1.0, 36 had sufficient data series to extract seasonality parameters. These 36 wetlands had 141 site years of data in total, which we fit with the double-logistic fitting method which followed site data well (representative examples in Fig. 2). For extratropical sites in the Southern Hemisphere, we shifted all data by 182 d so that maximum solar insolation seasonality would be congruent across the globe.
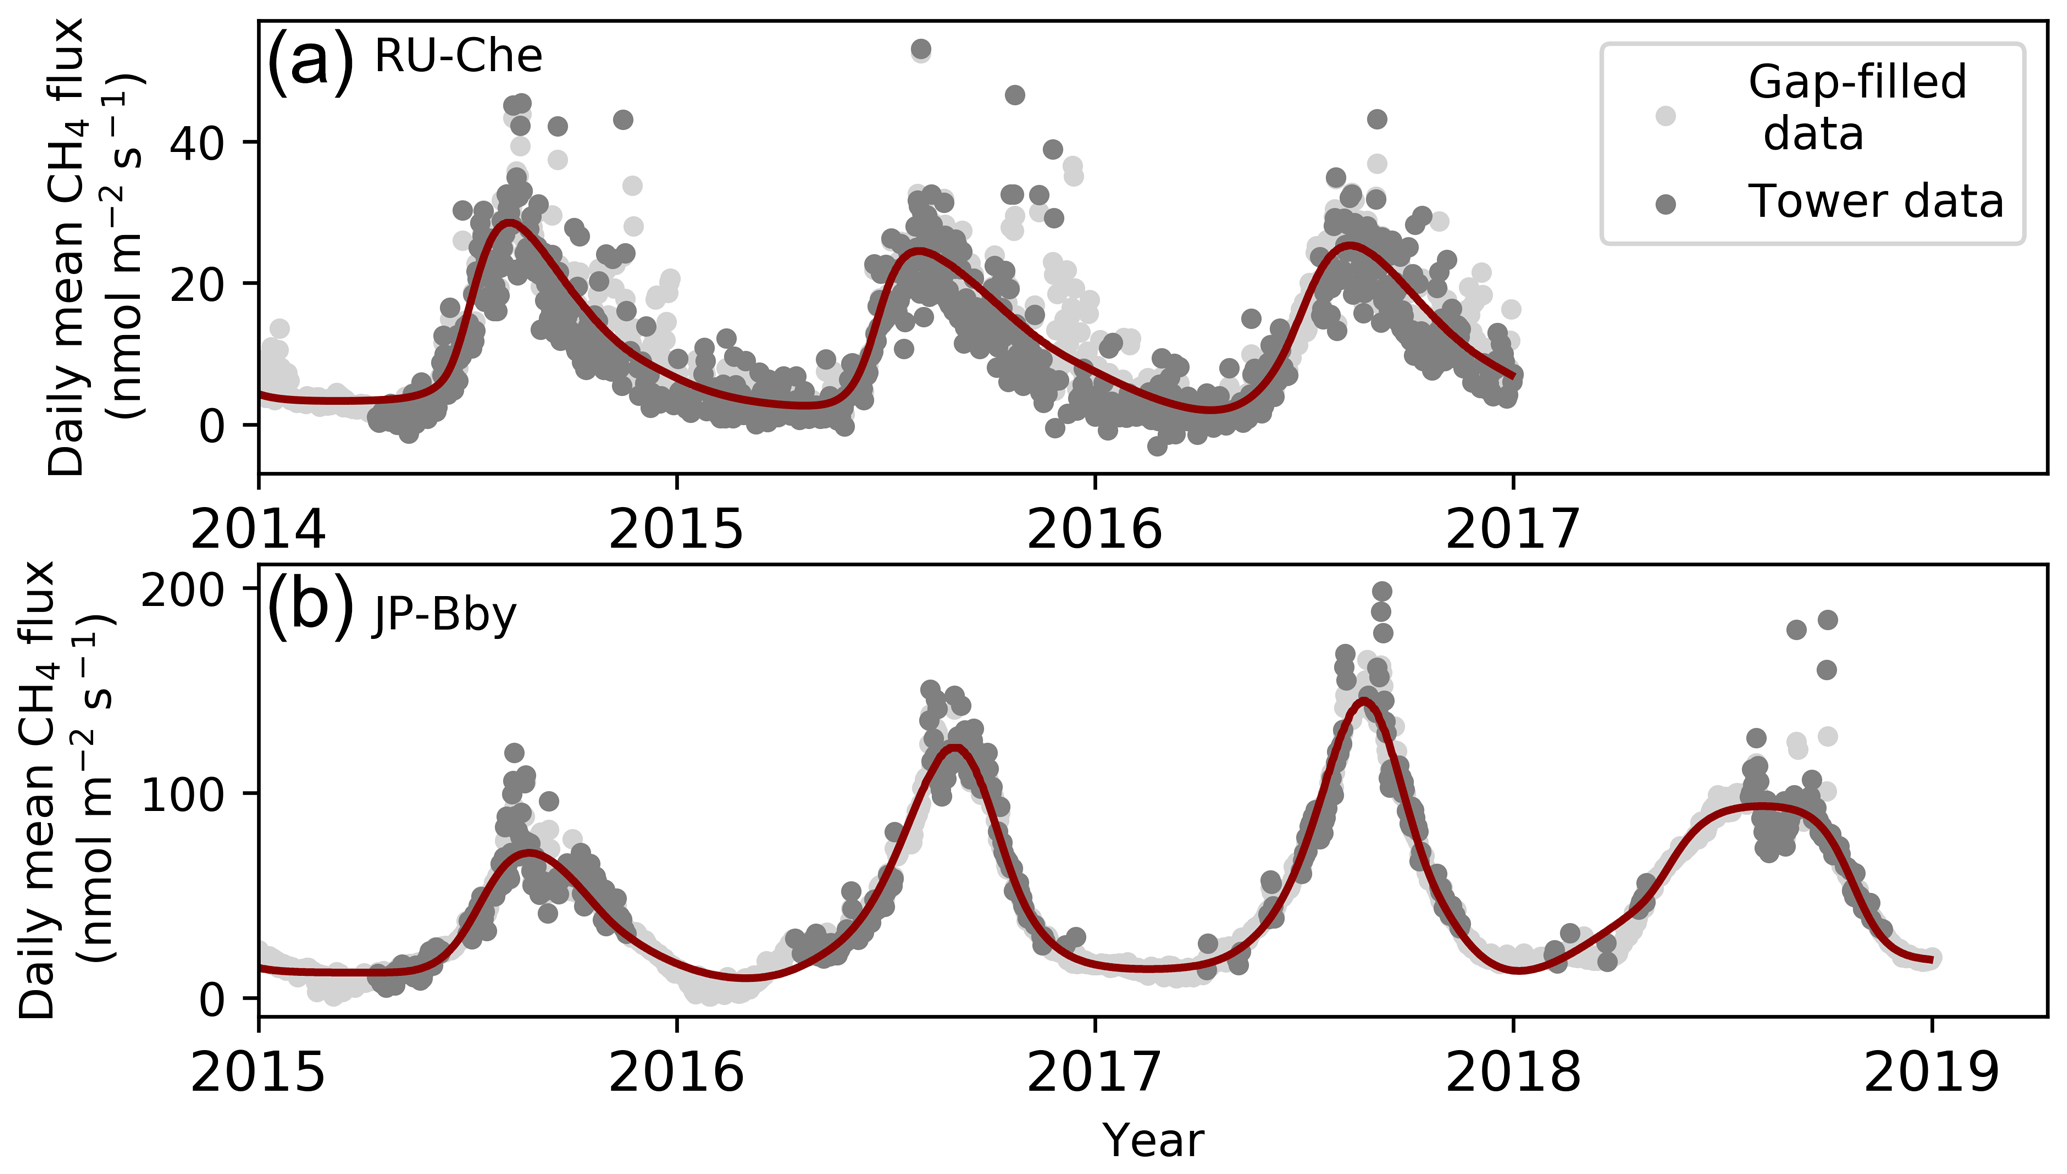
Figure 2Examples of TIMESAT fits for two FLUXNET-CH4 sites, (a) RU-Che and (b) JP-Bby. Methane (CH4) flux data showing daily average flux tower data, with several high outliers excluded to improve the plot (dark gray), gap-filled values (light gray), and TIMESAT-fitted curve (dark red line) for sites JP-Bby and RU-Che. TIMESAT captures the size and shape of peaks (note different scale on y axes). CH4= methane.
We also used TIMESAT to extract seasonality metrics for GPP, partitioned using the daytime-based approach (Lasslop et al., 2010) (GPP_DT), air temperature (TA), and soil temperature (TS_1, TS_2, etc). For sites where winter soil temperatures fall significantly below 0 ∘C, TIMESAT fits a soil temperature “start of elevated season” date to periods when the soil is still frozen. In order for TIMESAT to define the soil temperature seasonality within the thawed season, we converted all negative soil temperatures to zero (simply removing these values results in too many missing values for TIMESAT to fit). Many sites have more than one soil temperature probe, so we extracted separate seasonality metrics from each individual probe (although we used the metrics from the shallowest temperature probe in our analysis). Table B4 contain the TIMESAT seasonality parameters used in the seasonality analysis. We did not include water table depth in the seasonality analysis because many sites either lack water table depth measurements or have sparse data.
We regressed the CH4 seasonality parameters from TIMESAT against annual temperature, annual water table depth, and TIMESAT seasonality parameters for air temperature, soil temperature, and GPP (proxy for recent carbon input available as substrate) using linear mixed-effect modeling with the lmer command (with site as a random effect) from the R (R Core Team, 2018, version 3.6.2) package lmerTest (Kuznetsova et al., 2017). For these regressions we present the marginal R2 outputs from lmer, which represent the variance explained only by the fixed effects. Mixed-effect modeling was necessary to account for the non-independence between measurements taken at the same site during different years (Zona et al., 2016; Treat et al., 2018). We also compared how seasonality metrics varied across latitudinal bands by dividing sites into northern (> 60∘ N), temperate (between 40 and 60∘ N), subtropical (absolute value between 20 and 40∘ N latitude, with site NZ-KOP being the only Southern Hemisphere site), and tropical (absolute value below 20∘ N). Site-year totals for the northern, temperate, subtropical, and tropical bands were n=57, 36, 39, and 9, respectively. We used the Kruskal–Wallis test to establish whether groups (either across quarters or across latitudes) were from similar distributions and the post hoc multiple comparison “Dwass, Steel, Critchlow, and Fligner” procedure for inter-group comparisons. Kruskal–Wallis and post hoc tests were implemented in Python Version 3.7.4, using stats from scipy for Kruskal–Wallis and posthoc_dscf from scikit_posthocs.
We also compared quarterly CH4 flux sums by dividing data into quarterly periods: January–February–March (JFM), April–May–June (AMJ), July–August–September (JAS), and October–November–December (OND). For the sake of simplicity, we chose to compare quarterly periods rather than site-specific growing/non-growing season periods so that all time periods would be the same length. Quarterly sums were computed from the gap-filled CH4 fluxes when the longest continuous data gap within the quarter did not exceed 30 d, leading to site-year counts of 67, 92, 95, and 72 for JFM, AMJ, JAS, and OND, respectively. We compared quarterly CH4 fluxes across latitudinal bands both for the total CH4 flux and for the quarterly percentage of the annual CH4 flux. Quarterly statistics were also conducted with the Kruskal–Wallis test and the post hoc multiple comparison “Dwass, Steel, Critchlow, and Fligner” procedure implemented in Python. Quarterly values are provided in Table B3, and the sum of mean quarterly CH4 flux does not always equal mean annual CH4 flux because some quarters either do not have data or have data gaps that exceed 30 d.
3.1 FLUXNET-CH4 dataset
3.1.1 Dataset description
Version 1.0 of the FLUXNET-CH4 dataset contains 79 unique sites, 293 total site years of data, and 201 site years with sufficient data to estimate annual CH4 emissions. A synthesis paper, published prior to the public data release of FLUXNET-CH4 Version 1.0, had 60 unique sites and 139 site years with annual CH4 emission estimates (Knox et al., 2019). Freshwater wetlands make up the majority of sites (n=42), and the dataset also includes five salt marshes and one mangrove wetland. Notable additions to FLUXNET-CH4 from the previous unpublished dataset used in Knox et al. (2019) include six tropical sites (between 20∘ S and 20∘ N), including one site in South America, two sites in southern Africa, and three sites in Southeast Asia. The 15 upland sites include six needleleaf forests, three crop sites (excluding rice), two alpine meadows, one grassland, one mixed forest, one tundra, and one urban site. The drained sites represent former wetlands that have been artificially drained for use as grasslands (n=3) or croplands (n=3). FLUXNET-CH4 sites span the globe, though they are concentrated in North America and Europe (Fig. 3). Table B3 includes characteristics of all sites in the dataset.
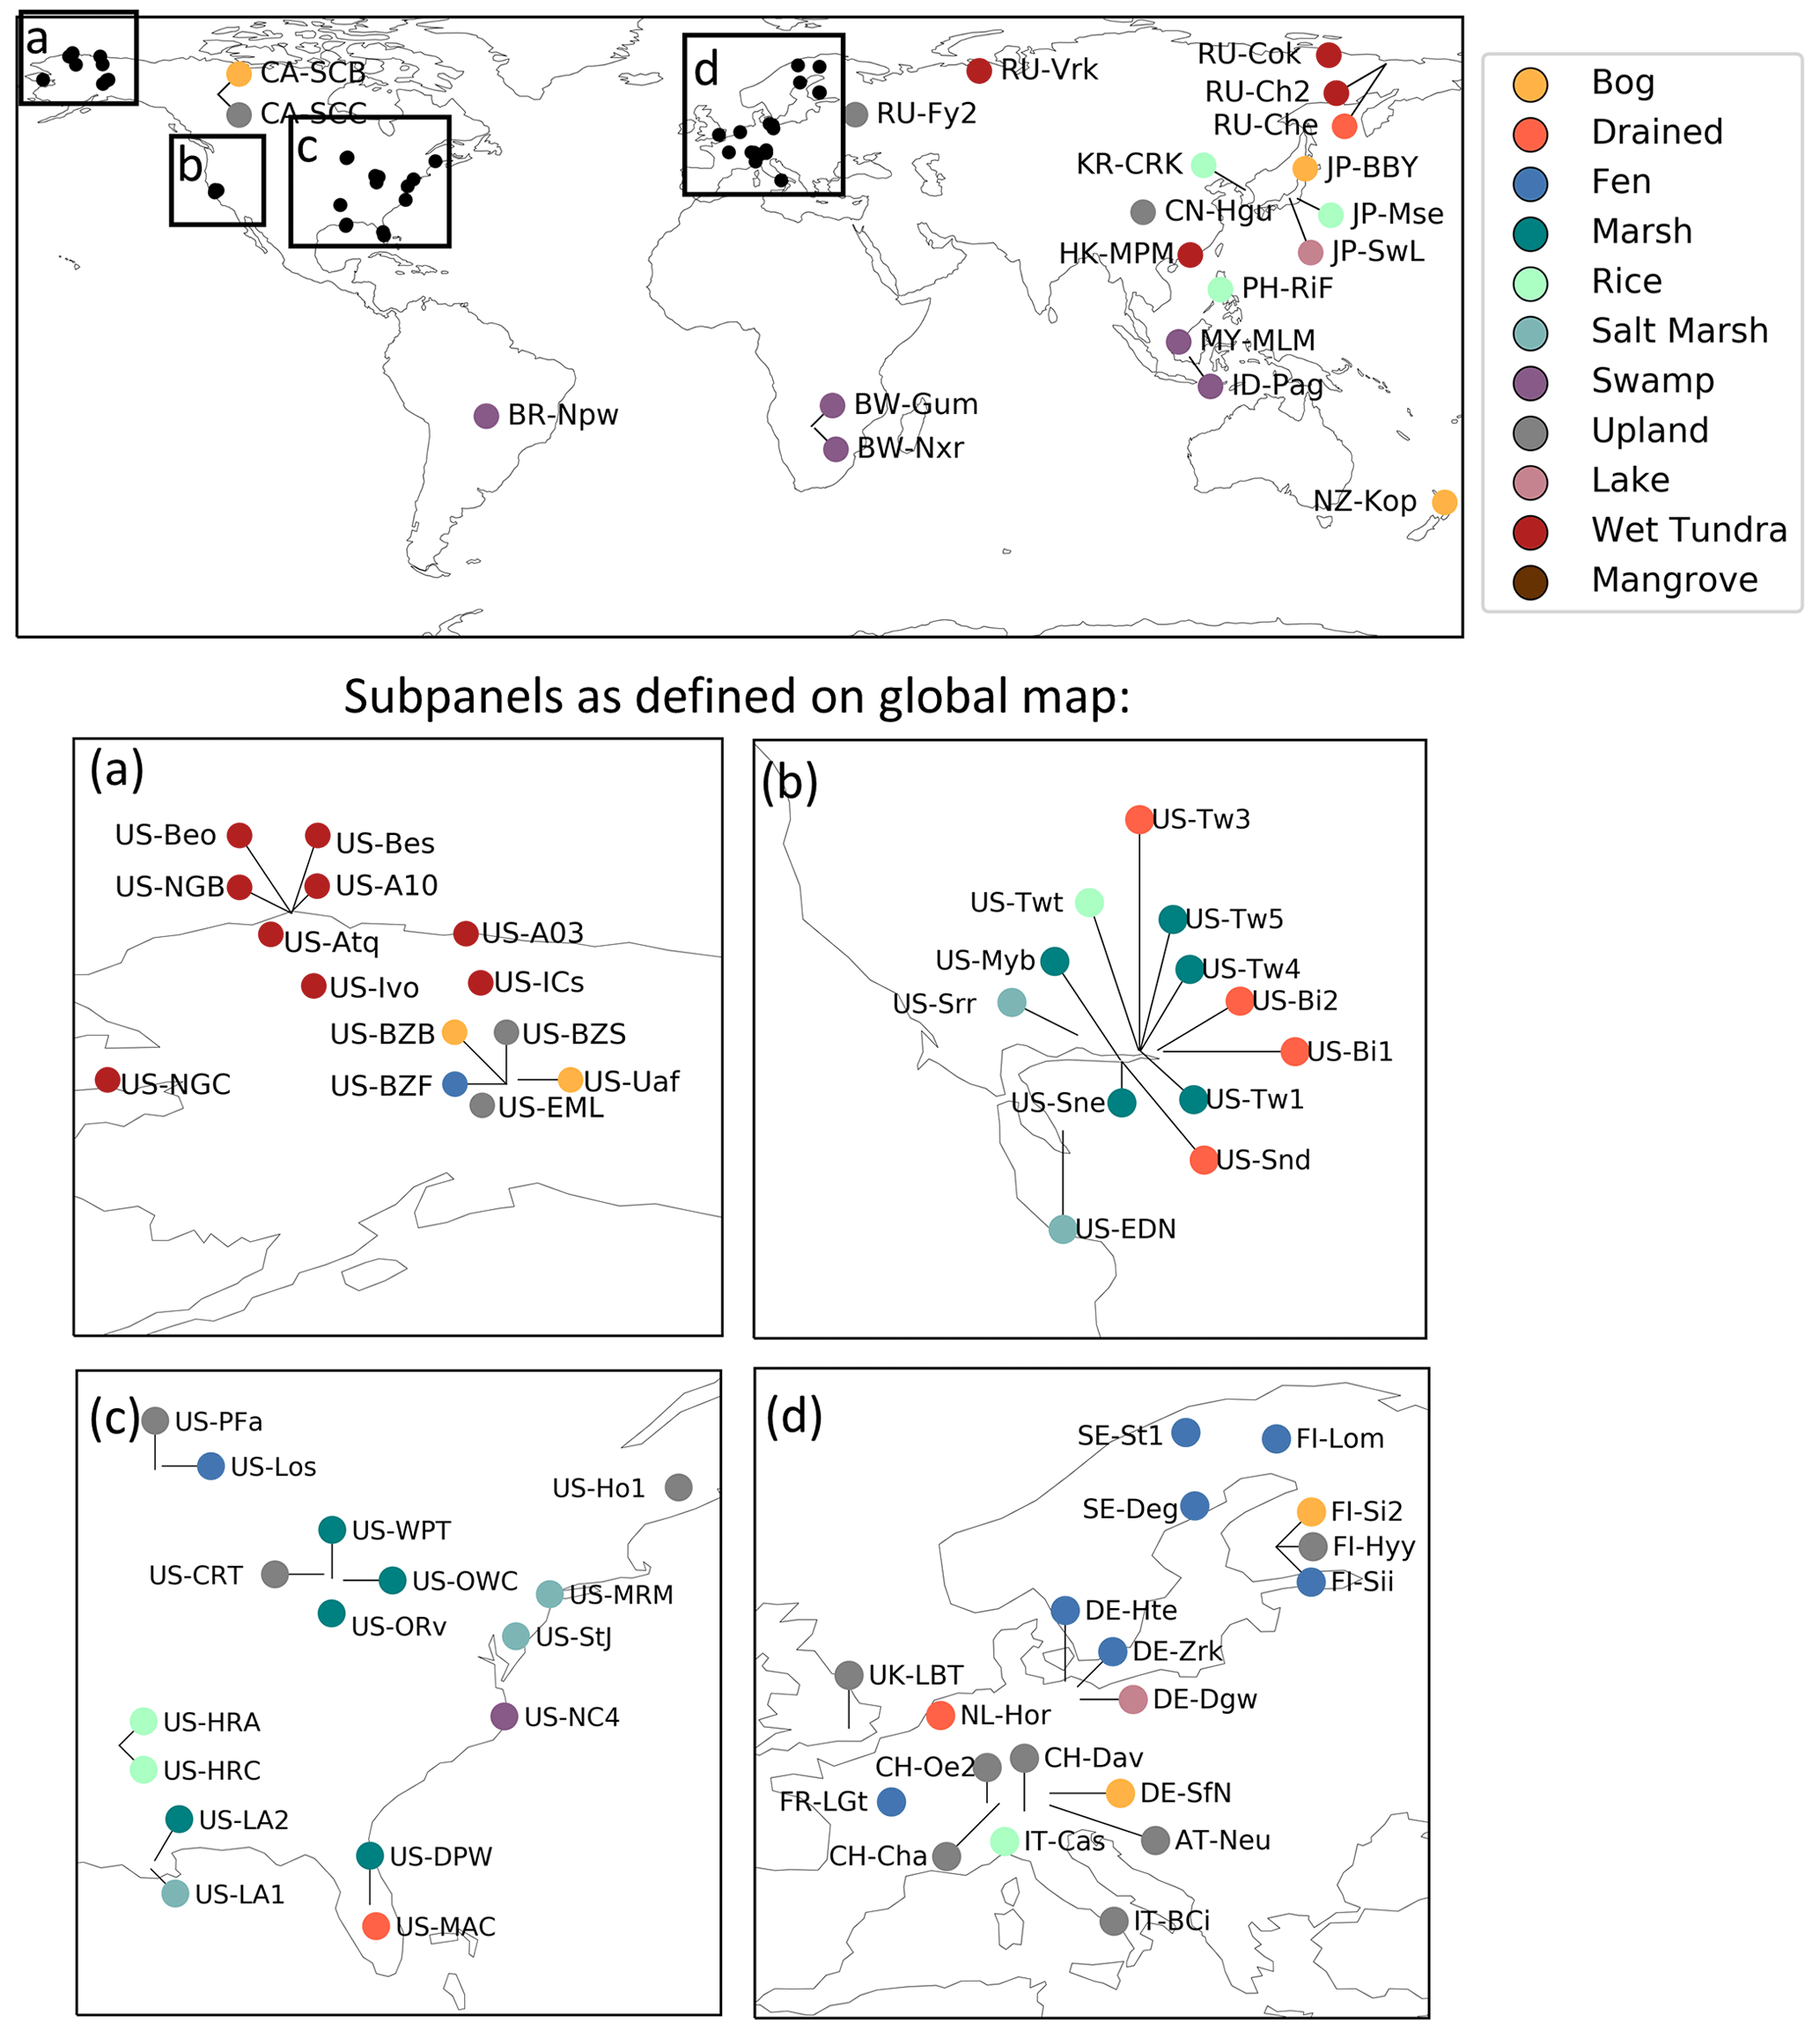
Figure 3Global map of FLUXNET-CH4 Version 1.0 site locations colored by site type. Panels (a)–(d) show sites that were too closely located to distinguish in the global map.
Sites represent a range of ecosystem types, latitudes, median fluxes, and seasonality patterns (Table 1). Across all FLUXNET-CH4 sites (including non-wetland sites), mean average annual CH4 flux is positively skewed with a median flux of 9.5 g C m−2 yr−1, a mean flux of 16.9 g C m−2 yr−1, and numerous annual CH4 fluxes exceeding 60 g C m−2 yr−1. Marshes and swamps have the highest median flux, and upland, salt marsh, and tundra sites have the lowest (Fig. 4). Lake emissions are highly variable due to one high-flux lake site (JP-SWL). Flux data at many sites show strong seasonality in CH4 emissions, but data coverage is also lower outside the growing season (Table 1). Data coverage is lowest during the JFM quarter (on average 20 % of half-hourly time periods contain flux data), reflecting the predominance of Northern Hemisphere sites and the practical difficulties in maintaining EC tower sites during colder winter months (Table 1). Bogs, fens, and marshes have pronounced seasonality, with fluxes being highest in the AMJ and JAS quarters. In contrast, CH4 fluxes from uplands, drained sites, and salt marshes are more uniform and low year-round.
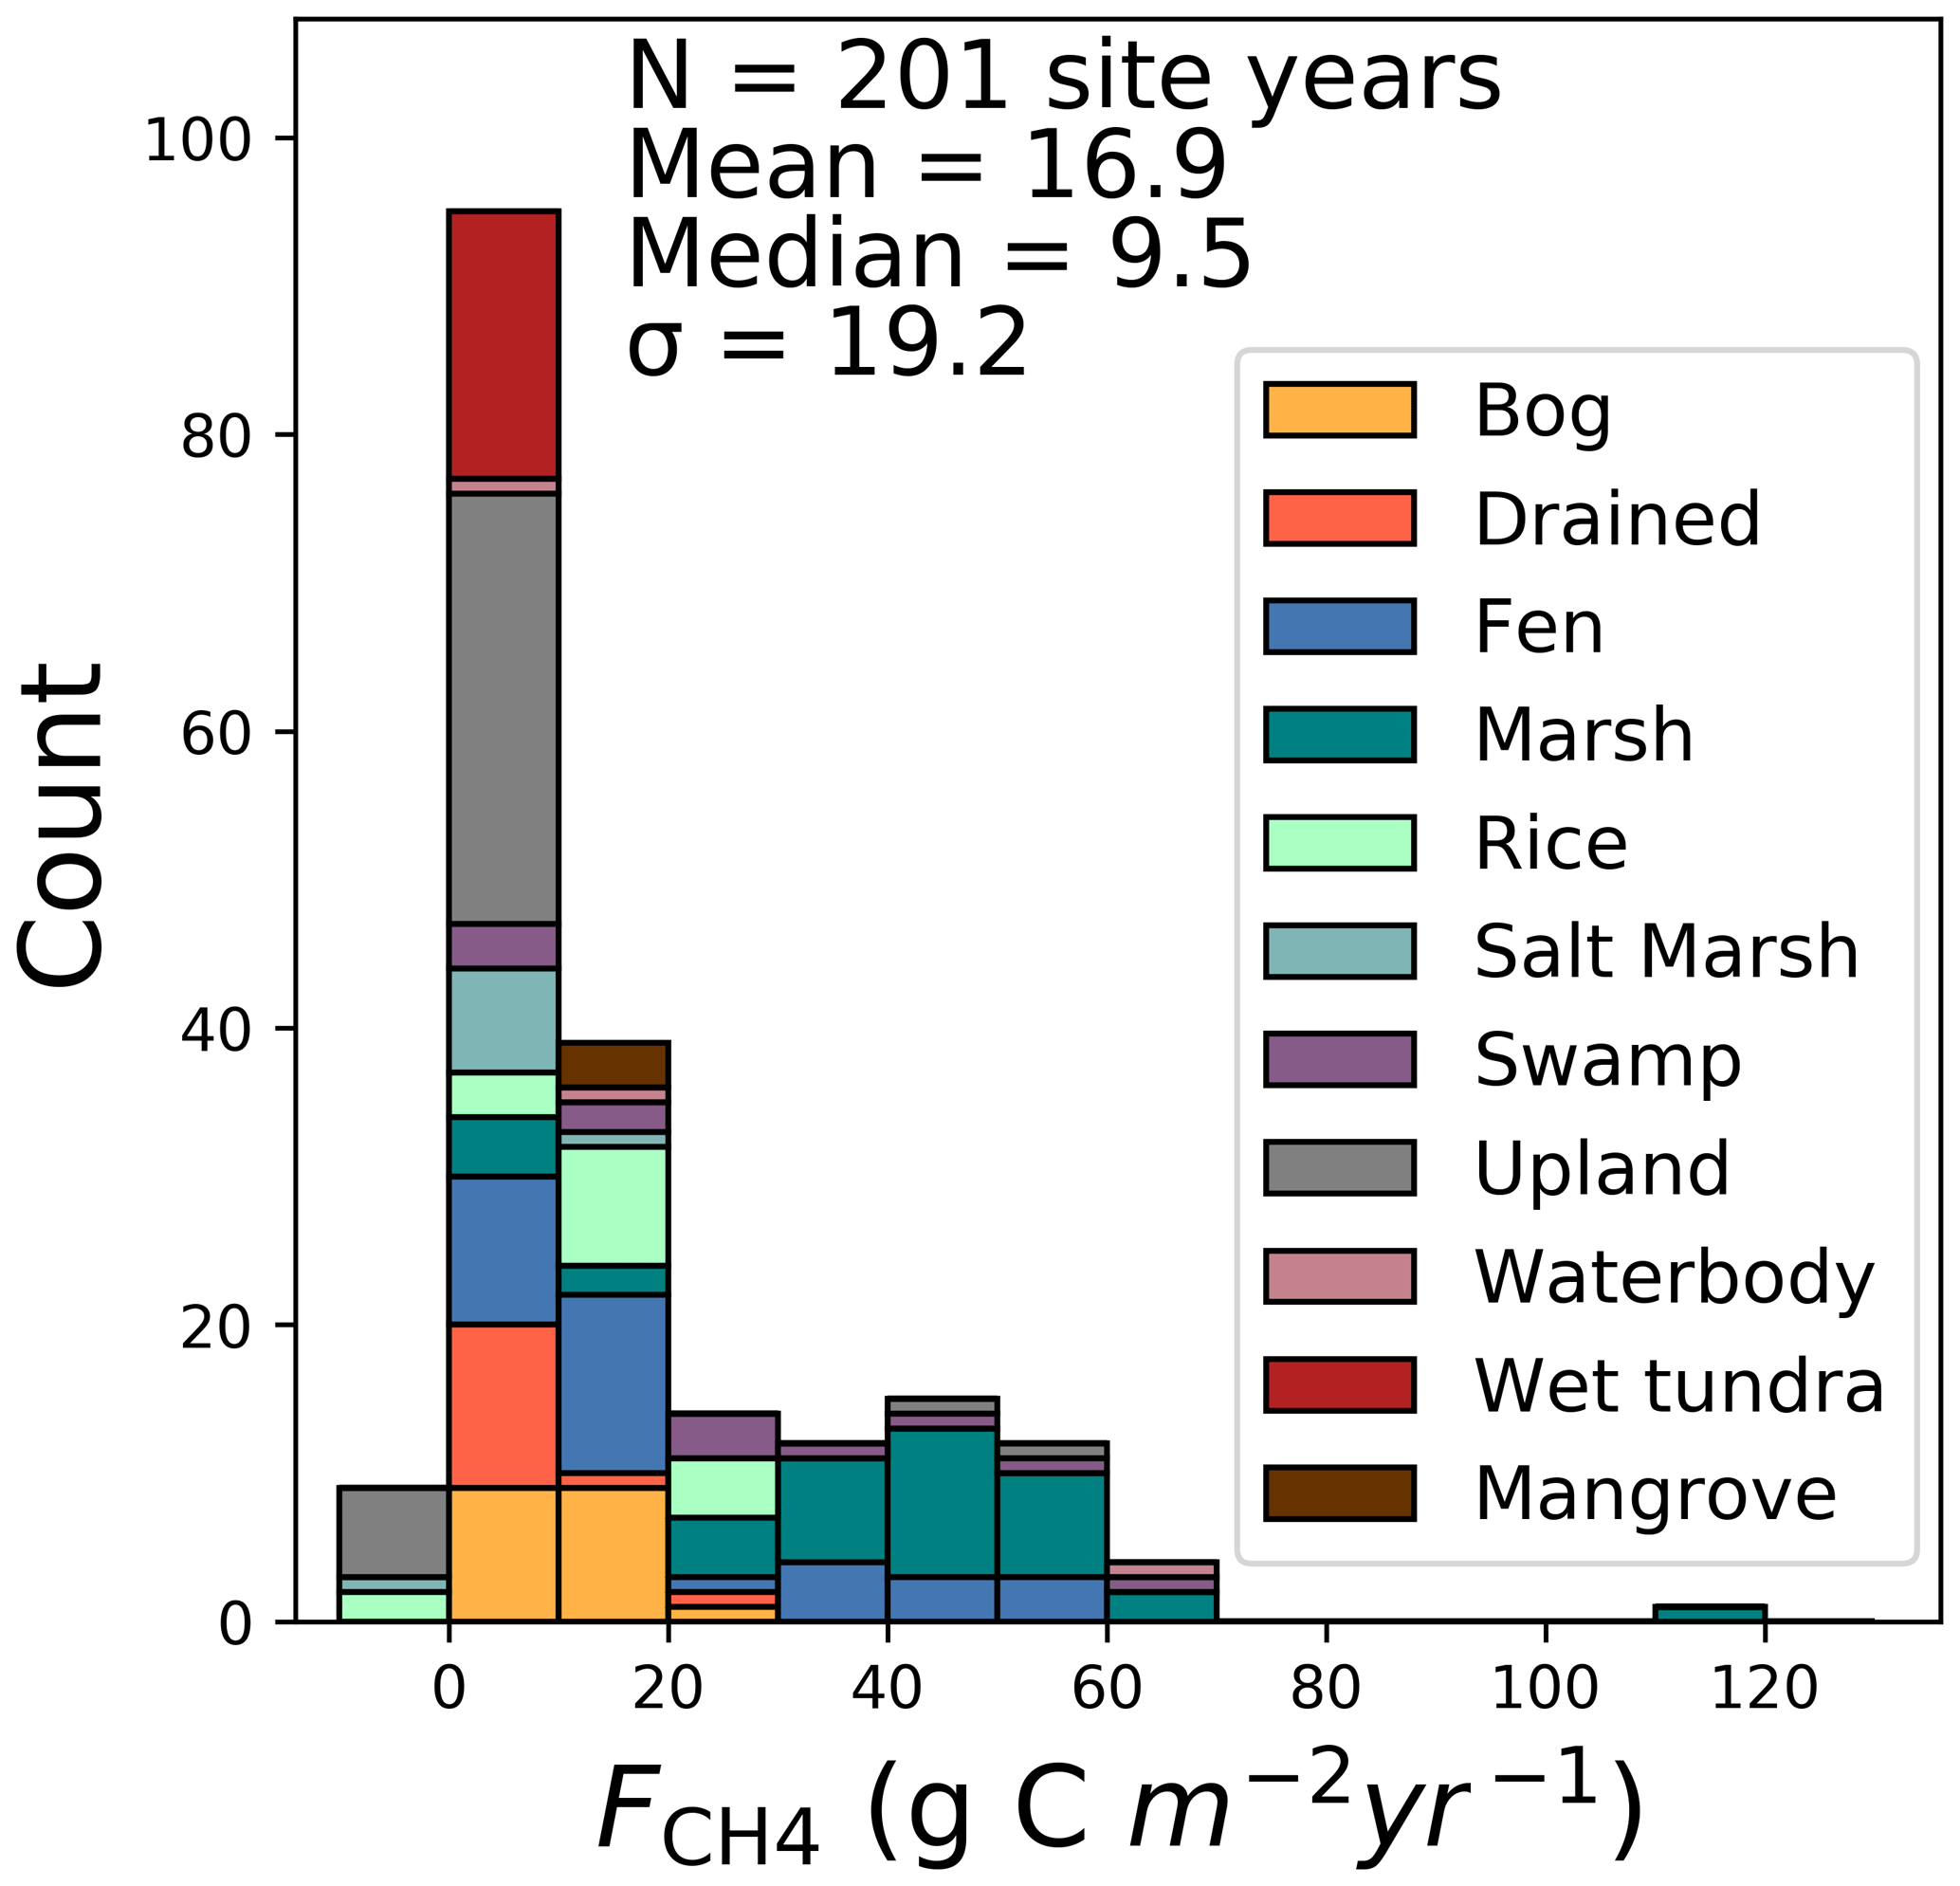
Table 1Summary table of sites grouped by ecosystem class reporting annual mean flux (Ann_Flux) and standard deviation from interannual variability (Ann_Flux_SD), site years of data, percent data cover per quarter, and median (med.) flux across site class. JFM signifies January–February–March, AMJ April–May–June, JAS July–August–September, and OND October–November–December.

3.1.2 Freshwater wetland CH4 characteristics
The FLUXNET-CH4 Version 1.0 dataset contains 42 freshwater wetlands that span 37∘ S to 69∘ N, including bogs, fens, wet tundra, marshes, and swamps, and a range of annual CH4 emission rates (Fig. 4). The majority of freshwater wetlands in our dataset emit 0–20 g C m−2 yr−1, with 10 emitting 20–60 g C m−2 yr−1, and one more than 60 g C m−2 yr−1. Differences in annual CH4 flux among wetland types is partially driven by temperature (which is often linked to site type), with mean annual air temperature explaining 51 % of the variance between sites (Fig. 5, exponential relationship). The global relationship between annual methane emissions and temperature can be described using a Q10 relationship where , with R2 and R1 being the CH4 emission rates at temperatures T2 and T1, respectively (temperature in ∘C). The Q10 based on Fig. 5 data is 2.57. We also note that annual CH4 flux from individual biomes may have different relationships with temperature, as previous work has shown biome-specific trends in CH4 flux with environmental drivers (Abdalla et al., 2016). However, there currently are not enough data points in each biome category to compare relationships between mean annual CH4 flux and temperature. Annual CH4 flux is not correlated with mean annual water table depth in FLUXNET-CH4, unlike in Knox et al. (2019), which used a subset of the FLUXNET-CH4 sites in which CH4 flux was correlated with water table depth only for sites with water table below ground for 90 % of measured days (r2=0.31, p< 0.05, n=27 site years). Freshwater wetland seasonality is further described in Sect. 3.3.
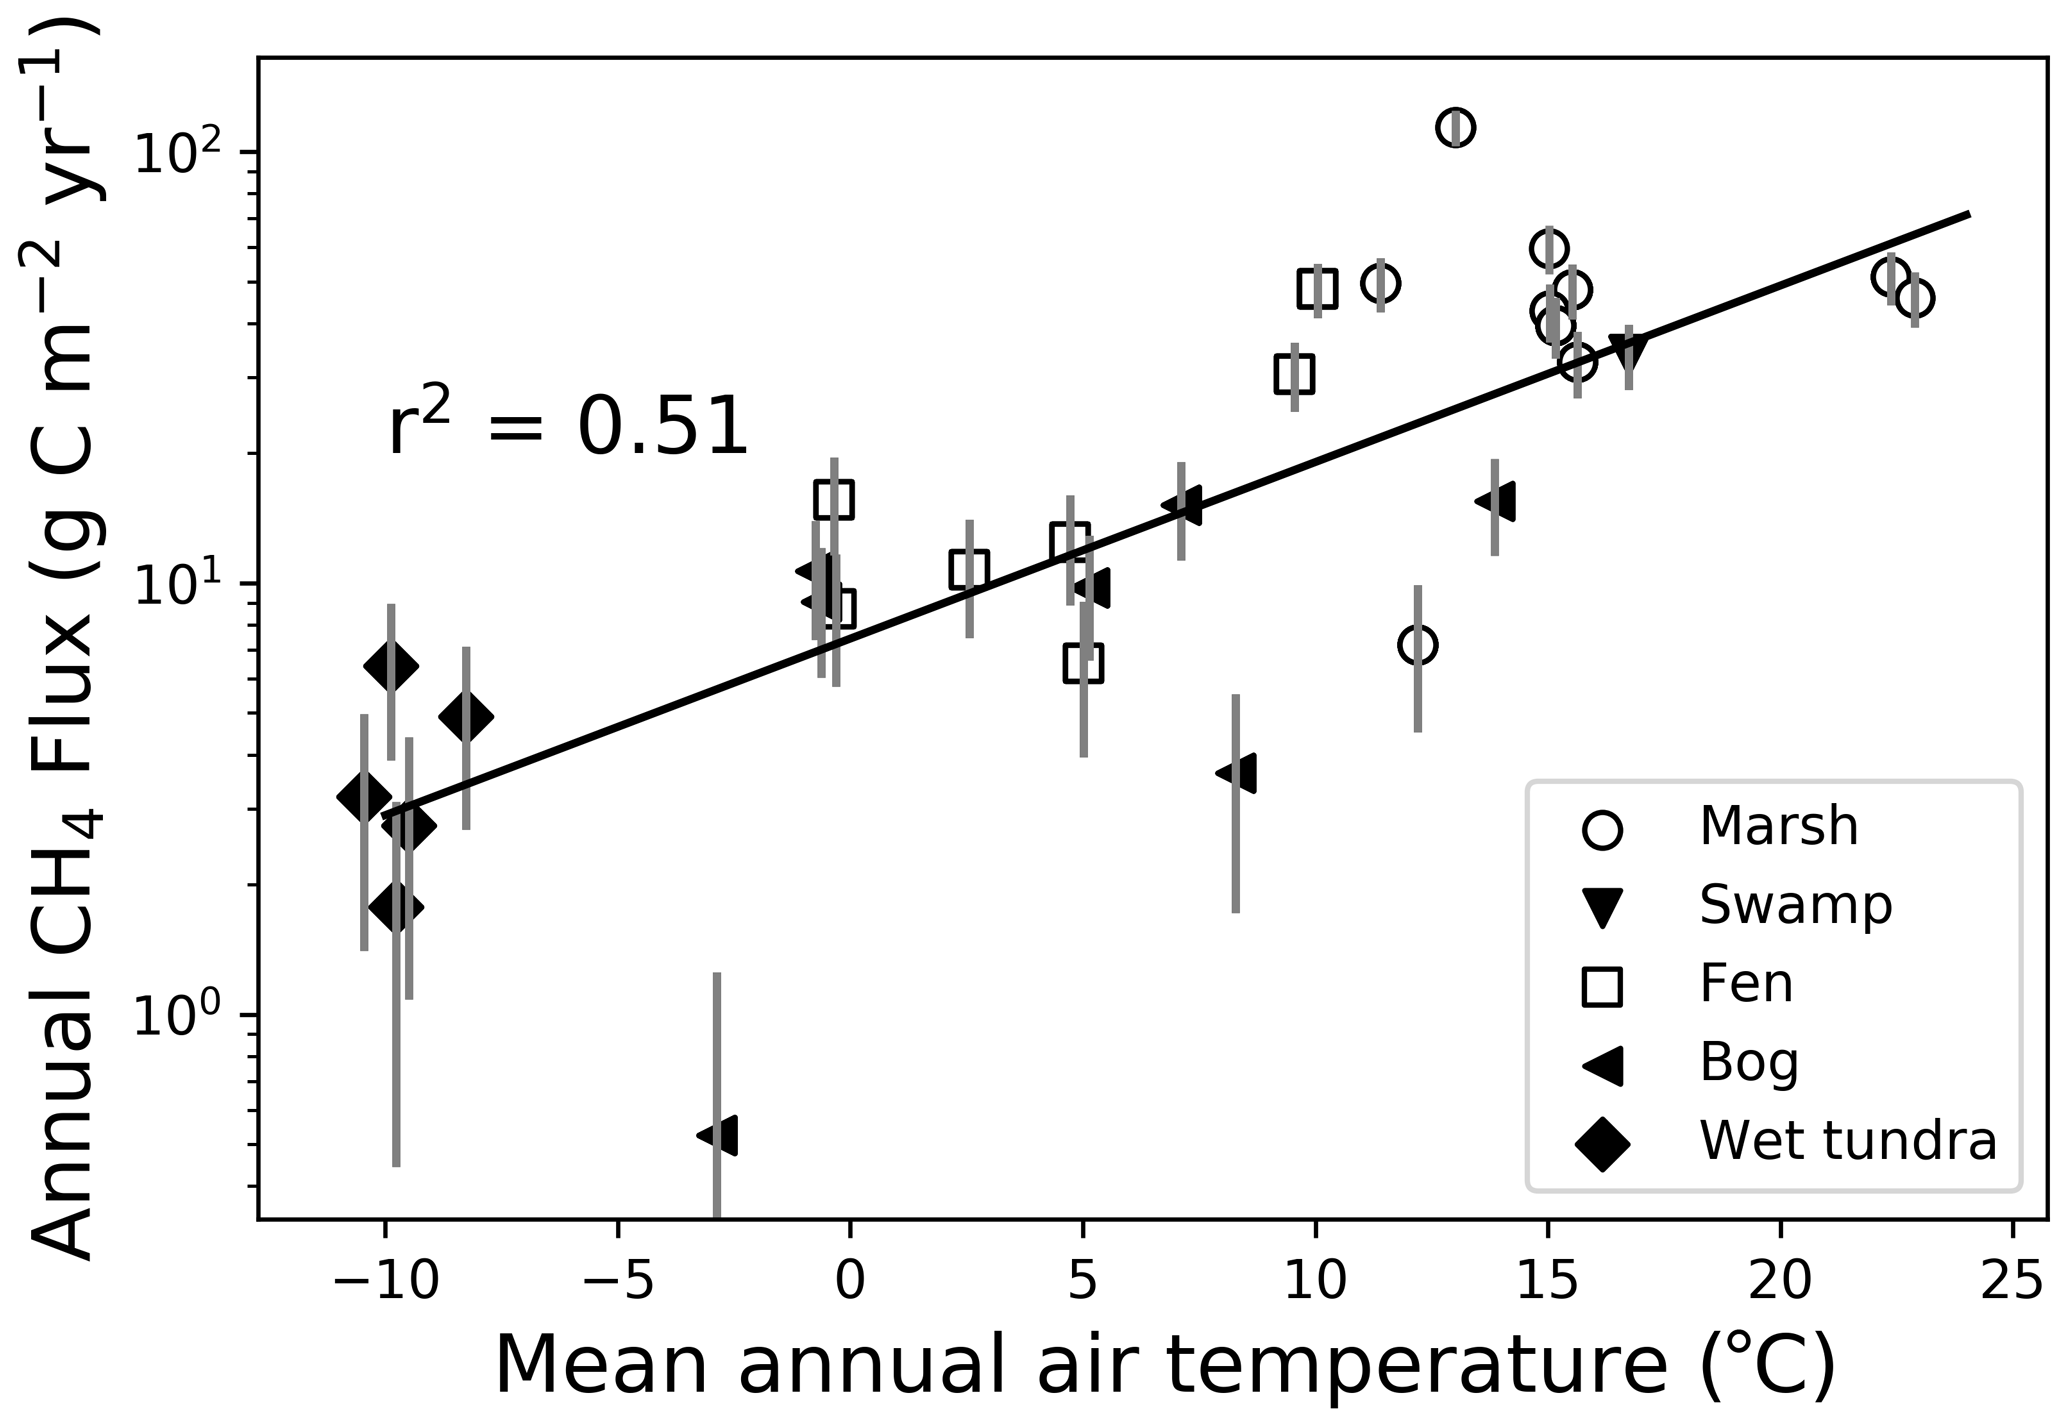
Figure 5Relationship between mean annual wetland methane (CH4) flux (g C m−2 yr−1, logarithmic scale) and mean annual air temperature (∘C) for each freshwater wetland site, with wetland type indicated by symbol. Markers represent individual site means, with vertical error bars representing the standard deviation of interannual variability.
3.1.3 Upland, rice, and urban CH4 characteristics
Upland agricultural sites are characterized by a lack of seasonal pattern in CH4 emissions, relatively low flux, and sometimes negative daily flux (i.e., CH4 uptake) averages. All of the upland non-agricultural sites in FLUXNET-CH4 Version 1.0 are net (albeit weak) CH4 sources except for the needleleaf forest site US-Ho1, which has a mean annual CH4 flux of g C m−2 yr−1 (see Table B3 for site acronyms and metadata). The average agricultural site emissions are 1.3±0.8 g C m−2 yr−1, and non-agricultural site emissions are 1.6±1.2 g C m−2 yr−1 across sites.
Rice sites (n=7) have average annual emissions across all sites of 16.7±7.7 g C m−2 yr−1 and are characterized by strong seasonal patterns, with either one or more CH4 emission peaks per year depending on the number of rice seasons and field water management. One peak is typically observed during the reproductive period for the continuously flooded sites with one rice season (i.e., US-HRC, JP-MSE) (Iwata et al., 2018; Runkle et al., 2019; Hwang et al., 2020). For sites with only one rice season but with single or multiple drainage and re-flooding periods, a secondary peak may appear before the reproductive peak (i.e., KR-CRK, IT-Cas, and US-HRA; Meijide et al., 2011; Runkle et al., 2019; Hwang et al., 2020). Two reproductive peaks appear for sites with two rice seasons (i.e., PH-RiF), and each reproductive peak may be accompanied by a secondary peak due to drainage events (Alberto et al., 2015). Even sites with one continuously flooded rice season may experience a second peak if the field is flooded during the fallow season to provide habitat for migrating birds (e.g., US-Twt; Knox et al., 2016).
The dataset has 1 year of urban data from site UK-LBT in London, England. UK-LBT observes CH4 fluxes from a 190 m tall communications tower in the center of London and has a mean annual CH4 flux of 46.5±5.6 g C m−2 yr−1. This flux is more than twice as high as the mean annual CH4 flux across all FLUXNET-CH4 sites, 16.9 g C m−2 yr−1. The London site has higher CH4 emissions in the winter compared to summer, which is attributed to a seasonal increase in natural gas usage (Helfter et al., 2016.)
3.1.4 Saltwater and mangrove wetland CH4 characteristics
Three of the five saltwater wetlands in FLUXNET-CH4 (US-Edn, US-MRM, and US-Srr) have a very low mean annual CH4 flux (see Table B2 for individual site-year CH4 flux sums and associated uncertainty) and minimal seasonality. Two other FLUXNET-CH4 saltwater sites (US-La1 and US-StJ) have significantly higher fluxes, with annual sums of 12.6±0.6 and 9.6±1.0 g C m−2 yr−1, respectively, while the mangrove site HK-MPM has annual mean fluxes of 11.1±0.5 g C m−2 yr−1. This range of CH4 fluxes across different saltwater ecosystems could be valuable for exploring the effect of salinity and different biogeochemical pathways of CH4 production, oxidation, and transport of CH4 (Bartlett et al., 1987; Poffenbarger et al., 2011). Saltwater wetlands along the coast have unique CH4 dynamics attributable to the presence of abundant electron acceptors, most importantly sulfates which inhibit methanogenesis (Pattnaik et al., 2000; Mishra et al., 2003; Weston et al., 2006) but at low concentrations can have no effect (Chambers et al., 2011) or even increase methanogenesis (Weston et al., 2011). In fact, estuarine wetlands with moderate salinity can still be significant sources of CH4 (Liu et al., 2020). Even under sulfate-rich conditions, high CH4 production can be found via methylotrophic methanogenesis (Dalcin Martins et al., 2017; Seyfferth et al., 2020,) or because the processes of sulfate reduction and methanogenesis are spatially separated (Koebsch et al., 2019). Consequently, representing the biophysical drivers of ecosystem-scale CH4 fluxes in non-freshwater wetlands is challenging and may represent a combination of competing or confounding effects (Vazquez-Lule and Vargas, 2021).
3.2 Freshwater wetland representativeness
We evaluated the representativeness of freshwater wetland sites in the FLUXNET-CH4 Version 1.0 dataset against wetlands globally, based on bioclimatic conditions of our sites. When evaluating bioclimatic variables individually, the distribution of freshwater wetlands across the network was significantly different from the global distribution (alpha > 0.05; two-tailed Kolmogorov–Smirnov tests; see Table B4). We exclude wetlands classified as “salt marsh” in this representativeness analysis and the seasonality analysis below because of the unique CH4 flux dynamics in saltwater ecosystems (as discussed in Sect. 3.1.4), though we note that some of the coastal wetlands included in the freshwater analysis periodically experience brackish water (i.e., US-Myb, US-Sne).
When considering the four bioclimatic variables, MAT, LE, EVI, and SRWI in a PCA, we found that our tower network generally samples the bioclimatic conditions of global wetland cover, but some noticeable gaps remain (Fig. 6). Three clusters of the world's wetland-dense regions are identified but are not equally sampled by the network. A cluster of low-temperature wetlands is sampled by a large number of high-latitude sites. The other two wetland clusters are not as well sampled: a high-temperature and LE cluster is represented only by two towers (ID-Pag and MY-MLM), while drier and temperate and subtropical wetlands including large swathes of the Sahel in Africa only have a site in Botswana (BW-Npw) as their closest analog tower.
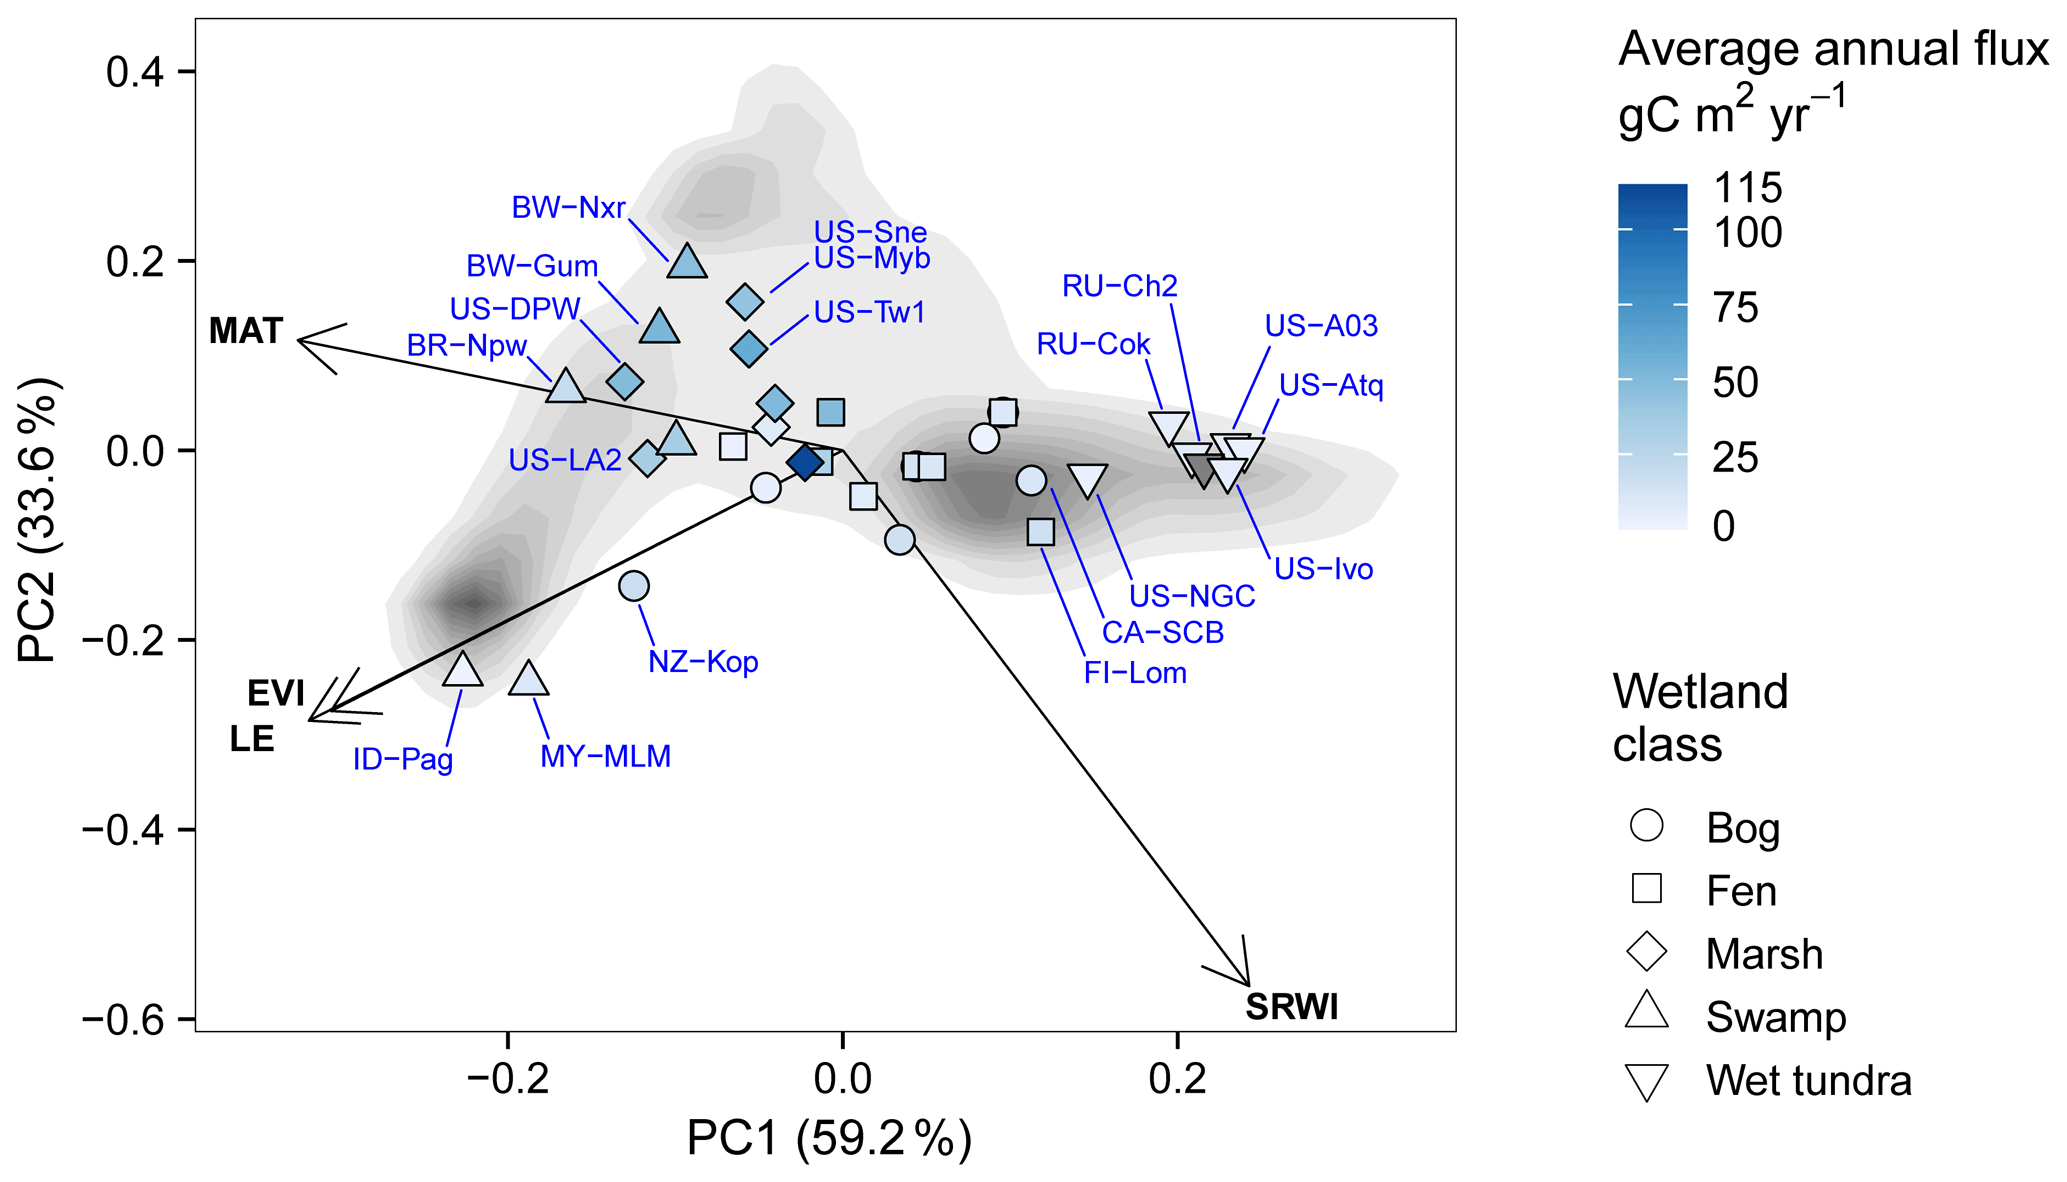
Figure 6Principal component analysis displaying the distribution of freshwater wetland sites (points) along the two main principal components together accounting for 91.9 % of variance. Tower sites are represented as points with shapes indicating their wetland type and color shade representing the annual methane (CH4) flux (gray points represent sites for which < 6 months of flux data were available to estimate annual budget). Sites codes are labeled in blue text for selected sites deviating from average conditions. Loading variables are represented by the arrows: mean annual temperature (MAT), simple ratio water index (SRWI), latent heat flux (LE), and enhanced vegetation index (EVI). The background shades of gray are a qualitative representation of the density of global wetland pixels and their distribution in the PCA climate space, with darker color representing higher densities (excluding Greenland and Antarctica). Only grid cells with > 5 % average wetland fraction according to the WAD2M over 2000–2018 are included (Zhang et al., 2020).
Evaluating the bioclimatic dissimilarity of global wetlands to the FLUXNET-CH4 network shows the least captured regions are in the tropics (Fig. 7a). Sparse coverage in the tropics also means that the few existing towers occupy a critical place in the network, particularly as tropical wetlands are the largest CH4 emitters (Bloom et al., 2017; Poulter et al., 2017). Highly dissimilar wetlands are limited in extent and distributed across all latitudes, but the average dissimilarity is higher in north temperate (55 to 65∘) and tropical (−5 to 5∘) latitudes (Fig. 7b). To evaluate the importance of individual towers in the network, we estimated the geographical area to which it is most analogous in bioclimate space (Fig. 7c). We found that some towers have disproportionately large constituencies (i.e., wetland areas that share the same closest bioclimatic analog tower). Towers in Indonesia (ID-Pag), Brazilian Pantanal (BR-Npw), and Botswana floodplains (BW-Nxr) represent the closest climate analog for much of the tropics (678 000, 300 000, and 284 000 km2, respectively), while CA-SCB represents a vast swath (291 000 km2) of boreal and arctic regions (Fig. 7d).
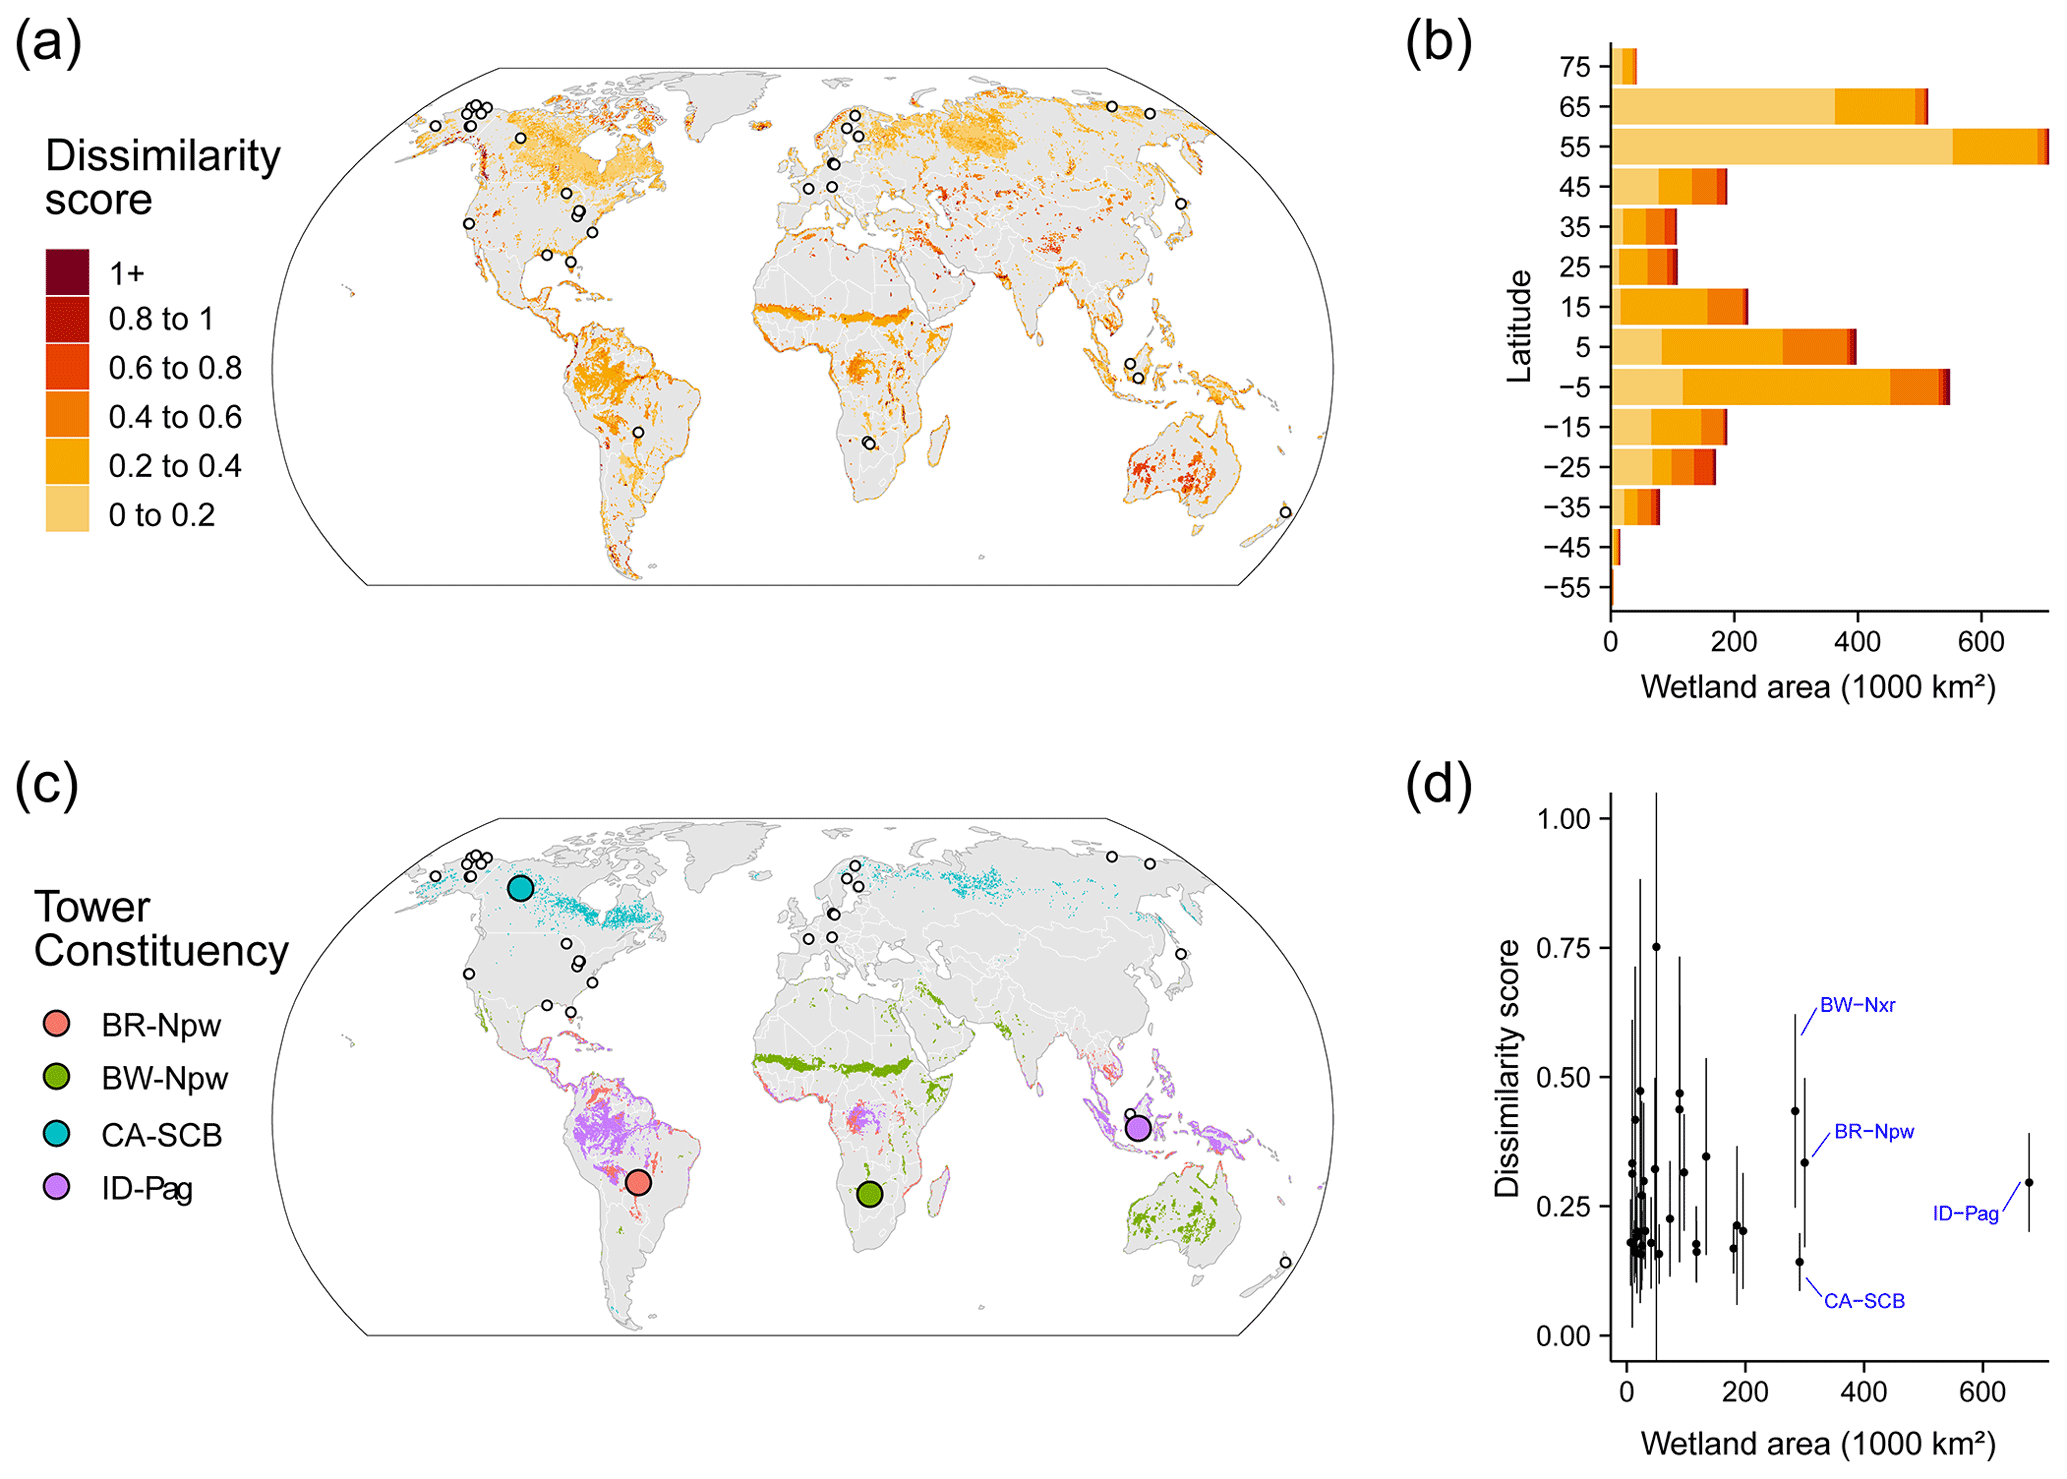
Figure 7(a) Distance in bioclimatic space between global land surface and the FLUXNET-CH4 Version 1.0 tower network (gray areas indicate no mapped wetlands). The Euclidean distance was computed on the four bioclimatic variables and was then standardized by the average distance within the network. Most of the land surface has a dissimilarity score lower than 1, meaning these areas are closer than the average tower distance (lower dissimilarity score means a similar bioclimate to that represented by towers in the network). However, this pattern reflects more the sparsity of the tower network than a similarity of the land surface to the network. Areas with < 5 % coverage by wetlands were excluded to focus on wetland-dense regions. (b) Latitudinal distribution of dissimilarity score, (c) map of the four largest tower constituencies, and (d) scatterplot of wetland area in each tower constituency plotted against the average dissimilarity score (point) and ± standard deviation (error bar).
Our assessment of wetland CH4 tower coverage determines the ability of our dataset to represent global wetland distributions and highlights some clear representation gaps in the network, particularly in tropical and humid regions. Other geographic regions such India, China, and Australia, where towers exist but are not included in the current network, should be prioritized when expanding the network even though they are not among the most distant areas to the current network. Similar representativeness assessments have been developed for CO2 tower networks to identify gaps and priorities for expansion (Jung et al., 2009). To improve the geographic coverage of the network for representing global-scale fluxes, locations for new tower sites can be targeted to cover bio-climatically distant areas from the current network (Villarreal et al., 2019). Candidate regions for expansion that are both high CH4 emitting (Saunois et al., 2020) and located in under-sampled climates are the following: African Sahel, Amazon Basin, Congo Basin, and Southeast Asia. Climatic conditions over boreal and arctic biomes are generally better represented (primarily at lower elevations), but there is scope to expand the network in wetland-dense regions like the Hudson Bay Lowlands and North Siberian Lowlands. Moreover, establishing sites in other ecosystem types, especially lakes and reservoirs (see Deemer et al., 2016; Bastviken et al., 2011; Matthews et al., 2020) in most climatic zones would help capture CH4 fluxes from these ecosystems.
Understanding the representativeness of the network is essential when inferring general patterns of flux magnitude, seasonality, and drivers from the tower data (Villarreal et al., 2018). We produced a first-order representativeness of average bioclimatic conditions, but temporal representativeness (across seasons, climate anomalies, and extreme events) is particularly needed given the episodic nature of CH4 fluxes (Chu et al., 2017; Mahecha et al., 2017; Göckede et al., 2019).
Assessing representation of wetland CH4 sites is complicated by the fact that wetlands occupy only a fraction of most landscapes (except wetland-dense regions such as North Siberian Lowlands, Hudson Bay Lowlands, Congo Basin, etc.) and that not all relevant factors affecting CH4 production and consumption could be considered in our analysis. For instance, our assessment of representation did not consider wetland types as such maps are limited by the inherent difficulties in remotely sensing wetland features (Gallant, 2015). The attribution of representativeness is further complicated by the fact that many EC tower locations are subject to small-scale variability within the field of view, or footprint, of the sensor. Consequently, the individual time steps within EC flux time series may represent a mixture of different wetland types or different fractions of wetland contribution to the total CH4 flux, varying with wind direction, atmospheric stability, or season (Chu et al., 2021). This further complicates upscaling efforts. Additionally, this representativeness analysis did not apply weights to the drivers to reflect their varying influence on CH4 flux. Such weights can be included in future versions as they are generated by a cross-validated machine learning approach (Jung et al., 2020). Future efforts could include the dissimilarity index from this analysis as a metric of extrapolation in a CH4 flux upscaling effort.
3.3 Freshwater wetland flux seasonality
3.3.1 Seasonal flux comparisons by latitudinal bands
CH4 flux and seasonality varied substantially across latitudinal bands (northern, temperate, subtropical, and tropical) (Fig. 8). Annual CH4 fluxes for temperate, and subtropical sites were significantly higher than for northern sites (8.7 ± 5.0, 29.7 ± 25.2, 40.1 ± 14.6, and 24.5 ± 20.7 g C m−2 yr−1 for northern, temperate, subtropical, and tropical, respectively, and p < 0.0001 using Kruskal–Wallis and post hoc comparisons; Fig. 8a), and tropical sites were similar to all other latitudinal bands likely because of their small sample size. The ratio of seasonal amplitude to peak flux provides a measure of the relative seasonal increase in emissions compared with baseline, in which a ratio of 0 indicates no seasonal change in amplitude, a ratio of 1 indicates the off-season flux is zero, and values over 1 mean the off-season baseline CH4 fluxes were negative (i.e., uptake). Average amplitude to peak flux ratios were similar across all latitudinal bands (0.9 ± 0.1, 0.9 ± 0.1, 0.9 ± 0.1, and 1.0 ± 0.7 for northern, temperate, subtropical, and tropical, respectively; Fig. 8b). The spring increase in CH4 emissions began later in northern sites compared with temperate and subtropical sites (end of May versus April, respectively, and p=0.001; Fig. 8c), while tropical sites vary widely in elevated emission season start date. Northern sites also had shorter elevated CH4 flux season lengths (138 ± 24 d) compared to temperate sites (162 ± 32 d), and both were shorter than subtropical sites (209 ± 43 d; p < 0.0001; Fig. 8e). On average, CH4 flux peaked earlier for temperate sites compared to northern (p=0.008) and subtropical sites (p=0.02; middle to late July compared with early August; Fig. 8f), while tropical sites again vary widely. Given their unique seasonality and low number of site years (n=9), tropical systems are discussed separately in Sect. 3.3.3 and are not included in the comparisons in the remainder of this section. While our results on CH4 seasonality corroborate expected trends for these latitudinal bands, they provide some of the first estimates of CH4 seasonality parameters and ranges across a global distribution of sites.
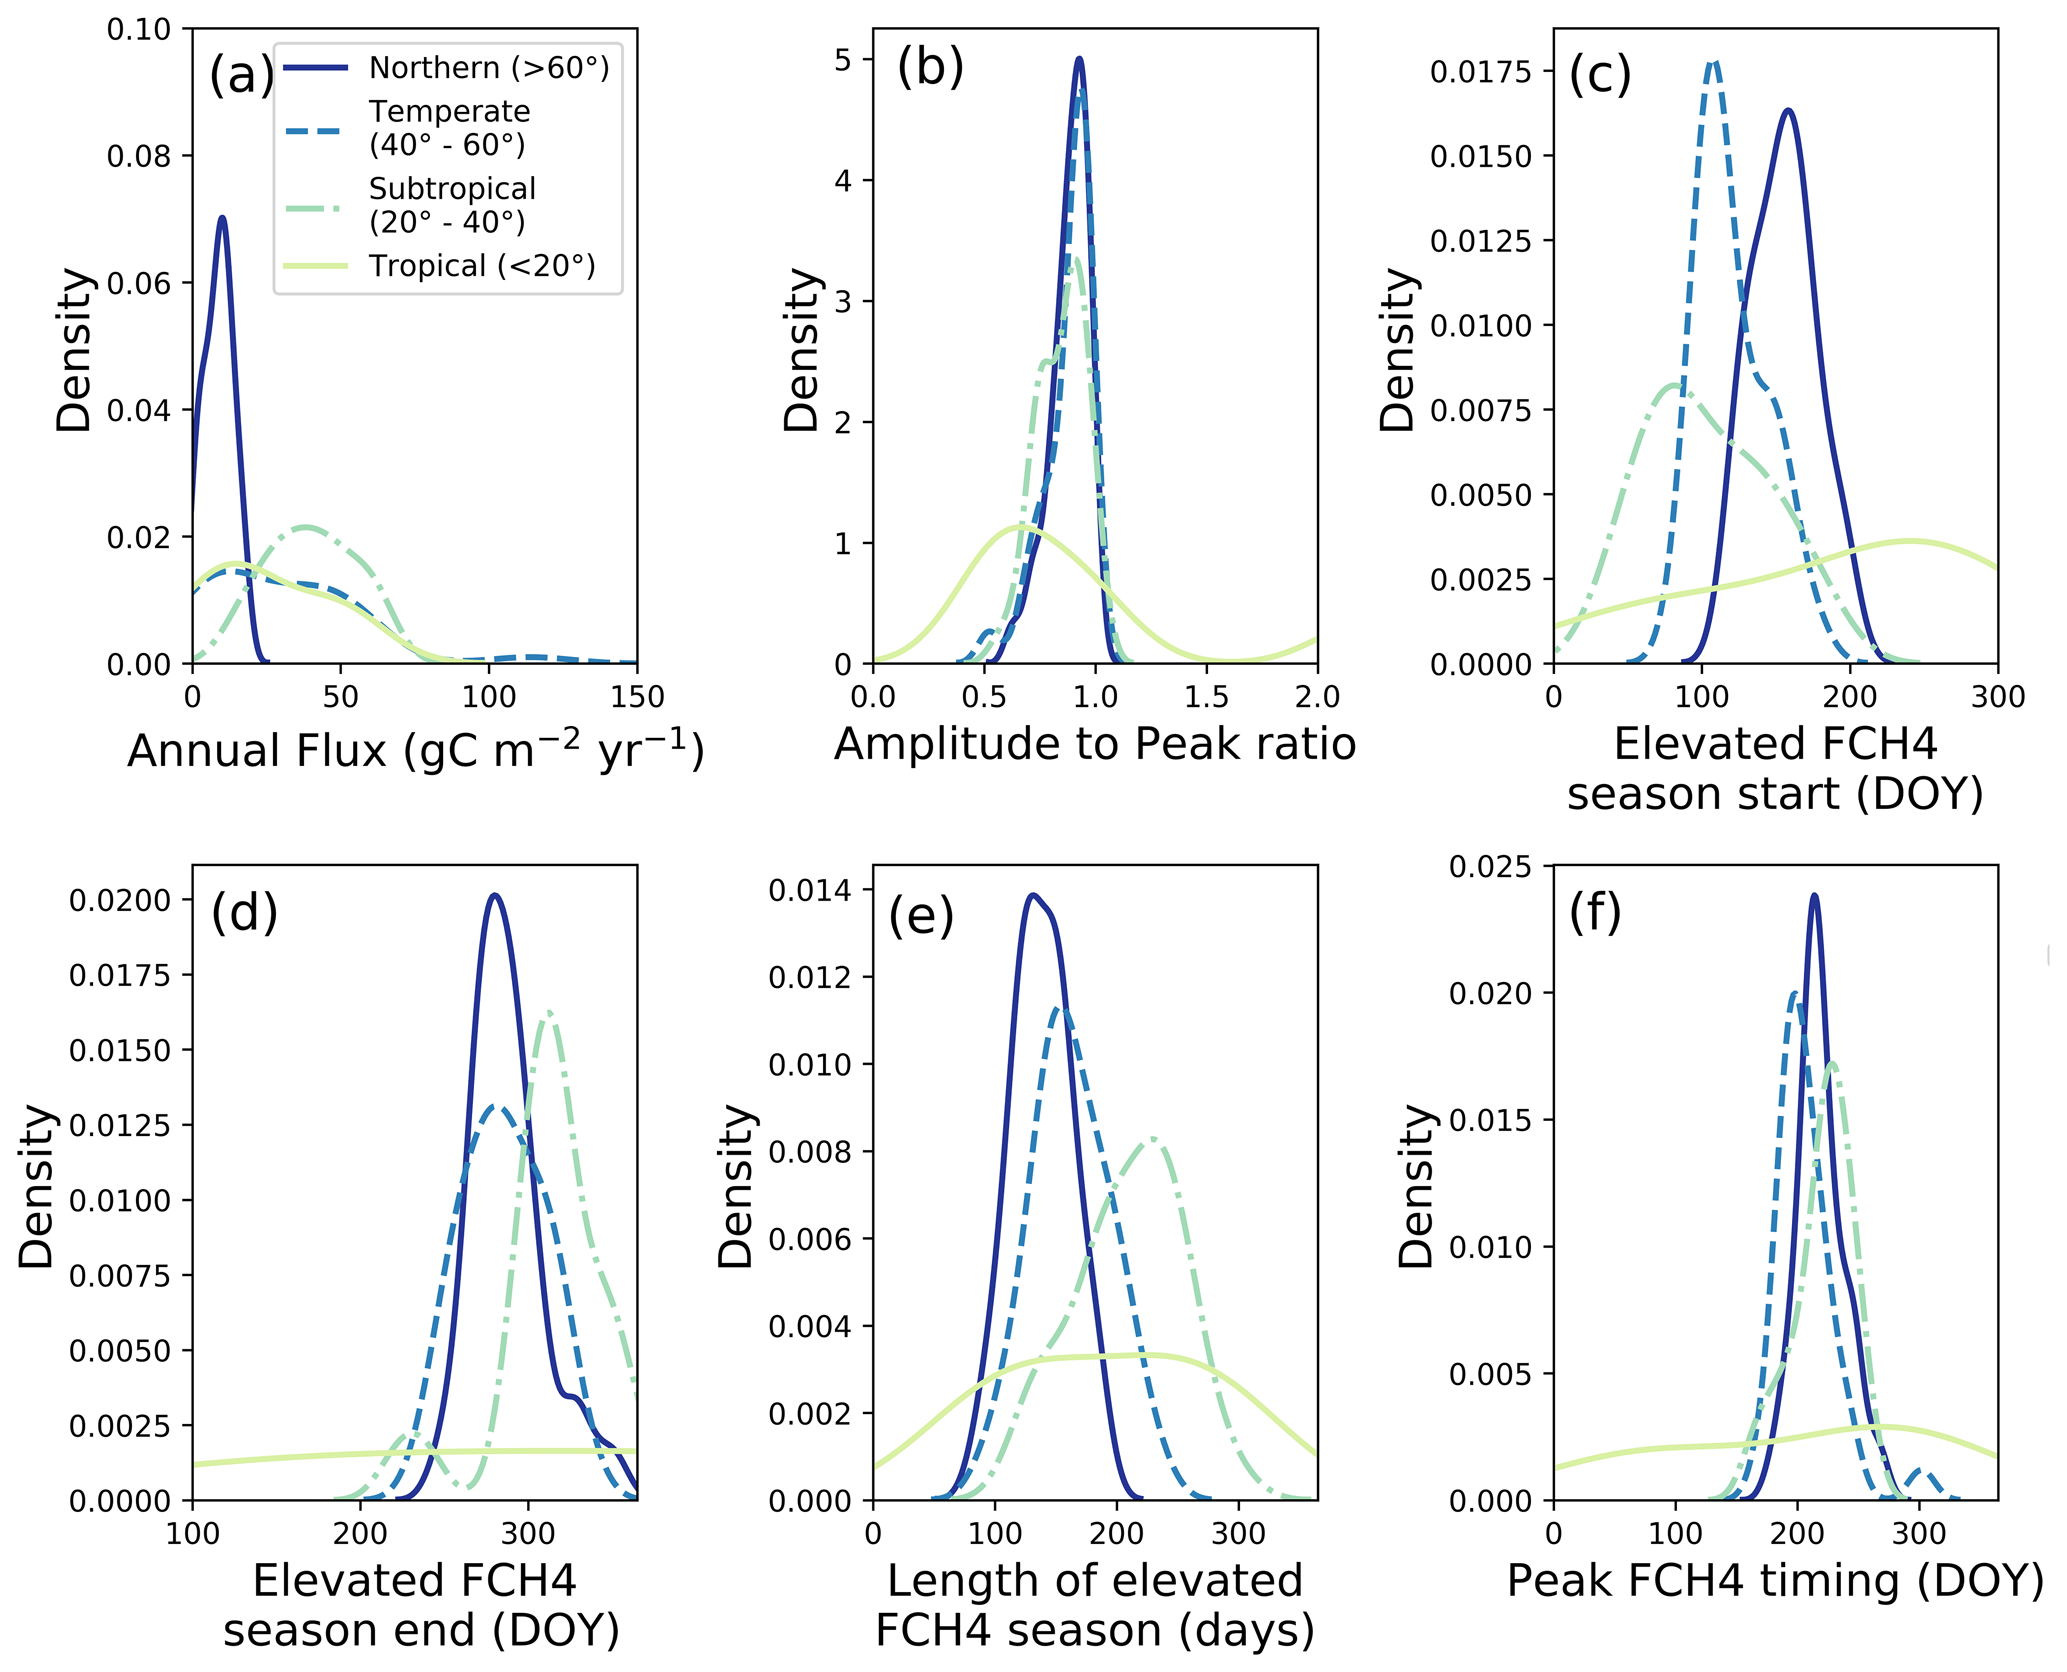
Figure 8(a) Annual methane (CH4) flux (g C m−2 yr−1), (b) ratio of seasonal amplitude to seasonal peak, where values of 0 indicate uniform annual CH4 flux, values of 1 indicate zero off-season fluxes, and values exceeding 1 indicate negative off-season fluxes, (c) CH4 flux (FCH4) elevated emission season start by day of year (DOY), (d) FCH4 elevated emission season end by DOY, (e) length of elevated CH4 flux season (days), and (f) DOY of peak FCH4. Northern (dark blue, solid line), temperate (blue, dashed line), sub-tropical (green, dot-dash line), and tropical (light green, solid line) wetlands plotted using the kernel density function. Each panel has lines that represent latitudinal bands as follows: northern (> 60∘), temperate (between 40 and 60∘), subtropical (between 20 and 40∘), and tropical (< 20∘), though the site-year totals vary between these groups (n=57, n=36, n=39, and n=9 respectively). All total CH4 flux values and elevated season start values are positive, and the apparent continuation of the data distribution into negative values is an artifact of the kernel density function. Southern Hemisphere sites below 20∘ S were shifted by 182 d to make summer the middle of the year for comparability with Northern Hemisphere sites.
We found that latitudinal groups showed strong differences in absolute CH4 flux across quarters and narrower differences in percentage of annual CH4 flux (Fig. 9a versus 9b). Thus, the AMJ quarter had a similar relative contribution to the annual CH4 flux across latitudes regardless of the absolute annual CH4 flux. CH4 fluxes (Fig. 9a) were highest during JAS for northern, temperate, and subtropical sites and highest in AMJ and JAS for temperate sites (p < 0.01). Though CH4 fluxes in northern sites are most commonly measured during warm summer months (Sachs et al., 2010; Parmentier et al., 2011), fluxes in JFM and OND (50 % of the yearly duration) on average make up 18.1 ± 3.6 %, 15.3 ± 0.1 %, and 31.2 ± 0.1 % (northern, temperate, and subtropical, respectively) of annual emissions. This pattern indicates that a substantial fraction of annual CH4 fluxes occur during cooler months. The contribution of non-growing season CH4 emissions to annual CH4 fluxes has previously been described for arctic and boreal regions (Zona et al., 2016; Treat et al., 2018), and our analysis suggests comparable contributions in temperate and subtropical systems for the same quarterly periods.

Figure 9(a) Quarterly contribution to total annual CH4 flux (in g C m−2) and (b) percentage of annual CH4 flux. Sites were divided into northern (> 60∘ N), temperate (40–60∘ N), and subtropical (20–40∘ N). Quarters with continuous data gaps exceeding 30 d were excluded. We used the following quarterly periods: January–February–March (JFM), April–May–June (AMJ), July–August–September (JAS), and October–November–December (OND). Tropical sites are discussed separately in Sect. 3.3.3 because of their unique seasonality and low number of sites.
3.3.2 Predictors of CH4 flux phenology
The start of the elevated CH4 flux season, and how long the elevated flux season lasts, correlated strongly with mean annual air temperature (Fig. 10; p < 0.0001 for each). Methane flux began to increase roughly 2 months earlier in the warmest systems (mean annual temperature > 20 ∘C) compared to the coldest (mean annual temperature near −10 ∘C), though several of the warmer sites had high variability. Our data suggest that the CH4 season started 2.8 ± 0.5 d earlier for every degree Celsius increase in mean annual temperature (Fig. 10a). In contrast, the end of the CH4 emission season was not correlated with mean annual temperature, but a positive trend existed despite high variability at the warmest and coldest sites (Fig. 10b). The high variability seen in the end of the CH4 season at northern sites is important to note and would likely be better resolved by incorporating other seasonality or phenological characteristics, such as moisture, active layer depth, and plant community composition (e.g., Kittler et al., 2017). Plants with aerenchymatous tissue, for example, influence the timing of plant-mediated CH4 flux and are a key source of uncertainty when predicting CH4 seasonality for northern wetlands (Xu et al., 2016; Kwon et al., 2017). Despite the relative lack of trend with season end date, the season length was still positively correlated with mean annual temperature, with the warmest sites having roughly 3 more months of seasonally elevated CH4 emissions than the coldest sites (Fig. 10c). CH4 season length increased 3.6 ± 0.6 d for every degree Celsius increase in mean annual temperature (note that these relationships are correlations, and we cannot disentangle causality with this analysis). Temperature is highly correlated with other parameters (i.e., radiation, days of snow cover, etc.), so CH4 flux is also likely to correlate with other environmental parameters.

Figure 10The (a) start of the elevated methane (CH4) emission season (y=-2.8x+130, with “x” in ∘C and “y” in day of year, DOY), (b) the end of the elevated emission season in DOY, and (c) the length of the emission season with mean annual site air temperature (, with “x” in ∘C and “y” in days). Each point represents a site year of data, and all reported r2 values are significant to p< 0.0001. Tropical sites are discussed separately in Sect. 3.3.3.
Although the spring onset of increasing CH4 emissions correlated with mean annual air temperature, on average it lagged behind the spring increase in the shallowest soil temperatures by 31 ± 40 d (Fig. 11; lag is significantly different than zero, and p < 0.001), with very few instances of CH4 emissions beginning before seasonal soil temperatures increase (and by 20 ± 50 d for the deepest temperature probes). In contrast, for roughly half of the sites, CH4 emission increased prior to seasonal GPP (a proxy for fresh substrate availability) increases. This suggests that the initiation of increased CH4 fluxes at the beginning of the season was not limited by availability of substrate derived from recent photosynthates. Additionally, the onset of CH4 fluxes tended to occur closer to the onset of soil temperature increase for cooler temperature sites (sites with later start dates tend to be cooler; Fig. 11a). This result is likely attributable to the direct influence of increased temperature on microbial processes (Chadburn et al., 2020), as well as the indirect influences of snowmelt, both via release of CH4 from the snowpack and a higher water table leading to more CH4 production (Hargreaves et al., 2001; Tagesson et al., 2012; Mastepanov et al., 2013; Helbig et al., 2017). These observed trends hold for the entire temperature or GPP range of freshwater wetland sites but are not necessarily applicable within individual latitudinal bands.
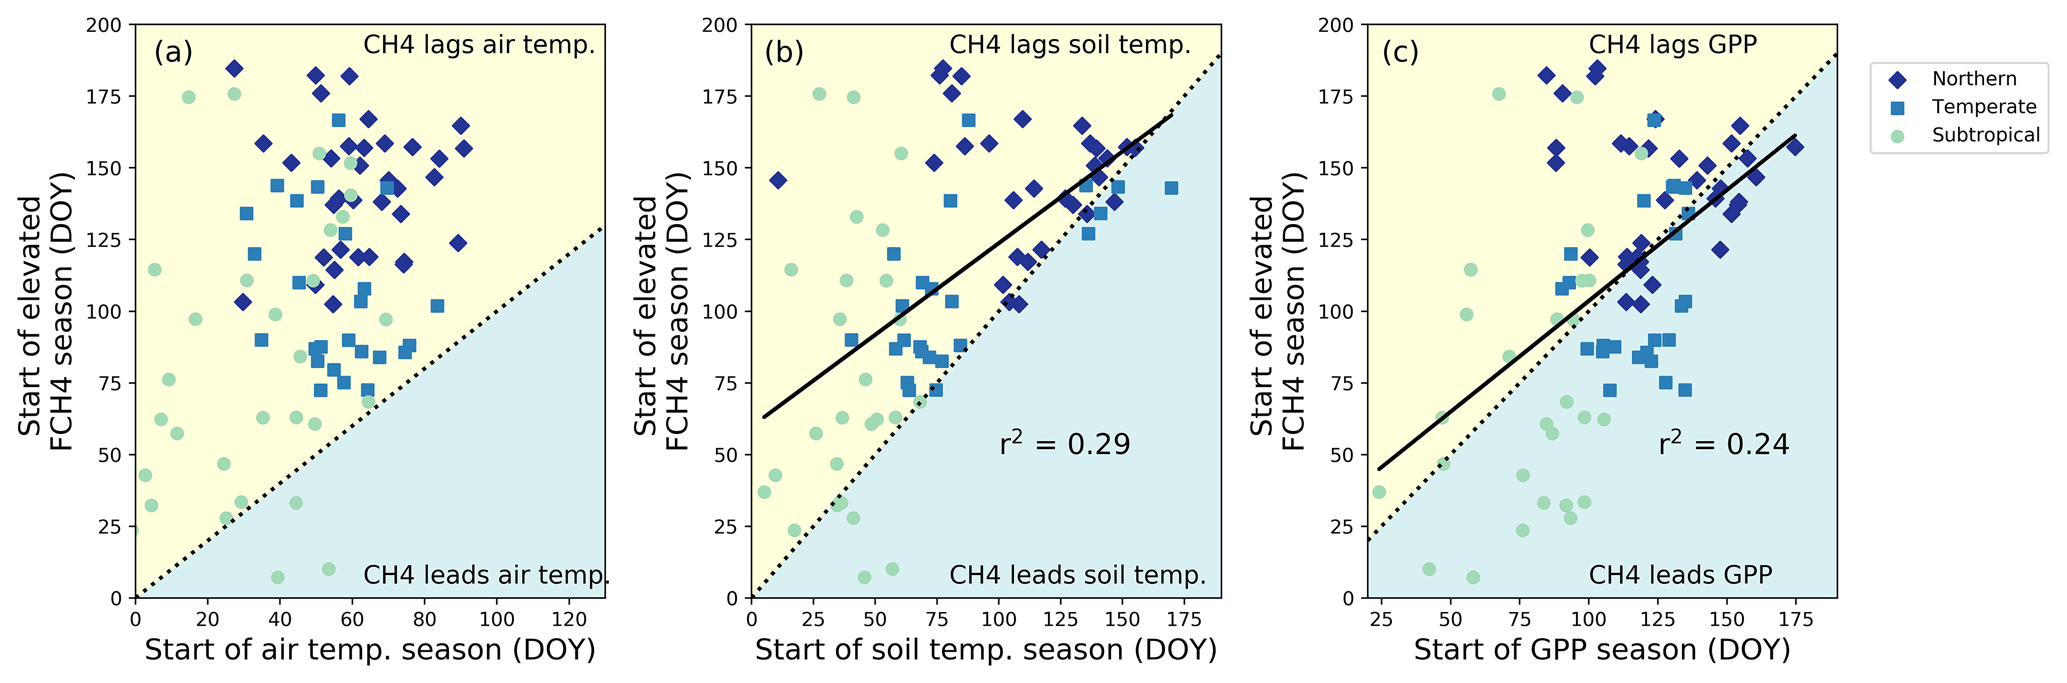
Figure 11Relationship between the onset of the methane (CH4) emission season to (a) the beginning of the air warming by day of year (DOY), (b) soil warming at the shallowest probe depth per site by DOY, and (c) gross primary productivity (GPP) increase for the subset of sites with soil temperature data by DOY. Each point represents a site year of data. Dashed lines represent a 1:1 relationship, and solid lines are significant (p < 0.05) regression fits. On average, the CH4 emission season lags behind the soil temperature increase by 31 ± 40 d and is more synchronous with GPP.
In contrast with the CH4 season start timing, the timing of the CH4 peak did not correlate with the timing of either the soil temperature peak or the GPP peak (Fig. A1). For 63 % of the sites, the average timing of peak CH4 emissions lagged behind the soil temperature peak, and at 83 % of the sites average peak CH4 lagged behind peak GPP (Fig. A1). Although there was no simple relationship between absolute CH4 peak timing and the environmental drivers we investigated, there was a correlation (p=0.0005) between the relative timing of peak CH4 compared to season onset (calculated as described in Sect. 2.3) and mean annual air temperature (Fig. 12a). For cooler sites, the peak of seasonal CH4 emissions occurred closer to the onset of the CH4 emission season than the end of the season, resulting in an asymmetrical seasonal CH4 flux shape that is illustrated in Fig. 2a. Soil temperature also peaked earlier in the season for cooler wetlands, though the relationship is not as pronounced (p=0.009; Fig. 12b). In contrast, GPP peaked later in the season for cooler wetlands (p=0.009, Fig. 12c). Previous work on Arctic sites (sites US-Ivo, US-Beo, US-Atq, US-Bes, and RU-CH2) highlighted the asymmetrical annual CH4 peak, with higher fall emissions being attributed to the “zero curtain” period when soil below the surface remains thawed for an extended period of time due to snow insulation (Zona et al., 2016; Kittler et al., 2017). Furthermore, soils can stay above the “zero curtain” range for an extended time into the fall and winter (Helbig et al., 2017), which may also be caused by snow insulation. The rapid onset of emissions in the spring following snowmelt could be attributed to the release of accumulated CH4 (Friborg et al., 1997), and other high latitude sites have seen similarly sharp increases in CH4 emissions at snowmelt (Dise, 1992; Windsor, 1992). However, not all studies in high latitudes have observed asymmetrical CH4 emission peaks, pointing to the inherent complexity of these ecosystems (Rinne et al., 2007; Tagesson et al., 2012).
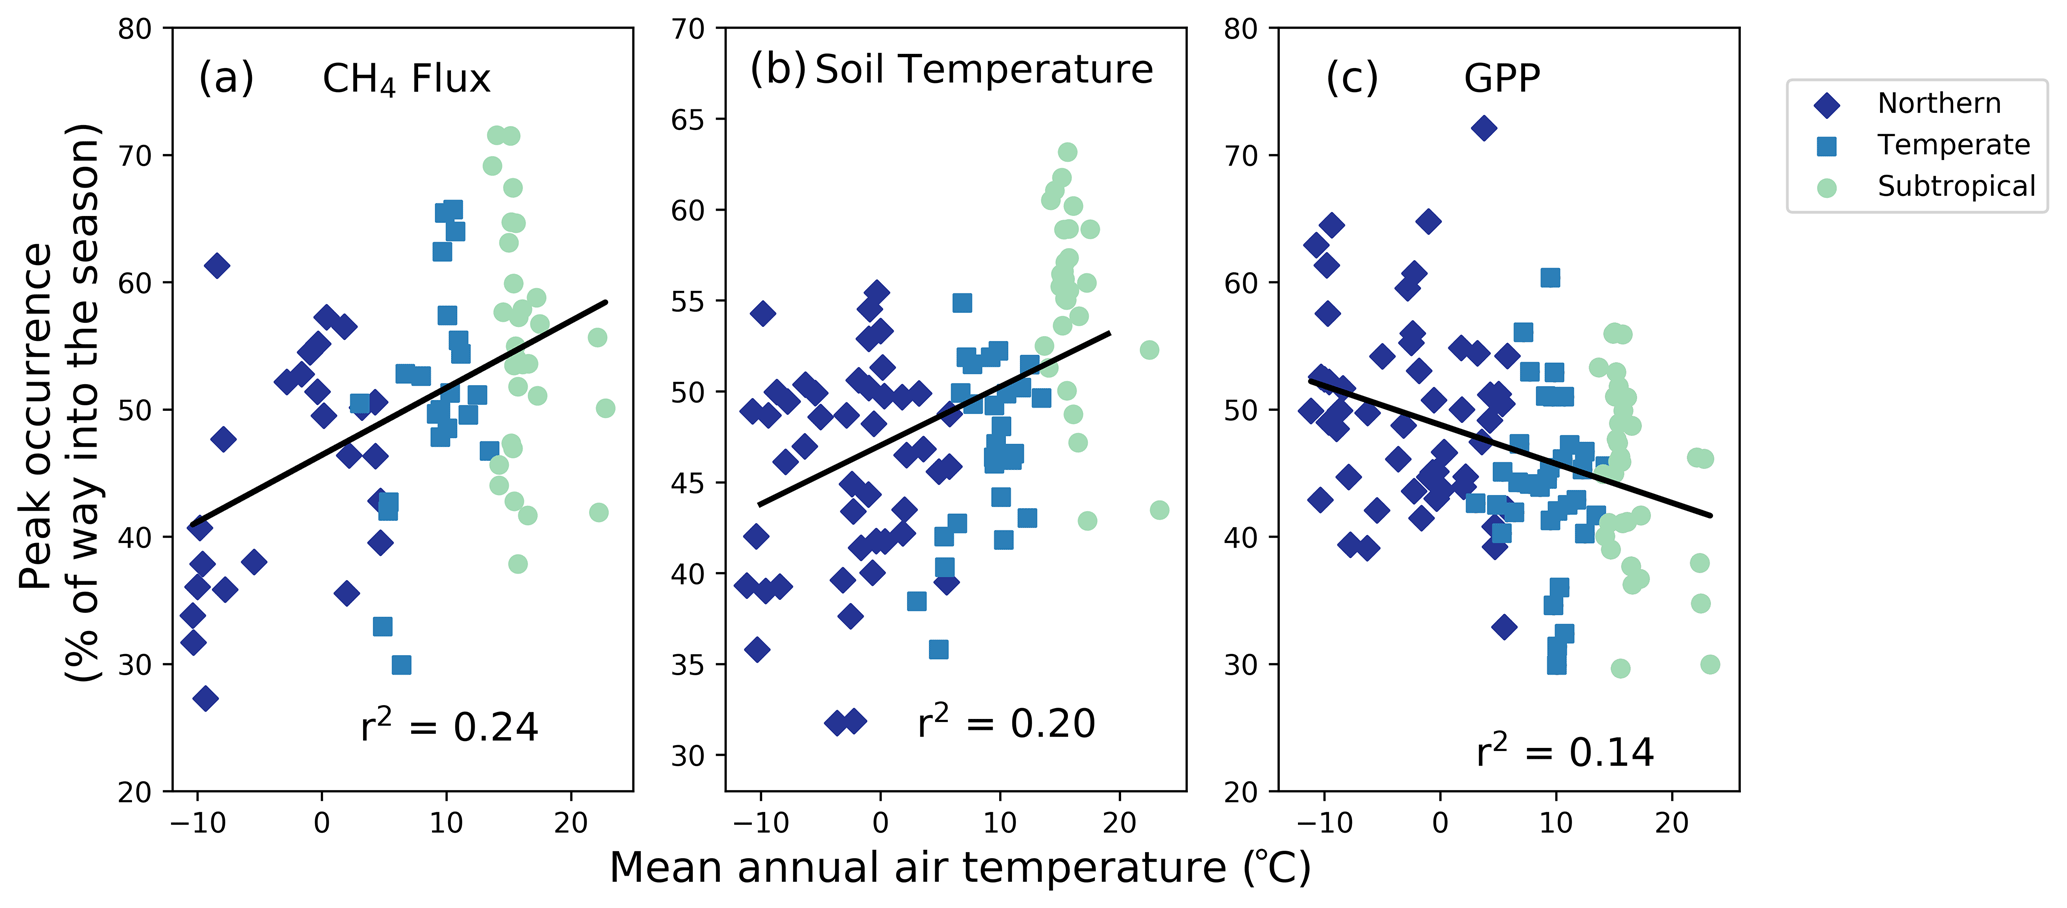
Figure 12Site-year peak methane (CH4) emissions (a) and peak soil temperature (b) occur earlier in the season for sites with lower mean annual temperatures. (c) Gross primary productivity (GPP) tends to peak earlier in the season for warmer sites, though the trend is weak. All r2 values are significant at p < 0.001. Each point represents a site year of data.
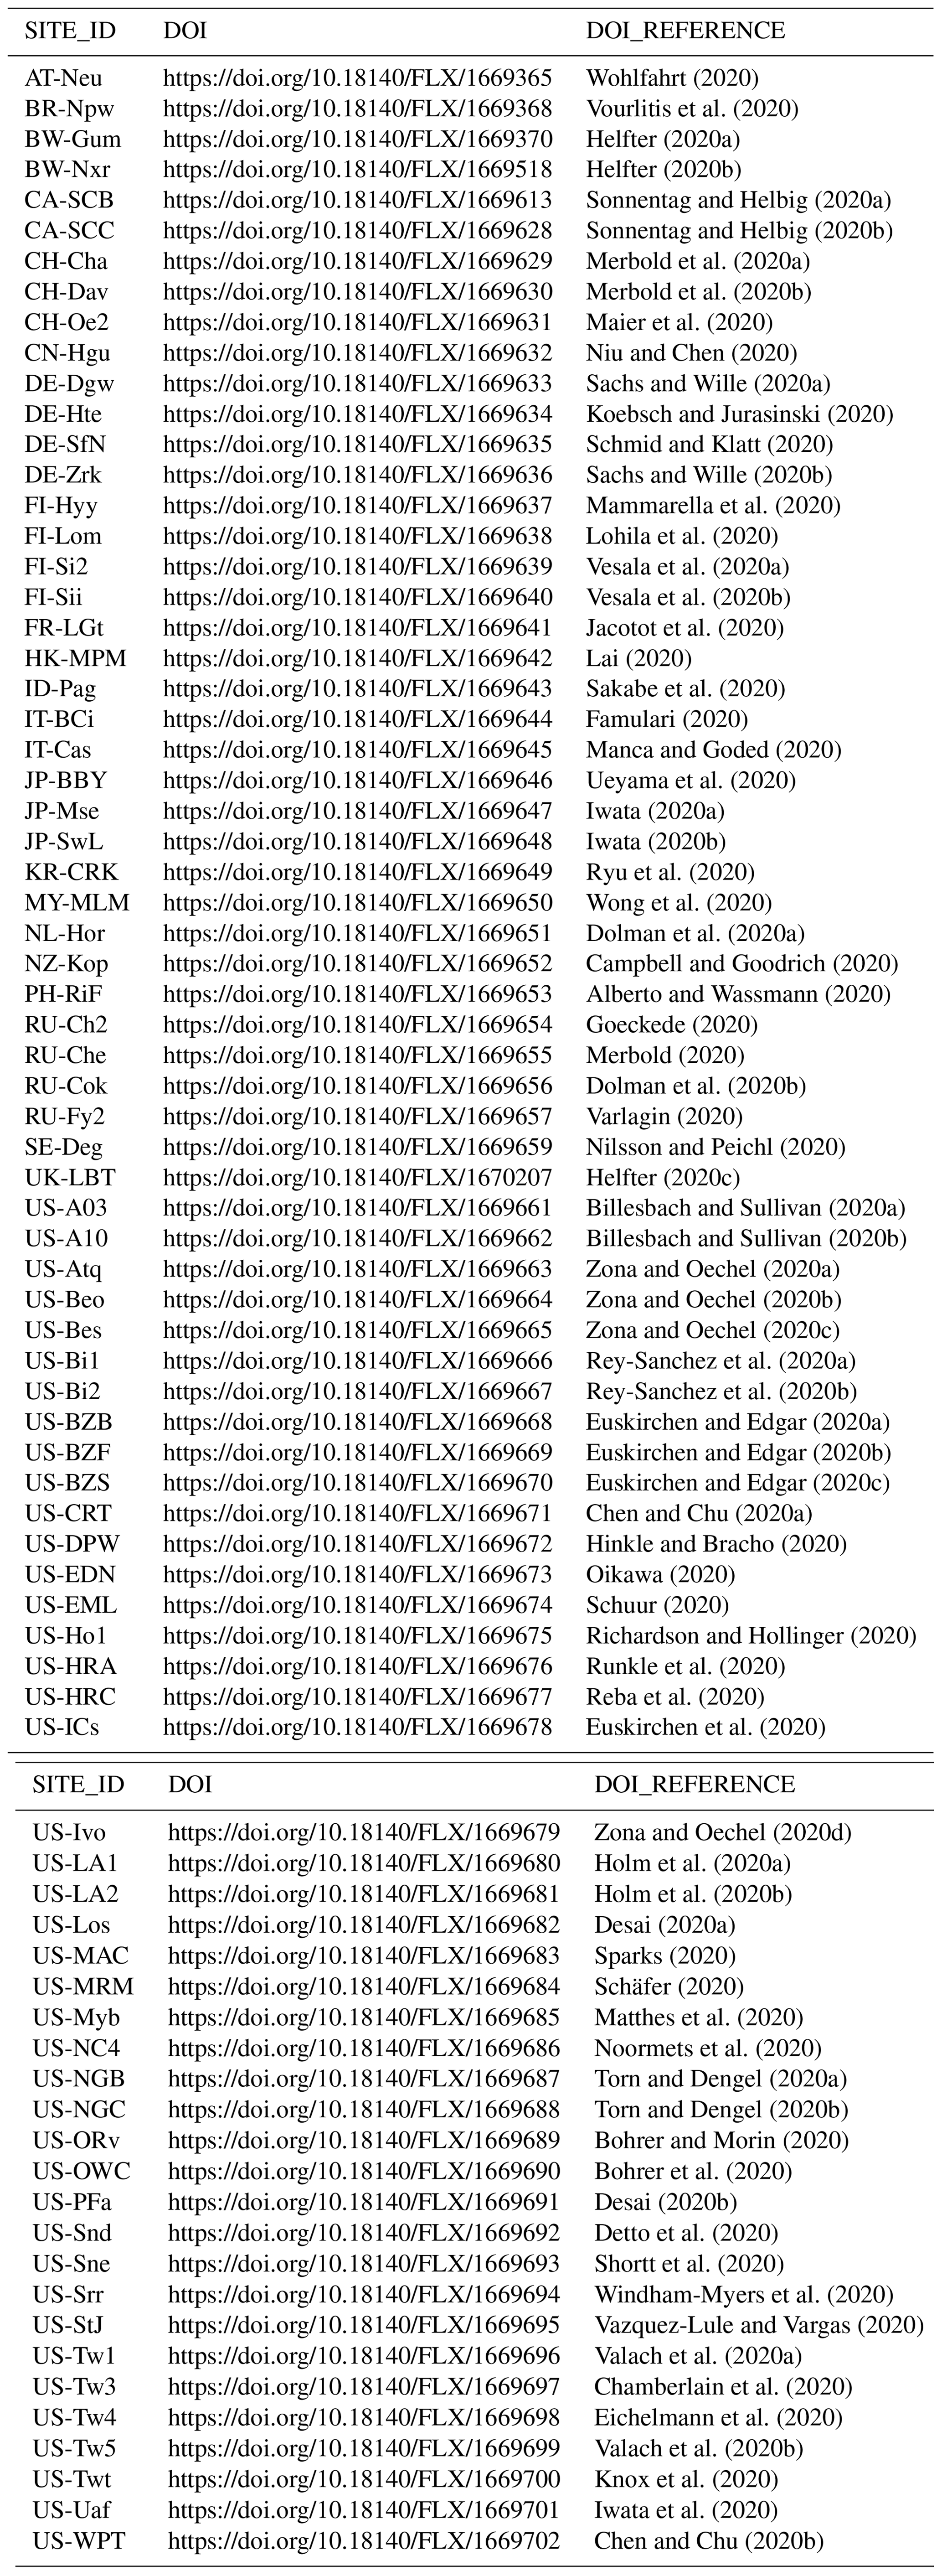
Table 2Site identification (SITE_ID), data DOI, and DOI reference for each FLUXNET-CH4 site.
3.3.3 Uniqueness of tropical wetlands
Tropical wetlands typically do not experience the large swings in temperature and GPP that contribute to CH4 flux seasonality in temperate and northern sites. Indeed, the relatively constant high temperatures and high GPP in tropical ecosystems may lead to the lower ratio between seasonal amplitude and peak CH4 flux compared with temperate and northern sites (Fig. 8b). Tropical flux sites have historically been under-studied, leading to a lack of synthesized information about these ecosystems. FLUXNET-CH4 has five tropical wetland sites (latitudes between 20∘ S and 20∘ N) and one tropical rice site, representing 13 site years of data. These sites are especially insightful as they provide the first estimates of CH4 fluxes from large, tropical, seasonal floodplain systems.
We found a broad range of annual CH4 fluxes across tropical sites in FLUXNET-CH4 Version 1.0. Annual CH4 flux emissions from two Southeast Asian flooded peat forests were relatively low, 0.01 ± 0.1 and 9.5 ± 0.6 g C m−2 yr−1 for ID-PAG and MY-MLM, respectively, which is consistent with annual CH4 fluxes measured at another peat forest in Indonesia (Deshmukh et al., 2020). In contrast, mean annual CH4 flux for a seasonally flooded swamp in the Brazilian Pantanal region (BR-NPW) was over twice as high as MY-MLM, at 19.2 ± 2.5 g C m−2 yr−1. Similarly high annual CH4 fluxes were observed at the two Botswana swamp sites in the Okavango Delta (51.7 ± 10.6 and 47.3 ± 3.7 g C m−2 yr−1 for BW-GUM and BW-NXR, respectively), one of which is seasonally inundated and surrounded by grassland (BW-NXR) and the other a permanently flooded lagoon covered in a floating papyrus mat (BW-GUM). The relatively low fluxes found at the two Southeast Asian peat forest sites indicate that these ecosystems may be smaller CH4 sources than expected given their location in the humid tropics. Even the higher-emitting tropical sites in Brazil and Botswana are still well within the range of annual CH4 flux typical in cooler latitudes (Fig. 1).
In addition to having highly variable CH4 flux magnitudes, the tropical sites differ from each other in their seasonality. CH4 flux hit a minimum around July for two sites (BW-GUM, latitude 18.965∘ S, and MY-MLM, latitude 1.46∘ N), while CH4 flux increased through July and the subsequent months for the other Botswana site, BW-NXR (latitude 19.548∘ S). Site ID-Pag (latitude 2.32∘ S) had minimal seasonality, whereas the flooded forest site in Brazil (BR-NPW, latitude 16.49∘ S) had near-zero fluxes from approximately July to January and consistently high fluxes for the remainder of the year. The rice site PH-RiF (latitude 14.14∘ N) had two annual CH4 flux peaks, which is consistent with some other rice sites and likely reflects management practices. Baseline CH4 flux values also differed, with the two Botswana sites having the highest off-season fluxes (29 and 133 nmol m−2 s−1 for BW-NXR and BW-GUM, respectively, estimated by TIMESAT), MY-MLM having an intermediate baseline CH4 flux (16 nmol m−2 s−1, estimated by TIMESAT), and the remainder of the sites having essentially zero flux at baseline. While more tropical wetland data will be needed to extract broad-scale conclusions about these ecosystems, the six tropical sites in FLUXNET-CH4 provide an important starting point for synthesis studies and highlight tropical wetland CH4 variability.
Half-hourly and daily aggregations are available for download at https://fluxnet.org/data/fluxnet-ch4-community-product/ (for citations, please cite this study), along with a table containing site metadata compiled from Table B3. Variable descriptions and units are provided in Table B1 and at https://fluxnet.org/data/fluxnet-ch4-community-product/ (last access: 7 April 2021). Each site has a unique FLUXNET-CH4 DOI as listed in Table B3. All site data used in this analysis are available under the CC BY 4.0 (https://creativecommons.org/licenses/by/4.0/, last access: 6 July 2021) copyright policy (two additional sites in FLUXNET-CH4 are available under the more restrictive Tier 2 data policy, https://fluxnet.org/data/data-policy/ (last access: 6 July 2021); these sites are not used in our analysis). The individual site DOIs are provided below in Table 2. All seasonality parameters used in these analyses are available at https://doi.org/10.5281/zenodo.4672601 (Delwiche et al., 2021).
The breadth and scope of CH4 flux data in the FLUXNET-CH4 dataset make it possible to study the global patterns of CH4 fluxes, particularly for global freshwater wetlands which release a substantial fraction of atmospheric CH4. To help data users understand seasonal patterns within the dataset, we provide the first global estimates of CH4 flux patterns and predictors in CH4 seasonality using freshwater wetland data. In the seasonality analysis, we find that, on average, the seasonal increase in CH4 emissions begins about 3 months earlier and lasts about 4 months longer at the warmest sites compared with the coolest sites. We also find that the beginning of the CH4 emission season lags behind the beginning of seasonal soil warming by approximately 1 month with almost no instances of CH4 emissions increasing before temperature increases. Additionally, roughly half the sites have CH4 emissions increasing prior to GPP increase, highlighting the importance of substrate versus temperature limitations on wetland CH4 emissions. Furthermore, relative to warmer climates, wetland CH4 emissions in cooler climates increase faster in the warming season and decrease slower in the cooling season. This phenomenon has previously been noted on a regional scale, and we show that it persists at the global scale. Constraining the seasonality of CH4 fluxes on a global scale can help improve the accuracy of global wetland models. FLUXNET-CH4 is an important new resource for the research community, but critical data gaps and opportunities remain. The current FLUXNET-CH4 dataset is biased towards sites in boreal and temperate regions, which influence the relationships presented in our analyses. Tropical ecosystems are estimated to account for 64 % of potential natural CH4 emissions (< 30∘ N; Saunois et al., 2020) but only account for 13 % of the FLUXNET-CH4 sites in the dataset. Unsurprisingly, tropical sites in our network do not represent the range of bioclimatic wetland conditions present in the tropics. Therefore, while maintaining flux towers in tropical ecosystems is challenging, it is necessary to further constrain the global CH4 cycle. Coastal wetlands are also poorly represented in FLUXNET-CH4 even though there is evidence of substantial CH4 emissions from these ecosystems, and so better representation across salinity gradients is warranted. Lastly, the average time series for FLUXNET-CH4 Version 1.0 is relatively short, only 3.7 site years on average compared with 7.2 for CO2 sites in FLUXNET (Pastorello et al., 2020). Adding additional site years of data from existing sites, as a complement to adding new sites, will increase the community's ability to explain interannual variability in CH4 emissions and seasonality. Nevertheless, FLUXNET-CH4 is an important and unprecedented resource with which to diagnose and understand drivers of the global CH4 cycle.
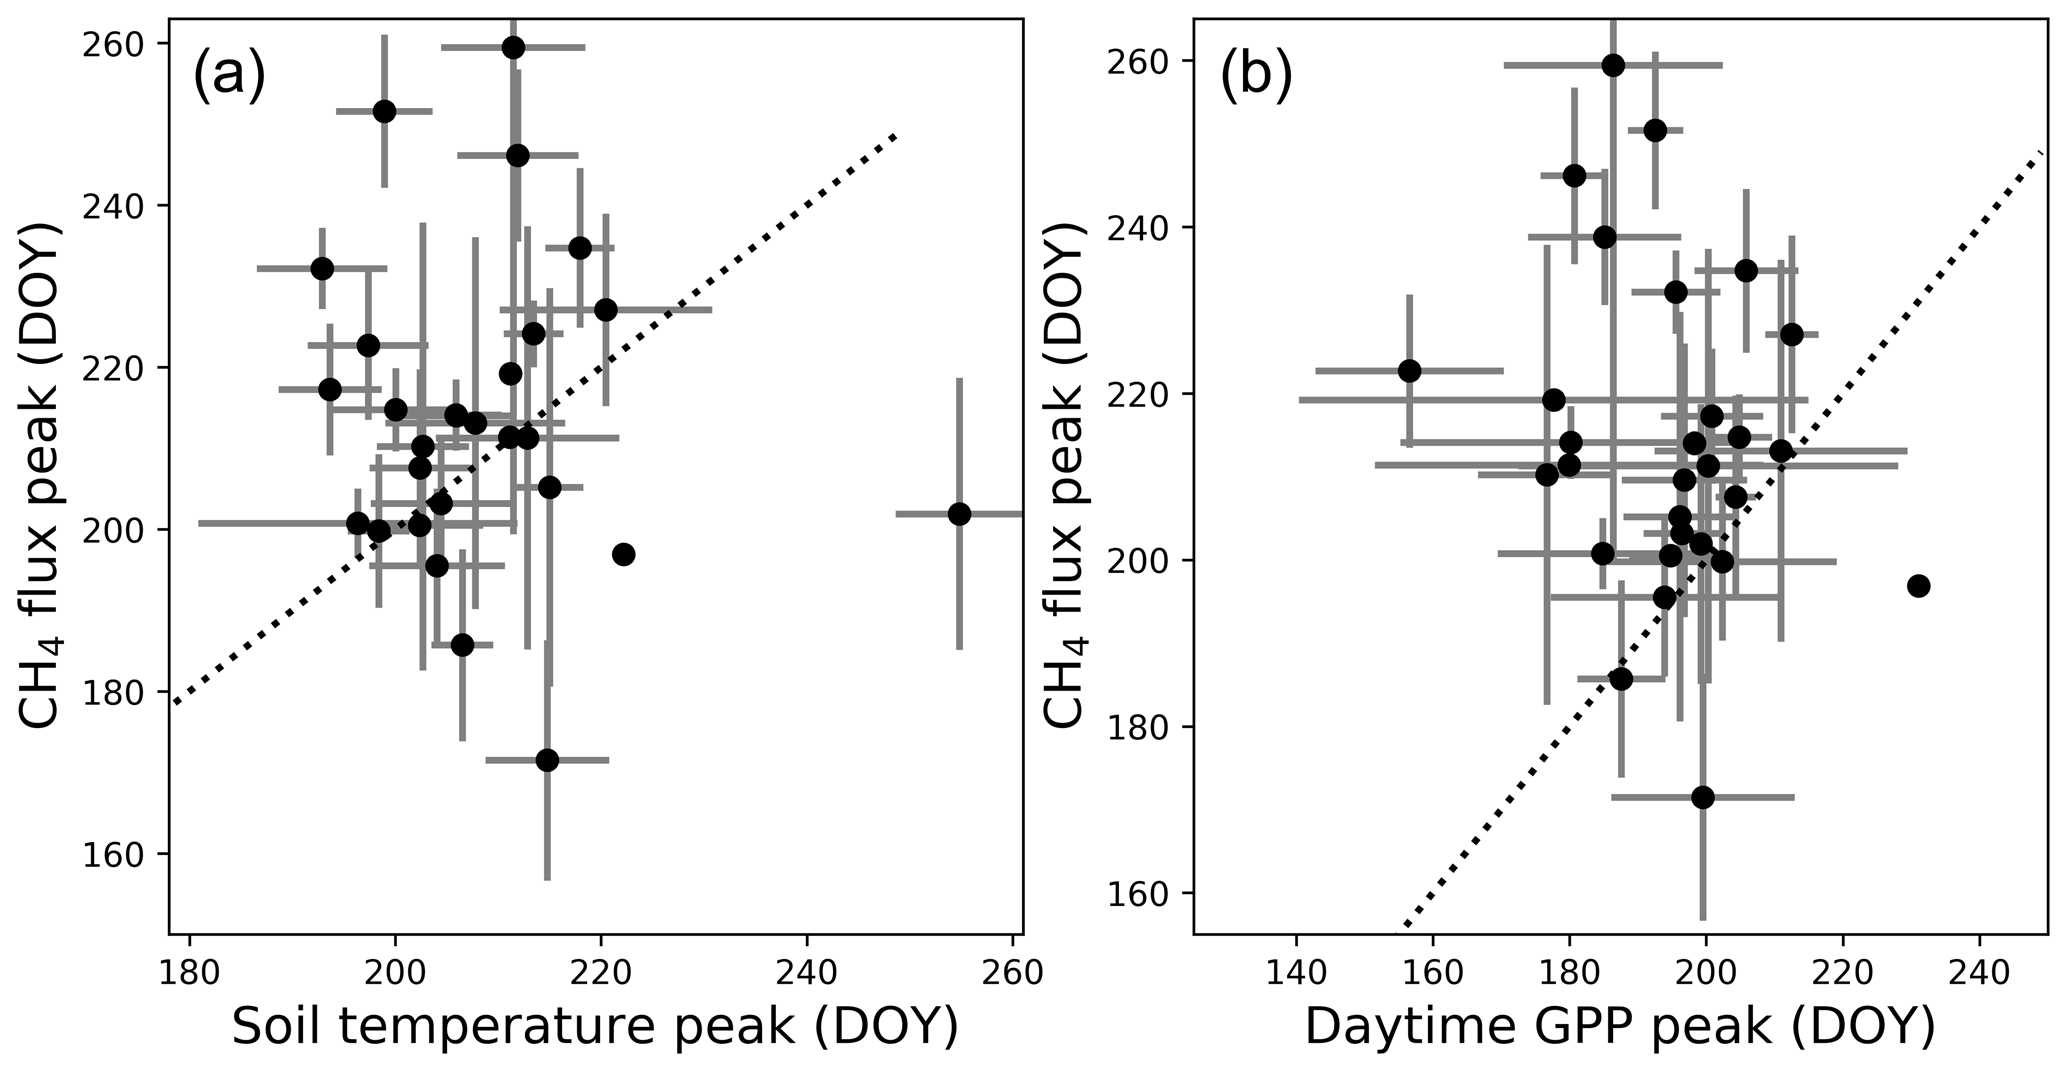
Figure A1Peak methane (CH4) flux timing versus peak gross primary productivity (GPP) timing (a) and peak soil temperature timing by day of year (b). Points represent site average, and error bars represent standard deviations. Dotted line represents 1:1 relationship.
This web page describes data variables and file formatting for the FLUXNET-CH4 Community Product.
B1 Data variable: base names
Base names indicate fundamental quantities that are either measured or calculated/derived. They can also indicate quantified quality information.
B2 Data variable: qualifiers
Qualifiers are suffixes appended to variable base names that provide additional information about the variable. For example, the _DT qualifier in the variable label GPP_DT indicates that gross primary production (GPP) has been partitioned using the flux partitioning method from Lasslop et al. (2010).
Multiple qualifiers can be added, and they must follow the order in which they are presented here.
B2.1 Qualifiers: general
General qualifiers indicate additional information about a variable.
-
_F: variable has been gap-filled by the FLUXNET-CH4 team. Gaps in meteorological variables, including air temperature (TA), incoming shortwave (SW_IN) and longwave (LW_IN) radiation, vapor pressure deficit (VPD), pressure (PA), precipitation (P), and wind speed (WS), were filled with ERA-Interim (ERA-I) reanalysis data (Vuichard and Papale, 2015). Other variables were filled using the multidimensional scaling (MDS) approach in REddyProc (see Delwiche et al., 2021, for more details).
-
_DT: variable is acquired using the flux partitioning method from Lasslop et al. (2010), with values estimated by fitting the light-response curve.
-
_NT: variable is acquired using the flux partitioning method from Reichstein et al. (2005), with values estimated from nighttime data and extrapolated to daytime.
-
_RANDUNC: random uncertainty is introduced from several different sources including errors associated with the flux measurement system (gas analyzer, sonic anemometer, data acquisition system, flux calculations), errors associated with turbulent transport, and statistical errors relating to the location and activity of the sites of flux exchange (“footprint heterogeneity”) (Hollinger and Richardson, 2005).
-
_ANNOPTLM: gap-filled variable uses an artificial neural net routine from Matlab with the Levenberg–Marquardt algorithm as the training function and parameters optimized across runs (more detail in Knox et al., 2016, 2019).
-
_UNC: uncertainty is introduced from ANNOPTLM gap-filling routine, as described in Knox et al. (2016, 2019).
-
_QC: this reports quality checks on FCH4 gap-filled data (_ANNOPTLM) based on length of data gap: 1 signifies data gap shorter than 2 months, and 3 signifies data gap exceeding 2 months which could lead to poor-quality gap-filled data.
B2.2 Qualifiers: positional (_V)
Positional qualifiers are used to indicate relative positions of observations at the site. For FLUXNET-CH4, positional qualifiers are used to distinguish soil temperature probes for sites with more than one probe. Probe depths for each positional qualifier per site are included in the metadata file included with data download and also in Table B7 of Delwiche et al. (2021). For sites where the original database file release in AmeriFlux, AsiaFlux, or EuroFlux contains multiple probes at the same _V depth, we average values and report only the average for each _V position. The one exception to this is site US-UAF where the original positional qualifier from the data we downloaded from AmeriFlux had different depths for the same qualifier. We still averaged the probe data, so _V qualifiers from US-UAF represent an average of more than one depth.
B3 Missing data
Missing data are reported using −9999. Data for all days in a leap year are reported.
Table B2Annual methane flux sum and uncertainty, annual mean soil temperature, and annual mean water table depth. Column headers are explained after the table.
* Data from ID-Pag spans 365 d from June 2016 to June 2017. Annual methane flux for each year is the sum of these 365 d, with uncertainty being calculated separately for each year.
| Column | Description |
| SITE_ID | Site identification code as assigned by regional flux data network |
| Year | Data year |
| Ann_Flux_g_C_m−2 | Total annual methane flux (g C m−2) |
| Ann_Flux_Uncertainty_g_C_m−2 | Gap-filling and random uncertainty associated with annual flux (g C m−2) |
| Mean_Soil_Temp_C | Annual mean soil temperature (degree C). For sites with multiple probes, we use the probe closest to the surface. |
| Mean_Water_Table_Depth_m | Annual mean water table depth (m) |

| Column | Description |
| SITE_ID | Site identification code as assigned by regional flux data network |
| SITE_NAME | Site name determined by site personnel |
| SITE_PERSONNEL | People associated with site FLUXNET-CH4 data |
| COUNTRY | Site country |
| LAT | Latitude |
| LON | Longitude |
| DATA_DOI | DOI link for site FLUXNET-CH4 data |
| YEAR_START | Year data begin |
| YEAR_END | Year data end |
| UTC_OFFSET | Site data offset from coordinated universal time (in hours) |
| ORIGINAL_DATA_SOURCE | Regional network hosting the site's methane data that were incorporated into FLUXNET-CH4 |
| SITE_CLASSIFICATION | Site classification based on the literature description of sites |
| UPLAND_CLASS | For upland sites, category of upland type |
| IGBP | International Geosphere–Biosphere Programme (IGBP) ecosystem surface classification |
| KOPPEN | Koppen climate zone abbreviation |
| MEAN_ANNUAL_TEMP_C_WORLDCLIM | Mean annual temperature from WorldClim2 Global Climate Data |
| MEAN_ANNUAL_PRECIP_MM_WORLDCLIM | Mean annual precipitation from WorldClim2 Global Climate Data |
| MOSS_BROWN | Presence/absence (1/0) brown moss. Presence/absence designated by Avni Malhotra using site literature |
| MOSS_SPHAGNUM | Presence/absence (1/0) sphagnum moss. Presence/absence designated by Avni Malhotra using site literature |
| AERENCHYMATOUS | Presence/absence (1/0) aerenchymatous vegetation. Presence/absence designated by Avni Malhotra using site literature |
| ERI_SHRUB | Presence/absence (1/0) ericaceous shrubs. Presence/absence designated by Avni Malhotra using site literature |
| TREE | Presence/absence (1/0) trees. Presence/absence designated by Avni Malhotra using site literature |
| DOM_VEG | Dominant vegetation type in tower footprint. Dom_veg provided to Avni Malhotra by site personnel via survey, except 15 sites where principal investigators did not answer and Avni Malhotra estimated dominant vegetation type based on site literature |
| IN_SEASONALITY_ANALYSIS | Is site in freshwater wetland seasonality analysis? 1 = yes, 0 = no. |
| Mean_Air_Temp_C | Mean annual air temperature (C) |
| Mean_Air_Temp_stdev_C | Standard deviation of annual air temperature (C) |
| Ann_Flux_g_CH4-C_m−2 | Mean annual methane flux (g CH4-C m−2 yr1) |
| Ann_Flux_stdev_g_CH4-C_m−2 | Standard deviation of annual methane flux (g CH4-C m−2 yr−1) |
| JFM_flux_g_CH4-C_m−2 | Mean methane flux in January, February, March (g CH4-C m−2 yr−1) |
| JFM_flux_stdev_g_CH4-C_m−2 | Standard deviation of methane flux in January, February, March (g CH4-C m−2 yr−1) |
| AMJ_flux_g_CH4-C_m−2 | Mean methane flux in April, May, June (g CH4-C m−2 yr−1) |
| AMJ_flux_stdev_g_CH4-C_m−2 | Standard deviation of methane flux in April, May, June (g CH4-C m−2 yr−1) |
| JAS_flux_g_CH4-C_m−2 | Mean methane flux in July, August, September (g CH4-C m−2 yr−1) |
| JAS_flux_stdev_g_CH4-C_m−2 | Standard deviation of methane flux in July, August, September (g CH4-C m−2 yr−1) |
| OND_flux_g_CH4-C_m−2 | Mean methane flux in October, November, December (g CH4-C m−2 yr−1) |
| OND_flux_stdev_g_CH4-C_m−2 | Standard deviation of methane flux in October, November, December (g CH4-C m−2 yr−1) |
| SOIL_TEMP_PROBE_DEPTHS | Depth of soil temperature probe (m), with negative values being under the surface |
Table B4Table of bioclimatic predictor data used in the principal component analysis (PCA) of Fig. 6.
| Column | Description |
| SITE_ID | Site identification code as assigned by regional flux data network |
| Enhanced_Vegetation_Index_(EVI) | Enhanced vegetation index (unitless) from MOD13A3 (Didan, 2015), 2001–2018 monthly data |
| Wong_Simple_Ratio_Water_Index_(SRWI) | Simple ratio water index (unitless) from MOD09A1 (Vermote, 2015), ∼ 2001–2018 monthly data |
| Latent_Heat_(LE) | Latent heat (in W m−2) from FLUXCOM (Jung et al., 2019), 2003–2013 monthly data |
| Mean_Annual_Temperature_(MAT) | Mean annual temperature (C) from BioClim (Fick and Hijman, 2017), 2001–2018 monthly data |
Table B5Seasonality parameters estimated using TIMESAT software for methane flux (FCH4), gross primary productivity (GPP), air temperature (TA), and soil temperature (TS, for shallowest probe at each site).

| Column | Description |
| SITE_ID | Site identification code as assigned by regional flux data network |
| Year | Data year |
| Start_FCH4_(DOY) | Season start for elevated methane fluxes (DOY), point “f” in Fig. 1 |
| End_FCH4_(DOY) | Season end for elevated methane fluxes (DOY), point “h” in Fig. 1 |
| Base_value_FCH4_(nmolCH4/m2/s) | Baseline methane flux during non-elevated season (nmol CH4 m−2 s−1), average of points “a” and “b” in Fig. 1 |
| Ampl_FCH4_(nmolCH4/m2/s) | Amplitude of methane flux during elevated flux season (nmol CH4 m−2 s−1), difference between point “e” in Fig. 1 and Base_value_FCH4 |
| Peak_FCH4_(DOY) | Day of maximum elevated methane flux (DOY), point “g” in Fig. 1 |
| Peak_value_FCH4_(nmolCH4/m2/s) | Maximum value of methane flux (nmol CH4 m−2 s−1), point “e” in Fig. 1 |
| Start_GPP_DT_(DOY) | Season start for elevated GPP_DT (DOY), point “f” in Fig. 1 |
| End_GPP_DT_(DOY) | Season end for elevated GPP_DT fluxes (DOY), point “h” in Fig. 1 |
| Base_value_GPP_DT_(µmolCO2/m2/s) | Baseline GPP_DT flux during non-elevated season (µmol CO2 m−2 s−1), average of points “a” and “b” in Fig. 1 |
| Ampl_GPP_DT_(µmolCO2/m2/s) | Amplitude of GPP_DT flux during elevated flux season (µmol CO2 m−2 s−1), difference between point “e” in Fig. 1 and Base_value_GPP_DT |
| Peak_GPP_DT_(DOY) | Day of maximum elevated GPP_DT flux (DOY), point “g” in Fig. 1 |
| Peak_value_GPP_DT_(µmolCO2/m2/s) | Maximum value of GPP_DT flux (µmol CO2 m−2 s−1), point “e” in Fig. 1 |
| Probe_name | Temperature probe name as given in data files |
| Soil_temp_depth_m | Depth of soil temperature probe (m), with negative values being under the surface |
| Start_TS_(DOY) | Season start for elevated TS (DOY), point “f” in Fig. 1 |
| End_TS_(DOY) | Season end for elevated TS (DOY), point “h” in Fig. 1 |
| Base_value_TS_(C) | Baseline TS during non-elevated season (C), average of points “a” and “b” in Fig. 1 |
| Ampl_TS_(C) | Amplitude of TS during elevated temperature season (C), difference between point “e” in Fig. 1 and Base_value_TS |
| Peak_TS_(DOY) | Day of maximum elevated TS (DOY), point “g” in Fig. 1 |
| Peak_value_TS_(C) | Maximum value of TS (C), point “e” in Fig. 1 |
| Start_TA_(DOY) | Season start for elevated TA (DOY), point “f” in Fig. 1 |
| End_TA_(DOY) | Season end for elevated TA (DOY), point “h” in Fig. 1 |
| Base_value_TA_(C) | Baseline TA during non-elevated season (C), average of points “a” and “b” in Fig. 1 |
| Ampl_TA_(C) | Amplitude of TA during elevated temperature season (C), difference between point “e” in Fig. 1 and Base_value_TA |
| Peak_TA_(DOY) | Day of maximum elevated TA (DOY), point “g” in Fig. 1 |
| Peak_value_TA_(C) | Maximum value of TA (C), point “e” in Fig. 1 |
Table B6Seasonality parameters estimated using TIMESAT software for soil temperature (TS, from every probe).
| Column | Description |
| SITE_ID | Site identification code as assigned by regional flux data network |
| Year | Data year |
| Probe_name | Temperature probe name as given in data files |
| Soil_temp_depth_m | Depth of soil temperature probe (m), with negative values being under the surface |
| Start_TS_(DOY) | Season start for elevated TS (DOY), point “f” in Fig. 1 |
| End_TS_(DOY) | Season end for elevated TS (DOY), point “h” in Fig. 1 |
| Base_value_TS_(C) | Baseline TS during non-elevated season (C), average of points “a” and “b” in Fig. 1 |
| Ampl_TS_(C) | Amplitude of TS during elevated temperature season (C), difference between point “e” in Fig. 1 and Base_value_TS |
| Peak_TS_(DOY) | Day of maximum elevated TS (DOY), point “g” in Fig. 1 |
| Peak_value_TS_(C) | Maximum value of TS (C), point “e” in Fig. 1 |

| Column | Description |
| SITE_ID | Site identification code as assigned by regional flux data network |
| Year | When relevant, information about time span of probe location; if blank, assume constant probe depth |
| Probe_name | Temperature probe name as given in data files |
| Soil_temp_depth_m | Depth of soil temperature probe (m), with negative values being under the surface |
| Additional_notes | When relevant, additional information about site |
KBD oversaw the data release, performed the seasonality analysis, gathered metadata, and prepared the manuscript with contributions from all co-authors. SHK gathered and standardized the data, and gap-filled the CH4 flux data. AM prepared the manuscript and gathered metadata. EFC did the representativeness analysis and prepared the manuscript. GM gathered data and prepared the manuscript. RBJ oversaw the data collection, processing, analysis, and release. DC and YWC oversaw the FLUXNET-CH4 dataset release on https://fluxnet.org (last access: 6 July 2021). DP, EC, and CT did the data collection, curation, and pre-processing for all of the sites outside North and South America. The remaining co-authors contributed eddy-covariance data to FLUXNET-CH4 dataset and/or participated in editing the manuscript.
The authors declare that they have no conflict of interest.
Publisher's note: Copernicus Publications remains neutral with regard to jurisdictional claims in published maps and institutional affiliations.
We acknowledge primary support from the Gordon and Betty Moore Foundation (grant GBMF5439, “Advancing Understanding of the Global Methane Cycle”; Stanford University) and from the John Wesley Powell Center for Analysis and Synthesis of the US Geological Survey (“Wetland FLUXNET Synthesis for Methane” working group). Benjamin R. K. Runkle was supported by the US National Science Foundation CBET CAREER Award 1752083. Ankur R. Desai acknowledges support of the DOE AmeriFlux Network Management Project. Masahito Ueyama was supported by ArCS II (JPMXD1420318865) and JSPS KAKENHI (20K21849). Dario Papale and Nina Buchmann acknowledge the support of the RINGO (GA 730944) H2020 EU project. Nina Buchmann and Kathrin Fuchs acknowledge the SNF project M4P (40FA40_154245/1) and InnoFarm (407340_172433). Nina Buchmann acknowledges support from the SNF for ICOS-CH phases 1 and 2 (20FI21_148992, 20FI20_173691). Carlo Trotta acknowledges the support of the E-SHAPE (GA 820852) H2020 EU project. William J. Riley was supported by the US Department of Energy, BER, RGCM, RUBISCO project under contract no. DEAC02−05CH11231. Jessica Turner acknowledges support from NSF GRFP (DGE−1747503) and NTL LTER (DEB−1440297). Minseok Kang was supported by the National Research Foundation of Korea (NRF−2018 R1C1B6002917). Carole Helfter acknowledges the support of the UK Natural Environment Research Council (the Global Methane Budget project, grant number NE/N015746/1). Rodrigo Vargas acknowledges support from the National Science Foundation (1652594). Dennis Baldocchi acknowledges the California Department of Water Resources for a funding contract from the California Department of Fish and Wildlife and the United States Department of Agriculture (NIFA grant #2011-67003-30371), as well as the US Department of Energy's Office of Science (AmeriFlux contract #7079856) for funding the AmeriFlux core sites. US-A03 and US-A10 are operated by the Atmospheric Radiation Measurement (ARM) user facility, a US Department of Energy's Office of Science user facility managed by the Biological and Environmental Research Program. Work at ANL was supported by the US Department of Energy's Office of Science and Office of Biological and Environmental Research under contract DE-AC02−06CH11357. Any use of trade, firm, or product names is for descriptive purposes only and does not imply endorsement by the US government. The CH-Dav, DE-SfN, FI-Hyy, FI-Lom, FI-Sii, FR-LGt, IT-BCi, SE-Deg, and SE-Sto sites are part of the ICOS European Research Infrastructure. Oliver Sonnentag acknowledges funding by the Canada Research Chairs, Canada Foundation for Innovation Leaders Opportunity Fund, and Natural Sciences and Engineering Research Council Discovery Grant programs for work at CA-SCC and CA-SCB. Benjamin Poulter acknowledges support from the NASA Carbon Cycle and Ecosystems program. Derrick Lai acknowledges the support of the Research Grants Council of the Hong Kong Special Administrative Region, China (project no. CUHK 458913). We thank Nathaniel Goenawan for his help with the representativeness analysis.
This research has been supported by the Gordon and Betty Moore Foundation (grant no. GBMF5439), the John Wesley Powell Center for Analysis and Synthesis of the US Geological Survey, the National Science Foundation (grant nos. 1752083, DGE−1747503, and 1652594), the ArCS II (grant no. JPMXD1420318865), the JSPS KAKENHI (grant no. 20K21849), the RINGO (grant no. GA 730944), the SNF (grant nos. 40FA40_154245/1, 20FI21_148992, and 20FI20_173691), the InnoFarm (grant no. 407340_172433), the E-SHAPE (grant no. GA 820852), the US Department of Energy (grant nos. DEAC02−05CH11231, 7079856, and DE-AC02−06CH11357), the NTL LTER (grant no. DEB−1440297), the National Research Foundation of Korea (grant no. NRF−2018 R1C1B6002917), the UK Natural Environment Research Council (grant no. NE/N015746/1), the California Department of Fish and Wildlife (grant no. 2011-67003-30371), the Canada Research Chairs, the Canada Foundation for Innovation Leaders Opportunity Fund, the Natural Sciences and Engineering Research Council Discovery Grant programs, and the NASA Carbon Cycle and Ecosystems program.
This paper was edited by David Carlson and reviewed by two anonymous referees.
Abdalla, M., Hastings, A., Truu, J., Espenberg, M., Mander, Ü, and Smith, P.: Emissions of methane from northern peatlands: a review of management impacts and implications for future management options, Ecol. Evol., 6, 7080–7102, https://doi.org/10.1002/ece3.2469, 2016.
Alberto, M. and Wassmann, R.: FLUXNET-CH4 PH-RiF Philippines Rice Institute flooded, Philippines, FLUXNET-CH4 Community Product [data set], https://doi.org/10.18140/FLX/1669653, 2020.
Alberto, M. C. R., Wassmann, R., Gummert, M., Buresh, R. J., Quilty, J. R., Correa, T. Q., Centeno, C. A. R., and Oca, G. M.: Straw incorporated after mechanized harvesting of irrigated rice affects net emissions of CH4 and CO2 based on eddy covariance measurements, Field Crop. Res., 184, 162–175, https://doi.org/10.1016/j.fcr.2015.10.004, 2015.
Anderson, D. E., Verma, S. B., and Rosenberg, N. J.: Eddy correlation measurements of CO2, latent heat, and sensible heat fluxes over a crop surface, Bound.-Lay. Meteorol., 29, 263–272, https://doi.org/10.1007/bf00119792, 1984.
Anderson, F. E., Bergamaschi, B., Sturtevant, C., Knox, S., Hastings, L., Windham-Myers, L., Detto, M., Hestir, E. L., Drexler, J., Miller, R. L., Matthes, J. H., Verfaillie, J., Baldocchi, D., Snyder, R. L., and Fujii, R.: Variation of energy and carbon fluxes from a restored temperate freshwater wetland and implications for carbon market verification protocols, J. Geophys. Res.-Biogeo., 121, 777–795, https://doi.org/10.1002/2015JG003083, 2016.
Angle, J. C., Morin, T. H., Solden, L. M., Narrowe, A. B., Smith, G. J., Borton, M. A., Rey-Sanchez, C., Daly, R. A., Mirfenderesgi, G., Hoyt, D. W., Riley, W. J., Miller, C. S., Bohrer, G., and Wrighton, K. C.: Methanogenesis in oxygenated soils is a substantial fraction of wetland methane emissions, Nat. Commun., 8, 1567, https://doi.org/10.1038/s41467-017-01753-4, 2017.
Bartlett, K. B., Bartlett, D. S., Harriss, R. C., and Sebacher, D. I.: Methane emissions along a salt marsh salinity gradient, Biogeochemistry, 4, 183–202, https://doi.org/10.1007/bf02187365, 1987.
Bastviken, D., Tranvik, L. J., Downing, J. A., Crill, P. M., and Enrich-Prast, A.: Freshwater methane emissions offset the continental carbon sink, Science, 331, 6013, https://doi.org/10.1126/science.1196808, 2011.
Billesbach, D. and Sullivan, R.: FLUXNET-CH4 US-A03 ARM-AMF3-Oliktok, United States, FLUXNET-CH4 Community Product [data set], https://doi.org/10.18140/FLX/1669661, 2020a.
Billesbach, D. and Sullivan, R.: FLUXNET-CH4 US-A10 ARM-NSA-Barrow, United States, FLUXNET-CH4 Community Product [data set], https://doi.org/10.18140/FLX/1669662, 2020b.
Bloom, A. A., Bowman, K. W., Lee, M., Turner, A. J., Schroeder, R., Worden, J. R., Weidner, R., McDonald, K. C., and Jacob, D. J.: A global wetland methane emissions and uncertainty dataset for atmospheric chemical transport models (WetCHARTs version 1.0), Geosci. Model Dev., 10, 2141–2156, https://doi.org/10.5194/gmd-10-2141-2017, 2017.
Bridgham, S. D., Cadillo-Quiroz, H., Keller, J. K., and Zhuang, Q.: Methane emissions from wetlands: biogeochemical, microbial, and modeling perspectives from local to global scales, Glob. Change Biol., 19, 1325–1346, https://doi.org/10.1111/gcb.12131, 2013.
Bohrer, G. and Morin, T. H.: FLUXNET-CH4 US-ORv Olentangy River Wetland Research Park, United States, FLUXNET-CH4 Community Product [data set], https://doi.org/10.18140/FLX/1669689, 2020.
Bohrer, G., Kerns, J., Morin, T. H., Rey-Sanchez, A. C., Villa, J., and Ju, Y.: FLUXNET-CH4 US-OWC Old Woman Creek, United States, FLUXNET-CH4 Community Product [data set], https://doi.org/10.18140/FLX/1669690. 2020.
Campbell, D. and Goodrich, J.: FLUXNET-CH4 NZ-Kop Kopuatai, New Zealand, FLUXNET-CH4 Community Product [data set], https://doi.org/10.18140/FLX/1669652, 2020.
Castro-Morales, K., Kleinen, T., Kaiser, S., Zaehle, S., Kittler, F., Kwon, M. J., Beer, C., and Göckede, M.: Year-round simulated methane emissions from a permafrost ecosystem in Northeast Siberia, Biogeosciences, 15, 2691–2722, https://doi.org/10.5194/bg-15-2691-2018, 2018.
Chadburn, S. E., Aalto, T., Aurela, M., Baldocchi, D., Biasi, C., Boike, J., Burke, E. J., Comyn-Platt, E., Dolman, A. J., Duran‐Rojas, C., Fan, Y., Friborg, T., Gao, Y., Gedney, N., Göckede, M., Hayman, G. D., Holl, D., Hugelius, G., Kutzbach, L., Lee, H., Lohila, A., Parmentier, F. W., Sachs, T., Shurpali, N. J., and Westermann, S.: Modeled microbial dynamics explain the apparent temperature sensitivity of wetland methane emissions, Global Biogeochem. Cy., 34, e2020GB006678, https://doi.org/10.1029/2020gb006678, 2020.
Chamberlain, S. D., Oikawa, P., Sturtevant, C., Szutu, D., Verfaillie, J., and Baldocchi, D.: FLUXNET-CH4 US-Tw3 Twitchell Alfalfa, United States, FLUXNET-CH4 Community Product [data set], https://doi.org/10.18140/FLX/1669697, 2020.
Chambers, L. G., Ramesh Reddy, K., and Osborne, T. Z.: Short-Term Response of Carbon Cycling to Salinity Pulses in a Freshwater Wetland, Soil Sci. Soc. Am. J., 75, 2000–2007, https://doi.org/10.2136/sssaj2011.0026, 2011.
Chang, K. Y., Riley, W. J., Knox, S. H., Jackson, R. B., McNicol, G., Poulter, B., Aurela, M., Baldocchi, D., Bansal, S., Bohrer, G., Campbell, D. I., Cescatti, A., Chu, H., Delwiche, K. B., Desai, A., Euskirchen, E., Friborg, T., Goeckede, M., Holm, G., Kang, M., Keenan, T., Krauss, K. W., Lohila, A., Mammarella, I., Miyata, A., Nilsson, M. B., Noormets, A., Papale, D., Runkle, B. R. K., Ryu, Y., Sachs, T., Schäfer, K. V. R., Schmid, H. P., Shurpali, N., Sonnentag, O., Tang, A. C. I., Torn, M. S., Trotta, C., Ueyama, M., Vargas, R., Vesala, T., Windham-Myers, L., Zhang, Z., and Zona, D.: Global wetland methane emissions have hysteretic responses to seasonal temperature, Nat. Commun., 12, 2266, https://doi.org/10.1038/s41467-021-22452-1, 2021.
Chanton, J. P., Glaser, P. H., Chasar, L. S., Burdige, D. J., Hines, M. E., Siegel, D. I., Tremblay, L. B., and Cooper, W. T.: Radiocarbon evidence for the importance of surface vegetation on fermentation and methanogenesis in contrasting types of boreal peatlands, Global Biogeochem. Cy., 22, GB4022, https://doi.org/10.1029/2008gb003274, 2008.
Chen, J. and Chu, H.: FLUXNET-CH4 US-CRT Curtice Walter-Berger cropland, United States, FLUXNET-CH4 Community Product [data set], https://doi.org/10.18140/FLX/1669671, 2020a.
Chen, J. and Chu, H.: FLUXNET-CH4 US-WPT Winous Point North Marsh, United States, FLUXNET-CH4 Community Product [data set], https://doi.org/10.18140/FLX/1669702, 2020b.
Chu, H., Chen, J., Gottgens, J. F., Ouyang, Z., John, R., Czajkowski, K., and Becker, R.: Net ecosystem methane and carbon dioxide exchanges in a Lake Erie coastal marsh and a nearby cropland, J. Geophys. Res.-Biogeo., 119, 722–740, https://doi.org/10.1002/2013JG002520, 2014.
Chu, H., Baldocchi, D. D., John, R., Wolf, S., and Reichstein, M.: Fluxes all of the time? A primer on the temporal representativeness of FLUXNET, J. Geophys. Res.-Biogeo., 122, 289–307, https://doi.org/10.1002/2016JG003576, 2017.
Chu, H., Luo, X., Ouyang, Z., Chan, W. S., Dengel, S., Biraud, S. C., Torn, M. S., Metzger, S., Kumar, J., Arain, M. A., Arkebauer, T. J., Baldocchi, D., Bernacchi, C., Billesbach, D., Black, T. A., Blanken, P. D., Bohrer, G., Bracho, R., Brown, S., Brunsell, N. A., Chen, J., Chen, X., Clark, K., Desai, A.R., Duman, T., Durden, D., Fares, S., Forbrich, I., Gammon, J. A., Gough, C. M., Griffis, T., Helbig, M., Hollinger, D., Humphreys, E., Ikawa, H., Iwata, H., Ju, Y., Knowles, J. F., Knox, S. H., Kobayashi, H., Kolb, T., Law, B., Lee, X., Litvak, M., Liu, H., Munger, J. W., Noormets, A., Novick, K., Oberbauer, S. F., Oechel, W., Oikawa, P., Papuga, S. A., Pendall, E., Prajapati, P., Prueger, J., Quinton, W. L., Richardson, A. D., Russel, E. S., Scott, R. L., Starr, G., Staebler, R., Stoy, P., Stuart-Haentjens, E., Sonnentag, O., Sullivan, R. C., Suyker, A., Ueyama, M., Vargas, R., Wood, J. D., and Zona, D.: Representativeness of Eddy-Covariance flux footprints for areas surrounding AmeriFlux sites, Agr. Forest Meteorol., 301-302, 108350, https://doi.org/10.1016/j.agrformet.2021.108350, 2021.
Dalcin Martins, P., Hoyt, D. W., Bansal, S., Mills, C. T., Tfaily, M., Tangen, B. A., Finocchiaro, R. G., Johnston, M. D., McAdams, B. C., Solensky, M. J., Smith, G. J., Chin, Y.-P., and Wilkins, M. J.: Abundant carbon substrates drive extremely high sulfate reduction rates and methane fluxes in Prairie Pothole Wetlands, Glob. Change Biol., 23, 3107–3120, https://doi.org/10.1111/gcb.13633, 2017.
Dean, J. F., Middelburg, J. J., Röckmann, T., Aerts, R., Blauw, L. G., Egger, M., Jetten, M. S. M., de Jong, A. E. E., Meisel, O. H., Rasigraf, O., Slomp, C. P., in't Zandt, M. H., and Dolman, A. J.: Methane Feedbacks to the Global Climate System in a Warmer World, Rev. Geophys., 56, 207–250, https://doi.org/10.1002/2017rg000559, 2018.
Deemer, B. R., Harrison, J. A., Li, S., Beaulieu, J. J., DelSontro, T., Barros, N., Bezerra-Neto, J. F., Powers, S. M., Dos Santos, M. A., and Vonk, J. A.: Greenhouse Gas Emissions from Reservoir Water Surfaces: A New Global Synthesis, Bioscience, 66, 949–964, https://doi.org/10.1093/biosci/biw117, 2016.
Dengel, S., Zona, D., Sachs, T., Aurela, M., Jammet, M., Parmentier, F. J. W., Oechel, W., and Vesala, T.: Testing the applicability of neural networks as a gap-filling method using CH4 flux data from high latitude wetlands, Biogeosciences, 10, 8185–8200, https://doi.org/10.5194/bg-10-8185-2013, 2013.
Delwiche, K. B., Knox, S. H., Malhotra, A., Fluet-Chouinard, E., McNicol, G., Feron, S., Ouyang, Z., Papale, D., Trotta, C., Canfora, E., Cheah, Y.-W., Christianson, D., Alberto, M. C. R., Alekseychik, P., Aurela, M., Baldocchi, D., Bansal, S., Billesbach, D. P., Bohrer, G., Bracho, R., Buchmann, N., Campbell, D. I., Celis, G., Chen, J., Chen, W., Chu, H., Dalmagro, H.J., Dengel, S., Desai, A. R., Detto, M., Dolman, H., Eichelmann, E., Euskirchen, E., Famulari, D., Friborg, T., Fuchs, K., Goeckede, M., Gogo, S., Gondwe, M. J., Goodrich, J. P., Gottschalk, P., Graham, S. L., Heimann, M., Helbig, M., Helfter, C., Hemes, K. S., Hirano, T., Hollinger, D., Hörtnagl, L., Iwata, H., Jacotot, A., Jansen, J., Jurasinski, G., Kang, M., Kasak, K., King, J., Klatt, J., Koebsch, F., Krauss, K. W., Lai, D. Y. F., Mammarella, I., Manca, G., Marchesini, L. B., Matthes, J. H., Maximon, T., Merbold, L., Mitra, B., Morin, T. H., Nemitz, E., Nilsson, M. B., Niu, S., Oechel, W.C., Oikawa, P. Y., Ono, K., Peichl, M., Peltola, O., Reba, M. L., Richardson, A. D., Riley, W., Runkle, B. R. K., Ryu, Y., Sachs, T., Sakabe, A., Sanchez, C. R., Schuur, E. A., Schäfer, K. V. R., Sonnentag, O., Sparks, J. P., Stuart- Haëntjens, E., Sturtevant, C., Sullivan, R. C., Szutu, D. J., Thom, J. E., Torn, M. S., Tuittila, E.-S., Turner, J., Ueyama, M., Valach, A. C., Vargas, R., Varlagin, A., Vazquez-Lule, A., Verfaillie, J. G., Vesala, T., Vourlitis, G. L., Ward, E. J., Wille, C., Wohlfahrt, G., Wong, G. X., Zhang, Z., Zona, D., Windham-Myers, L., Poulter, B., and Jackson, R. B.: FLUXNET-CH4: A global, multi-ecosystem dataset and analysis of methane seasonality from freshwater wetlands (Appendix B and Figure 3), Zenodo [data set], https://doi.org/10.5281/zenodo.4672601, 2021.
Deshmukh, C. S., Julius, D., Evans, C. D., Nardi, Susanto, A. P., Page, S. E., Gauci, V., Laurén, A., Sabiham, S., Agus, F., Asyhari, A., Kurnianto, S., Suardiwerianto, Y., and Desai, A. R.: Impact of forest plantation on methane emissions from tropical peatland, Glob. Change Biol., 26, 2477–2495, https://doi.org/10.1111/gcb.15019, 2020.
Desai, A. R.: FLUXNET-CH4 US-Los Lost Creek, United States, FLUXNET-CH4 Community Product [data set], https://doi.org/10.18140/FLX/1669682, 2020a.
Desai, A. R.: FLUXNET-CH4 US-PFa Park Falls/WLEF, United States, FLUXNET-CH4 Community Product [data set], https://doi.org/10.18140/FLX/1669691, 2020b.
Desjardins, R. L.: A technique to measure CO2 exchange under field conditions, Int. J. Biometeorol., 18, 76–83, https://doi.org/10.1007/bf01450667, 1974.
Detto, M., Sturtevant, C., Oikawa, P., Verfaillie, J., and Baldocchi, D.: FLUXNET-CH4 US-Snd Sherman Island, United States, FLUXNET-CH4 Community Product [data set], https://doi.org/10.18140/FLX/1669692, 2020.
Didan, K.: MOD13A3 MODIS/Terra vegetation Indices Monthly L3 Global 1km SIN Grid V006, NASA EOSDIS Land Processes DAAC [data set], https://doi.org/10.5067/MODIS/MOD13A3.006, 2015.
Dise, N.: Winter fluxes of methane from Minnesota peatlands, Biogeochemistry, 17, 17–83, https://doi.org/10.1007/bf00002641, 1992.
Dolman, H., Hendriks, D., van Huissteden, K., and Belelli, L.: FLUXNET-CH4 NL-Hor Horstermeer, Netherlands, FLUXNET-CH4 Community Product [data set], https://doi.org/10.18140/FLX/1669651, 2020a.
Dolman, H., Maximov, T., Parmentier, F., Budishev, A., and Marchesini, L. B.: FLUXNET-CH4 RU-Cok Chokurdakh, Russian Federation, FLUXNET-CH4 Community Product [data set], https://doi.org/10.18140/FLX/1669656, 2020b.
Eichelmann, E., Knox, S., Rey Sanchez, C., Valach, A., Sturtevant, C., Szutu, D., Verfaillie, J., and Baldocchi, D.: FLUXNET-CH4 US-Tw4 Twitchell East End Wetland, United States, FLUXNET-CH4 Community Product [data set], https://doi.org/10.18140/FLX/1669698, 2020.
Eklundh, L. and Jönsson, P.: TIMESAT: A Software Package for Time-Series Processing and Assessment of Vegetation Dynamics, Remote Sensing Time Series, Springer International Publishing, 141–158, https://doi.org/10.1007/978-3-319-15967-6_7. 2015.
Etheridge, D. M., Steele, L. P., Francey, R. J., and Langenfelds, R. L.: Atmospheric methane between 1000 A.D. and present: Evidence of anthropogenic emissions and climatic variability, J. Geophys. Res.-Atmos., 103, 15979–15993, https://doi.org/10.1029/98jd00923, 1998.
Etminan, M., Myhre, G., Highwood, E. J., and Shine, K. P.: Radiative forcing of carbon dioxide, methane, and nitrous oxide: A significant revision of the methane radiative forcing, Geophys. Res. Lett., 43, 12614–12623, https://doi.org/10.1002/2016gl071930, 2016.
Euskirchen, E. and Edgar, C.: FLUXNET-CH4 US-BZB Bonanza Creek Thermokarst Bog, United States, FLUXNET-CH4 Community Product [data set], https://doi.org/10.18140/FLX/1669668, 2020a.
Euskirchen, E. and Edgar, C.: FLUXNET-CH4 US-BZF Bonanza Creek Rich Fen, United States, FLUXNET-CH4 Community Product [data set], https://doi.org/10.18140/FLX/1669669, 2020b.
Euskirchen, E. and Edgar, C.: FLUXNET-CH4 US-BZS Bonanza Creek Black Spruce, United States, FLUXNET-CH4 Community Product [data set], https://doi.org/10.18140/FLX/1669670, 2020c.
Euskirchen, E., Bret-Harte, M., and Edgar, C.: FLUXNET-CH4 US-ICs Imnavait Creek Watershed Wet Sedge Tundra, United States, FLUXNET-CH4 Community Product [data set], https://doi.org/10.18140/FLX/1669678, 2020.
Famulari, D.: FLUXNET-CH4 IT-BCi Borgo Cioffi, Italy, FLUXNET-CH4 Community Product [data set], https://doi.org/10.18140/FLX/1669644, 2020.
Fick, S. E. and Hijmans, R. J.: WorldClim: 2: new 1km spatial resolution climate surfaces for global land areas, Int. J. Climatol., 37, 4302–4315, 2017.
Friborg, T., Christensen, T. R., and Søgaard, H.: Rapid response of greenhouse gas emission to early spring thaw in a subarctic mire as shown by micrometeorological techniques, Geophys. Res. Lett., 24, 3061–3064, https://doi.org/10.1029/97gl03024, 1997.
Gallant, A.: The Challenges of Remote Monitoring of Wetlands, Remote Sensing, 7, 10938–10950, https://doi.org/10.3390/rs70810938, 2015.
Göckede, M., Kittler, F., and Schaller, C.: Quantifying the impact of emission outbursts and non-stationary flow on eddy-covariance CH4 flux measurements using wavelet techniques, Biogeosciences, 16, 3113–3131, https://doi.org/10.5194/bg-16-3113-2019, 2019.
Goeckede, M.: FLUXNET-CH4 RU-Ch2 Chersky reference, Russian Federation, FLUXNET-CH4 Community Product [data set], https://doi.org/10.18140/FLX/1669654, 2020.
Gu, L., Post, W. M., Baldocchi, D. D., Andrew Black, T., Suyker, A. E., Verma, S. B., Vesala, T., and Wofsy, S. C.: Characterizing the Seasonal Dynamics of Plant Community Photosynthesis Across a Range of Vegetation Types, in: Phenology of Ecosystem Processes, edited by: Noormets, A., Springer, New York, NY, 35–58, https://doi.org/10.1007/978-1-4419-0026-5_2, 2009.
Hargreaves, K. J., Fowler, D., Pitcairn, C. E. R., and Aurela, M.: Annual methane emission from Finnish mires estimated from eddy covariance campaign measurements, Theor. Appl. Climatol., 70, 203–213, https://doi.org/10.1007/s007040170015, 2001.
Hargrove, W. W., Hoffman, F. M., and Law, B. E.: New analysis reveals representativeness of the AmeriFlux network, Eos T. Am. Geophys., 84, 529, https://doi.org/10.1029/2003EO480001, 2003.
Hatala, J. A., Detto, M., and Baldocchi, D. D.: Gross ecosystem photosynthesis causes a diurnal pattern in methane emission from rice, Geophys. Res. Lett., 39, L06409m https://doi.org/10.1029/2012gl051303, 2012.
Helbig, M., Quinton, W. L., and Sonnentag, O.: Warmer spring conditions increase annual methane emissions from a boreal peat landscape with sporadic permafrost, Environ. Res. Lett., 12, 115009, https://doi.org/10.1088/1748-9326/aa8c85, 2017.
Helfter, C.: FLUXNET-CH4 BW-Gum Guma, Botswana, FLUXNET-CH4 Community Product [data set], https://doi.org/10.18140/FLX/1669370, 2020a.
Helfter, C.: FLUXNET-CH4 BW-Nxr Nxaraga, Botswana, FLUXNET-CH4 Community Product [data set], https://doi.org/10.18140/FLX/1669518, 2020b.
Helfter, C.: FLUXNET-CH4 UK-LBT London_BT, United Kingdom, FLUXNET-CH4 Community Product [data set], https://doi.org/10.18140/FLX/1670207, 2020c.
Helfter, C., Tremper, A. H., Halios, C. H., Kotthaus, S., Bjorkegren, A., Grimmond, C. S. B., Barlow, J. F., and Nemitz, E.: Spatial and temporal variability of urban fluxes of methane, carbon monoxide and carbon dioxide above London, UK, Atmos. Chem. Phys., 16, 10543–10557, https://doi.org/10.5194/acp-16-10543-2016, 2016.
Hinkle, C. R. and Bracho, R.: FLUXNET-CH4 US-DPW Disney Wilderness Preserve Wetland, United States, FLUXNET-CH4 Community Product [data set], https://doi.org/10.18140/FLX/1669672, 2020.
Hoffman, F. M., Kumar, J., Mills, R. T., and Hargrove, W. W.: Representativeness-based sampling network design for the State of Alaska, Landscape Ecol., 28, 1567–1586, https://doi.org/10.1007/s10980-013-9902-0, 2013.
Hollinger, D. Y. and Richardson, A. D.: Uncertainty in Eddy Covariance Measurements and Its Application to Physiological Models, Tree Physiol., 25, 873–885, https://doi.org/10.1093/treephys/25.7.873, 2005.
Holm, G. O., Perez, B. C., McWhorter, D. E., Krauss, K. W., Raynie, R. C., and Killebrew, C. J.: FLUXNET-CH4 US-LA1 Pointe-aux-Chenes Brackish Marsh, United States, FLUXNET-CH4 Community Product [data set], https://doi.org/10.18140/FLX/1669680, 2020a.
Holm, G. O., Perez, B. C., McWhorter, D. E., Krauss, K. W., Raynie, R. C., and Killebrew, C. J.: FLUXNET-CH4 US-LA2 Salvador WMA Freshwater Marsh, United States, FLUXNET-CH4 Community Product [data set], https://doi.org/10.18140/FLX/1669681, 2020b.
Hwang, Y., Ryu, Y., Huang, Y., Kim, J., Iwata, H., and Kang, M.: Comprehensive assessments of carbon dynamics in an intermittently-irrigated rice paddy, Agr. Forest Meteorol., 285–286, 107933, https://doi.org/10.1016/j.agrformet.2020.107933, 2020.
Iwata, H.: FLUXNET-CH4 JP-Mse Mase rice paddy field, Japan, FLUXNET-CH4 Community Product [data set], https://doi.org/10.18140/FLX/1669647, 2020a.
Iwata, H.: FLUXNET-CH4 JP-SwL Suwa Lake, Japan, FLUXNET-CH4 Community Product [data set], https://doi.org/10.18140/FLX/1669648, 2020b.
Iwata, H., Mano, M., Ono, K., Tokida, T., Kawazoe, T., Kosugi, Y., Sakabe, A., Takahashi, K., and Miyata, A.: Exploring sub-daily to seasonal variations in methane exchange in a single-crop rice paddy in central Japan, Atmos. Environ., 179, 156–165, https://doi.org/10.1016/j.atmosenv.2018.02.015, 2018.
Iwata, H., Ueyama, M., and Harazono, Y.: FLUXNET-CH4 US-Uaf University of Alaska, Fairbanks, United States, FLUXNET-CH4 Community Product [data set], https://doi.org/10.18140/FLX/1669701, 2020.
Jacotot, A., Gogo, S., and Laggoun-Défarge, F.: FLUXNET-CH4 FR-LGt La Guette, France, FLUXNET-CH4 Community Product [data set], https://doi.org/10.18140/FLX/1669641, 2020.
Jönsson, P. and Eklundh, L.: Seasonality extraction by function fitting to time-series of satellite sensor data, IEEE T. Geosci. Remote, 40, 1824–1832, https://doi.org/10.1109/tgrs.2002.802519, 2002.
Jönsson, P. and Eklundh, L.: TIMESAT – a program for analyzing time-series of satellite sensor data. Comput. Geosci., 30, 833–845, https://doi.org/10.1016/j.cageo.2004.05.006, 2004.
Jung, M., Reichstein, M., and Bondeau, A.: Towards global empirical upscaling of FLUXNET eddy covariance observations: validation of a model tree ensemble approach using a biosphere model, Biogeosciences, 6, 2001–2013, https://doi.org/10.5194/bg-6-2001-2009, 2009.
Jung, M., Schwalm, C., Migliavacca, M., Walther, S., Camps-Valls, G., Koirala, S., Anthoni, P., Besnard, S., Bodesheim, P., Carvalhais, N., Chevallier, F., Gans, F., Goll, D. S., Haverd, V., Köhler, P., Ichii, K., Jain, A. K., Liu, J., Lombardozzi, D., Nabel, J. E. M. S., Nelson, J. A., O'Sullivan, M., Pallandt, M., Papale, D., Peters, W., Pongratz, J., Rödenbeck, C., Sitch, S., Tramontana, G., Walker, A., Weber, U., and Reichstein, M.: Scaling carbon fluxes from eddy covariance sites to globe: synthesis and evaluation of the FLUXCOM approach, Biogeosciences, 17, 1343–1365, https://doi.org/10.5194/bg-17-1343-2020, 2020.
Kim, Y., Johnson, M. S., Knox, S. H., Andrew Black, T., Dalmagro, H. J., Kang, M., Kim, J., and Baldocchi, D.: Gap-filling approaches for eddy covariance methane fluxes: A comparison of three machine learning algorithms and a traditional method with principal component analysis, Glob. Change Biol., 26, 1499–1518, https://doi.org/10.1111/gcb.14845, 2020.
Kittler, F., Heimann, M., Kolle, O., Zimov, N., Zimov, S., and Göckede, M.: Long-Term Drainage Reduces CO2 Uptake and CH4 Emissions in a Siberian Permafrost Ecosystem: Drainage impact on Arctic carbon cycle, Global Biogeochem. Cy., 31, 1704–1717, https://doi.org/10.1002/2017GB005774, 2017.
Knox, S., Matthes, J. H., Verfaillie, J., and Baldocchi, D.: FLUXNET-CH4 US-Twt Twitchell Island, United States, FLUXNET-CH4 Community Product [data set], https://doi.org/10.18140/FLX/1669700, 2020.
Knox, S. H., Sturtevant, C., Matthes, J. H., Koteen, L., Verfaillie, J., and Baldocchi, D.: Agricultural peatland restoration: effects of land-use change on greenhouse gas (CO2 and CH4) fluxes in the Sacramento-San Joaquin Delta, Glob. Change Biol., 21, 750–765, https://doi.org/10.1111/gcb.12745, 2015.
Knox, S. H., Matthes, J. H., Sturtevant, C., Oikawa, P. Y., Verfaillie, J., and Baldocchi, D.: Biophysical controls on interannual variability in ecosystem-scale CO2 and CH4 exchange in a California rice paddy, J. Geophys. Res.-Biogeo., 121, 978–1001, https://doi.org/10.1002/2015jg003247, 2016.
Knox, S. H., Jackson, R. B., Poulter, B., McNicol, G., Fluet-Chouinard, E., Zhang, Z., Hugelius, G., Bousquet, P., Canadell, J. G., Saunois, M., Papale, D., Chu, H., Keenan, T. F., Baldocchi, D., Torn, M. S., Mammarella, I., Trotta, C., Aurela, M., Bohrer, G., Campbell, D.I., Cescatti, A., Chamberlain, S., Chen, J., Chen, W., Dengel, S., Desai, A. R., Euskirchen, E., Friborg, T., Gasbarra, D., Goded, I., Goeckede, M., Heimann, M., Helbig, M., Hirano, T., Hollinger, D. Y., Iwata, H., Jurasinski, G., Kang, M., Koebsch, F., Mammarella, I., Nilsson, M. B., Ono, K., Peichl, M., Peltola, O., Ryu, Y., Sachs, T., Sakabe, A., Sparks, J., Tuittila, E.-S., Vourlitis, G. L., Wong, G. X., Windham-Myers, L., Poulter, B., and Jackson, R. B.: FLUXNET-CH4 Synthesis Activity: Objectives, Observations, and Future Directions, B. Am. Meterol. Soc., 100, 2607–2632, https://doi.org/10.1175/bams-d-18-0268.1, 2019.
Koebsch, F. and Jurasinski, G.: FLUXNET-CH4 DE-Hte Huetelmoor, Germany, FLUXNET-CH4 Community Product [data set], https://doi.org/10.18140/FLX/1669634, 2020.
Koebsch, F., Jurasinski, G., Koch, M., Hofmann, J., and Glatzel, S.: Controls for multi-scale temporal variation in ecosystem methane exchange during the growing season of a permanently inundated fen, Agr. Forest Meteorol., 204, 94–105, https://doi.org/10.1016/j.agrformet.2015.02.002, 2015.
Koebsch, F., Winkel, M., Liebner, S., Liu, B., Westphal, J., Schmiedinger, I., Spitzy, A., Gehre, M., Jurasinski, G., Köhler, S., Unger, V., Koch, M., Sachs, T., and Böttcher, M. E.: Sulfate deprivation triggers high methane production in a disturbed and rewetted coastal peatland, Biogeosciences, 16, 1937–1953, https://doi.org/10.5194/bg-16-1937-2019, 2019.
Kuznetsova, A., Brockhoff, P. B., and Christensen, R. H. B.: lmerTest Package: Tests in Linear Mixed Effects Models, J. Stat. Softw., 82, 1–26, https://doi.org/10.18637/jss.v082.i13, 2017.
Kwon, M. J., Beulig, F., Ilie, I., Wildner, M., Küsel, K., Merbold, L., Mahecha, M. D., Zimov, N., Zimov, S. A., Heimann, M., Schuur, E. A. G., Kostka, J. E., Kolle, O., Hilke, I., and Göckede, M.: Plants, microorganisms, and soil temperatures contribute to a decrease in methane fluxes on a drained Arctic floodplain, Glob. Change Biol., 23, 2396–2412, https://doi.org/10.1111/gcb.13558, 2017.
Lai, D. Y. F.: Methane Dynamics in Northern Peatlands: A Review, Pedosphere, 19, 409–421, https://doi.org/10.1016/s1002-0160(09)00003-4, 2009.
Lai, D. Y. F., Roulet, N. T., and Moore, T. R.: The spatial and temporal relationships between CO2 and CH4 exchange in a temperate ombrotrophic bog, Atmos. Environ, 89, 249–259, https://doi.org/10.1016/j.atmosenv.2014.02.034, 2014.
Lai, D. Y. F.: FLUXNET-CH4 HK-MPM Mai Po Mangrove, Hong Kong, FLUXNET-CH4 Community Product [data set], https://doi.org/10.18140/FLX/1669642, 2020.
Lasslop, G., Reichstein, M., Papale, D., Richardson, A. D., Arneth, A., Barr, A., Stoy, P., and Wohlfahrt, G.: Separation of net ecosystem exchange into assimilation and respiration using a light response curve approach: critical issues and global evaluation, Glob. Change Biol., 16, 187–208, https://doi.org/10.1111/j.1365-2486.2009.02041.x, 2010.
Liu, J., Zhou, Y., Valach, A., Shortt, R., Kasak, K., Rey-Sanchez, C., Hemes, K. S., Baldocchi, D., and Lai, D. Y. F.: Methane emissions reduce the radiative cooling effect of a subtropical estuarine mangrove wetland by half, Glob. Change Biol., 26, 4998–5016, https://doi.org/10.1111/gcb.15247, 2020.
Lohila, A., Aurela, M., Tuovinen, J.-P., Laurila, T., Hatakka, J., Rainne, J., and Mäkelä, T.: FLUXNET-CH4 FI-Lom Lompolojankka, Finland, FLUXNET-CH4 Community Product [data set], https://doi.org/10.18140/FLX/1669638, 2020.
Madsen, K., Nielsen, H. B., and Tingleff, O.: Methods for non-linear least squares problems, Informatics and Mathematical Modelling, Technical Univeristy of Denmark, 2nd Edn., 2004.
Maier, R., Hörtnagl, L., and Buchmann, N.: FLUXNET-CH4 CH-Oe2 Oensingen crop, FLUXNET-CH4 Community Product [data set], Switzerland, https://doi.org/10.18140/FLX/1669631, 2020.
Mahecha, M. D., Gans, F., Sippel, S., Donges, J. F., Kaminski, T., Metzger, S., Migliavacca, M., Papale, D., Rammig, A., and Zscheischler, J.: Detecting impacts of extreme events with ecological in situ monitoring networks, Biogeosciences, 14, 4255–4277, https://doi.org/10.5194/bg-14-4255-2017, 2017.
Malhotra, A. and Roulet, N. T.: Environmental correlates of peatland carbon fluxes in a thawing landscape: do transitional thaw stages matter?, Biogeosciences, 12, 3119–3130, https://doi.org/10.5194/bg-12-3119-2015, 2015.
Mammarella, I, Rannik, Ü., Kolari, P., Levula, J., and Vesala, T.: FLUXNET-CH4 FI-Hyy Hyytiala, Finland, FLUXNET-CH4 Community Product [data set], https://doi.org/10.18140/FLX/1669637, 2020.
Manca, G. and Goded, I. FLUXNET-CH4 IT-Cas Castellaro, Italy, FLUXNET-CH4 Community Product [data set], https://doi.org/10.18140/FLX/1669645, 2020.
Mastepanov, M., Sigsgaard, C., Tagesson, T., Ström, L., Tamstorf, M. P., Lund, M., and Christensen, T. R.: Revisiting factors controlling methane emissions from high-Arctic tundra, Biogeosciences, 10, 5139–5158, https://doi.org/10.5194/bg-10-5139-2013, 2013.
Matthes, J. H., Sturtevant, C., Oikawa, P., Chamberlain, S. D., Szutu, D., Ortiz, A. A., Verfaillie, J., and Baldocchi, D.: FLUXNET-CH4 US-Myb Mayberry Wetland, United States, FLUXNET-CH4 Community Product [data set], https://doi.org/10.18140/FLX/1669685, 2020.
Matthews, E., Johnson, M. S., Genovese, V., Du, J., and Bastviken, D.: Methane emission from high latitude lakes: methane-centric lake classification and satellite-driven annual cycle of emissions. Sci. Rep.-UK, 10, 12465, https://doi.org/10.1038/s41598-020-68246-1, 2020.
Megonigal, J. P., Whalen, S. C., Tissue, D. T., Bovard, B. D., Allen, A. S., and Albert, D. B.: A Plant-Soil-Atmosphere Microcosm for Tracing Radiocarbon from Photosynthesis through Methanogenesis, Soil Sci. Soc. Am. J., 63, 665–671, https://doi.org/10.2136/sssaj1999.03615995006300030033x, 1999.
Meijide, A., Manca, G., Goded, I., Magliulo, V., di Tommasi, P., Seufert, G., and Cescatti, A.: Seasonal trends and environmental controls of methane emissions in a rice paddy field in Northern Italy, Biogeosciences, 8, 3809–3821, https://doi.org/10.5194/bg-8-3809-2011, 2011.
Melloh, R. A. and Crill, P. M.: Winter methane dynamics in a temperate peatland, Global Biogeochem. Cy., 10, 247–254, https://doi.org/10.1029/96gb00365, 1996.
Melton, J. R., Wania, R., Hodson, E. L., Poulter, B., Ringeval, B., Spahni, R., Bohn, T., Avis, C. A., Beerling, D. J., Chen, G., Eliseev, A. V., Denisov, S. N., Hopcroft, P. O., Lettenmaier, D. P., Riley, W. J., Singarayer, J. S., Subin, Z. M., Tian, H., Zürcher, S., Brovkin, V., van Bodegom, P. M., Kleinen, T., Yu, Z. C., and Kaplan, J. O.: Present state of global wetland extent and wetland methane modelling: conclusions from a model inter-comparison project (WETCHIMP), Biogeosciences, 10, 753–788, https://doi.org/10.5194/bg-10-753-2013, 2013.
Merbold, L.: FLUXNET-CH4 RU-Che Cherski, Russian Federation, FLUXNET-CH4 Community Product [data set], https://doi.org/10.18140/FLX/1669655, 2020.
Merbold, L., Fuchs, K., Buchmann, N., and Hörtnagl, L.: FLUXNET-CH4 CH-Cha Chamau, Switzerland, FLUXNET-CH4 Community Product [data set], https://doi.org/10.18140/FLX/1669629, 2020a.
Merbold, L., Hörtnagl, L., and Buchmann, N.: FLUXNET-CH4 CH-Dav Davos, Switzerland, FLUXNET-CH4 Community Product [data set], https://doi.org/10.18140/FLX/1669630, 2020b.
Meyer, H. and Pebesma, E.: Predicting into unknown space? Estimating the area of applicability of spatial prediction models, arXiv [preprint], arXiv:2005.07939, 2020.
Mishra, S. R., Pattnaik, P., Sethunathan, N., and Adhya, T. K.: Anion-Mediated Salinity Affecting Methane Production in a Flooded Alluvial Soil. Geomicrobiol. J., 20, 579–586, https://doi.org/10.1080/713851167, 2003.
Moffat, A. M., Papale, D., Reichstein, M., Hollinger, D. Y., Richardson, A. D., Barr, A. G., Beckstein, C., Braswell, B. H., Churkina, G., Desai, A. R., Falge, E., Gove, J. H., Heimann, M., Hui, D., Jarvis, A. J., Kattge, J., Noormets, A., and Stauch, V. J.: Comprehensive comparison of gap-filling techniques for eddy covariance net carbon fluxes, Agr. Forest Meteorol., 147, 209–232, https://doi.org/10.1016/j.agrformet.2007.08.011, 2007.
Myhre, G., Shindell, D., Bréon, F.-M., Collins, W., Fuglestvedt, J., Huang, J., Koch, D., Lamarque, J.-F., Lee, D., Mendoza, B., Nakajima, T., Robock, A., Stephens, G., Takemura, T., and Zhang, H.: Anthropogenic and Natural Radiative Forcing Supplementary Material, in: Climate Change 2013: The Physical Science Basis, Contribution of Working Group I to the Fifth Assessment Report of the Intergovernmental Panel on Climate Change, edited by: Stocker, T. F., Qin, D., Plattner, G.-K., Tignor, M., Allen, S. K., Boschung, J., Nauels, A., Xia, Y., Bex, V., and Midgley, P. M., 2013.
Nemitz, E., Mammarella, I., Ibrom, A., Aurela, M., Burba, G. G., Dengel, S., Gielen, B., Grelle, A., Heinesch, B., Herbst, M., Hörtnagl, L., Klemedtsson, L., Lindroth, A., Lohila, A., McDermitt, D. K., Meier, P., Merbold, L., Nelson, D., Nicolini, G., Nilsson, M. B., Peltola, O., Rinne, J., and Zahniser, M.: Standardisation of eddy-covariance flux measurements of methane and nitrous oxide, Int. Agrophy., 32, 517–549, https://doi.org/10.1515/intag-2017-0042, 2018.
Nielsen, H. B.: Damping parameter in Marquardt's method, Department of Mathematical Modeling, IMM, Technical University of Denmark, Technical Report, IMM-REP-1999-05, 1999.
Nilsson, M. B. and Peichl, M.: FLUXNET-CH4 SE-Deg Degero, Sweden, FLUXNET-CH4 Community Product [data set], https://doi.org/10.18140/FLX/1669659, 2020.
Niu, S. and Chen, W.: FLUXNET-CH4 CN-Hgu Hongyuan, China, FLUXNET-CH4 Community Product [data set], https://doi.org/10.18140/FLX/1669632, 2020.
Noormets, A., King, J., Mitra, B., Miao, G., Aguilos, W., Minick, W., Prajapati, P., and Domec, J.-C.: FLUXNET-CH4 US-NC4 NC_AlligatorRiver, United States, FLUXNET-CH4 Community Product [data set], https://doi.org/10.18140/FLX/1669686, 2020.
Oikawa, P. Y., Jenerette, G. D., Knox, S. H., Sturtevant, C., Verfaillie, J., Dronova, I., Poindexter, C. M., Eichelmann, E., and Baldocchi, D. D.: Evaluation of a hierarchy of models reveals importance of substrate limitation for predicting carbon dioxide and methane exchange in restored wetlands, J. Geophys. Res.-Biogeo., 122, 145–167, https://doi.org/10.1002/2016JG003438, 2017.
Oikawa, P.: FLUXNET-CH4 US-EDN Eden Landing Ecological Reserve, United States, FLUXNET-CH4 Community Product [data set], https://doi.org/10.18140/FLX/1669673, 2020.
Olefeldt, D., Turetsky, M. R., Crill, P. M., and McGuire, A. D.: Environmental and physical controls on northern terrestrial methane emissions across permafrost zones, Glob. Change Biol., 19, 589–603, https://doi.org/10.1111/gcb.12071, 2013.
Papale, D., Andrew Black, T., Carvalhais, N., Cescatti, A., Chen, J., Jung, M., Kiely, G., Lasslop, G., Mahecha, M. D., Margolis, H., Merbold, L., Montagnani, L., Moors, E., Olesen, J. E., Reichstein, M., Tramontana, G., van Gorsel, E., Wohlfahrt, G., and Ráduly, B.: Effect of spatial sampling from European flux towers for estimating carbon and water fluxes with artificial neural networks, J. Geophys. Res.-Biogeo., 120, 1941–1957, https://doi.org/10.1002/2015jg002997, 2015.
Parmentier, F. J. W., van Huissteden, J., van der Molen, M. K., Schaepman-Strub, G., Karsanaev, S. A., Maximov, T. C., and Dolman, A. J.: Spatial and temporal dynamics in eddy covariance observations of methane fluxes at a tundra site in northeastern Siberia, J. Geophys. Res., 116, 1368, https://doi.org/10.1029/2010JG001637, 2011.
Pastorello, G., Trotta, C., Canfora, E., Chu, H., Christianson, D., Cheah, Y.-W., Poindexter, C., Chen, J., Elbashandy, A., Humphrey, M., Isaac, P., Polidori, D., Ribeca, A., van Ingen, C., Zhang, L., Amiro, B., Ammann, C., Arain, M. A., Ardö, J., et al.: The FLUXNET2015 dataset and the ONEFlux processing pipeline for eddy covariance data, Sci. Data, 7, 225, https://doi.org/10.1038/s41597-020-0534-3, 2020.
Pattnaik, P., Mishra, S. R., Bharati, K., Mohanty, S. R., Sethunathan, N., and Adhya, T. K.: Influence of salinity on methanogenesis and associated microflora in tropical rice soils, Microbiol. Res., 155, 215–220, https://doi.org/10.1016/S0944-5013(00)80035-X, 2000.
Poffenbarger, H. J., Needelman, B. A., and Patrick Megonigal, J.: Salinity Influence on Methane Emissions from Tidal Marshes, Wetlands, 31, 831–842, https://doi.org/10.1007/s13157-011-0197-0, 2011.
Poulter, B., Bousquet, P., Canadell, J. G., Ciais, P., Peregon, A., Saunois, M., Arora, V. K., Beerling, D. J., Brovkin, V., Jones, C. D., Joos, F., Gedney, N., Ito, A., Kleinen, T., Koven, C. D., McDonald, K., Melton, J. R., Peng, C., Peng, S., Prigent, C., Schroeder, R., Riley, W. J., Saito, M., Spahni, R., Tian, H., Taylor, L., Viovy, N., Wilton, D., Wiltshire, A., Xu, X., Zhang, B., Zhang, Z., and Zhu, Q.: Global wetland contribution to 2000–2012 atmospheric methane growth rate dynamics, Environ. Res. Lett., 12, 094013, https://doi.org/10.1088/1748-9326/aa8391, 2017.
R Core Team: R: A Language and Environment for Statistical Computing. R Foundation for Statistical Computing, Vienna, 2018.
Reba, M., Runkle, B., and Suvocarev, K.: FLUXNET-CH4 US-HRC Humnoke Farm Rice Field – Field C, United States, FLUXNET-CH4 Community Product [data set], https://doi.org/10.18140/FLX/1669677, 2020.
Reichstein, M., Falge, E., Baldocchi, D., Papale, D., Aubinet, M., Berbigier, P., Bernhofer, C., Buchmann, N., Gilmanov, T., Granier, A., Grunwald, T., Havrankova, K., Ilvesniemi, H., Janous, D., Knohl, A., Laurila, T., Lohila, A., Loustau, D., Matteucci, G., Meyers, T., Miglietta, F., Ourcival, J.-M., Pumpanen, J., Rambal, S., Rotenberg, E., Sanz, M., Tenhunen, J., Seufert, G., Vaccari, F., Vesala, T., Yakir, D., and Valentini, R.: On the separation of net ecosystem exchange into assimilation and ecosystem respiration: review and improved algorithm, Glob. Change Biol., 11, 1424–1439, https://doi.org/10.1111/j.1365-2486.2005.001002.x, 2005.
Rey-Sanchez, C., Szutu, D., Shortt, R., Chamberlain, S. D., Verfaillie, J., and Baldocchi, D.: FLUXNET-CH4 US-Bi1 Bouldin Island Alfalfa, United States, FLUXNET-CH4 Community Product [data set], https://doi.org/10.18140/FLX/1669666, 2020a.
Rey-Sanchez, C., Szutu, D., Hemes, K., Verfaillie, J., and Baldocchi, D.: FLUXNET-CH4 US-Bi2 Bouldin Island corn, United States, FLUXNET-CH4 Community Product [data set], https://doi.org/10.18140/FLX/1669667, 2020b.
Richardson, A. D. and Hollinger, D. Y.: A method to estimate the additional uncertainty in gap-filled NEE resulting from long gaps in the CO2 flux record, Agr. Forest Meteorol., 147, 199–208, https://doi.org/10.1016/j.agrformet.2007.06.004, 2007.
Richardson, A. D. and Hollinger, D. Y.: FLUXNET-CH4 US-Ho1 Howland Forest (main tower), United States, FLUXNET-CH4 Community Product [data set], https://doi.org/10.18140/FLX/1669675, 2020.
Richardson, A. D., Hollinger, D. Y., Burba, G. G., Davis, K. J., Flanagan, L. B., Katul, G. G., William Munger, J., Ricciuto, D. M., Stoy, P. C., Suyker, A. E., Verma, S. B., and Wofsy, S. C.: A multi-site analysis of random error in tower-based measurements of carbon and energy fluxes, Agr. Forest Meteorol., 136, 1–18, https://doi.org/10.1016/j.agrformet.2006.01.007, 2006.
Richardson, A. D., Mahecha, M. D., Falge, E., Kattge, J., Moffat, A. M., Papale, D., Reichstein, M., Stauch, V. J., Braswell, B. H., Churkina, G., Kruijt, B., and Hollinger, D. Y.: Statistical properties of random CO2 flux measurement uncertainty inferred from model residuals, Agr. Forest Meteorol., 148, 38–50, https://doi.org/10.1016/j.agrformet.2007.09.001, 2008.
Richardson, A. D., Aubinet, M., Barr, A. G., Hollinger, D. Y., Ibrom, A., Lasslop, G., and Reichstein, M.: Uncertainty quantification, Eddy Covariance: A Practical Guide to Measurement and Data Analysis, edited by: Aubinet, M., Vesala, T., and Papale, D.: Springer Atmospheric Sciences, 2012.
Rinne, J., Riutta, T., Pihlatie, M., Aurela, M., Haapanala, S., Tuovinen, J.-P., Tuittila, E.-S., and Vesala, T.: Annual cycle of methane emission from a boreal fen measured by the eddy covariance technique, Tellus B, 59, 449–457, https://doi.org/10.1111/j.1600-0889.2007.00261.x, 2007.
Runkle, B., Reba, M., and Suvocarev, K.: FLUXNET-CH4 US-HRA Humnoke Farm Rice Field – Field A, United States, FLUXNET-CH4 Community Product [data set], https://doi.org/10.18140/FLX/1669676, 2020.
Runkle, B. R. K., Suvočarev, K., Reba, M. L., Reavis, C. W., Smith, S. F., Chiu, Y.-L., and Fong, B.: Methane Emission Reductions from the Alternate Wetting and Drying of Rice Fields Detected Using the Eddy Covariance Method, Environ. Sci. Technol., 53, 671–681, https://doi.org/10.1021/acs.est.8b05535, 2019.
Ryu, Y., Kang, M., and Kim, J.: FLUXNET-CH4 KR-CRK Cheorwon Rice paddy, Korea, Republic of, FLUXNET-CH4 Community Product [data set], https://doi.org/10.18140/FLX/1669649, 2020.
Sachs, T. and Wille, C.: FLUXNET-CH4 DE-Dgw Dagowsee, Germany, FLUXNET-CH4 Community Product [data set], https://doi.org/10.18140/FLX/1669633, 2020a.
Sachs, T. and Wille, C.: FLUXNET-CH4 DE-Zrk Zarnekow, Germany, FLUXNET-CH4 Community Product [data set], https://doi.org/10.18140/FLX/1669636, 2020b.
Sachs, T., Giebels, M., Boike, J., and Kutzbach, L.: Environmental controls on CH4 emission from polygonal tundra on the microsite scale in the Lena river delta, Siberia: controls on tundra CH4 flux and scaling, Glob. Change Biol., 16, 3096–3110, https://doi.org/10.1111/j.1365-2486.2010.02232.x, 2010.
Sakabe, A., Itoh, M., Hirano, T., and Kusin, K.: FLUXNET-CH4 ID-Pag Palangkaraya undrained forest, Indonesia, FLUXNET-CH4 Community Product [data set], https://doi.org/10.18140/FLX/1669643, 2020.
Saunois, M., Bousquet, P., Poulter, B., Peregon, A., Ciais, P., Canadell, J. G., Dlugokencky, E. J., Etiope, G., Bastviken, D., Houweling, S., Janssens-Maenhout, G., Tubiello, F. N., Castaldi, S., Jackson, R. B., Alexe, M., Arora, V. K., Beerling, D. J., Bergamaschi, P., Blake, D. R., Brailsford, G., Brovkin, V., Bruhwiler, L., Crevoisier, C., Crill, P., Covey, K., Curry, C., Frankenberg, C., Gedney, N., Höglund-Isaksson, L., Ishizawa, M., Ito, A., Joos, F., Kim, H.-S., Kleinen, T., Krummel, P., Lamarque, J.-F., Langenfelds, R., Locatelli, R., Machida, T., Maksyutov, S., McDonald, K. C., Marshall, J., Melton, J. R., Morino, I., Naik, V., O'Doherty, S., Parmentier, F.-J. W., Patra, P. K., Peng, C., Peng, S., Peters, G. P., Pison, I., Prigent, C., Prinn, R., Ramonet, M., Riley, W. J., Saito, M., Santini, M., Schroeder, R., Simpson, I. J., Spahni, R., Steele, P., Takizawa, A., Thornton, B. F., Tian, H., Tohjima, Y., Viovy, N., Voulgarakis, A., van Weele, M., van der Werf, G. R., Weiss, R., Wiedinmyer, C., Wilton, D. J., Wiltshire, A., Worthy, D., Wunch, D., Xu, X., Yoshida, Y., Zhang, B., Zhang, Z., and Zhu, Q.: The global methane budget 2000–2012, Earth Syst. Sci. Data, 8, 697–751, https://doi.org/10.5194/essd-8-697-2016, 2016.
Saunois, M., Stavert, A. R., Poulter, B., Bousquet, P., Canadell, J. G., Jackson, R. B., Raymond, P. A., Dlugokencky, E. J., Houweling, S., Patra, P. K., Ciais, P., Arora, V. K., Bastviken, D., Bergamaschi, P., Blake, D. R., Brailsford, G., Bruhwiler, L., Carlson, K. M., Carrol, M., Castaldi, S., Chandra, N., Crevoisier, C., Crill, P. M., Covey, K., Curry, C. L., Etiope, G., Frankenberg, C., Gedney, N., Hegglin, M. I., Höglund-Isaksson, L., Hugelius, G., Ishizawa, M., Ito, A., Janssens-Maenhout, G., Jensen, K. M., Joos, F., Kleinen, T., Krummel, P. B., Langenfelds, R. L., Laruelle, G. G., Liu, L., Machida, T., Maksyutov, S., McDonald, K. C., McNorton, J., Miller, P. A., Melton, J. R., Morino, I., Müller, J., Murguia-Flores, F., Naik, V., Niwa, Y., Noce, S., O'Doherty, S., Parker, R. J., Peng, C., Peng, S., Peters, G. P., Prigent, C., Prinn, R., Ramonet, M., Regnier, P., Riley, W. J., Rosentreter, J. A., Segers, A., Simpson, I. J., Shi, H., Smith, S. J., Steele, L. P., Thornton, B. F., Tian, H., Tohjima, Y., Tubiello, F. N., Tsuruta, A., Viovy, N., Voulgarakis, A., Weber, T. S., van Weele, M., van der Werf, G. R., Weiss, R. F., Worthy, D., Wunch, D., Yin, Y., Yoshida, Y., Zhang, W., Zhang, Z., Zhao, Y., Zheng, B., Zhu, Q., Zhu, Q., and Zhuang, Q.: The Global Methane Budget 2000–2017, Earth Syst. Sci. Data, 12, 1561–1623, https://doi.org/10.5194/essd-12-1561-2020, 2020.
Schäfer, K.: FLUXNET-CH4 US-MRM Marsh Resource Meadowlands Mitigation Bank, United States, FLUXNET-CH4 Community Product [data set], https://doi.org/10.18140/FLX/1669684, 2020.
Schmid, H. P. and Klatt, J.: FLUXNET-CH4 DE-SfN Schechenfilz Nord, Germany, FLUXNET-CH4 Community Product [data set], https://doi.org/10.18140/FLX/1669635, 2020.
Schuur, E. A.: FLUXNET-CH4 US-EML Eight Mile Lake Permafrost thaw gradient, Healy Alaska, United States, FLUXNET-CH4 Community Product [data set], https://doi.org/10.18140/FLX/1669674, 2020.
Seyfferth, A. L., Bothfeld, F., Vargas, R., Stuckey, J. W., Wang, J., Kearns, K., Michael, H. A., Guimond, J., Yu, X., and Sparks, D. L.: Spatial and temporal heterogeneity of geochemical controls on carbon cycling in a tidal salt marsh, Geochim. Cosmochim. Ac., 282, 1–18, https://doi.org/10.1016/j.gca.2020.05.013, 2020.
Shortt, R., Hemes, K., Szutu, D., Verfaillie, J., and Baldocchi, D.: FLUXNET-CH4 US-Sne Sherman Island Restored Wetland, United States, FLUXNET-CH4 Community Product [data set], https://doi.org/10.18140/FLX/1669693, 2020.
Sims, D. A., Rahman, A. F., Cordova, V. D., El-Masri, B. Z., Baldocchi, D. D., Flanagan, L. B., Goldstein, A. H., Hollinger, D. Y., Misson, L., Monson, R. K., Oechel, W. C., Schmid, H. P., Wofsy, S. C., and Xu, L.: On the use of MODIS EVI to assess gross primary productivity of North American ecosystems, J. Geophys. Res.-Biogeo., 111, G04015, https://doi.org/10.1029/2006jg000162, 2006.
Sonnentag, O. and Helbig, M.: FLUXNET-CH4 CA-SCB Scotty Creek Bog, Canada, FLUXNET-CH4 Community Product [data set], https://doi.org/10.18140/FLX/1669613, 2020a.
Sonnentag, O. and Helbig, M.: FLUXNET-CH4 CA-SCC Scotty Creek Landscape, Canada, FLUXNET-CH4 Community Product [data set], https://doi.org/10.18140/FLX/1669628, 2020b.
Spahni, R., Wania, R., Neef, L., van Weele, M., Pison, I., Bousquet, P., Frankenberg, C., Foster, P. N., Joos, F., Prentice, I. C., and van Velthoven, P.: Constraining global methane emissions and uptake by ecosystems, Biogeosciences, 8, 1643–1665, https://doi.org/10.5194/bg-8-1643-2011, 2011.
Sparks, J. P.: FLUXNET-CH4 US-MAC MacArthur Agro-Ecology, United States, FLUXNET-CH4 Community Product [data set], https://doi.org/10.18140/FLX/1669683, 2020.
Sturtevant, C. S., Ruddell, B. L., Knox, S. H., Verfaillie, J. G., Matthes, J. H., Oikawa, P. Y., and Baldocchi, D. D.: Identifying scale-emergent, nonlinear, asynchronous processes of wetland methane exchange, J. Geophys. Res.-Biogeo., 121, 188–204, https://doi.org/10.1002/2015JG003054, 2016.
Tagesson, T., Mölder, M., Mastepanov, M., Sigsgaard, C., Tamstorf, M. P., Lund, M., Falk, J. M., Lindroth, A., Christensen, T. R., and Ström, L.: Land-atmosphere exchange of methane from soil thawing to soil freezing in a high-Arctic wet tundra ecosystem, Glob. Change Biol., 18, 1928–1940, https://doi.org/10.1111/j.1365-2486.2012.02647.x, 2012.
Taoka, T., Iwata, H., Hirata, R., Takahashi, Y., Miyabara, Y., and Itoh, M.: Environmental Controls on Diffusive and Ebullitive Methane Emission at a Sub-Daily Time Scale in the Littoral Zone of a Mid-Latitude Shallow Lake, J. Geophys. Res.-Biogeo., 125, e2020JG005753, https://doi.org/10.1029/2020JG005753, 2020.
Torn, M. and Dengel, S.: FLUXNET-CH4 US-NGB NGEE Arctic Barrow, United States, FLUXNET-CH4 Community Product [data set], https:// https://doi.org/10.18140/FLX/1669687, 2020a.
Torn, M. and Dengel, S.: FLUXNET-CH4 US-NGC NGEE Arctic Council, United States, FLUXNET-CH4 Community Product [data set], https://doi.org/10.18140/FLX/1669688, 2020b.
Treat, C. C., Anthony Bloom, A., and Marushchak, M. E.: Nongrowing season methane emissions-a significant component of annual emissions across northern ecosystems, Glob. Change Biol., 24, 3331–3343, https://doi.org/10.1111/gcb.14137, 2018.
Turetsky, M. R., Kotowska, A., Bubier, J., Dise, N. B., Crill, P., Hornibrook, E. R. C., Minkkinen, K., Moore, T. R., Myers-Smith, I. H., Nykänen, H., Olefeldt, D., Rinne, J., Saarnio, S., Shurpali, N., Tuittila, E.-S., Waddington, J. M., White, J. R., Wickland, K. P., and Wilmking, M.: A synthesis of methane emissions from 71 northern, temperate, and subtropical wetlands, Glob. Change Biol., 20, 2183–2197, https://doi.org/10.1111/gcb.12580, 2014.
Ueyama, M., Hirano, T., and Kominami, Y.: FLUXNET-CH4 JP-BBY Bibai bog, Japan, FLUXNET-CH4 Community Product [data set], https://doi.org/10.18140/FLX/1669646, 2020.
Valach, A., Szutu, D., Eichelmann, E., Knox, S., Verfaillie, J., and Baldocchi, D.: FLUXNET-CH4 US-Tw1 Twitchell Wetland West Pond, United States, FLUXNET-CH4 Community Product [data set], https://doi.org/10.18140/FLX/1669696, 2020a.
Valach, A., Kasak, K., Szutu, D., Verfaillie, J., and Baldocchi, D.: FLUXNET-CH4 US-Tw5 East Pond Wetland, United States, FLUXNET-CH4 Community Product [data set], https://doi.org/10.18140/FLX/1669699, 2020b.
Varlagin, A.: FLUXNET-CH4 RU-Fy2 Fyodorovskoye dry spruce, Russian Federation, FLUXNET-CH4 Community Product [data set], https://doi.org/10.18140/FLX/1669657, 2020.
Vazquez-Lule, A. and Vargas, R.: FLUXNET-CH4 US-StJ St Jones Reserve, United States, FLUXNET-CH4 Community Product [data set], https://doi.org/10.18140/FLX/1669695, 2020.
Vázquez-Lule, A. and Vargas, R.: Biophysical drivers of net ecosystem and methane exchange across phenological phases in a tidal salt marsh, Agr. Forest Meteorol., 300, 108309, https://doi.org/10.1016/j.agrformet.2020.108309, 2021.
Verma, S. B., Ullman, F. G., Billesbach, D., Clement, R. J., Kim, J., and Verry, E. S.: Eddy correlation measurements of methane flux in a northern peatland ecosystem, Bound.-Lay. Meteorol., 58, 289–304, https://doi.org/10.1007/BF02033829, 1992.
Vermote, E.: MOD09A1 MODIS Surface Reflectance 8-Day L3 Global 500m SIN Grid V006, NASA EOSDIS Land Processes DAAC [data set], https://doi.org/10.5067/MODIS/MOD09A1.006 (Terra), 2015.
Vesala, T., Tuittila, E.-S., Mammarella, I., and Alekseychik, P.: FLUXNET-CH4 FI-Si2 Siikaneva-2 Bog, Finland, FLUXNET-CH4 Community Product [data set], https://doi.org/10.18140/FLX/1669639, 2020a.
Vesala, T., Tuittila, E.-S., Mammarella, I., and Rinne, J.: FLUXNET-CH4 FI-Sii Siikaneva, Finland, FLUXNET-CH4 Community Product [data set], https://doi.org/10.18140/FLX/1669640, 2020b.
Villarreal, S., Guevara, M., Alcaraz-Segura, D., Brunsell, N. A., Hayes, D., Loescher, H. W., and Vargas, R.: Ecosystem functional diversity and the representativeness of environmental networks across the conterminous United States, Agr. Forest Meteorol., 262, 423–433, https://doi.org/10.1016/j.agrformet.2018.07.016, 2018.
Villarreal, S., Guevara, M., Alcaraz-Segura, D., and Vargas, R.: Optimizing an Environmental Observatory Network Design Using Publicly Available Data, J. Geophys. Res.-Biogeo., 124, 1812–1826, https://doi.org/10.1029/2018JG004714, 2019.
Vourlitis, G., Dalmagro, H., de Nogueira, J. S., Johnson, M., and Arruda, P. FLUXNET-CH4 BR-Npw Northern Pantanal Wetland, Brazil, FLUXNET-CH4 Community Product [data set], https://doi.org/10.18140/FLX/1669368, 2020.
Vuichard, N. and Papale, D.: Filling the gaps in meteorological continuous data measured at FLUXNET sites with ERA-Interim reanalysis, Earth Syst. Sci. Data, 7, 157–171, https://doi.org/10.5194/essd-7-157-2015, 2015.
Weston, N. B., Dixon, R. E., and Joye, S. B.: Ramifications of increased salinity in tidal freshwater sediments: Geochemistry and microbial pathways of organic matter mineralization, J. Geophys. Res., 111, G01009, https://doi.org/10.1029/2005jg000071, 2006.
Weston, N. B., Vile, M. A., Neubauer, S. C., and Velinsky, D. J.: Accelerated microbial organic matter mineralization following salt-water intrusion into tidal freshwater marsh soils, Biogeochemistry, 102, 135–151, https://doi.org/10.1007/s10533-010-9427-4, 2011.
Wik, M., Crill, P. M., Varner, R. K., and Bastviken, D.: Multiyear measurements of ebullitive methane flux from three subarctic lakes, J. Geophys. Res.-Biogeo., 118, 1307–1321, https://doi.org/10.1002/jgrg.20103, 2013.
Windham-Myers, L., Stuart-Haëntjens, E., Bergamaschi, B., and Knox, S.: FLUXNET-CH4 US-Srr Suisun marsh – Rush Ranch, United States, FLUXNET-CH4 Community Product [data set], https://doi.org/10.18140/FLX/1669694, 2020.
Windsor, J., Moore, T. R., and Roulet, N. T.: Episodic fluxes of methane from subarctic fens, Can. J. Soil Sci., 72, 441–452, https://doi.org/10.4141/cjss92-037, 1992.
Wohlfahrt, G.: FLUXNET-CH4 AT-Neu Neustift, Austria, FLUXNET-CH4 Community Product [data set], https://doi.org/10.18140/FLX/1669365, 2020.
Wong, G. X., Melling, L., Tang, A. C. I. Aeries, E. B., Waili, J. W., Musin, K. K., Lo, K. S., and Kiew, F.: FLUXNET-CH4 MY-MLM Maludam National Park, Malaysia, FLUXNET-CH4 Community Product [data set], https://doi.org/10.18140/FLX/1669650, 2020.
Wutzler, T., Lucas-Moffat, A., Migliavacca, M., Knauer, J., Sickel, K., Šigut, L., Menzer, O., and Reichstein, M.: Basic and extensible post-processing of eddy covariance flux data with REddyProc, Biogeosciences, 15, 5015–5030, https://doi.org/10.5194/bg-15-5015-2018, 2018.
Xu, X., Riley, W. J., Koven, C. D., Billesbach, D. P., Chang, R. Y.-W., Commane, R., Euskirchen, E. S., Hartery, S., Harazono, Y., Iwata, H., McDonald, K. C., Miller, C. E., Oechel, W. C., Poulter, B., Raz-Yaseef, N., Sweeney, C., Torn, M., Wofsy, S. C., Zhang, Z., and Zona, D.: A multi-scale comparison of modeled and observed seasonal methane emissions in northern wetlands, Biogeosciences, 13, 5043–5056, https://doi.org/10.5194/bg-13-5043-2016, 2016.
Yvon-Durocher, G., Allen, A. P., Bastviken, D., Conrad, R., Gudasz, C., St-Pierre, A., Thanh-Duc, N., and del Giorgio, P. A.: Methane fluxes show consistent temperature dependence across microbial to ecosystem scales, Nature, 507, 488–491, https://doi.org/10.1038/nature13164, 2014.
Zhang, Z., Fluet-Choinard, E., Jensen, K., McDonald, K., Hugelius, G., Gumbricht, T., Carrol, M., Prigent, C., Bartsch, A., and Poulter, B.: Development of a global dataset of Wetland Area and Dynamics for Methane Modeling (WAD2M), Zenodo [data set], https://doi.org/10.5281/zenodo.3998454, 2020.
Zhang, Z., Fluet-Chouinard, E., Jensen, K., McDonald, K., Hugelius, G., Gumbricht, T., Carroll, M., Prigent, C., Bartsch, A., and Poulter, B.: Development of the global dataset of Wetland Area and Dynamics for Methane Modeling (WAD2M), Earth Syst. Sci. Data, 13, 2001–2023, https://doi.org/10.5194/essd-13-2001-2021, 2021.
Zona, D. and Oechel, W. C.: FLUXNET-CH4 US-Atq Atqasuk, United States, FLUXNET-CH4 Community Product [data set], https://doi.org/10.18140/FLX/1669663, 2020a.
Zona, D. and Oechel, W. C.: FLUXNET-CH4 US-Beo Barrow Environmental Observatory (BEO) tower, United States, FLUXNET-CH4 Community Product [data set], https://doi.org/10.18140/FLX/1669664, 2020b.
Zona, D. and Oechel, W. C.: FLUXNET-CH4 US-Bes Barrow-Bes (Biocomplexity Experiment South tower), United States, FLUXNET-CH4 Community Product [data set], https://doi.org/10.18140/FLX/1669665, 2020c.
Zona, D. and Oechel, W. C.: FLUXNET-CH4 US-Ivo Ivotuk, United States, FLUXNET-CH4 Community Product [data set], https://doi.org/10.18140/FLX/1669679, 2020d.
Zona, D., Gioli, B., Commane, R., Lindaas, J., Wofsy, S. C., Miller, C. E., Dinardo, S. J., Dengel, S., Sweeney, C., Karion, A., Chang, R. Y.-W., Henderson, J. M., Murphy, P. C., Goodrich, J. P., Moreaux, V., Liljedahl, A., Watts, J. D., Kimball, J. S., Lipson, D. A., and Oechel, W. C.: Cold season emissions dominate the Arctic tundra methane budget, P. Natl. Acad. Sci. USA, 113, 40–45, https://doi.org/10.1073/pnas.1516017113, 2016.
The requested paper has a corresponding corrigendum published. Please read the corrigendum first before downloading the article.
- Article
(4370 KB) - Full-text XML