the Creative Commons Attribution 4.0 License.
the Creative Commons Attribution 4.0 License.
 | 29 Jul 2021
SLOCLIM: a high-resolution daily gridded precipitation and temperature dataset for Slovenia
Roberto Serrano-Notivoli
Katarina Čufar
Maks Merela
Zalika Črepinšek
Lučka Kajfež Bogataj
Martín de Luis
We present a new publicly available daily gridded dataset of maximum and minimum temperature and precipitation data covering the whole territory of Slovenia from 1950 to 2018. It represents the great variability of climate at the crossroads between the Mediterranean, Alpine and continental climatic regimes with altitudes between 0–2864 m a.s.l. We completely reconstructed (quality control and gap filling) the data for the three variables from 174 observatories (climatological, precipitation and automatic stations) with the original records all over the country. A comprehensive quality control process based on the spatial coherence of the data was applied to the original dataset, and the missing values were estimated for each day and location independently. Using the filled data series, a grid of 1×1 km spatial resolution with 20 998 points was created by estimating daily temperatures (minimum and maximum) and precipitation, as well as their corresponding uncertainties at each grid point. In order to show the potential applications, four daily temperature indices and two on precipitation were calculated to describe the spatial distribution of (1) the absolute maximum and minimum temperature, (2) the number of frost days, (3) the number of summer days, (4) the intensity of precipitation and (5) the maximum number of consecutive dry days. The use of all the available information, the complete quality control and the high spatial resolution of the grid allowed for an accurate estimate of precipitation and temperature that represents a precise spatial and temporal distribution of daily temperatures and precipitation in Slovenia. The SLOCLIM dataset is publicly available at https://doi.org/10.5281/zenodo.4108543 and http://www.sloclim.eu (last access: 10 June 2021) and can be cited as Škrk et al. (2020).
- Article
(16100 KB) - Full-text XML
- BibTeX
- EndNote


Complex territories demand high-quality climatic data to properly describe and understand those events that are usually masked by global datasets or others at coarser resolutions than those required by the high-frequency climatic phenomena, like extreme events. Slovenia is an outstanding case study of a challenging territory for climate research. The high heterogeneity of the terrestrial surfaces and the greatly varied climatic regime in a 20 271 km2 country represented by lowlands and mountains within an altitudinal range of nearly 3000 m serves as example of extreme climatic diversity in a relatively small region. Continental, Alpine and sub-Mediterranean climates meet and interact in the area, including two climatic zones that are particularly affected by global warming (the Mediterranean and Alpine regions) (Giorgi, 2006; Klanderud and Totland, 2005). Slovenia also faces a high frequency and magnitude of extreme events (Cegnar, 2016), which are reflected at an annual scale where, for instance, precipitation totals over 3500 mm can be locally measured in the northwest, while less than 800 mm can be found in the northeast. Moreover, temperature ranges from −35 to +40 ∘C (Bertalanič et al., 2006) show the very extreme character of the seasons. These extremes affect the environment and life of the population through damage to infrastructure, agricultural and afforested areas. More in-depth knowledge of climatic conditions is needed to design prevention measures in this context.
The Environmental Agency of the Republic of Slovenia (ARSO) maintains a very good archive of meteorological data (ARSO, 2020) collected through meteorological stations covering the whole territory and all the different environments. However, the density of these observations varies in space and time, as in most European countries, with a lack of meteorological stations in sparsely populated areas including mountains (especially at higher altitudes), agricultural and afforested areas, which represent most of the Slovenian territory. Furthermore, the data provided by the stations are often of varying length and partly incomplete due for various reasons, such as measurement errors, mechanical failure of devices, missing and interrupted measurements, and abandonment and relocation of meteorological stations, amongst others. In addition, considering the complex orography and proximity to the coast, the heterogeneity of terrestrial surfaces, where weather conditions change rapidly, a dense dataset with an integrated approach is needed for the whole country.
High-resolution gridded datasets allow for precise characterization of the climatic variables and are important for climatic analysis and hydrological hazard predictions, agricultural management, forestry and many other applications related to climate variables, as they help to identify extreme climatic conditions that can be analysed and used for prevention measures (Herrera et al., 2012). In this sense, gridded datasets have an advantage over station-based datasets, as they can provide climatic data for any location in the territory in the form of serially complete data series that allow long-term analysis. They allow us to examine spatial and temporal climatic variations providing an equal area grid where each grid value is under validation control (Haylock et al., 2008), and missing information from stations is reconstructed. On the other hand, they have some limitations, as they are models and not real measurements. How much they differ from real data depends on the accuracy of the method and locations/density of the meteorological stations. Furthermore, the reconstruction of long periods with missing data can lead to inhomogeneities in the temporal structure of the reconstructed series. When the temporal scale is increased from monthly to daily data, the spatial and temporal variability is also increased, and the uncertainty can quickly escalate.
With regard to Slovenia, and to the best of our knowledge, until recently the only gridded climate dataset was the one created by Dolinar (2016), and this contains temperature and precipitation data with 1×1 km spatial resolution from 1961 onwards. Although this dataset is valuable to describe the mean climate and regimes, its monthly temporal scale is insufficient to address the frequency, duration and intensity of the extremes, which clearly define the variable climate of Slovenia. Based on the experience of previous studies creating daily datasets at the regional level, both for precipitation (Chaney et al., 2014; Hernández et al., 2016; Serrano-Notivoli et al., 2017b; Yatagai et al., 2012) and temperature (Lussana et al., 2018; Serrano-Notivoli et al., 2019), a new high-resolution dataset for the Slovenian territory is suitable considering the high-density network of stations that is available. Serrano-Notivoli et al. (2017a, b, 2019) developed a method to reconstruct and create daily gridded datasets using all the available information in three stages: (1) quality control of raw data, (2) estimate of missing values and (3) prediction of new values over a gridded dataset. This methodology has been proven to work well in dense networks such as the one available for mainland Spain and its island territories (Serrano-Notivoli et al., 2017a, b, 2019) but also for specific mountain areas with a large diversity of environments (Cuadrat et al., 2020; Martínez del Castillo et al., 2019).
We present a new high-resolution daily gridded precipitation and temperature dataset for Slovenia (SLOCLIM) with a spatial resolution of 1×1 km for the period 1950 to 2018. We used all the available climatic information in the country gathered from stations in all possible environments to create a grid based on thoroughly reconstructed data series in three steps: (a) a comprehensive quality control of the original data, (b) the estimate of new values corresponding to the missing data and (c) the creation of the gridded dataset using the reconstructed series.
We used the meteorological records from 174 stations of the Slovenian Meteorological Agency (ARSO) regularly distributed over the territory of Slovenia (Fig. 1) to create the gridded datasets. Although some data series begin before 1950, we decided to limit the research to the years 1950 to 2018, when the station network remained stable over time and space.
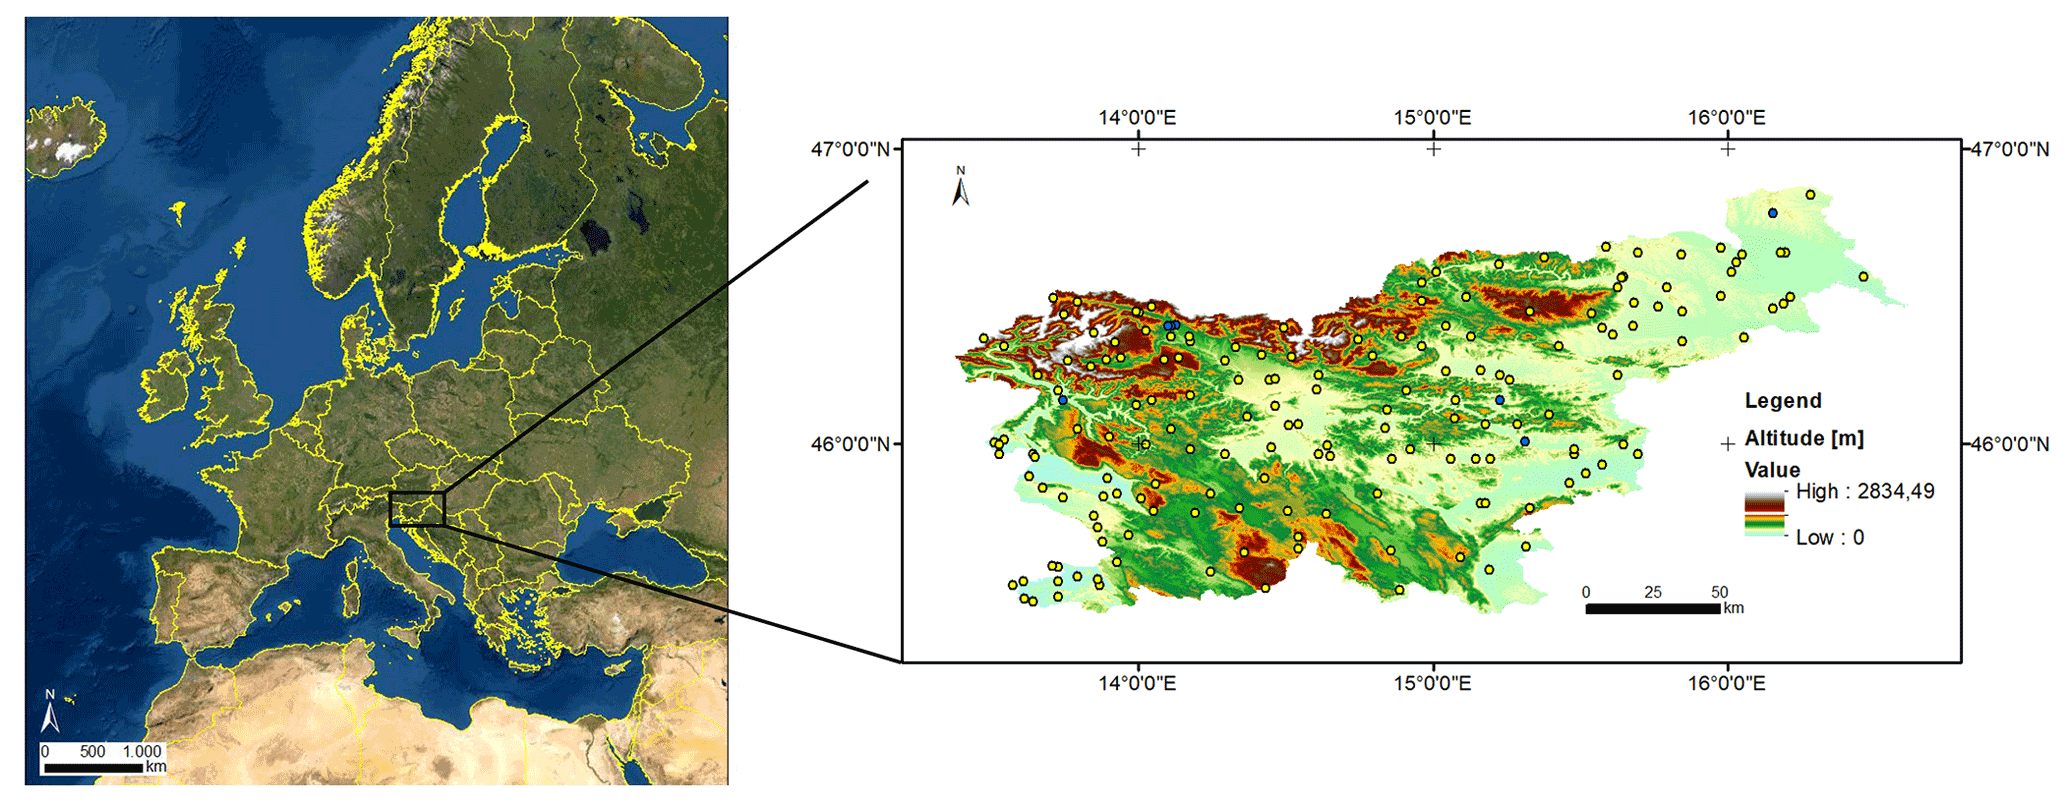
Figure 1Location of Slovenia in Europe (left) and spatial distribution (right) of the 174 meteorological stations with temperature and precipitation information (yellow dots) and only precipitation (blue dots) (Esri, 2020; GISCO, 2020; GURS, 2020).
All the stations recorded daily precipitation, while 167 recorded both precipitation and temperature (ARSO, 2020). The altitudinal pattern showed a lower availability of data at the highest elevations, with less than five stations over 1000 m a.s.l. (Fig. 2b) and corresponding with less populated and afforested areas. The average amount of annual data from stations also varied over time (Fig. 2a), with a rapid increase in the first 20 years, reaching the highest availability in 1970 (107) and decreasing thereafter. The early measurements contained more precipitation than temperature data.
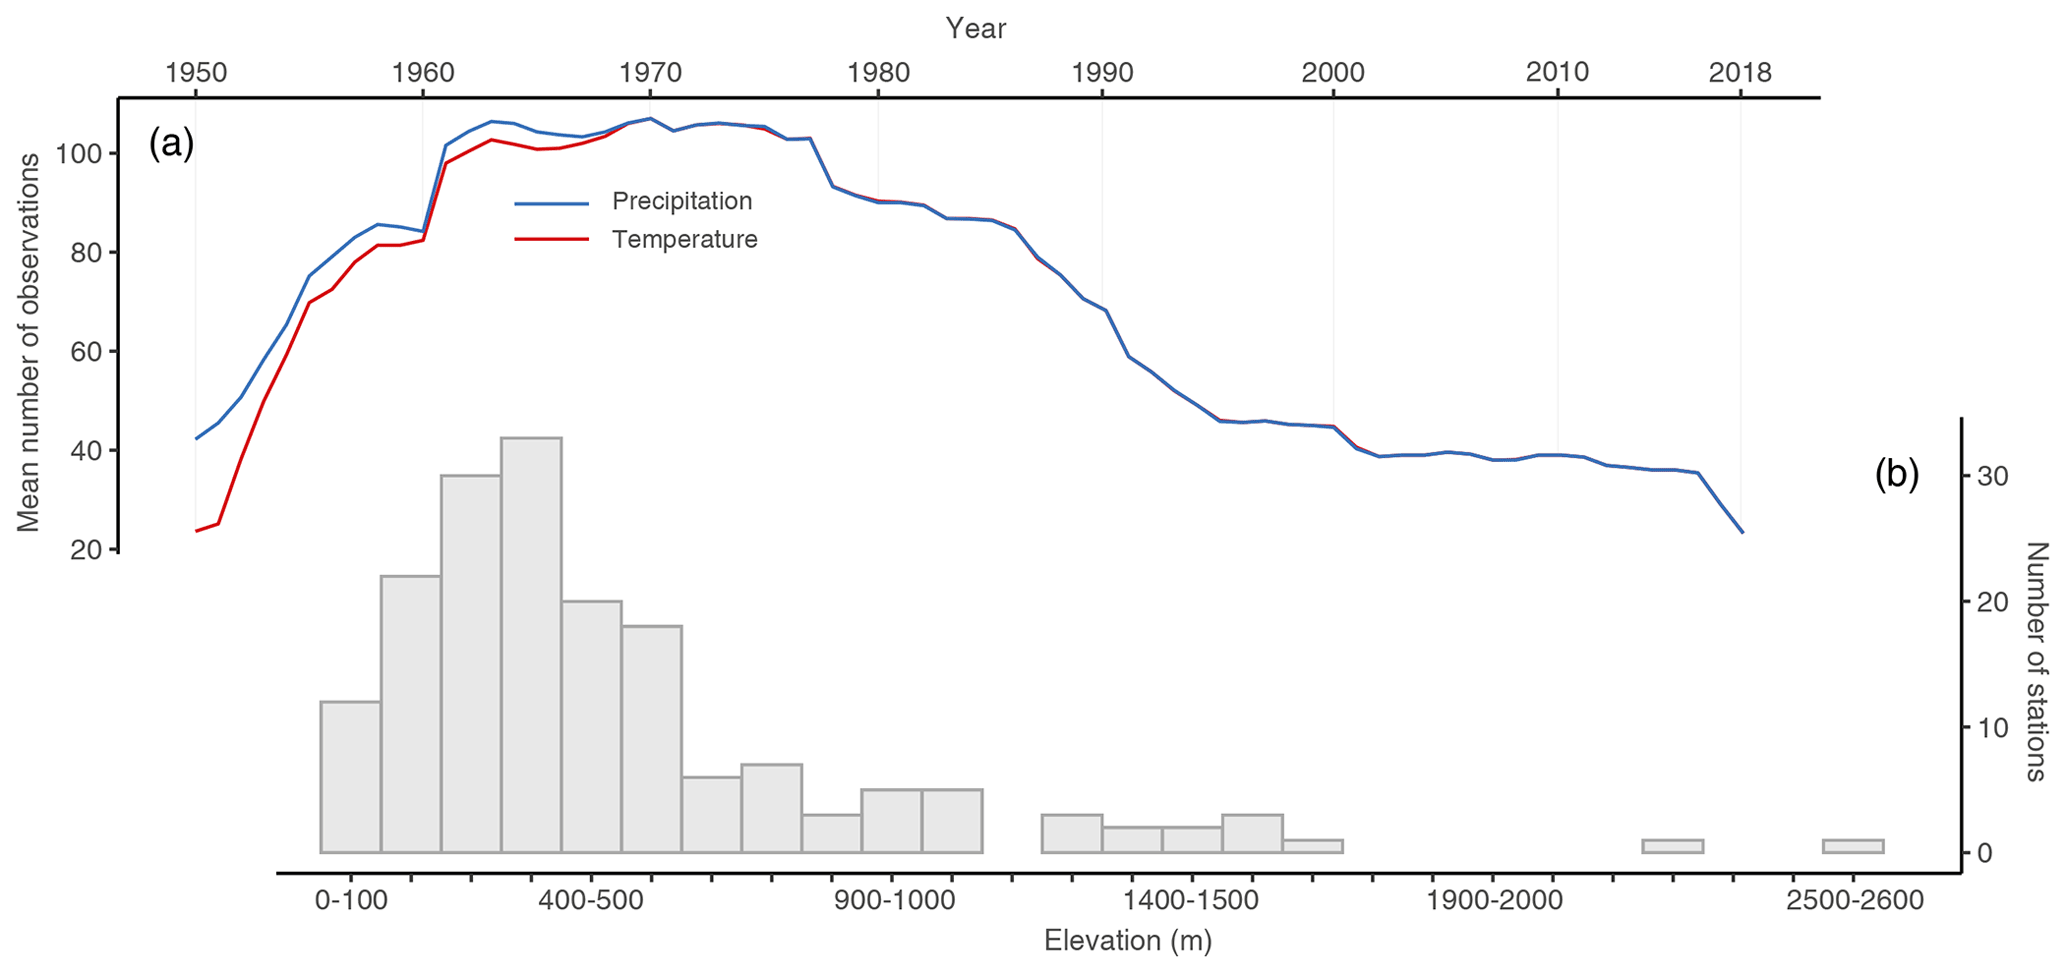
Figure 2Original data: (a) mean annual number of observations of precipitation and temperature, and (b) number of stations by elevation ranges.
A complete reconstruction of the original daily data series was performed following the three-step methodology developed in Serrano-Notivoli et al. (2017a, b, 2019), which is based on an (1) exhaustive quality control (QC) of the raw series, (2) the estimate of new values for missing records using all the available information and local regression models, and (3) the estimates of new values in a regular grid using the reconstructed series.
The QC detected and removed the most obvious erroneous data in the original dataset based on different criteria created to keep the internal and the spatial coherence of the data. For precipitation five criteria were used: (1) suspect data – the observed value was over zero and all its 10 nearest observations were zero; (2) suspect zero – the observed value was zero and all its 10 nearest observations were over zero; (3) suspect outlier – the magnitude of the observed value was 10 times higher or lower than that one predicted by its 10 nearest observations; (4) suspect dry day – the observed value was zero, wet probability was over 99 %, and predicted magnitude was over 5 mm; and (5) suspect wet day – the observed value was over 5 mm, dry probability was over 99 %, and predicted magnitude was under 0.1 mm. In order to determine a day as wet or dry, for each day and location independently, the 10 nearest observations were codified as 0 or 1 depending on the absence or not of precipitation on that day, and then a binomial generalized linear model (GLM) was fitted to these values using their longitude, latitude and altitude as covariates. The model was then applied to obtain a prediction at the target location using its corresponding covariates values. If the predicted value (predicted probability), ranging from 0 to 1, was higher than 0.5, it was considered a wet day.
For temperature we also used five criteria: (1) internal coherence (TMAX>TMIN), (2) removal of months containing less than 3 d of data, (3) removal of those days out of range considering maximum temperature (TMAX) ≥ 50 ∘C or ∘C and minimum temperature (TMIN≥40 ∘C or ∘C, (4) removal of all days in a month with a standard deviation of temperature equal to zero (suspect repeated values in the series), and (5) removal of all days in a month if the sum of the differences between TMAX and TMIN was equal to zero (suspect duplicated values in TMAX and TMIN). These criteria helped us to evaluate, amongst others, situations of internal incoherence like abnormal values, significant deviations from other values or duplicated values. In such cases all suspects were removed. In order to perform the QC process by applying the above-referenced criteria, we used generalized linear mixed models (GLMMs) and generalized linear models (GLMs) to calculate the reference values (RVs) for each day and location of the original dataset. The information from the 10 nearest stations (15 in temperature) varied according to the data availability. In order to estimate precipitation and temperature variables, the observations acted as dependent variables, and the associated geographical information of each station participating in the model (latitude, longitude, altitude and distance from the coast) was the independent variable. The calculated RVs were then compared with their corresponding original data to assess their quality and remove suspect values following the QC criteria.
After QC, the second stage consisted of calculating new RVs based on the cleaned dataset that were used to replace the missing values. A leave-one-out cross-validation (LOO-CV) was implemented, where RVs were calculated for all days and locations including those for which an observation exists but without using that observation, for comparison and validation purposes. This whole process produced a serially complete dataset.
In the third stage, new values at each grid location of the 1×1 km gridded dataset were estimated based on the reconstructed point-based dataset, including a measure of uncertainty for each location and day, as calculated from the standard error of the models. The advantage of this methodology is that all of the available data can be used as there are no restrictions imposed due to the length or structural characteristics of the series.
Based on the gridded dataset created from the original data and with the described method, we computed four temperature and two precipitation indices to show the potential applications of the grid: (1) the mean annual maximum value of daily maximum temperature, (2) the mean annual minimum value of daily minimum temperature, (3) the average annual count of days when daily minimum temperature was below 0 ∘C (frost days), (4) the average annual count of days when daily maximum temperature was over 25 ∘C (summer days), (5) maximum number of consecutive dry days per year with daily precipitation of less than 1 mm and (6) daily precipitation intensity (annual precipitation/number of wet days). All the indices were presented with their corresponding uncertainty estimates. The indices were calculated through a Monte Carlo approach by computing 1000 random realizations for each grid cell. These realizations were based on a normal distribution where the mean was the value of the estimate and the standard deviation was the value of the uncertainty. The indices were computed for all realizations, and the final maps represent the median and the percentage of variation based on the standard deviation of all the realizations.
The maps throughout this article were created using ArcGIS® software by Esri. ArcGIS® and ArcMap™ are the intellectual property of Esri and used herein under license. Copyright ©Esri. All rights reserved. For more information about Esri® software, please visit http://www.esri.com (last access: 10 June 2021).
4.1 Quality control
The original missing daily data, considering the whole period (1950–2018) for all stations, were 60.2 % for precipitation and 59.7 % for maximum and minimum temperature. The quality control was applied to the remaining 39.8 % and 40.3 % of the data, respectively.
4.1.1 Precipitation
The number of removed data varied over the years, increasing from 1950 onwards and reaching a peak in 1967, and then decreasing until the end of the period (Fig. 3a). From the removed data, the Suspect data and Suspect zeros criteria, which usually represent estimates of low precipitation values based on nearest observations, were the most frequent. While these criteria are commonly frequent in this kind of QC (Serrano-Notivoli et al., 2017b, 2019), only 1.26 % of the original raw observations were removed.
4.1.2 Temperature
The quality control process removed 1.28 % of the original TMAX data and 0.86 % of the original TMIN data (Fig. 3b). According to the monthly criteria, 1090 (0.06 %) pieces of data for the TMAX and 2139 (0.13 %) for the TMIN were removed, and according to the daily criteria, 20 491 (0.21 %) values were removed for the TMAX and 12 283 (0.73 %) values for the TMIN.
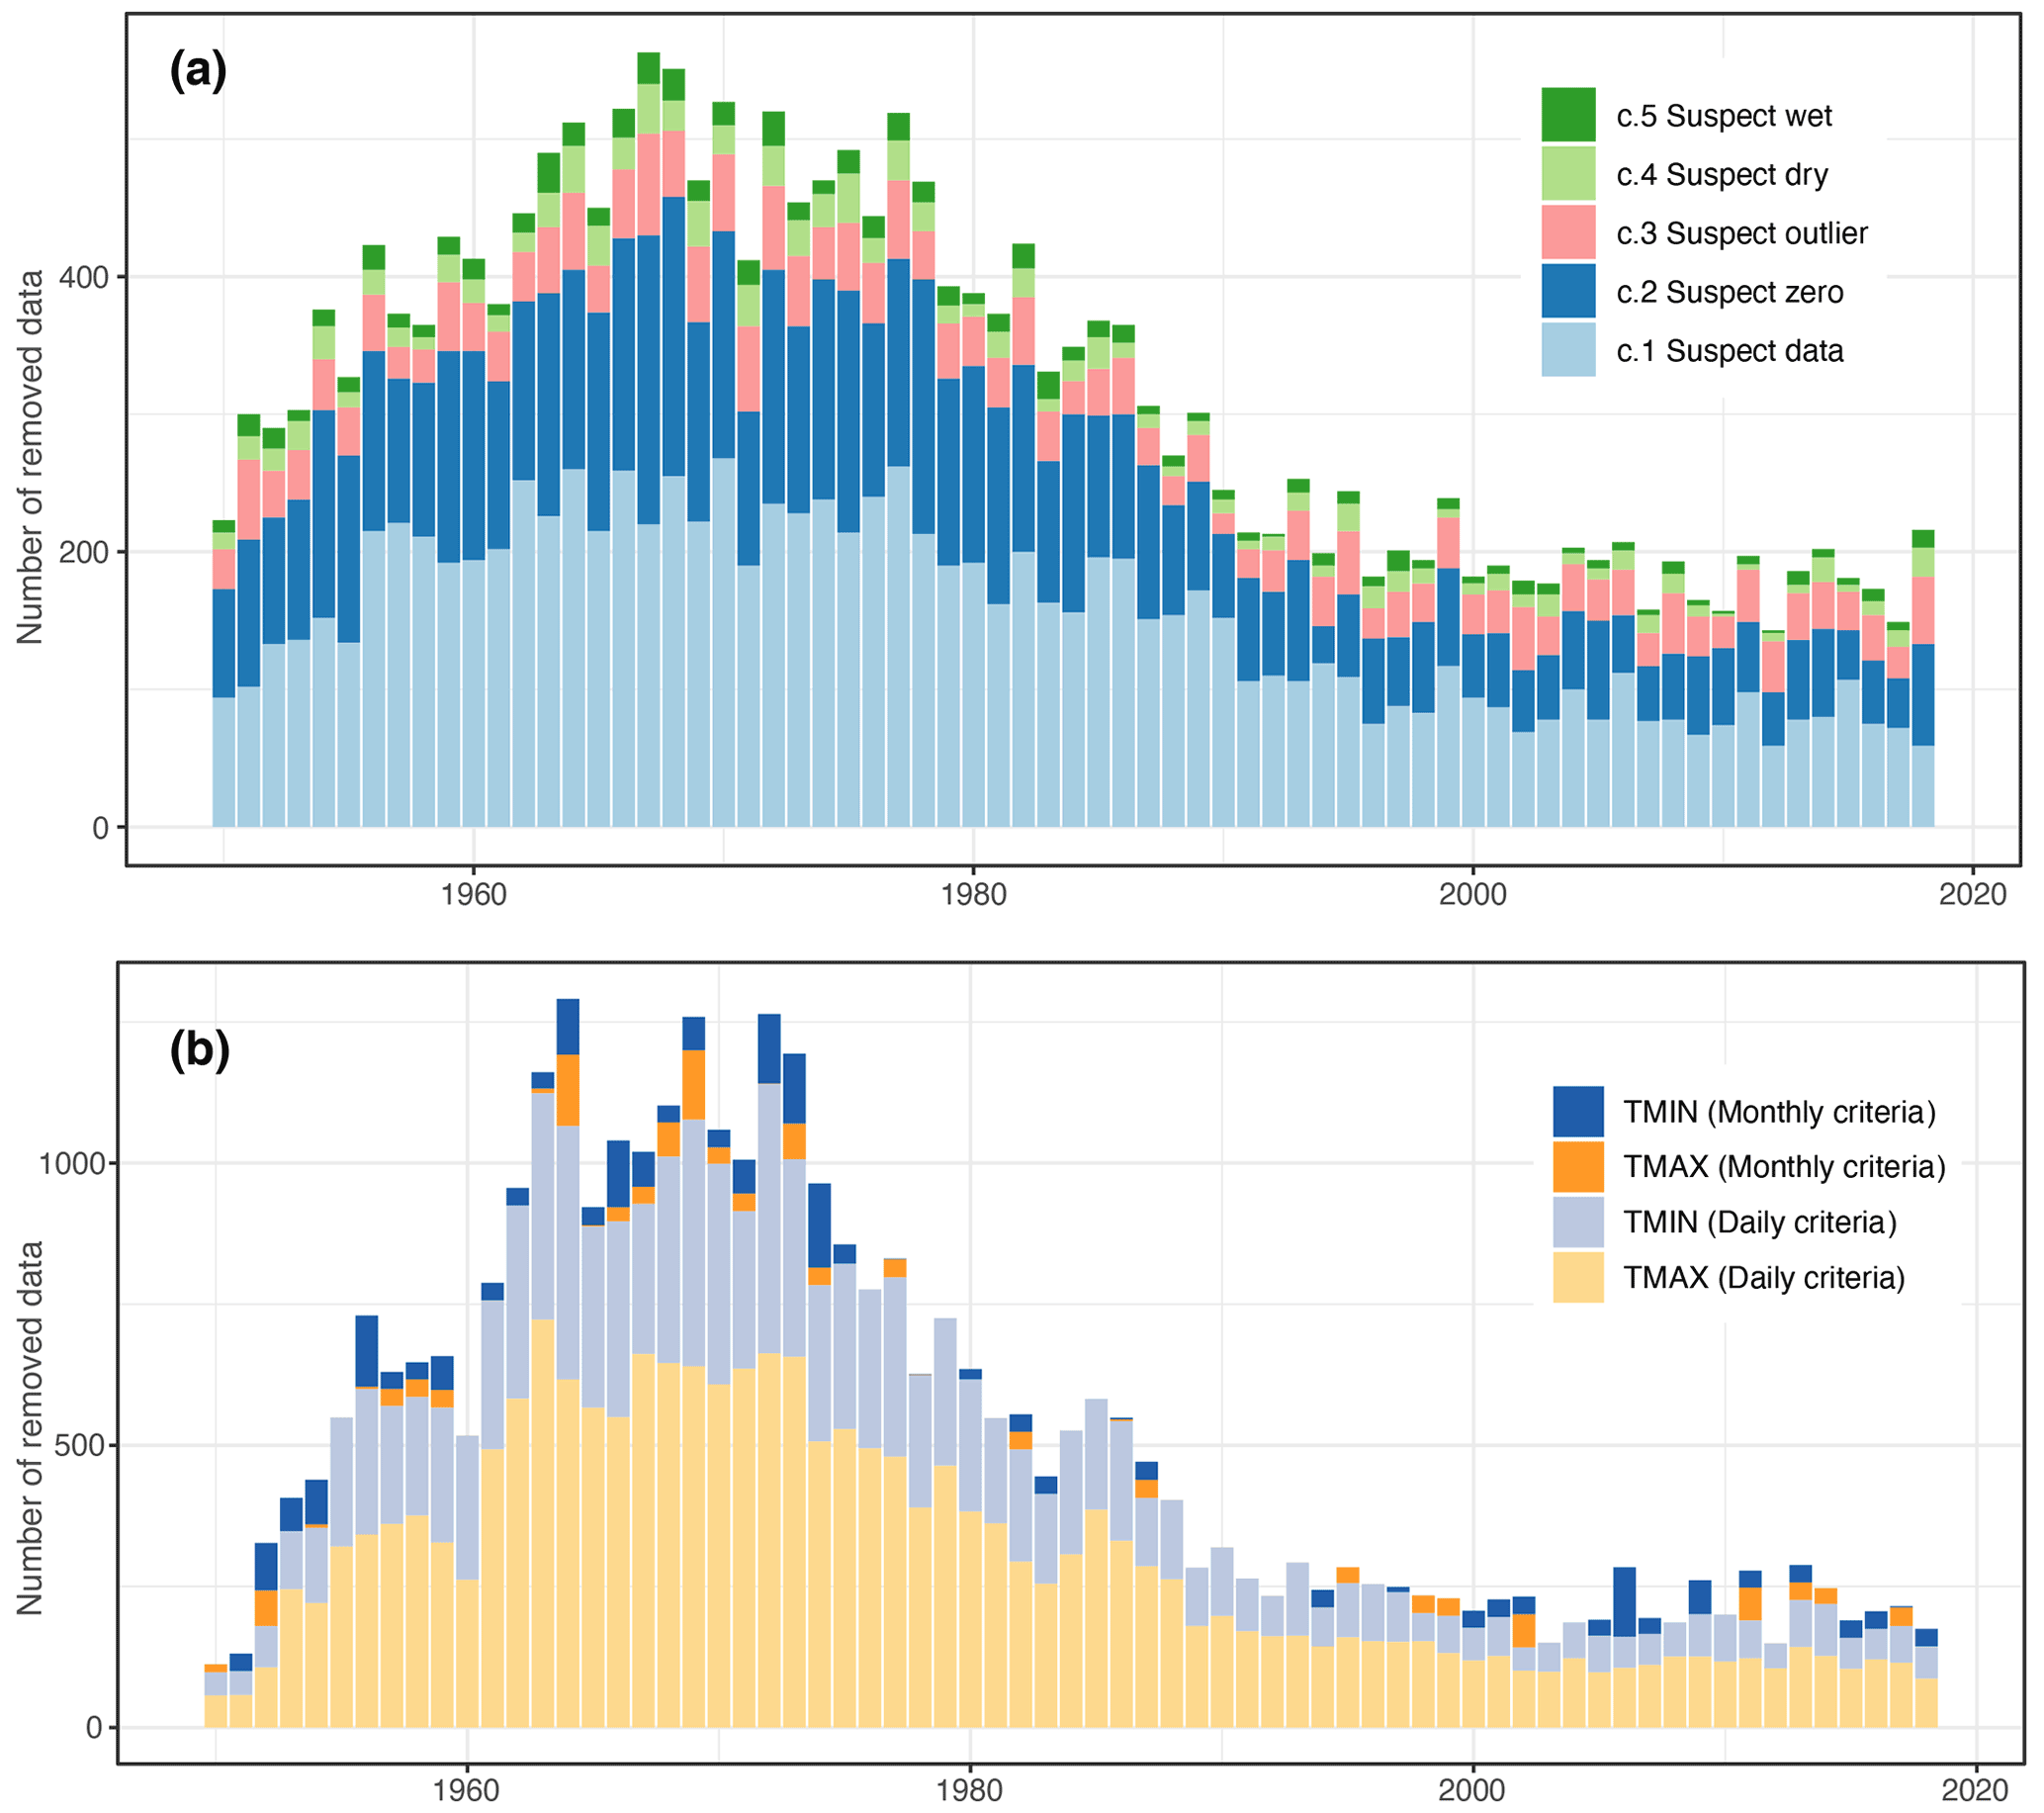
Figure 3Total number of removed precipitation (a) and temperature (b) observations from the original dataset by the different criteria per year. The criteria are explained in more detail in Serrano-Notivoli et al. (2017b, 2019).
4.2 Measurements – estimation comparison
4.2.1 Precipitation
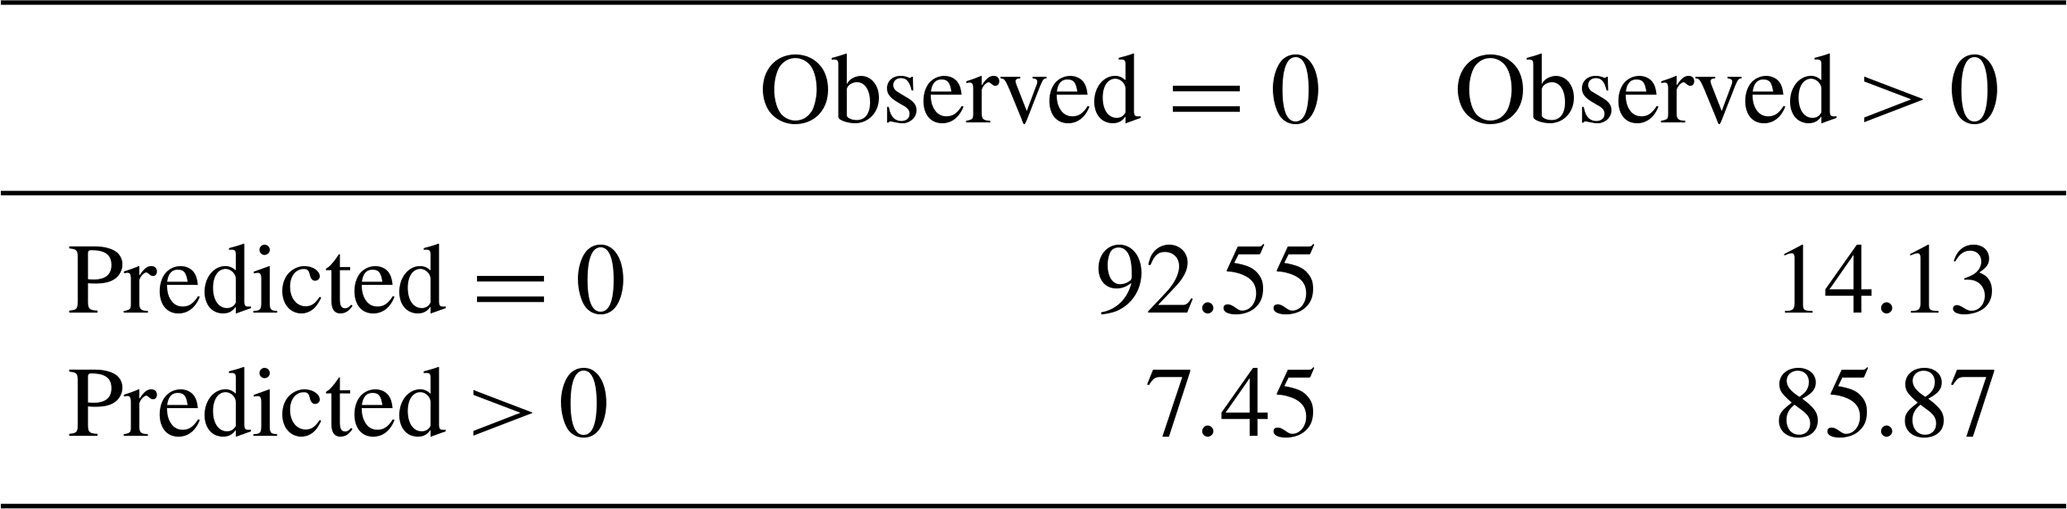
The number of observed zero precipitation days (dry days) in Slovenia was 1 006 891, and the number of estimated ones (only for corresponding days with measurements) was 1 011 337, with the difference being +0.44 % in favour of estimated ones. Terming the wet days as positive (observed P (precipitation) >0) and the dry days as negative (observed P=0), the true negative rate (RV = 0 and P=0) was over 92 %, and the true positive rate (RV > 0 and P>0) was over 85 % (Table 1). To a large extent the false negatives (RV = 0 and P>0) and false positives (RV > 0 and P=0) were due to the prediction of precipitation for days with low amounts of this. In events with very low amounts of precipitation, the estimate of the probability of occurrence was likely to be dry, despite the fact that the station could register a minimum quantity of rain (usually under 1 or 2 mm). This causes a small difference in amounts and is becoming more distinct in the dry/wet accuracy assessment.
Table 1Accuracy of the wet/dry day estimates: percent of observed dry (P (precipitation) = 0) and wet (P>0) days, and percent of predicted dry (RV = 0) and wet (RV > 0) days on observed dry and wet days.
The highest Pearson correlations (> 0.94) were found in the comparison by days between the original dataset and corresponding estimates rather than in the comparison by stations (Fig. 4). This indicates the complexity of the geographical variability (elevation, orientation, landscape configuration, etc.) between stations. The highest correlation between the measurements and estimates by stations was found for medians without zeros (only considering days with P > 0 in measurements and estimations). The comparison showed the lowest correlation in the 95th percentiles of wet days when comparing by both stations and days. Also, a slight underestimation of high precipitation amounts was noted, probably due to a smoothness of the estimates in situations with very local high precipitation events.
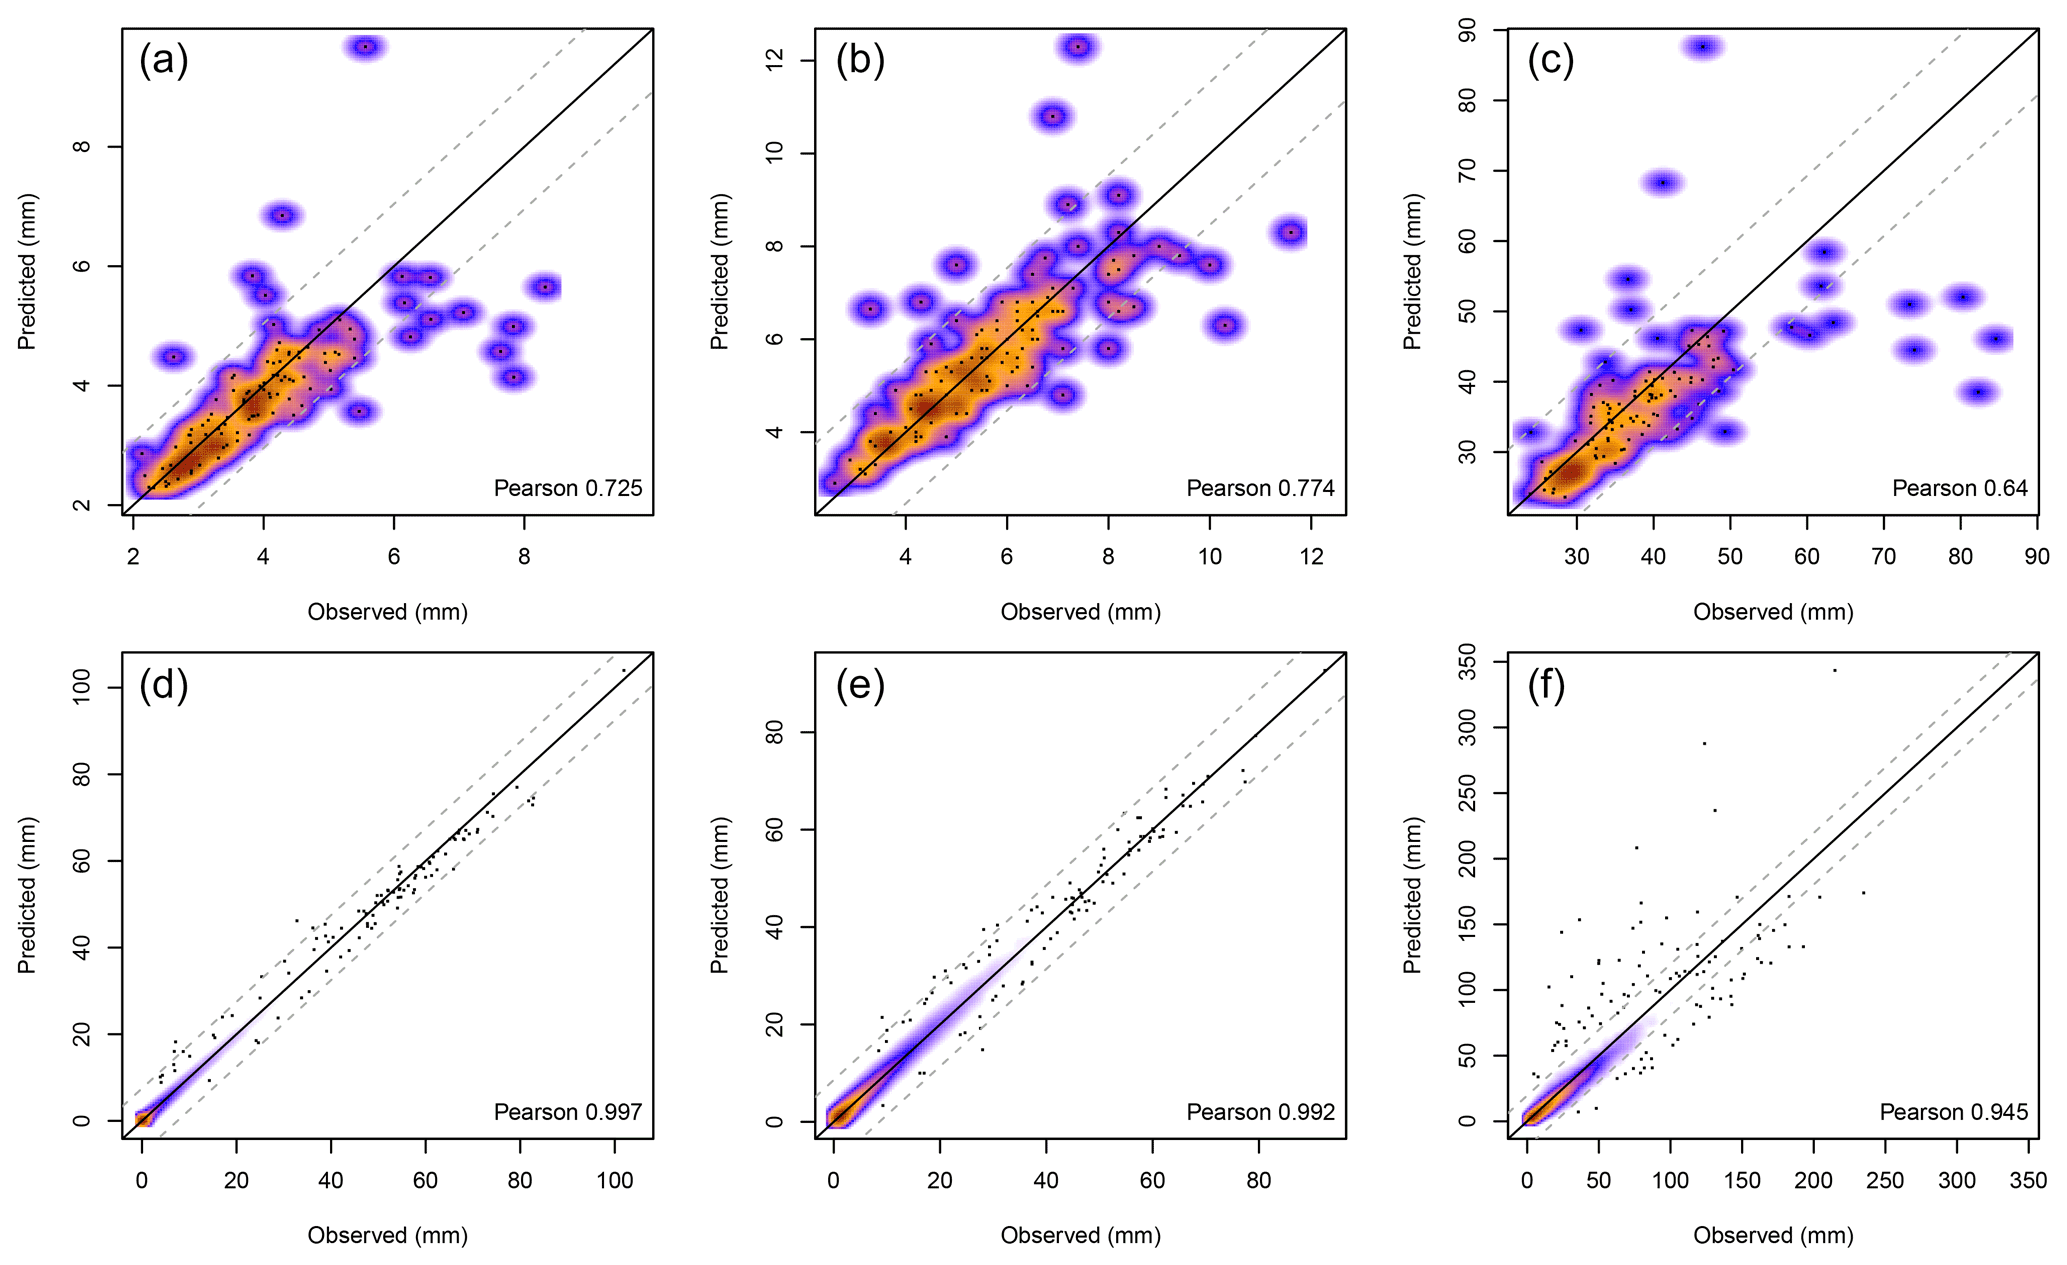
Figure 4Comparison between measurements and estimates by stations (a, b, c) and by days (d, e, f). (a, d) Comparison of mean precipitation; (b, e) comparison of median precipitation in wet days; (c, f) comparison of 95th percentiles in wet days. Dashed lines represent ±1 standard deviation of the data.
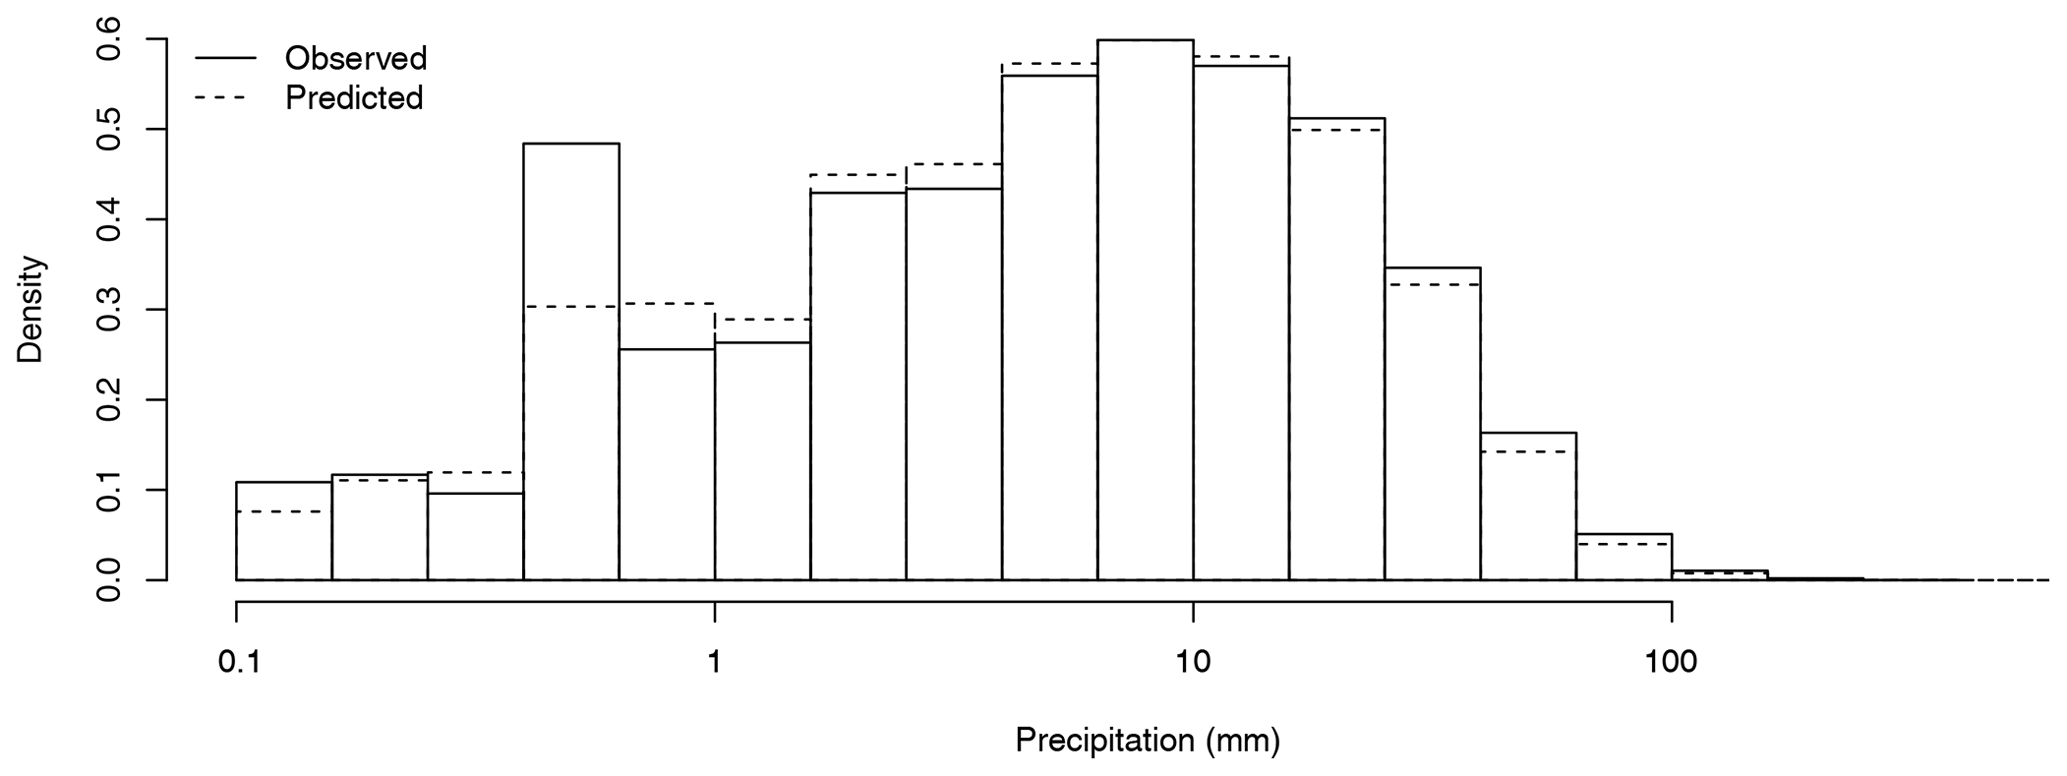
The histogram of estimated and observed precipitation showed a good agreement (Fig. 5). However, values below 1 mm were slightly underestimated in some cases. The agreement between the histograms was very high above 1 mm.
The fit of the estimated values by altitudinal ranges showed a slight overestimation in the ratio of means (RM) between 700 and 900 m a.s.l. (Table 2). Overestimation was higher above 1100 m a.s.l. with the exception of 1500–2000 m a.s.l., where the estimation was lower than the measurements. The ratio of the standard deviation (RSD) also showed differences between estimated and observed values, especially between 1100 and 1300 m a.s.l. The mean absolute error (MAE) increased with altitude, which can be attributed to the decreasing number of available stations with altitude.
Table 2The leave-one-out cross-validation (LOO-CV) statistics showing the goodness of fit between measurements and estimations of daily precipitation separated by altitudes (m a.s.l.). N: number of stations; %OBS: percentage of observed precipitation; %PRE: percentage of predicted precipitation; MAE: mean absolute error; ME: mean error; RM: ratio of means; RSD: ratio of standard deviations. The results were rounded to two decimal places.
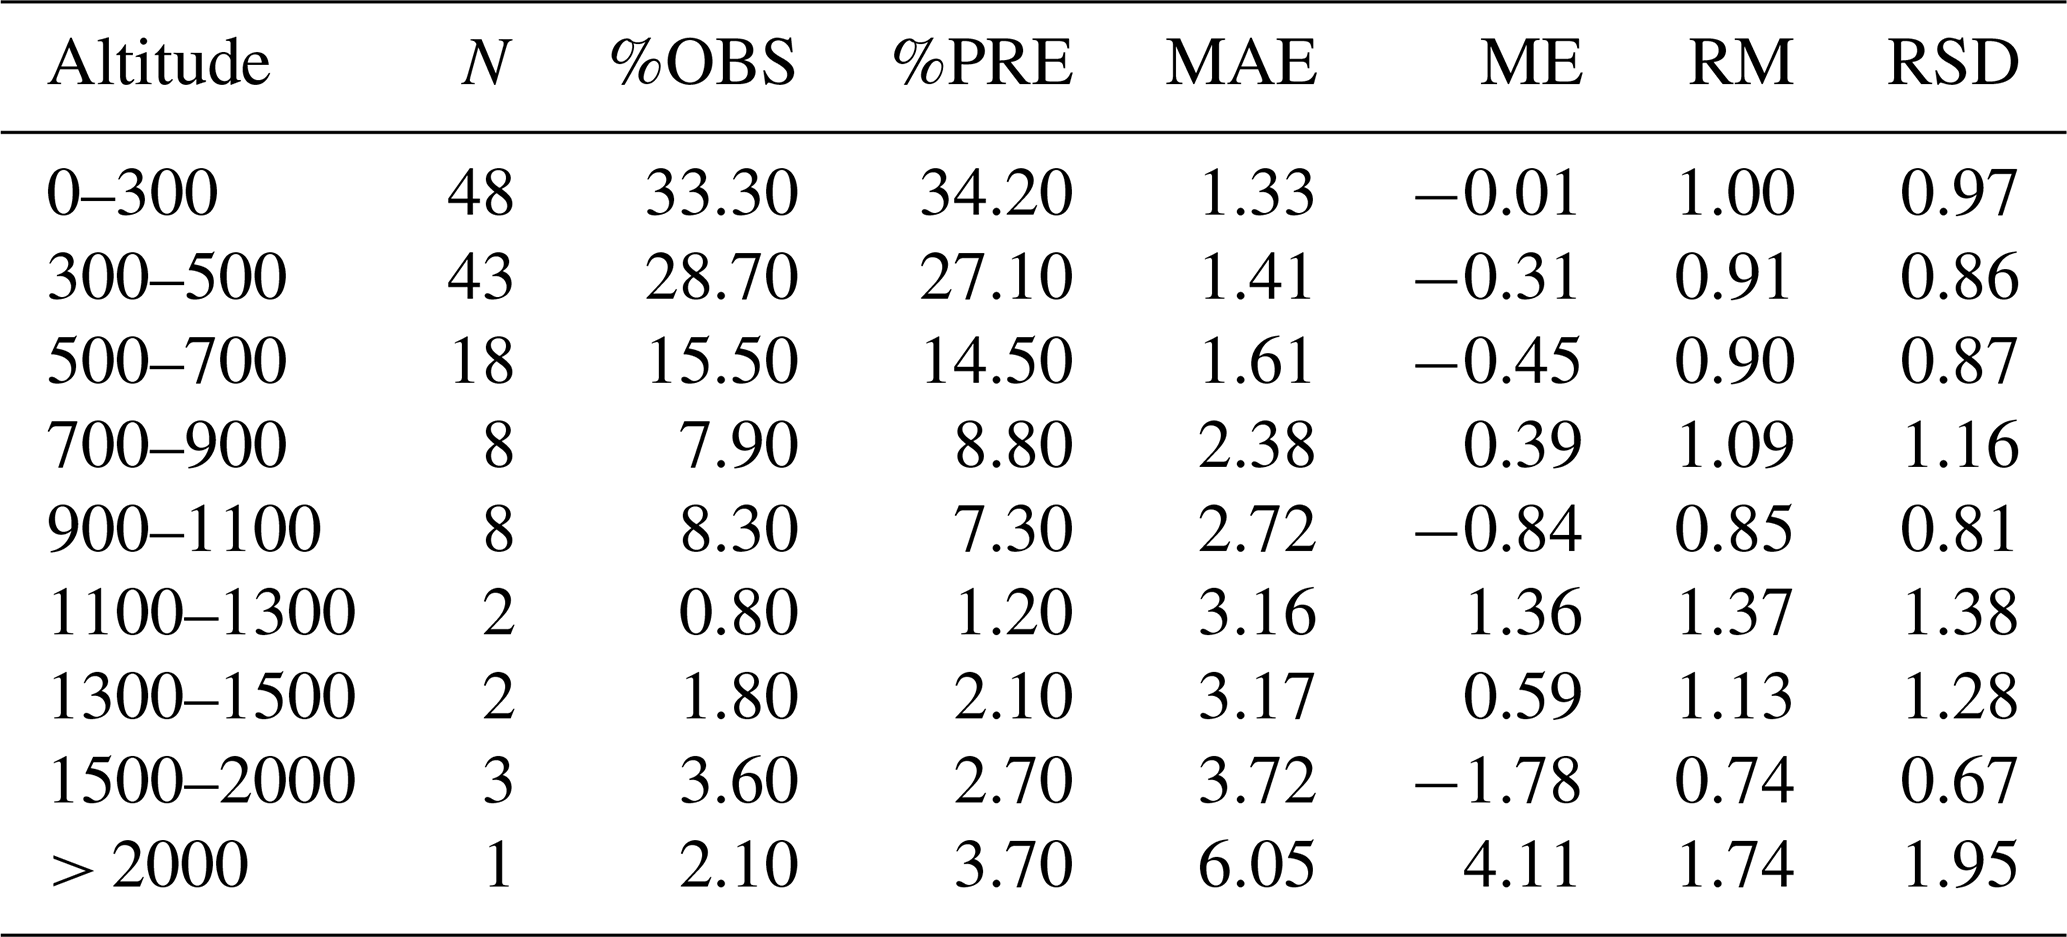
Table 3The leave-one-out cross-validation (LOO-CV) statistics for precipitation, showing the goodness of fit between measurements and estimates of monthly aggregates. MAE: mean absolute error; ME: mean error; RM: ratio of means; RSD: ratio of standard deviations. The results were rounded to two decimal places.
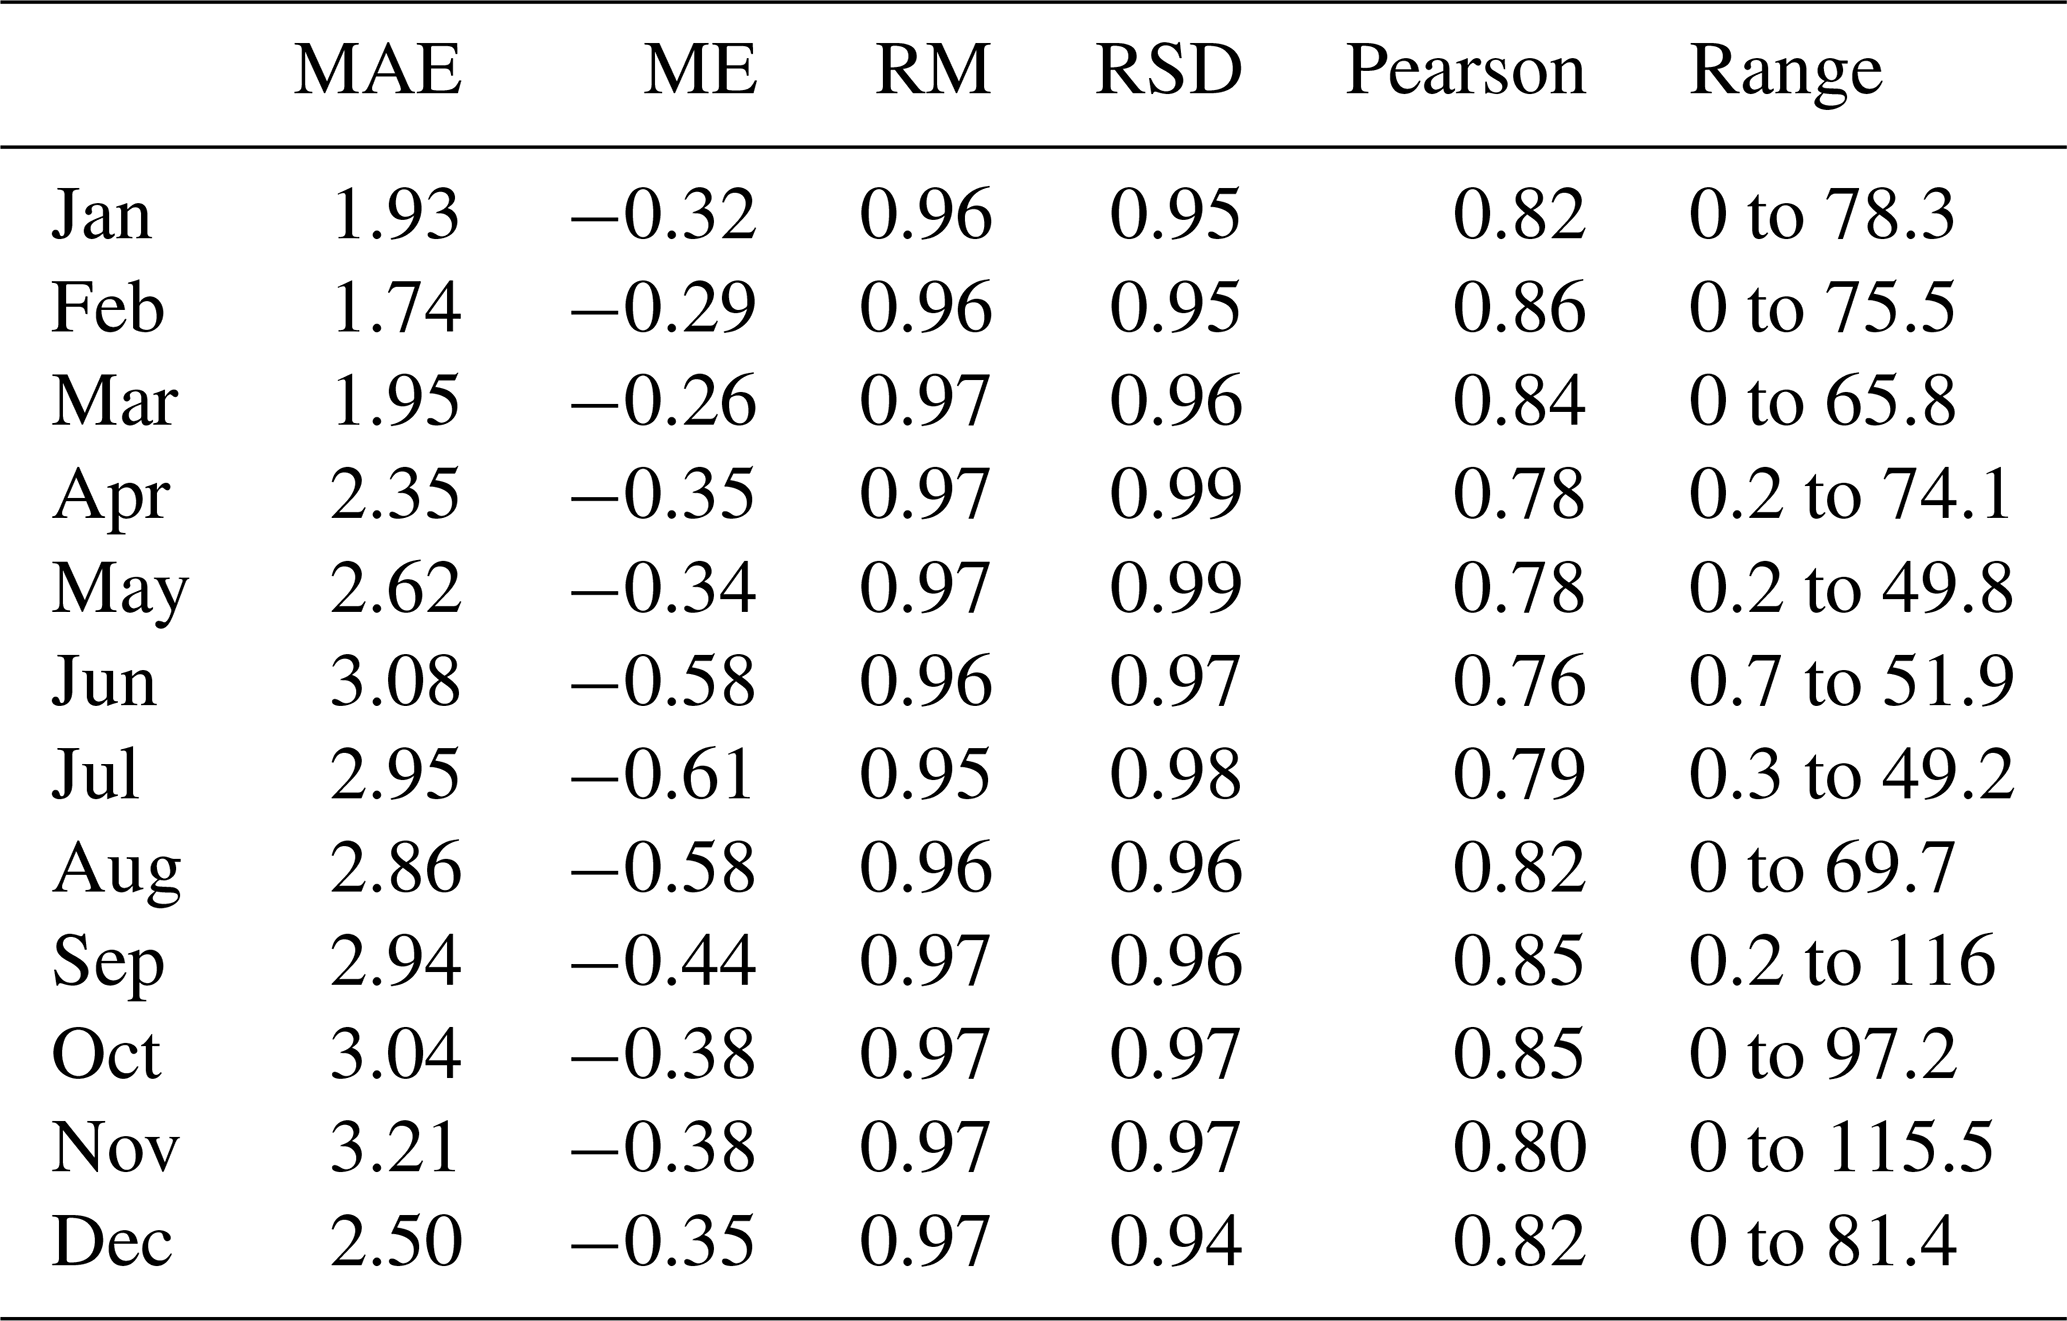
The ratio of means (RM) indicated that the monthly aggregates of daily precipitation in all months were slightly underestimated. The ratio of standard deviation (RSD) was very close to 1 through all months (Table 3). In December, however, the RSD was below 0.95, indicating a bias in the variance estimate. In the other months there are no substantial biases in the variance estimation. Overall, all monthly statistics are relatively homogeneous over the year due to the evenly distributed precipitation over the year.
4.2.2 Temperature
The results showed very high correlations between the estimated values and measurements both for TMAX and TMIN when considering daily means, as the Pearson correlation coefficients were 0.99 and 0.93, respectively (Fig. 6). Similarly, good agreements were obtained when considering the extremes (5th percentile of TMIN and 95th percentile of TMAX) with Pearson correlations of 0.99 and 0.91, respectively.
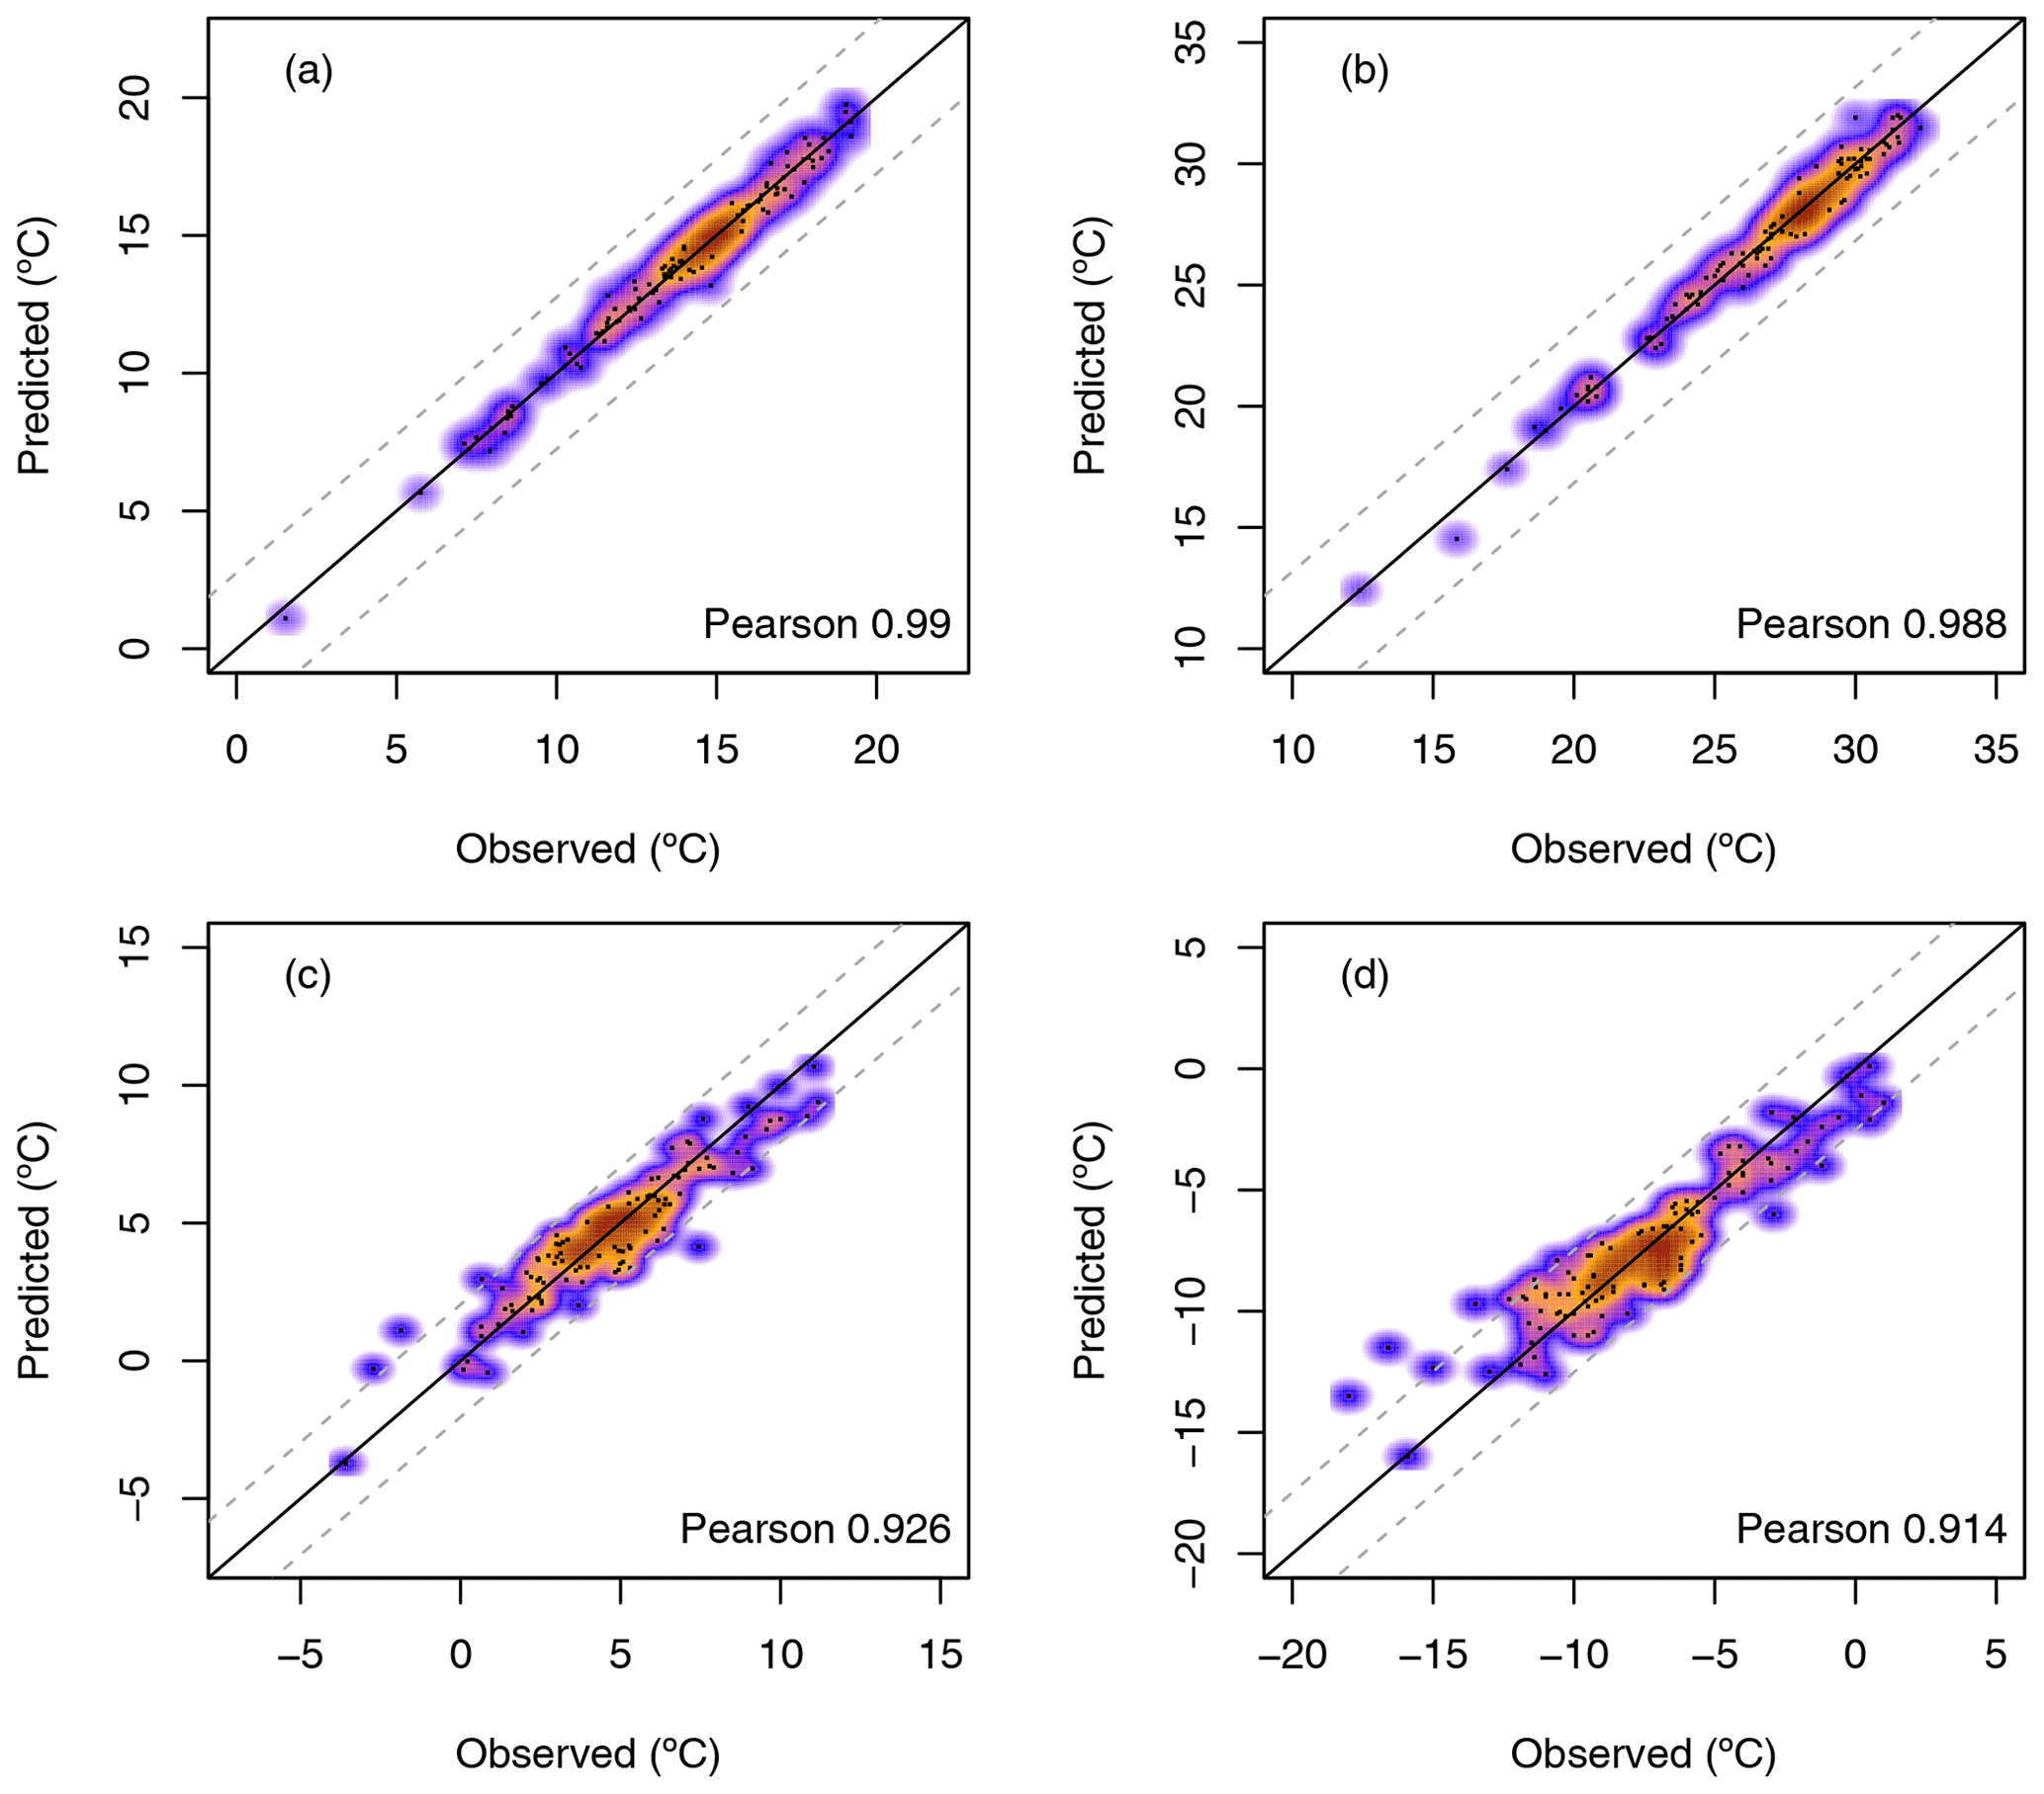
Figure 6Comparison between measurements and estimates, by stations, of the mean maximum temperatures (a) and their 95th percentiles (b), and comparison of the mean minimum temperatures (c) and their 5th percentiles (d). Dashed lines represent ±1 standard deviation of the data.
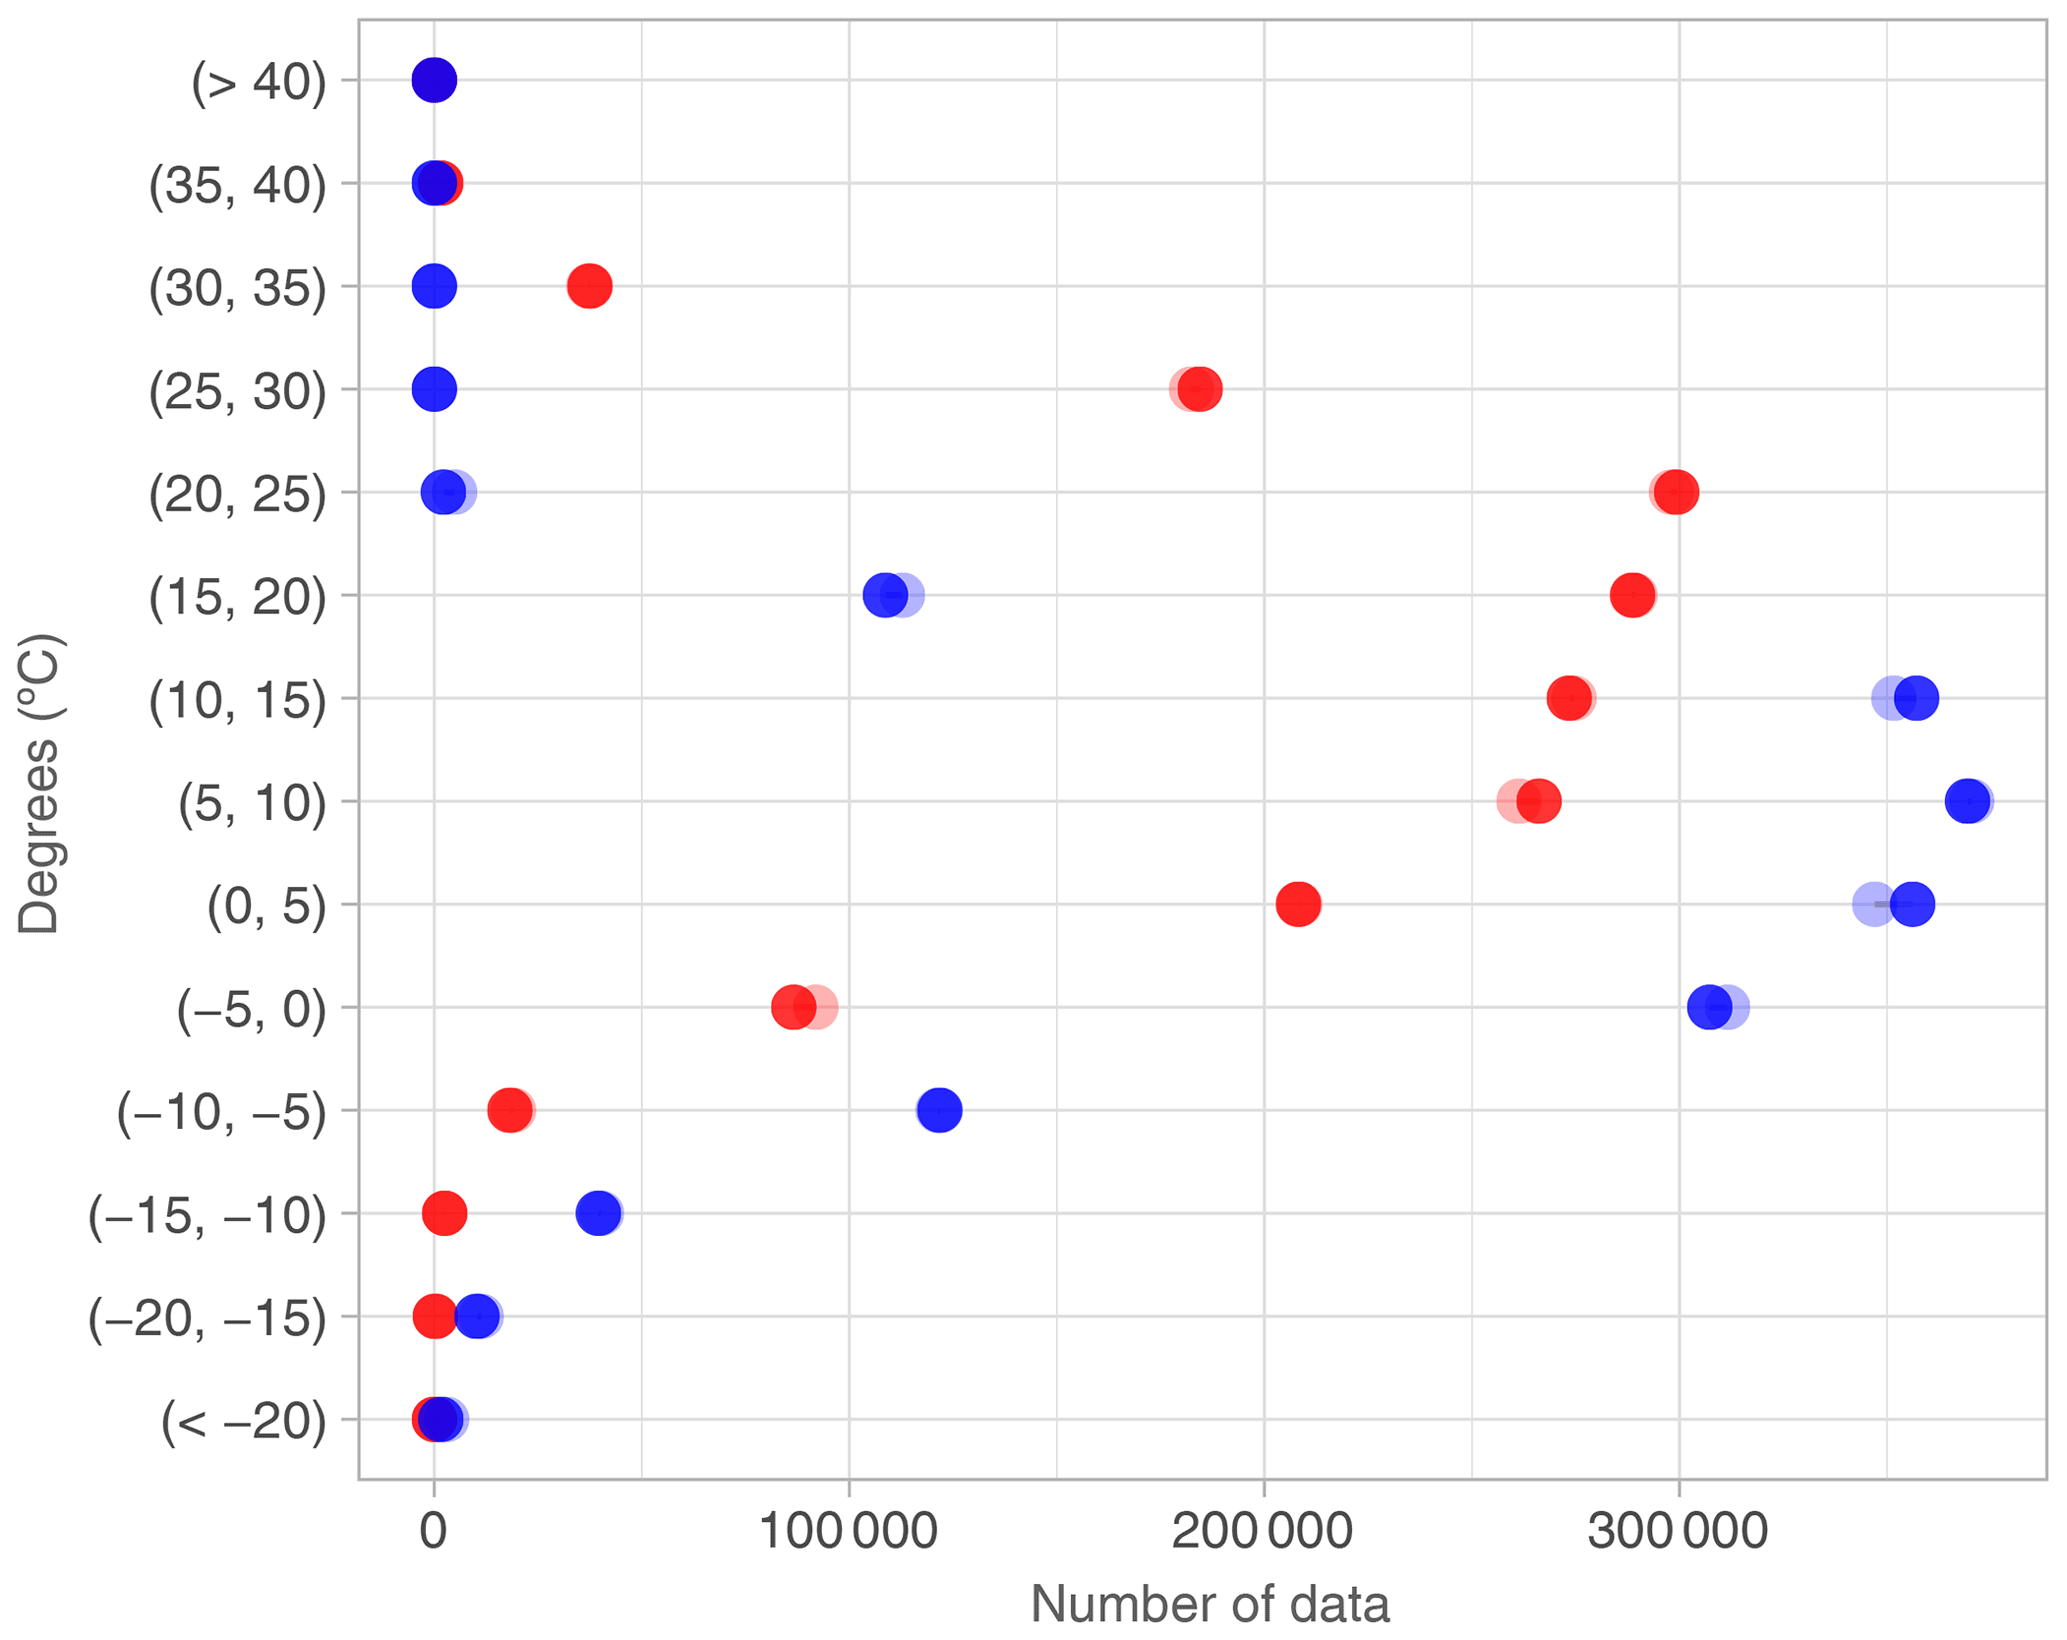
Figure 7Comparison of frequencies by categories between observed (solid) and predicted (transparent) maximum (red) and minimum (blue) temperatures.
The frequency of the observed temperatures and their estimates (Fig. 7) showed very good general agreement. There was a slight underestimation of TMIN (in the temperature intervals 0 to 5 and 10 to 15 ∘C) and TMAX (interval 5 to 10 ∘C). Overestimation was found for TMAX and TMIN for the interval −5 to 0 ∘C.
Table 4The leave-one-out cross-validation (LOO-CV) statistics showing the goodness of fit between measurements and estimates of daily maximum and minimum temperature separated by altitudes (m a.s.l.). N: number of stations; OBSm: mean observed maximum and minimum temperature (maximum and minimum temperature in ∘C); PREDm: mean predicted temperature (∘C); MAE: mean absolute error (∘C); ME: mean error (∘C); RM: ratio of means; RSD: ratio of standard deviations. The results were rounded to two decimal places.
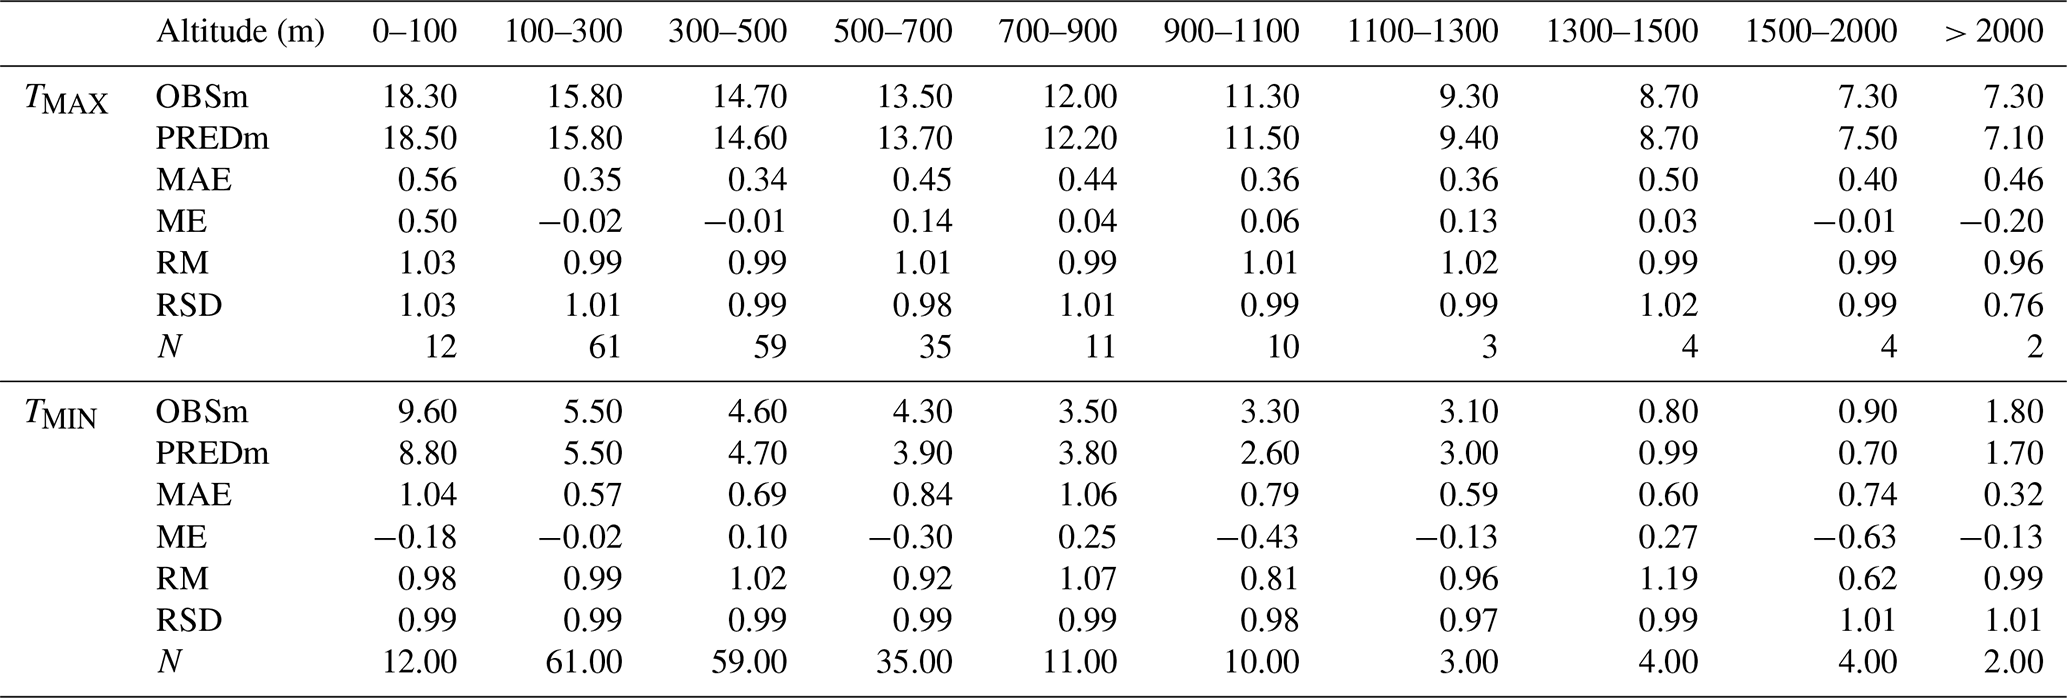
Most of the stations in Slovenia are located at lower altitudes, with 60 % of them between 100 and 500 m a.s.l., which leads to a slight underestimation of TMIN values at 900–1100 and 1500–2000 m a.s.l. due to having fewer data. Also, an overestimation of TMIN was observed at the 1300–1500 m a.s.l. range, but the similarity between the observed and estimated temperatures was generally higher for TMAX (Table 4).
Table 5The leave-one-out cross-validation (LOO-CV) statistics showing the goodness of fit between maximum and minimum temperature measurements and estimates of monthly aggregates. MAE: mean absolute error (∘C); ME: mean error (∘C); RM: ratio of means; RSD: ratio of standard deviations; Pearson: Pearson correlation coefficient. The results were rounded to two decimal places.
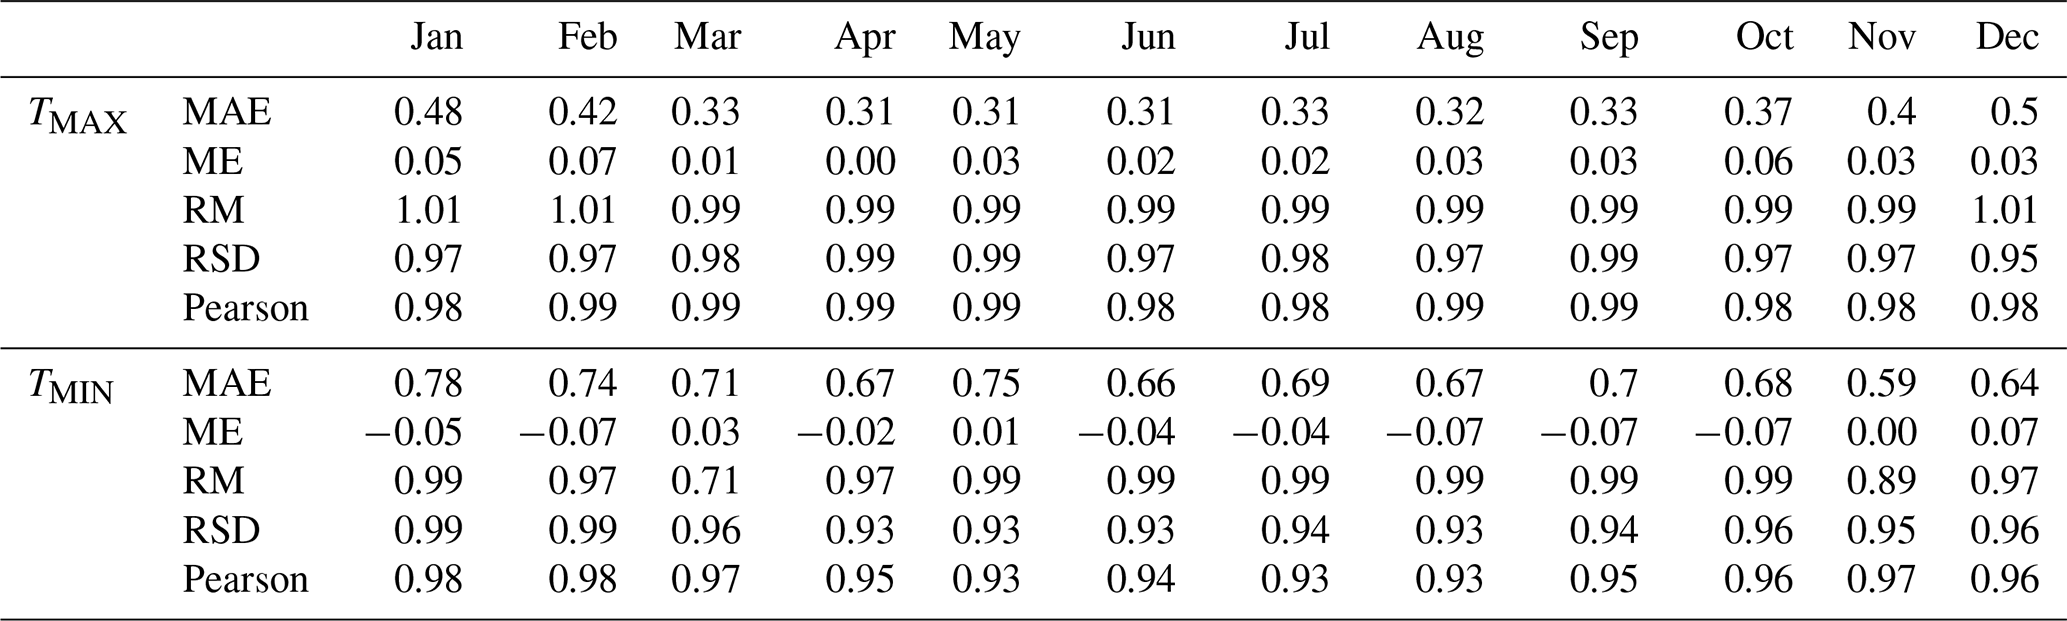
The ratio of means (RM) showed that the differences in the means between observed and estimated temperatures were lower for TMAX, with all the values very close to 1 (Table 5). TMIN showed, overall, a higher underestimation, especially in March. Moreover, the ratio of standard deviation (RSD) was higher in TMAX, while TMIN showed values under 0.95 from April to September, indicating a bias in variance estimation in these months. ME values were close to 0 in all cases, and Pearson correlations were higher than 0.98 in TMAX in all months, ranging from 0.93 to 0.98 in TMIN.
4.3 Spatial distribution and uncertainty in daily precipitation
Mean precipitation on wet days (SDII) showed that the highest values occurred in the central to northwestern part of the country and also at some individual locations on the south and north, with amounts up to 27 mm (Fig. 8a). The lowest amounts were in the northeastern part of Slovenia (less than 10 mm). The average maximum length of dry spells (CDD) reached the highest values in the northeastern part of the country, with 70 d, while this number decreased in the southeast and northwest until the values were lower than 35 d (Fig. 8b). The uncertainty of SDII was very low (< 10 %) all over the country (Fig. 9a), while the uncertainty of CDD averaged between 16 % and 20 % in most of it, with higher values (21 %–25 %) in the northeastern part (Fig. 9b).
The highest values of the mean annual absolute daily maximum temperature (TXx) were found in the southwest and east of Slovenia, with temperatures up to 36 ∘C (Fig. 10a), while values below 20 ∘C were more frequent at higher elevations. As expected, the mean annual absolute daily minimum temperature (TNn) showed a similar pattern to TXx (Fig. 10b), with the lowest values in the north and northwestern part of Slovenia (−22 ∘C) and much higher values in the southwest, where the influence of the sea affects temperatures. However, in the eastern half of the territory there was a lower spatial variability compared to that seen for TXx. The mean annual number of summer days (SU) was calculated from the annual count of days when daily TMAX was over 25 ∘C. Similar to the TXx, the highest values were found in the southwestern and also eastern part of the country (Fig. 10c). In the mountain areas, however, only a small number of summer days were found. The mean annual number of frost days (FD) was calculated from the annual count of days when the minimum daily temperature was below 0 ∘C. The number of frost days varied from 36 in the coastal area to 240 in the highest elevations, where orography had a significant influence (Fig. 10d).
The highest uncertainty values of TXx and SU were found in the northwestern part of the country (Fig. 11a, c), while the highest values of uncertainty of TNn were found in the southwestern part (Fig. 11b). Uncertainty was very low for the number of frost days (Fig. 11d).
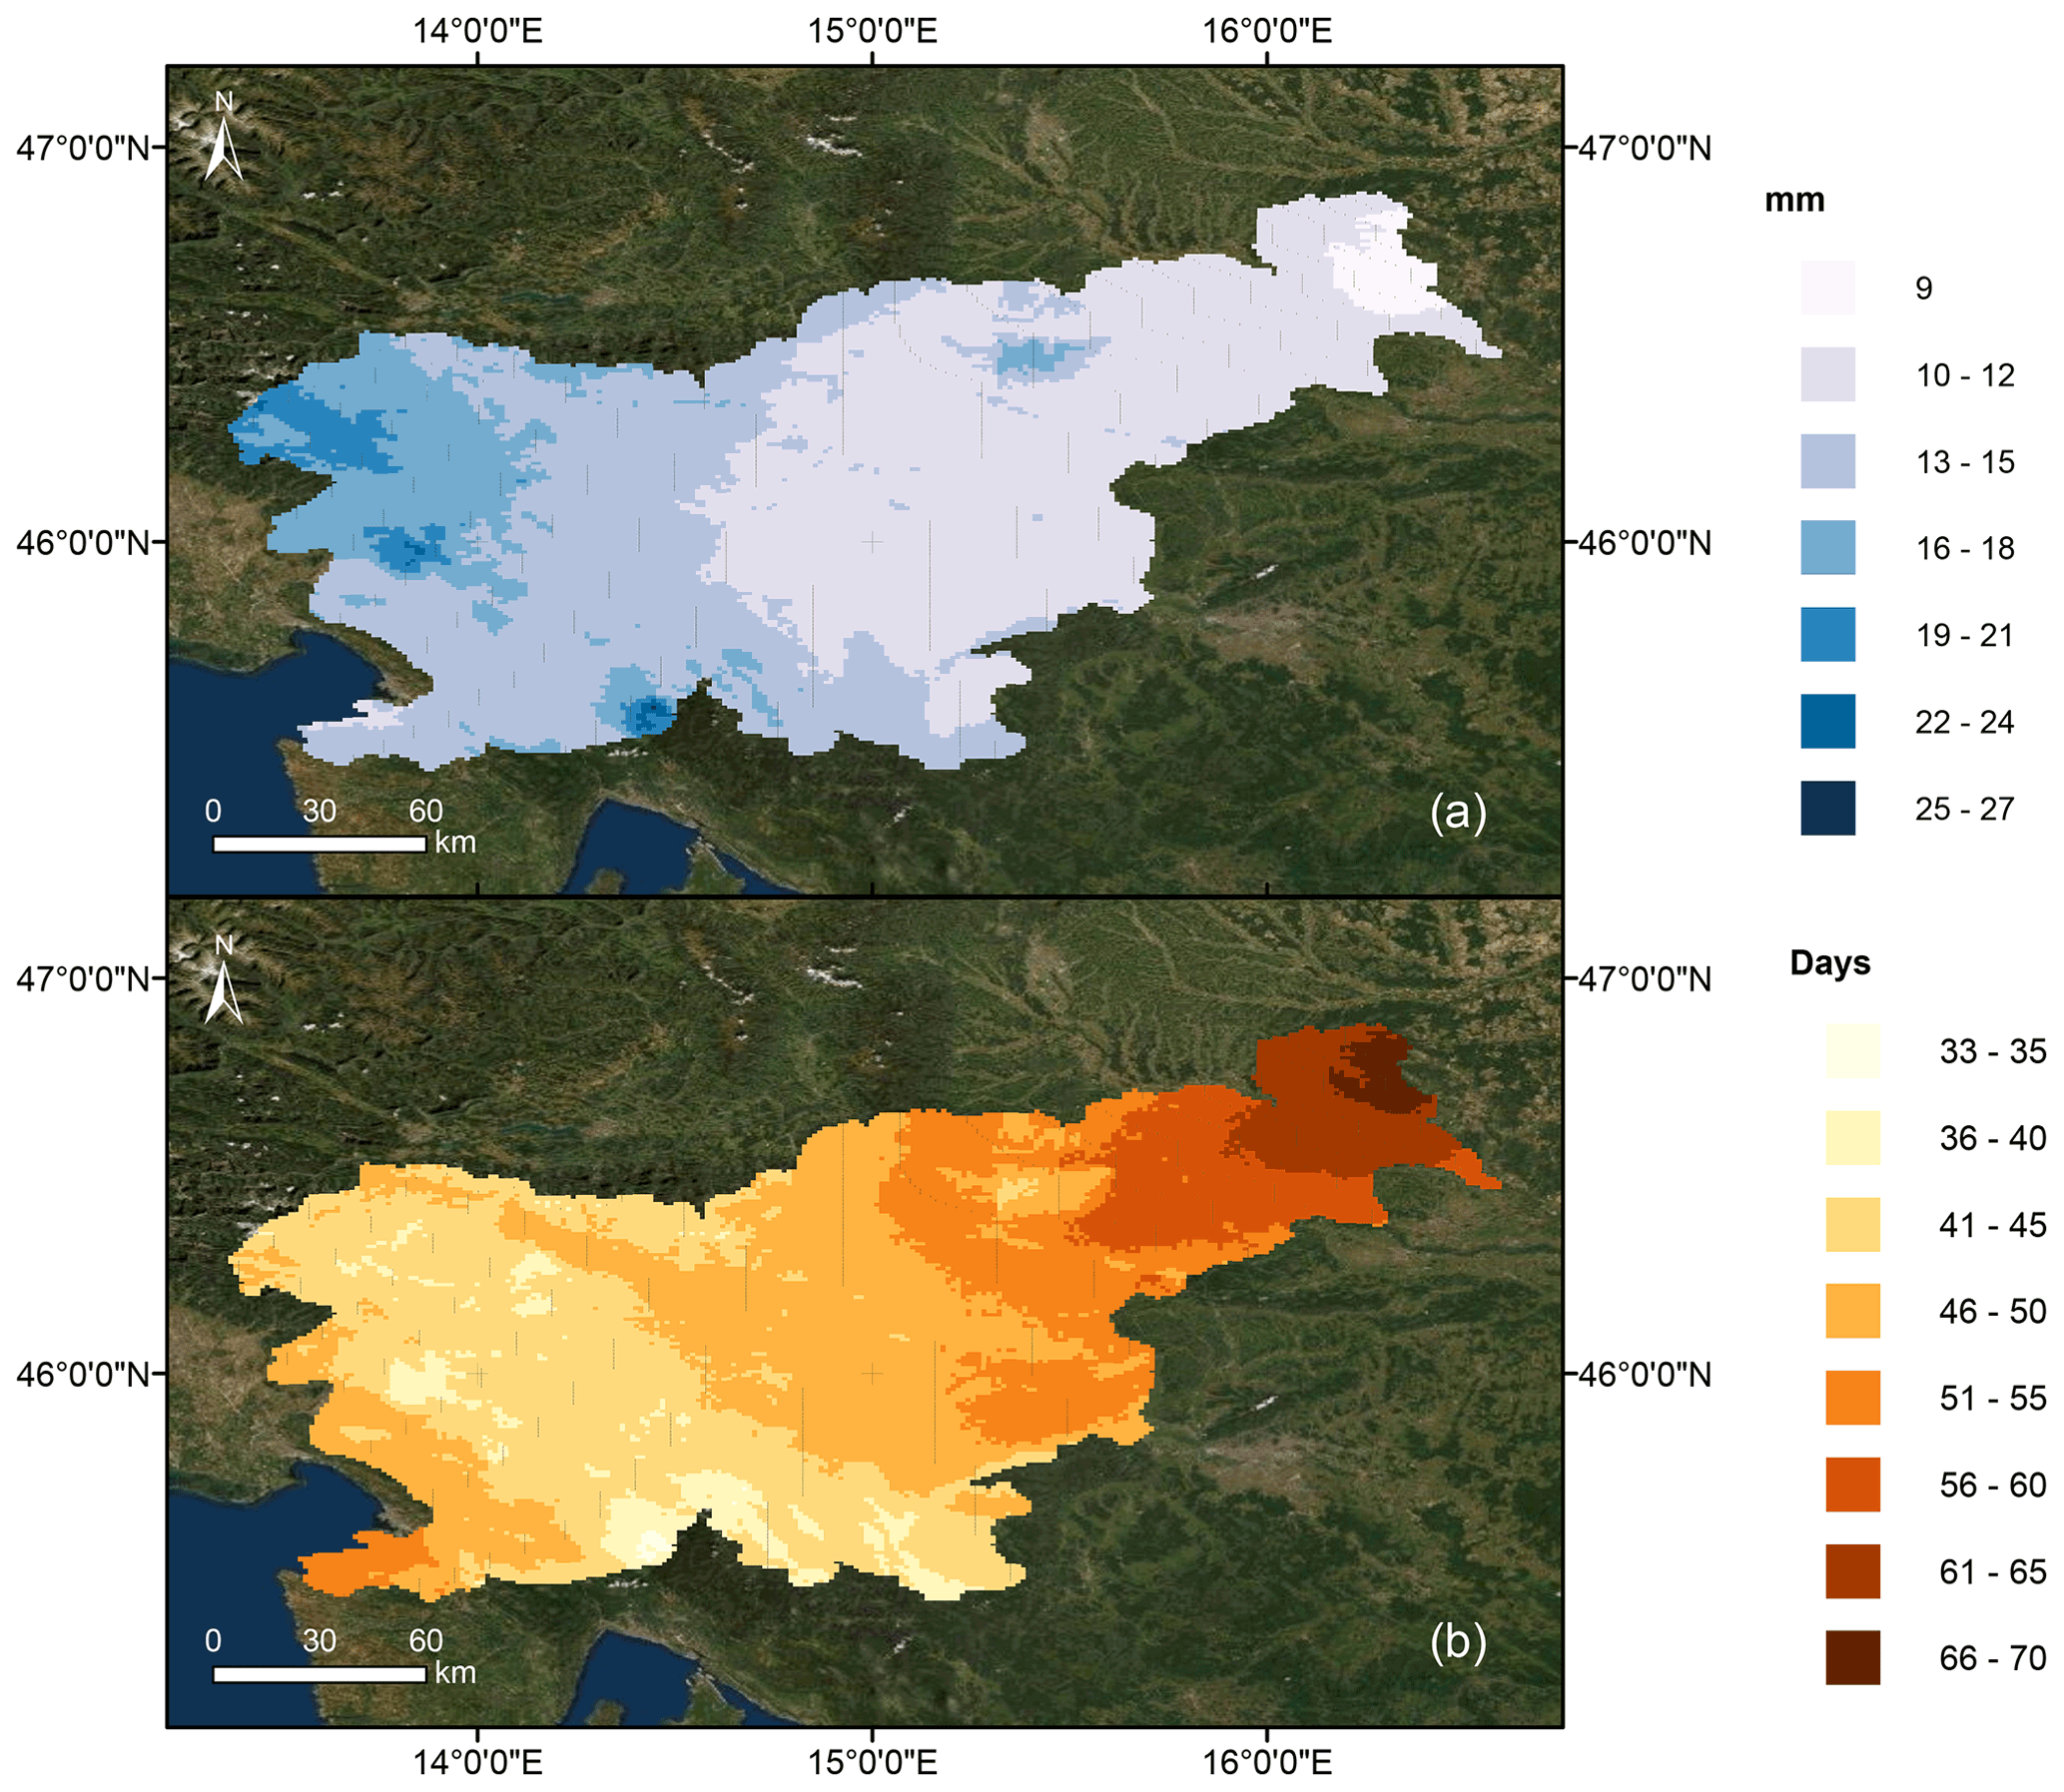
Figure 8Daily precipitation indices: (a) SDII – daily precipitation intensity; (b) CDD – maximum number of consecutive dry days (Esri, 2020; GISCO, 2020).
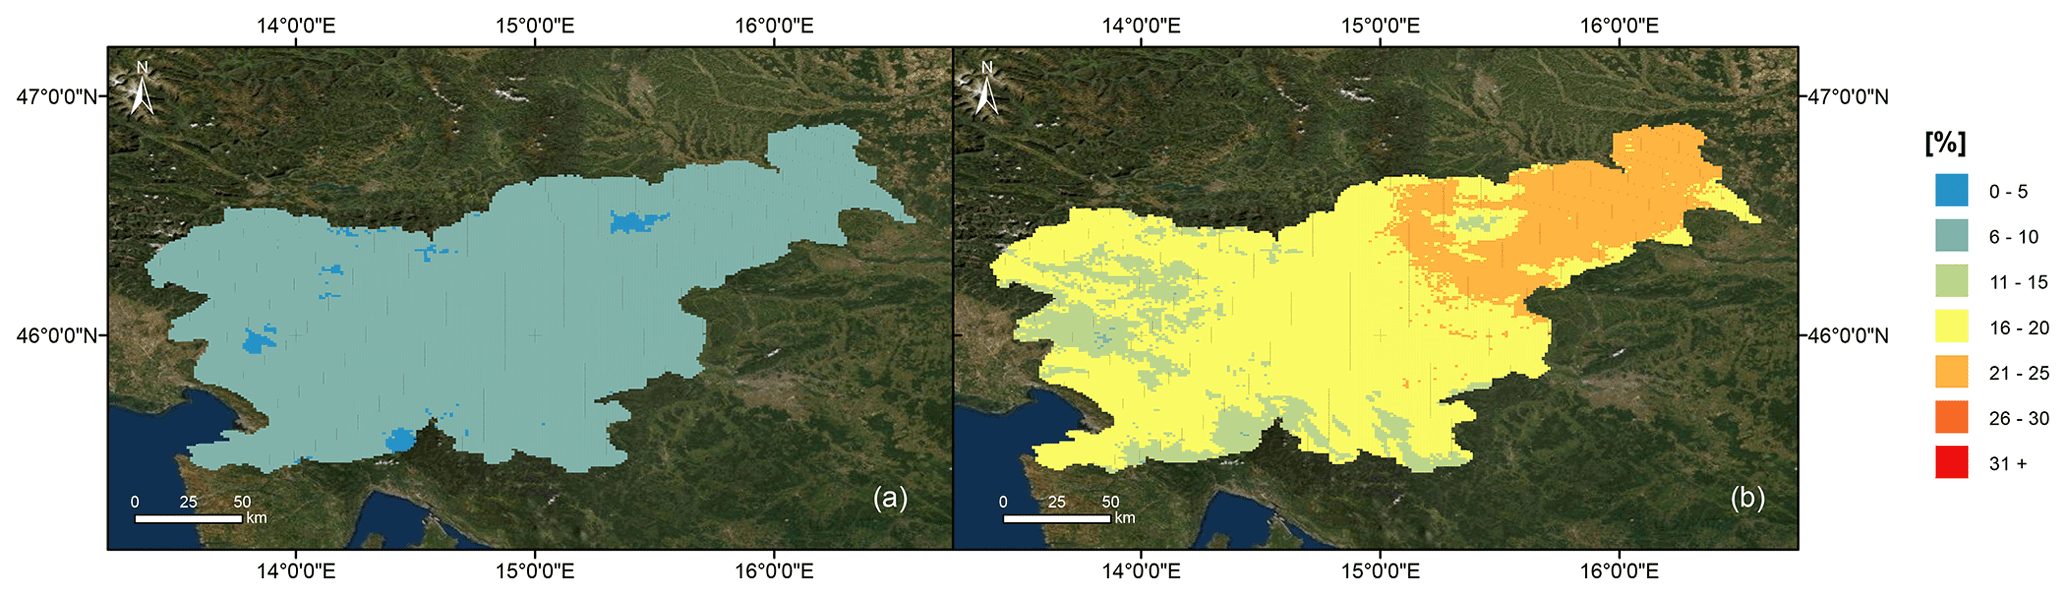
Figure 9Uncertainty of (a) SDII – daily precipitation intensity and (b) CDD – maximum number of consecutive dry days (Esri, 2020; GISCO, 2020).
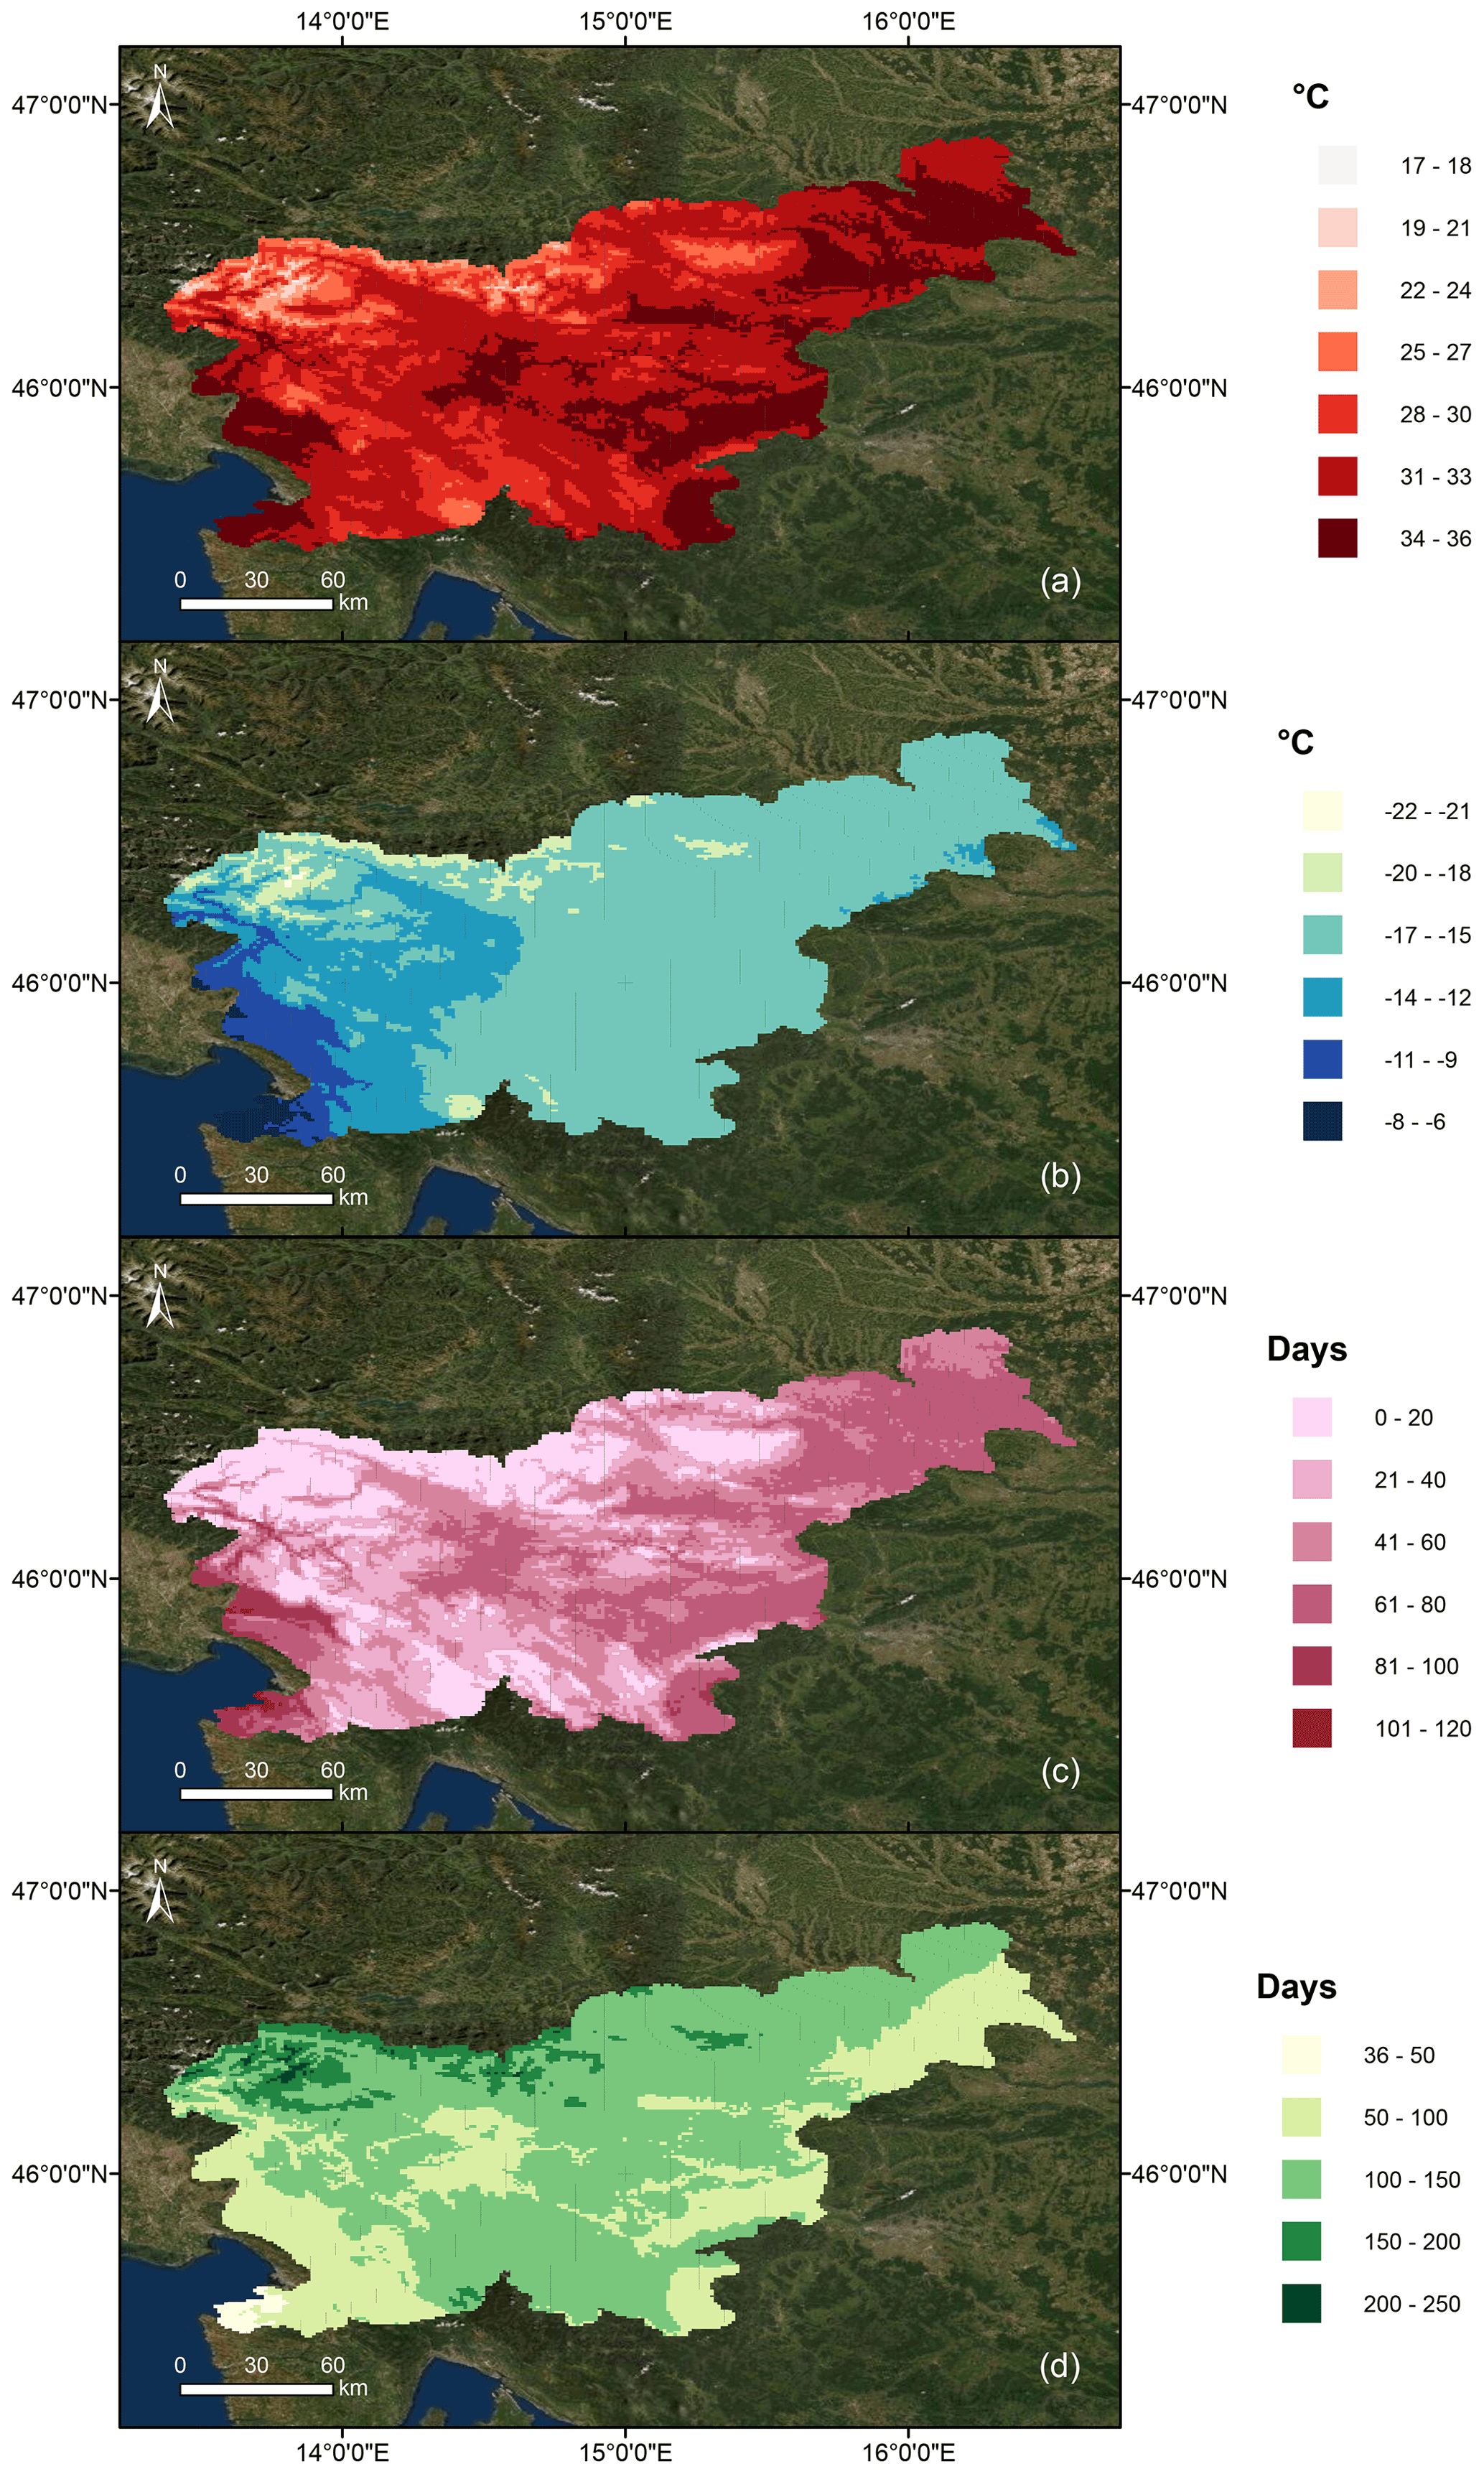
Figure 10Mean annual (1950–2018) values for (a) TXx – absolute daily maximum temperature, (b) TNn – absolute daily minimum temperature, (c) SU – number of summer days, and (d) FD – number of frost days (Esri, 2020; GISCO, 2020).
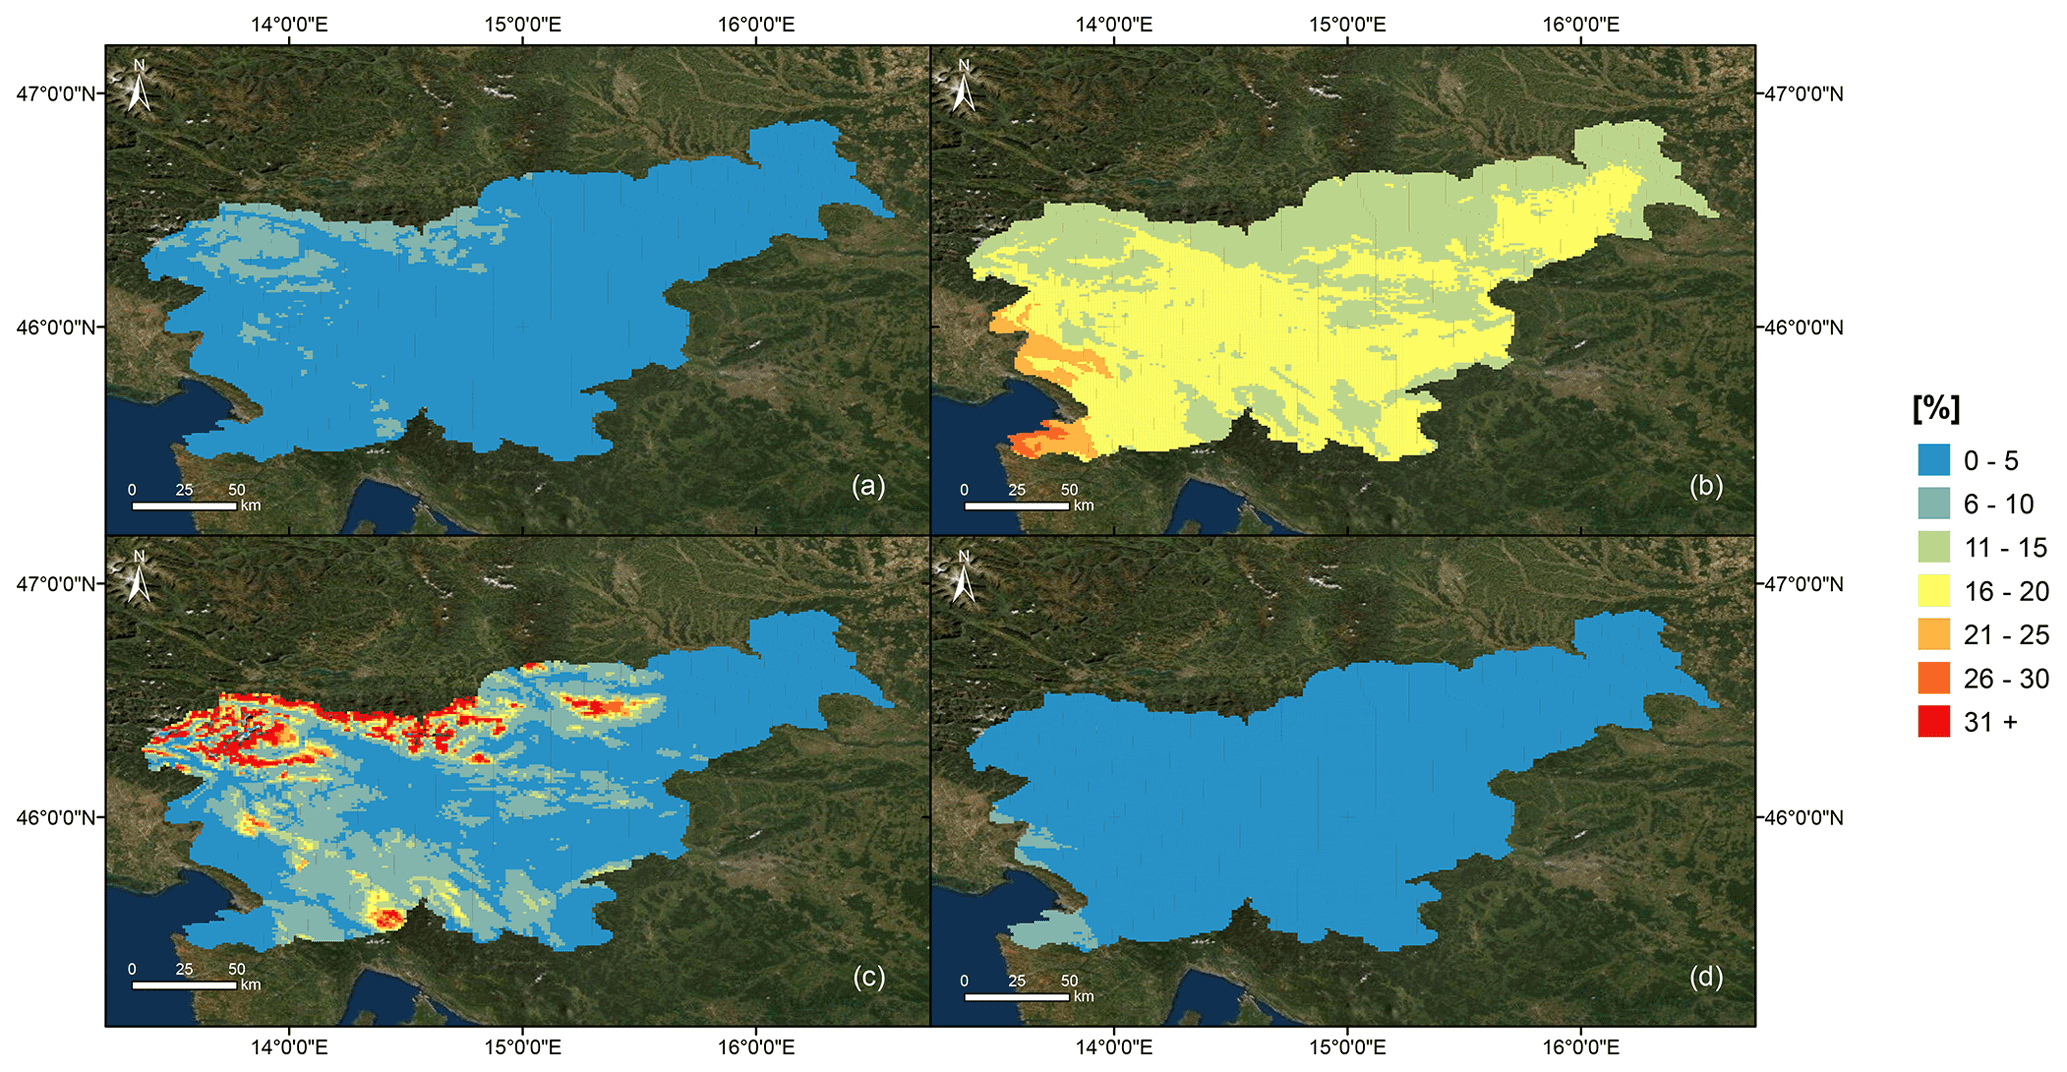
Figure 11Uncertainty of (a) TXx – absolute daily maximum temperature, (b) TNn – absolute daily minimum temperature, (c) SU – number of summer days and (d) FD – number of frost days (Esri, 2020; GISCO, 2020).
The temporal evolution of the annual values of uncertainty (Fig. 12) showed a homogeneous behaviour in precipitation all over the period except from 2013, when uncertainty rose both in median and highest values. Maximum temperature showed also a relatively static behaviour, with higher values of uncertainty in the initial decades (1950–1960s) and at the end of the period (2000s). The lower values were found in the 1980s. With a different pathway, minimum temperature played a different pattern in the first half of the period, with a decrease from 1950 to the mid-1960s and then progressively increasing to 2018, being its maximums in 1993 and 2011.
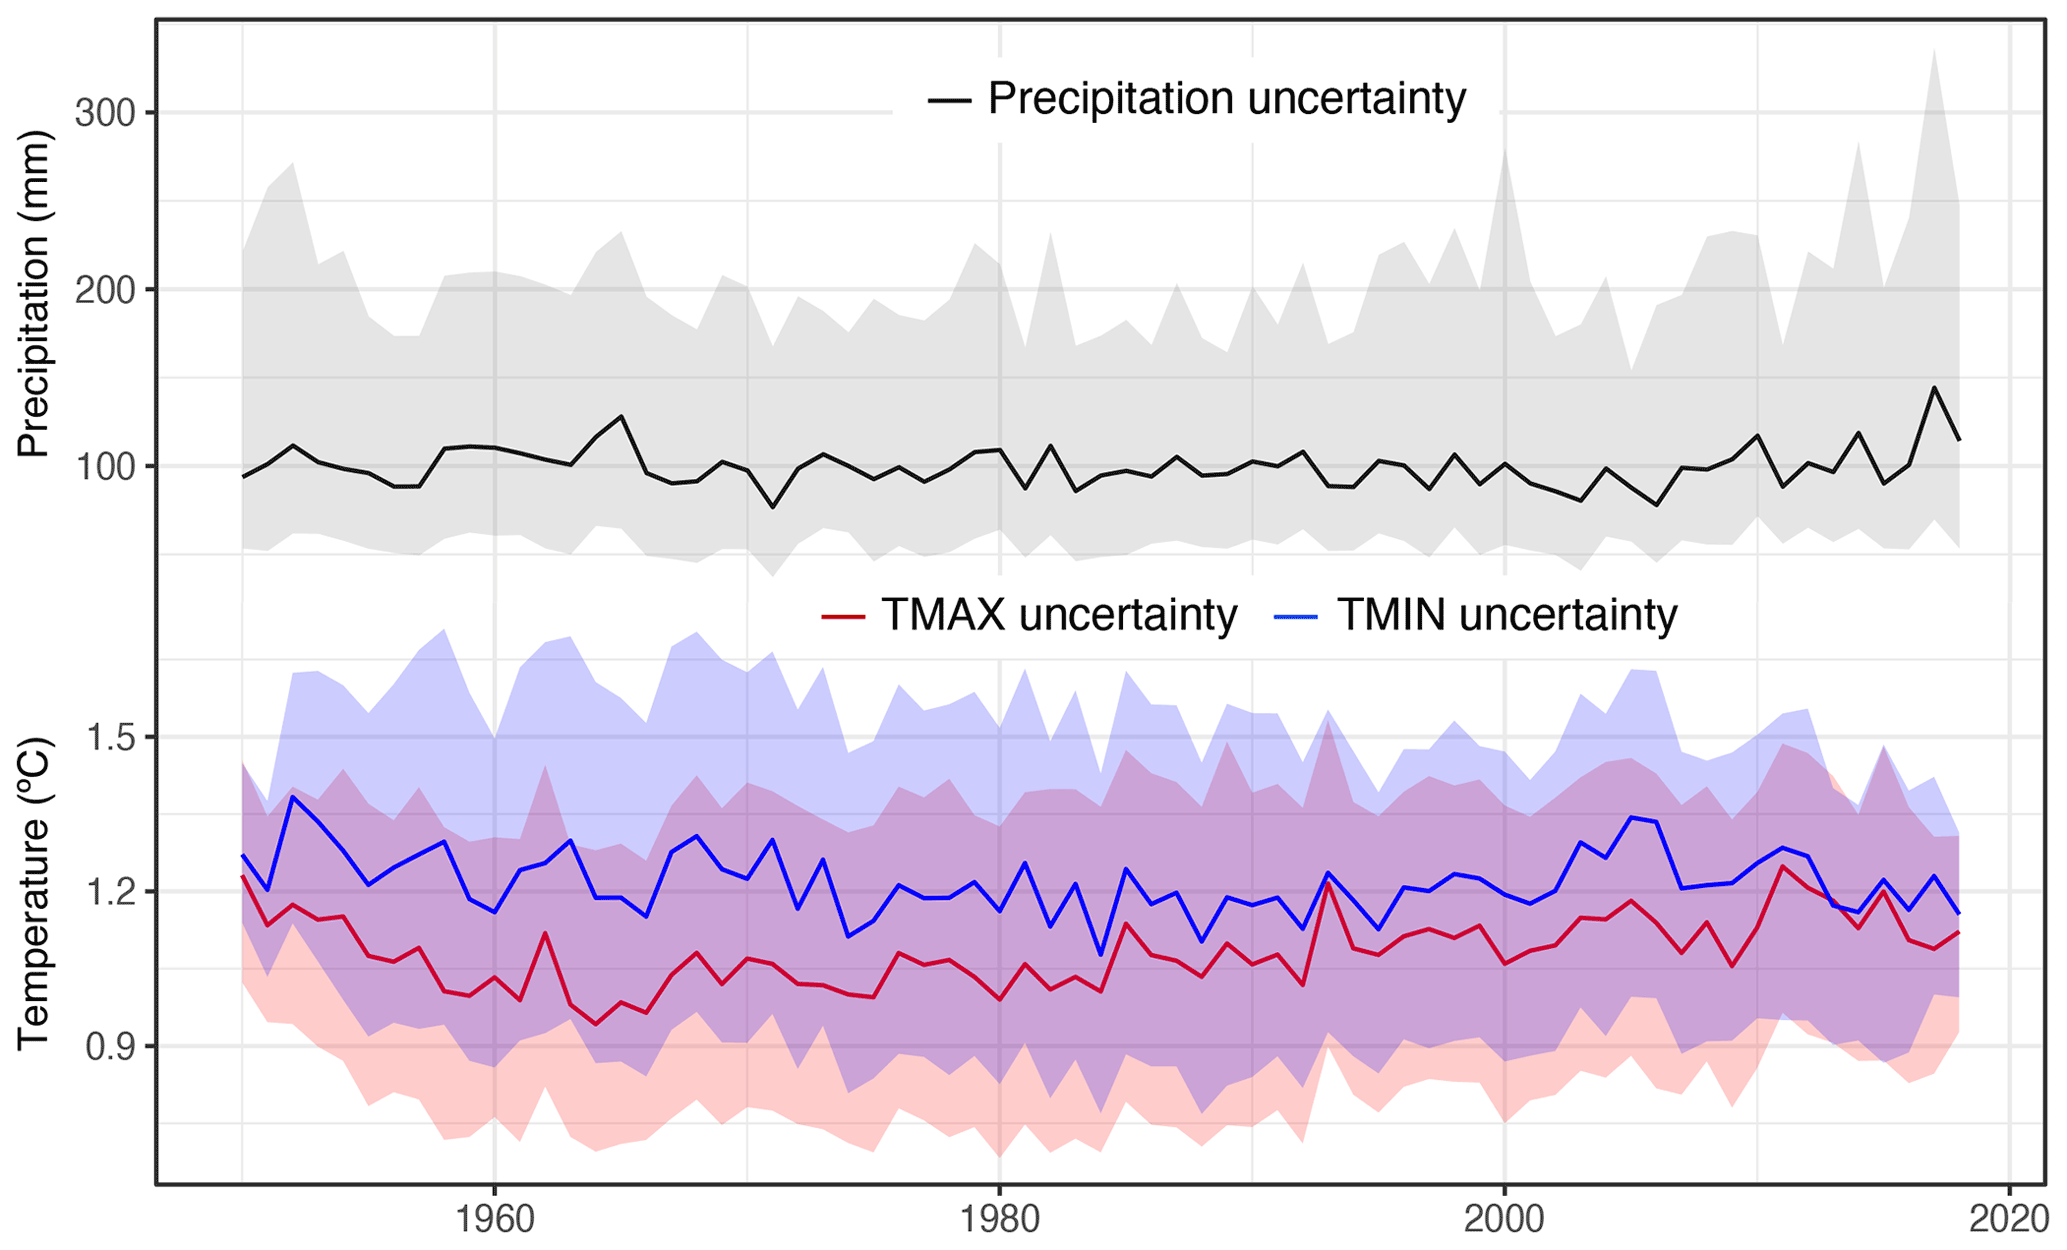
Figure 12Temporal evolution of annual median values (lines) in precipitation and temperature gridded datasets. Shaded areas show the range between the 5th and 95th percentile of uncertainty values.
To provide access to data to a wider range of users, we designed a web page for SLOCLIM (http://www.sloclim.eu, last access: 10 June 2021) where the data for selected point and period can be downloaded in .csv format. On this web page, users can select any date in the period 1950–2018 and any location on the map of Slovenia and obtain the data (maximum and minimum temperature and amount of precipitation) for the selected period in .csv format, which can also be opened in Excel.
SLOCLIM is the first climatic reconstruction for Slovenia at a high spatial resolution, providing daily data of TMAX, TMIN and the amount of precipitation from 1950 to 2018. This new daily gridded dataset contributes significantly to the climate description of the country, and it is expected to be of high value for multiple potential applications, especially in areas where observed climate records are not available, such as agricultural land, forests and mountains.
There were no climatic reconstructions available for Slovenia until the work of Dolinar (2016), who established a grid on a 1 km scale for the monthly temperature and precipitation from 1961 onwards, using explanatory variables such as longitude, latitude, altitude and their second degree polynomial terms to improve the reconstruction. Besides this, there have been other activities aimed at the homogenization of climatic data, such as the project Climate Change and Variability in Slovenia (Vertačnik et al., 2015), which was based on homogenized monthly data with the goal of obtaining high-quality meteorological data from 1961 onwards.
In order to fill the gap, the SLOCLIM database was created with a methodology that is suitable for a country like Slovenia with large climatic and orographic differences, as it provides a reliable independent assessment of climate parameters, considering the local character of precipitation and temperature at each particular location. The period 1950 to 2018 represents the longest possible time span for data reconstruction at the given resolution, which is mainly determined by the number, location and quality of meteorological stations. The method makes use of all available information and includes a comprehensive iterative quality control process that checks the spatial and temporal consistency of the data until no suspect values are detected.
The presented results show very high correlations between the estimated values and the measurements for both temperatures and precipitation, indicating the ability to reproduce realistic climatic situations. The comparison by days showed higher Pearson correlations between the original precipitation dataset and the corresponding estimates than the comparison by stations. The reason for this is the complexity of the high geographical variability between stations, which could, to a certain extent, also influence the underestimation of minimum temperatures at higher altitudes. This is shown in the LOO-CV by altitudes, where the bias in the estimates at high elevations is probably due to the lower number of available observations. Grid estimates at these altitudinal ranges (especially > 2000 m a.s.l.) may reflect the lower reliability through higher values of uncertainty. The dataset used in Dolinar (2016) showed slightly higher correlation coefficients between predicted and measured values than found in our study, but it was constructed on a monthly basis using a completely different approach. Furthermore, Dolinar (2016) obtained lower correlations between predicted and measured values for precipitation than for temperature, which is consistent with our results and is attributed to the generally higher precipitation variability both in space and time.
The agreement between the original dataset and the corresponding estimates in our study was high due to the good quality of the original data, mainly because ARSO regularly undertakes a validation control of the climatological data collected by meteorological stations, resulting in consolidated data (Bertalanič et al., 2006). Although the spatial coverage with meteorological stations decreases over time, it is still relatively high compared to other countries.
In Slovenia, precipitation is highest in the northwest (in the Julian Alps) and southwest in the Dinaric Mountains and lowest in the northeast (ARSO, 2016b), as confirmed also by our reconstruction. The highest uncertainties in precipitation were found in the northeast, in the area with the lowest amount and intensity of precipitation. Therefore, the uncertainty is higher because it is more difficult to make solid predictions in areas where precipitation is very low and the number of consecutive dry days is higher. The highest temperatures are reached in the southwestern part of the country and the lowest in the northwest (in the Alpine region), as shown by ARSO (2016a) and confirmed by our reconstruction. The presented indices of mean annual absolute daily maximum and minimum temperatures are in agreement with the observations of ARSO (2016a). The highest uncertainty levels for the high temperature indices (TXx, SU) were found for the northwest, and those for the lowest temperatures (TNn, FD) were found in the southwest, possibly due to the high orographic effect and the distance to the sea. In the southwest, lower temperatures occur less frequently than in other parts of the country, which possibly explains why the uncertainty is greater. In this regard, the uncertainty of the number of summer days (SU) was particularly high in the areas at the highest altitudes. The geographical distribution of the temperature indices is consistent with the climatic regions defined by Kozjek et al. (2017).
The SLOCLIM database opens up many possibilities for applications in areas which need data with high spatial and temporal resolution. It has the potential to address a number of relevant climate-related topics, including recognition of climatic trends and extremes as well as their mitigation and planning of prevention measures. SLOCLIM is expected to support ongoing and future research activities which are focused on basic climatic questions in Slovenia and surrounding regions, such as trend analyses and projections (Dolinar et al., 2018; de Luis et al., 2014; Milošević et al., 2017), as well as reconstruction of past climate and extreme events based on tree-ring parameters (Cook et al., 2015; Čufar et al., 2008; Hafner et al., 2014). Research where climate data are needed also includes that focused on the effects of climate change on the well-being and health of the population (Ciuha et al., 2019; Pogačar et al., 2019, 2020), as well as agroclimatic shifts and the food supply (Ceglar et al., 2012, 2019a, b). In Slovenia, a densely afforested country, climate affects the survival and productivity of forest trees due to shifts in leaf phenology (Čufar et al., 2012, 2015) and the production of crucial tree tissues, like wood and phloem (Delpierre et al., 2019; Martinez del Castillo et al., 2018; Prislan et al., 2013). While forest trees can be damaged due to extreme events like ice storms (Decuyper et al., 2020; Klopčič et al., 2020), the effects of climate differ along various gradients (Čater and Levanič, 2019; Jevšenak et al., 2020) and at the microsite level (Diaci et al., 2020; Kermavnar et al., 2019). In most cases the use of precise daily climatic parameters can help to improve recognition of climate–growth relationships (Jevšenak, 2019; Jevšenak and Levanič, 2018).
The SLOCLIM dataset is freely available in the web repository Zenodo. It can be accessed through https://doi.org/10.5281/zenodo.4108543 and cited as Škrk et al. (2020). The data are arranged in six files (daily maximum and minimum temperature, daily amount of precipitation, and their uncertainties). The data are also freely available through web page http://www.sloclim.eu (last access: 10 June 2021).
The result of the presented study is a high-resolution daily gridded precipitation and temperature dataset for Slovenia with a spatial resolution of 1×1 km for the period 1950 to 2018 (SLOCLIM). Advantages of SLOCLIM compared to other existing datasets in Slovenia are the use of all available data and the provision of reconstructed daily data over a dense grid. It delivers the daily amount of precipitation as well as maximum and minimum temperature. The available measurement data with regard to latitude, longitude, altitude and distance from the coast were used to calculate the dataset. All the data were quality controlled by using cross-validation. Missing values were calculated using the 10 nearest observations in precipitation and 15 in temperature. All results showed high correlation between estimated and observed values, and six climatic indices were also calculated: precipitation intensity, length of dry period, mean annual absolute maximum and minimum temperatures, mean annual number of frost days, and mean annual number of summer days. The indices correlated well with altitudes and distance from the coast.
SLOCLIM represents a novel publicly available climatic database for Slovenia with multiple potential applications for recognition and mitigation of climate-related events directly affecting the environment, well-being and health of the population, agriculture and food supply, and forestry. High-resolution gridded daily data are expected to facilitate research activities in numerous scientific disciplines studying climatic trends and projections; reconstruction of past climate and prediction of future climate, environment, human and animal populations; and agricultural and forest systems. The data can help to identify extreme climatic events and can be also used for prediction, adaptation and mitigation measures.
RSN, MdL, KC and NS designed the research; RSN and MdL developed the methodological approach; LKB, ZC and KC organized the original data; MdL, RSN and NS made the reconstruction of the climatic data and developed the gridded dataset. RSN and NS performed the validation processes and performed the analysis and presentation of the results. NS and RSN designed and wrote the manuscript with contribution from all co-authors. MM contributed in the creation of the web page.
The authors declare that they have no conflict of interest.
Publisher's note: Copernicus Publications remains neutral with regard to jurisdictional claims in published maps and institutional affiliations.
Climatic data were provided by the Environmental Agency of the Republic of Slovenia (ARSO) within the Ministry of the Environment and Spatial Planning. We thank Gregor Senegačnik from the Slovenia Forest Service for help with ArcMap. We thank Zorko Vičar for his great help with the original climatic data. We thank Paul Steed for language editing.
The study was supported by the Slovenian Research Agency ARRS (programs P4-0015 and P4-0085 and young researchers' program). Roberto Serrano-Notivoli and Martín de Luis were partially supported by the Government of Aragón through the “Program of research groups” (group H09_20R, “Clima, Agua, Cambio Global y Sistemas Naturales”).
This paper was edited by Lukas Gudmundsson and reviewed by Miquel Tomas-Burguera and Martin Hanel.
ARSO: Letna povprečna temperatura zraka (1981–2010), available at: http://meteo.arso.gov.si/uploads/probase/www/climate/image/sl/by_variable/temperature/annual-mean-air-temperature_81-10.png (last access: 11 September 2020), 2016a.
ARSO: Povprečna letna višina merjenih padavin (1981–2010), available at: http://meteo.arso.gov.si/uploads/probase/www/climate/image/sl/by_variable/precipitation/mean-annual-measured-precipitation_81-10.png (last access: 11 September 2020), 2016b.
ARSO: Archival data on meteorological conditions in Slovenia, Slov. Environ. Agency. Minist. Environ. Spat. Planning, Ljubljana, Slov., available at: http://meteo.arso.gov.si/met/sl/archive/, last access: 1 March 2020.
Bertalanič, R., Dolinar, M., Nadbath, M., Ovsenik-Jeglič, T., Vertačnik, G., and Vičar, Z.: Climate of Slovenia 1971–2000, edited by: Dolinar, M., The Environmental Agency of the Republic of Slovenia, Ljubljana, Slovenia, p. 20, available at: https://meteo.arso.gov.si/uploads/probase/www/climate/text/en/publications/climate_of_slovenia_71_00.pdf (last access: 10 June 2021), 2006.
Čater, M. and Levanič, T.: Beech and silver fir's response along the Balkan's latitudinal gradient, Sci. Rep., 9, 1–14, https://doi.org/10.1038/s41598-019-52670-z, 2019.
Ceglar, A., Medved Cvikl, B., Moran Tejeda, E., Vicente Serrano, S. M., and Kajfež Bogataj, L.: Assessment of multi-scale drought datasets to quantify drought severity and impacts in agriculture: a case study for Slovenia, Int. J. Spat. Data Infrastruct. Res., 7, 464–487, https://doi.org/10.2902/1725-0463.2012.07.art21, 2012.
Ceglar, A., Van der Wijngaart, R., De Wit, A., Lecerf, R., Boogaard, H., Seguini, L., Van den Berg, M., Toreti, A., Zampieri, M., and Fumagalli, D.: Improving WOFOST model to simulate winter wheat phenology in Europe: Evaluation and effects on yield, Agric. Syst., 168, 168–180, 2019a.
Ceglar, A., Zampieri, M., Toreti, A., and Dentener, F.: Observed Northward Migration of Agro-Climate Zones in Europe Will Further Accelerate Under Climate Change, Earth's Future, 7, 1088–1101, https://doi.org/10.1029/2019EF001178, 2019b.
Cegnar, T.: Ekstremni vremenski dogodki, ARSO, available at: http://kazalci.arso.gov.si/sl/content/ekstremni-vremenski-dogodki-1 (last access: 12 September 2020), 2016.
Chaney, N. W., Sheffield, J., Villarini, G., and Wood, E. F.: Development of a high-resolution gridded daily meteorological dataset over sub-Saharan Africa: Spatial analysis of trends in climate extremes, J. Climate, 27, 5815–5835, https://doi.org/10.1175/JCLI-D-13-00423.1, 2014.
Ciuha, U., Pogačar, T., Bogataj, L. K., Gliha, M., Nybo, L., Flouris, A. D., and Mekjavic, I. B.: Interaction between indoor occupational heat stress and environmental temperature elevations during heat waves, Weather. Clim. Soc., 11, 755–762, https://doi.org/10.1175/WCAS-D-19-0024.1, 2019.
Cook, E. R., Seager, R., Kushnir, Y., Briffa, K. R., Büntgen, U., Frank, D., Krusic, P. J., Tegel, W., Schrier, G. Vander, Andreu-Hayles, L., Baillie, M., Baittinger, C., Bleicher, N., Bonde, N., Brown, D., Carrer, M., Cooper, R., Čufar, K., DIttmar, C., Esper, J., Griggs, C., Gunnarson, B., Günther, B., Gutierrez, E., Haneca, K., Helama, S., Herzig, F., Heussner, K. U., Hofmann, J., Janda, P., Kontic, R., Köse, N., Kyncl, T., Levanič, T., Linderholm, H., Manning, S., Melvin, T. M., Miles, D., Neuwirth, B., Nicolussi, K., Nola, P., Panayotov, M., Popa, I., Rothe, A., Seftigen, K., Seim, A., Svarva, H., Svoboda, M., Thun, T., Timonen, M., Touchan, R., Trotsiuk, V., Trouet, V., Walder, F., Wany, T., Wilson, R., and Zang, C.: Old World megadroughts and pluvials during the Common Era, Sci. Adv., 1, 1–10, https://doi.org/10.1126/sciadv.1500561, 2015.
Cuadrat, J. M., Serrano-Notivoli, R., Llabrés, A., Prohom, M., Saz, M. Á., Tejedor, E., Cunillera, J., Trapero, L., Pons, M., Copons, R., Lopez-Moreno, J. I., Luna, M. Y., Rodriguez, E., Gascoin, S., and Soubeyroux, J. M.: Creación de un sistema de indicadores para la caracterización del clima de los Pirineos, in: Desafíos y oportunidades de un mundo en transición: Una interpretación desde la Geografía, edited by: Farinos, J., Escribano, J., Penarrubia, M. P., Serrano, J., and Asins, S., Universitat de València, Valencia, p. 53, 2020.
Čufar, K., De Luis, M., Eckstein, D., and Kajfež-Bogataj, L.: Reconstructing dry and wet summers in SE Slovenia from oak tree-ring series, Int. J. Biometeorol., 52, 607–615, https://doi.org/10.1007/s00484-008-0153-8, 2008.
Čufar, K., de Luis, M., Saz, M. A., Črepinšek, Z., and Kajfež-Bogataj, L.: Temporal shifts in leaf phenology of beech (Fagus sylvatica) depend on elevation, Trees-Struct. Funct., 26, 1091–1100, https://doi.org/10.1007/s00468-012-0686-7, 2012.
Čufar, K., De Luis, M., Prislan, P., Gričar, J., Črepinšek, Z., Merela, M., and Kajfež-Bogataj, L.: Do variations in leaf phenology affect radial growth variations in Fagus sylvatica?, Int. J. Biometeorol., 59, 1127–1132, https://doi.org/10.1007/s00484-014-0896-3, 2015.
Decuyper, M., Chávez, R. O., Čufar, K., Estay, S. A., Clevers, J. G. P. W., Prislan, P., Gričar, J., Črepinšek, Z., Merela, M., de Luis, M., Notivoli, R. S., del Castillo, E. M., Rozendaal, D. M. A., Bongers, F., Herold, M., and Sass-Klaassen, U.: Spatio-temporal assessment of beech growth in relation to climate extremes in Slovenia – An integrated approach using remote sensing and tree-ring data, Agr. Forest Meteorol., 287, 107925, https://doi.org/10.1016/j.agrformet.2020.107925, 2020.
Delpierre, N., Lireux, S., Hartig, F., Camarero, J. J., Cheaib, A., Čufar, K., Cuny, H., Deslauriers, A., Fonti, P., Gričar, J., Huang, J. G., Krause, C., Liu, G., de Luis, M., Mäkinen, H., del Castillo, E. M., Morin, H., Nöjd, P., Oberhuber, W., Prislan, P., Rossi, S., Saderi, S. M., Treml, V., Vavrick, H., and Rathgeber, C. B. K.: Chilling and forcing temperatures interact to predict the onset of wood formation in Northern Hemisphere conifers, Glob. Change Biol., 25, 1089–1105, https://doi.org/10.1111/gcb.14539, 2019.
de Luis, M., Čufar, K., Saz, M. A., Longares, L. A., Ceglar, A., and Kajfež-Bogataj, L.: Trends in seasonal precipitation and temperature in Slovenia during 1951–2007, Reg. Environ. Change, 14, 1801–1810, https://doi.org/10.1007/s10113-012-0365-7, 2014.
Diaci, J., Rozman, J., and Rozman, A.: Regeneration gap and microsite niche partitioning in a high alpine forest: Are Norway spruce seedlings more drought-tolerant than beech seedlings?, Forest Ecol. Manag., 455, 117688, https://doi.org/10.1016/j.foreco.2019.117688, 2020.
Dolinar, M.: Monthly gridded datasets for temperature and precipitation over Slovenia, Proc. GeoMLA–Geostatistics Mach. Learn., Belgrade, Serbia, 2016.
Dolinar, M., Gregorič, G., Honzak, L., Sušnik, A., Vlahović, Ž. and Žust, A.: Ocena podnebnih sprememb v Sloveniji do konca 21, stoletja: povzetek dejavnikov okolja z vplivom na kmetijstvo in gozdarstvo, Ministrstvo za okolje in prostor, Agencija Republike Slovenije za okolje, Ljubljana, available at: https://meteo.arso.gov.si/uploads/probase/www/climate/text/sl/publications/povzetek-podnebnih-sprememb-agro.pdf (last access: 10 June 2021), 2018.
Esri: Imagery [basemap], World Imag., available at: https://www.arcgis.com/home/item.html?id=10df2279f9684e4a9f6a7f08febac2a9 (last access: 10 June 2021), 2020.
Giorgi, F.: Climate change hot-spots, Geophys. Res. Lett., 33, 1–4, https://doi.org/10.1029/2006GL025734, 2006.
GISCO: Countries 2020, Geogr. Inf. Syst. Comm., available at: https://ec.europa.eu/eurostat/web/gisco/geodata/reference-data/administrative-units-statistical-units/countries, last access: 15 November 2020.
GURS: Orthophoto DOF025 (2017–2019), Free Access Database, available at: http://www.gu.gov.si/en/services/free_access_database/, last access: 15 November 2020.
Hafner, P., McCarroll, D., Robertson, I., Loader, N. J., Gagen, M., Young, G. H. F., Bale, R. J., Sonninen, E., and Levanič, T.: A 520 year record of summer sunshine for the eastern European Alps based on stable carbon isotopes in larch tree rings, Clim. Dynam., 43, 971–980, https://doi.org/10.1007/s00382-013-1864-z, 2014.
Haylock, M. R., Hofstra, N., Klein Tank, A. M. G., Klok, E. J., Jones, P. D., and New, M.: A European daily high-resolution gridded data set of surface temperature and precipitation for 1950–2006, J. Geophys. Res.-Atmos., 113, D20119, https://doi.org/10.1029/2008JD010201, 2008.
Hernández, A., Kutiel, H., Trigo, R. M., Valente, M. A., Sigró, J., Cropper, T., and Santo, F. E.: New Azores archipelago daily precipitation dataset and its links with large-scale modes of climate variability, Int. J. Climatol., 36, 4439–4454, https://doi.org/10.1002/joc.4642, 2016.
Herrera, S., Gutiérrez, J. M., Ancell, R., Pons, M. R., Frías, M. D., and Fernández, J.: Development and analysis of a 50-year high-resolution daily gridded precipitation dataset over Spain (Spain02), Int. J. Climatol., 32, 74–85, https://doi.org/10.1002/joc.2256, 2012.
Jevšenak, J.: Daily climate data reveal stronger climate-growth relationships for an extended European tree-ring network, Quaternary Sci. Rev., 221, 105868, https://doi.org/10.1016/j.quascirev.2019.105868, 2019.
Jevšenak, J. and Levanič, T.: dendroTools: R package for studying linear and nonlinear responses between tree-rings and daily environmental data, Dendrochronologia, 48, 32–39, 2018.
Jevšenak, J., Tychkov, I., Gričar, J., Levanič, T., Tumajer, J., Prislan, P., Arnič, D., Popkova, M., and Shishov, V. V.: Growth-limiting factors and climate response variability in Norway spruce (Picea abies L.) along an elevation and precipitation gradients in Slovenia, Int. J. Biometeorol., 65, 311–324, https://doi.org/10.1007/s00484-020-02033-5, 2020.
Kermavnar, J., Marinšek, A., Eler, K., and Kutnar, L.: Evaluating short-term impacts of forest management and microsite conditions on understory vegetation in temperate fir-beech forests: Floristic, ecological, and trait-based perspective, Forests, 10, 909, https://doi.org/10.3390/f10100909, 2019.
Klanderud, K. and Totland, Ø.: Simulated climate change altered dominance hierarchies and diversity of an alpine biodiversity hotspot, Ecology, 86, 2047–2054, https://doi.org/10.1890/04-1563, 2005.
Klopčič, M., Poljanec, A., Dolinar, M., Kastelec, D., and Bončina, A.: Ice-storm damage to trees in mixed Central European forests: damage patterns, predictors and susceptibility of tree species, For. An Int. J. For. Res., 93, 430–443, https://doi.org/10.1093/forestry/cpz068, 2020.
Kozjek, K., Dolinar, M., and Skok, G.: Objective climate classification of Slovenia, Int. J. Climatol., 37, 848–860, https://doi.org/10.1002/joc.5042, 2017.
Lussana, C., Tveito, O. E., and Uboldi, F.: Three-dimensional spatial interpolation of 2 m temperature over Norway, Q. J. Roy. Meteor. Soc., 144, 344–364, https://doi.org/10.1002/qj.3208, 2018.
Martinez del Castillo, E., Prislan, P., Gričar, J., Gryc, V., Merela, M., Giagli, K., de Luis, M., Vavrčík, H., and Čufar, K.: Challenges for growth of beech and co-occurring conifers in a changing climate context, Dendrochronologia, 52, 1–10, https://doi.org/10.1016/j.dendro.2018.09.001, 2018.
Martínez del Castillo, E., Longares, L. A., Serrano-Notivoli, R., and de Luis, M.: Modeling tree-growth: Assessing climate suitability of temperate forests growing in Moncayo Natural Park (Spain), Forest Ecol. Manag., 435, 128–137, https://doi.org/10.1016/j.foreco.2018.12.051, 2019.
Milošević, D. D., Savić, S. M., Stankov, U., Žiberna, I., Pantelić, M. M., Dolinaj, D., and Leščešen, I.: Maximum temperatures over slovenia and their relationship with atmospheric circulation patterns, Geogr. CGS, 122, 1–20, https://doi.org/10.37040/geografie2017122010001, 2017.
Pogačar, T., Žnidaršič, Z., Črepinšek, Z., and Bogataj, L. K.: Aggravated Occupational Heat Stress Recognition and Mitigation in Slovenia, in: Climate Change Adaptation in Eastern Europe, edited by: Leal Filho, W., Trbic, G., and Filipovic, D., Springer, Cham, 267–277, 2019.
Pogačar, T., Žnidaršič, Z., Bogataj, L. K., and Črepinšek, Z.: Steps towards comprehensive heat communication in the frame of a heat health warning system in Slovenia, Int. J. Env. Res. Pub. He., 17, 1–16, https://doi.org/10.3390/ijerph17165829, 2020.
Prislan, P., Gričar, J., de Luis, M., Smith, K. T., and Čufar, K.: Phenological variation in xylem and phloem formation in Fagus sylvatica from two contrasting sites, Agr. Forest Meteorol., 180, 142–151, https://doi.org/10.1016/j.agrformet.2013.06.001, 2013.
Serrano-Notivoli, R., de Luis, M., Saz, M. Á., and Beguería, S.: Spatially based reconstruction of daily precipitation instrumental data series, Clim. Res., 73, 167–186, 2017a.
Serrano-Notivoli, R., Beguería, S., Saz, M. Á., Longares, L. A., and de Luis, M.: SPREAD: a high-resolution daily gridded precipitation dataset for Spain – an extreme events frequency and intensity overview, Earth Syst. Sci. Data, 9, 721–738, https://doi.org/10.5194/essd-9-721-2017, 2017b.
Serrano-Notivoli, R., Beguería, S., and de Luis, M.: STEAD: a high-resolution daily gridded temperature dataset for Spain, Earth Syst. Sci. Data, 11, 1171–1188, https://doi.org/10.5194/essd-11-1171-2019, 2019.
Škrk, N., de Luis, M., Čufar, K., Črepinšek, Z., Kajfež Bogataj, L., and Serrano-Notivoli, R.: SLOCLIM: A high-resolution daily gridded precipitation and temperature dataset for Slovenia [Dataset], Zenodo [data set], https://doi.org/10.5281/zenodo.4108543, 2020.
Vertačnik, G., Dolinar, M., Bertalanič, R., Klančar, M., Dvoršek, D., and Nadbath, M.: Ensemble homogenization of Slovenian monthly air temperature series, Int. J. Climatol., 35, 4015–4026, https://doi.org/10.1002/joc.4265, 2015.
Yatagai, A., Kamiguchi, K., Arakawa, O., Hamada, A., Yasutomi, N. and Kitoh, A.: Aphrodite constructing a long-term daily gridded precipitation dataset for Asia based on a dense network of rain gauges, B. Am. Meteorol. Soc., 93, 1401–1415, https://doi.org/10.1175/BAMS-D-11-00122.1, 2012.