the Creative Commons Attribution 4.0 License.
the Creative Commons Attribution 4.0 License.
 | 11 Feb 2021
Crowdsourced air traffic data from the OpenSky Network 2019–2020
Martin Strohmeier
Xavier Olive
Jannis Lübbe
Matthias Schäfer
Vincent Lenders
The OpenSky Network is a non-profit association that crowdsources the global collection of live air traffic control data broadcast by aircraft and makes them available to researchers.
OpenSky's data have been used by over 100 academic groups in the past 5 years, with popular research applications ranging from improved weather forecasting to climate analysis. With the COVID-19 outbreak, the demand for live and historic aircraft flight data has surged. Researchers around the world use air traffic data to comprehend the spread of the pandemic and analyse the effects of the global containment measures on economies, climate and other systems.
With this work, we present a comprehensive air traffic dataset, derived and enriched from the full OpenSky data and made publicly available for the first time (Olive et al., 2020; https://doi.org/10.5281/zenodo.3931948, last access: 9 February 2021). It spans all flights seen by the network's more than 3500 members between 1 January 2019 and 1 July 2020. The archive is being updated every month and for the first 18 months includes 41 900 660 flights, from 160 737 aircraft, which were seen to frequent 13 934 airports in 127 countries.
- Article
(2839 KB) - Full-text XML
- BibTeX
- EndNote


In this paper, we present a dataset of global flight movements derived from crowdsourced air traffic control data collected by the OpenSky Network (Schäfer et al., 2014), which are widely used in many fields, including several areas pertaining to Earth system sciences. With the spread of COVID-19, they are furthermore widely used in the understanding of the pandemic and its effects.
OpenSky flight data have regularly been used in analysing environmental issues such as noise emissions (Tengzelius and Abom, 2019) or black carbon particulate emissions (Zhang et al., 2019) to name but a few. In the wake of the pandemic, OpenSky has received a surge of more than 70 requests for air traffic data specifically related to COVID-19. The research behind these requests can be largely separated into two different areas, epidemiological modelling and understanding the systemic impact of the pandemic.
The first category, modelling of the possible spread of COVID-19, was of crucial interest early in the stages of the pandemic and will again gain importance in estimating travel safety in the future. The utility of flight data for this purpose was illustrated for example in widely circulated studies such as Bogoch et al. (2020) but has been known to be useful in the context of pandemics for much longer (e.g. Mao et al., 2015).
The second main category comprises the analysis of the socio-ecological impact of COVID-19 and measures implemented to fight it. It uses flights for example as an indicator of economic activity (at a given airport or region or globally) as illustrated in Miller et al. (2020). Examples of such use of data provided by OpenSky can be found in the following: Bank of England, Monetary Policy Committee (2020), International Monetary Fund (2020), or United Nations Department of Economic and Social Affairs (2020).
Flight data can further be used to understand the impact of the sudden drop in air traffic in many global systems. For example, Lecocq et al. (2020) employed OpenSky data recently in order to analyse the impact of COVID-19 mitigation measures on high-frequency seismic noise and we have received several requests relating to research specifically on the impact of COVID-19. This present dataset, available at https://doi.org/10.5281/zenodo.3931948 (last access: 9 February 2021), was created in order to make it easier for researchers to access air traffic data for their own systemic analyses.
Crowdsourced research projects are a form of “citizen science” whereby members of the public can join larger scientific efforts by contributing to smaller tasks. In the past, such efforts have taken many forms including attempting to detect extra-terrestrial signals (UC Berkley, 2019) or exploring protein folding for medical purposes (Pande, 2019). Typically, the projects form distributed computing networks with results being fed to a central server.
In a parallel development, software-defined radios (SDRs) have become readily available and affordable over the past decade. SDR devices present a significant change to traditional radios, in that wireless technologies can be implemented as separate pieces of software and run on the same hardware. This has greatly reduced the barriers to entry, so many more users can now take part in wireless projects such as crowdsourced sensor networks with little cost. This development has given rise to several global crowdsourced flight tracking efforts, from commercial to enthusiast and research use.
The concept of flight tracking itself is based on several radar technologies. Traditionally, these were expensive and inaccurate non-cooperative radars developed for military purposes. With the explosive growth of global civil aviation, however, more accurate cooperative radar technologies have been deployed to ensure safety and efficiency of the airspace.
For this dataset of flight movements, we use the data broadcast by aircraft with the modern Automatic Dependent Surveillance–Broadcast (ADS-B) protocol. These data include position, velocity, identification and flight status information broadcast up to twice a second (see Schäfer et al., 2014). The protocol is being made mandatory in many airspaces as of 2020, resulting in broad equipage among larger aircraft from industrialized countries and emerging economies as described by Schäfer et al. (2016).
Figure 2 illustrates the principle of OpenSky in the abstract: the data are broadcast by ADS-B-equipped aircraft and received by crowdsourced receivers on the ground, which have typical ranges of 100–500 km in a line-of-sight environment. The data are then sent to the OpenSky Network, where they are processed and stored in a Cloudera Impala database. In line with its mission as a non-profit organization, OpenSky then grants researchers from academic and other institutions direct access to this database on request (Schäfer et al., 2014).
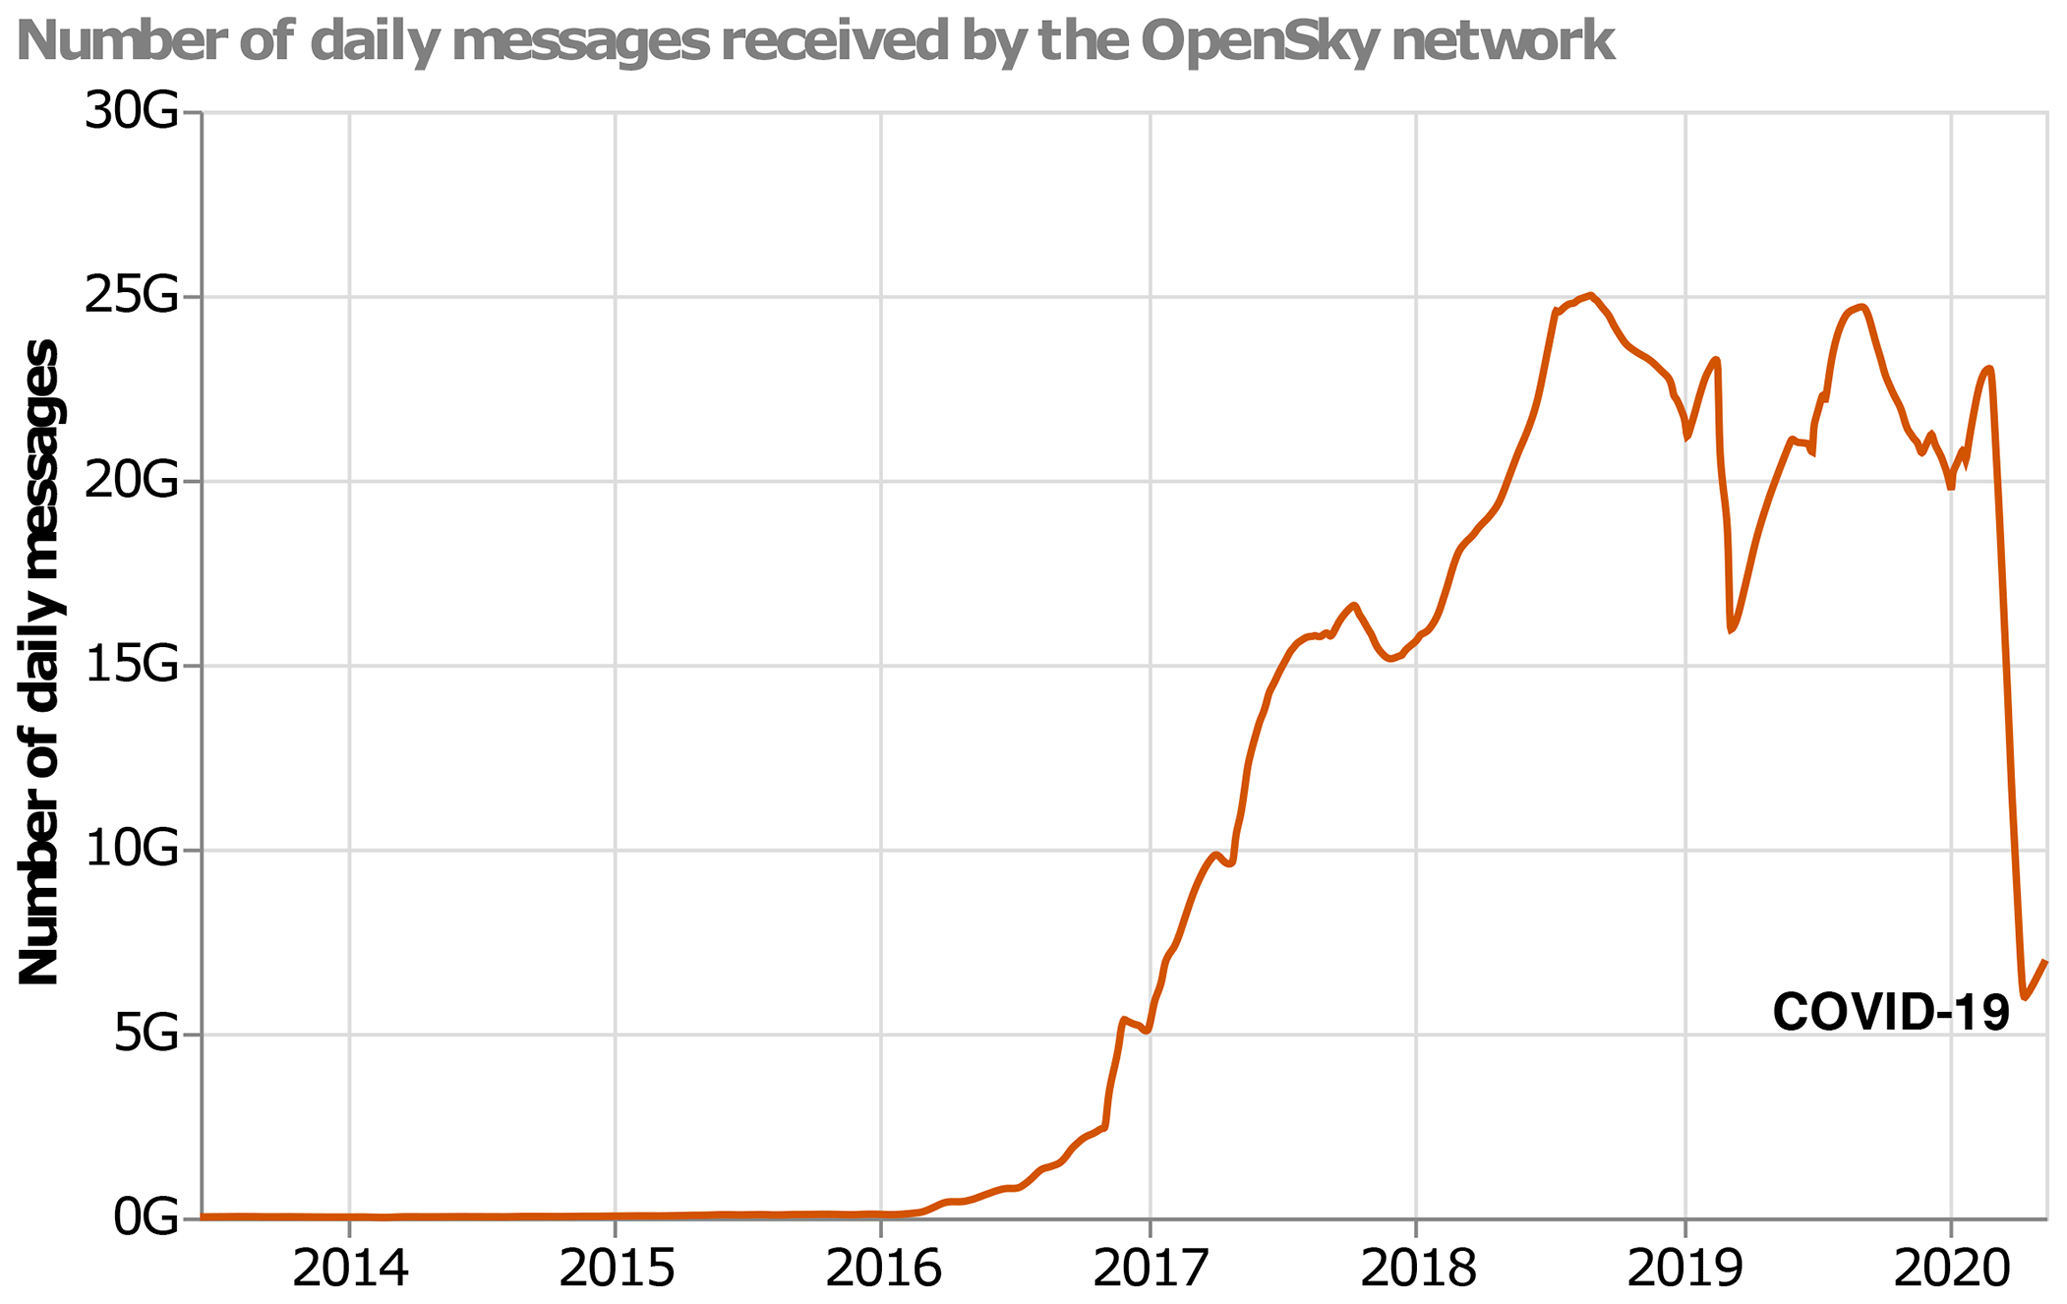
Along with the global sensor coverage, the database has initially grown exponentially since its inception in 2014 (see Fig. 1) and currently comprises over 24 trillion messages, taking up around 2 PB. In peak pre-pandemic times, almost 100 000 flights were tracked per day. The raw data available in the Impala database have been used in more than 150 academic publications as of 2020 (Strohmeier, 2020). However, despite available application programming interfaces and third-party tools, access to these data requires significant investment of time and resources to understand the availability and underlying structure of the database. With this dataset and its accompanying descriptor, we want to address this accessibility issue and make a relevant part of the OpenSky Network flight metadata accessible to all researchers.
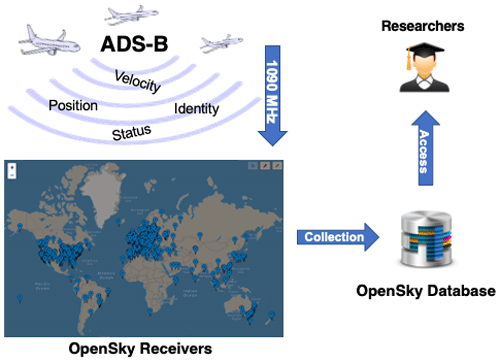
Figure 2High-level illustration of the flight data crowdsourcing process, including map of active receivers on 1 July 2020. © OpenStreetMap contributors 2020. Distributed under the Creative Commons BY-SA License.
3.1 Crowdsourced collection
The raw data used to generate the dataset were recorded by more than 3000 crowdsourced sensors of the OpenSky Network. The network records the payloads of all 1090 MHz secondary surveillance radar downlink transmissions of aircraft along with the timestamps and signal strength indicators provided by each sensor on signal reception. Part of this data collection comprises the exact aircraft locations broadcast at 2 Hz by transponders using the ADS-B technology.
As the data come from a crowdsourced system of receivers, their collection faces numerous challenges and difficulties found in such an organically grown, non-controlled set of receivers. However, it is the only feasible option for the large-scale collection of open research data as collecting data from a synchronized and controlled deployment would be less flexible and less widely applicable, in particular for a non-profit research endeavour. Conversely, due to the high sensor density and high level of redundancy in the OpenSky Network, many well-covered regions of these data achieve the quality of controlled deployments on a nationwide level.
The true coverage of the network, i.e. actually received positions of aeroplanes, is illustrated in Fig. 3, both for 1 January 2019 and during the pandemic on 1 May 2020. Historic coverage for any given day is visible at https://opensky-network.org/network/facts (last access: 9 February 2021). We compare this growing coverage to global commercial flight tracking website Flightradar24, which tracked 68 948 849 total flights in 2019.1 Unfortunately, this number is not broken down into how many of these flights were tracked via ADS-B technology (versus other methods such as multilateration or non-crowdsourced approaches including the use of satellites and primary radar), which would make it possible to directly compare it with our dataset. Still, with 30 989 481 flights recorded by OpenSky for 2019, this means our dataset covers about 45 % of all global flights. Intuitively this number will be significantly higher in the well-covered areas (see Fig. 3).

Figure 3Coverage of OpenSky on 1 January 2019 (top) and 1 May 2020 (bottom). © Google Maps.
3.2 Derivation of flights
We define a flight for the purpose of this dataset as the continuous time between the first received ADS-B contact of one specific aircraft and the last. Such a flight's length must be at least 15 min. This filter avoids noise from misconfigured transponders and real aircraft seen for only a very short time, which are generally not of significant value for the dataset.
If an aircraft leaves OpenSky's coverage range for more than a threshold T=10 min, this flight's track is considered finished at the point of last contact. We further want to avoid creating a new flight record in case an aircraft simply leaves the coverage and returns after some time larger than T (e.g. for any flight over the Atlantic Ocean) without actually having landed. We thus apply a simple check: if time, distance and reported velocity fit with a constant extrapolation based on the last-known values (minus a small threshold of 0.5∘ longitude and/or latitude), they will be considered segments of the same flight. If not, it is assumed that the aircraft has landed at some point outside OpenSky's coverage and a separate flight is recorded.
The destination airport candidates are received from these identified flight trajectories as follows. If the last position seen is above 2500 m, no candidate is defined and the value is set to “NULL”. Otherwise, the descending trajectory is extrapolated towards the ground and the Cartesian distance to the closest airports is computed. If there is no airport within 10 km, the value is set to NULL. Otherwise, the closest identified airport is listed as the destination airport. The procedure applies in reverse for the origin airport candidates.
We note that this approach is necessarily an extrapolation and airports may in some cases be wrongly identified if the contact is lost before the ground, in particular where several airports are close by.
3.3 Data cleaning
To make the data accessible and meet requirements, complex pre-processing is needed in order to reduce the reduce the data volume and eliminate the need to understand all system aspects in order to use the data. Moreover, the information quality needs to be assessed and indicated, allowing researchers to choose subsets that match their own requirements. Therefore, we performed the following processing steps to prepare the unstructured OpenSky Network data and create a well-defined dataset for scientific analysis.
3.3.1 Decoding
Decoding ADS-B correctly is a complex task. Although libraries and tutorials such as that of Sun et al. (2019) exist, it remains a tedious task that requires a deep understanding of the underlying link layer technology Mode S. Moreover, the sheer volume of data collected by OpenSky (about 120 GB of raw data per hour) makes this process challenging and resource-intensive. Therefore, we relieve researchers from this burden by providing readily decoded information such as position in WGS84 coordinates, altitude information in metres and the unique aircraft identifier as a 24 bit hexadecimal number.
3.3.2 Timestamps
Timestamps are provided in different resolutions and units, depending on the receiving sensor type. For the purposes of this dataset, we use the time when the messages where received at the server, with 1 s precision, which we deem more than sufficient for the macro use cases intended. Where a single message is received by multiple receivers, the first timestamp is used.
3.3.3 Deduplication
OpenSky's raw data are merely a long list of single measurements by single sensors. However, as most localization algorithms rely on signals being received by multiple receivers, we grouped multiple receptions belonging to the same transmission based on their continuous timestamp and signal payload. This process is called deduplication. Note that although most position reports are unique, a small number of falsely grouped measurements remain as noise in the data.
3.3.4 Quality assurance
Crowdsourcing creates potential issues regarding the quality and integrity of location and timing information of certain aircraft and sensors. Such issues can range from faults in the transmission chain (i.e. aircraft transponder, ground station) to malicious injection of falsified aircraft data. To allow researchers to ignore these effects while still preserving them as a potential subject of research, OpenSky offers integrity checks to verify and judge the data correctness (see Schäfer et al., 2018). We also note that the abstracted nature of this dataset makes it more robust to any issues in the first place as low-quality data will be averaged out over time by the many involved receivers.
3.4 Data enrichment
We use the OpenSky aircraft database to add aircraft types to our flight data and access publicly available open application programming interfaces (APIs) to match the commercial flight identifier, where available.
The integration of aircraft types enables additional analysis such as gauging the popularity of different types and manufacturers across time, regions and use cases. Aircraft type designators follow the International Civil Aviation Organization (ICAO) convention (International Civil Aviation Union, 2020).
The OpenSky aircraft database was created in 2017 as an additional crowdsourcing project. It joins different data sources, both official and unofficial ones. The official sources include the registration information from the flight authorities in the USA, UK, Ireland and Switzerland, which is downloaded and incorporated daily. Besides these, it relies on enthusiast knowledge based on live observations and third-party sources. These are integrated opportunistically; the database is editable by any registered user of the OpenSky Network. The enriched metadata reflect the state of the database at the time of creation; regular updates of the full aircraft database are made available at https://opensky-network.org/datasets/metadata/ (last access: 9 February 2021).
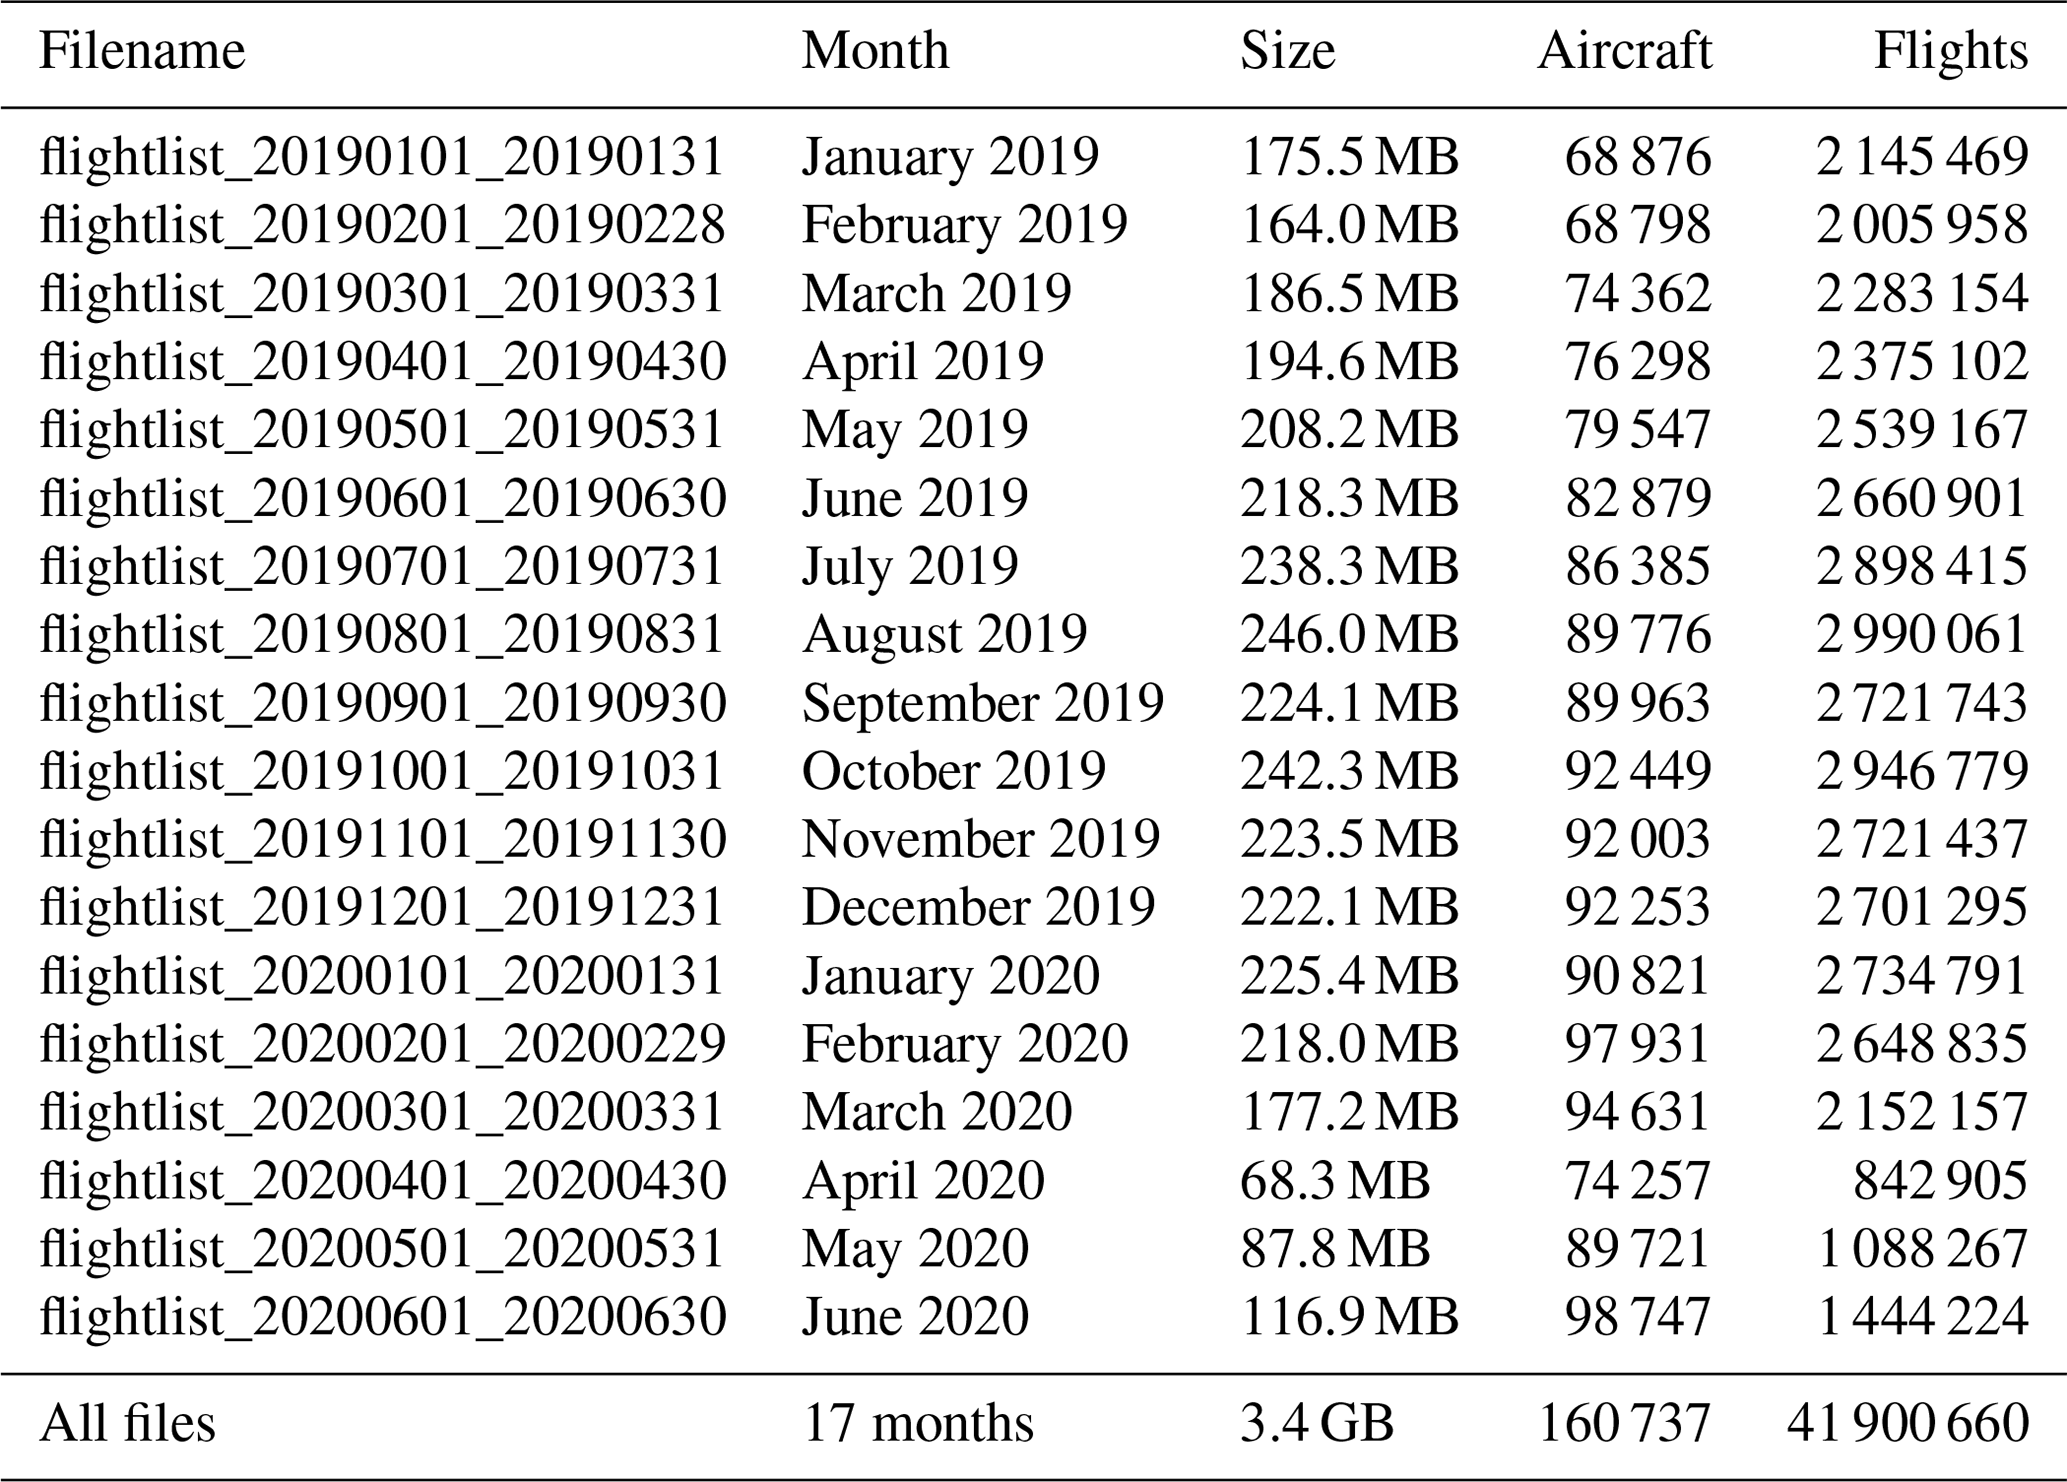
Overall, the archive includes 41 900 660 flights, from 160 737 aircraft, which were seen to frequent 13 934 airports in 127 countries. One file per month is provided in comma-separated values (CSV) format. Table 1 provides a breakdown of the included CSV files and their contents, broken down into size, number of flights, number of unique aircraft, unique origins and destinations. Note the significant reduction in size and flights since the beginning of pandemic measures in March 2020.
We describe the columns of the dataset in the following:
-
callsign. The identifier of the flight used for display on the radar screens of air traffic controllers or voice communication. For commercial flights, the first three letters are typically reserved for an airline, e.g. AFR for Air France or DLH for Lufthansa. This is then typically followed by four digits. For non-airline flights this can often be chosen freely or depending on the customs of the airspace of a country. It is broadcast by the aeroplane itself. For anonymity reasons, the callsign is only provided for verified commercial airline flights.
-
number. The commercial number of the flight if available through OpenSky. These flight numbers are typically used by the airlines for booking references or departure boards at airports.
-
aircraft_uid. A unique aircraft identification number randomly generated based on the transponder identification number that is globally unique and specific to an aircraft (rather than a flight). Changes occur only if an aircraft changes ownership, with exceptions for military aircraft, which may in some countries be able to have their identifier changed arbitrarily.
-
typecode. This is the aircraft model type if available through the aircraft database.
-
origin. This is a four-letter code for the origin airport of the flight if the trajectory was able to be matched successfully.
-
destination. This is a four-letter code for the destination airport of the flight if the trajectory was able to be matched successfully.
-
firstseen. This is the UTC timestamp of the first airborne message received by the OpenSky Network.
-
lastseen. This is the UTC timestamp of the last airborne message received by the OpenSky Network.
-
day. This is the UTC day of the last airborne message received by the OpenSky Network.
-
latitude_1, longitude_1, altitude_1. This is the position of the aircraft at the firstseen timestamps. The altitude is a barometric measurement based on a standard pressure of 1013 HPa.
-
latitude_2, longitude_2, altitude_2. This is the position of the aircraft at the lastseen timestamps. The altitude is a barometric measurement based on a standard pressure of 1013 HPa.
In the following, we provide some statistics showing that our flights dataset reflects the air traffic reality as different time series showing the effect of the COVID-19 pandemic at different airports and for different airlines.
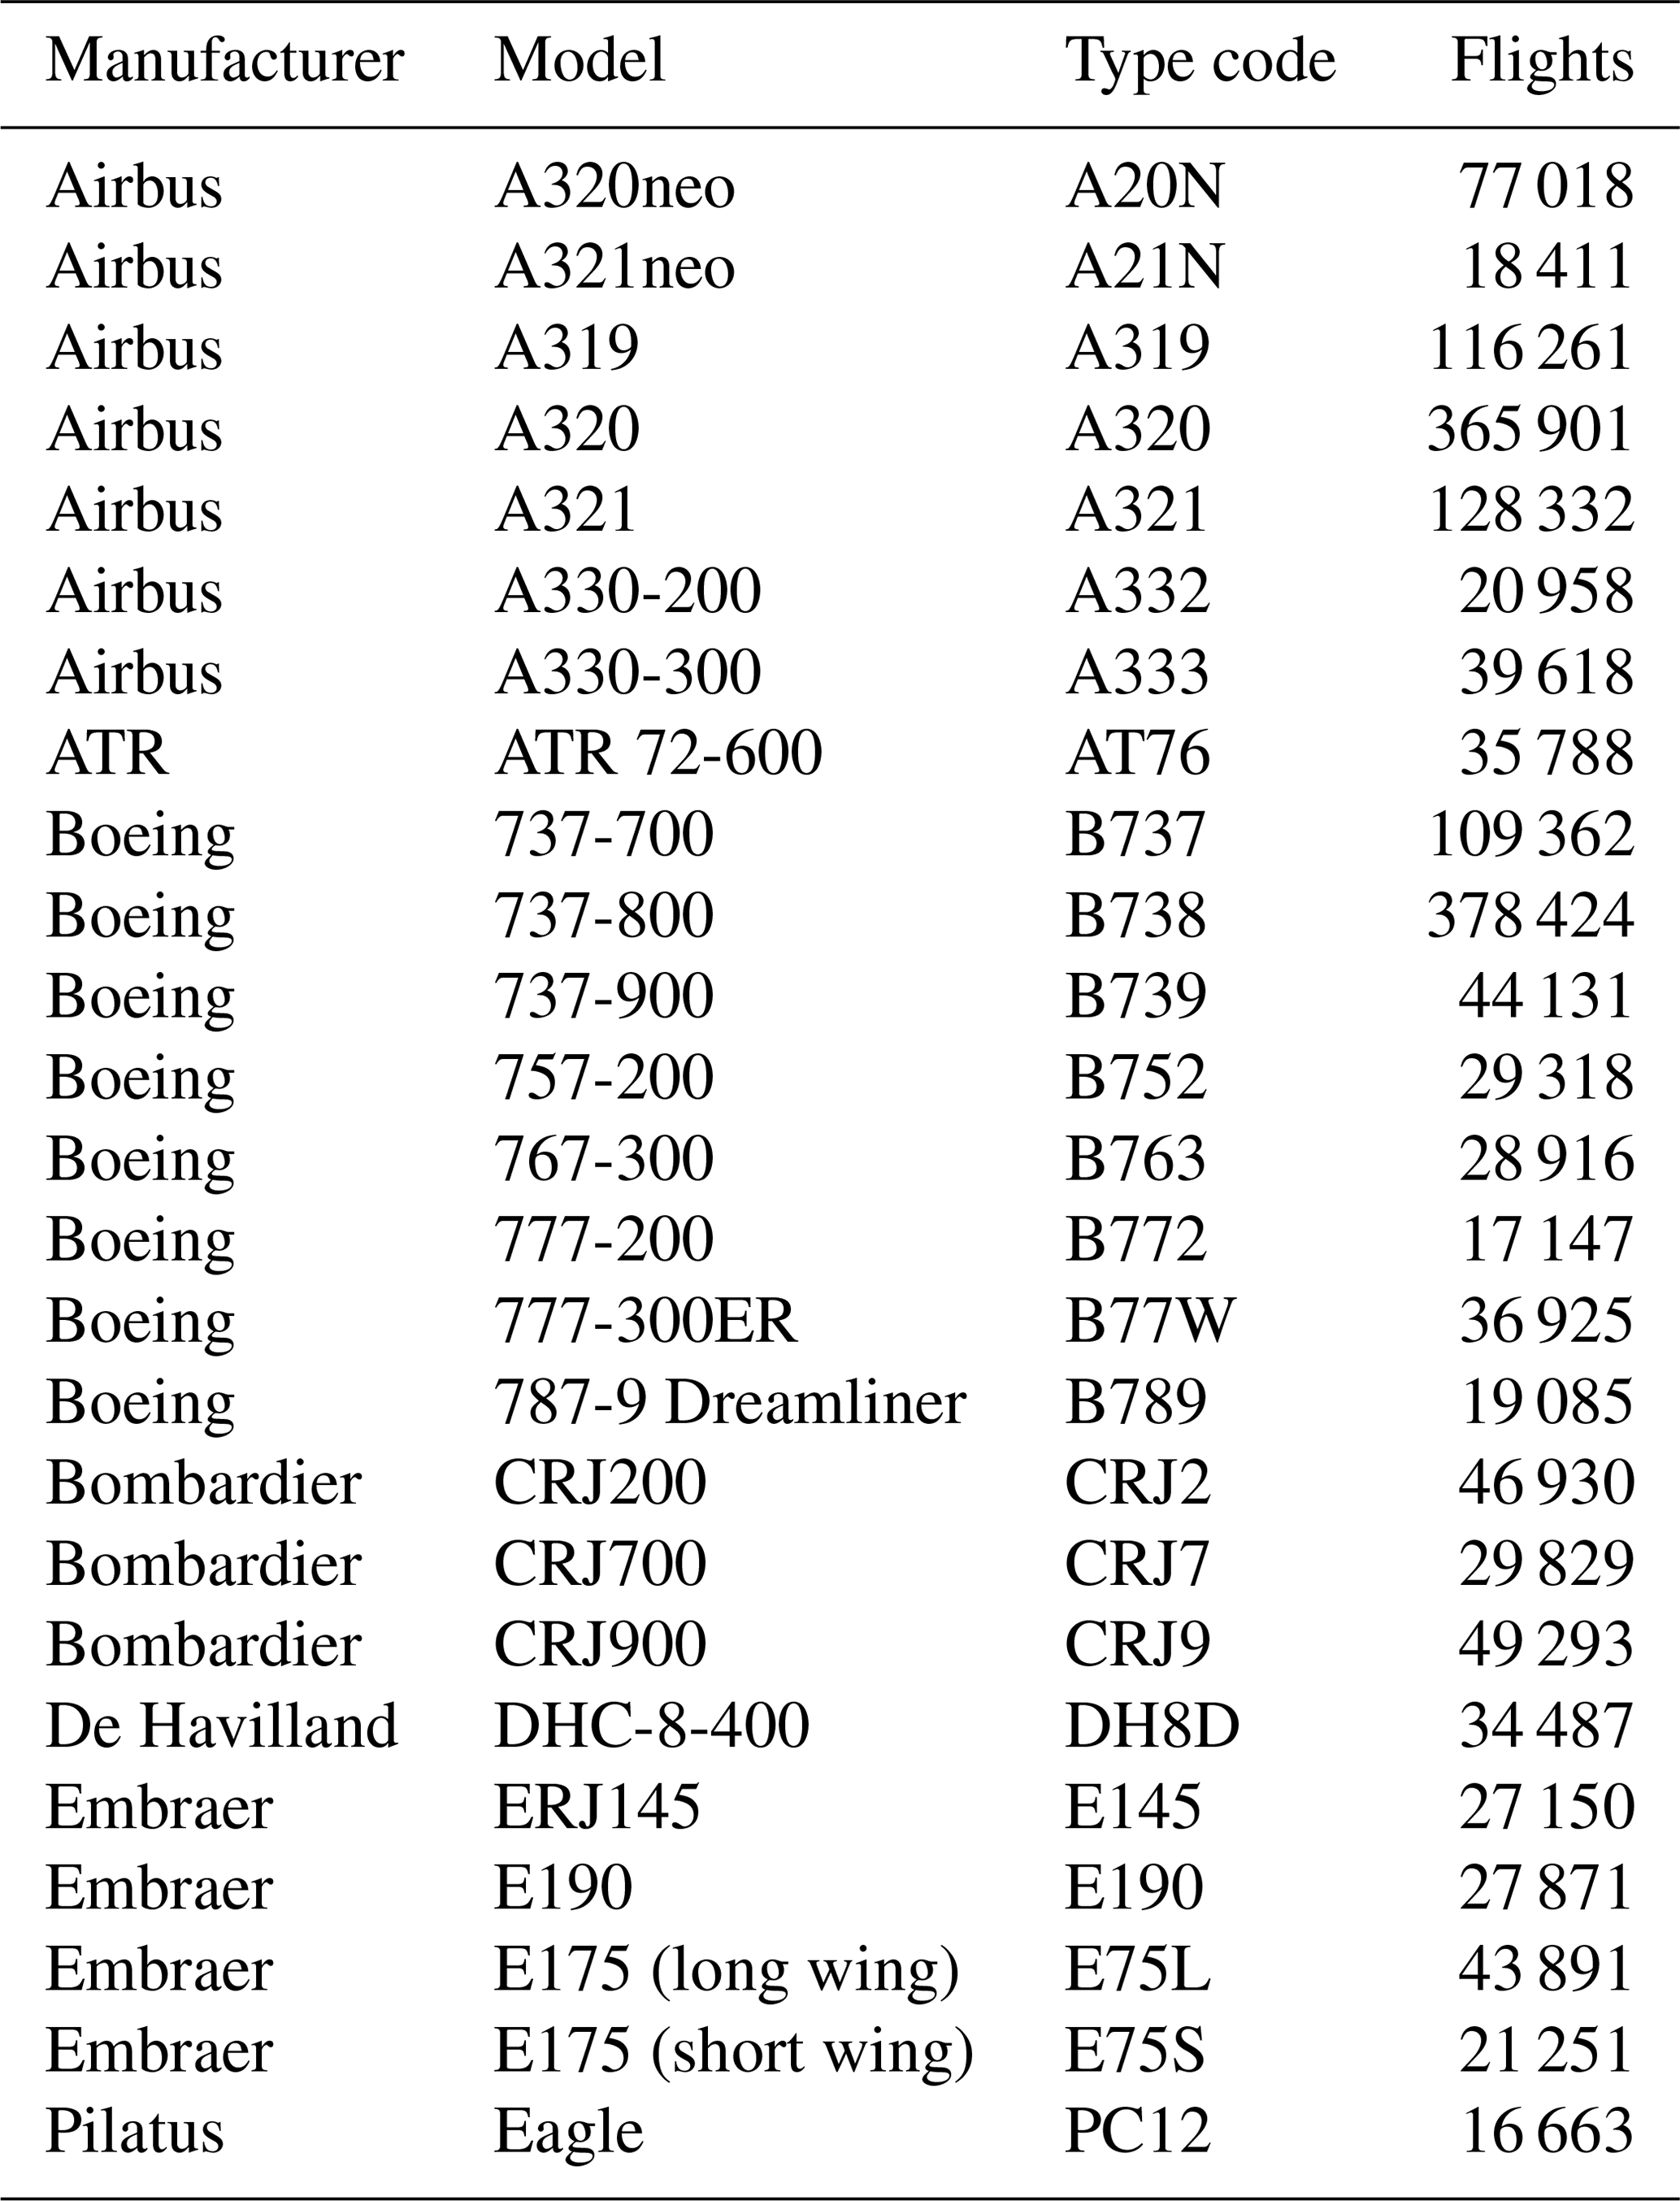
Table 3Top 20 airports based on recorded flight destinations in January 2020.
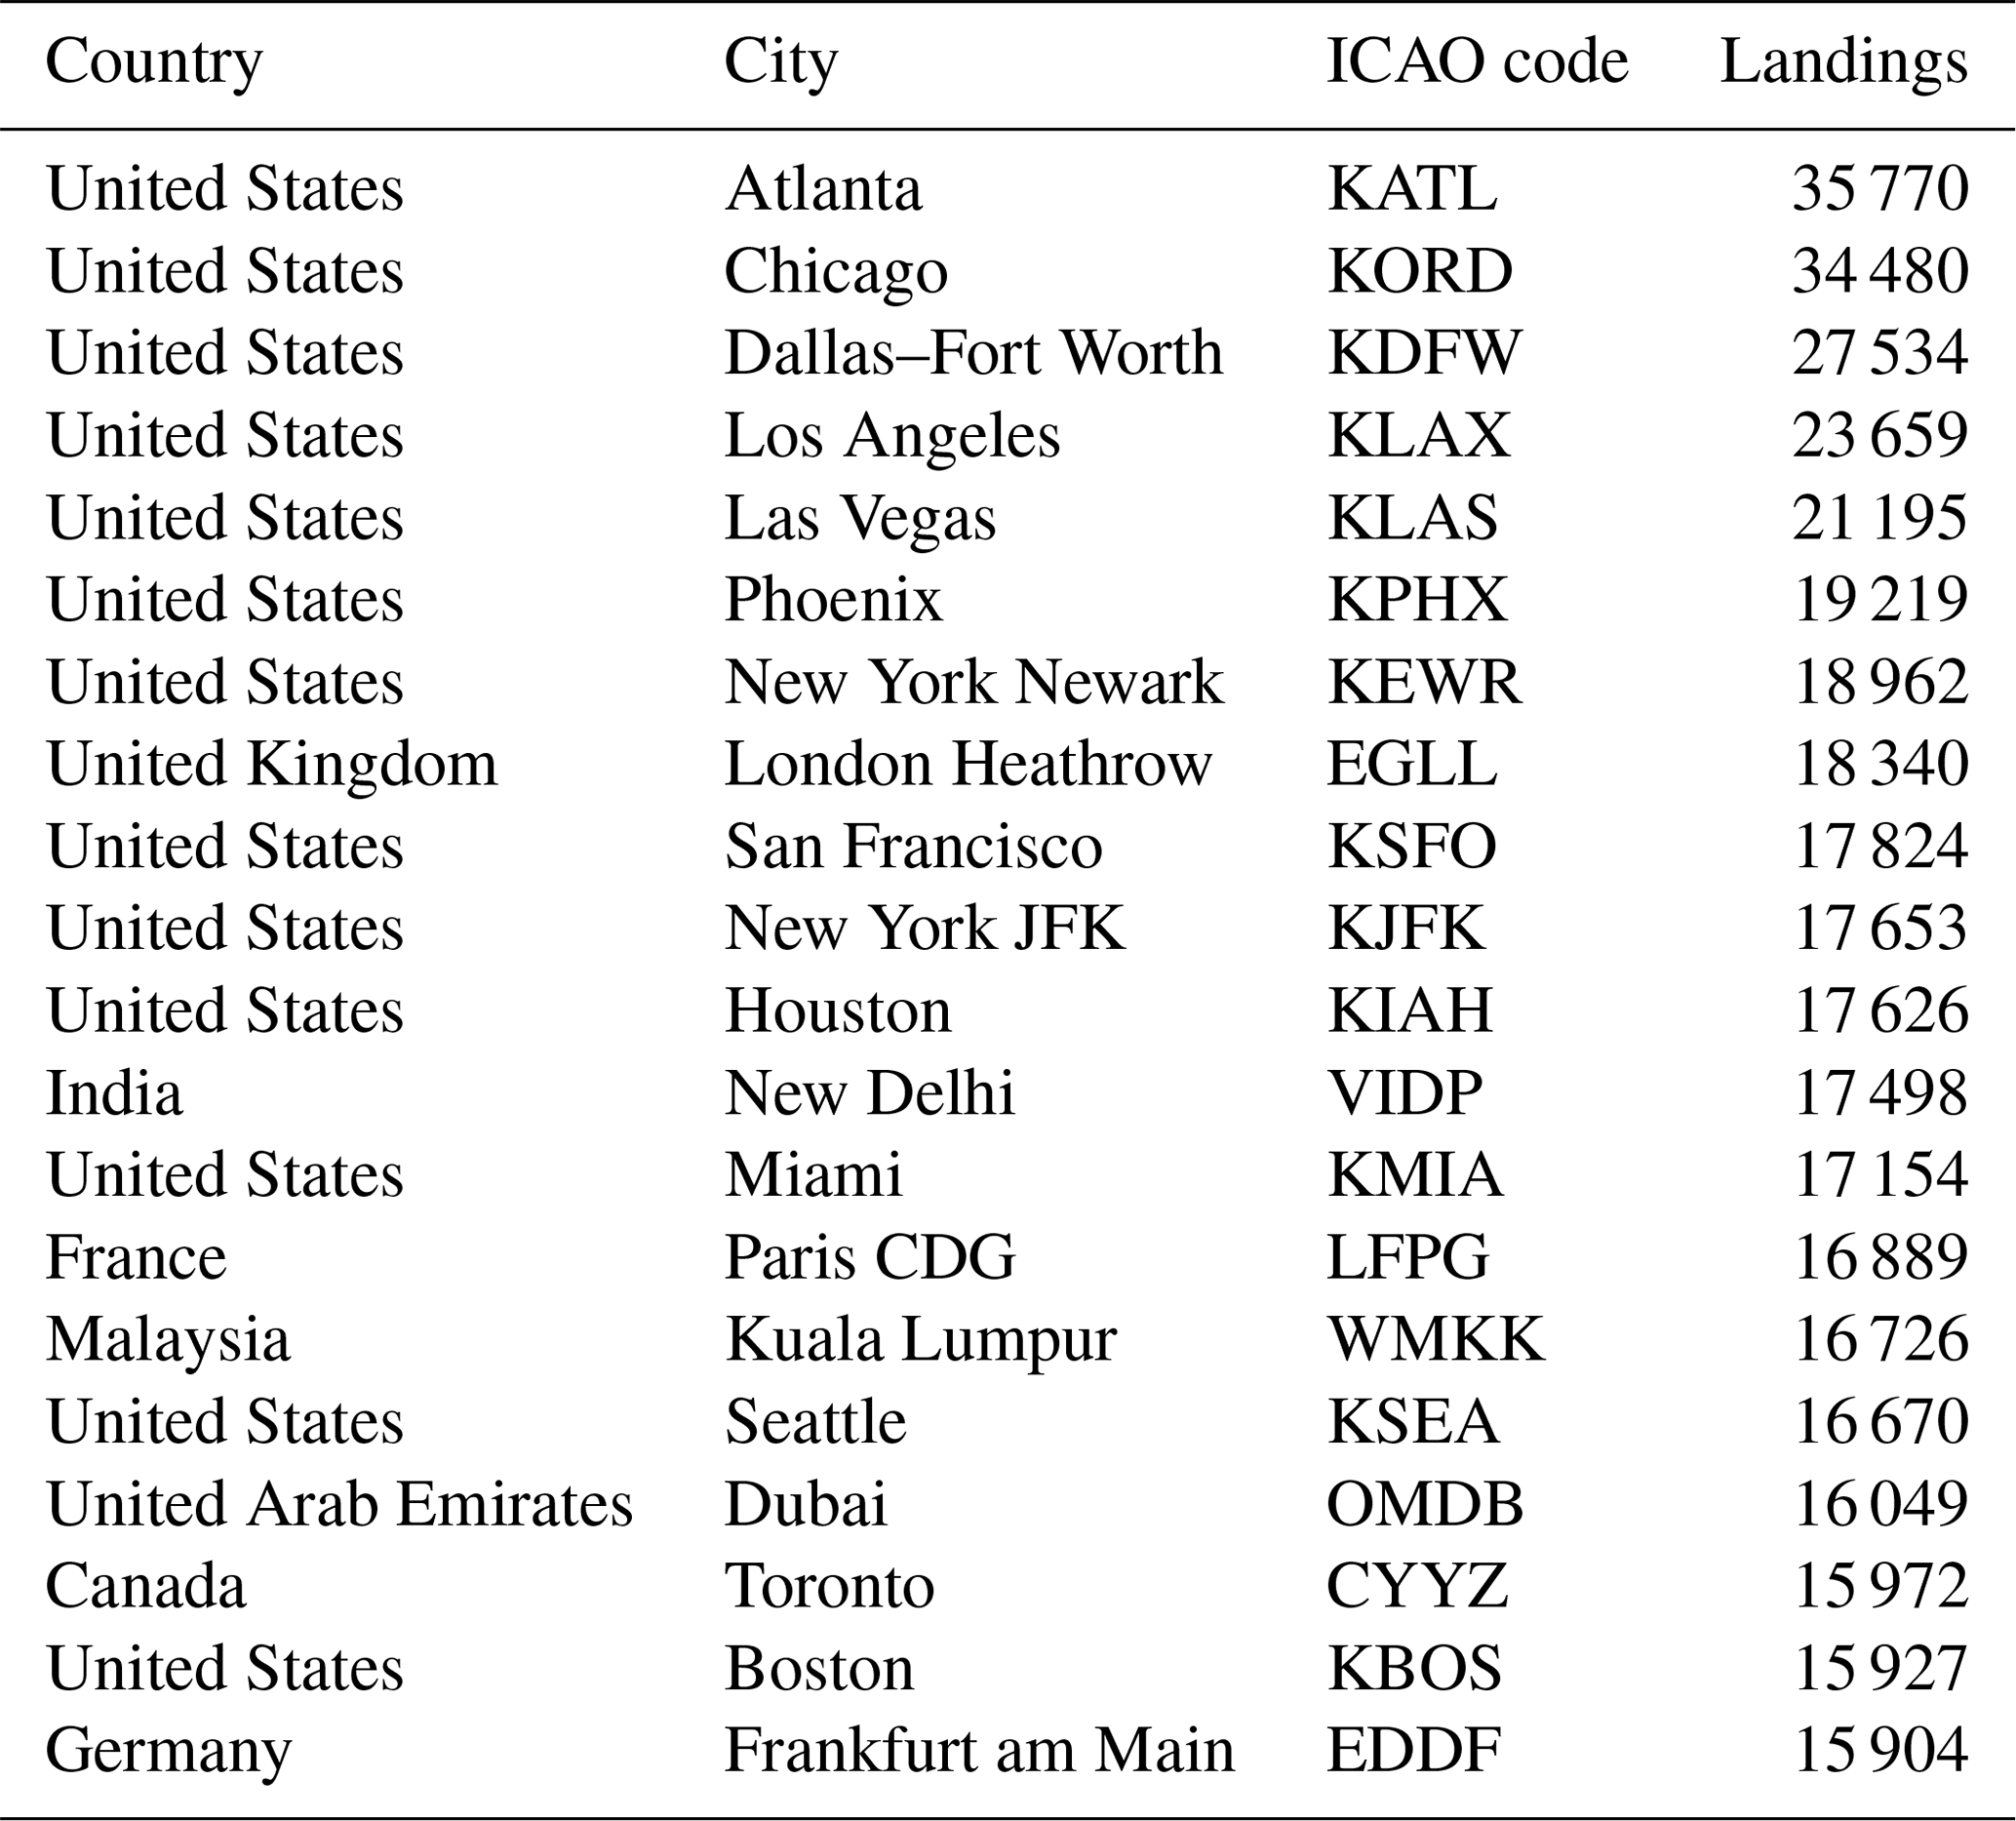
Table 2 shows the distribution of the top 25 aircraft types in the flight dataset over 1 month (January 2020). Overall, the top models are dominated by the four largest commercial aircraft manufacturers: Boeing with eight different types accounting for 663 308 flights, Airbus with seven models and 766 499 flights, Embraer with four models (120 163 flights), and Bombardier (three models, 126 052 flights). The 737-800 is the single most popular aircraft with 378 424 flights in January 2020 alone.
Table 3 shows the distribution of the top 20 airport types in the flight dataset in January 2020 (based on recorded flight destinations). Reflecting both global air traffic realities and OpenSky's coverage focus, 13 of these airports are in the United States, including the 7 busiest with regards to landings. Several of the major hubs in Europe (Frankfurt, London Heathrow, Paris Charles de Gaulle) and Asia (Kuala Lumpur, Dubai and Delhi) as well as Toronto in Canada make up the remaining 7.

Figure 4Comparison of flight numbers at various airports as seen by the OpenSky Network during 2020.
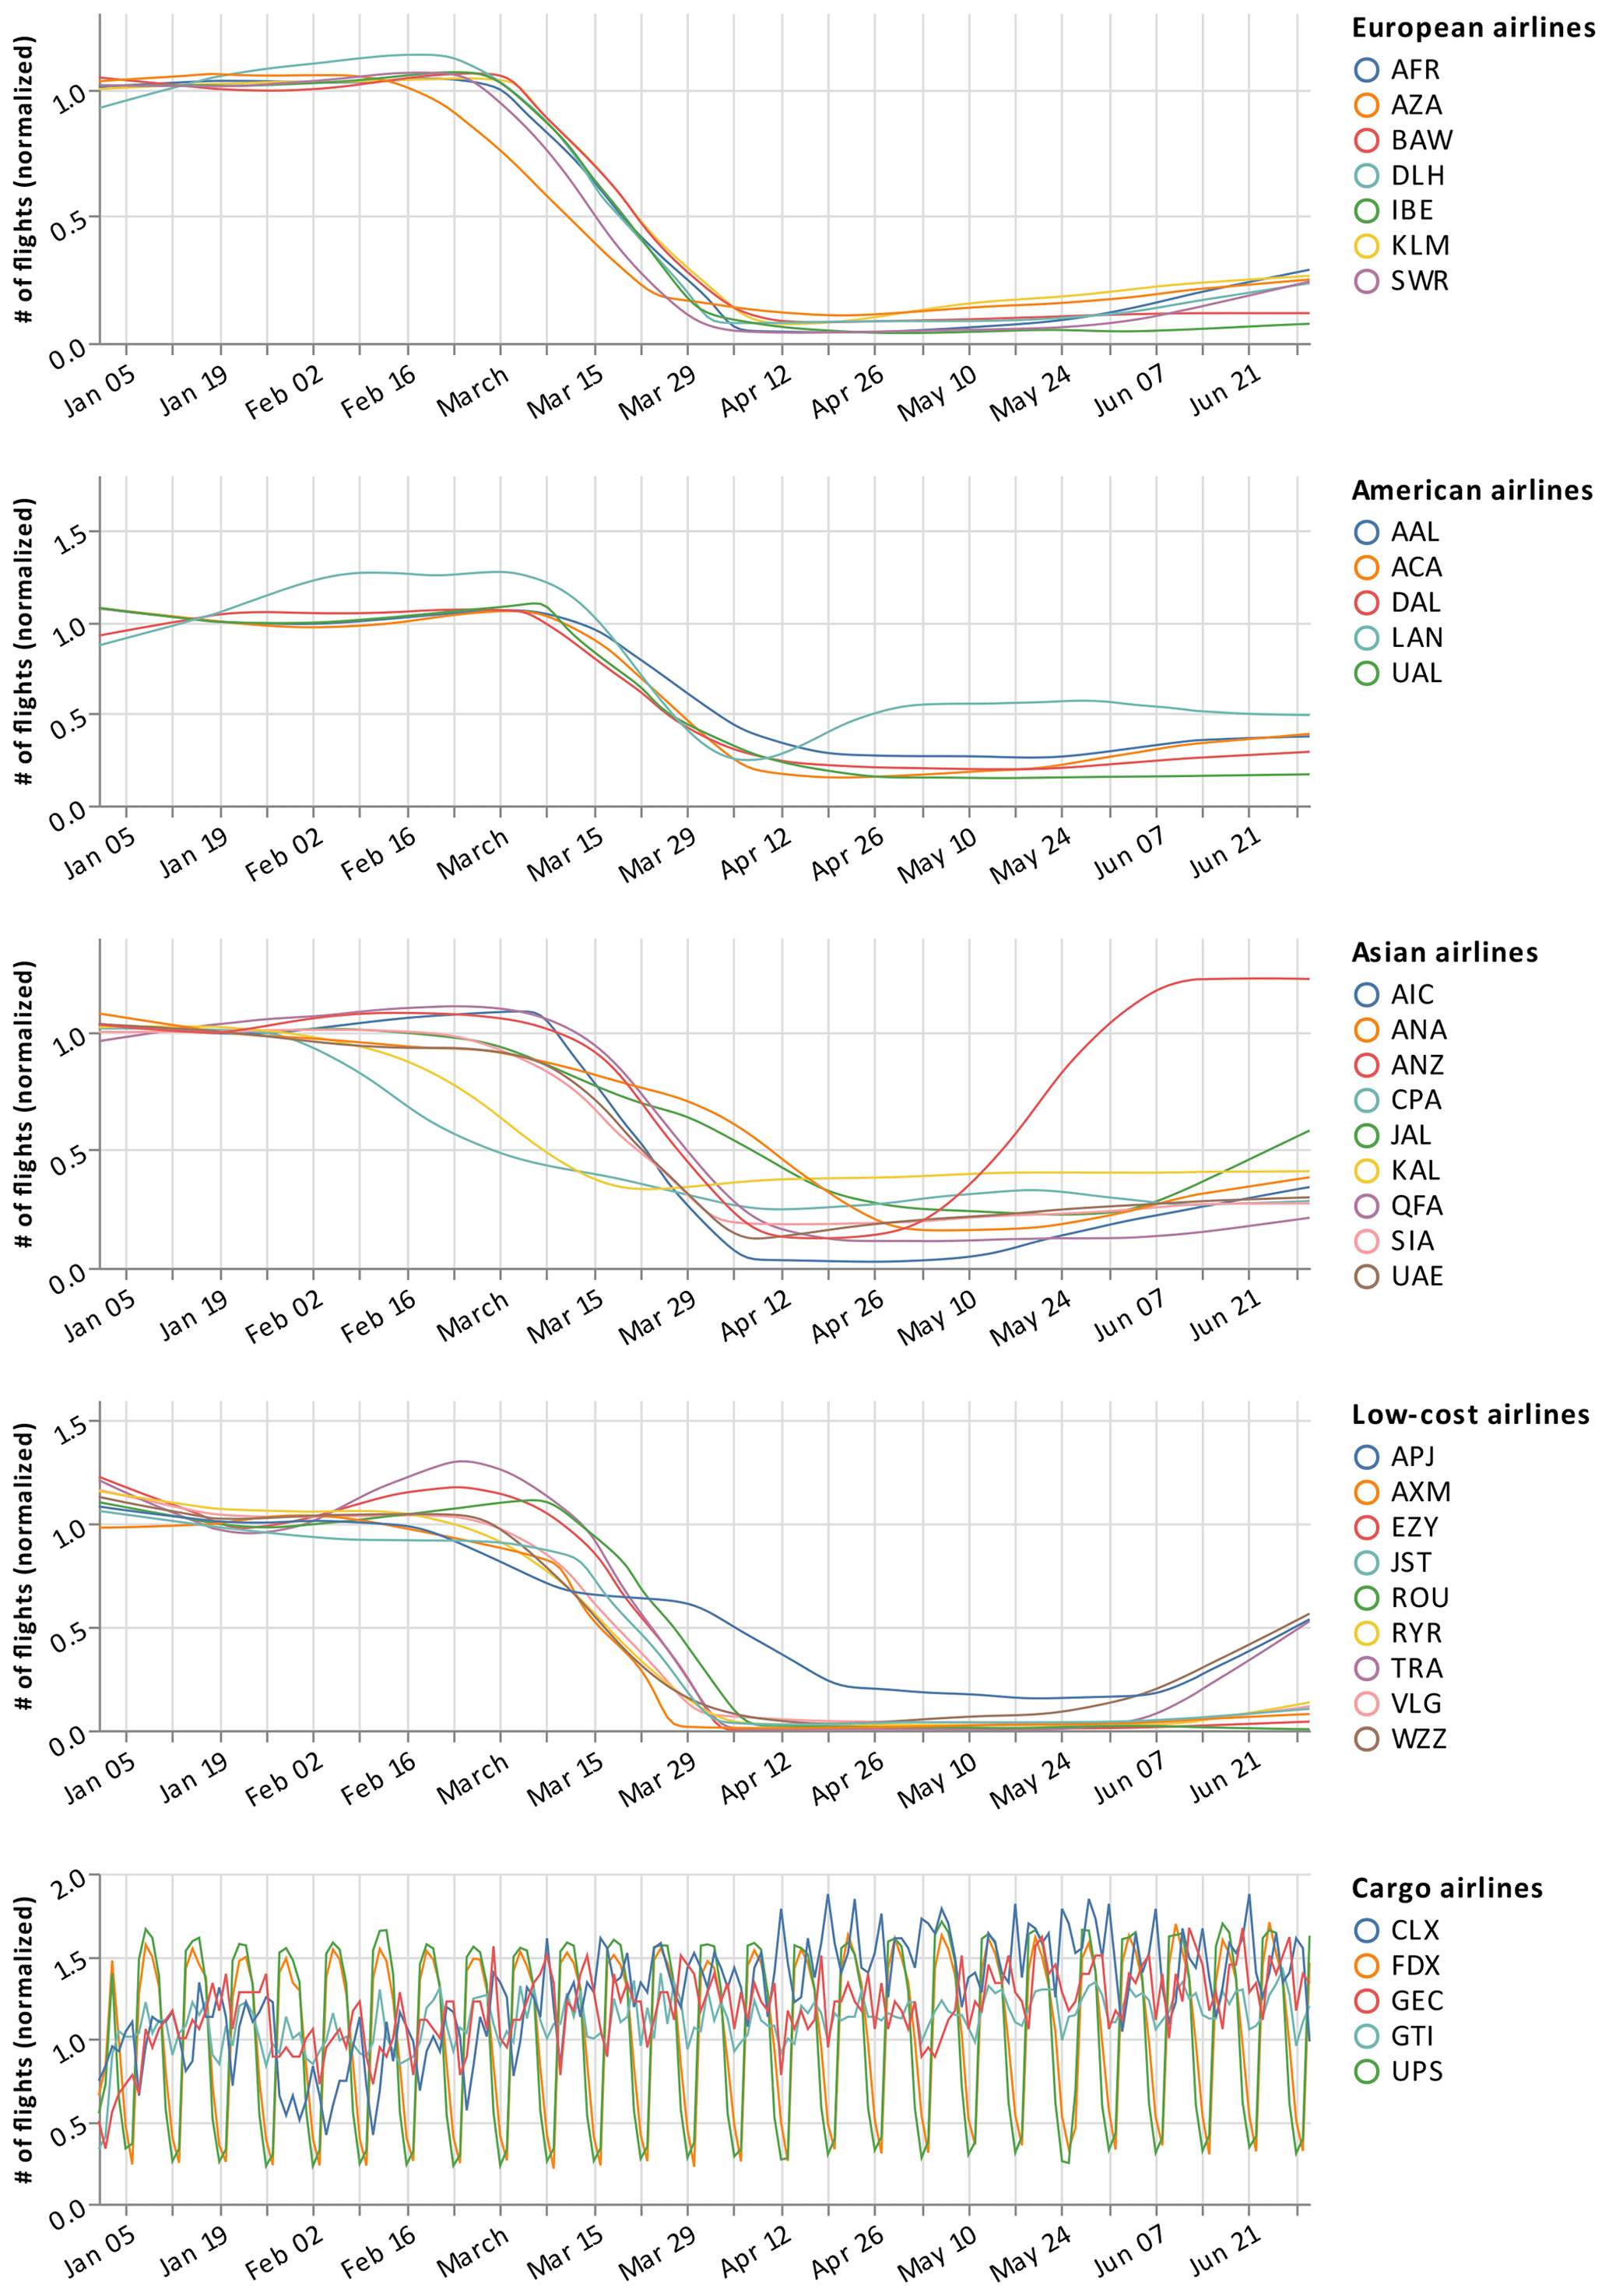
Figure 5Comparison of flight numbers of various airlines as seen by the OpenSky Network during 2020. Flights are grouped by geographic regions for legacy carriers. Cargo and low-cost airlines are shown separately.
Figure 4 shows a time series of airport activity (as measured by departures) in four different regions based on data from 1 January to 30 April 2020. The impact of the pandemic (or rather the measures to contain it) can be seen clearly in all four. For example, the data show the following:
-
a slow decrease from February in several East Asian airports (even earlier in Hong Kong),
-
European airports decreasing sharply from early March onward,
-
America's air traffic dropping later by about 2 weeks,
-
India stopping all air traffic sharply by mid-March (VABB, VIDP).
In a similar fashion, Fig. 5 shows COVID-19's normalized impact on different airlines across the globe. Among noticeable trends, we can identify the following:
-
sharply decreasing patterns for all regular airlines in March, with stronger effects for European airlines compared to American and Asian airlines;
-
most low-cost airlines practically stopping all business activities (with the exception of the Japanese Peach airline);
-
a very slow recovery for most airlines and regions beginning in May and June, with some rebounding more strongly, for example Air New Zealand (ANZ);
-
cargo airlines showing no negative impact of the crisis and some possibly even finding a slight upward trend.
This dataset may differ from other data sources due to limitations of ADS-B data. On the other hand, there are advantages as it reflects all aircraft types rather than only commercial airlines.
It is important to note that ADS-B equipage has been increasing over time as existing aircraft have been retrofitted and older aircraft have been replaced. This effectively means that the number of tracked aircraft in the dataset had been slowly increasing pre-pandemic, reflecting the reality of a dynamic global aviation industry.
Further, there are differences in ADS-B equipage across countries' airspaces (depending on their regulatory approach) as well as potentially between aircraft types. For example, small personal aircraft flying locally and below 18 000 feet (5486.4 m) are often not required to use ADS-B. Similarly, military aircraft may have exceptions for operational reasons. It is not possible to track and reflect these highly dynamic developments in a static dataset; however, this should be kept in mind for comparative analysis purposes.
Finally, as a recommendation for data handling and visualization, Figs. 4 and 5 have been created with the open-source Python package traffic (Olive, 2019), which offers dedicated methods for air traffic data and interfaces with OpenSky and other data sources. Further usage notes and tool recommendations are regularly added on the OpenSky website (https://opensky-network.org/community/blog/item/6-opensky-covid-19-flight-dataset, last access: 9 February 2021).
The dataset is available under the CC-BY License at Zenodo (see Olive et al., 2020; https://doi.org/10.5281/zenodo.3931948, last access: 9 February 2021).
The code to generate and process the data is available in different components. The popular dump1090 package, used as the basis to receive a large majority of crowdsourced information (ca. 80 % in OpenSky), is available in Foster (2017). Other receiver software may include proprietary and closed-source software such as Radarcape and SBS-3.
The OpenSky decoder is available in OpenSky's GitHub repository at https://github.com/openskynetwork/java-adsb (Fuchs and Schäfer, 2020, last access: 9 February 2021).
Code concerning data cleaning and processing is documented at https://traffic-viz.github.io/scenarios/covid19.html (Olive, 2021, last access: 9 February 2021).
Air traffic and flight data are needed for effective research in many areas of Earth systems science and related fields. We presented an openly accessible, specifically crafted dataset based on crowdsourced data obtained through the OpenSky Network and validated it successfully. From January 2019 to July 2020, the archive includes 41 900 660 flights, from 160 737 aircraft, which were seen to frequent 13 934 airports in 127 countries. As it is updated monthly, this dataset will be growing significantly and will provide deeper insights into flight behaviour before, during and after the COVID-19 pandemic.
MaSt contributed through manuscript writing and data collection; XO contributed through data preparation, data cleaning and data visualization; JL contributed through route data collection; MS and VL contributed through creating and maintaining OpenSky Network infrastructure. All authors contributed through manuscript review.
The authors declare that they have no conflict of interest.
We are thankful to all members and supporters of the OpenSky Network foundation for making this data collection effort possible.
This paper was edited by David Carlson and reviewed by Simon Proud and one anonymous referee.
Bank of England, Monetary Policy Committee: Monetary Policy Report, Tech. Rep., available at: https://www.bankofengland.co.uk/-/media/boe/files/monetary-policy-report/2020/may/monetary-policy-report-may-2020.pdf (last access: 9 February 2021), 2020. a
Bogoch, I. I., Watts, A., Thomas-Bachli, A., Huber, C., Kraemer, M. U., and Khan, K.: Potential for global spread of a novel coronavirus from China, J. Trav. Med., 27, taaa011, https://doi.org/10.1093/jtm/taaa011, 2020. a
Foster, N.: gr-air-modes, available at: https://github.com/antirez/dump1090, last access: 1 June 2020, 2017. a
Fuchs, M. and Schäfer, M.: Mode S and ADS-B decoding library for Java, GitHub repository, available at: https://github.com/openskynetwork/java-adsb (last access: 9 February 2021), 2020. a
International Civil Aviation Union: DOC 8643: Aircraft Type Designators, available at: https://www.icao.int/publications/DOC8643/Pages/default.aspx (last access: 9 February 2021), 2020. a
International Monetary Fund: Ensuring Continuity in the Production of External Sector Statistics During the COVID-19 Lockdown, Special Series on Statistical Issues to Respond to COVID-19, available at: https://www.imf.org/~/media/Files/Publications/covid19-special-notes/en-special-series-on-covid-19-ensuring-continuity-in-the-production-of-external-sector-statistics.ashx?la=en (last access: 9 February 2021), 2020. a
Lecocq, T., Hicks, S. P., Van Noten, K., van Wijk, K., Koelemeijer, P., De Plaen, R. S., Massin, F., Hillers, G., Anthony, R. E., Apoloner, M.-T., et al.: Global quieting of high-frequency seismic noise due to COVID-19 pandemic lockdown measures, Science, 369, 1338–1343, https://doi.org/10.1126/science.abd2438, 2020. a
Mao, L., Wu, X., Huang, Z., and Tatem, A. J.: Modeling monthly flows of global air travel passengers: An open-access data resource, J. Trans. Geogr., 48, 52–60, 2015. a
Miller, S., Moat, H. S., and Preis, T.: Using aircraft location data to estimate current economic activity, Sci. Rep., 10, 1–7, 2020. a
Olive, X.: traffic, a toolbox for processing and analysing air traffic data, Journal of Open Source Software, 4, https://doi.org/10.21105/joss.01518, available at: https://www.theoj.org/joss-papers/joss.01518/10.21105.joss.01518.pdf (last access: 9 February 2021), 2019. a
Olive, X.: Impact of COVID-19 on worldwide aviation, [Online], available at: https://traffic-viz.github.io/scenarios/covid19.html, last access: 9 February 2021. a
Olive, X., Strohmeier, M., and Lübbe, J.: Crowdsourced air traffic data from The OpenSky Network [CC-BY], Zenodo, https://doi.org/10.5281/zenodo.3931948, 2020. a, b
Pande, V.: Folding@home, available at: https://foldingathome.org (last access: 9 February 2021), 2019. a
Schäfer, M., Strohmeier, M., Lenders, V., Martinovic, I., and Wilhelm, M.: Bringing up OpenSky: A large-scale ADS-B sensor network for research, in: Proceedings of the 13th international symposium on Information processing in sensor networks, IEEE Press, 83–94, 2014. a, b, c
Schäfer, M., Strohmeier, M., Smith, M., Fuchs, M., Pinheiro, R., Lenders, V., and Martinovic, I.: OpenSky report 2016: Facts and figures on SSR mode S and ADS-B usage, in: 2016 IEEE/AIAA 35th Digital Avionics Systems Conference (DASC), IEEE, 1–9, 2016. a
Schäfer, M., Strohmeier, M., Smith, M., Fuchs, M., Lenders, V., and Martinovic, I.: OpenSky report 2018: assessing the integrity of crowdsourced mode S and ADS-B data, in: 2018 IEEE/AIAA 37th Digital Avionics Systems Conference (DASC), IEEE, 1–9, 2018. a
Strohmeier, M.: Research Usage and Social Impact of Crowdsourced Air Traffic Data, in: 8th OpenSky Symposium 2020, Vol. 59, p. 1, 2020. a
Sun, J., Vû, H., Ellerbroek, J., and Hoekstra, J. M.: pyModeS: Decoding Mode-S Surveillance Data for Open Air Transportation Research, IEEE Transactions on Intelligent Transportation Systems, 2777–2786, 2019. a
Tengzelius, U. and Abom, M.: Aircraft pass-by noise on ground modelled with the SAFT-program, in: Inter.Noise 2019, 2019. a
UC Berkley: SETI@home, available at: https://setiathome.berkeley.edu/ (last access: 9 February 2021), 2019. a
United Nations Department of Economic and Social Affairs: Using experimental statistics to monitor of the impact of COVID-19 in Denmark, available at: https://covid-19-response.unstatshub.org/data-solutions/using-experimental-to-monitor-the-impact-of-covid19-in-denmark/ (last access: 9 February 2021), 2020. a
Zhang, X., Chen, X., and Wang, J.: A number-based inventory of size-resolved black carbon particle emissions by global civil aviation, Nat. Commun., 10, 534, https://doi.org/10.1038/s41467-019-08491-9, 2019. a
https://www.flightradar24.com/blog/flightradar24s-2019-by-the-numbers/ (last access: 9 February 2021).