the Creative Commons Attribution 4.0 License.
the Creative Commons Attribution 4.0 License.
 | 29 Jun 2021
Dataset of 1 km cropland cover from 1690 to 1999 in Scandinavia
Mats Widgren
Beibei Li
Yu Ye
Xiuqi Fang
Chengpeng Zhang
Tiexi Chen
Spatially explicit historical land cover datasets are essential not only for simulations of climate and environmental dynamics but also for projections of future land use, food security, climate, and biodiversity. However, widely used global datasets are developed for continental- to global-scale analysis and simulations. Their accuracy depends on the verification of more regional reconstruction results. This study collects cropland area data of each administrative unit (parish/municipality/county) in Scandinavia from multiple sources. The cropland area data are validated, calibrated, interpolated, and allocated into 1 km×1 km grid cells. Then, we develop a dataset with spatially explicit cropland area from 1690 to 1999. Results indicate that the cropland area increased from 1.82×10⁶ ha to 6.71×10⁶ ha from 1690 to 1950 and then decreased to 5.90×10⁶ ha in 1999. Before 1810, cropland cover expanded in southern Scandinavia and remained stable in northern Scandinavia. From 1810 to 1910, northern Scandinavia experienced slight cropland expansion. The cropland area increased rapidly in the southern part of the study area before changing slightly. After 1950, the cropland areas began to decrease in most regions, especially in eastern Scandinavia. When comparing global datasets with this study, although the total Scandinavia cropland area is in agreement among SAGE (Center for Sustainability and the Global Environment), HYDE (History Database of the Global Environment ) 3.2, PJ (Pongratz Julia), and this study, the spatial patterns show considerable differences, except for in Denmark between HYDE 3.2 and this study. The dataset can be downloaded from https://doi.org/10.1594/PANGAEA.926591 (Wei et al., 2021).
- Article
(17500 KB) - Full-text XML
-
Supplement
(172 KB) - BibTeX
- EndNote


Human-influenced land is a major component of anthropogenic global changes in the Earth system (Verburg et al., 2016). Thus, historical land use data are important for understanding the impact of land use and land cover change (LULCC) on global change. From a fully natural vegetation state to the 20th century, it was likely that land use change led to an increase in the Earth's albedo with a radiative forcing of W m−2 (Myhre et al., 2013). Over the years 1980–2005, conversion of mid-latitude natural forests into cropland and pastures was accompanied by a reduction in latent heat flux and an increase in sensible heat flux in summertime (Findell et al., 2017). The global CO2 emissions from land use and land cover change reached a cumulative total of about 206±57 Pg C from 1750 to 2018 (Gasser et al., 2020). The above conclusions of climate and environmental dynamics are all made by using spatially explicit historical land cover datasets. Historical land cover change information is also essential as a baseline analysis for projections of future land use, food security, climate, and biodiversity (Foley et al., 2011; Hurtt et al., 2011; Ellis et al., 2012; Brovkin et al., 2013; Fuchs et al., 2015; Mehrabi et al., 2018).
SAGE (Center for Sustainability and the Global Environment; Ramankutty and Foley, 1999, 2010), HYDE (History Database of the Global Environment; Klein Goldewikk, 2001; Klein Goldewijk et al., 2017), PJ (Pongratz Julia; Pongratz et al., 2008) and KK10 (Kaplan and Krumhardt 2010; Kaplan et al., 2009, 2011) datasets are produced as four representative datasets of global land use/cover. These global datasets are widely used in simulations of global and regional climate change or carbon budget because of their spatial resolutions and long-term coverage (Foley et al., 2005; Olofsson and Hickler, 2007; Strassmann et al., 2008; Pongratz et al., 2009b, 2010; Van Minnen et al., 2009; Arora and Boer, 2010; Hurtt et al., 2011; Kaplan et al., 2011; Brovkin et al., 2013; Yan et al., 2017; Zhang et al., 2017; Friedlingstein et al., 2020). However, global datasets are developed for continental- to global-scale analysis and simulation (Klein Goldewijk, 2001; Pongratz et al., 2009a; Ramankutty and Foley, 2010). Using population data to estimate global historical land use may induce large uncertainties and limitations in presenting regional-scale details (Klein Goldewijk and Verburg, 2013). Many regional land use reconstructions illustrate that global datasets have non-negligible discrepancies in reflecting regional spatial land use patterns historically, especially for cropland. Historical document-based reconstructions conclude that the SAGE, HYDE, and PJ datasets have drawbacks in capturing the spatial distribution of historical cropland change in China (Li et al., 2010; Zhang et al., 2013; Li et al., 2016, 2019; Wei et al., 2019). In the USA, the HYDE maps substantially underestimate crop density in high-cropland-coverage regions but overestimate it in the low-density areas for 1850–2016 (Yu and Lu, 2018). Neither KK10 nor HYDE captures the fine-scale spatial pattern of open land as inferred from the pollen-based land cover reconstructions in Europe for four preindustrial time points (Kaplan et al., 2017). Uncertainties in global datasets can be transferred into higher uncertainties in quantifying the climate and environmental effects of anthropogenic land cover change (ALCC) at both local and regional scales (Yang et al., 2018; Lejeune et al., 2018; Yu et al., 2019). Therefore, PAGES LandCover6k and related projects aim to improve ALCC datasets at both global and regional scales based on combined information from pollen-based reconstructions, archeological and historical data, and other reconstructions (Gaillard et al., 2015; Widgren, 2018a). Errors in global products can be assessed or corrected using the regional quantitative reconstructed land cover data and regional agrarian history maps (Widgren, 2018b; Fang et al., 2020).
Quantitative reconstruction of historical regional cropland change is impossible without scrutinized and published historical records or datasets at high spatial resolutions. Scandinavia (Sweden, Norway, and Denmark) has detailed cropland area records for quantitative historical cropland data reconstruction. In Scandinavia, though arable land accounts for a small proportion of the land area, farmers have historically been drivers of economic and social change (Gadd, 2011; Jansson, 2011). The cropland area has changed significantly over the past few centuries because of population growth, increasing food consumption, technology introduction, and land reforms (Anderberg, 1991; Almås, 2004; Vejre and Brandt, 2004; Jansson, 2011). Empirical studies at the regional level and historical documents from the government indicate Scandinavia experienced a rapid development of agriculture before the 20th century (Olsson and Svensson, 2010; Jansson, 2011; Nielsen et al., 2012; Cui et al., 2014). Then, agriculture became more intensive and specialized. Studies in Scandinavia have mainly concentrated on agricultural policy, agricultural economy, settlement and population, and landscape history (Anderberg, 1991; Olsson et al., 2000; Almås, 2004; Vejre and Brandt, 2004; Gustavsson et al., 2007; Olsson and Svensson, 2010; Jansson, 2011; Eriksson and Cousins, 2014; Levin et al., 2014; Mazier et al., 2015; Jacks, 2019).
Most results of agricultural history studies in Scandinavia cannot be directly input into climate and environmental models. The impacts of ALCC on the climate and environment cannot be evaluated precisely without grid-based cropland maps (Ramankutty and Foley, 1999; Lin et al., 2009), which are also essential for the accuracy assessment of global datasets (Fang et al., 2020). However, there have been few attempts to develop grid-based historical cropland data in Scandinavia. Pollen-based quantitative reconstruction of Holocene regional vegetation cover in Europe has been presented in a 1∘ × 1∘ spatial-scale dataset for climate modeling in Scandinavia (Trondman et al., 2015). To facilitate simulation studies with high-precision regional input data, Li et al. (2013) developed the cropland cover change dataset from 1875 to 1999 in Sweden and Norway. Materials from mainly two sources were collected, including Swedish data from the official agricultural statistics and the data provided by Norwegian Social Science Data Services (NSD; https://nsd.no/nsd/english/, last access: 16 November 2012). Methods of seed–cropland conversion, data interpolation and allocation, and data gridding were used to produce the cropland dataset at the spatial resolution of 0.5∘. At present, the highest resolution of the existing historical cropland cover dataset for Scandinavia is still 5′ × 5′ from the global dataset HYDE 3.2 (Klein Goldewijk et al., 2017).
This study's main objective is to provide a grid-based cropland dataset for 1690–1999 with high precision in Scandinavia, by reconstructing cropland area at the parish, municipality, or county levels and allocating cropland area into 1 km×1 km grid cells. Compared with existing datasets, our newly developed dataset of cropland cover provides more detailed information on spatial patterns of historical cropland change in Scandinavia.
In this study, cropland from multiple data sources is first gathered for further allocation. Meanwhile, administrative division maps and digital elevation model (DEM) data are also used. Land cover in 2000 based on remote sensing methods is selected to constrain historical cropland allocation. More details are as follows.
Besides the Scandinavian Peninsula (Sweden and Norway) cropland data after 1875 provided by Li et al. (2013), the cropland data used in this study are from different sources. Data sources in this study are shown in Table 1. For Sweden, all the data before 1875 are from the Svensk Nationell Datatjänst (Swedish National Data Service, termed SND; https://snd.gu.se/en/catalogue/study/SND0910, last access: 8 October 2019). Based on tax records, historical maps, land survey records, and farmer inventories, Palm (2014) developed an agricultural database (The database Sweden 1570–1810: population, agriculture, land ownership), which covers all parishes within Sweden's contemporary boundaries and the periods between 1570 and 1810. In SND's database, cropland is called åker in Swedish, which is also used in the data sources from 1875 to 1999 in Sweden. Åker from SND includes land under temporary crops, land under temporary meadows and pastures, and land that is temporarily fallow. However, the unit of åker in the dataset refers not to hectares but to barrels of seeds. For Norway, cropland data in 1665 and 1723 are from Statistiske studier over folkemængde og jordbrug i Norges landdistrikter i det syttende og attende aarhundrede (Statistical studies on population and agriculture: in the rural areas of Norway in the 17th and 18th centuries; Aschehoug, 1890). Cropland data in 1809 are from the study of Hovland (1978). In the above two sources, the volumes of different seed types, such as wheat, rye, barley, oat, peas, and potatoes, are recorded (land under temporary crops). The volumes of seeds in each county (amt) are presented. For Denmark, cropland data are from multiple sources. Data in 1688 are based on the Atlas over Denmark: Historisk-Geografisk Atlas (Atlas over Denmark: Historical-Geographic Atlas; Dam and Jakobsen, 2008). Dam and Jakobsen's map shows a cropland fraction of each ejerlav (area under a village, a manor, or a group of single farms) in Denmark. The cropland is called ager in Danish, referring to the total area under crop rotation. It includes the lands under temporary crops, temporary meadows and pastures, and temporarily fallow land. Pia Frederiksen from Aarhus University provided the cropland data for 1800, 1881, and 1998, based on data developed by Jørgen Rydén Rømer, Bernd Münier, and Morten Stenak (Odgaard and Rømer, 2009). Data for 1800 are from the map Videnskabernes Selskabs Kort (VSK) in 1762–1806 and further developed from agricultural statistics. The data for 1881 and 1998 are merged from maps and national statistics. They have the smallest spatial unit of a sogn (parish). The cropland is called agerjord, and it is divided into two subgroups, namely Besået areal (the lands annually sown with various 1-year or 2-year crops) and Græs i omdrift (the lands for temporary meadow or fallow land before it is plowed again for sowing). Besået areal and Græs i omdrift correspond to temporary cropland and to the lands with temporary meadows and that are temporarily fallow in 1688, respectively. The cropland area data in 1907 are from Statistisk Årbog 1912 (Danmarks Statistik, 1912), and its spatial resolution is the amt (county). The cropland area data in 1936, 1950, and 1980 are from agricultural statistics of Statistiske Meddelelser (Danmarks Statistik, 1936, 1950, 1980). The spatial resolutions of cropland data in 1936, 1950, and 1980 are the amt (county), amtsrådskreds (county council), and kommuner (municipality), respectively. The areas under temporary crops, under temporary meadows, and temporarily fallow are listed in tables by Danmarks Statistik.
Table 1Description of cropland data sources used in this study.
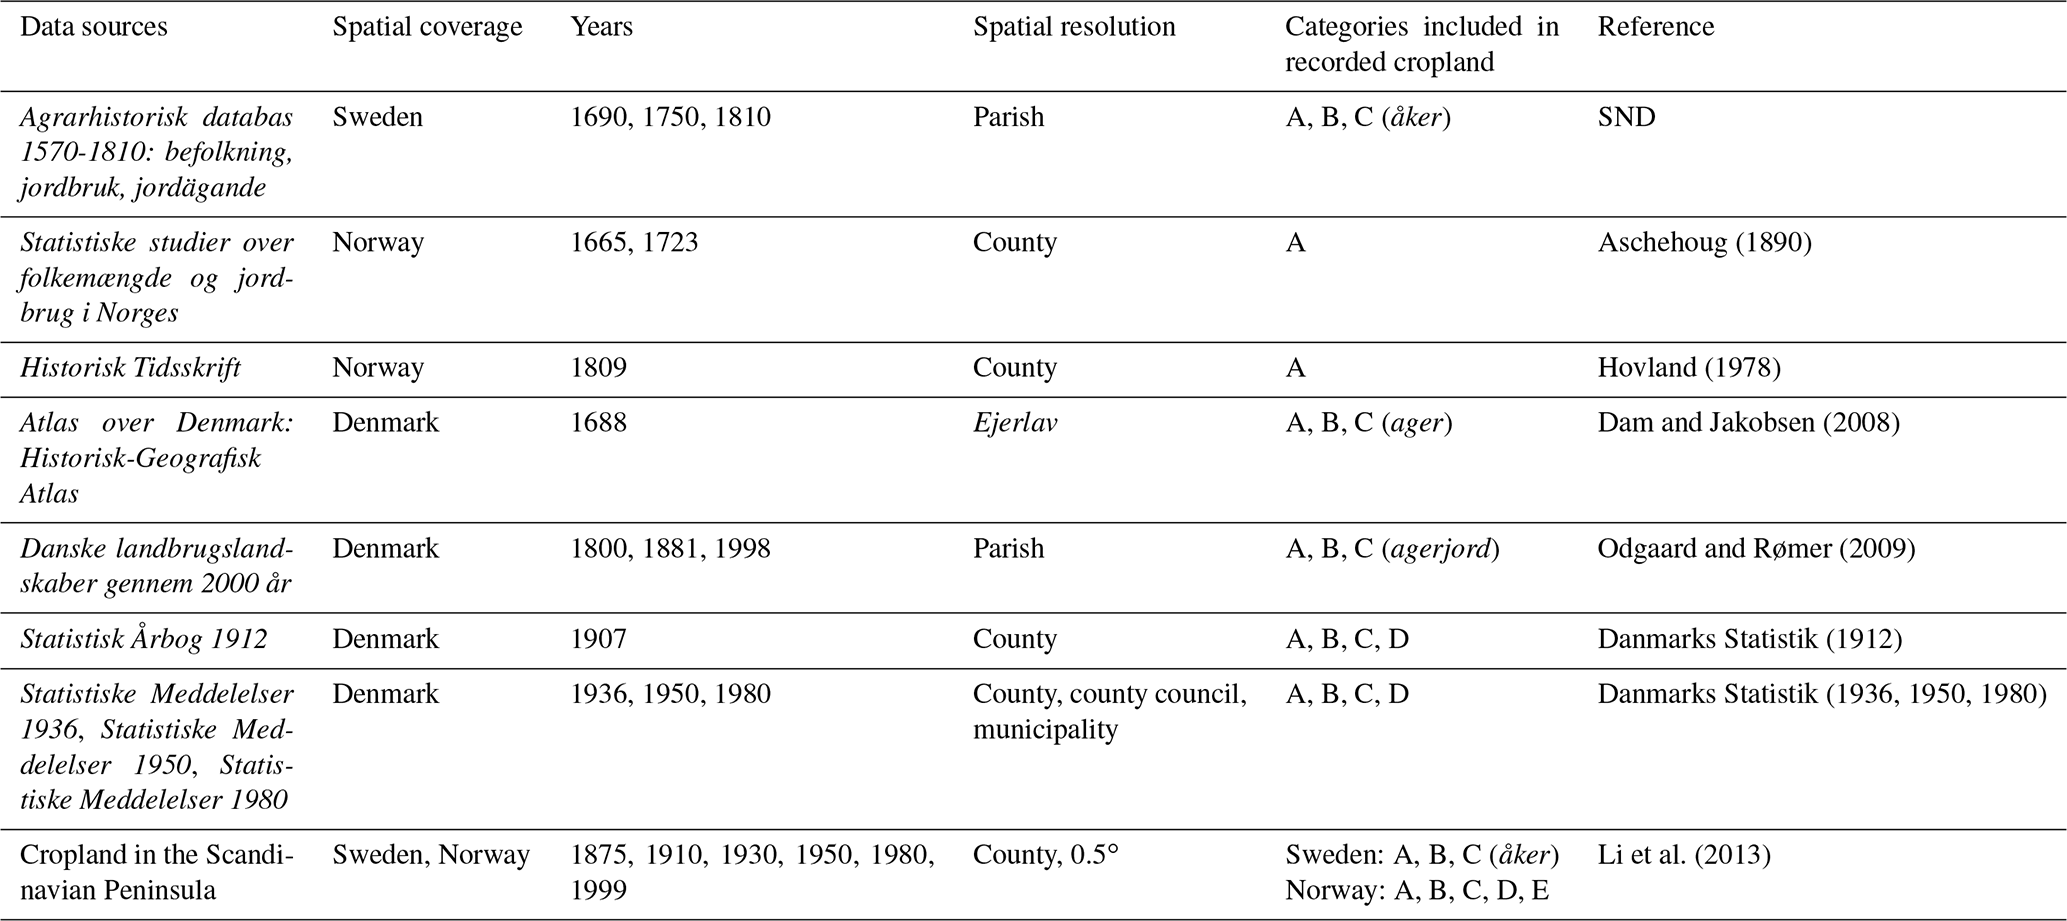
A: areas under temporary crops; B: areas under temporary meadows and pastures; C: land that is temporarily fallow; D: areas under permanent crops; E: permanent grassland and meadow.
The digital version of the administrative division maps of Sweden was initially developed at the National Archives of Sweden (Riksarkivet). It was later revised at the Department of Human Geography, Stockholm University. Ulf Jansson kindly provided the version used here. The administrative division maps of Norway are from NSD. The base maps of Denmark are downloaded from the HisKIS network (http://hiskis2.dk/?page_id=110, last access: 7 September 2019) and Danish Geodata Agency (http://download.kortforsyningen.dk/, last access: 7 September 2019).
Satellite-based land cover data from 2000 are selected as a reference to constrain the spatial distribution of historical cropland allocation. There are several well developed and widely used land cover datasets (Zhang et al., 2019). The satellite-based land cover data in 2000 are provided by the CORINE Land Cover (CLC 2000; https://land.copernicus.eu/pan-european/corine-land-cover/, last access: 7 April 2021) (Büttner, 2014), which has been well evaluated in Europe (Feranec et al., 2010). Although CLC1990 data are also provided, only CLC 2000 contains the earliest data covering our study region in the CLC data series. It consists of an inventory of land cover in five main categories and 44 classes. The details of CLC 2000 application in our model are explained in Sect. 3.2.
The DEM used in this study is from the NASA Shuttle Radar Topographic Mission (SRTM; https://cgiarcsi.community/data/srtm-90m-digital-elevation-database-v4-1/, last access: 20 February 2020) 90 m DEMs.
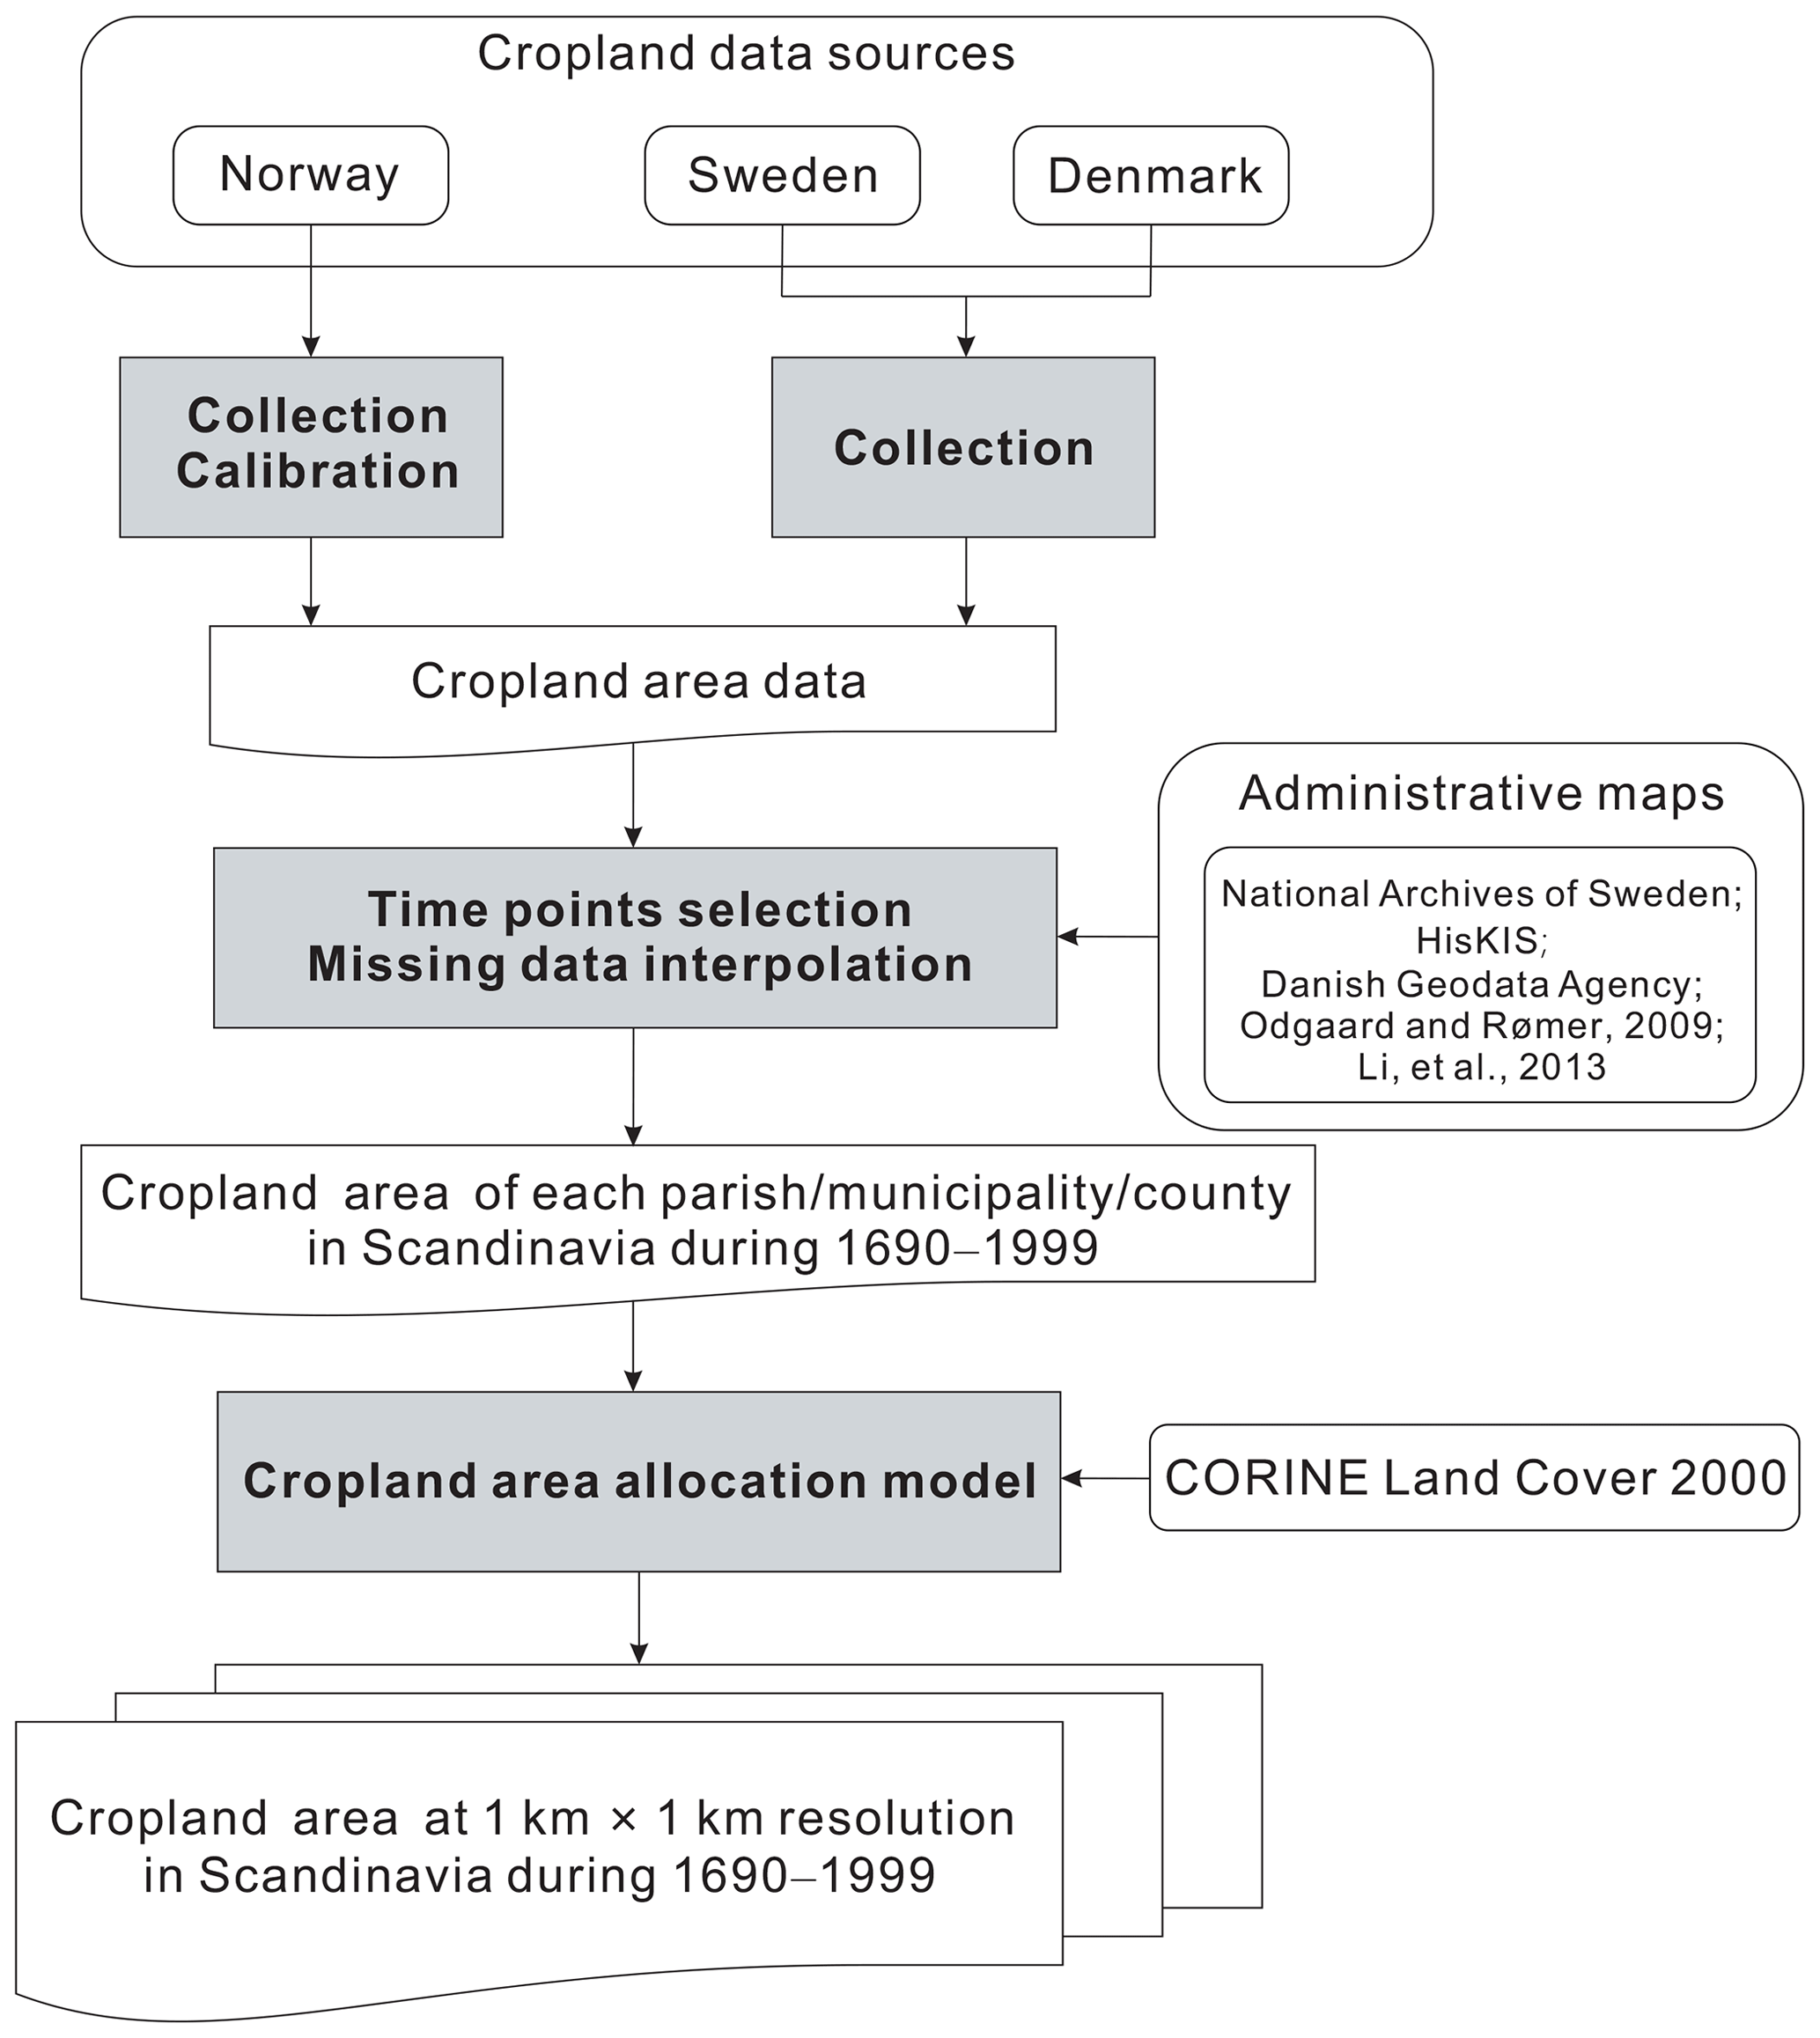
There are two main steps to develop the 1 km spatial resolution grid-based cropland dataset for 1690 to 1999: (1) collecting original multiple-source cropland area data to reconstruct the cropland area of each administrative unit and (2) allocating cropland area in administrative units into 1 km×1 km grid cells, using an allocation model that features the use of remote sensing land cover data as a constraint. The flowchart of the methods is described in Fig. 1.
3.1 Cropland area reconstruction at the parish/municipality/county levels
Based on the multiple sources, we collect cropland area data of each parish/municipality/county in Scandinavia from 1690 to 1999. Cropland data recorded as barrels of seeds are converted to cropland area in Sweden and Norway before 1875. By comparing between statistics and the census in 1999, cropland area data from statistics are calibrated. After time point selection, missing data are interpolated, and the cropland area at the parish/municipality/county levels in Scandinavia from 1690 to 1999 is developed.
3.1.1 Cropland data collection and calibration
The category “cropland” defined by the Food and Agriculture Organization (FAO; http://www.fao.org/, last access: 8 October 2020) is used in this study. Thus, our cropland includes arable land (areas under temporary crops, temporary meadows and pastures, land that is temporarily fallow) and areas under permanent crops. Non-cropland area, such as permanent meadows, is excluded.
As the unit of Swedish data in 1690, 1750, and 1810 from SND is barrels of seeds and not area, we use the formula of 1 barrel of seeds =4936 m2 of cropland =0.4936 hectares (ha) of cropland (Cardarelli, 2003) to obtain the cropland area of each parish. The Norwegian data in 1665, 1723, and 1809 also provide the volume of seeds but not the cropland area. We collect the relationships between the volume of seeds and the cropland area from four sources (Table 2). The values of liter per maal (1 maal = 0.1 ha) for seven types of seeds are close to each other, except for the value from NSD. The closest year to the three time points of 1665, 1723, and 1809 is 1835. Because agricultural development reduced the use of seeds per maal gradually, we choose the values of liter per maal in 1835 from Statistiske Oversigter 1914 (Aschehoug, 1914). Different area units are used for data sources in the remaining years; thus we unify the area units as hectares.
Table 2Relation of maal to liter from different sources in Norway.

Cropland data from SND are based on tax records, historical maps, land survey records, and farmer inventories. Cross-validation of data from multiple sources ensures data reliability. However, land under permanent crops are excluded in SND's data, which underestimate the total cropland area before 1875 in Sweden. Moreover, no additional historical records are found regarding the size of land under permanent crops. Using the same coefficient in different years to estimate land area under permanent crops increases the discrepancy of the cropland area. Based on the Farm Structure Survey (FSS, https://ec.europa.eu/, last access: 2 February 2021) in 1999 and 2010, the total land size under permanent crops accounts for only approximately 0.1 % of all cropland area in Sweden. Thus, we use the converted area from the barrels of seeds as the cropland area before 1875 in Sweden. For the collected cropland area data after 1875 in Sweden, Li et al. (2013) evaluated the statistics they used and ensured data accuracy. Cropland area data of Denmark in 1688, 1800, and 1881 were also validated using historical maps when they were generated (Dam and Jakobsen, 2008; Odgaard and Rømer, 2009). As the census from the FSS shows that the area under permanent crops accounts for less than 1 % of all cropland in Denmark, we use ager and agerjord as cropland in 1688, 1800, 1881, and 1998. Danish statistics provide the land use areas of all crops, temporary meadows and pastures, and fallow land. Therefore, we select the land area categorized as cropland according to the FAO. Then we calculate the total cropland area of each parish in Denmark.
The total cropland area collected by Li et al. (2013) from statistics in Norway was 1.04×10⁶ ha in 1999. It is 38 % larger than the total area of arable land and land under permanent crops in 2000 from the FSS. But it is the same as the total area of arable land, land under permanent crops, and land under permanent grassland and meadow from the FSS. Thus, we re-collect the arable land area and land area under permanent crops from the 1999 statistics (NSD kommunedatabase; https://kdb.nsd.no/kdbbin/kdb_start.exe, last access: 2 February 2021) used by Li et al. (2013). We find the total cropland area provided by the FSS in 2000 is 1.18 times larger than our collected statistics in 1999. Thus, a calibration coefficient of 1.18 is used to compensate for estimating the cropland area in Norway from official statistics from 1665 to 1999.
3.1.2 Time point selection and data interpolation
Based on the years when cropland area data are available in Sweden, Norway, and Denmark, we select nine times to represent the cropland change trend from 1690 to 1999. Compared to the data sources in Norway and Denmark, the cropland data from Swedish data sources are the most abundant and complete. Thus, the nine time points are based on the data sources in Sweden, which are 1690, 1750, 1810, 1875, 1910, 1930, 1950, 1980, and 1999. The years of 1690, 1750, and 1810 correspond to 1665, 1723, and 1809 from the data sources in Norway. In Denmark, 1690, 1810, 1910, 1930, 1950, 1980, and 1999 correspond to 1688, 1800, 1881, 1912, 1936, 1950, and 1998, respectively.
To map the spatial patterns of cropland distribution in Sweden before 1875, we use the parish level administrative map from 1750. We link the datasets during 1690–1810 to the base map in 1750 based on parish code. Four cities (stad) in the datasets fail to connect with the corresponding base map. Fourteen parishes on the base map also lack cropland data. After checking their administrative codes, a relationship between the four cities (stad) and 14 parishes is found. Then, all the 2390 parishes are associated with their corresponding cropland area data.
For Denmark, cropland area data in 184 (total 8083) ejerlav are missing in 1688. We assume that neighboring ejerlav with similar terrain have the same cropland fraction and cropland growth rate. Then, the missing data are interpolated based on the cropland fractions of their neighboring ejerlav in 1688, and the cropland area changes from 1688 to 1800. Using the same method, we also interpolate 56 (total 1705) missing data in 1800 and 2 missing data (total 1719) in 1881. We select the administrative map in 1688 from the HisKIS network as the cropland data base map. Cropland area data in 1800, 1881, and 1999 also have corresponding base maps (Odgaard and Rømer, 2009). The base maps for data in 1936, 1950, and 1980 are from the Danish Geodata Agency (https://eng.gst.dk/, last access: 7 September 2019). There is no cropland area record of Denmark in 1750. Therefore, we assume that the cropland area change rate from 1690 to 1810 is constant and compute each parish's cropland area in 1750.
Because the cropland data before 1875 are at the county (amt) level and the administrative division did not change dramatically from 1690 to 1875 in Norway, the administrative map in 1875 from NSD's kommunedatabase is used as the base map for cropland data during 1690–1810. Following the above steps, the cropland area of each administrative unit at the nine time points is connected to the corresponding administrative maps.
3.2 Cropland area allocation into grid cells
As the cropland area data of each parish/municipality/county cannot be used as input for the climate and environment simulations directly, we develop cropland area allocation models and allocate the cropland area into 1 km×1 km grid cells. The allocation process includes two essential parts, cropland distribution factors and the maximum extent constraints. In this work, elevation and slope are selected as the distribution factors. The maximum extent constraints are defined based on the CLC 2000 data.
We analyze the factors affecting cropland distribution. In previous studies, elevation, slope, climate, soil, water, and population were used as causes related to the change in cropland spatial distribution (Klein Goldewijk et al., 2011; Li et al., 2016; Paudel et al., 2017). People tend to prefer starting from areas with lower elevations and gentler slopes when cultivating the land. Land with high elevations and slopes has negative characteristics that constrain cropland cultivation; therefore it will only be used after low-elevation and gentle-slope land has been cultivated. In Scandinavia, there is little climate difference in each parish/municipality/county. We assume the impact of climate on cropland distribution has been included in the effects of elevation and slope in each parish/municipality/county. Soil properties such as texture, fertility, and organic-matter content impact suitability for growing crops, but they are not a limitation for land cultivation in most areas. According to statistics from Statistics Sweden (SCB), Statistics Norway (SSB), and Statistics Denmark (DST), Scandinavia's population constantly increased from the 17th century to the present, while the cropland area decreased after 1950. Population growth was an important reason for cropland area increase before 1950, especially in Sweden and Denmark. However, the spatial distribution of population data before 1950 at a high spatial resolution is hard to obtain. Thus, elevation and slope are selected as the factors in the cropland area allocation model. Using the NASA SRTM 90 m DEMs, we resample the DEMs in Scandinavia to a 1 km resolution. The values of elevation and slope are normalized using the following formulas:
where E′ (i) and S′ (i) are the normalized elevation and slope value of grid i, E(i) and S(i) are the original elevation and slope value of grid i,Emax and Smin are the maximum elevation and slope value of grid i in Scandinavia, and Emin and Smin are the minimum elevation and slope value of grid i in Scandinavia.
The value of land cultivation suitability Suit(i) of grid i is calculated using the following formula:
where Mcrop(i) refers to the maximum extent of cropland, which is a crucial component for allocation models. In this study, Mcrop(i) is defined using the CLC 2000 data.
The weight of grid i for cropland area allocation (w(i)) and the cropland area of grid i (Crop(i)) become
where Crop(Pn) is the total cropland area of the administrative unit (Pn). The total weight of each administrative unit for cropland area allocation is 1.
In previous studies, the maximum extents of cropland (Mcrop) in modern times have been used to allocate historical cropland area (Li et al., 2016; Wei et al., 2019) because the area of cropland in modern times is usually larger than that in historical periods. However, this is a source of error in Scandinavia as many croplands were converted to forest during the 20th century. Beyond the maximum extent of modern cropland, more marginal lands may have been cultivated. Considering Scandinavia's agricultural history and urbanization development, we use different maximum extents of cropland during 1690–1950, in 1980, and in 1999.
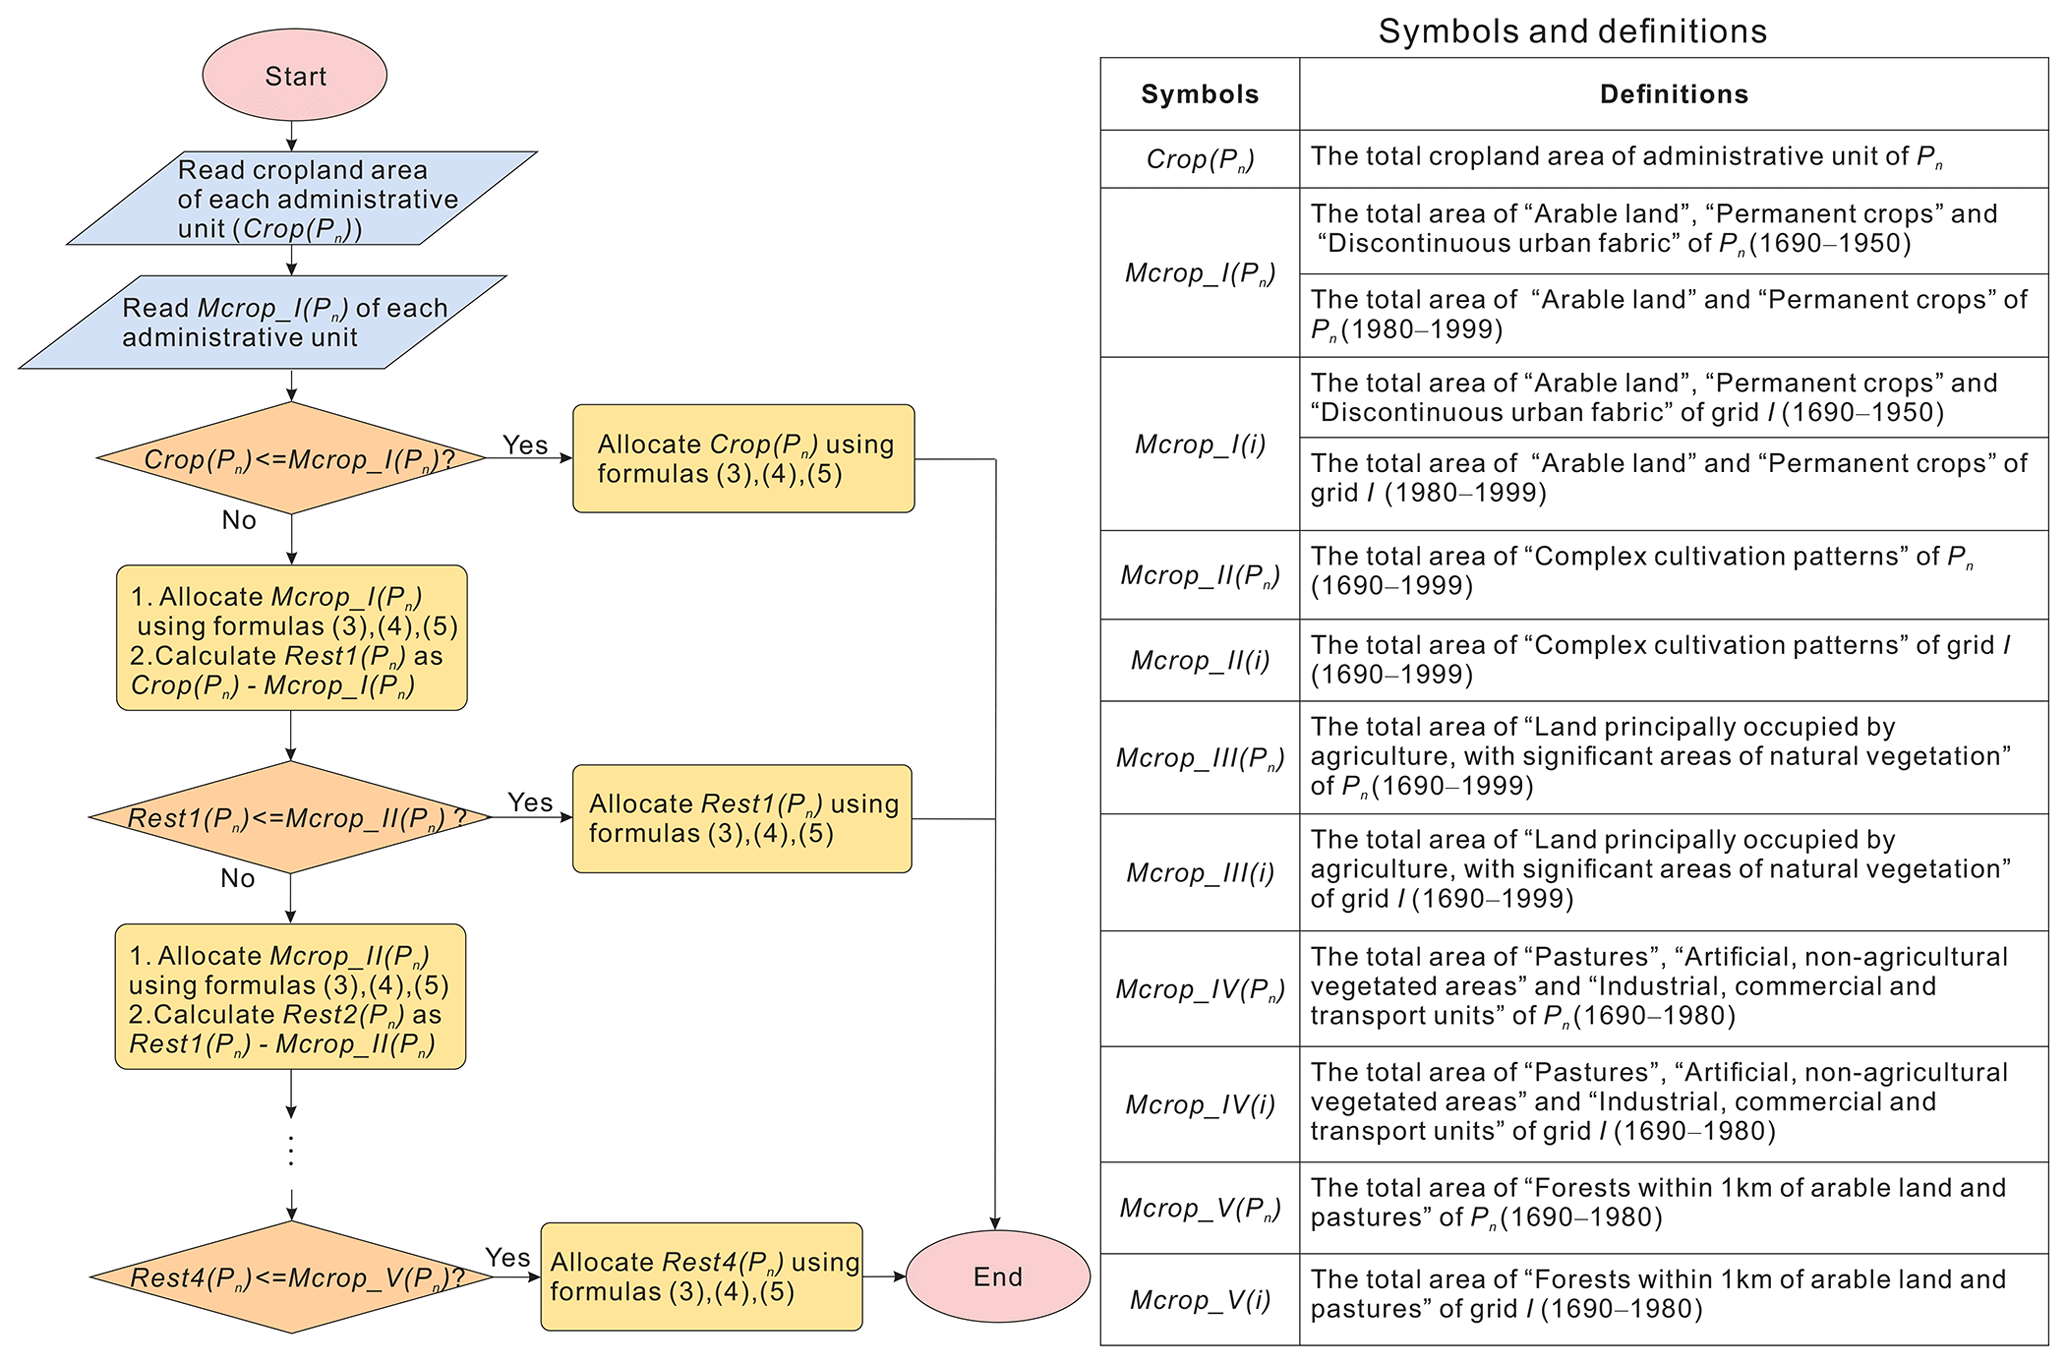
Because urban land is usually built on rural and cultivated land, urban land cover maps from CLC 2000 are also used to build the maximum cropland cover extent map. In Scandinavia, although industrialization accelerated after 1870, the urbanization rate was still less than 30 % before 1930. After 1960, urbanization was even faster, and its rate reached over 50 % in 1990 (Clark, 2009). Thus, the urban land cover map is only used during 1690–1950. The cropland area is allocated to grid cells following the process shown in Fig. 2.
First, the maximum extent of cropland in the first step allocation is defined as the sum of “Arable land”, “Permanent crops”, and “Discontinuous urban fabric” from CLC 2000. Mcrop_I(i) and Mcrop_I(Pn) refer to the maximum extent of cropland in grid i and the administrative unit Pn, respectively. We compare our collected cropland area of administrative unit Pn (Crop(Pn)) with Mcrop_I(Pn). If Crop(Pn)≤Mcrop_I(Pn), Crop(Pn) is allocated into grid cells using Eqs. (3), (4), and (5) mentioned above, where Mcrop_I(i) is Mcrop(i) in Eq. (3). Otherwise, if Crop(Pn)>Mcrop_I(Pn), Mcrop_I(Pn) is allocated and the rest (Rest1(Pn), calculated as Crop(Pn)−Mcrop_I(Pn)) goes into the next step (Fig. 2).
In the second step, Rest1(Pn) is compared with Mcrop_II(Pn). If Rest1(Pn)≤Mcrop_II(Pn), Rest1(Pn) is allocated into grid cells using Eqs. (3), (4), and (5), where Mcrop_II(i) is Mcrop(i) in Eq. (3). Otherwise, Mcrop_II(Pn) is allocated. The rest (Rest2(Pn), calculated as Rest1(Pn)−Mcrop_II(Pn)) is compared with Mcrop_III(Pn) and allocated following the same procedure as that of the first and second steps. Mcrop_IV(i) and Mcrop_V(i) are used in Eq. (3) in turn, until the cropland areas in all administrative units are allocated to grid cells.
For the cropland area in 1980, as the urbanization rate reached approximately 50 %, more cropland was converted to urban land. Here we define the maximum extent of cropland in the first allocation step as the sum of Arable land and Permanent crops from CLC 2000. Crop(Pn) is allocated to grid cells using the allocation model in Fig. 2. For cropland area in 1999, following the allocation steps in Fig. 2, Crop(Pn) is allocated to Mcrop_I(i) (defined as all Arable land and Permanent crops of grid i), Mcrop_II(i) (defined as “Complex cultivation patterns” of grid i), and Mcrop_III(i) (defined as “Land principally occupied by agriculture, with significant areas of natural vegetation” of grid i) in turn.
3.3 Cropland data comparison
Because global datasets were produced based on the national level cropland area while cropland areas at the parish/municipality/county levels are used to spatialize cropland distribution by us, cropland datasets from this study can be used to assess the accuracy of global datasets. As the total cropland area is small in Scandinavia, we use the relative difference ratio (RD) to identify the differences between different datasets as follows:
where Cglobe(t) is the cropland area from global datasets and C(t) is the cropland area from this study.
Because the cropland area only accounted for less than 8 % of Scandinavia's total land area in 2000, it is difficult to observe small changes from the 1 km×1 km resolution cropland maps, especially in northern Scandinavia. However, we find the total cropland area from 1690 to 1999 showed a phased change. Significant changes in the spatial distribution of cropland in southern Scandinavia and northern cropland expansion are also shown clearly on our maps.
4.1 Changes in the total cropland area
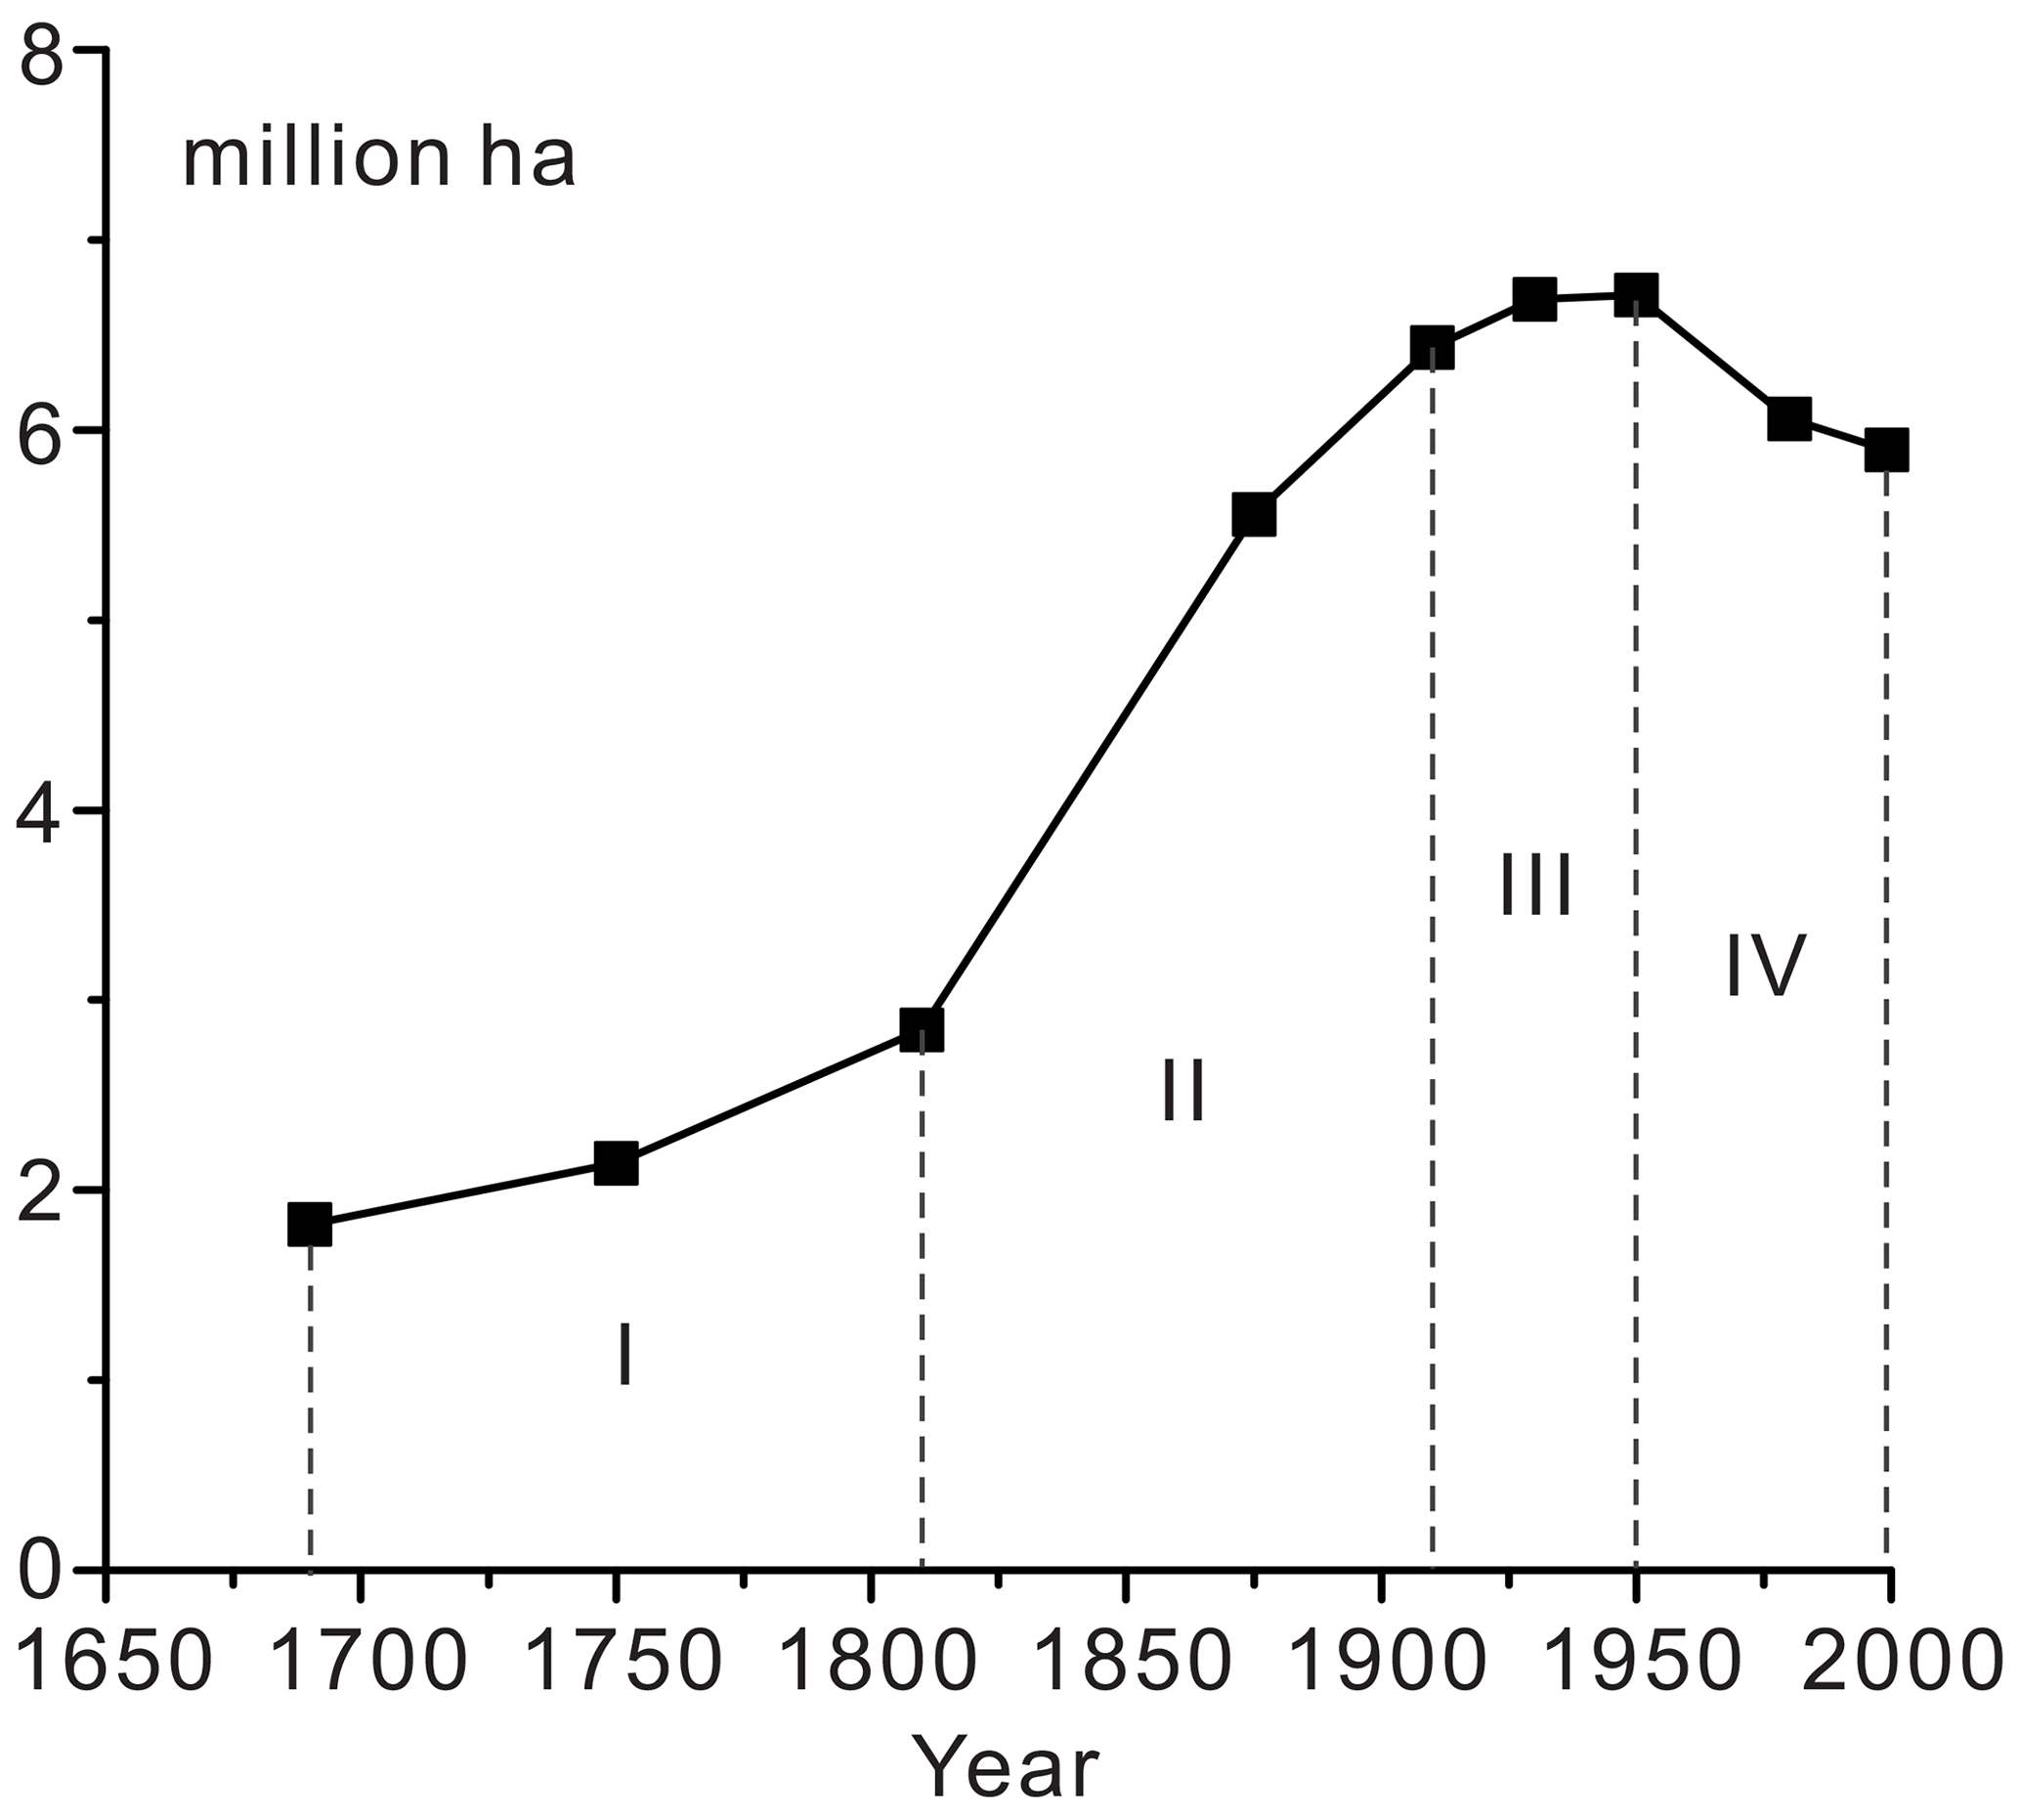
The total cropland area change in Scandinavia during 1690–1999 is shown in Fig. 3. Overall, cropland area developed slowly before 1810 and kept developing rapidly afterwards. The increasing trend did not stop until the beginning of the 20th century. Then it remained stable for around 40 years before dropping in 1999. The cropland area change process can be divided into four stages: (1) there was a slight increase in 1690–1810, with an annual growth rate of 0.37 % on average. In 1690, the cropland area was 1.82×10⁶ ha, accounting for 2.07 % of the land area. The cropland area rose steadily to 2.84×10⁶ ha in 1810. (2) There was a rapid increase during 1810–1910, with an annual growth rate of 0.82 % on average. After 1810, the cropland area rose dramatically for the next century, reaching 6.43×10⁶ ha in 1910. (3) There was a steady rise in 1910–1950, with a 0.10 % average annual growth rate. Between 1910 and 1950, a slight increase in the cropland area was experienced. Then the cropland area reached 6.71×10⁶ ha. (4) There was a gradual decrease in 1950–1999, with a −0.26 % average annual growth rate. After 1950, the cropland area declined and dropped to 5.90×10⁶ ha in 1999, constituting 6.71 % of the land area.
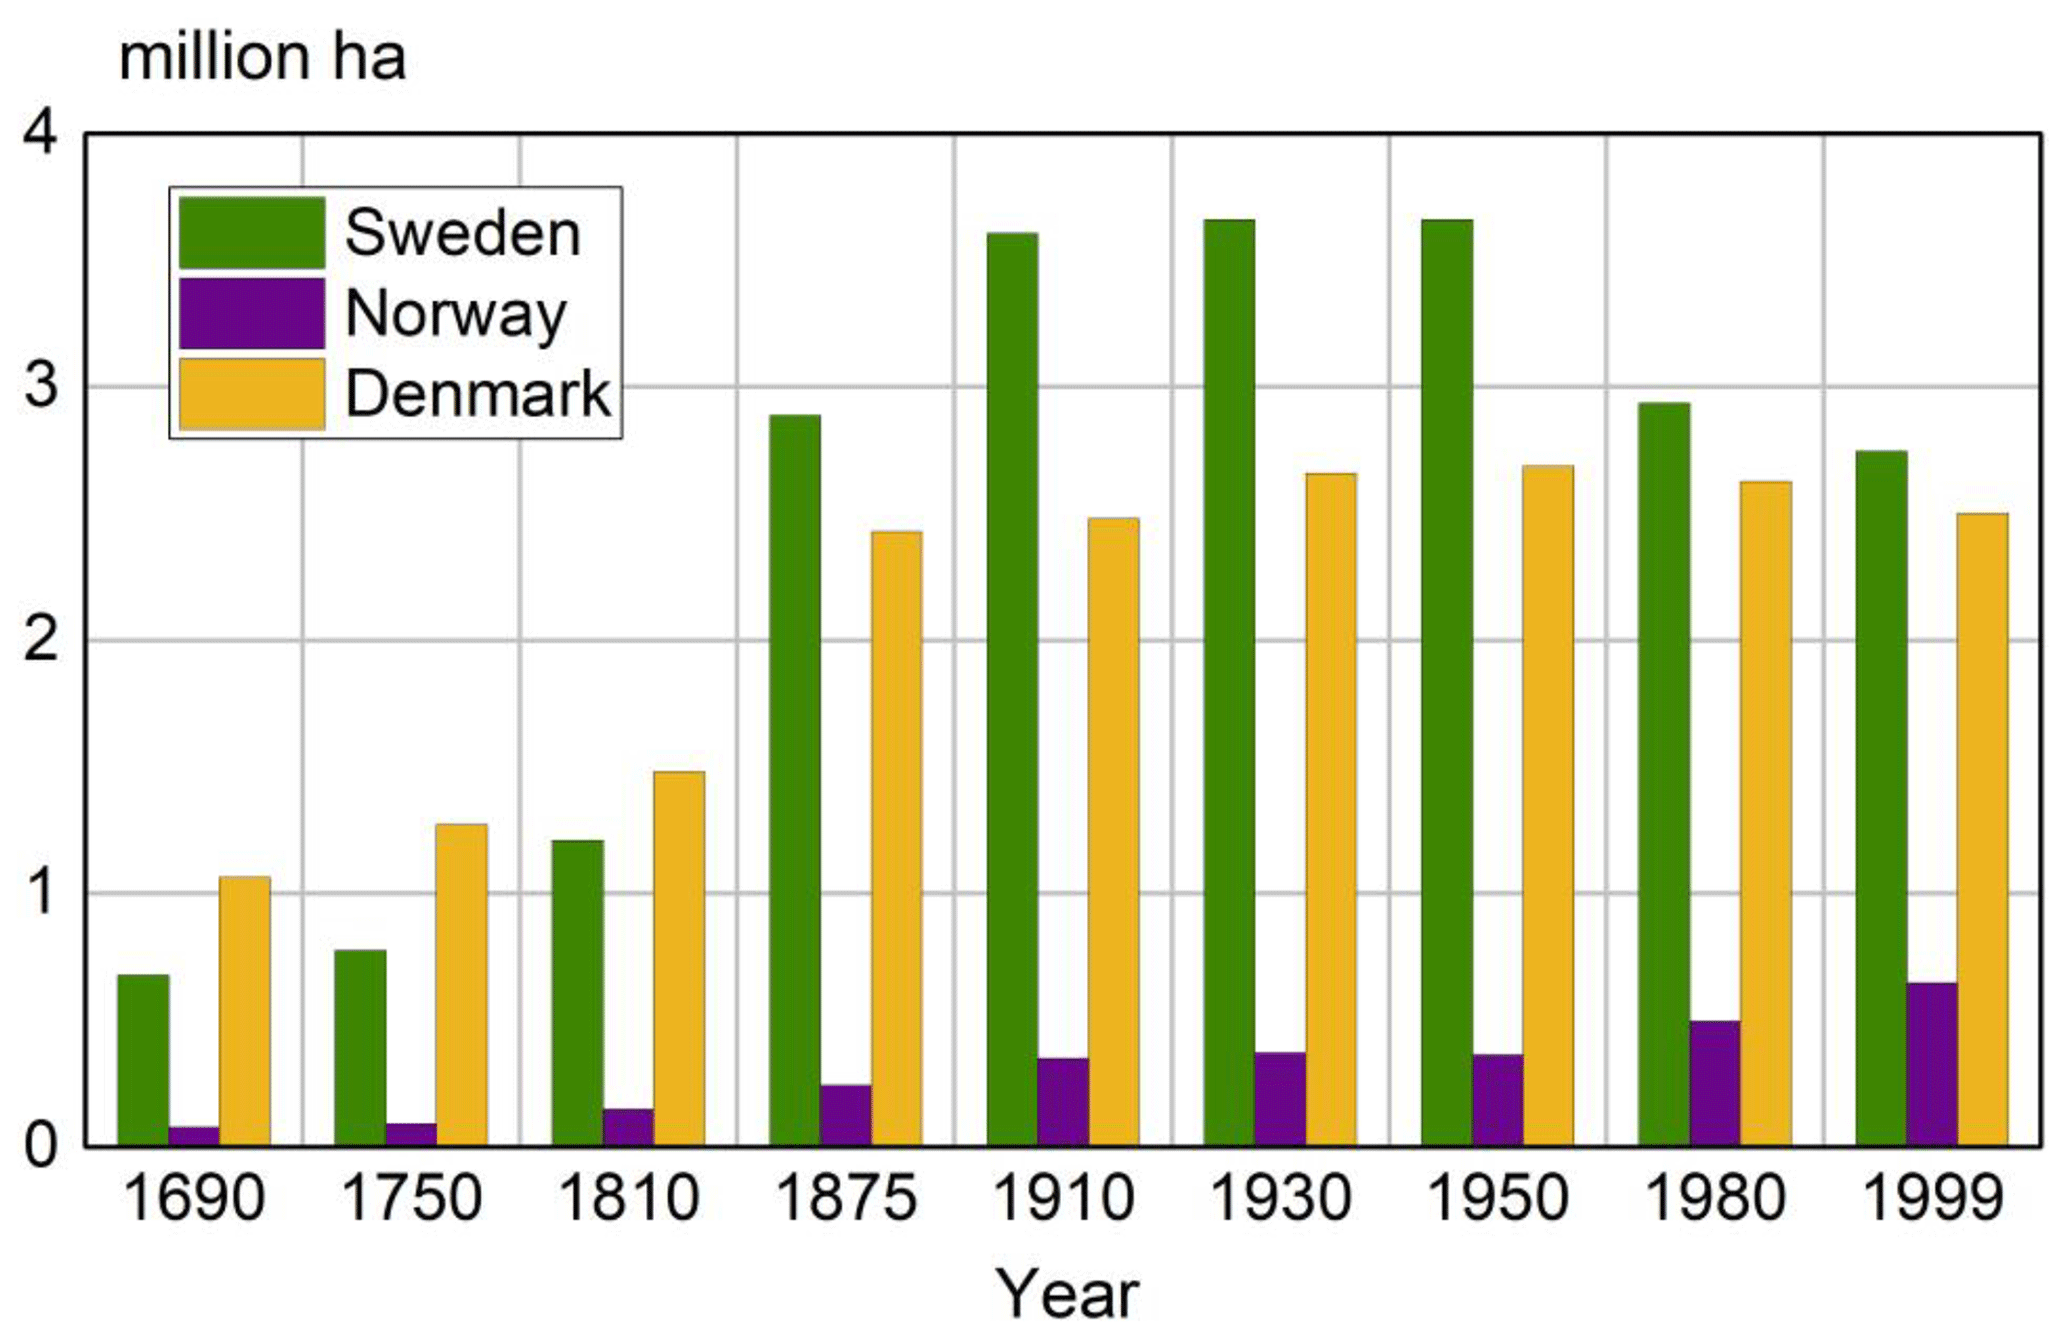
For Sweden, the cropland area was just 0.68×10⁶ ha in 1690 and rose slowly to 1.21×10⁶ ha in 1810. After 1810, Sweden had the largest cropland area in Scandinavia, growing from 2.89×10⁶ ha in 1875 to around 3.60×10⁶ ha in 1910. The next 40 years witnessed a slight growth in cropland area, reaching a peak in 1950 of 3.66×10⁶ ha which represented 52.57 % of the total cropland area in Sweden. Then, the cropland area declined to 2.75×106 ha by 1999.
For the first three time points, Denmark's cropland area grew gradually and accounted for 58.53 %, 59.44 %, and 52.17 % of all cropland area in 1690, 1750, and 1810, respectively. The cropland area continued to rise at an average annual growth rate of 0.36 % until 1950 when it reached its highest area of 2.68×10⁶ ha. After that, the figure slowly dropped to 2.63×10⁶ ha in 1999.
The cropland area difference between Sweden and Denmark narrowed after 1980. Compared with Sweden and Denmark, Norway had the smallest cropland area, which comprised only 6 % of Scandinavia's total cropland area on average. After a slow increase from 1690 to 1810, there was noticeable growth between 1810 and 1910. During 1690–1910 the cropland area increased by 4.5 times. Despite some slight fluctuations, the cropland area rose from 0.35×10⁶ ha in 1910 to 0.65×10⁶ ha in 1999, with an average annual growth rate of 0.70 % (Fig. 4).
4.2 Spatial cropland distribution patterns
The spatial patterns of cropland distribution from 1690 to 1999 in Scandinavia are shown in Fig. 5. Denmark and southern Sweden already had extensive cropland cover in 1690, which reflected their long historical agricultural practices. Before 1810, cropland cover expanded in southern Scandinavia and remained stable in the north. Grid cells with more than 5 % cropland accounted for 9.79 % and 12.58 % of the total grids cells in 1690 and 1810, respectively, while the number of grid cells with more than 60 % cropland increased by a factor of approximately 4. After 1810, cropland in northern Scandinavia experienced slight expansion, and the cropland fractions increased rapidly. In 1910, grid cells with more than 5 % cropland represented a proportion of around 17.05 %, while the percentage of grid cells with more than 60 % cropland grew to 6 %. During 1910–1950, cropland area changed gradually. Cropland proportion changes in most grid cells were between −20 % and 20 %. After 1950, cropland areas began to decrease in most regions, especially in eastern Scandinavia. In western Scandinavia, the cropland area increased gradually and expanded to the north. Grid cells with more than 60 % cropland accounted for 5.53 % of the total grid cells and 28.43 % of the grid cells that had cropland in 1999.
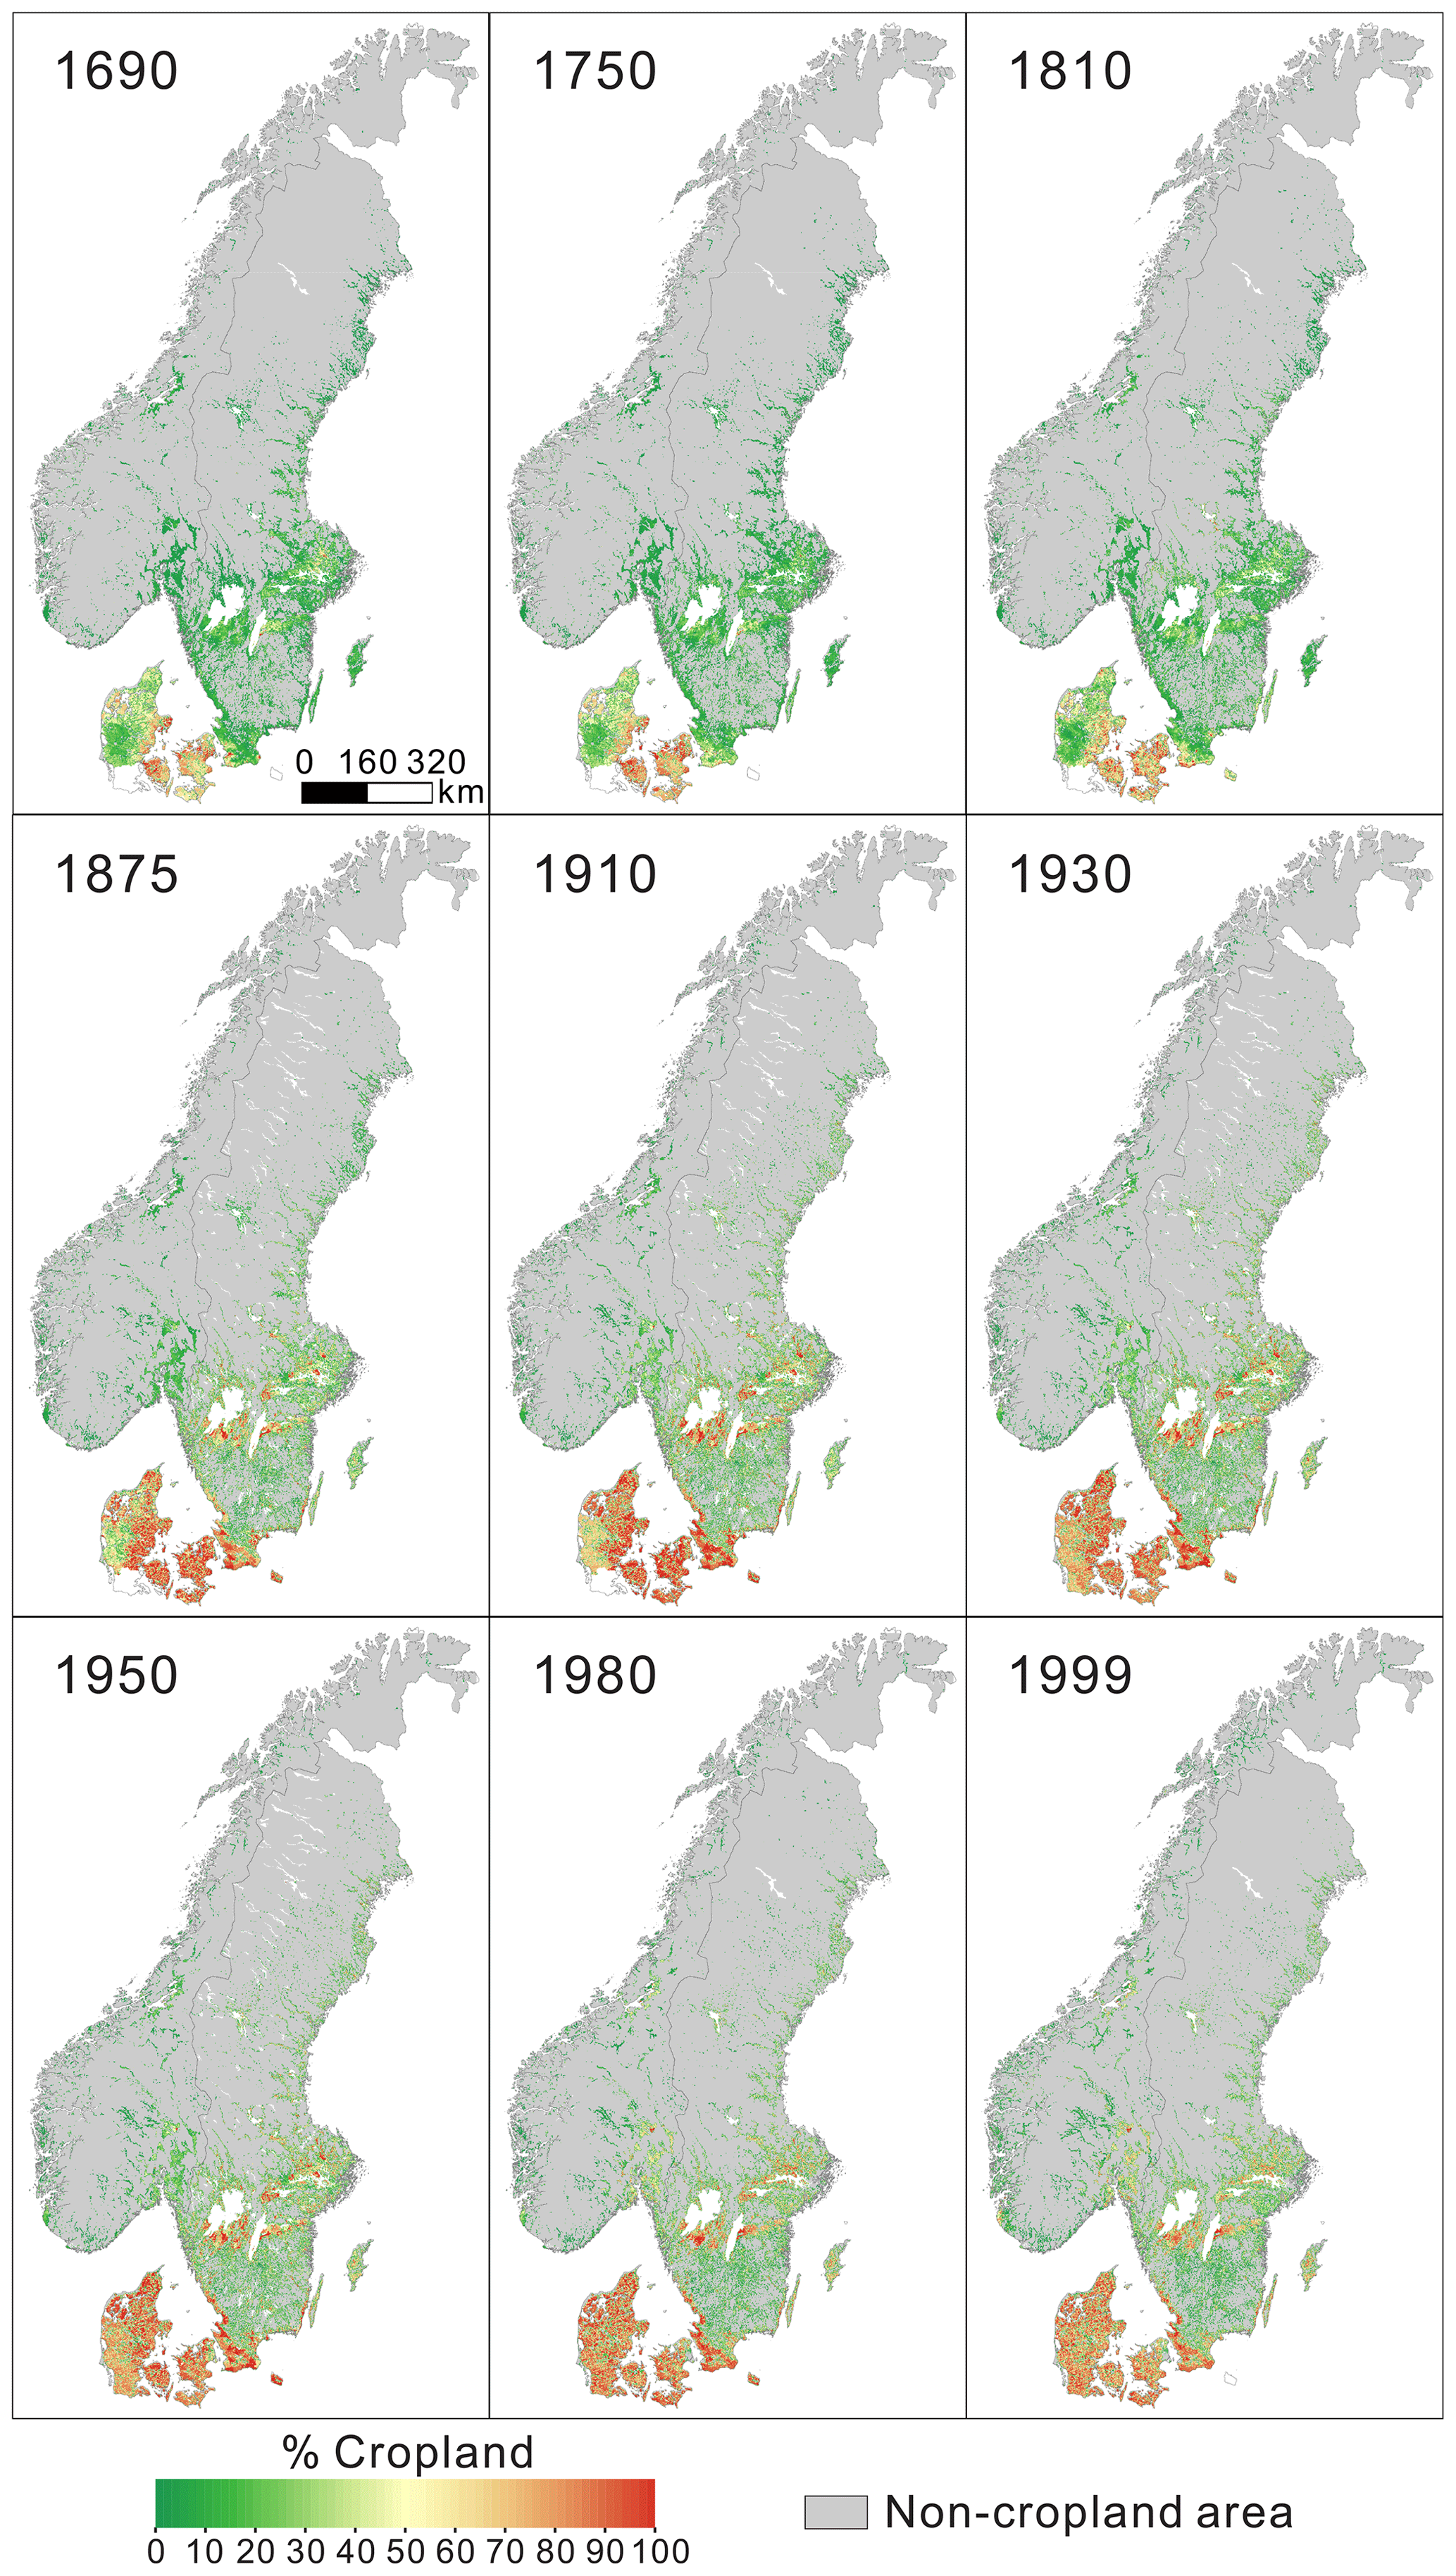
Figure 5Spatial distribution of cropland area during 1690–1999 in Scandinavia.
In Sweden, about half of the area is covered by forest. Mountains, marshes, and lakes together cover approximately one-third of the area. The cropland area has accounted for 1.50 %–8.13 % of Sweden's total land area over the past 300 years. In 1690, croplands were especially dense in southern Sweden, especially around the lakes of Vänern, Vättern, Mälaren, and Hjälmaren as well as in Skåne, reflecting the long cultivation history. After that, the cropland spatial patterns became more intensive in southern Sweden and began to spread northward. Several grid cells with more than 80 % cropland were observed and increased in 1910. During 1910–1950, spatial patterns of cropland distribution remained stable, except for slight increases in Västerbotten and Norrbotten counties in the north and minor changes in Skåne (Malmöhus and Kristianstad counties) and Gotland. In the following years, the cropland area declined in most regions. The percentage of grid cells with more than 80 % cropland dropped in 1980 and 1999. However, the coastal areas of Halland and Skåne still maintained high cropland fractions.
Mountains, forests, open heathlands, and grasslands dominate Norway's landscapes, and only about 3 % of the land surface is suited for cultivation or arable farming (FAO; http://www.fao.org/family-farming/detail/en/c/358178/, last access: 8 October 2019). In 1690, a small amount of cropland in Norway was distributed around the two agricultural centers, Oslofjord and Trondheimsfjorden. From 1750 to 1810, the cropland spatial patterns around the two fjords expanded and cropland appeared in Nordland County in northern Norway. Then, the cropland fraction increased in the two agricultural centers during 1810–1910, and cropland began to appear in the northernmost county, Finnmark. Cropland in the two agricultural centers stabilized and even decreased but increased in other regions from 1910 to 1950. After 1950, cropland around Oslofjord and Trondheimsfjorden started growing again. The dramatic growth occurred in the southwestern area of Rogaland. Cropland area in low-elevation coastal regions also increased.
Denmark is among the most intensively cultivated countries in Europe. The long land cultivation history has included widespread cropland cover since 1690 in Denmark. Most high-fraction grid cells were distributed in eastern Denmark before 1950 as soil conditions there were more suitable for crop planting than in the western part of the country. The period between 1690 and 1810 experienced gradual growth, and the most rapid cropland increase occurred in eastern Denmark. Between 1810 and 1910, a sharp increase in cropland area in both eastern and western Denmark was observed. Grid cells with more than 20 % and 60 % cropland accounted for 83.42 % and 71.24 % of the total grid cells in 1910. Since 1910, negative rates of change in cropland areas have dominated in northern and eastern Denmark and positive rates have dominated in the western part, including Ribe, Ringkjøbing, and Viborg counties. However, the changes in cropland areas of most grid cells were less than 20 %. Although cropland areas in South Jutland, Ribe, Ringkjøbing, Viborg, and North Jutland counties increased moderately, those in other Danish counties declined from 1950 to 1999.
4.3 Validation of the dataset developed in this study
To validate the newly created dataset, we use the satellite-based modern cropland cover data. Two sets of global land cover maps at a 30 m resolution, from the Global Food Security-Support Analysis Data at 30 m (GFSAD30; https://croplands.org/app/map?lat=0&lng=0&zoom=2, last access: 7 April 2021) Project and GlobeLand30 maps (http://globeland30.org/, last access: 7 April 2021), are found. However, GFSAD30 provides land cover maps at a 30 m resolution only for 2015 whereas GlobeLand30 has 30 m resolution maps in 2000, 2010, and 2020. Although there are differences among satellite-based maps of multiple time points in modern times, the period of 1985–2000 can be regarded as one time point compared to the past 300 years. Thus, we choose the GlobeLand30 map for 2000 to validate our 1999 cropland dataset.
The images for land cover development classification and update of GlobeLand30 are mainly 30 m multispectral images (Chen et al., 2014). GlobeLand30 includes 10 land cover classes in total, namely cultivated land, forest, grassland, shrubland, wetland, water bodies, tundra, artificial surface, bare land, and perennial snow and ice. Cultivated land refers to the land used for cultivating crops. Paddy fields, irrigated upland, rainfed upland, vegetable land, cultivated pasture, greenhouse land, and land mainly planted with crops and rarely with fruit trees or other plantations are included in cultivated land. However, cropland in our datasets only includes arable land (areas under temporary crops, temporary meadows and pastures, land that is temporarily fallow) and areas under permanent crops.
We compare our cropland area at the parish and county levels in 1999 with cultivated land area from the 2000 GlobeLand30 map to validate the statistics we used. We firstly aggregate the 30 m resolution GlobeLand30 to 1 km. Then we compare the result with our 1999 grid-based cropland dataset to validate our allocation method. The comparison between our cropland area at the parish and county levels in 1999 and the cultivated land from the 2000 GlobeLand30 map shows that the cultivated land area from GlobeLand30 is 1.4 times that of our cropland area (Fig. 6).
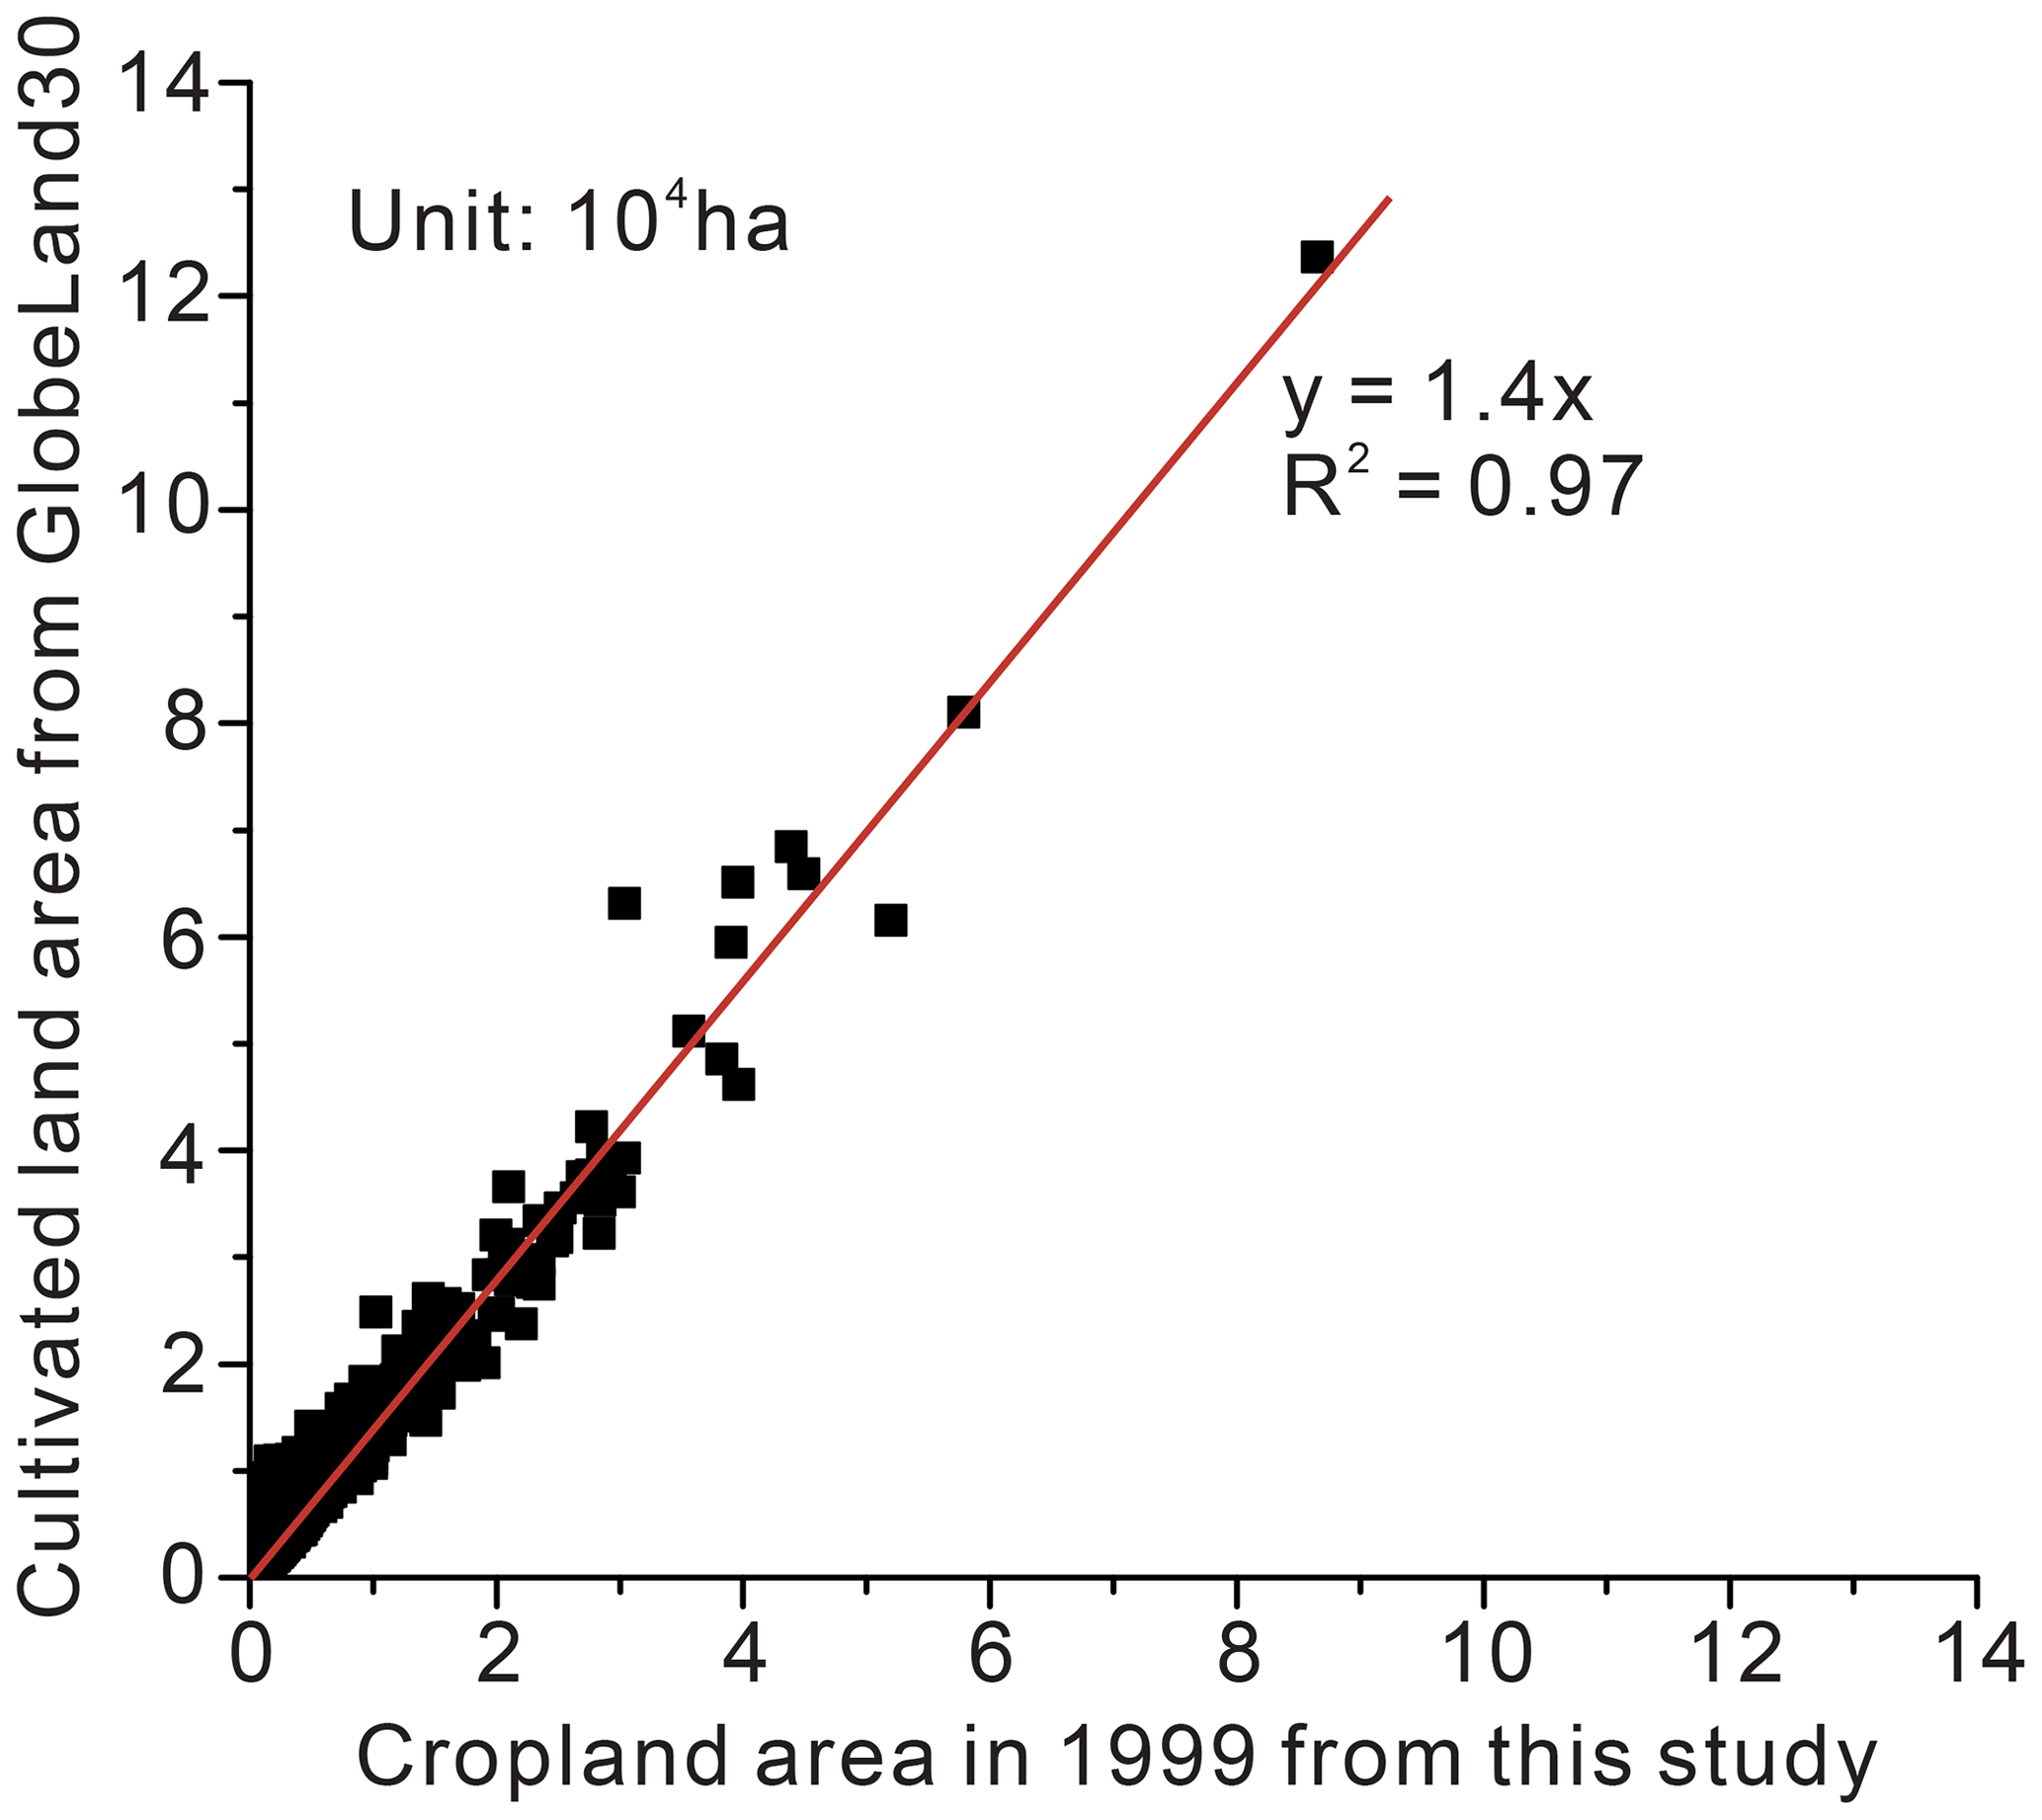
Figure 6Comparison of the area at the parish and county levels between GlobeLand30 and this study.
Comparison of the grid-based cropland area at a 1 km resolution between GlobeLand30 and this study shows grids with differences between −20 % and 20 % account for 64.81 % of the total number of grids with the cropland area >0 (Fig. 7). Because only arable land and permanent crops comprise cropland in this study, among all grids with cultivated land >0, 79.44 % of grids from GlobeLand30 have more cultivated land than this study.
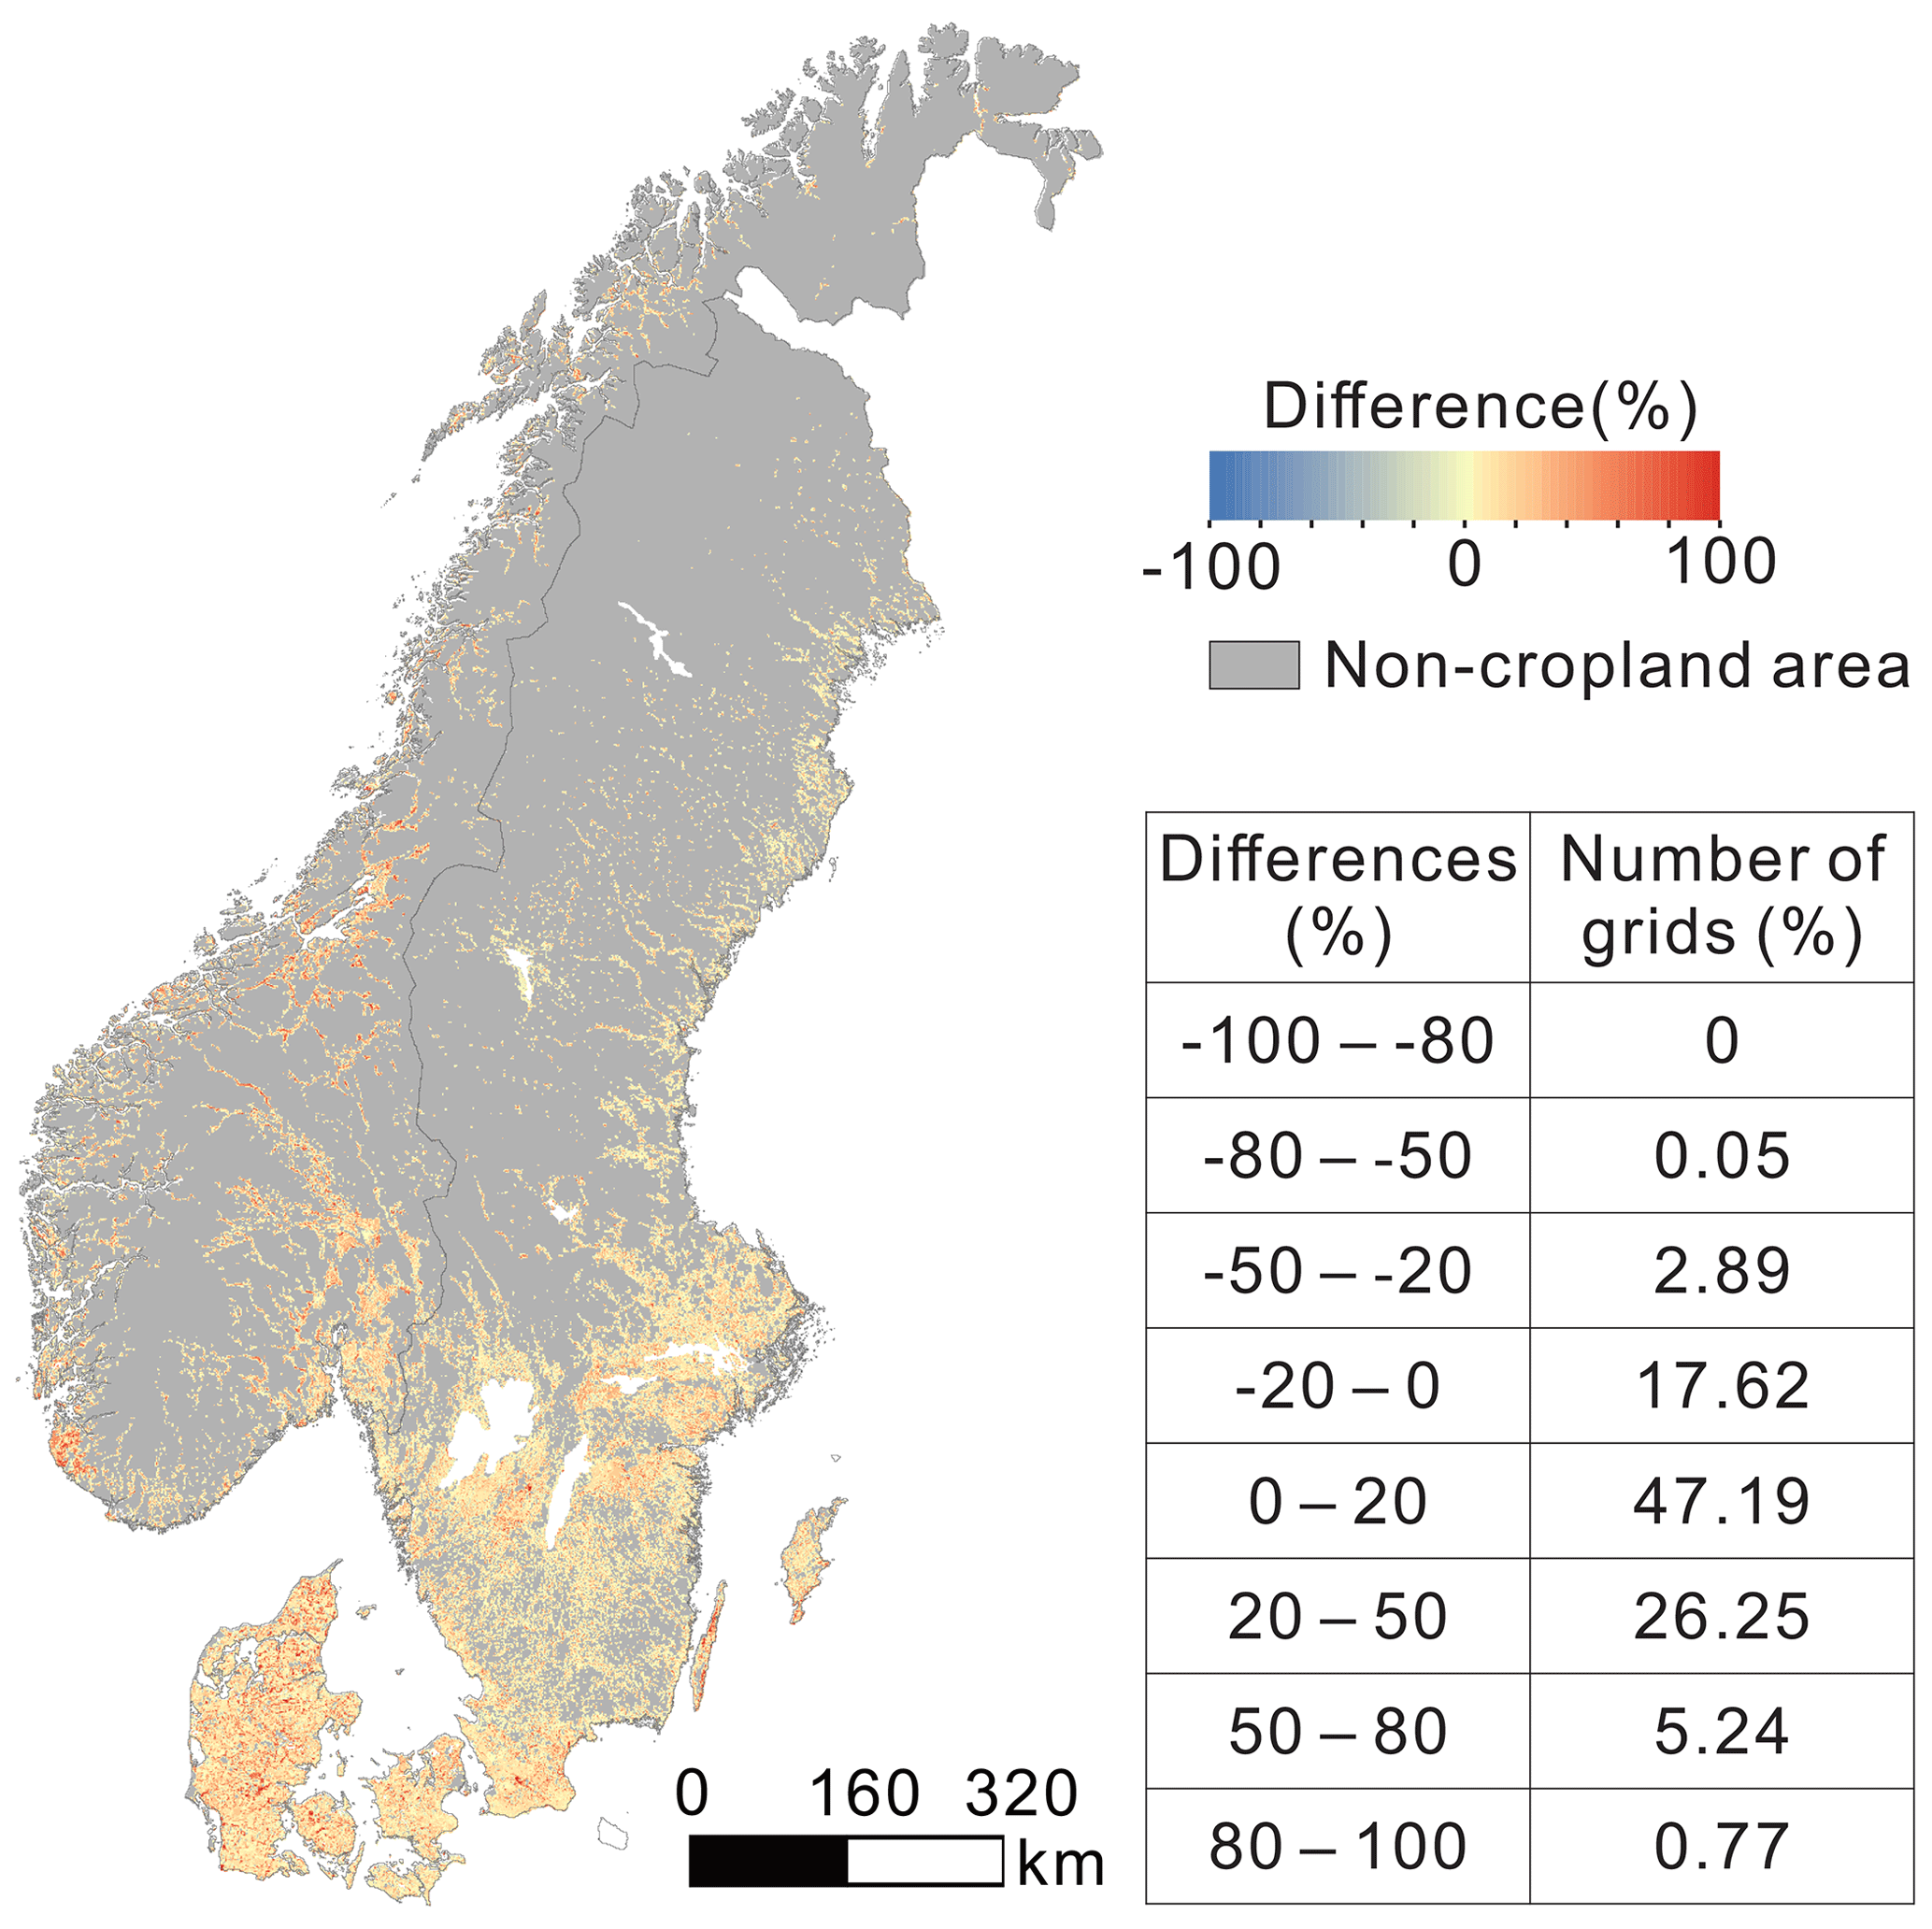
Figure 7Comparison of the grid-based cropland area between GlobeLand30 and this study.
Because CLC 2000 provides more agricultural (cultivated) land classes (Büttner, 2014), we use CLC 2000 to further validate our cropland dataset. In Scandinavia, CLC 2000 divides agricultural areas into four categories: Arable land (including one class, “Non-irrigated arable land”), Permanent crops (including one class, “Fruit trees and berry plantations”), “Heterogeneous agricultural areas” (including two classes, Complex cultivation patterns and Land principally occupied by agriculture, with significant areas of natural vegetation), and Pastures. Comparison of the grid-based cultivated land area and agricultural areas at a 1 km resolution between GlobeLand30 and CLC 2000 shows the consistency of these two datasets. We compare the total area of Arable land, Permanent crops, and Complex cultivation patterns from CLC 2000 with our cropland area for each parish and county (Fig. 8). Figure 8 shows that the area from CLC 2000 is 1.17 times that of our cropland area. Removing some marginal roads and natural lands included in Arable land, Permanent crops, and Complex cultivation patterns from CLC 2000, our cropland areas at the parish and county levels are close to those from CLC 2000.
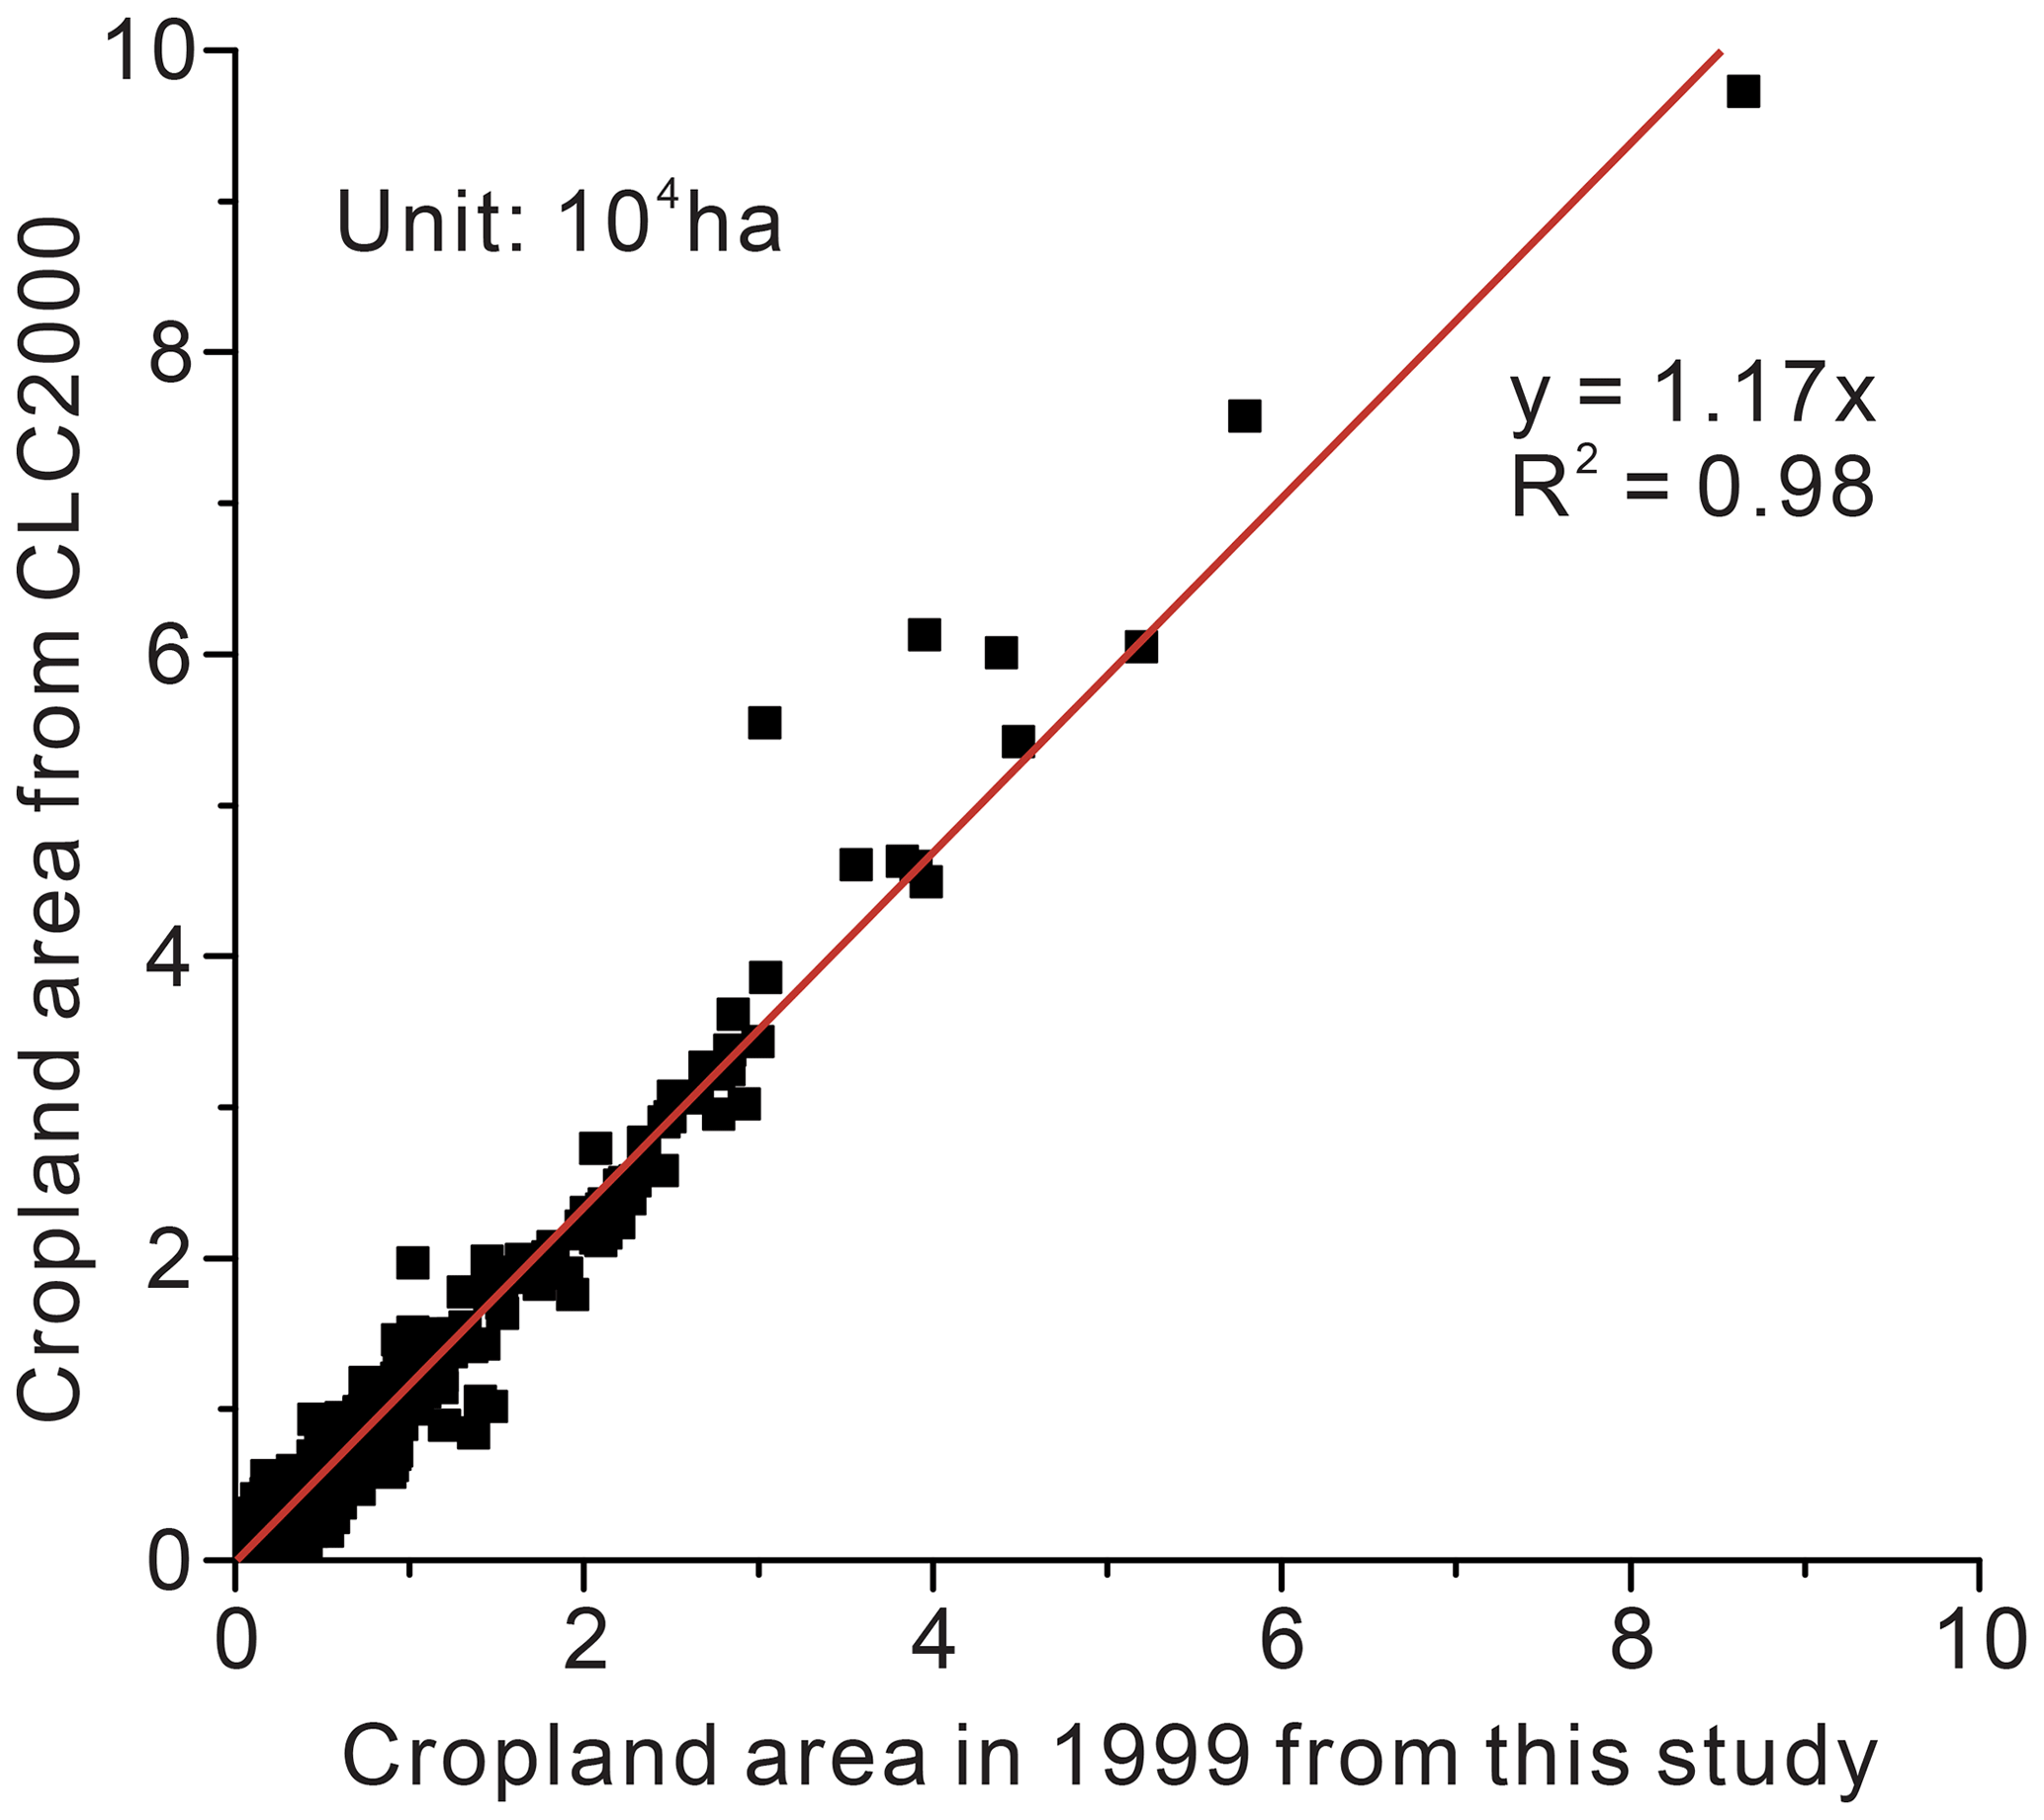
Figure 8Comparison of the cropland area at the parish and county levels between CLC 2000 and this study.
Comparison of the grid-based cropland area at 1 km resolution between CLC 2000 and this study shows grids with differences between −20 % and 20 % account for 90.54 % of the total number of grids with the cropland area >0 (Fig. 9). Our grid-based cropland area is close to that in CLC 2000 overall, which indicates the reliability of our cropland dataset. However, around Stockholm and Trondheim, in southeastern Norway, and in northern Denmark, our cropland areas are slightly less than those from CLC 2000.
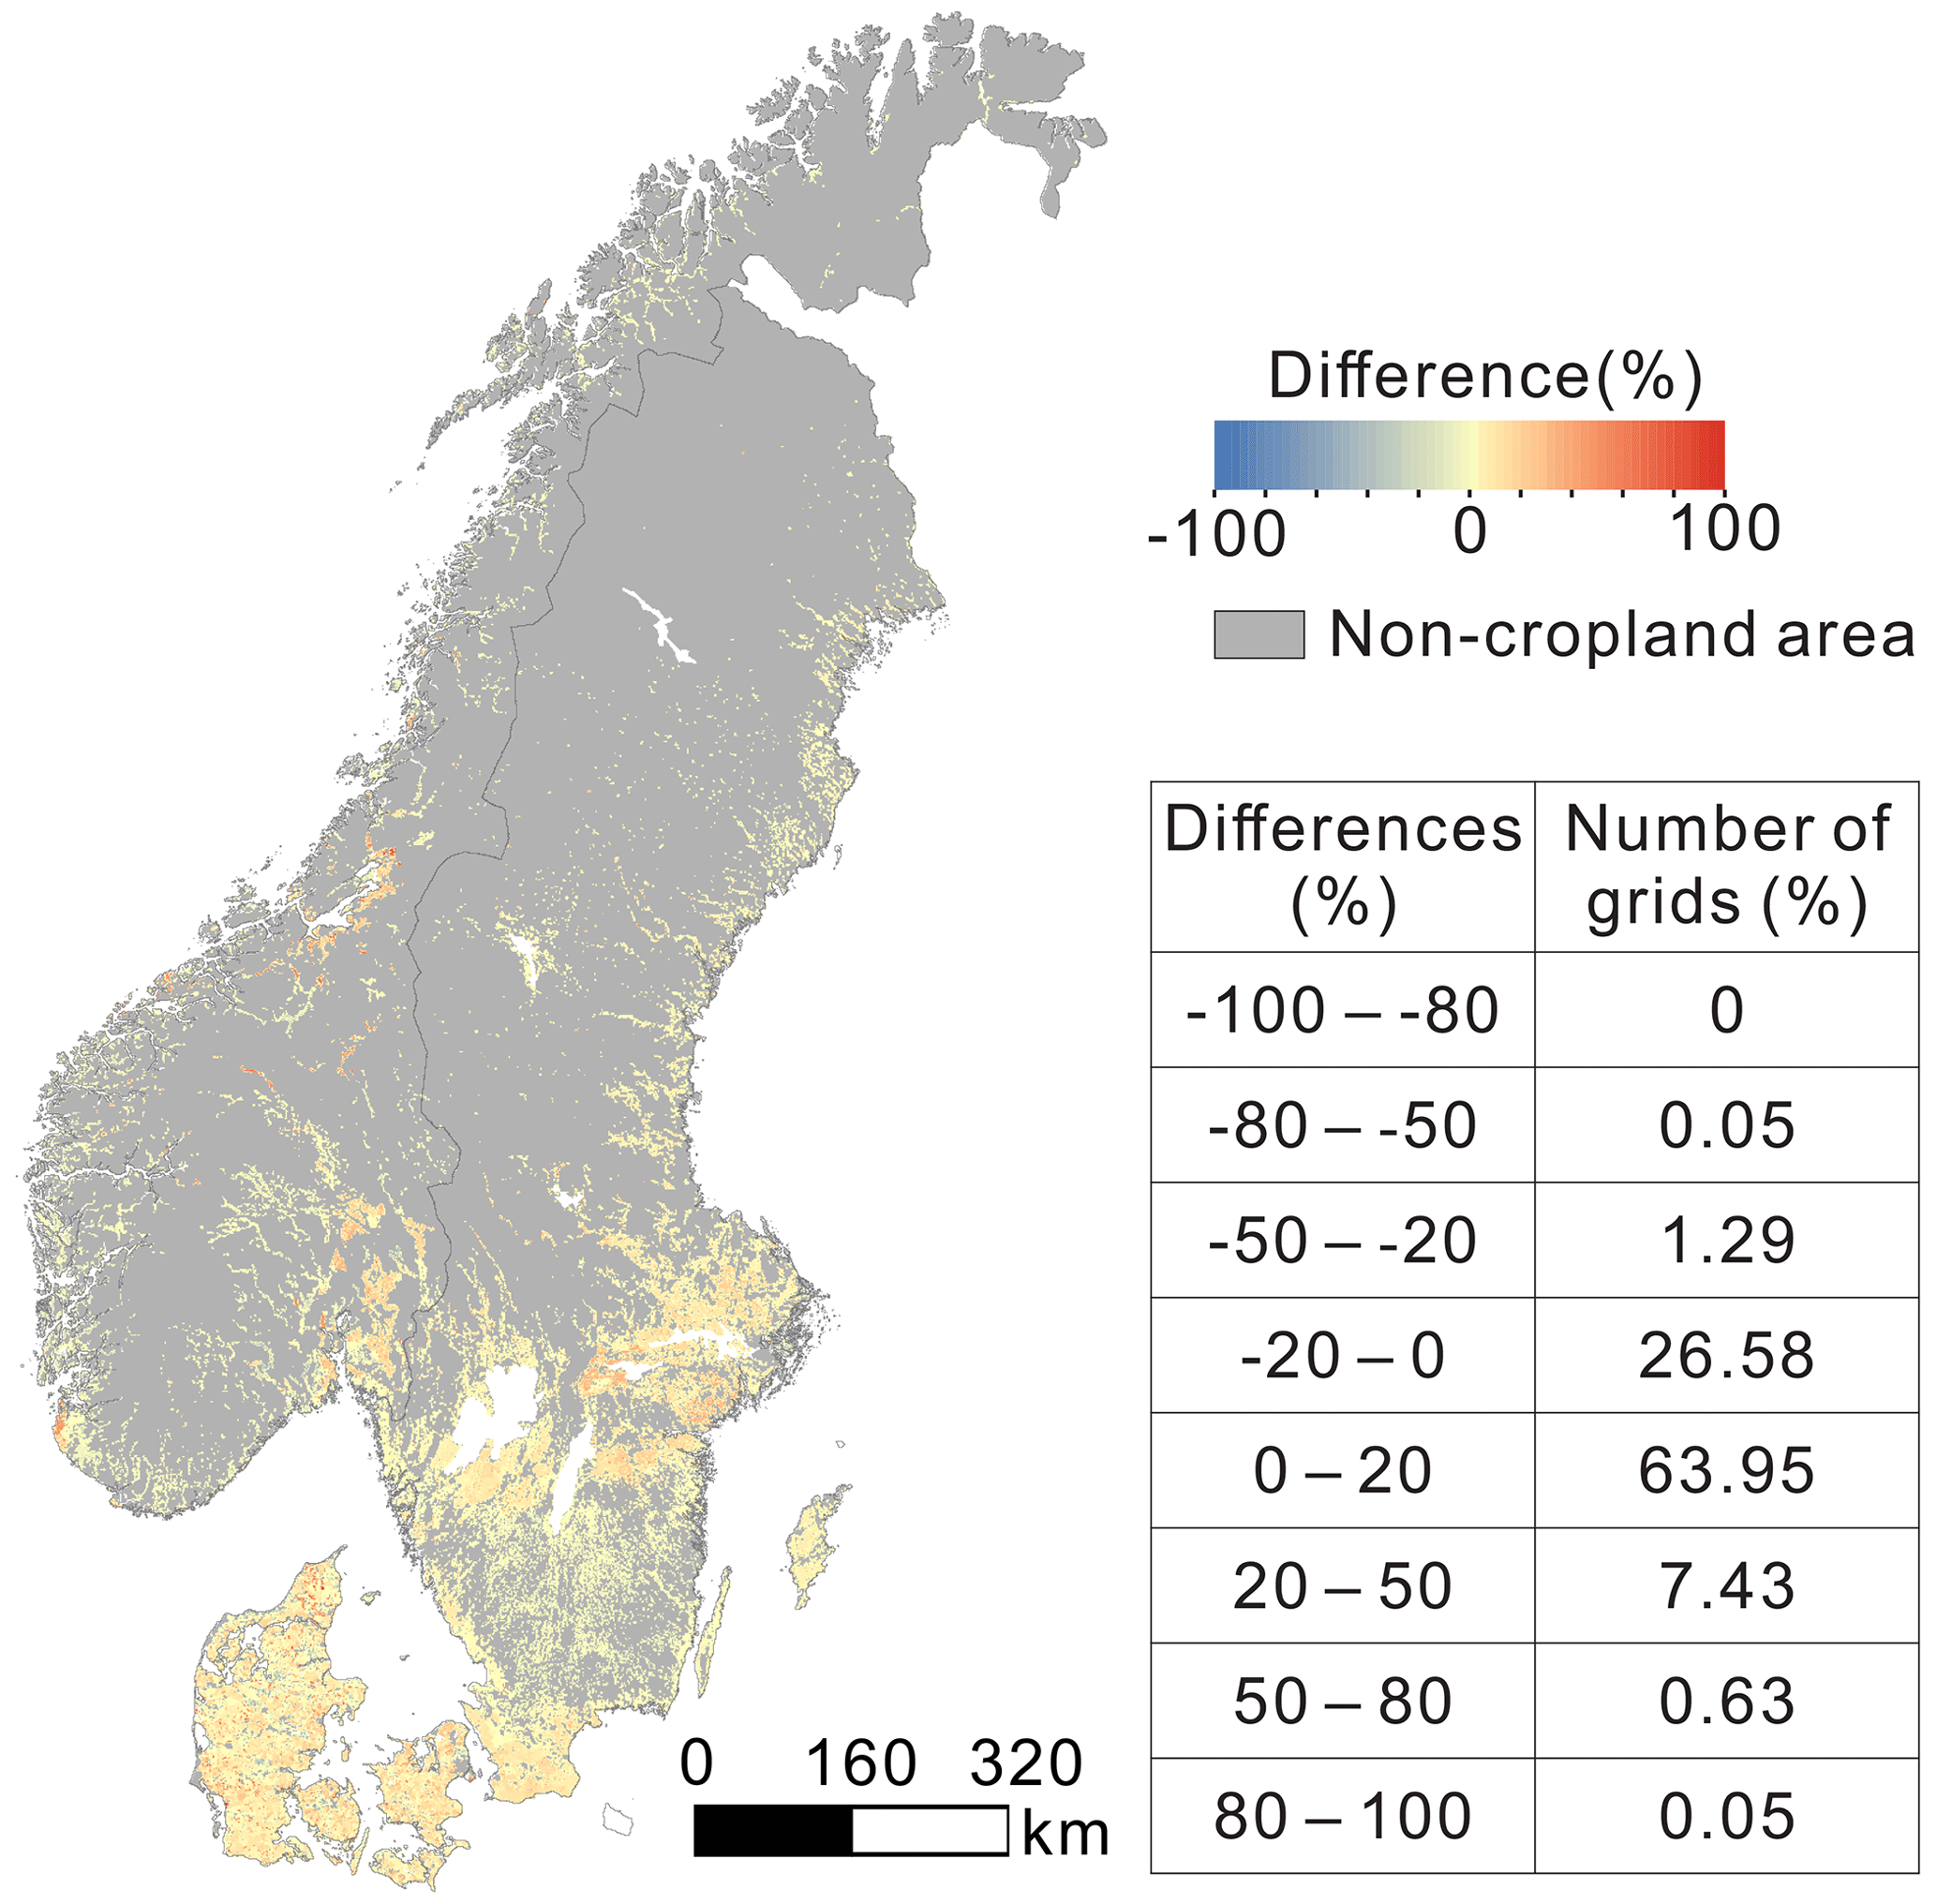
Figure 9Comparison of the grid-based cropland area between CLC 2000 and this study.
We also compare the total country level cropland area with that from previously published studies. Because many studies of historical agriculture in Norway and Denmark are also statistically based, cropland areas before 1980 are available only in Sweden. This study's cropland area is similar to the data from previous studies (R2=0.967; slope = 1.05), which indicates the reliability of the results in this study (Fig. 10). Because the studies of Anderberg (1991), Lindstad (2002), and Groth et al. (1998) provided the cultivated land area but not the cropland area, their data show slightly larger areas than the data observed in this study.
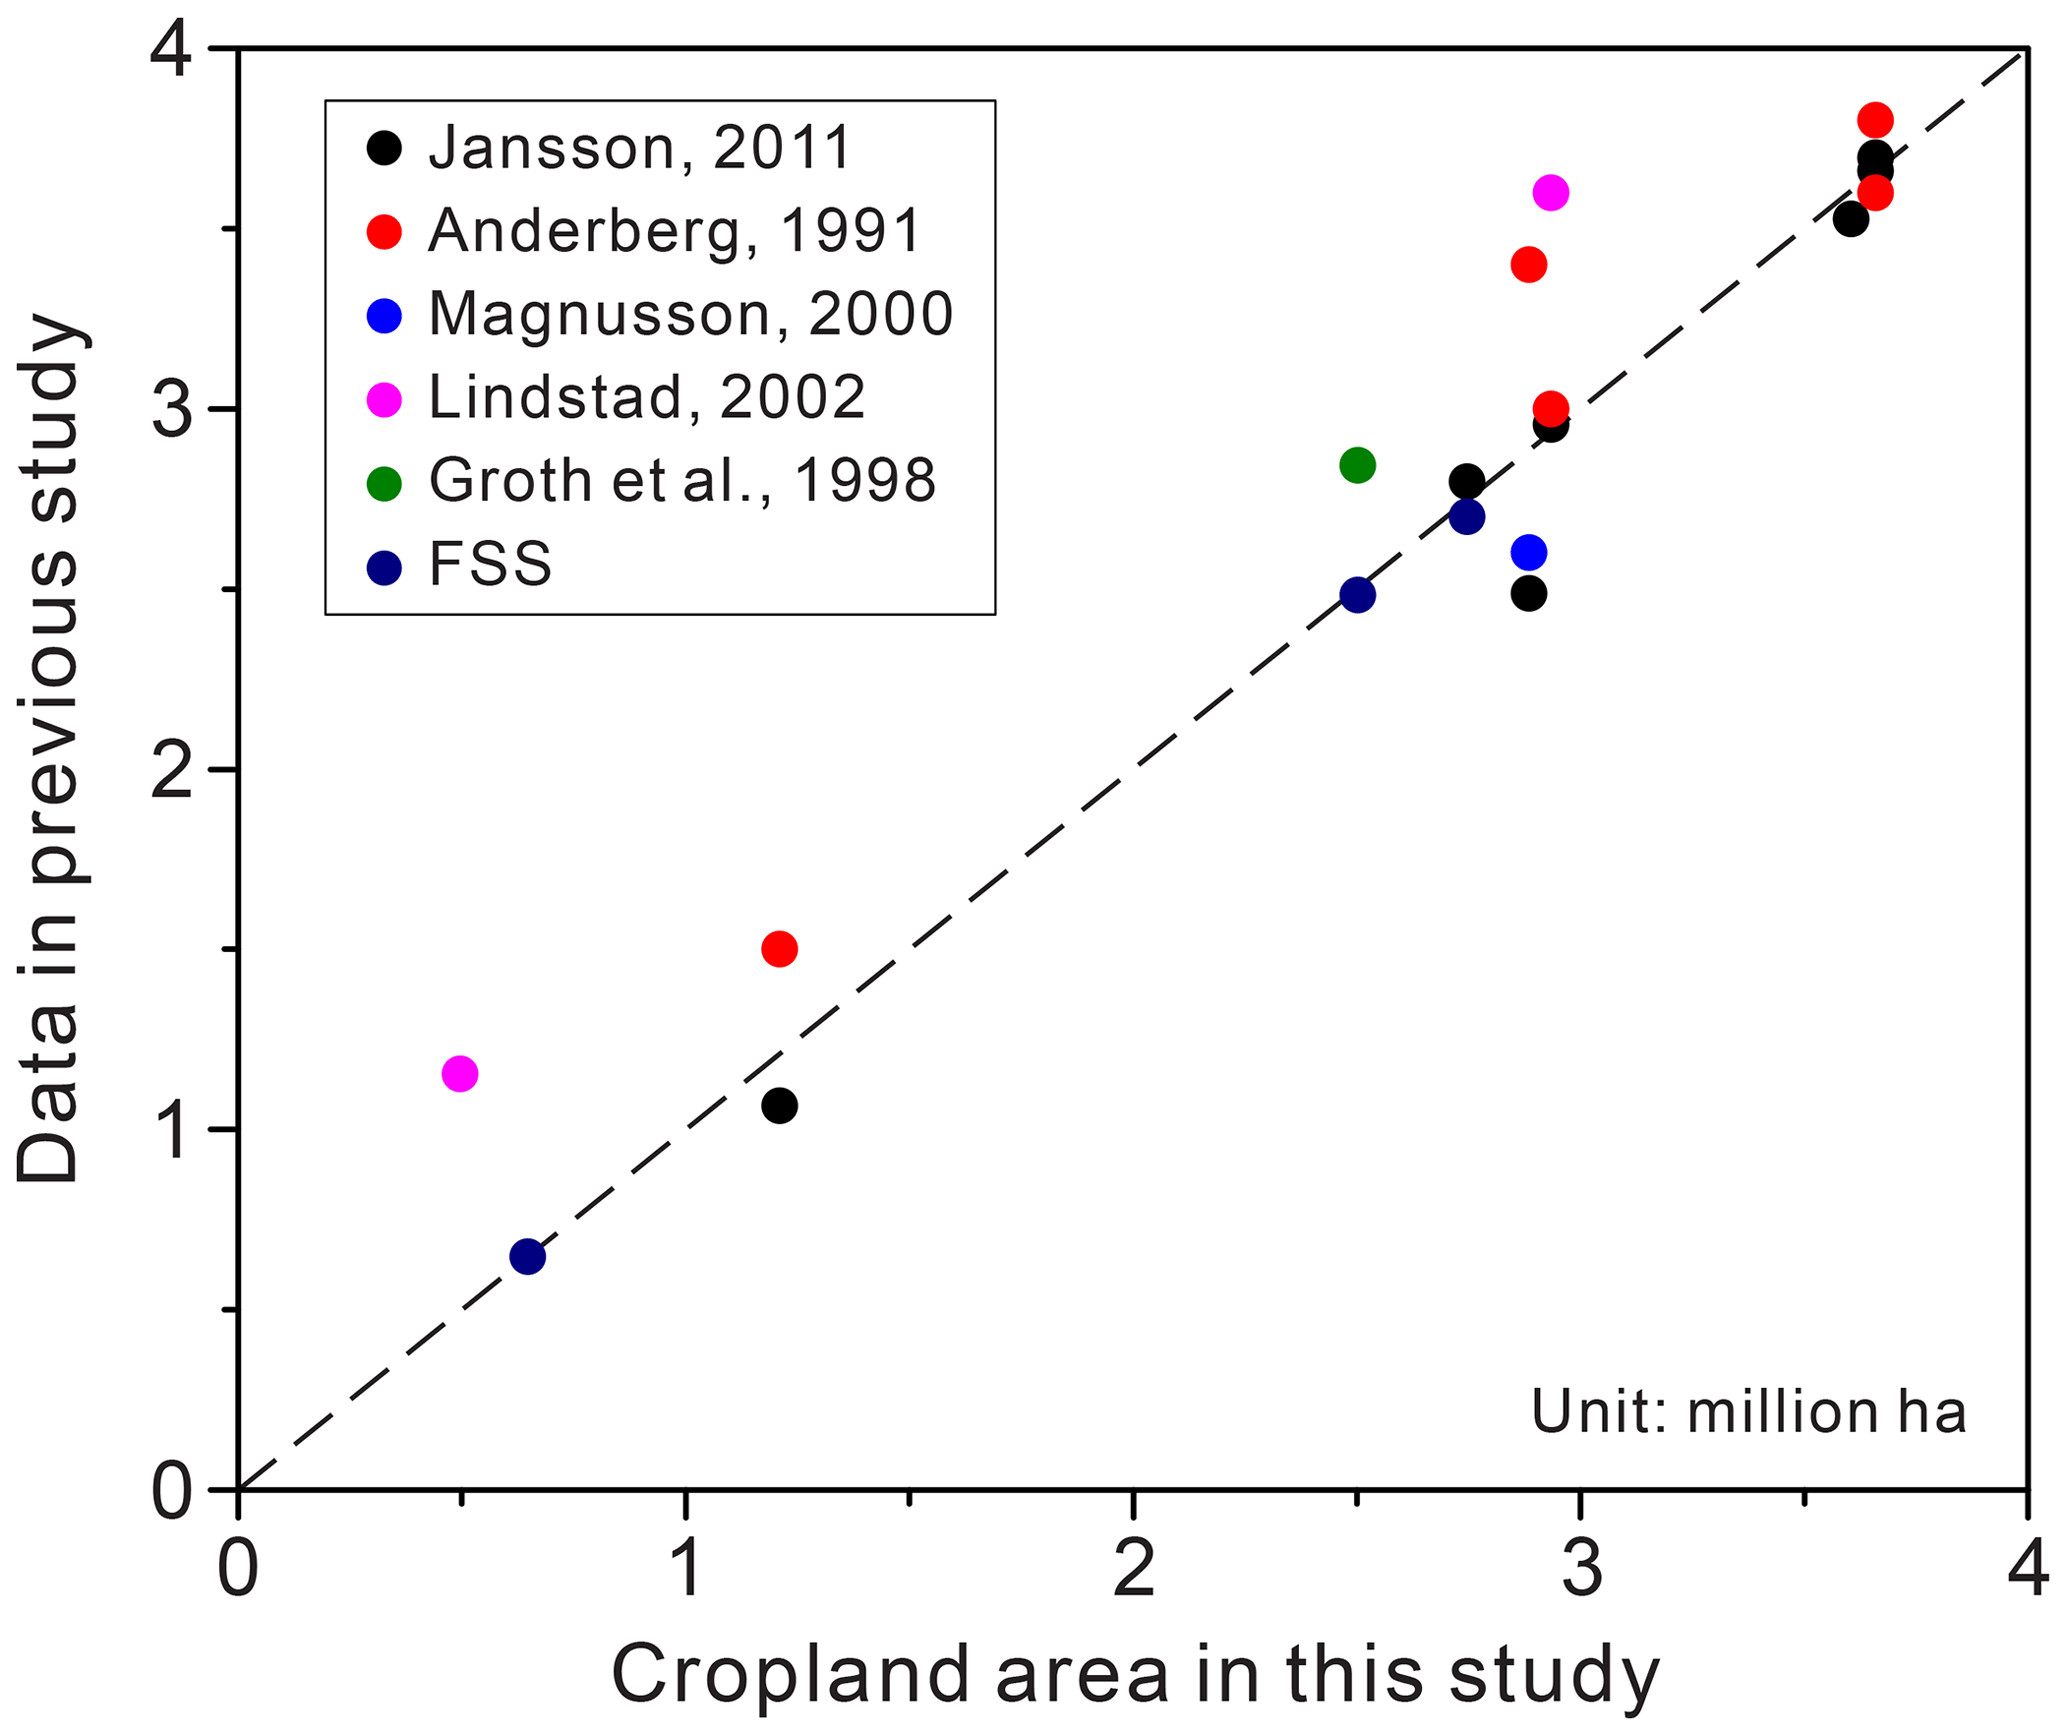
Figure 10Comparison of the cropland data from previous studies and this study.
Several missing data are interpolated in Denmark in 1688, 1750, 1800, and 1881 using the cropland fractions of their neighbors and the linear interpolation method. These interpolation methods are also used by Ramankutty and Foley (1999), Ye et al. (2015), Wei et al. (2016), He et al. (2017), Li et al. (2018), and Yu and Lu (2018). However, their interpolated data did not reduce the credibility of their datasets. As satellite-based data and survey data at the parish level are unavailable from 1688 to 1881, the interpolated data are impossible to validate using direct fitted observations. Based on the study of Fang et al. (2020), three methods can be used to assess the credibility of historical land cover datasets, including accuracy assessment (quantitative assessment based on quantitatively reconstructed regional land cover data), rationality assessment (qualitative assessment, including the regional historical fact-based rationality assessment and the expertise-based rationality assessment), and likelihood assessment (the credibility of the land cover data for given spatial or temporal units is inferred according to the degree of consistency in land cover data extracted from multiple datasets). Apart from the data sources we used, other quantitatively reconstructed regional land cover data in Denmark from 1688 to 1881 are unavailable. As a result, we employ a regional historical fact-based rationality assessment to analyze the reliability of our interpolated data in Denmark. The following Danish history suggests that linearly interpolated data are reasonable. The national tax system stipulated that each household in Denmark had 20 ha of cropland, no more and no less. The population of Denmark grew steadily from 1690 to 1881. During this period, wars did not cause sudden changes in cropland area in Denmark. The agricultural reform that began in 1789 changed the relationship between landlords and tenant farmers. But it did not cause a sudden change in cropland area (Jespersen, 2018).
5.1 Comparison with global datasets
To show the improvement made by our dataset, four widely used global datasets, HYDE 3.2 (Klein Goldewijk et al., 2017), SAGE (Ramankutty and Foley, 1999), PJ (Pongratz et al., 2007), and KK10 (Kaplan et al., 2011), are selected to compare with our results. As KK10 only provides the sum of cropland and pasture area data, it is much larger than the total cropland area from other studies (Fig. 11). For Scandinavia, the total cropland area from this study is between that from the HYDE 3.2 and PJ results. However, differences are apparent at the country level, especially in Norway and Denmark. For Sweden, though cropland areas are close to those from different datasets before 1810, the PJ results indicate areas far smaller than those from HYDE 3.2 and this study after 1875. The PJ dataset is close to the SAGE dataset because the cropland data source in the PJ dataset for Scandinavia is from SAGE dataset over the period of 1700–1992.

Figure 11Comparison of the total cropland area among SAGE, HYDE3.2, PJ, KK10, and this study.
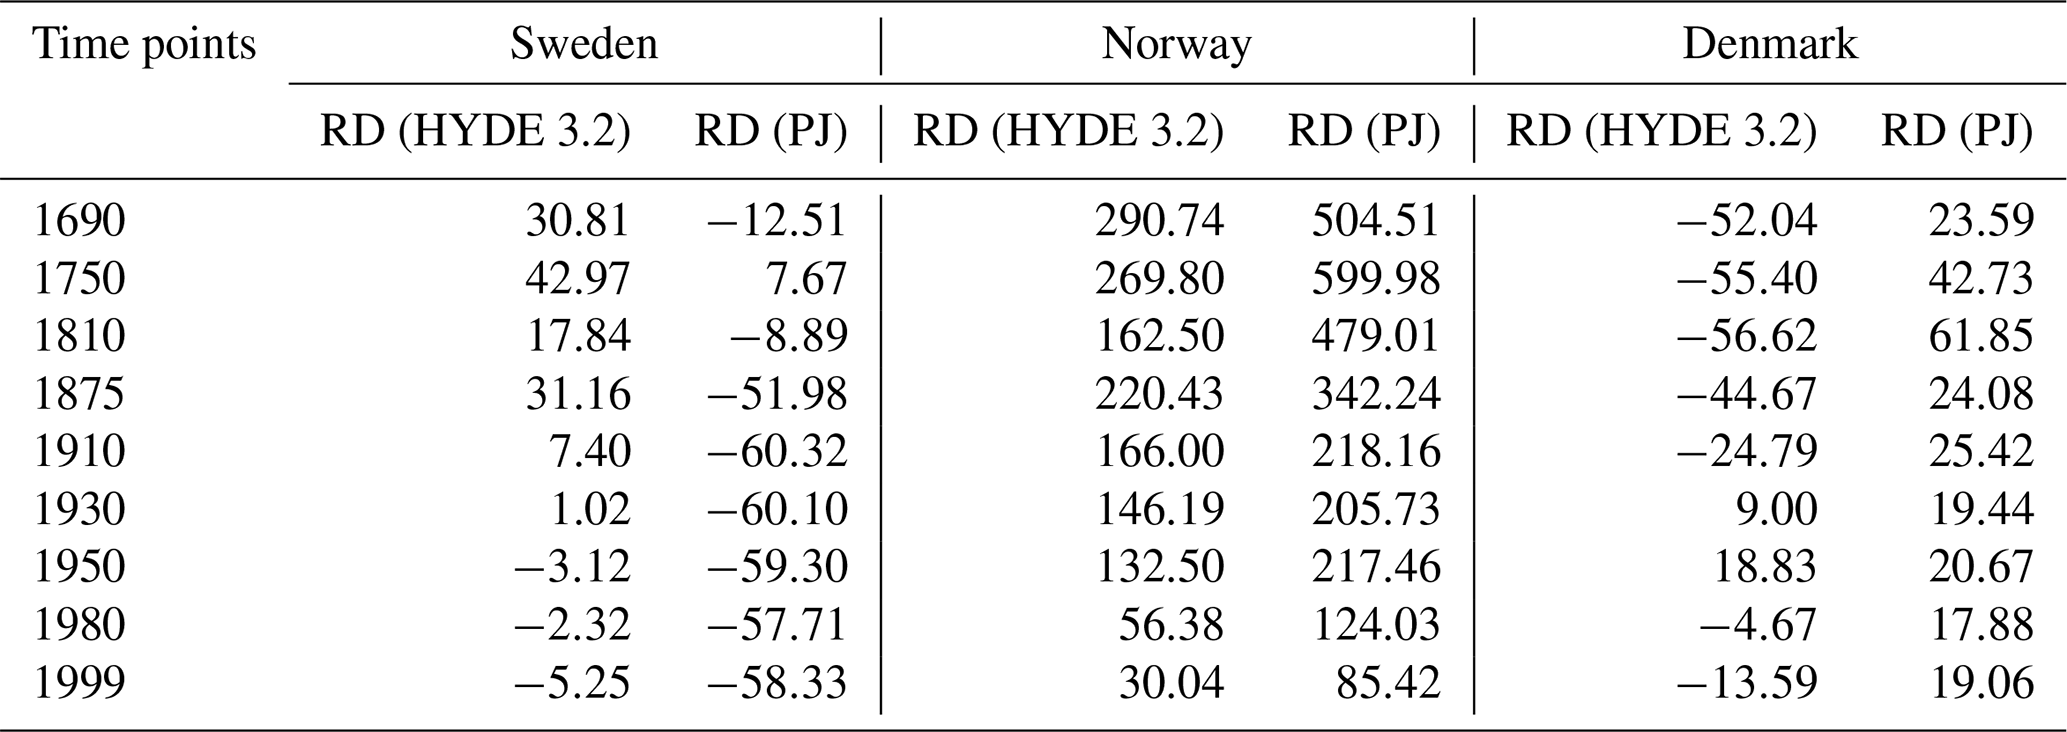
Compared with HYDE 3.2, large differences are found during 1690–1875 in Sweden and Denmark and at all time points in Norway. Although the RD between PJ and this study is close before 1810 in Sweden and after 1875 in Denmark, it is even larger than that between HYDE 3.2 and this study in Norway. The PJ dataset overestimates the total cropland area in Norway and Denmark and after 1875 in Sweden. HYDE 3.2 also overestimates the total cropland area in Norway but underestimates it before 1910 and after 1980 in Denmark compared with this study (Table 3). Different definitions of cropland in Norway cause cropland area overestimation in Norway by HYDE 3.2 and PJ. Based on the FSS data, we infer that some permanent meadow area is included in the cropland land area by HYDE 3.2 and PJ datasets.
Table 3Relative difference ratio (RD, unit %) between global datasets and this study.
We select time points with RDs <30 % to compare spatial patterns of cropland distribution from PJ, HYDE 3.2, and this study. PJ has a spatial resolution of 0.5∘ × 0.5∘, but HYDE 3.2's resolution is . To reduce the resampling error, cropland area data from this study are aggregated to 0.5∘ × 0.5∘ and 10 km×10 km to compare with PJ and the resampled HYDE 3.2, respectively. For Sweden, although the differences in total cropland area during 1690–1810 from PJ and this study are small, the spatial patterns of cropland distribution vary substantially. Based on the PJ dataset, more cropland is shown in northern Sweden and Skåne, but the cropland area around lakes Vänern, Vättern, Mälaren, and Hjälmaren in southern Sweden is less than that in this study. For Denmark, more cropland area is allocated in western and southeastern Denmark by PJ, but cropland area in northern and southwestern Denmark is scarce (Fig. 12), which is inconsistent with the facts. Because the land in eastern Denmark is more conducive to cultivation than that in the west, the eastern cropland area gradually decreased with urbanization development. Increased afforestation and the need for urban expansion steadily reduced the agricultural area in eastern Denmark (Pedersen and Møllenberg, 2017).
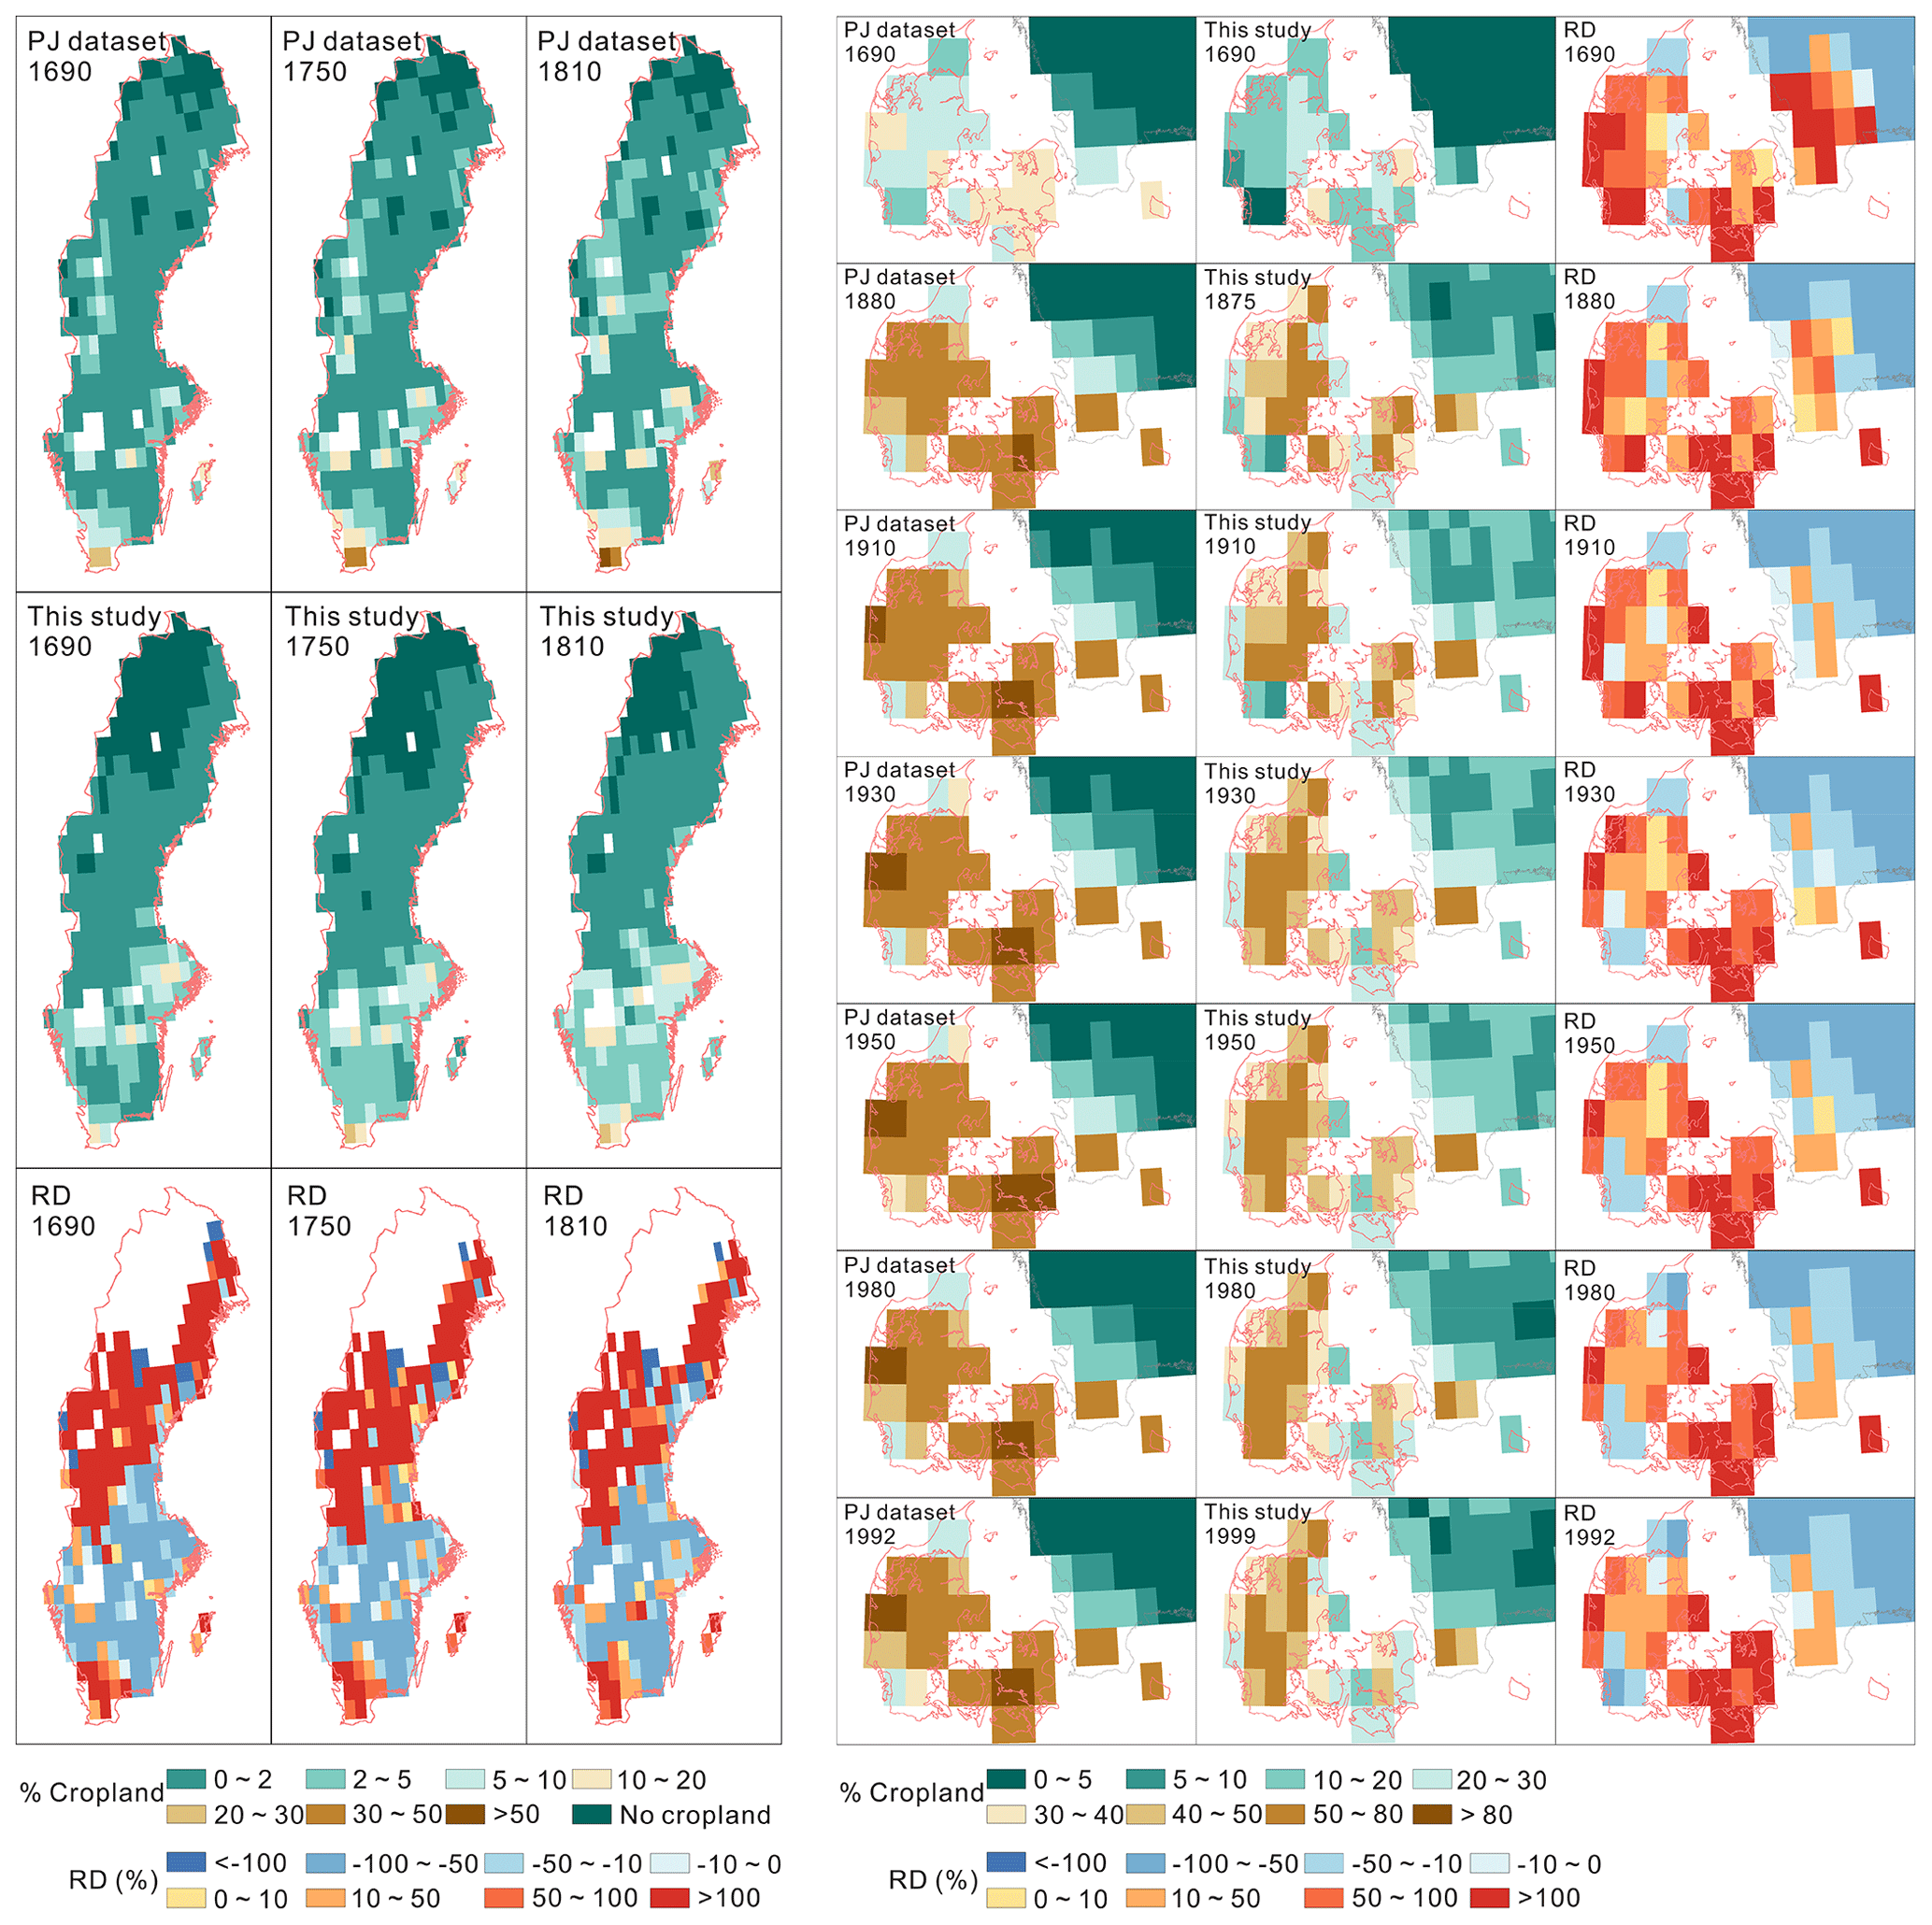
Figure 12Comparison of the spatial distribution of cropland area between PJ and this study (the left figure is the comparison in Sweden, and the right one is the comparison in Denmark).
Although spatial cropland patterns are in agreement in Sweden between HYDE 3.2 and this study, around the lakes Vänern, Vättern, Mälaren, and Hjälmaren and in the northeast coastal area there is significantly more cropland area in HYDE 3.2 than in this study. However, in Blekinge, Halland, Jönköping, Kalmar, and Kronoberg counties in southern Sweden, there is less cropland area in HYDE 3.2 than in this study. Moreover, no cropland area is allocated in northern Sweden from HYDE 3.2, but statistics show that this area has cropland. The number of grid cells with an RD more than 50 % or less than −50 % account for 53 %–64 % of the total grid cells from 1810 to 1999 (Fig. 13). There is little difference in the spatial patterns of cropland from 1910 to 1999 for Denmark between HYDE 3.2 and this study (Fig. 14). RDs of most grid cells are between −50 % and 50 %. The number of grid cells with RDs between −10 % and 10 % account for approximately 40 % of the total grid cells in 1980 and 1999, because Denmark has a small land area and most land has been cultivated intensely. Moreover, the topographical differences within Denmark are relatively small. Thus, although HYDE 3.2 used the national cropland area, the cropland area allocation errors are small in Denmark.

Figure 13Comparison of the spatial distribution of cropland area between HYDE 3.2 and this study in Sweden.

Figure 14Comparison of the spatial distribution of cropland area between HYDE 3.2 and this study in Denmark.
5.2 Uncertainties
To develop the cropland area dataset in Scandinavia from 1690 to 1999, we have used many methods to ensure data accuracy. However, there are still uncertainties in this work. First, our cropland is defined as the sum of arable land and land under permanent crops. Arable land comprises areas under temporary crops, temporary meadows and pastures, and land that is temporarily fallow. Although the temporarily fallow and permanent crop areas account for a small proportion of the total cropland area, the absence of records about the size of fallow land makes our cropland smaller than the real value before 1875 in Sweden and Norway. Second, we use elevation and slope as factors that affect the spatial distribution of cropland, which may allocate a smaller amount of cropland area to grids that could not have cropland historically. This may induce the historical spatial patterns of cropland that is insufficiently concentrated, especially in northern Scandinavia. In Sweden and Denmark, the cropland area reached its maximum in 1950 and decreased after 2000. Because there is no satellite-based land use data in 1950, the maximum extent constraints are defined based on the CLC 2000 data in our cropland area allocation model. The spatial pattern of cropland based on the CLC 2000 data is smaller than the real maximum pattern. In administrative units where our reconstructed cropland areas are larger than those from the CLC 2000, we allocate the extra cropland area to Pastures, “Artificial, non-agricultural vegetated areas”, “Industrial, commercial and transport units”, and “Forests within 1 km of arable land and pastures” in turn. However, the current method cannot obtain grid-based cropland data that are in agreement with the real value in history. Failure to use settlements in the cropland area allocation model also introduces errors into our grid-based dataset. Third, the land area of different levels of administrative unit varies greatly. Especially in Sweden, even for the same level of administrative unit, the land areas are very different. For example, the land area of Jokkmokk Parish (socken) is almost 500 times larger than that of Brunnby Parish (socken). Using the same model to allocate cropland area of different levels of administrative unit to 1 km grid cells may also increase the error in cropland area allocation. Therefore, in future studies, according to different levels of administrative unit, different cropland area allocation models should be used to improve the accuracy of historical grid-based cropland maps in Scandinavia. Moreover, because the earliest satellite-based land cover maps at a 30 m resolution are from 2000, we only validate our cropland data in 1999. Cultivated pasture, greenhouse land, and other economic croplands are included in the cultivated land of GlobeLand30, and it is 1.4 times larger than our cropland area. Though cultivated pasture is not included in the cropland area from CLC 2000, it is also larger than our cropland area in 1999, reflecting the underestimation of our cropland data based on statistics.
All cropland cover data for 1690, 1750, 1810, 1875, 1910, 1930, 1950, 1980, and 1999 at a spatial resolution of 1 km are available at https://doi.org/10.1594/PANGAEA.926591 (Wei et al., 2021).
Based on the collected cropland data of each administrative unit from statistics and previous studies, we develop the cropland area dataset at a spatial resolution of 1 km in Scandinavia from 1690 to 1999, using a range of data processing and cropland area allocation methods. Our reconstruction indicates that the cropland area developed slowly before 1810, then increased rapidly until the beginning of the 20th century, and remained stable for around 40 years before declining in 1999. At the country level, the cropland area change trends in Sweden and Denmark were almost identical to that in Scandinavia. The cropland areas of both Sweden and Denmark reached a peak in 1950. Norway had the least cropland area, which increased gradually from 1690 to 1999. The spatial patterns of cropland distribution show that Denmark and southern Sweden already had extensive cropland cover in 1690. In the following 100 years, cropland expanded in southern Scandinavia and remained stable in the north. During 1910–1950 the cropland area changed slightly but began to decrease in southern and eastern Scandinavia after 1950.
The statistically based accuracy of our grid-based cropland dataset has been validated by comparison with satellite-based data (GlobeLand30 and CLC 2000) in 2000, although our cropland area is slightly smaller than that from satellite-based data. Comparing our dataset with global datasets shows that KK10 has a much larger total cropland area than this study in Scandinavia. Although the total cropland area is in agreement in Scandinavia among HYDE 3.2, PJ, and this study, more considerable differences are found in cropland areas at the country level. The differences in cropland spatial patterns are also non-negligible, even at time points where the total cropland area differences are small in Sweden and Denmark between PJ and this study. HYDE 3.2 allocates more cropland area to highly cultivated regions in Sweden but has a lower cropland area between the highly cultivated regions in southern Sweden.
Although some cropland area allocation errors introduce uncertainties with our reconstruction, this study improves descriptions of historical cropland change in Scandinavia. Our cropland dataset is an essential reference for a better understanding of the complex climate system.
The supplement related to this article is available online at: https://doi.org/10.5194/essd-13-3035-2021-supplement.
XW, MW, and BL designed the work. XW wrote the manuscript. XF, YY, and TC provided suggestions on structure and methods. CZ helped with downloading some data for cropland allocation. All the authors contributed to the review of the manuscript.
The authors declare that they have no conflict of interest.
Publisher's note: Copernicus Publications remains neutral with regard to jurisdictional claims in published maps and institutional affiliations.
We thank Peder Dam from Odense City Museums and Pia Frederiksen from Aarhus University for providing us cropland data of Denmark in 1688, 1800, 1881, and 1998, and we thank Ulf Jansson for providing an administrative map of Sweden in 1750.
This research has been supported by the National Key R&D Program of China (grant no. 2017YFA0603304), the National Science Foundation of China (grant nos. 41807433 and 41972193), the Basic Research Program (Natural Science Foundation) of Jiangsu Province (grant no. K20180804), and the Fund of the China Scholarship Council (grant no. 201406040148).
This paper was edited by David Carlson and reviewed by two anonymous referees.
Almås, R.: Norwegian Agricultural History, Tapir Academic Press, Trondheim, 2004.
Anderberg, S.: Historical Land Use Changes: Sweden, In: Brouwer, F., Thomas, A., and Chadwick, M. (Eds.): Land Use Change in Europe, Processes of Change, Environmental Transformations and Future Patterns, Springer Science+Business Media, B.V., Dordrecht, 1991.
Arora, V. K. and Boer, G. J.: Uncertainties in the 20th century carbon budget associated with land use change, Global Change Biol., 16, 3327–3348, https://doi.org/10.1111/j.1365-2486.2010.02202.x, 2010.
Aschehoug, T. H.: Statistiske studier over folkemængde og jordbrug i Norges landdistrikter i det syttende og attende aarhundrede, Kristiania, Oslo, 1890.
Aschehoug, T. H.: Statistiske oversigter 1914, Kristiania, Oslo, 1914.
Brovkin, V., Boysen, L., Arora, V. K., Boisier, J. P., Cadule, P., Chini, L., Claussen, M., Friedlingstein, P., Gayler, V., van den Hurk, B. J. J. M., Hurtt, G. C., Jones, C. D., Kato, E., de Noblet-Ducoudré, N., Pacifico, F., Pongratz, J., and Weiss, M.: Effect of Anthropogenic Land-Use and Land-Cover Changes on Climate and Land Carbon Storage in CMIP5 Projections for the Twenty-First Century, J. Climate, 26, 6859–6881, https://doi.org/10.1175/JCLI-D-12-00623.1, 2013.
Büttner, G.: CORINE land cover and land cover change products. In Land use and land cover mapping in Europe, Springer, Dordrecht, 55–74 pp., 2014.
Cardarelli, F.: Encyclopaedia of Scientific Units, Weights and Measures, Springer, London, 2003.
Chen, J., Ban, Y., and Li, S.: Open access to Earth land-cover map, Nature, 514, 434, https://doi.org/10.1038/514434c, 2014.
Clark, P. European Cities and Towns 400–2000, Oxford University Press, New York, 2009.
Cui, Q., Gaillard, M., Lemdahl, G., Stenberg, L., Sugita, S., and Zernova, G.: Historical land-use and landscape change in southern Sweden and implications for present and future biodiversity, Ecol. Evol., 4, 3555–3570, https://doi.org/10.1002/ece3.1198, 2014.
Dam, P. and Jakobsen, J. G. G.: Atlas over Danmark: Historisk-Geografisk Atlas, Det Kongelige Danske Geografiske Selskab, København, 2008.
Danmarks Statistik: Statistisk Årbog 1912, H. H. Thieles Bogtrykkeri, København, 1912.
Danmarks Statistik: Statistiske Meddelelser 1936, Bianco Lunos Bogtrykkeri A/S, København, 1936.
Danmarks Statistik: Statistiske Meddelelser 1950, Bianco Lunos Bogtrykkeri A/S, København, 1950.
Danmarks Statistik: Statistiske Meddelelser 1980, Bianco Lunos Bogtrykkeri A/S, København, 1980.
Ellis, E. C., Antill, E. C., and Kreft, H.: All is not loss: plant biodiversity in the anthropocene, PLoS One, 7, e30535, https://doi.org/10.1371/journal.pone.0030535, 2012.
Eriksson, O. and Cousins, S.: Historical Landscape Perspectives on Grasslands in Sweden and the Baltic Region, Land, 3, 300–321, https://doi.org/10.3390/land3010300, 2014.
Fang, X., Zhao, W., Zhang, C., Zhang, D., Wei, X., Qiu, W., and Ye, Y.: Methodology for credibility assessment of historical global LUCC datasets, Science China Earth Sciences, 63, 1013–1025, https://doi.org/10.1007/s11430-019-9555-3, 2020.
Feranec, J., Jaffrain, G., Soukup, T., and Hazeu, G.: Determining changes and flows in European landscapes 1990–2000 using CORINE land cover data, Appl. Geogr., 30, 19–35, https://doi.org/10.1016/j.apgeog.2009.07.003, 2010.
Findell, K. L., Berg, A., Gentine, P., Krasting, J. P., Lintner, B. R., Malyshev, S., Santanello Jr., J. A., and Shevliakova, E.: The impact of anthropogenic land use and land cover change on regional climate extremes, Nat. Commun., 8, 989, https://doi.org/10.1038/s41467-017-01038-w, 2017.
Foley, J. A., Defries, R., Asner, G. P., Barford, C., Bonan, G., Carpenter, S. R., Chapin, F. S., Coe, M. T., Daily, G. C., Gibbs, H. K., Helkowski, J. H., Holloway, T., Howard, E. A., Kucharik, C. J., Monfreda, C., Patz, J. A., Prentice, I. C., Ramankutty, N., and Snyder, P. K.: Global consequences of land use, Science, 309, 570–574, https://doi.org/10.1126/science.1111772, 2005.
Foley, J. A., Ramankutty, N., Brauman, K. A., Cassidy, E. S., Gerber, J. S., Johnston, M., Mueller, N. D., O'Connell, C., Ray, D. K., West, P. C., Balzer, C., Bennett, E. M., Carpenter, S. R., Hill, J., Monfreda, C., Polasky, S., Rockstrom, J., Sheehan, J., Siebert, S., Tilman, D., and Zaks, D. P.: Solutions for a cultivated planet, Nature, 478, 337–342, https://doi.org/10.1038/nature10452, 2011.
Friedlingstein, P., O'Sullivan, M., Jones, M. W., Andrew, R. M., Hauck, J., Olsen, A., Peters, G. P., Peters, W., Pongratz, J., Sitch, S., Le Quéré, C., Canadell, J. G., Ciais, P., Jackson, R. B., Alin, S., Aragão, L. E. O. C., Arneth, A., Arora, V., Bates, N. R., Becker, M., Benoit-Cattin, A., Bittig, H. C., Bopp, L., Bultan, S., Chandra, N., Chevallier, F., Chini, L. P., Evans, W., Florentie, L., Forster, P. M., Gasser, T., Gehlen, M., Gilfillan, D., Gkritzalis, T., Gregor, L., Gruber, N., Harris, I., Hartung, K., Haverd, V., Houghton, R. A., Ilyina, T., Jain, A. K., Joetzjer, E., Kadono, K., Kato, E., Kitidis, V., Korsbakken, J. I., Landschützer, P., Lefèvre, N., Lenton, A., Lienert, S., Liu, Z., Lombardozzi, D., Marland, G., Metzl, N., Munro, D. R., Nabel, J. E. M. S., Nakaoka, S.-I., Niwa, Y., O'Brien, K., Ono, T., Palmer, P. I., Pierrot, D., Poulter, B., Resplandy, L., Robertson, E., Rödenbeck, C., Schwinger, J., Séférian, R., Skjelvan, I., Smith, A. J. P., Sutton, A. J., Tanhua, T., Tans, P. P., Tian, H., Tilbrook, B., van der Werf, G., Vuichard, N., Walker, A. P., Wanninkhof, R., Watson, A. J., Willis, D., Wiltshire, A. J., Yuan, W., Yue, X., and Zaehle, S.: Global Carbon Budget 2020, Earth Syst. Sci. Data, 12, 3269–3340, https://doi.org/10.5194/essd-12-3269-2020, 2020.
Fuchs, R., Herold, M., Verburg, P. H., Clevers, J. G., and Eberle, J.: Gross changes in reconstructions of historic land cover/use for Europe between 1900 and 2010, Global Change Biol,, 21, 299–313, https://doi.org/10.1111/gcb.12714, 2015.
Gadd, C.: The Agricultural Revolution in Sweden, 1700–1870, in: The Agrarian History of Sweden, from 4000 bc to ad 2000, edited by: Myrdal, J. and Morell, M., Nordic Academic Press, Lund, 2011.
Gaillard, M. J. and LandCover6k Interim Steering Group members: LandCover6k: Global anthropogenic land-cover change and its role in past climate, Past Global Change Magazine, 23, 38–39, 2015.
Gasser, T., Crepin, L., Quilcaille, Y., Houghton, R. A., Ciais, P., and Obersteiner, M.: Historical CO2 emissions from land use and land cover change and their uncertainty, Biogeosciences, 17, 4075–4101, https://doi.org/10.5194/bg-17-4075-2020, 2020.
Groth, N. B., Hedegaard, M. B., Holmberg, T., Höll, A., and Skov-Petersen, H.: Arealanvendelsen i Danmark 1995–2025. By- og Landsplanserien Nr. 2, Forskningscenter for Skov & Landskab, Copenhagen, 1998.
Gustavsson, E., Lennartsson, T., and Emanuelsson, M.: Land use more than 200 years ago explains current grassland plant diversity in a Swedish agricultural landscape, Biol. Conserv., 138, 47–59, https://doi.org/10.1016/j.biocon.2007.04.004, 2007.
He, F., Li, M., and Li, S.: Reconstruction of Lu-level cropland areas in the Northern Song Dynasty (AD976-1078), J. Geogr. Sci., 27, 606–618, https://doi.org/10.1007/s11442-017-1395-3, 2017.
Hovland, E.: Åkerbruket i Norge i begynnelsen av 1800-tallet, Historisk Tidsskrift 57, 331–346, 1978.
Hurtt, G. C., Chini, L. P., Frolking, S., Betts, R. A., Feddema, J., Fischer, G., Fisk, J. P., Hibbard, K., Houghton, R. A., Janetos, A., Jones, C. D., Kindermann, G., Kinoshita, T., Klein Goldewijk, K., Riahi, K., Shevliakova, E., Smith, S., Stehfest, E., Thomson, A., Thornton, P., van Vuuren, D. P., and Wang, Y. P.: Harmonization of land-use scenarios for the period 1500–2100: 600 years of global gridded annual land-use transitions, wood harvest, and resulting secondary lands, Clim. Change, 109, 117–161, https://doi.org/10.1007/s10584-011-0153-2, 2011.
Jacks, G.: Drainage in Sweden -the past and new developments, Acta Agriculture Scandinavica, Section B-Soil & Plant Science, 69, 405–410, https://doi.org/10.1080/09064710.2019.1586991, 2019.
Jansson, U.: Agriculture and forestry in Sweden since 1900: a cartographic description. National atlas of Sweden, Royal Swedish Academy of Agriculture and Forestry, Stockholm, 2011.
Jespersen, K. J. V.: A history of Denmark (Macmillan essential histories), Red Globe Press, New York, 2018.
Kaplan, J. O., Krumhardt, K. M., and Zimmermann, N.: The prehistoric and preindustrial deforestation of Europe, Quaternary Sci. Rev., 28, 3016–3034, https://doi.org/10.1016/j.quascirev.2009.09.028, 2009.
Kaplan, J. O., Ruddiman, W. F., Crucifix, M. C., Oldfield, F. A., Krumhardt, K. M., Ellis, E. C., Ruddiman, W. F., Lemmen C., and Klein Goldewijk, K.: Holocene carbon emissions as a result of anthropogenic land cover change, Holocene, 21, 775–791, https://doi.org/10.1177/0959683610386983, 2011.
Kaplan, J., Krumhardt, K., Gaillard, M.-J., Sugita, S., Trondman, A.-K., Fyfe, R., Marquer, L., Mazier, F., and Nielsen, A.: Constraining the Deforestation History of Europe: Evaluation of Historical Land Use Scenarios with Pollen-Based Land Cover Reconstructions, Land, 6, 91, https://doi.org/10.3390/land6040091, 2017.
Klein Goldewijk, K.: Estimating global land use change over the past 300 years: The HYDE Database, Global Biogeochem. Cycles, 15, 417–433, https://doi.org/10.1029/1999GB001232, 2001.
Klein Goldewijk, K. and Verburg, P. H.: Uncertainties in global-scale reconstructions of historical land use: an illustration using the HYDE data set, Landscape Ecol., 28, 861–877, https://doi.org/10.1007/s10980-013-9877-x, 2013.
Klein Goldewijk, K., Beusen, A., Van Drecht, G., and De Vos, M.: The HYDE 3.1 spatially explicit database of human-induced global land-use change over the past 12,000 years, Global Ecol. Biogeogr., 20, 73–86, https://doi.org/10.1111/j.1466-8238.2010.00587.x, 2011.
Klein Goldewijk, K., Beusen, A., Doelman, J., and Stehfest, E.: Anthropogenic land use estimates for the Holocene – HYDE 3.2, Earth Syst. Sci. Data, 9, 927–953, https://doi.org/10.5194/essd-9-927-2017, 2017.
Klokk, O.: Oversigt over det norske landbruks utvikling siden 1750, Kristiania, Oslo, 1920.
Lejeune, Q., Davin, E. L., Gudmundsson, L., Winckler, J., and Seneviratne, S. I.: Historical deforestation locally increased the intensity of hot days in northern mid-latitudes, Nat. Clim. Change, 8, 386–390, https://doi.org/10.1038/s41558-018-0131-z, 2018.
Levin, G., Blemmer, M., Gyldenkærne, S., Johannsen, V., Caspersen, O., Petersen, H., Nyed, P., Becker, T., Bruun, H, Fuglsang, M., Münier, B., Bastrup-Birk, A., and Nord-Larsen, T.: Estimating land use/land cover changes in Denmark from 1990–2012, Technical Report from DCE-Danish Centre for Environment and Energy, Aarhus, 38, 2014.
Li, B., Fang, X., Ye, Y., and Zhang, X.: Accuracy assessment of global historical cropland datasets based on regional reconstructed historical data – A case study in Northeast China, Science China Earth Sciences, 53, 1689–1699, https://doi.org/10.1007/s11430-010-4053-5, 2010.
Li, B., Jansson, U., Ye, Y., and Widgren, M.: The spatial and temporal change of cropland in the Scandinavian Peninsula during 1875–1999, Regional Environmental Change, 13, 1325–1336, https://doi.org/10.1007/s10113-013-0457-z, 2013.
Li, M., He, F., Li, S., and Yang, F.: Reconstruction of the cropland cover changes in eastern China between the 10th century and 13th century using historical documents, Sci. Rep.-UK, 8, 13552, https://doi.org/10.1038/s41598-018-31807-6, 2018.
Li, S., He, F., and Zhang, X.: A spatially explicit reconstruction of cropland cover in China from 1661 to 1996, Regional Environmental Change, 16, 417–428, https://doi.org/10.1007/s10113-014-0751-4, 2016.
Li, S., He, F., Zhang, X., and Zhou, T.: Evaluation of global historical land use scenarios based on regional datasets on the Qinghai-Tibet Area, Sci. Total Environ., 657, 1615–1628, https://doi.org/10.1016/j.scitotenv.2018.12.136, 2019.
Lin, S., Zheng, J., and He, F.: Gridding cropland data reconstruction over the agricultural region of China in 1820, J. Geogr. Sci., 19, 36–48, https://doi.org/10.1007/s11442-009-0036-x, 2009.
Lindstad, B. H.: A comparative study of forestry in Finland, Norway, Sweden, and the United States, with special emphasis on policy measures for nonindustrial private forests in Norway and the United States, General Technical Report. PNW-GTR-538, U.S. Department of Agriculture, Forest Service, Pacific Northwest Research Station, Portland, OR, https://doi.org/10.2737/PNW-GTR-538, 2002.
Magnusson, L.: An Economic History of Sweden, Routledge, New York, 2000.
Mazier, F., Broström, A., Bragée, P., Fredh, D., Stenberg, L., Thiere, G., Sugita, S., and Hammarlund, D.: Two hundred years of land-use change in the South Swedish Uplands: comparison of historical map-based estimates with a pollen-based reconstruction using the landscape reconstruction algorithm, Veg. Hist. Archaeobot., 24, 555–570, https://doi.org/10.1007/s00334-015-0516-0, 2015.
Mehrabi, Z., Ellis, E. C., and Ramankutty. N.: The challenge of feeding the world while conserving half the planet, Nature Sustainability, 1, 409–412, https://doi.org/10.1038/s41893-018-0119-8, 2018.
Myhre, G., Shindell, D., Bréon, F.-M., Collins, W., Fuglestvedt, J., Huang, J., Koch, D., Lamarque, J.-F., Lee, D., Mendoza, B., Nakajima, T., Robock, A., Stephens, G., Takemura, T., and Zhang, H.: Anthropogenic and Natural Radiative Forcing, in: Climate Change 2013: The Physical Science Basis. Contribution of Working Group I to the Fifth Assessment Report of the Intergovernmental Panel on Climate Change, edited by: Stocker, T. F., Qin, D., Plattner, G.-K., Tignor, M., Allen, S. K., Boschung, J., Nauels, A., Xia, Y., Bex, V., and Midgley, P. M., Cambridge University Press, Cambridge, United Kingdom and New York, NY, USA, 688 pp., 2013.
Nielsen, A. B., Giesecke, T., Theuerkauf, M., Feeser, I., Behre, K.-E., Beug, H.-J., Chen, S.-H., Christiansen, J., Dörfler, W., Endtmann, E., Jahns, S., de Klerk, P., Kühl, N., Latałowa, M., Odgaard, B. V., Rasmussen, P., Stockholm, J. R., Voigt, R., Wiethold, J., and Wolters, S.: Quantitative reconstructions of changes in regional openness in north-central Europe reveal new insights into old questions, Quaternary Sci. Rev., 47, 131–149, https://doi.org/10.1016/j.quascirev.2012.05.011, 2012.
Odgaard, B. and Rømer, J. R.: Danske Landbrugs-landskaber gennem 2000 år, Gylling: Narayana Press, 2009.
Olofsson, J. and Hickler, T.: Effects of human land-use on the global carbon cycle during the last 6000 years, Veg. Hist. Archaeobot., 17, 605–615, https://doi.org/10.1007/s00334-007-0126-6, 2007.
Olsson, E., Austrheim, G., and Grenne, S.: Landscape change patterns in mountains, land use and environmental diversity, Mid-Norway 1960–1993, Landscape Ecol., 15, 155–170, https://doi.org/10.1023/A:1008173628016, 2000.
Olsson, M. and Svensson, P.: Agricultural growth and institutions: Sweden, 1700–1860, Eur. Rev. Econ. Hist., 14, 275–304, https://doi.org/10.1017/S1361491610000067, 2010.
Palm, L. A.: Agrarhistorisk databas 1570–1810: befolkning, jordbruk, jordägande. Version 1.0, available at: https://snd.gu.se/en/catalogue/study/SND0910 (last access: 8 October 2019), 2014.
Paudel, B., Zhang, Y., Li, S., and Wu, X.: Spatiotemporal reconstruction of agricultural land cover in Nepal from 1970 to 2010, Reg. Environ. Change, 17, 2349–2357, https://doi.org/10.1007/s10113-017-1164-y, 2017.
Pedersen, H. B. and Møllenberg, S.: Agriculture and Danish farm returns through 100 years 1916–2015, Statistics Denmark, Copenhagen, 2017.
Pongratz, J., Reick, C., Raddatz, T., and Claussen, M.: Reconstruction of global land use and land cover AD 800 to 1992, World Data Center for Climate (WDCC) at DKRZ, https://doi.org/10.1594/WDCC/RECON_LAND_COVER_800-1992, 2007.
Pongratz, J., Reick, C., Raddatz, T., and Claussen, M.: A reconstruction of global agricultural areas and land cover for the last millennium, Global Biogeochem. Cycles, 22, GB3018, https://doi.org/10.1029/2007GB003153, 2008.
Pongratz, J., Raddatz, T., Reick, C. H., Esch, M., and Claussen, M.: Radiative forcing from anthropogenic land cover change since A.D. 800, Geophys. Res. Lett., 36, L02709, https://doi.org/10.1029/2008GL036394, 2009a.
Pongratz, J., Reick, C. H., Raddatz, T., and Claussen, M.: Effects of anthropogenic land cover change on the carbon cycle of the last millennium, Global Biogeochem. Cycles, 23, GB4001, https://doi.org/10.1029/2009GB003488, 2009b.
Pongratz, J., Reick, C. H., Raddatz, T., and Claussen, M.: Biogeophysical versus biogeochemical climate response to historical anthropogenic land cover change, Geophys. Res. Lett., 37, L08702, https://doi.org/10.1029/2010GL043010, 2010.
Ramankutty, N. and Foley, J. A.: Estimating historical changes in global land cover: Cropland from 1700 to 1992, Global Biogeochem. Cycles, 13, 997–1027, https://doi.org/10.1029/1999GB900046, 1999.
Ramankutty, N. and Foley, J. A.: ISLSCP II Historical Croplands Cover, 1700–1992, in: ISLSCP Initiative II Collection, edited by: Hall, F. G., Collatz, G., Meeson, B., Los, S., Brown de Colstoun, E., and Landis, D., Data set, Oak Ridge National Laboratory Distributed Active Archive Center, Oak Ridge, Tennessee, USA, https://doi.org/10.3334/ORNLDAAC/966 (last access: 8 October 2020), 2010.
Smitt, J.: Norges Landbrug i Dette Aarhundrede, Kristiania, Oslo, 1888.
Strassmann, K. M., Joos, F., and Fischer, G.: Simulating effects of land use changes on carbon fluxes: past contributions to atmospheric CO2 increases and future commitments due to losses of terrestrial sink capacity, Tellus B, 60, 583–603, https://doi.org/10.1111/j.1600-0889.2008.00340.x, 2008.
Trondman, A.-K., Gaillard, M.-J., Mazier, F., Sugita, S., Fyfe, R., Nielsen, A. B., Twiddle, C., Barratt, P., Birks, H. J. B., Bjune, A. E., Bjrkman, L., Brostrm, A., Caseldine, C., David, R., Dodson, J., Drfler, W., Fischer, E., van Geel, B., Giesecke, T., Hultberg, T., Kalnina, L., Kangur, M., van der Knaap, P., Koff, T., Kune, P., Lagers, P., Lataowa, M., Lechterbeck, J., Leroyer, C., Leydet, M., Lindbladh, M., Marquer, L., Mitchell, F. J. G., Odgaard, B. V., Peglar, S. M., Persson, T., Poska, A., Rsch, M., Sepp, H., Veski, S., and Wick, L.: Pollen-based quantitative reconstructions of Holocene regional vegetation cover (plant-functional types and land-cover types) in Europe suitable for climate modelling, Global Change Biol., 21, 676–697, https://doi.org/10.1111/gcb.12737, 2015.
Van Minnen, J. G., Klein Goldewijk, K., Stehfest, E., Eickhout, B., van Drecht G., and Leemans, R.: The importance of three centuries of land-use change for the global and regional terrestrial carbon cycle, Clim. Change, 97, 123–144, https://doi.org/10.1007/s10584-009-9596-0, 2009.
Vejre, H. and Brandt, J.: Contemporary Danish landscape research, Belgeo, 2–3, 223–230, https://doi.org/10.4000/belgeo.13532, 2004.
Verburg, P. H., Crossman, N., Ellis, E., Heinimann, A., Hostert, P., Mertz, O., Nagendra, H., Sikor, T., Erb, K.-H., Golubiewski, N., Grau, R., Grove, M., Konaté, S., Meyfroidt, P., Parker, D. C., Chowdhury, R. R., Shibata, H., Thompson, A., Zhen, L., Boillat, S., Scarpa, F., Fürst, C., Huang, H. Q., Wanatabe, T., and Lin, Y.-P.: Science plan and implementation strategy (2016–2021), The 2013 2nd GLP Open Science Meeting, Berlin, 2016.
Wei, X., Ye, Y., Zhang, Q., and Fang, X.: Reconstruction of cropland change over the past 300 years in the Jing-Jin-Ji area, China, Reg. Environ. Change, 16, 2097–2109, https://doi.org/10.1007/s10113-016-0933-3, 2016.
Wei, X., Ye, Y., Zhang, Q., Li, B., and Wei, Z.: Reconstruction of cropland change in North China Plain Area over the past 300 years, Global Planet. Change, 176, 60–70, https://doi.org/10.1016/j.gloplacha.2019.01.010, 2019.
Wei, X., Widgren, M., Li, B., Ye, Y., Fang, X., Zhang, C., and Chen, T.: Cropland cover over the past 300 years in Scandinavia [data set], PANGAEA, https://doi.org/10.1594/PANGAEA.926591, 2021.
Widgren, M.: Towards a global history of agricultural systems, Past Global Change Magazine, 26, 18–19, https://doi.org/10.22498/pages.26.1.18, 2018a.
Widgren, M.: Mapping Global Agricultural History: A Map and Gazetteer for Sub-Saharan Africa, c. 1800 AD, in: Plants and People in the African Past, edited by: Mercuri, A., D'Andrea, A., Fornaciari, R., and Höhn, A., Springer, Cham, 2018b.
Yan, M., Liu, J., and Wang, Z.: Global Climate Responses to Land Use and Land Cover Changes Over the Past Two Millennia, Atmosphere, 8, 64, https://doi.org/10.3390/atmos8040064, 2017.
Yang, X., Jin, X., Xiang, X., Fan, Y., Liu, J., Shan, W., and Zhou, Y.: Carbon emissions induced by farmland expansion in China during the past 300 years, Science China Earth Sciences, 62, 423–437, https://doi.org/10.1007/s11430-017-9221-7, 2018.
Ye, Y., Wei, X., Li, F., and Fang, X.: Reconstruction of cropland cover changes in the Shandong Province over the past 300 years, Sci. Rep.-UK, 5, 13642, https://doi.org/10.1038/srep13642, 2015.
Yu, Z. and Lu, C.: Historical cropland expansion and abandonment in the continental U.S. during 1850 to 2016, Global Ecol. Biogeogr., 27, 322–333, https://doi.org/10.1111/geb.12697, 2018.
Yu, Z., Lu, C., Tian, H., and Canadell, J. G.: Largely underestimated carbon emission from land use and land cover change in the conterminous US, Global Change Biol., 25, 3741–3752, https://doi.org/10.1111/gcb.14768, 2019.
Zhang, B., Tian, H., Lu, C., Dangal, S. R. S., Yang, J., and Pan, S.: Global manure nitrogen production and application in cropland during 1860–2014: a 5 arcmin gridded global dataset for Earth system modeling, Earth Syst. Sci. Data, 9, 667–678, https://doi.org/10.5194/essd-9-667-2017, 2017.
Zhang, C., Ye, Y., Fang, X., Li, H., and Wei, X.: Synergistic modern global 1 km cropland dataset derived from multi-sets of land cover products, Remote Sensing, 11, 2250, https://doi.org/10.3390/rs11192250, 2019.
Zhang, X., He, F., and Li, S.: Reconstructed cropland in the mid-eleventh century in the traditional agricultural area of China: implications of comparisons among datasets, Reg. Environ. Change, 13, 969–977, https://doi.org/10.1007/s10113-012-0390-6, 2013.