the Creative Commons Attribution 4.0 License.
the Creative Commons Attribution 4.0 License.
 | 17 Jun 2021
Changes in China's anthropogenic emissions and air quality during the COVID-19 pandemic in 2020
Qiang Zhang
Guannan Geng
Cuihong Chen
Qinren Shi
Mengshi Cui
Yu Lei
Kebin He
The COVID-19 pandemic lockdowns led to a sharp drop in socio-economic activities in China in 2020, including reductions in fossil fuel use, industry productions, and traffic volumes. The short-term impacts of lockdowns on China's air quality have been measured and reported, however, the changes in anthropogenic emissions have not yet been assessed quantitatively, which hinders our understanding of the causes of the air quality changes during COVID-19. Here, for the first time, we report the anthropogenic air pollutant emissions from mainland China by using a bottom-up approach based on the near-real-time data in 2020 and use the estimated emissions to simulate air quality changes with a chemical transport model. The COVID-19 lockdown was estimated to have reduced China's anthropogenic emissions substantially between January and March in 2020, with the largest reductions in February. Emissions of SO2, NOx, CO, non-methane volatile organic compounds (NMVOCs), and primary PM2.5 were estimated to have decreased by 27 %, 36 %, 28 %, 31 %, and 24 %, respectively, in February 2020 compared to the same month in 2019. The reductions in anthropogenic emissions were dominated by the industry sector for SO2 and PM2.5 and were contributed to approximately equally by the industry and transportation sectors for NOx, CO, and NMVOCs. With the spread of coronavirus controlled, China's anthropogenic emissions rebounded in April and since then returned to the comparable levels of 2019 in the second half of 2020. The provinces in China have presented nearly synchronous decline and rebound in anthropogenic emissions, while Hubei and the provinces surrounding Beijing recovered more slowly due to the extension of lockdown measures. The ambient air pollution presented much lower concentrations during the first 3 months in 2020 than in 2019 while rapidly returning to comparable levels afterward, which have been reproduced by the air quality model simulation driven by our estimated emissions. China's monthly anthropogenic emissions in 2020 can be accessed from https://doi.org/10.6084/m9.figshare.c.5214920.v2 (Zheng et al., 2021) by species, month, sector, and province.
- Article
(3377 KB) - Full-text XML
-
Supplement
(180 KB) - BibTeX
- EndNote


The world witnessed the outbreak and spread of the coronavirus disease COVID-19 in the first half of 2020. The widespread lockdowns to contain the coronavirus include the broad restrictions on travel, business operations, and people-to-people interactions, which have caused an unprecedented disruption in the atmospheric environment. The reduced socio-economic activities caused an immediate sharp drop in global fossil fuel demand, reduced air pollutant emissions, and cleaner air (Bauwens et al., 2020; F. Liu et al., 2020; Venter et al., 2020). However, unlike the air quality index that is monitored in real time, the conventional datasets of energy use and air pollutant emissions are only available after 1 or 2 years of latency, which hampers our understanding of the energy–emission–air quality cascade in a fast-evolving event such as COVID-19.
Recently pioneer studies started to explore the new concept of near-real-time emission tracking to assess the influence of COVID-19 lockdowns on climate and air quality. These new approaches extrapolated the emission inventories of a baseline year to the current time in 2020 based on observational constraints or relevant activity indicators. The observation-based method (“top-down method”) employed air pollutant concentrations measured by satellites (Chevallier et al., 2020; Ding et al., 2020; Miyazaki et al., 2020; Zhang et al., 2020, 2021; Zheng et al., 2020) and ground stations (Feng et al., 2020; Xing et al., 2020) to infer the evolution of anthropogenic emissions, which are constrained by both observational data and chemical transport models. Satellite imagery of nitrogen dioxide (NO2) is widely used to constrain nitrogen oxide (NOx) emissions due to its broad spatial coverage and high retrieval accuracy. The activity indicator-based method (“bottom-up method”) relied on daily electricity generation (Guevara et al., 2021; Z. Liu et al., 2020a, b), confinement index (Le Quéré et al., 2020), and mobility index (Forster et al., 2020) to estimate the emission changes based on the assumptions associating those activity indicator changes with the anthropogenic emissions. Since few near-real-time proxies are available at present, several common datasets have to be used to approximate the emission changes of different source sectors.
The research on near-real-time emission tracking is still in its infancy. Substantial gaps exist between what we need to understand the emission dynamics and what the current top-down and bottom-up methods can provide us. The top-down approach can constrain emission distributions based on real-time observation data, while it lacks sectoral emission details and cannot retrieve all of the reactive species. The bottom-up approach estimates emissions by sector and by species, but it is limited by the lack of the recent emission baseline and sufficient activity data reflecting emissions change. Since each method has its advantages and disadvantages, having both top-down and bottom-up approaches is important at present.
Here, as the second paper following our previous study (Zheng et al., 2020) that estimates China's daily NOx and carbon dioxide (CO2) emissions during COVID-19 with a top-down approach, we develop a bottom-up method in parallel to track monthly emissions of all of the conventional air pollutants in mainland China and for the first time report China's anthropogenic emissions from January to December in 2020. We use the Multi-resolution Emission Inventory for China (MEIC) model (Zheng et al., 2018a) to estimate China's emissions in 2018 and 2019 and then use 39 types of near-real-time activity data to update the emission estimates to 2020. Provincial and sectoral emissions are estimated by month, and the relative changes in monthly emissions from 2019 to 2020 are evaluated through atmospheric chemical model simulations and the comparisons against the ground-based observations. The emission datasets developed in this study can provide the most up-to-date China's emissions input to chemical transport models and help interpret the abrupt changes in pollutant concentrations during the COVID-19 lockdowns.
2.1 Baseline emissions in 2019
We use the MEIC model to estimate China's anthropogenic emissions in 2018 and 2019 following our previous study (Zheng et al., 2018a) that calculated China's 2010–2017 emissions. MEIC is a bottom-up emission model that used the technology-based approach to estimate emissions with activity data, emission factors, and pollution control techniques of emission sources. More than 700 anthropogenic emission sources are included in the MEIC model, which can be aggregated into five sectors of power, industry, residential, transportation, and agriculture. Power plants (Liu et al., 2015) and cement plants (Liu et al., 2021) are both treated as point sources in MEIC with detailed facility-level emission parameters and geographical coordinates to estimate emissions and locate their positions. The other industrial plants are estimated as area sources in each province, where the parameters such as emission factors and pollution removal efficiencies are well-tuned using a comprehensive industrial database that includes about 100 000 industrial plants in China (Qi et al., 2017; Zheng et al., 2017; Zheng et al., 2018b). Emissions from the residential sector are estimated on the basis of the survey-based fuel consumption data (Peng et al., 2019), which corrects the underestimation bias of rural coal use statistics in China. On-road transport emissions are estimated using the county-level information that depicts high-resolution emission distribution patterns at fine spatial scales (Zheng et al., 2014). Off-road transport and agricultural emissions are both estimated as area sources at the provincial level with the detailed provincial activity database and emission factors mainly derived from the local measurement (Li et al., 2017a). Please refer to our previous papers cited above for more details of the MEIC emission model.
2.2 Monthly emissions in 2020
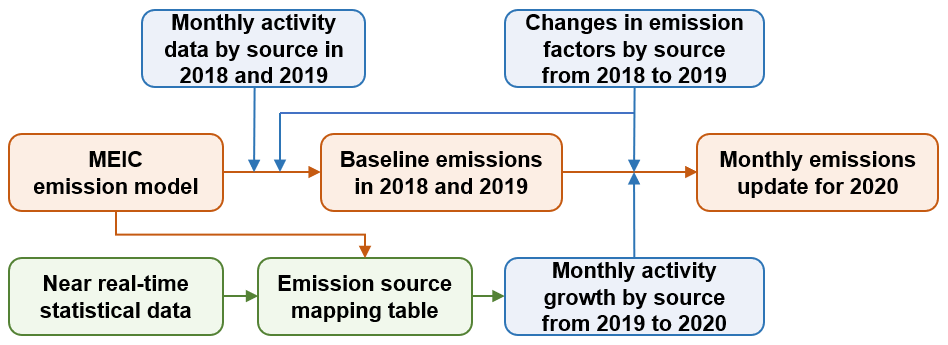
We face challenges in estimating monthly emissions of 2020 using the traditional bottom-up method due to a lack of timely updated activity data and emission factors to drive the MEIC model to do a complete calculation. Currently, it is difficult to achieve real-time information, and both the coal consumption and pollution control statistics are not available until at least 1 year later. Adapting to such a situation, we develop a new method (Fig. 1) to update China's monthly emissions from 2019 to 2020 based on the near-real-time activity indicators and the emission factor trends of each province. China's emissions of different air pollutants in 2020 are then estimated by source, by month, and by province using the following formula.
where i represents source, s represents pollutant species, p represents province, m represents month, E is emission, α is the ratio of monthly emissions in 2020 to those in the same month of 2019, A is activity data (e.g., fuel consumption, industrial products), and EF is the source-specific net emission factor accounting for pollution removal by end-of-pipe control devices. The pollutant species estimated in this study include sulfur dioxide (SO2), NOx, carbon monoxide (CO), non-methane volatile organic compounds (NMVOCs), particulate matter whose aerodynamic diameter is smaller than 2.5 µm (PM2.5), and black carbon (BC). This equation extrapolates the monthly emissions in 2019 () to the same month in 2020 () via the parameter α, which is calculated by multiplying the ratio of activity data (A) between the 2 years by the ratio of emission factors. The emission factor ratios between 2019 and 2018 estimated by MEIC in this study are used to approximate the ratios of monthly emission factors between 2020 and 2019 that are not available at present, assuming that each province follows its pollution control pathway that was initiated in 2013 (Zheng et al., 2018a; Zhang et al., 2019).
Monthly emissions in 2019 and emission factor ratios between 2019 and 2018 are derived from the MEIC emission model that has been updated in this study (Sect. 2.1). The activity data ratios are collected and estimated by emission source (Table S1). We collect 39 types of official monthly statistical data (Table S1), of which 22 types are provincial data, to represent the activity changes in different emission sources from 2019 to 2020. The power sector uses monthly thermal power generation. The industrial sector relies on the monthly productions of different products (e.g., iron, steel, cement, glass, and ethylene) and uses gross domestic product from industrial production to represent the industrial sources without timely updated activity statistics (e.g., industrial fuel burned, industrial solvent use). The residential sector includes commercial, heating, and cooking sources, which use the index of service production, population-weighted heating degree day (Crippa et al., 2020), and the assumption of no change to predict the 2019-to-2020 change in the activities. The transportation sector uses the transport volume of freight (metric ton times kilometer) and passenger (people times kilometer) by road, railways, and inland waterways to predict the changes in the oil consumption of vehicles and off-road equipment. The changes in the activity of construction equipment are estimated based on the floor space of real estate that was newly built each month. In addition, we use China's monthly natural gas consumption to constrain the total natural gas use by all of the emission sources.
2.3 Chemical transport model
We use the Weather Research and Forecasting (WRF) Version 3.9.1 and the Community Multiscale Air Quality (CMAQ) Version 5.2 to simulate the changes in air quality during the COVID-19 pandemic in 2020 based on our estimated emissions. The WRF model is used to simulate the meteorological fields, which are initialized by the NCEP FNL Operational Model Global Tropospheric Analyses dataset (https://rda.ucar.edu/datasets/ds083.2/, last access: 10 November 2020). The CMAQ model domain covers mainland China with a spatial resolution of 36 km×36 km and 28 vertical layers. We conduct the model simulations from December 2018 to December 2020, with the first month used for the model spin-up. Anthropogenic emission inputs for mainland China are derived from the emission estimates of this study, and the anthropogenic emissions from all of the other regions within our model domain are derived from the MIX inventory (Li et al., 2017b). The emissions from the natural sources of biogenic, open biomass burning, and dust sources are obtained from the MEGANv3.1 model (https://bai.ess.uci.edu/megan, last access: 10 November 2020), GFEDv4 dataset (van der Werf et al., 2017), and on-line dust emission module in CMAQ, respectively. Please refer to our previous studies for the detailed physical and chemical configurations (Zheng et al., 2015; Cheng et al., 2019). We use the observations of surface air pollutant concentrations to evaluate the simulated monthly changes in the ambient air pollution from 2019 to 2020. The hourly concentrations of air pollutants are derived from the surface measurement network maintained by the China National Environmental Monitoring Center (CNEMC) (http://106.37.208.233:20035/, last access: 10 November 2020). More than 1500 surface stations are included in the CNEMC observational network at present that covers all of the cities in mainland China. We calculate monthly average concentrations of SO2, NO2, CO, and PM2.5 and compare the relative changes of the same month from 2019 to 2020 with our modeling results, which can evaluate the estimated emission changes between these 2 years.
Table 1China's monthly anthropogenic emissions in 2019 and 2020. The values in brackets represent the emission estimation results in 2020 using the same emission factors as in 2019.
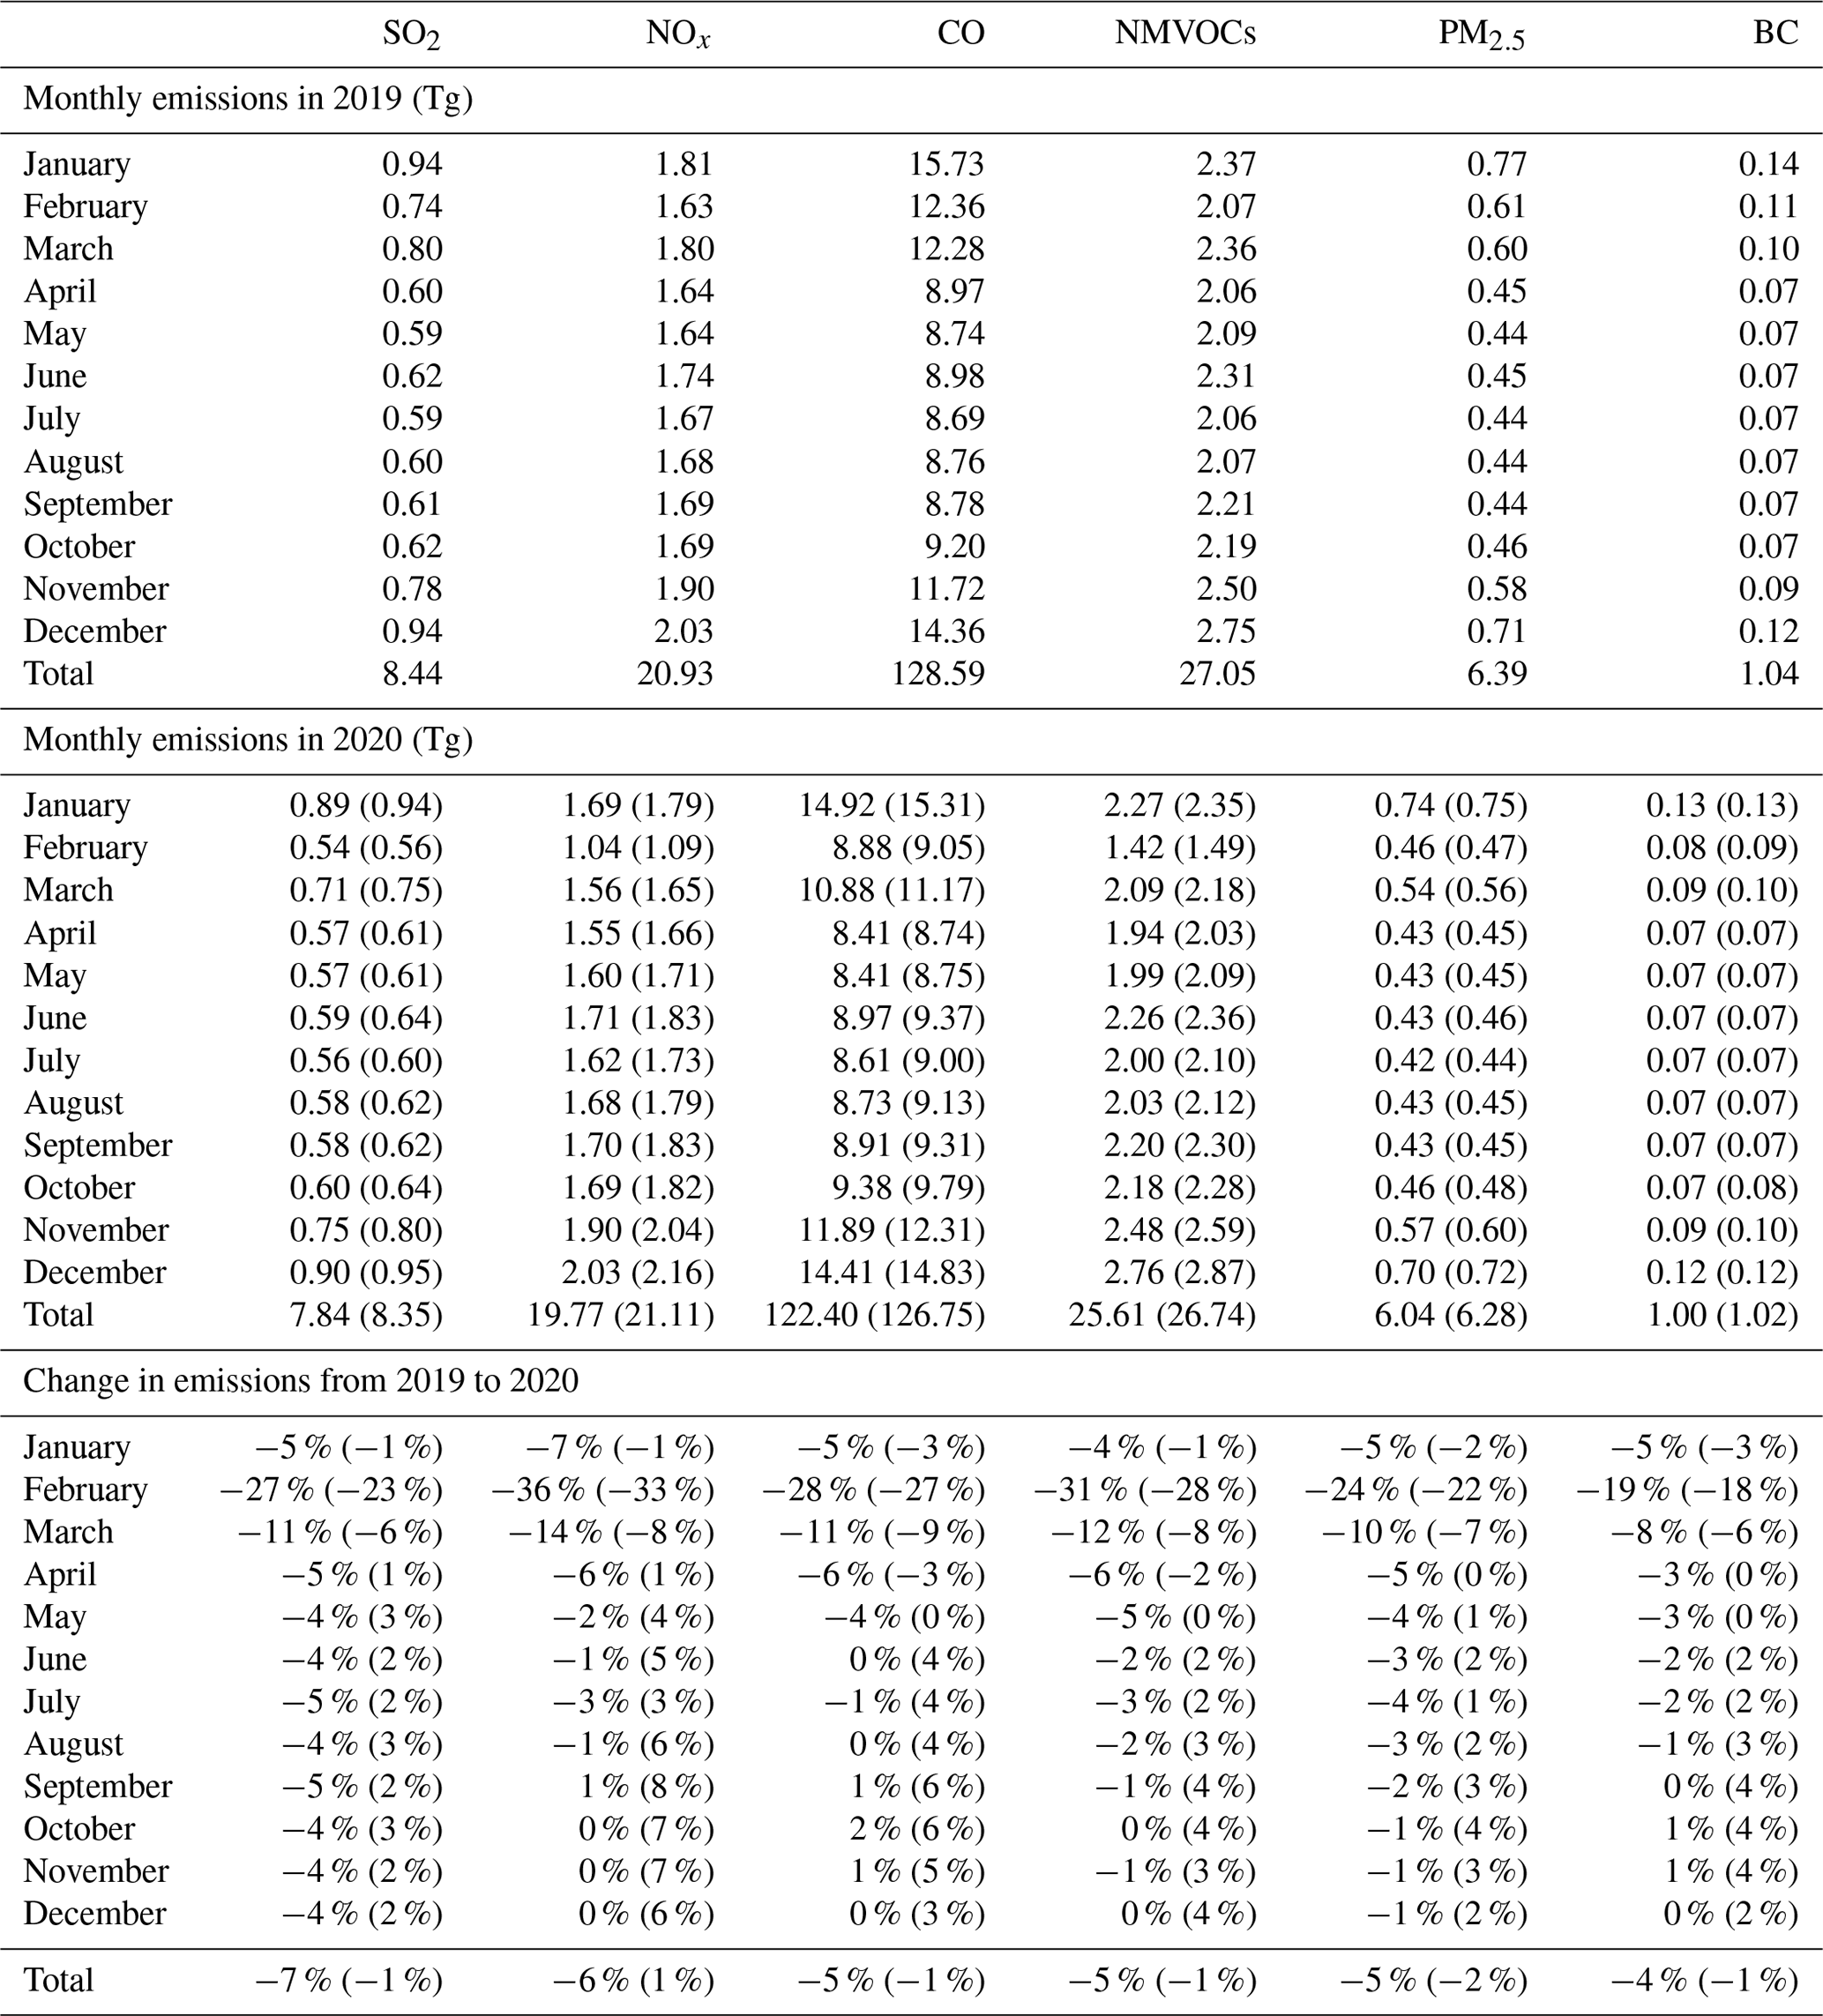
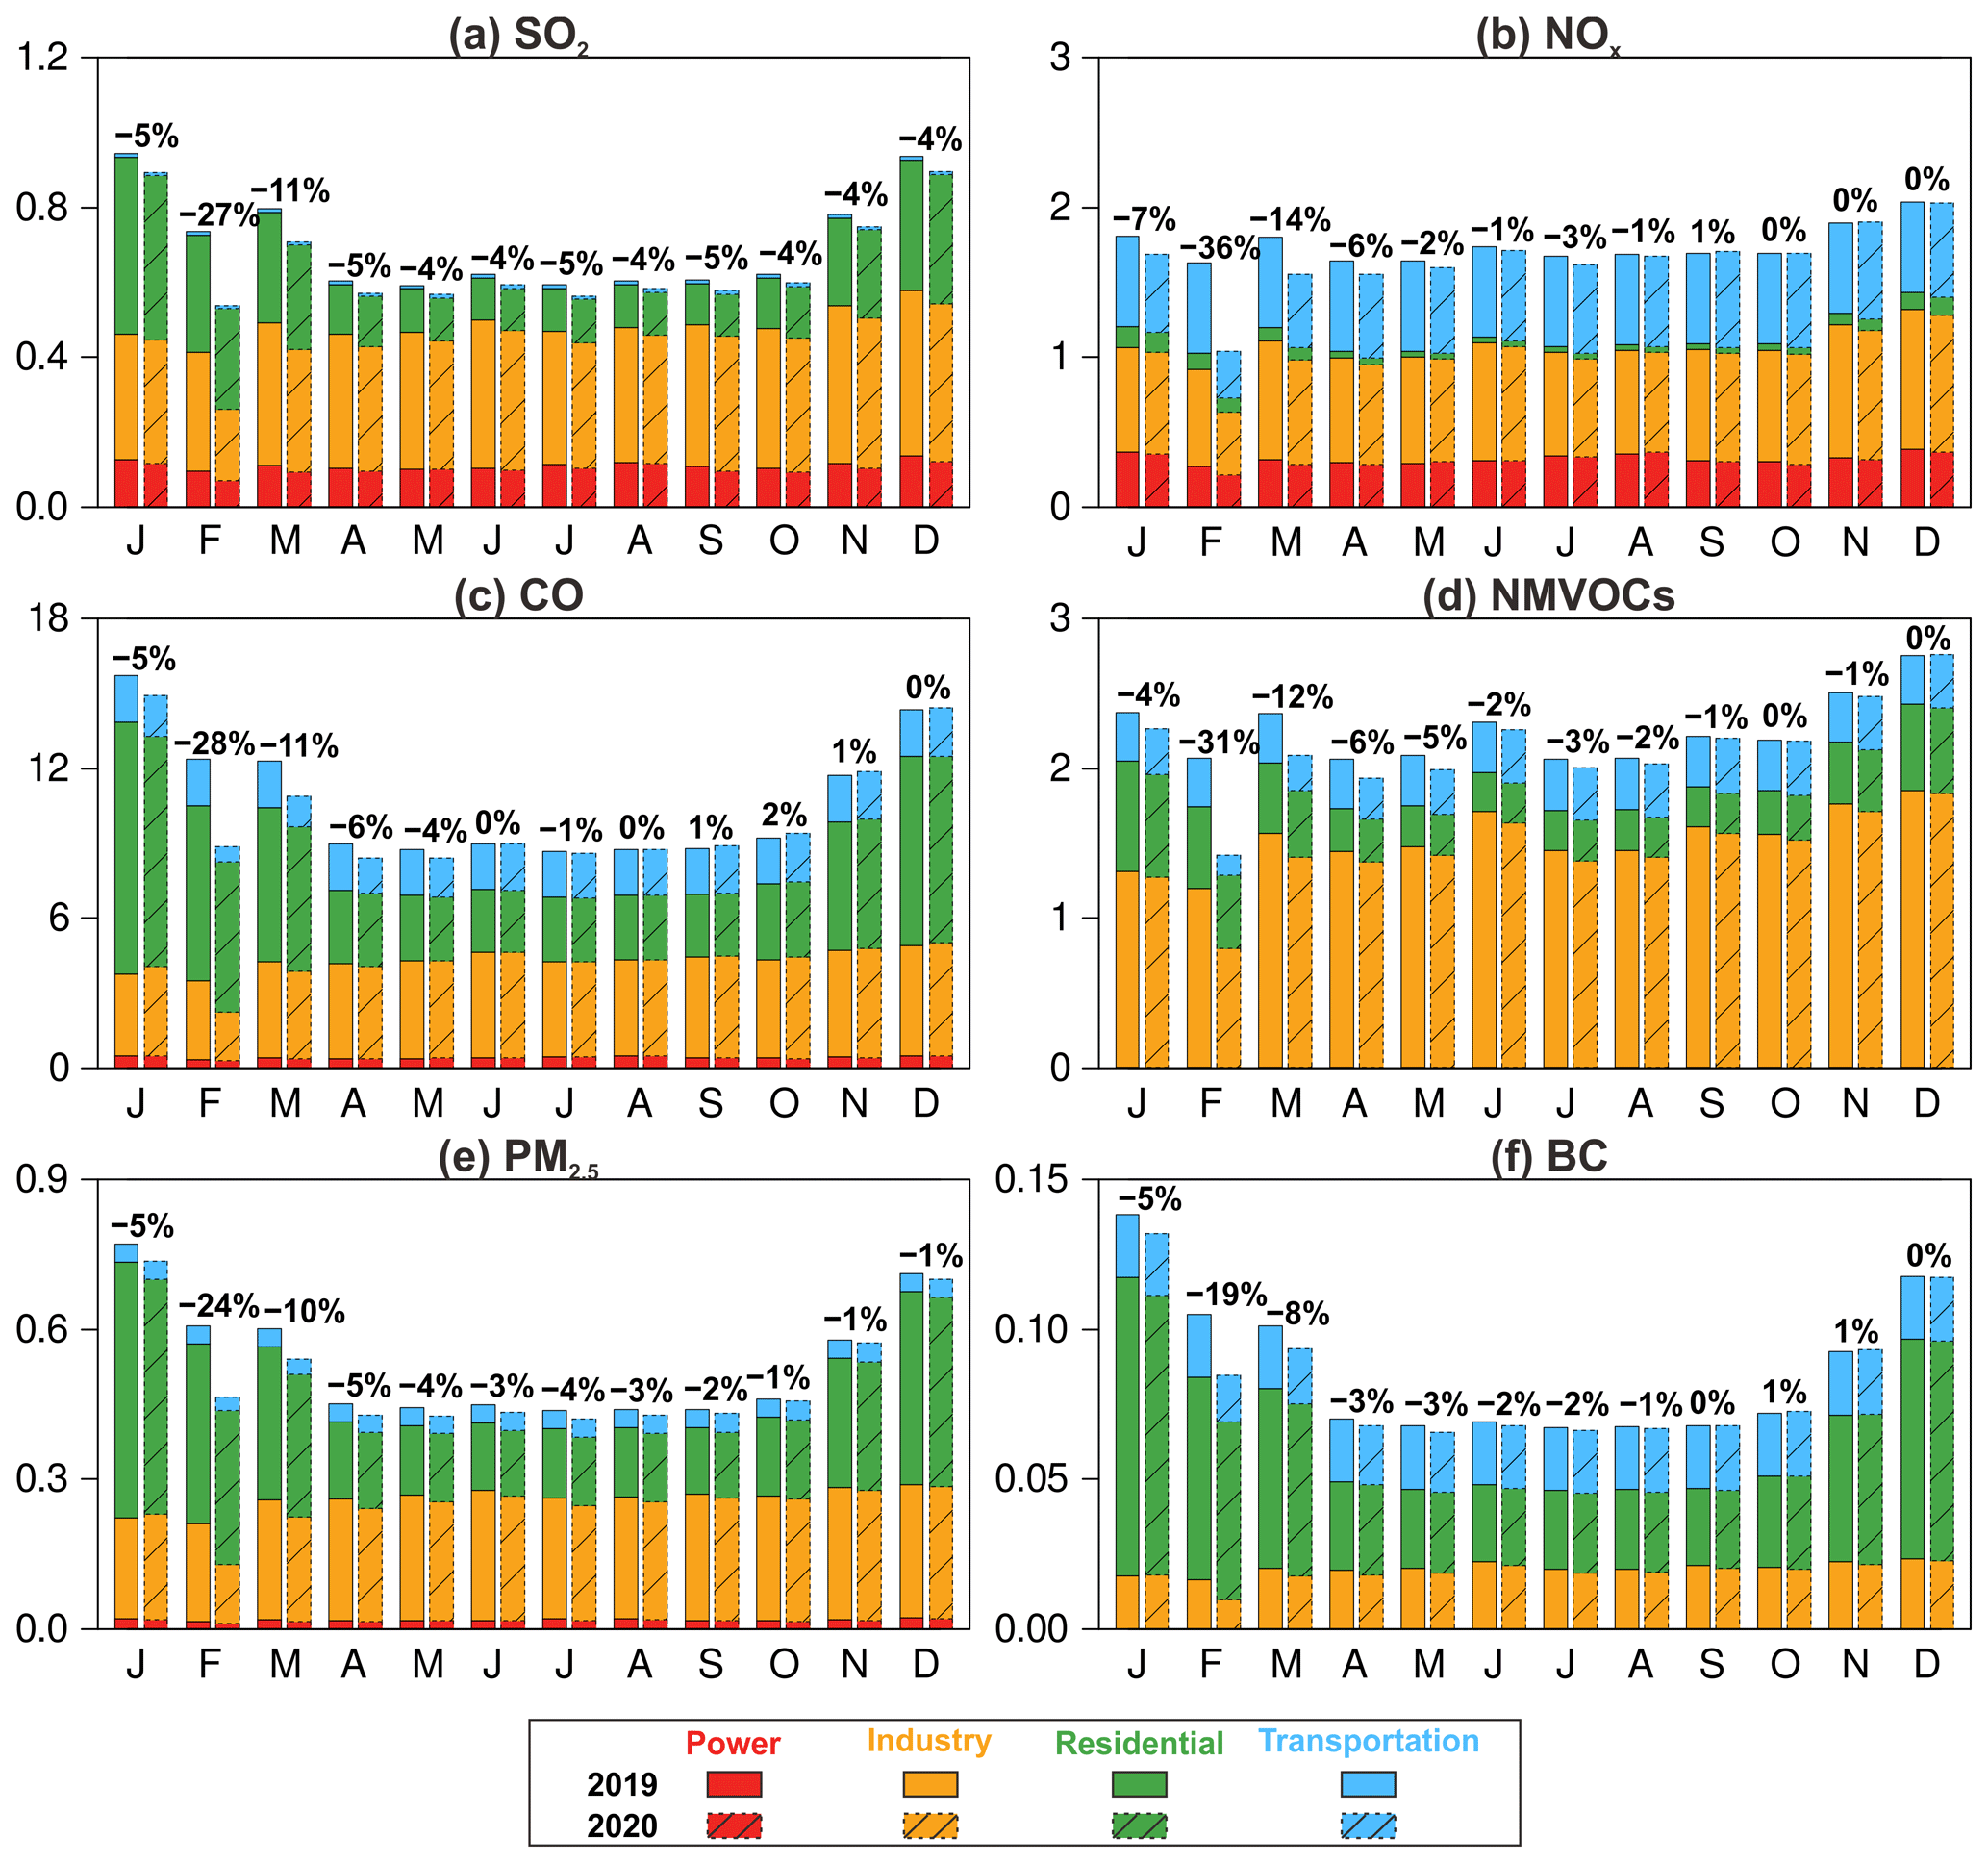
Figure 2Monthly emissions from January to December in 2019 and 2020. Six pollutants are presented including SO2 (a), NOx (b), CO (c), NMVOCs (d), PM2.5 (e), and BC (f). The left bars for each month represent the emissions in 2019, and the right bars for each month represent the emissions in 2020. The values above the bars represent the change in monthly emissions in 2020 compared to the same month in 2019.
3.1 Changes in monthly emissions from 2019 to 2020
China's emissions of SO2, CO, PM2.5, and BC in 2019 reveal an evident seasonal variation with high emissions in winter and low emissions in summer, with emissions slightly lower in February than in January and March (Table 1 and Fig. 2). The emission seasonality is shaped by more emissions from residential heating stoves in winter and fewer emissions during the Chinese New Year holiday in February 2019. The emissions in 2020 show a similar seasonal variation but are substantially lower than the 2019 emissions between January and March, when the 2020 emissions are 5 %–27 % lower for SO2, 7 %–36 % lower for NOx, 5 %–28 % lower for CO, 4 %–31 % lower for NMVOCs, 5 %–24 % lower for PM2.5, and 5 %–19 % lower for BC than those emissions in 2019. The largest reductions in emissions are observed in February. The air pollutant emissions were estimated to decline by 19 %–36 % compared to those in February 2019, with NOx illustrating the largest reductions among the air pollutants. However, after April 2020, China's emissions have gradually increased through December and finally returned to comparable levels in 2019. In December 2020, China's emissions of SO2, NOx, PM2.5, and BC were only 4 %, 0.3 %, 1 %, and 0.2 % lower than those emissions in 2019, while CO and NMVOC emissions were 0.3 % and 0.2 % higher than in 2019, respectively. The sensitivity analysis of emission estimation using the same emission factors between 2019 and 2020 (values in brackets in Table 1) suggests that the decline and rebound in China's economic and industrial activities are the main drivers of the emission dynamics during the COVID-19 pandemic. With emission factors frozen, the activity growth could have driven up China's emissions more rapidly, which even surpassed the 2019 emissions by 2 %–6 % in December 2020.
The distinct monthly variation in China's emissions in 2020 is in phase with the occurrence of both the Chinese New Year and the COVID lockdowns. The reduced socio-economic activities during the Chinese New Year holiday, which took place in February 2019 but in January 2020, explain why the emissions in January 2020 were lower than those in January 2019. However, the lower emissions in 2020 continued to persist in February and March and did not return to the normal levels soon, which is in contrast to the rapid rebound in emissions after the Chinese New Year in 2019. The larger decline and slower recovery in the monthly emissions of 2020 are coincident with the timeline of the COVID lockdowns implemented in China. The lockdown of Wuhan, where the virus outbreak was first identified, started on 23 January 2020, which set the precedent for similar control measures implemented in the other Chinese cities within the next few days. All of China's cities were placed under a strict lockdown that lasted 1 to 2 months, which substantially reduced economic activities and forced air pollutant emissions to remain much lower than the corresponding months in 2019. With the success in controlling the virus in February and March, most of China's cities gradually loosened control measures starting in April, and Wuhan reopened on 8 April. China's economy then started to rapidly recover, reflected by the sharp rise in energy consumption. For example, China's thermal electricity generation in April, May, and June 2020 was 1.2 %, 9.0 %, and 5.4 %, respectively, higher than those in the same months of 2019 (Table S2). The travel demands started to resume and the road freight transport volumes between April and August in 2020 were 1.6 %–6.6 % higher than those in the same months of 2019.
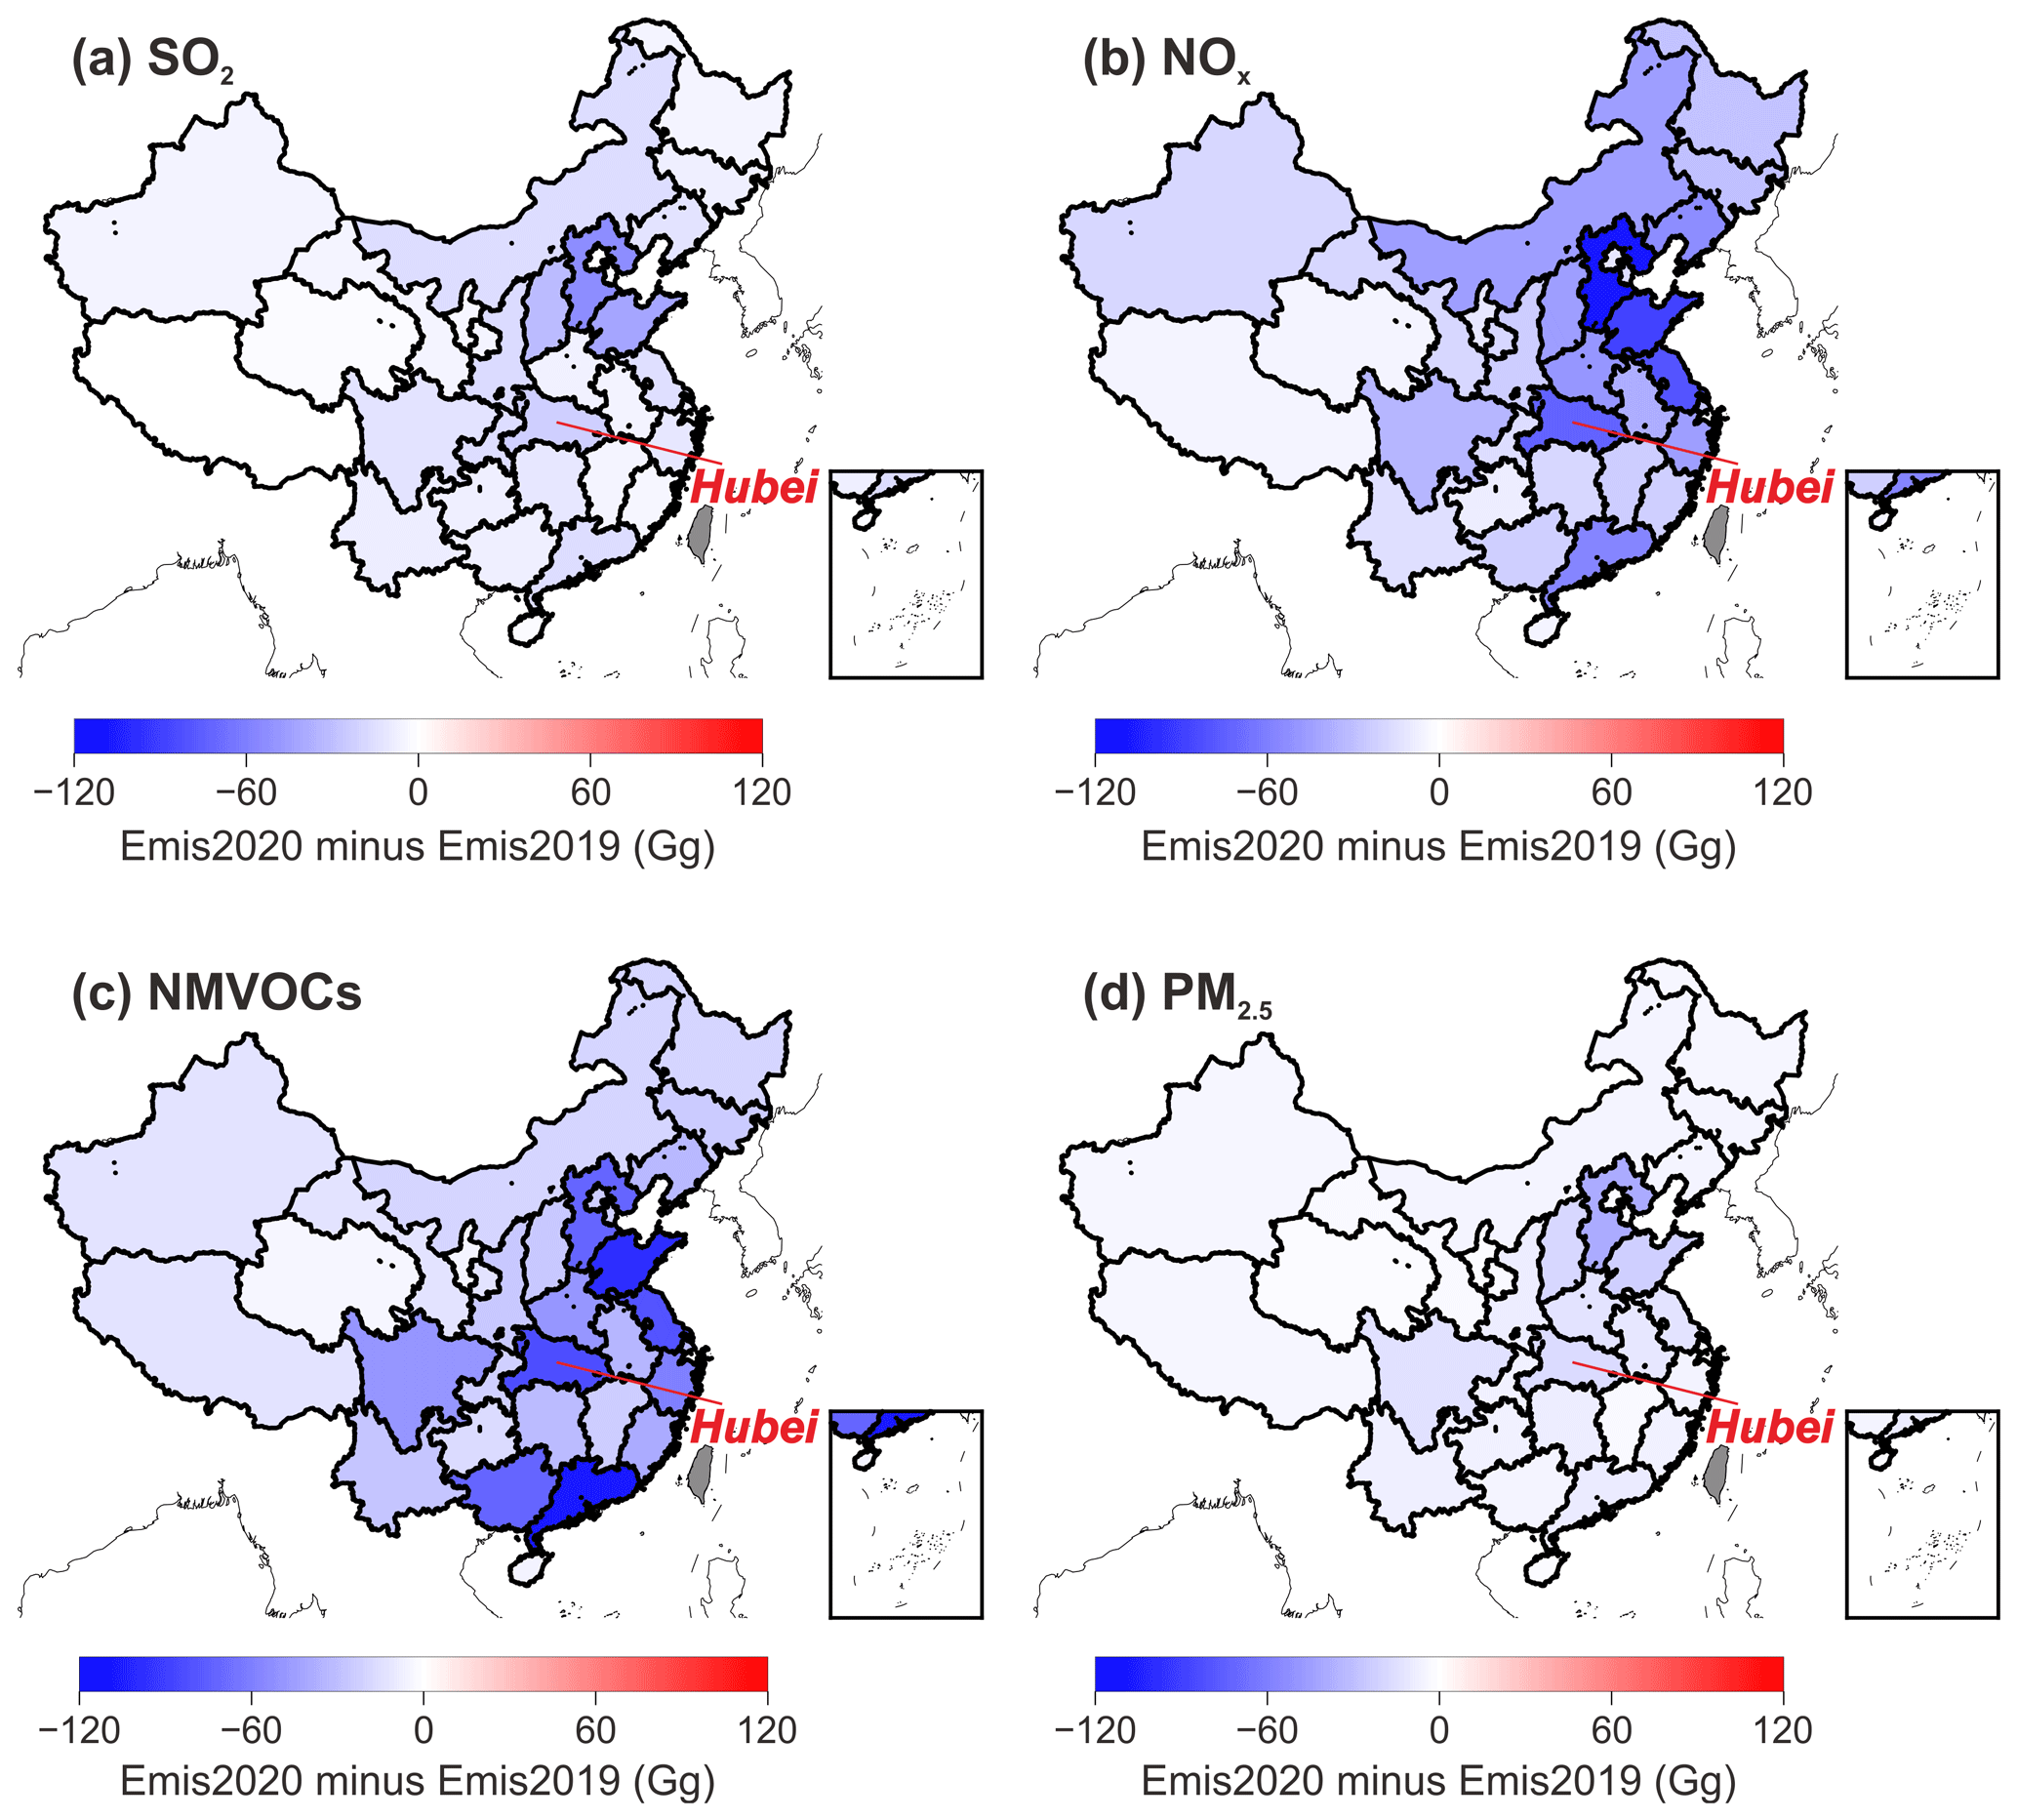
Figure 3Differences in January–April emissions between 2019 and 2020. Four pollutants are presented including SO2 (a), NOx (b), NMVOCs (c), and PM2.5 (d). The background map shows the provincial borders in China. The color of each province represents the emissions from January to April in 2020 minus the emissions from January to April in 2019. The grey color represents the province whose data are not estimated in this study.
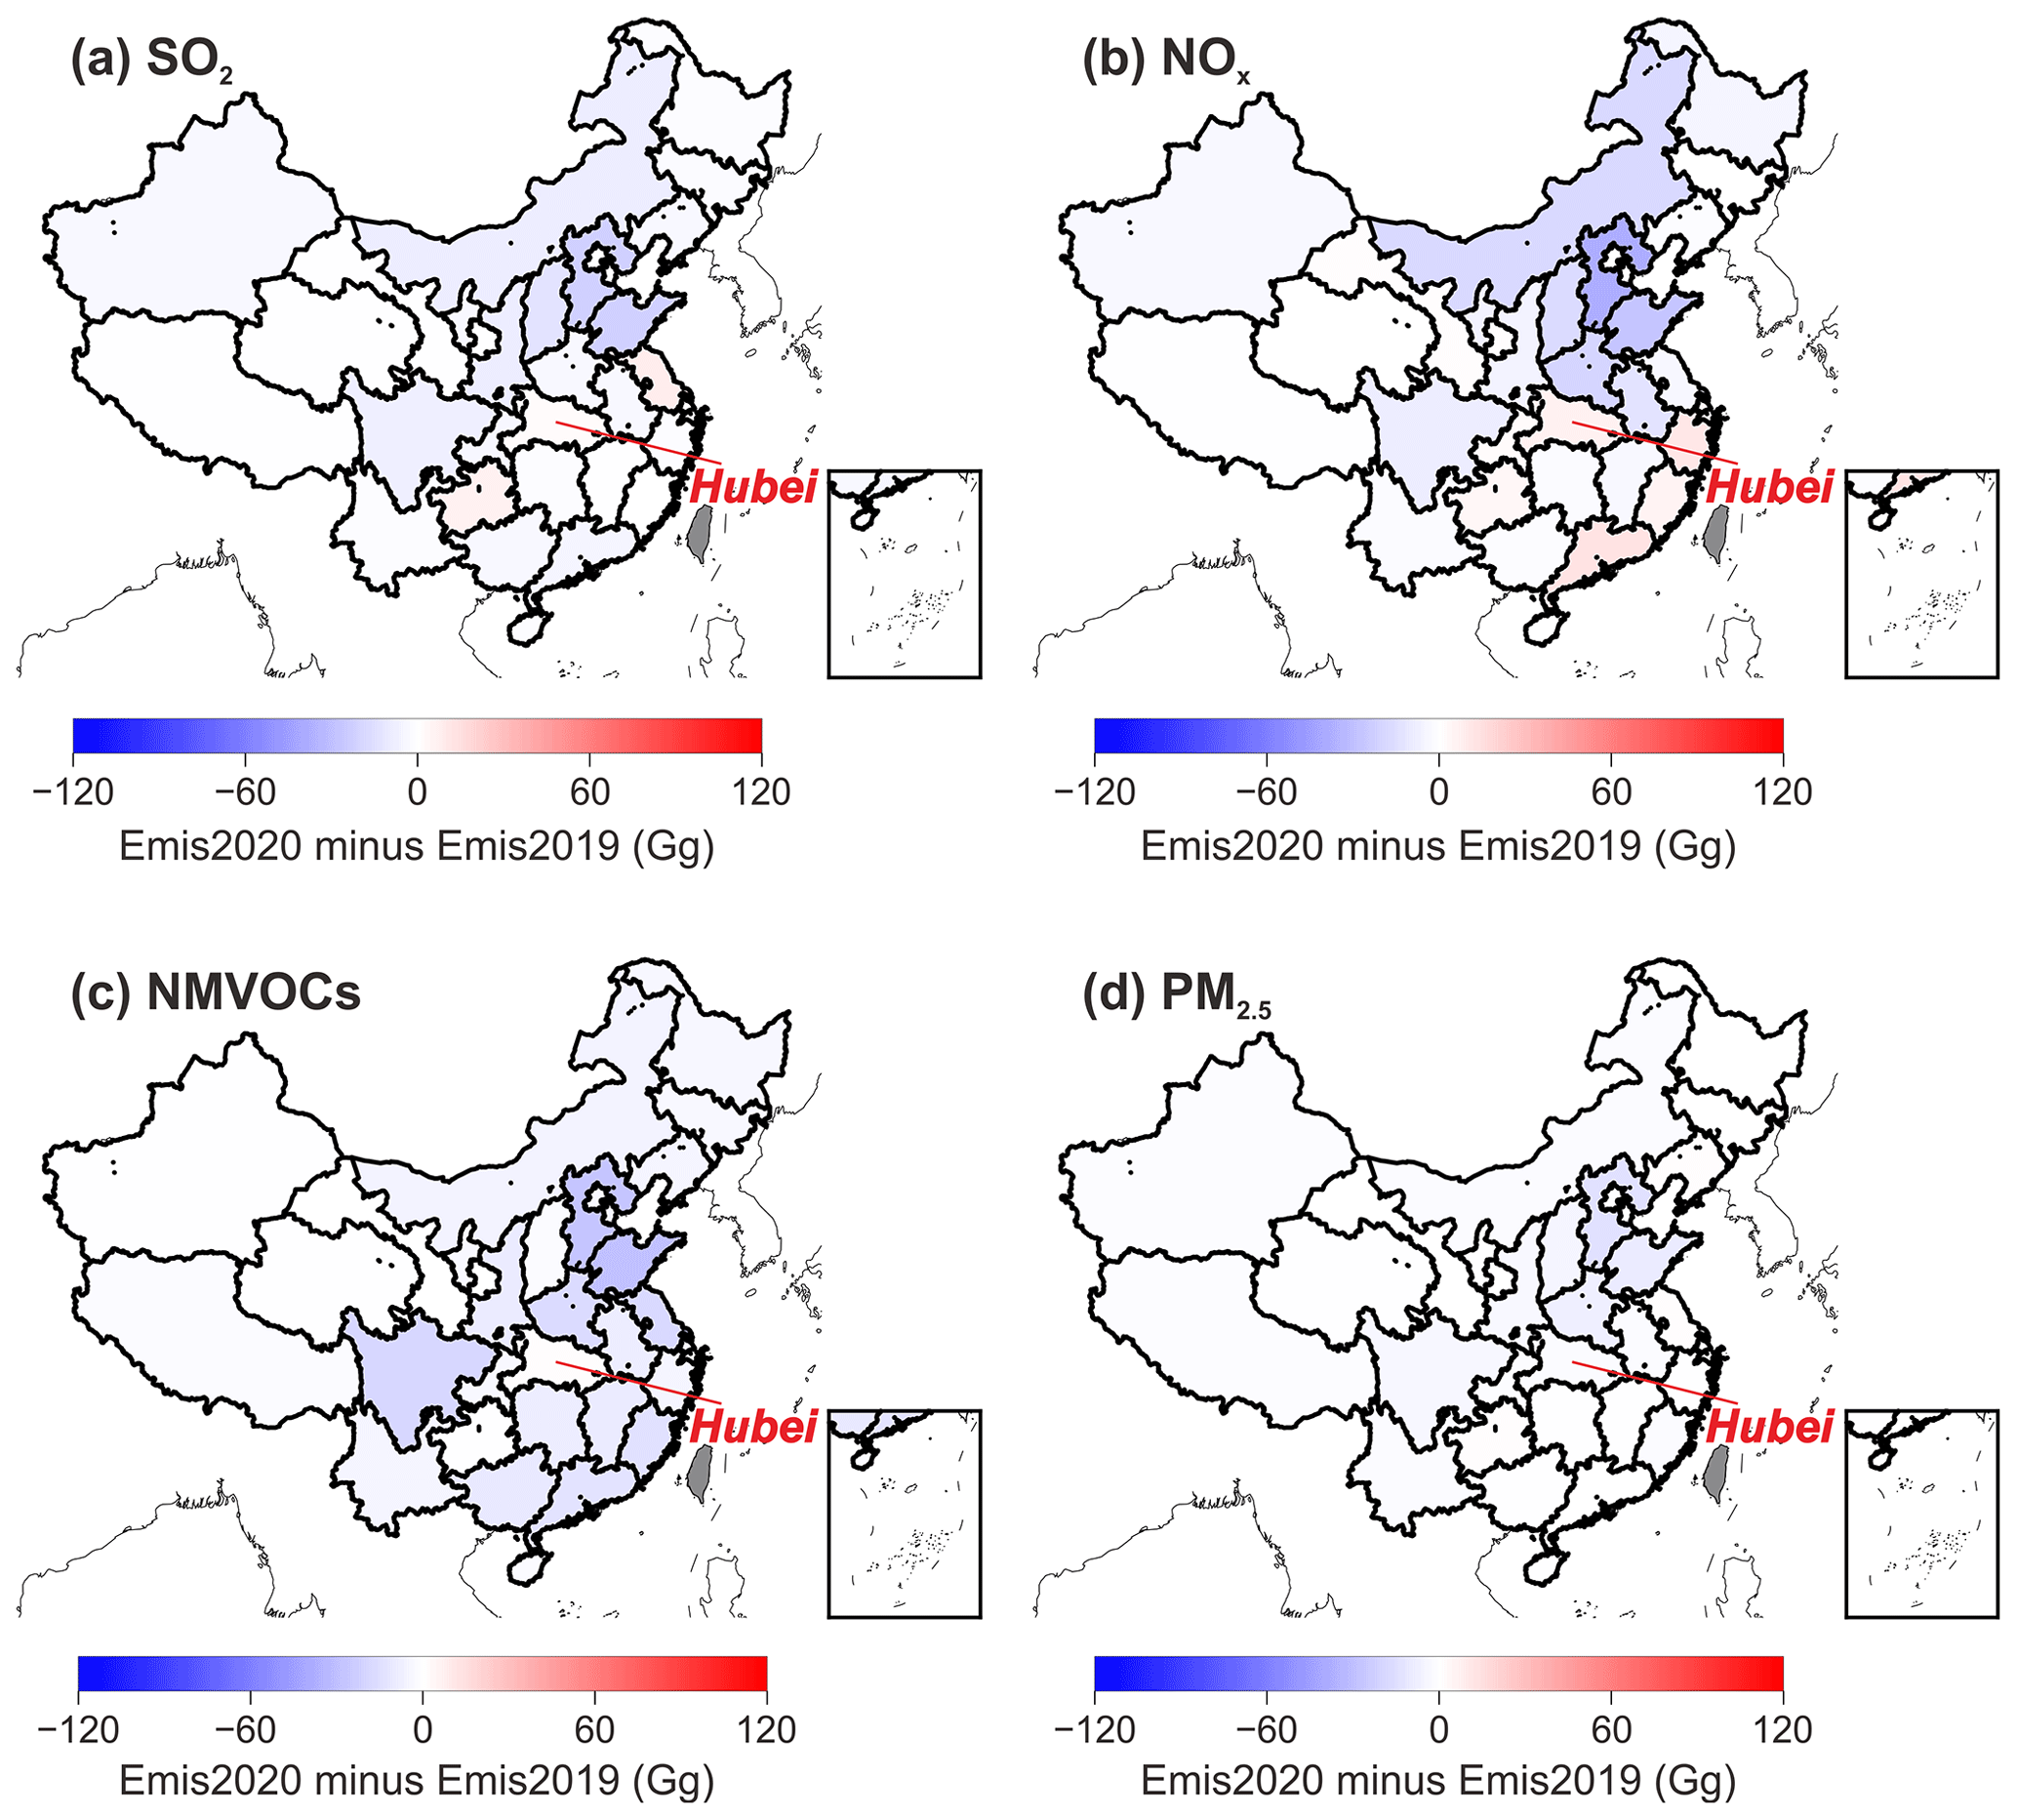
Figure 4Differences in May–August emissions between 2019 and 2020. Four pollutants are presented including SO2 (a), NOx (b), NMVOCs (c), and PM2.5 (d). The background map shows the provincial borders in China. The color of each province represents the emissions from May to August in 2020 minus the emissions from May to August in 2019. The grey color represents the province whose data are not estimated in this study.
Figures 3 and 4 present the changes in China's provincial emissions from 2019 to 2020. From January to April (Fig. 3), all of China's provinces reduced their air pollutant emissions in 2020 compared to 2019. Hubei Province, where Wuhan is located, showed the largest emission reductions due to the longest and strictest COVID lockdown measures adopted in this province. SO2 and PM2.5 emissions decreased a little more in the provinces of north and central China, where most of the industrial plants in China are concentrated. NOx and NMVOC emissions also presented large reductions in the provinces on China's southeast coast, which have developed high-income economies and more vehicle ownership and transport emissions. Figure 4 illustrates the emission difference from May to August in 2020 compared to 2019, which suggests that most of the provinces except Hubei and the provinces surrounding Beijing have experienced rapidly recovered economies and air pollutant emissions. Hubei, Beijing, and the provinces around Beijing retained their public health response systems to the COVID-19 emergency at the top level for more than 3 months, while the other provinces only stayed at the top level for 1 to 2 months. The stringent containment measures implemented in these provinces have hindered rebounding emissions levels. China's anthropogenic emissions in 2020 can be accessed in Zheng et al. (2021) by species, month, sector, and province.
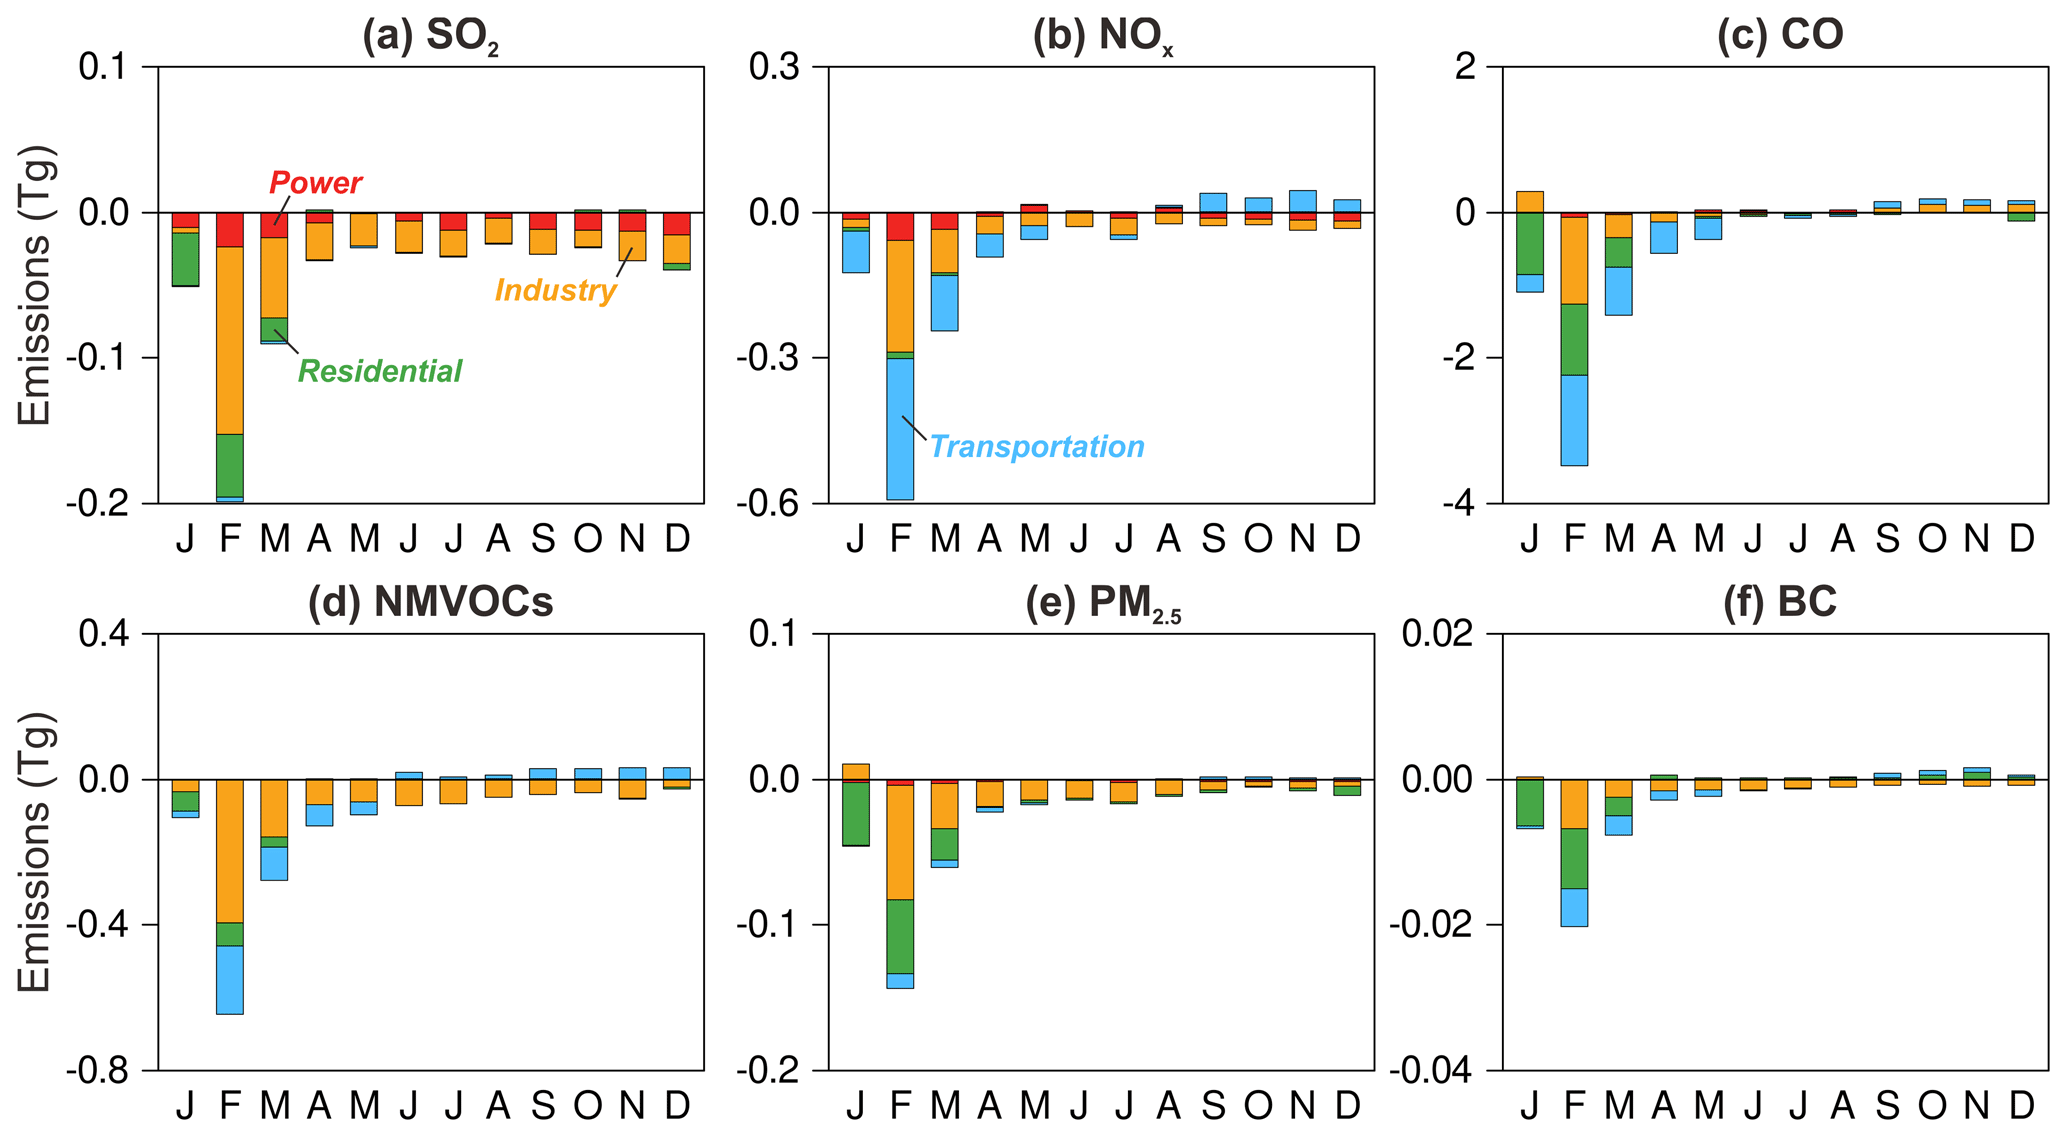
Figure 5Differences in monthly emissions between 2019 and 2020 by source sector. Six pollutants are presented including SO2 (a), NOx (b), CO (c), NMVOCs (d), PM2.5 (e), and BC (f). Each bar represents the results of monthly emissions in 2020 minus those in 2019. The color of stacked bars represents the source sectors of power (red), industry (yellow), residential (green), and transportation (blue).
3.2 Drivers of emission dynamics in 2020
The differences in the monthly emissions between 2019 and 2020 are decomposed into the contributions from power, industry, residential, and transportation sectors (Fig. 5). The results suggest that the industry and transportation sectors are the major drivers of the emissions decline between January and March in 2020. In February 2020, when China's emissions were lowest during the lockdowns, these two sectors contributed 66 %, 88 %, 70 %, 90 %, 62 %, and 59 %, respectively, to the emissions decrease in SO2, NOx, CO, NMVOCs, PM2.5, and BC. The industry sector dominates the reductions in SO2 and PM2.5 emissions, and the industry and transportation sectors have approximately equal contributions to the decreases in NOx, CO, NMVOC, and BC emissions. The industry sector dominated emission reductions because it is the largest source of most of these pollutants in China (Zheng et al., 2018a), and the industrial activities have dropped substantially (Table S2). The gross domestic product by industry during January and February 2020 was 13.5 % lower than the corresponding months in 2019. We observe large declines in industrial products, such as cement production, which dropped by 29.5 % in January and February. It should also be noted that the higher industrial source emissions of CO and PM2.5 in January 2020 than in January 2019 are due to the larger industrial productions of iron, steel, and non-ferrous metals (Table S2) before the lockdown. The transportation sector revealed an even larger fall in activities (for example, road freight transport dropped by 41.5 % in February 2020) than in February 2019. That explains why transport had equal or slightly higher contributions to NOx, CO, NMVOC, and BC emission reductions than the industry sector, although it emits fewer emissions than industry.
The industry and transportation sectors were also the major drivers of the emissions rebound from April to December (Fig. 5). The increases in industrial emissions are coincident with the strong recovery of China's industrial economy from the COVID lockdowns. The negative growth rates of industrial productions in the first months were followed by the accelerated positive growth rates in the following months. The gross domestic product by industry has increased by 3.9 %–5.6 % between April and August in 2020 compared to the same months in 2019 (Table S2). Heavy industrial products such as iron, steel, cement, and aluminum increased their monthly productions by more than 5 % in August 2020 compared to August 2019. The accelerated growth of industrial activities combined with the slightly decreased emission factors made China's industrial emissions return to the emission levels of 2019. China's economic recovery also stimulated the demand for freight transport, which has substantially increased freight transport volumes on the road, rail, and inland waterways (Table S2). The transport emissions of NOx and BC, especially those from diesel engines, have resumed growth and reached the 2019 emission levels. However, the activities of passenger vehicles have not fully recovered yet, illustrated by the reduced passenger transport (Table S2) and the lower TOMTOM traffic index (https://www.tomtom.com/en_gb/traffic-index/, last access: 10 November 2020). Passenger vehicles are mainly gasoline-powered and dominate CO and NMVOCs emissions in the transportation sector; therefore the transport emissions of these two pollutants did not recover as rapidly as NOx emissions.
The residential sector is also important for the monthly variation in China's emissions in 2020, especially for SO2, CO, PM2.5, and BC. The production of service industries during January and February 2020 was 13.0 % lower than the corresponding months in 2019, probably caused by the reduced commercial activities that were affected by the COVID-19 stay-at-home orders. In addition, the winter in 2020, especially February, was the second warmest one on record for the globe (https://www.climate.gov/news-features/understanding-climate/winter-and-february-2020-end-second-warmest-record-globe, last access: 10 November 2020). In China, the population-weighted heating degree day from January to March in 2020 was estimated to be 3.6 %, 9.1 %, and 3.4 %, respectively, lower than the same months in 2019, suggesting that the residential heating demand was lower in 2020 compared to 2019. Therefore, the lower residential emissions between January and March in 2020 are dominated by both the reduced service industry activities during the COVID lockdowns and the lower energy demand by the residential space heating. After that, the residential emissions rebounded rapidly due to the recovered commercial activities, revealed by the growth in the service industry productions by 1.0 %–4.0 % from May to August in 2020 (Table S2). The growing activities drove up air pollutant emissions in the residential sector and made residential emissions return to the 2019 emission levels.
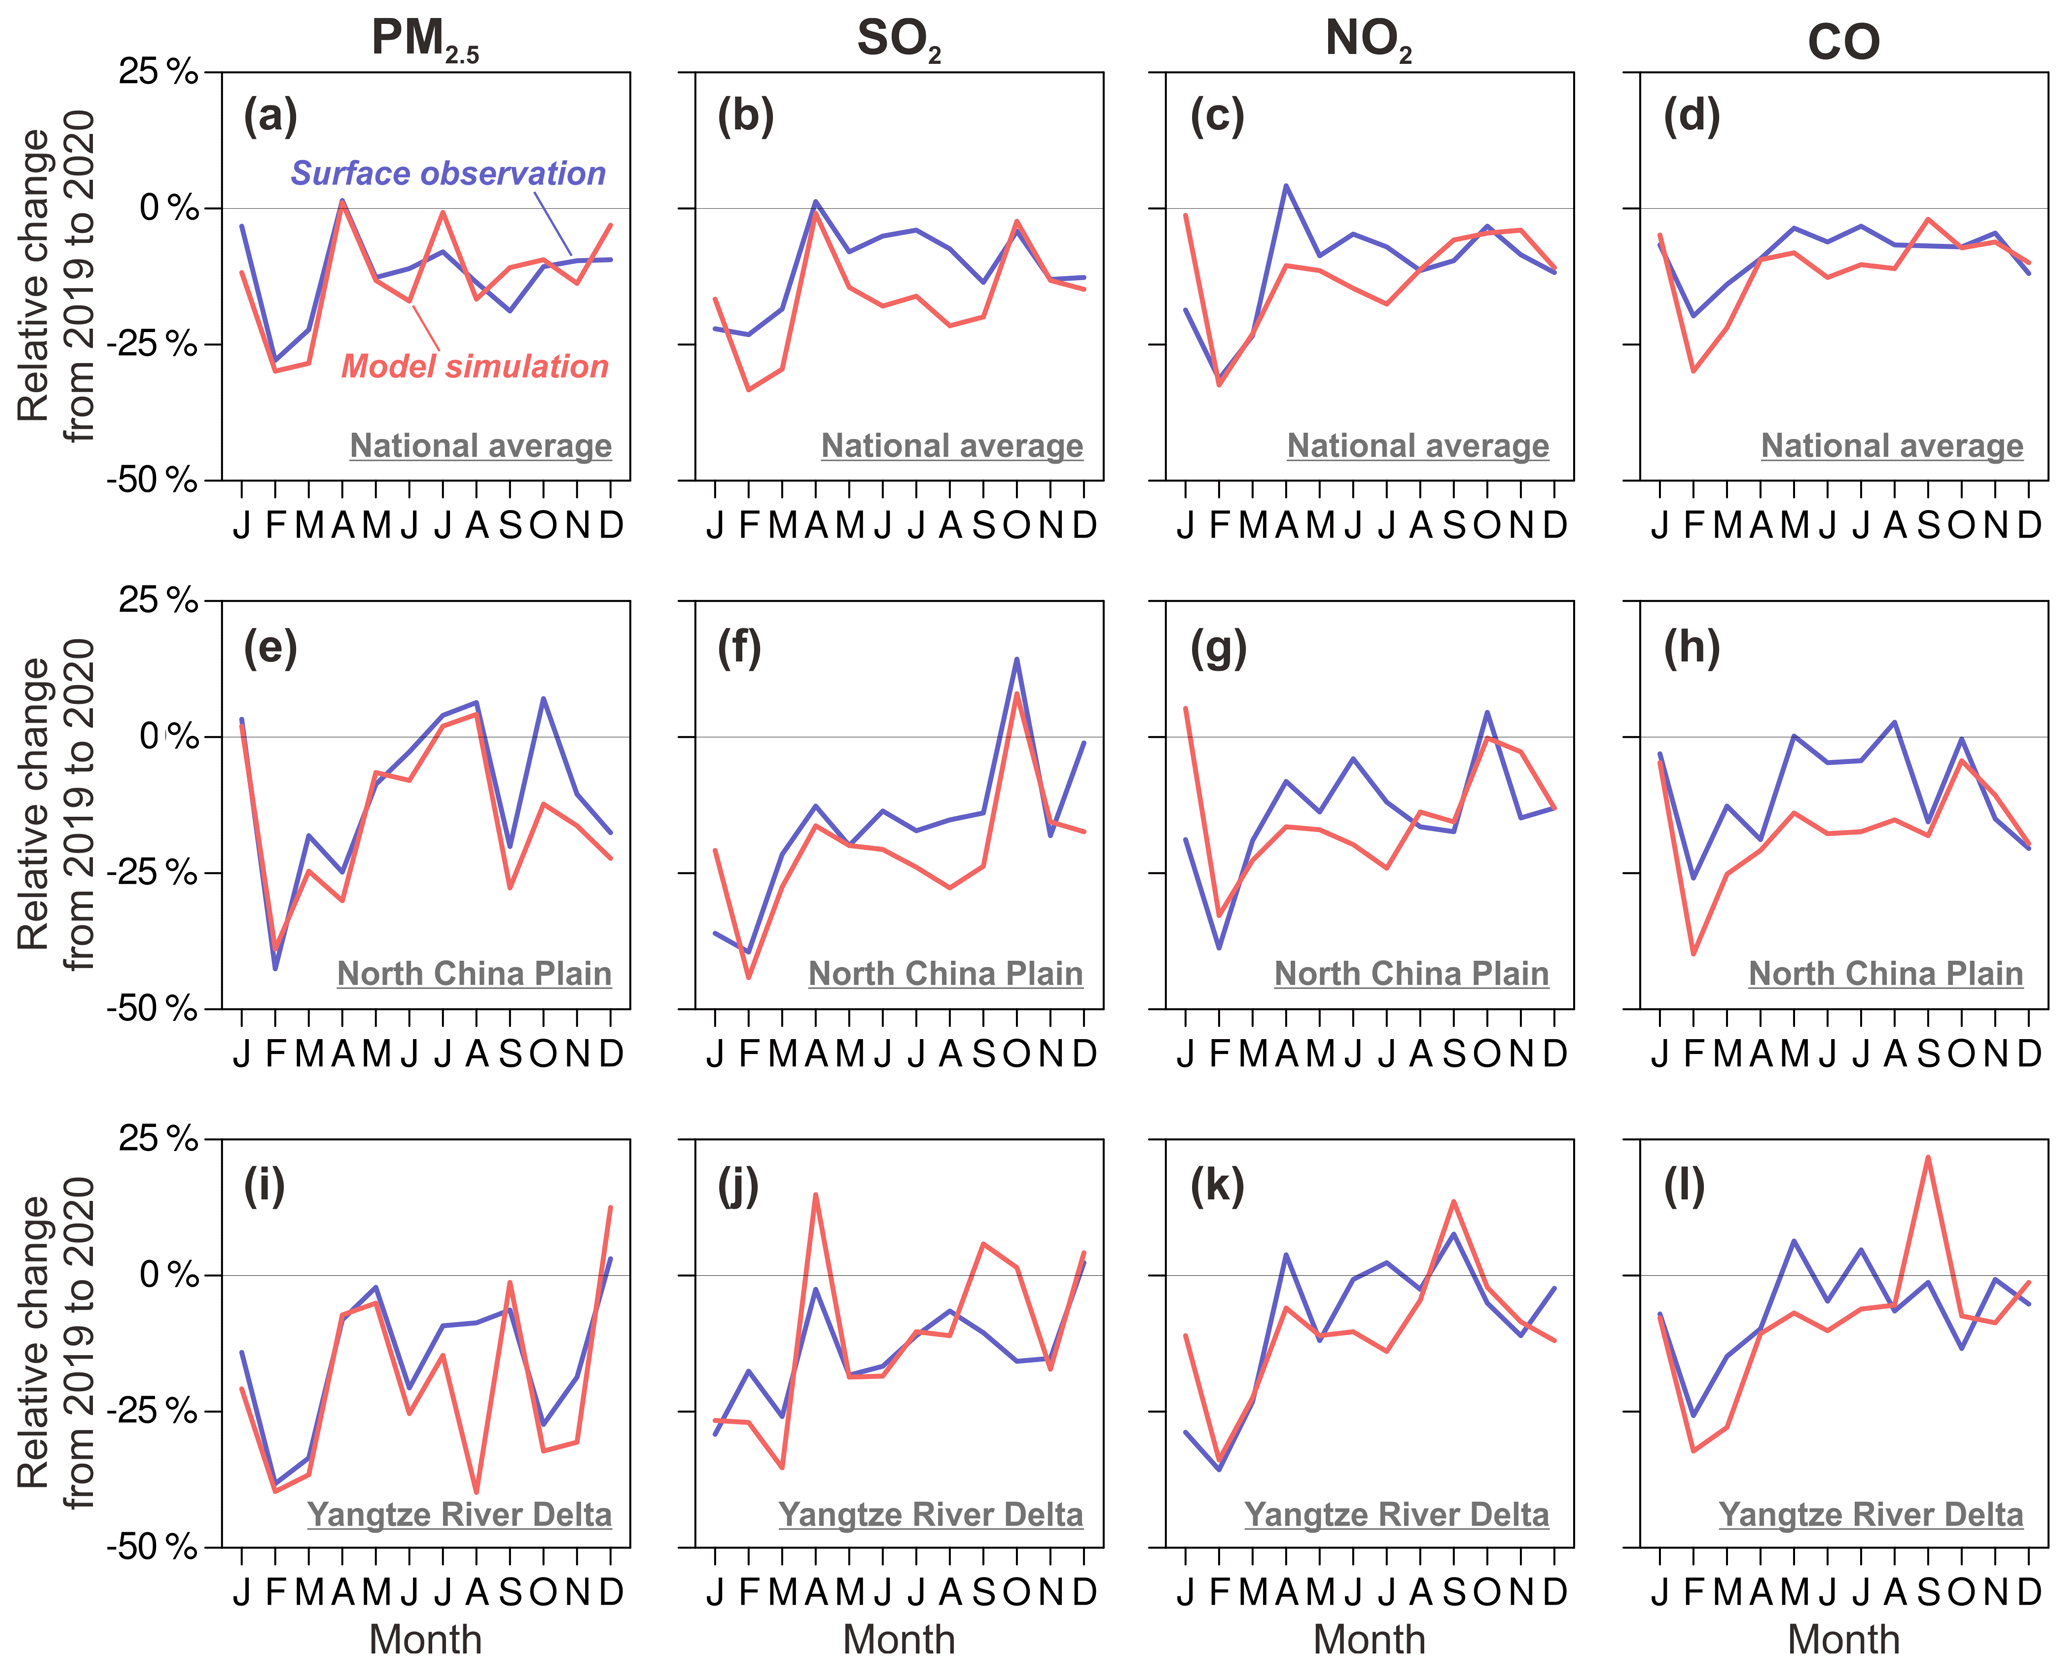
Figure 6Comparison between observations and modeling results regarding the monthly relative changes from 2019 to 2020. Four pollutants are presented including PM2.5, SO2, NO2, and CO. The solid red curves represent the modeled concentrations based on our estimated emissions in this study; the blue curves represent the surface observations (http://106.37.208.233:20035/, last access: 10 November 2020). (a)–(d) The comparisons of national average concentrations; (e)–(h) the comparisons of regional average concentrations over the North China Plain; (i)–(l) the comparisons of regional average concentrations over the Yangtze River Delta.
3.3 Comparison with observations
Figure 6 compares observed and modeled changes in PM2.5, SO2, NO2, and CO monthly concentrations from 2019 to 2020, including the comparison results for national (Fig. 6a–d) and regional (Fig. 6e–l) averages. Two regions are separated here, including the North China Plain (Fig. 6e–h) and Yangtze River Delta (Fig. 6i–l), where the anthropogenic sources dominate air pollutant emissions with tens of thousands of industrial plants and millions of vehicles emitting a mass of air pollutants. The observed surface concentrations (blue curves in Fig. 6) illustrate an abrupt decline during the first 3 months of 2020 compared to the corresponding months of 2019, with February showing the lowest values. The air pollution burden over China was observed to have recovered rapidly since April, although the monthly average concentrations were still slightly lower in 2020 than those in 2019. The WRF-CMAQ simulations (red curves in Fig. 6) driven by our estimated emissions agree well with the surface observations for the abrupt decline and slow rebound trends from January to December in 2020. The broad consistencies between modeling and observations suggest that our emission estimation method and results reproduce the response of China's anthropogenic emissions to the COVID-19 pandemic, which has captured the impact of stringent lockdowns and the following economic recovery on anthropogenic emissions at both national and regional scales.
The discrepancies in the comparison between modeling and observations are caused by several factors. First, such a comparison to evaluate emissions input is more suitable for short-lived pollutants, such as PM2.5, SO2, and NO2. CO has an atmospheric lifetime of several weeks; therefore the atmospheric burden of CO is determined not only by the local CO emission sources but also by the regional backgrounds of CO distributions (Zheng et al., 2019). The boundary conditions used by our WRF-CMAQ model system are generated by global model simulations based on the global emissions in 2014 (Hoesly et al., 2018) due to the lack of timely updated global inventories. The inter-annual variations in the global emissions, especially during the COVID-19 pandemic, are not taken into account yet, which partly contributes to the differences in the comparisons for CO concentrations (Fig. 6d, h, l). Second, the emissions for 2020 are estimated based on the near-real-time data at a provincial level (Sect. 2.2), whereas the spatial heterogeneity of emission dynamics was not represented within a province. Industrial emissions, the main driver of emissions decline and rebound during COVID in China, are mainly distributed over sub-urban and rural areas; however, the surface observation stations tend to be located in densely populated urban areas. The representation errors in the comparison between modeling and observations could lead to the discrepancies shown in Fig. 6. Last but not least, the discrepancies in Fig. 6 also imply possible uncertainties in our emission estimates for 2020. Uncertainties primarily lie in the emission sources without near-real-time monthly statistics of activities; for example, the industrial gross domestic product is used to predict the activity changes of industrial boilers and industrial solvent use, which causes uncertainties that can be reduced if more activity data are available in the future.
The COVID-induced emissions decline based on our bottom-up method is broadly consistent with the top-down estimates inferred from observations. Our top-down inversions constrained by TROPOMI NO2 columns suggest that China's NOx emissions between January and April decreased by 15.9 % in 2020 compared to the corresponding months in 2019 (Zheng et al., 2020), which agrees well with the bottom-up estimated reduction of 15.3 % in this study. Feng et al. (2020) estimated the changes in China's NOx emission based on an inverse modeling analysis of surface NO2 observations. Their results suggested that China's NOx emissions decreased by 35.9 % due to the COVID-19 lockdown measures, which is consistent with our bottom-up estimate of a 36.3 % reduction in China's NOx emissions in February 2020 compared to February 2019. Zhang et al. (2021) used TROPOMI NO2 observations to infer China's NOx emissions and estimated a reduction of 53.4 % during lockdown compared to the same period in 2019, which presented a larger decline in NOx emissions than the estimates above.
The WRF v3.9.1 model developed by the National Center for Atmospheric Research can be downloaded from https://github.com/NCAR/WRFV3/releases/tag/V3.9.1 (last access: 10 November 2020, National Center for Atmospheric Research, 2020). The CMAQ v5.2 model developed by the United States Environmental Protection Agency can be downloaded from https://github.com/USEPA/CMAQ/tree/5.2 (last access: 10 November 2020, United States Environmental Protection Agency, 2020).
The monthly statistics of the industrial economy and industrial products in China can be accessed from https://data.stats.gov.cn/ (last access: 10 November 2020, National Bureau of Statistics, 2020). The monthly statistics of the transport volume of freight and passenger by road, railways, and inland waterways in China can be downloaded from http://www.mot.gov.cn/shuju/ (last access: 10 November 2020, Ministry of Transport of the People's Republic of China, 2020). The monthly natural gas consumption data in China are made available at https://www.ndrc.gov.cn/fgsj/tjsj/jjyx/mdyqy/ (last access: 10 November 2020, National Development and Reform Commission, 2020). The daily coal consumption in six major power companies of China can be accessed from https://www.wind.com.cn/ (last access: 10 November 2020, Wind, 2020). The TOMTOM traffic index can be downloaded from https://www.tomtom.com/en_gb/traffic-index/ (last access: 10 November 2020, TOMTOM, 2020). The daily average temperature at 2 m is derived from https://cds.climate.copernicus.eu/ (last access: 10 November 2020). The gridded population dataset is derived from the UN WPP-Adjusted Population Count, v4.11, which can be accessed from https://doi.org/10.7927/H4PN93PB (Center for International Earth Science Information Network – CIESIN – Columbia University, 2018). China's monthly anthropogenic emissions in 2020 can be accessed from https://doi.org/10.6084/m9.figshare.c.5214920.v2 (Zheng et al., 2021).
We have developed a novel bottom-up approach to track China's air pollutant emissions by month through integrating the emission model MEIC with the near-real-time statistical data. We established a relation between the near-real-time data with all of the anthropogenic emission sources and the activity data used in the baseline inventory, which lay the foundation for the extrapolation of baseline emissions to the current time. The emission estimation results based on this new approach simulate the abrupt decline and the slow rebound of China's air pollutant emissions from the COVID outbreak, lockdown, and recovery in the 12 months of 2020 well. The observations of pollutant concentrations in the atmosphere independently evaluate the estimates of monthly emissions variation, while the discrepancies illustrated in the direct comparisons also imply possible uncertainties that deserve more attention in the future. The dynamic emission inventories built using such methods can provide timely emissions input to chemical transport models, which mitigates the map between the real-time observations and the time-lagged emissions data during COVID-19 (Huang et al., 2020). The method developed here can be applied to other regions in the world, where the near-real-time data are available and can be linked to the baseline bottom-up emission inventory systematically. This is a unique opportunity to understand the dynamic energy–emission–air quality cascade in a short time and probably also to imply effective mitigation strategies in the future. Perhaps more importantly, the methods developed here, as well as in our previous paper (Zheng et al., 2020), constitute a pragmatic effort to monitor emissions in near real time, not just for the analysis of the ongoing COVID-19 pandemic but also for enhancing our abilities in the future to track emission mitigation progress toward air quality goals in a rapidly changing economic situation.
The supplement related to this article is available online at: https://doi.org/10.5194/essd-13-2895-2021-supplement.
BZ and QZ designed the study. BZ developed the new emission estimation method and estimated China's anthropogenic emissions. The manuscript was written by BZ and QZ and was revised and discussed by all of the coauthors.
The authors declare that they have no conflict of interest.
Publisher’s note: Copernicus Publications remains neutral with regard to jurisdictional claims in published maps and institutional affiliations.
This article is part of the special issue “Surface emissions for atmospheric chemistry and air quality modelling”. It is not associated with a conference.
This work was supported by the National Natural Science Foundation of China (grant nos. 91744310, 41921005, and 41625020).
This research has been supported by the National Natural Science Foundation of China (grant nos. 91744310, 41921005, and 41625020).
This paper was edited by Nellie Elguindi and reviewed by two anonymous referees.
Bauwens, M., Compernolle, S., Stavrakou, T., Müller, J.-F., van Gent, J., Eskes, H., Levelt, P. F., van der A, R., Veefkind, J. P., Vlietinck, J., Yu, H., and Zehner, C.: Impact of Coronavirus Outbreak on NO2 Pollution Assessed Using TROPOMI and OMI Observations, Geophys. Res. Lett., 47, e2020GL087978, https://doi.org/10.1029/2020GL087978, 2020.
Center for International Earth Science Information Network – CIESIN – Columbia University: Gridded Population of the World, Version 4 (GPWv4): Population Count Adjusted to Match 2015 Revision of UN WPP Country Totals, Revision 11, NASA Socioeconomic Data and Applications Center (SEDAC), Palisades, NY, https://doi.org/10.7927/H4PN93PB, 2018.
Cheng, J., Su, J., Cui, T., Li, X., Dong, X., Sun, F., Yang, Y., Tong, D., Zheng, Y., Li, Y., Li, J., Zhang, Q., and He, K.: Dominant role of emission reduction in PM2.5 air quality improvement in Beijing during 2013–2017: a model-based decomposition analysis, Atmos. Chem. Phys., 19, 6125–6146, https://doi.org/10.5194/acp-19-6125-2019, 2019.
Chevallier, F., Zheng, B., Broquet, G., Ciais, P., Liu, Z., Davis, S. J., Deng, Z., Wang, Y., Bréon, F.-M., and O'Dell, C. W.: Local anomalies in the column-averaged dry air mole fractions of carbon dioxide across the globe during the first months of the coronavirus recession, Geophys. Res. Lett., 47, e2020GL090244, https://doi.org/10.1029/2020gl090244, 2020.
Crippa, M., Solazzo, E., Huang, G., Guizzardi, D., Koffi, E., Muntean, M., Schieberle, C., Friedrich, R., and Janssens-Maenhout, G.: High resolution temporal profiles in the Emissions Database for Global Atmospheric Research, Sci. Data, 7, 121, https://doi.org/10.1038/s41597-020-0462-2, 2020.
Ding, J., van der A, R. J., Eskes, H. J., Mijling, B., Stavrakou, T., van Geffen, J. H. G. M., and Veefkind, J. P.: NOx Emissions Reduction and Rebound in China Due to the COVID-19 Crisis, Geophys. Res. Lett., 47, e2020GL089912, https://doi.org/10.1029/2020gl089912, 2020.
Feng, S., Jiang, F., Wang, H., Wang, H., Ju, W., Shen, Y., Zheng, Y., Wu, Z., and Ding, A.: NOx Emission Changes Over China During the COVID-19 Epidemic Inferred From Surface NO2 Observations, Geophys. Res. Lett., 47, e2020GL090080, https://doi.org/10.1029/2020gl090080, 2020.
Forster, P. M., Forster, H. I., Evans, M. J., Gidden, M. J., Jones, C. D., Keller, C. A., Lamboll, R. D., Quéré, C. L., Rogelj, J., Rosen, D., Schleussner, C.-F., Richardson, T. B., Smith, C. J., and Turnock, S. T.: Current and future global climate impacts resulting from COVID-19, Nat. Clim. Change, 10, 913–919, https://doi.org/10.1038/s41558-020-0883-0, 2020.
Guevara, M., Jorba, O., Soret, A., Petetin, H., Bowdalo, D., Serradell, K., Tena, C., Denier van der Gon, H., Kuenen, J., Peuch, V.-H., and Pérez García-Pando, C.: Time-resolved emission reductions for atmospheric chemistry modelling in Europe during the COVID-19 lockdowns, Atmos. Chem. Phys., 21, 773–797, https://doi.org/10.5194/acp-21-773-2021, 2021.
Hoesly, R. M., Smith, S. J., Feng, L., Klimont, Z., Janssens-Maenhout, G., Pitkanen, T., Seibert, J. J., Vu, L., Andres, R. J., Bolt, R. M., Bond, T. C., Dawidowski, L., Kholod, N., Kurokawa, J.-I., Li, M., Liu, L., Lu, Z., Moura, M. C. P., O'Rourke, P. R., and Zhang, Q.: Historical (1750–2014) anthropogenic emissions of reactive gases and aerosols from the Community Emissions Data System (CEDS), Geosci. Model Dev., 11, 369–408, https://doi.org/10.5194/gmd-11-369-2018, 2018.
Huang, X., Ding, A., Gao, J., Zheng, B., Zhou, D., Qi, X., Tang, R., Wang, J., Ren, C., Nie, W., Chi, X., Xu, Z., Chen, L., Li, Y., Che, F., Pang, N., Wang, H., Tong, D., Qin, W., Cheng, W., Liu, W., Fu, Q., Liu, B., Chai, F., Davis, S. J., Zhang, Q., and He, K.: Enhanced secondary pollution offset reduction of primary emissions during COVID-19 lockdown in China, National Sci. Rev., 8, nwaa137, https://doi.org/10.1093/nsr/nwaa137, 2020.
Le Quéré, C., Jackson, R. B., Jones, M. W., Smith, A. J. P., Abernethy, S., Andrew, R. M., De-Gol, A. J., Willis, D. R., Shan, Y., Canadell, J. G., Friedlingstein, P., Creutzig, F., and Peters, G. P.: Temporary reduction in daily global CO2 emissions during the COVID-19 forced confinement, Nat. Clim. Change, 10, 647–653, https://doi.org/10.1038/s41558-020-0797-x, 2020.
Li, M., Liu, H., Geng, G., Hong, C., Liu, F., Song, Y., Tong, D., Zheng, B., Cui, H., Man, H., Zhang, Q., and He, K.: Anthropogenic emission inventories in China: a review, National Sci. Rev., 4, 834–866, https://doi.org/10.1093/nsr/nwx150, 2017a.
Li, M., Zhang, Q., Kurokawa, J.-I., Woo, J.-H., He, K., Lu, Z., Ohara, T., Song, Y., Streets, D. G., Carmichael, G. R., Cheng, Y., Hong, C., Huo, H., Jiang, X., Kang, S., Liu, F., Su, H., and Zheng, B.: MIX: a mosaic Asian anthropogenic emission inventory under the international collaboration framework of the MICS-Asia and HTAP, Atmos. Chem. Phys., 17, 935–963, https://doi.org/10.5194/acp-17-935-2017, 2017b.
Liu, F., Zhang, Q., Tong, D., Zheng, B., Li, M., Huo, H., and He, K. B.: High-resolution inventory of technologies, activities, and emissions of coal-fired power plants in China from 1990 to 2010, Atmos. Chem. Phys., 15, 13299–13317, https://doi.org/10.5194/acp-15-13299-2015, 2015.
Liu, F., Page, A., Strode, S. A., Yoshida, Y., Choi, S., Zheng, B., Lamsal, L. N., Li, C., Krotkov, N. A., Eskes, H., van der A, R., Veefkind, P., Levelt, P. F., Hauser, O. P., and Joiner, J.: Abrupt decline in tropospheric nitrogen dioxide over China after the outbreak of COVID-19, Sci. Adv., 6, eabc2992, https://doi.org/10.1126/sciadv.abc2992, 2020.
Liu, J., Tong, D., Zheng, Y., Cheng, J., Qin, X., Shi, Q., Yan, L., Lei, Y., and Zhang, Q.: Carbon and air pollutant emissions from China's cement industry 1990–2015: trends, evolution of technologies, and drivers, Atmos. Chem. Phys., 21, 1627–1647, https://doi.org/10.5194/acp-21-1627-2021, 2021.
Liu, Z., Ciais, P., Deng, Z., Davis, S. J., Zheng, B., Wang, Y., Cui, D., Zhu, B., Dou, X., Ke, P., Sun, T., Guo, R., Zhong, H., Boucher, O., Bréon, F.-M., Lu, C., Guo, R., Xue, J., Boucher, E., Tanaka, K., and Chevallier, F.: Carbon Monitor, a near-real-time daily dataset of global CO2 emission from fossil fuel and cement production, Sci. Data, 7, 392, https://doi.org/10.1038/s41597-020-00708-7, 2020a.
Liu, Z., Ciais, P., Deng, Z., Lei, R., Davis, S. J., Feng, S., Zheng, B., Cui, D., Dou, X., Zhu, B., Guo, R., Ke, P., Sun, T., Lu, C., He, P., Wang, Y., Yue, X., Wang, Y., Lei, Y., Zhou, H., Cai, Z., Wu, Y., Guo, R., Han, T., Xue, J., Boucher, O., Boucher, E., Chevallier, F., Tanaka, K., Wei, Y., Zhong, H., Kang, C., Zhang, N., Chen, B., Xi, F., Liu, M., Bréon, F.-M., Lu, Y., Zhang, Q., Guan, D., Gong, P., Kammen, D. M., He, K., and Schellnhuber, H. J.: Near-real-time monitoring of global CO2 emissions reveals the effects of the COVID-19 pandemic, Nat. Commun., 11, 5172, https://doi.org/10.1038/s41467-020-18922-7, 2020b.
Ministry of Transport of the People's Republic of China: Homepage, available at: https://www.mot.gov.cn/shuju/, last access: 10 November 2020.
Miyazaki, K., Bowman, K., Sekiya, T., Jiang, Z., Chen, X., Eskes, H., Ru, M., Zhang, Y., and Shindell, D.: Air Quality Response in China Linked to the 2019 Novel Coronavirus (COVID-19) Lockdown, Geophys. Res. Lett., 47, e2020GL089252, https://doi.org/10.1029/2020gl089252, 2020.
National Bureau of Statistics: Homepage, available at: https://data.stats.gov.cn/, last access: 10 November 2020.
National Center for Atmospheric Research (NCAR): Weather Research and Forecasting Model V3.9.1, available at: https://github.com/NCAR/WRFV3/releases/tag/V3.9.1, last access: 10 November 2020.
National Development and Reform Commission: Homepage, available at: https://www.ndrc.gov.cn/fgsj/tjsj/jjyx/mdyqy/, last access: 10 November 2020.
Peng, L., Zhang, Q., Yao, Z., Mauzerall, D. L., Kang, S., Du, Z., Zheng, Y., Xue, T., and He, K.: Underreported coal in statistics: A survey-based solid fuel consumption and emission inventory for the rural residential sector in China, Appl. Energ., 235, 1169–1182, https://doi.org/10.1016/j.apenergy.2018.11.043, 2019.
Qi, J., Zheng, B., Li, M., Yu, F., Chen, C., Liu, F., Zhou, X., Yuan, J., Zhang, Q., and He, K.: A high-resolution air pollutants emission inventory in 2013 for the Beijing-Tianjin-Hebei region, China, Atmos. Environ., 170, 156–168, https://doi.org/10.1016/j.atmosenv.2017.09.039, 2017.
TOMTOM: TOMTOM Traffic Index, available at: https://www.tomtom.com/en_gb/traffic-index/, last access: 10 November 2020.
United States Environmental Protection Agency (USEPA): The Community Multiscale Air Quality V5.2, available at: https://github.com/USEPA/CMAQ/tree/5.2, last access: 10 November 2020.
van der Werf, G. R., Randerson, J. T., Giglio, L., van Leeuwen, T. T., Chen, Y., Rogers, B. M., Mu, M., van Marle, M. J. E., Morton, D. C., Collatz, G. J., Yokelson, R. J., and Kasibhatla, P. S.: Global fire emissions estimates during 1997–2016, Earth Syst. Sci. Data, 9, 697–720, https://doi.org/10.5194/essd-9-697-2017, 2017.
Venter, Z. S., Aunan, K., Chowdhury, S., and Lelieveld, J.: COVID-19 lockdowns cause global air pollution declines, P. Natl. Acad. Sci. USA, 117, 18984–18990, https://doi.org/10.1073/pnas.2006853117, 2020.
Wind: Win.d, available at: https://www.wind.com.cn/, last access: 10 November 2020.
Xing, J., Li, S., Jiang, Y., Wang, S., Ding, D., Dong, Z., Zhu, Y., and Hao, J.: Quantifying the emission changes and associated air quality impacts during the COVID-19 pandemic on the North China Plain: a response modeling study, Atmos. Chem. Phys., 20, 14347–14359, https://doi.org/10.5194/acp-20-14347-2020, 2020.
Zhang, Q., Zheng, Y., Tong, D., Shao, M., Wang, S., Zhang, Y., Xu, X., Wang, J., He, H., Liu, W., Ding, Y., Lei, Y., Li, J., Wang, Z., Zhang, X., Wang, Y., Cheng, J., Liu, Y., Shi, Q., Yan, L., Geng, G., Hong, C., Li, M., Liu, F., Zheng, B., Cao, J., Ding, A., Gao, J., Fu, Q., Huo, J., Liu, B., Liu, Z., Yang, F., He, K., and Hao, J.: Drivers of improved PM2.5 air quality in China from 2013 to 2017, P. Natl. Acad. Sci. USA, 116, 24463–24469, https://doi.org/10.1073/pnas.1907956116, 2019.
Zhang, Q., Pan, Y., He, Y., Walters, W. W., Ni, Q., Liu, X., Xu, G., Shao, J., and Jiang, C.: Substantial nitrogen oxides emission reduction from China due to COVID-19 and its impact on surface ozone and aerosol pollution, Sci. Total Environ., 753, 142238, https://doi.org/10.1016/j.scitotenv.2020.142238, 2021.
Zhang, R., Zhang, Y., Lin, H., Feng, X., Fu, T.-M., and Wang, Y.: NOx Emission Reduction and Recovery during COVID-19 in East China, Atmosphere, 11, 433, https://doi.org/10.3390/atmos11040433, 2020.
Zheng, B., Huo, H., Zhang, Q., Yao, Z. L., Wang, X. T., Yang, X. F., Liu, H., and He, K. B.: High-resolution mapping of vehicle emissions in China in 2008, Atmos. Chem. Phys., 14, 9787–9805, https://doi.org/10.5194/acp-14-9787-2014, 2014.
Zheng, B., Zhang, Q., Zhang, Y., He, K. B., Wang, K., Zheng, G. J., Duan, F. K., Ma, Y. L., and Kimoto, T.: Heterogeneous chemistry: a mechanism missing in current models to explain secondary inorganic aerosol formation during the January 2013 haze episode in North China, Atmos. Chem. Phys., 15, 2031–2049, https://doi.org/10.5194/acp-15-2031-2015, 2015.
Zheng, B., Zhang, Q., Tong, D., Chen, C., Hong, C., Li, M., Geng, G., Lei, Y., Huo, H., and He, K.: Resolution dependence of uncertainties in gridded emission inventories: a case study in Hebei, China, Atmos. Chem. Phys., 17, 921–933, https://doi.org/10.5194/acp-17-921-2017, 2017.
Zheng, B., Tong, D., Li, M., Liu, F., Hong, C., Geng, G., Li, H., Li, X., Peng, L., Qi, J., Yan, L., Zhang, Y., Zhao, H., Zheng, Y., He, K., and Zhang, Q.: Trends in China's anthropogenic emissions since 2010 as the consequence of clean air actions, Atmos. Chem. Phys., 18, 14095–14111, https://doi.org/10.5194/acp-18-14095-2018, 2018a.
Zheng, B., Zhang, Q., Davis, S. J., Ciais, P., Hong, C., Li, M., Liu, F., Tong, D., Li, H., and He, K.: Infrastructure Shapes Differences in the Carbon Intensities of Chinese Cities, Environ. Sci. Technol., 52, 6032–6041, https://doi.org/10.1021/acs.est.7b05654, 2018b.
Zheng, B., Chevallier, F., Yin, Y., Ciais, P., Fortems-Cheiney, A., Deeter, M. N., Parker, R. J., Wang, Y., Worden, H. M., and Zhao, Y.: Global atmospheric carbon monoxide budget 2000–2017 inferred from multi-species atmospheric inversions, Earth Syst. Sci. Data, 11, 1411–1436, https://doi.org/10.5194/essd-11-1411-2019, 2019.
Zheng, B., Geng, G., Ciais, P., Davis, S. J., Martin, R. V., Meng, J., Wu, N., Chevallier, F., Broquet, G., Boersma, F., van der A, R., Lin, J., Guan, D., Lei, Y., He, K., and Zhang, Q.: Satellite-based estimates of decline and rebound in China's CO2 emissions during COVID-19 pandemic, Sci. Adv., 6, eabd4998, https://doi.org/10.1126/sciadv.abd4998, 2020.
Zheng, B., Zhang, Q., Geng, G., Shi, Q., Lei, Y., and He, K.: Changes in China's anthropogenic emissions during the COVID-19 pandemic [data set], figshare, https://doi.org/10.6084/m9.figshare.c.5214920.v2, 2021.