the Creative Commons Attribution 4.0 License.
the Creative Commons Attribution 4.0 License.
 | 04 Jun 2021
University of Colorado and Black Swift Technologies RPAS-based measurements of the lower atmosphere during LAPSE-RATE
Cory Dixon
Steven Borenstein
Dale A. Lawrence
Jack Elston
Daniel Hesselius
Maciej Stachura
Roger Laurence III
Sara Swenson
Christopher M. Choate
Abhiram Doddi
Aiden Sesnic
Katherine Glasheen
Zakariya Laouar
Flora Quinby
Eric Frew
Brian M. Argrow
Between 14 and 20 July 2018, small remotely piloted aircraft systems (RPASs) were deployed to the San Luis Valley of Colorado (USA) together with a variety of surface-based remote and in situ sensors as well as radiosonde systems as part of the Lower Atmospheric Profiling Studies at Elevation – a Remotely-piloted Aircraft Team Experiment (LAPSE-RATE). The observations from LAPSE-RATE were aimed at improving our understanding of boundary layer structure, cloud and aerosol properties, and surface–atmosphere exchange and provide detailed information to support model evaluation and improvement work. The current paper describes the observations obtained using four different types of RPASs deployed by the University of Colorado Boulder and Black Swift Technologies. These included the DataHawk2, the Talon and the TTwistor (University of Colorado), and the S1 (Black Swift Technologies). Together, these aircraft collected over 30 h of data throughout the northern half of the San Luis Valley, sampling altitudes between the surface and 914 m a.g.l. Data from these platforms are publicly available through the Zenodo archive and are co-located with other LAPSE-RATE data as part of the Zenodo LAPSE-RATE community (https://zenodo.org/communities/lapse-rate/, last access: 27 May 2021). The primary DOIs for these datasets are https://doi.org/10.5281/zenodo.3891620 (DataHawk2, de Boer et al., 2020a, e), https://doi.org/10.5281/zenodo.4096451 (Talon, de Boer et al., 2020d), https://doi.org/10.5281/zenodo.4110626 (TTwistor, de Boer et al., 2020b), and https://doi.org/10.5281/zenodo.3861831 (S1, Elston and Stachura, 2020).
- Article
(8263 KB) - Full-text XML
- BibTeX
- EndNote


During the summer of 2018, the University of Colorado along with the Earth System Research Laboratory (ESRL) of the National Oceanic and Atmospheric Administration (NOAA) and National Center for Atmospheric Research (NCAR) hosted the annual meeting for the International Society for Atmospheric Research using Remotely piloted Aircraft (ISARRA; de Boer et al., 2019a). Along with this conference the organizers set up a “flight week”, where participating groups could conduct remotely piloted aircraft system (RPAS) flights in a coordinated manner to make scientifically relevant measurements of the lower atmosphere. This campaign, titled “Lower Atmospheric Profiling Studies at Elevation – a Remotely-piloted Aircraft Team Experiment” (LAPSE-RATE, de Boer et al., 2020a, c), brought together a variety of teams to Colorado's San Luis Valley for a week of atmospheric science-centric RPAS operation. A summary of the LAPSE-RATE campaign, including an overview of meteorological conditions and the San Luis Valley sampling environment, is provided in an overview paper at the beginning of this special issue (de Boer et al., 2020c).
As a part of the LAPSE-RATE effort, a team of participants from the University of Colorado Boulder (CU) and Black Swift Technologies (BST) contributed a week of time and RPAS and ground-based equipment. These teams, originating in CU's Integrated Remote and In Situ Sensing (IRISS) grand challenge project, the Cooperative Institute for Research in Environmental Science (CIRES), and the Department of Aerospace Engineering's Research and Engineering Center for Unmanned Vehicles (RECUV), consisted of a combination of scientists, engineers, and students and leveraged the technology and expertise developed over a variety of previous successful RPAS-based atmospheric science deployments conducted by the University of Colorado. These include development of equipment and execution of field campaigns to better understand the thermodynamic and dynamic environments around supercell thunderstorms (Koch et al., 2018; Frew et al., 2012; Houston et al., 2012), extensive operation of RPASs at high latitudes (de Boer et al., 2016, 2018, 2019b, c; Cassano et al., 2016; Cassano, 2014; Intrieri et al., 2014; Knuth et al., 2013), and the use of these platforms to understand turbulence around the world, including in tropical cyclones (Cione et al., 2020). Similarly, BST has an extensive background of conducting RPAS operations for environmental science as evidenced by a variety of studies and synthesis papers (Elston et al., 2015, 2011a, b). This experience has resulted in a variety of innovative operational modes, including a roaming flight pattern called “follow me”, in which the aircraft is trained to follow a flight pattern centered on a moving vehicle. This pattern provided insight into spatial gradients across the valley, as discussed later.
For the LAPSE-RATE campaign, the CU and BST teams were interested in contributing to all of the science goals connected to the campaign, including
-
convective initiation,
-
the morning boundary layer transition,
-
density currents and drainage flows,
-
aerosol properties, and
-
sensor and platform intercomparison work.
CU and BST participation included a significant number of participants (>15); several operations vehicles; over 10 unmanned aircraft; and a mobile atmospheric observatory, command/control center, and computing facility (see de Boer et al., 2021). The next section provides an overview of the RPASs deployed, including information on the platforms and the sensors they carried, as well as the unique capabilities offered by each. Section 3 provides insight into the sampling that was completed, including information on measurement locations, the types of weather conditions sampled, general details on flight strategies, statistics summarizing the flights and data collected, and information on interesting events sampled. Section 4 provides an overview of data processing and quality control, while Sect. 5 offers insight into data availability (and DOIs). Finally, we summarize the paper and dataset and provide information on contributions of authors, funding sources, and collaborators.
Table 1An overview of the platforms and meteorologically relevant measurements from each. The total number of campaign flight hours covered by each platform are included in brackets in the first (leftmost) column.
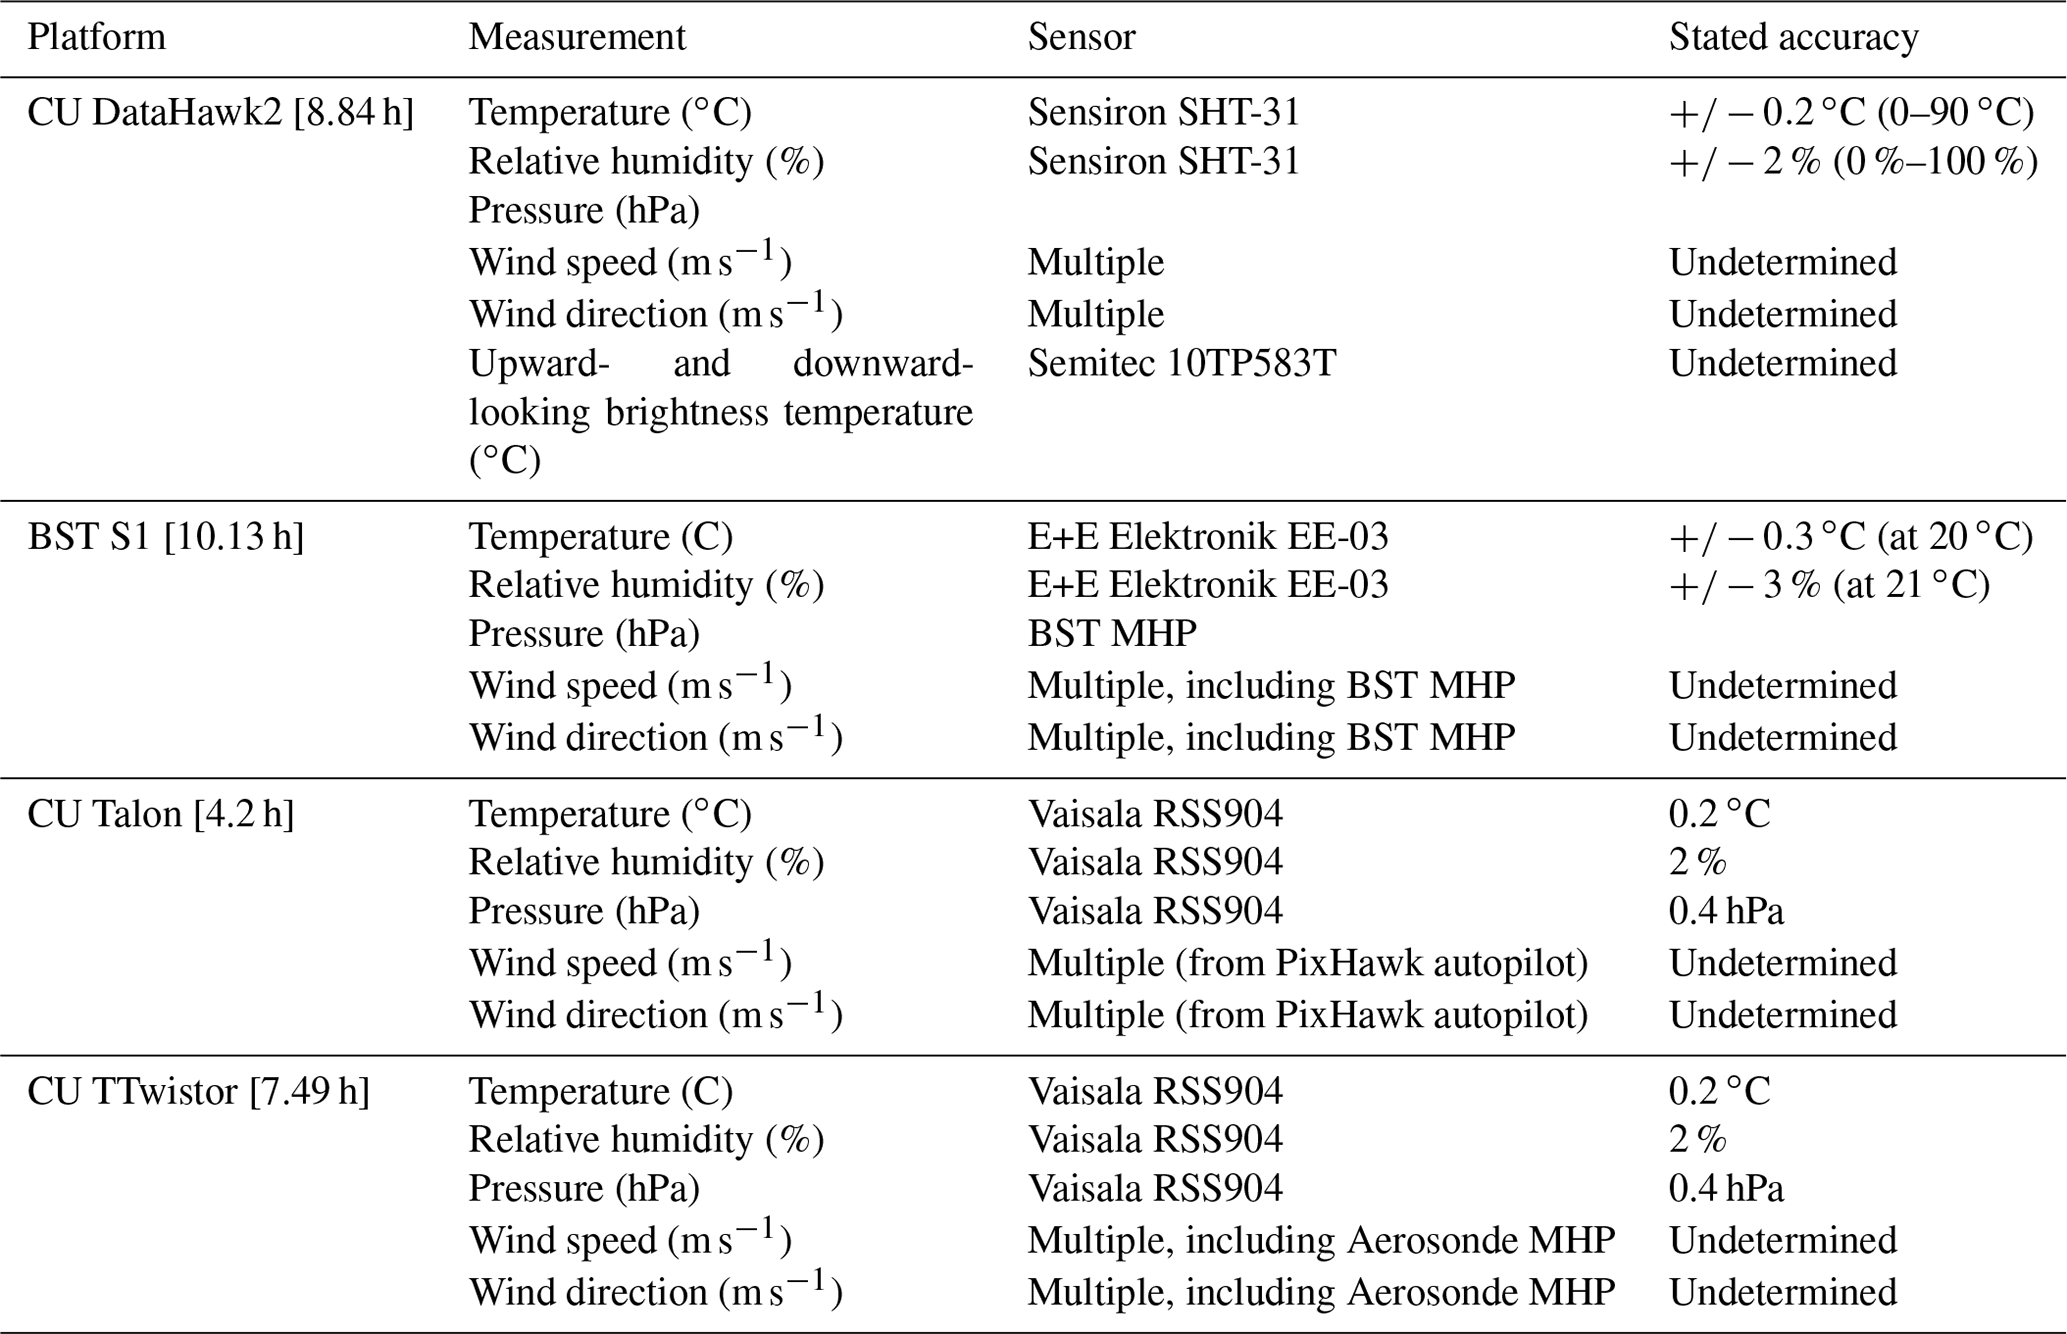
During LAPSE-RATE, CU and BST operated a combination of six different RPAS types. An overview of these systems is provided in Table 1. These range from commercially available airframes with open-source autopilot systems to custom systems entirely designed, developed, and constructed at CU and BST. In this section, we provide an overview of the different aircraft and the sensors carried by each.
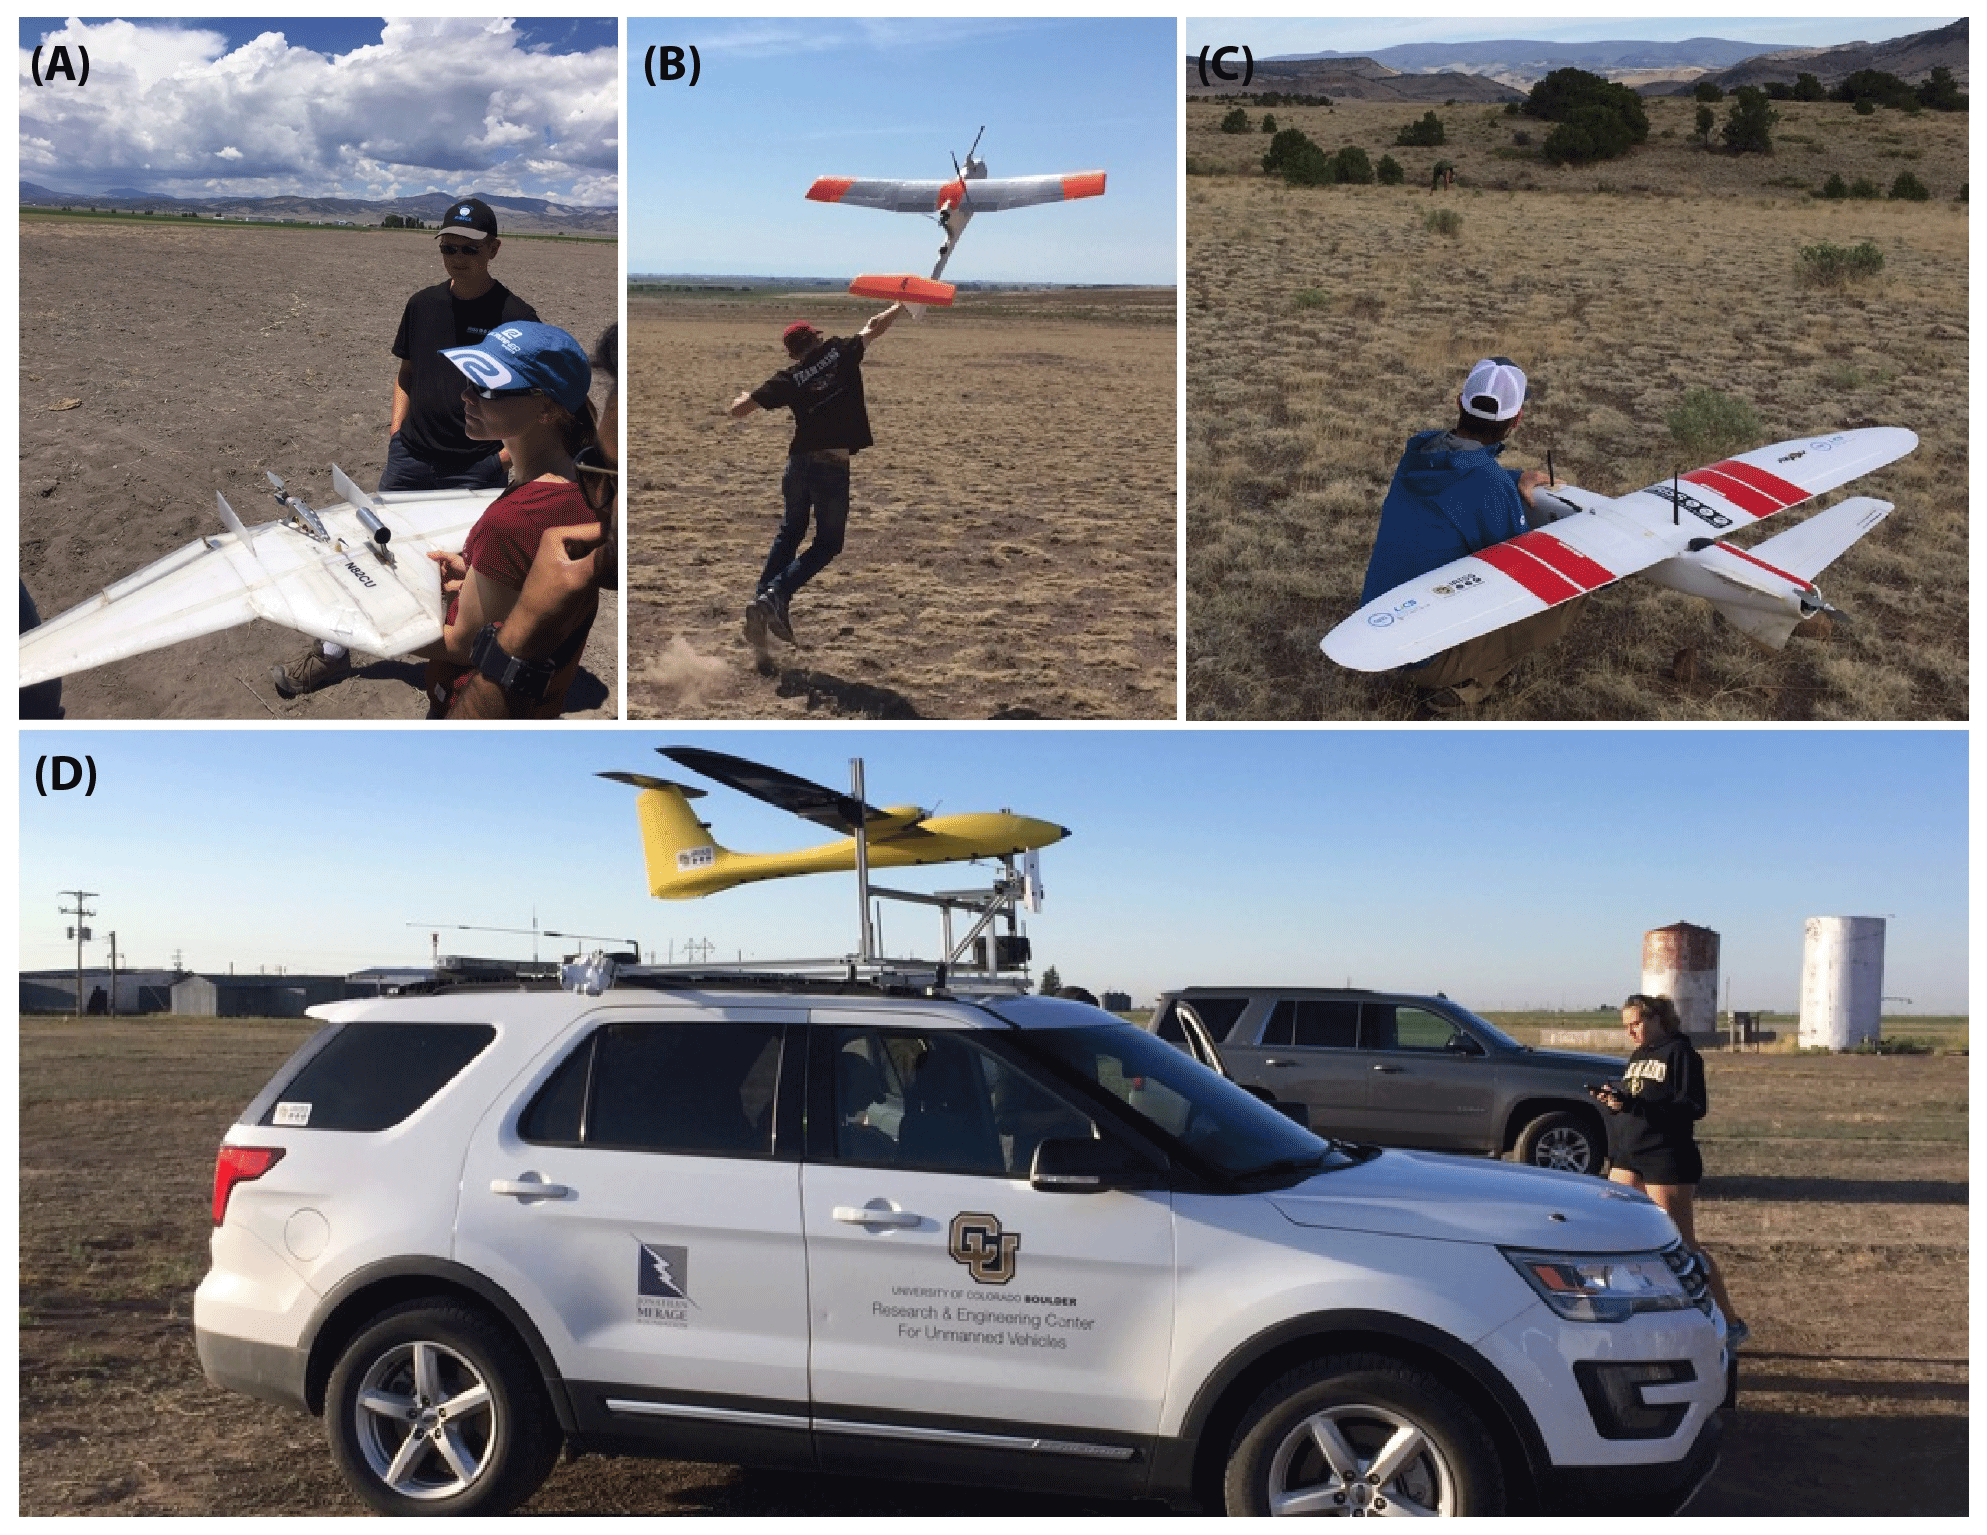
Figure 1The aircraft used to collect the datasets described in this paper. Clockwise from the top left: the CU DataHawk2, the BST S1, the CU Talon, and the CU TTwistor mounted on top of a tracker vehicle for launch prior to follow-me operations.
One of the CU aircraft with the most amount of flight time during LAPSE-RATE was the DataHawk2 platform (Fig. 1a). This system, developed and designed entirely within RECUV, consists of a lightweight (<1 kg takeoff weight), 1.2 m fixed-wing foam pusher-prop aircraft, with a custom autopilot system and sensor suite. Capable of approximately 45 min of flight with a standard battery configuration and featuring a cruise speed of 14–16 m s−1, the DataHawk2 has a theoretical range of approximately 40 km. It has operated in a variety of environments, including the high Arctic (de Boer et al., 2018, 2019b), Asia (Kantha et al., 2017), and South America (Scipión et al., 2016). The DataHawk2's relatively slow flight speed (14 m s−1, burst up to 22 m s−1) allows the platform to obtain measurements at high spatial resolution when compared to other aerial vehicles, making it ideal for studies of atmospheric turbulence at fine scales (e.g., Kantha et al., 2017; Balsley et al., 2018). Despite this relatively slow speed, the DataHawk2 has been operated in winds up to 12 m s−1, making it a robust research platform for the harsh Arctic environment. The aircraft is capable of autonomous operation, although most flights (including all of the LAPSE-RATE flights) are completed under a remote-pilot scenario, where the aircraft is guided and monitored using a computer ground station. The DataHawk2 collected 8.84 h of data during LAPSE-RATE.
The DataHawk2 system carries a variety of sensors for measuring atmospheric and surface properties. Custom-built instrumentation includes a fine wire sensor array employing two cold wires and one hot wire. These fine wires offer high-frequency (800 Hz) information on temperature and fine-scale turbulence. High bandwidth is enabled by small surface-area-to-volume ratios of very thin (5 µm diameter) wires. In addition to the fine wire array, the DataHawk2 carries custom electronics that include integrated-circuit slow response sensors (Sensiron SHT-31) for measurement of temperature through a calibrated semiconductor and relative humidity using a capacitive sensor. To measure surface and sky brightness temperatures, DataHawk2s are equipped with upward- and downward-looking thermopile sensors (Semitec 10TP583T with custom electronics). To provide additional information on thermodynamic structure, DataHawk2s have also carried the commercially available iMet1 radiosonde package, providing comparative information on position (GPS), temperature (bead thermistor), pressure (piezoresistive), and relative humidity (capacitive), as well as the Vaisala RSS421 sensor that is similar to the sensor suite used for the popular RS-41 radiosonde. However, neither the iMet1 nor RSS421 were installed during LAPSE-RATE. Finally, to estimate winds using the DataHawk2, information from the onboard GPS, pitot tube, and inertial measurement unit (IMU) is integrated to calculate all three wind vectors. This calculation is completed using equations presented in van den Kroonenberg (2008), under the assumption that the aircraft instantly reacts to perturbations in the local wind vector, meaning that the sideslip angle (β) is assumed to be zero and that the angle of attack (α) is set to be equal to the mean pitch of the aircraft in level flight. These sensors are logged at a variety of different acquisition rates. Specifically, the fine wire measurements were logged on board the aircraft at 800 Hz, while other variables were logged at 100 Hz. All data are interpolated to a common 10 Hz clock in the archived LAPSE-RATE datasets.
In addition to the DataHawk2, CU collaborated with BST to operate a Black Swift S1 RPAS (Fig. 1b) during LAPSE-RATE. This platform was originally designed as an advanced, fully autonomous survey and mapping platform. Equipped with the Black Swift Technologies SwiftCore flight management and autopilot system, remote operation and flight planning is done from a tablet. Takeoff is performed through non-assisted hand launches, and the advanced landing algorithm provides for robust and precise autonomous belly landings. The aircraft has a 1.7 m wingspan and a gross takeoff weight of 2.5 kg. When operated with a 13 600 mA h lithium polymer battery, it allows for an endurance of up to 1.5 h at a cruise speed of 17 m s−1, depending on the mission profile and environmental conditions. The aircraft has a high operational ceiling and has been used to perform mapping missions at altitudes up to 14 000 feet (4267.2 m) in Colorado. It has been employed for surveying work, land management, crop damage assessments, and large area ecological studies. During LAPSE-RATE, the S1 was equipped with the Black Swift Technologies multi-hole probe (BST MHP). This probe includes five pressure ports to measure the system's airspeed, angle of attack, and sideslip angle that can be combined with information from an INS and GPS to provide estimates of the horizontal and vertical wind speed and direction. The BST MHP includes an integrated E+E Elektronik EE-03 sensor for environmental humidity and temperature. This sensor has a stated accuracy of ± 3 % relative humidity for environmental conditions between 10 %–100 %, and a temperature accuracy of ± 0.3 ∘C at an ambient temperature of 20 ∘C. All data collected using the S1, with the exception of the temperature and humidity, were logged at 100 Hz. The temperature and humidity values were logged at 4 Hz. The S1 collected 10.13 h of data during LAPSE-RATE.
Beyond the DataHawk2 and S1, CU operated two other aircraft on a more limited basis. The first of these was the X-UAV Talon RPAS (Fig. 1c). These systems are small (1.7 m, 3 kg) airframes made of expanded polyolefin (EPO) foam and were outfitted with the PixHawk2 autopilot system running the open-source ArduPilot Plane software. For LAPSE-RATE, the Talons were set up to fly for approximately 45 min on a single battery at a cruise speed of 18 m s−1. As with the DataHawk2, this relatively slow flight speed provides high-resolution measurements from the custom payload that was flown on this platform. The Talons operated for LAPSE-RATE carried a Vaisala RSS904 sensor (similar sensor module to that used in the Vaisala RS-92 radiosonde) to make measurements of temperature, pressure, and humidity. The RSS904 features a capacitive wire temperature sensor with a 0.1 ∘C resolution, a thin-film capacitor humidity sensor with a resolution of 1 %, a silicon pressure sensor with a measurement resolution of 0.1 hPa, and expected accuracies of 0.2 ∘C, 2 % and 0.4 hPa, respectively, in temperature, RH, and pressure. The Talon collected 4.2 h of data during LAPSE-RATE.
The RSS904 sensor suite was integrated into a custom 3D-printed nose cone. In addition to measurements from the RSS904, wind speed and direction were estimated by the autopilot system, using a combination of the GPS velocities, aircraft attitude measurements from the inertial navigation system, and aircraft airspeed. Aircraft navigation data were logged at 10 Hz, while the pressure, temperature, and humidity values from the RSS904 were logged at 2 Hz. For a limited number of Talon flights, the aircraft carried a “microsonde” custom temperature, pressure, and humidity sensor suite developed at CU. The microsonde was developed to be integrated into a Lagrangian drifter called the Driftersonde (Swenson et al., 2019) that could be launched from small RPASs for atmospheric research. The microsonde includes a MS8607 pressure, temperature, and humidity (PTH) sensor from TE Connectivity, which consists of a piezoresistive pressure sensing element, which measures both barometric pressure and temperature. The piezoresistive microelectromechanical systems (MEMS) measure atmospheric pressure relative to a vacuum inside the MEMS, sealed by a thin membrane. A Wheatstone bridge logs temperature by measuring the temperature-dependent resistance. Additionally, the MS8607 includes a capacitive sensing element that features a dielectric polymer film, sensitive to humidity, between two electrodes to measure relative humidity. In addition to the MS8607, the microsonde includes a CAM-M8Q GPS module (u-blox) that provides reception of up to three global navigation satellite systems (GNSS) (GPS, Galileo, GLONASS, BeiDou) at a given time. The integration of the microsonde on the Talon during LAPSE-RATE was, in part, to provide a dataset to allow for direct comparison between the measurements it produced to those from the RSS904, which is considered to be an industry standard sensor suite. Microsonde data were logged at 1 Hz.
Finally, the other aircraft operated by CU that saw limited action during LAPSE-RATE was the TTwistor RPAS (Fig. 1d). The TTwistor is based on an earlier, proven design, the Tempest (Elston et al., 2011b; Roadman et al., 2012), which was deployed extensively to study severe weather in the midwestern United States. The TTwistor is a dual-motor RPAS capable of completing up to 3 h of continuous flight operations with an 18 000 mA h high-voltage lithium polymer (Li-HV) battery pack. This results in a range of 120–240 km, depending on operational mode and flight pattern, at a typical cruise speed of 28 m s−1. Additionally, the aircraft was designed to be capable of a fast (40+ m s−1) dash speed to allow it to get out of situations with strong winds around convective storms. The aircraft carries a PixHawk autopilot system for autonomous navigation between GPS coordinates and remote operation by a ground pilot. For LAPSE-RATE the TTwistor carried a payload consisting of a multi-hole pressure probe (MHP) from Aeroprobe Corporation; a VectorNav VN-200 inertial navigation system (INS); and a Vaisala RSS904 pressure, temperature, and humidity sensor system. The VN-200 has a stated dynamic accuracy of 0.1∘ (rms) in pitch and roll measurements and 0.3∘ (rms) in magnetic heading. Additionally, it features a stated 2.5 m (5.0 m) accuracy in horizontal (vertical) position and 0.05 m s−1 accuracy in velocity. In combination the airspeed, angle of attack, and sideslip angles from the MHP and attitude and ground-relative velocity information from the VN-200 allow for fully informed calculation of the vertical and horizontal winds. VN-200 data were logged at 50 Hz, MHP data were logged at 100 Hz, and the RSS904 variables were logged at 2 Hz.
The extended endurance of the TTwistor, along with advanced implementation of autopilot capabilities and a surface tracking vehicle (Fig. 1d), allows this platform to be deployed in a follow-me mode. In this mode of operation, the flight team is inside of a moving vehicle, and the aircraft is programmed to stay within a given distance of the vehicle while in flight. This allows for the execution of extended horizontal transects for collection of data on spatial variability and gradients. The follow-me mode has been used to make measurements of outflow boundaries associated with severe storms, and during LAPSE-RATE it was implemented to attempt to better understand the influence of surface heterogeneity on the overlying atmospheric state. The TTwistor collected 7.49 h of data during LAPSE-RATE.
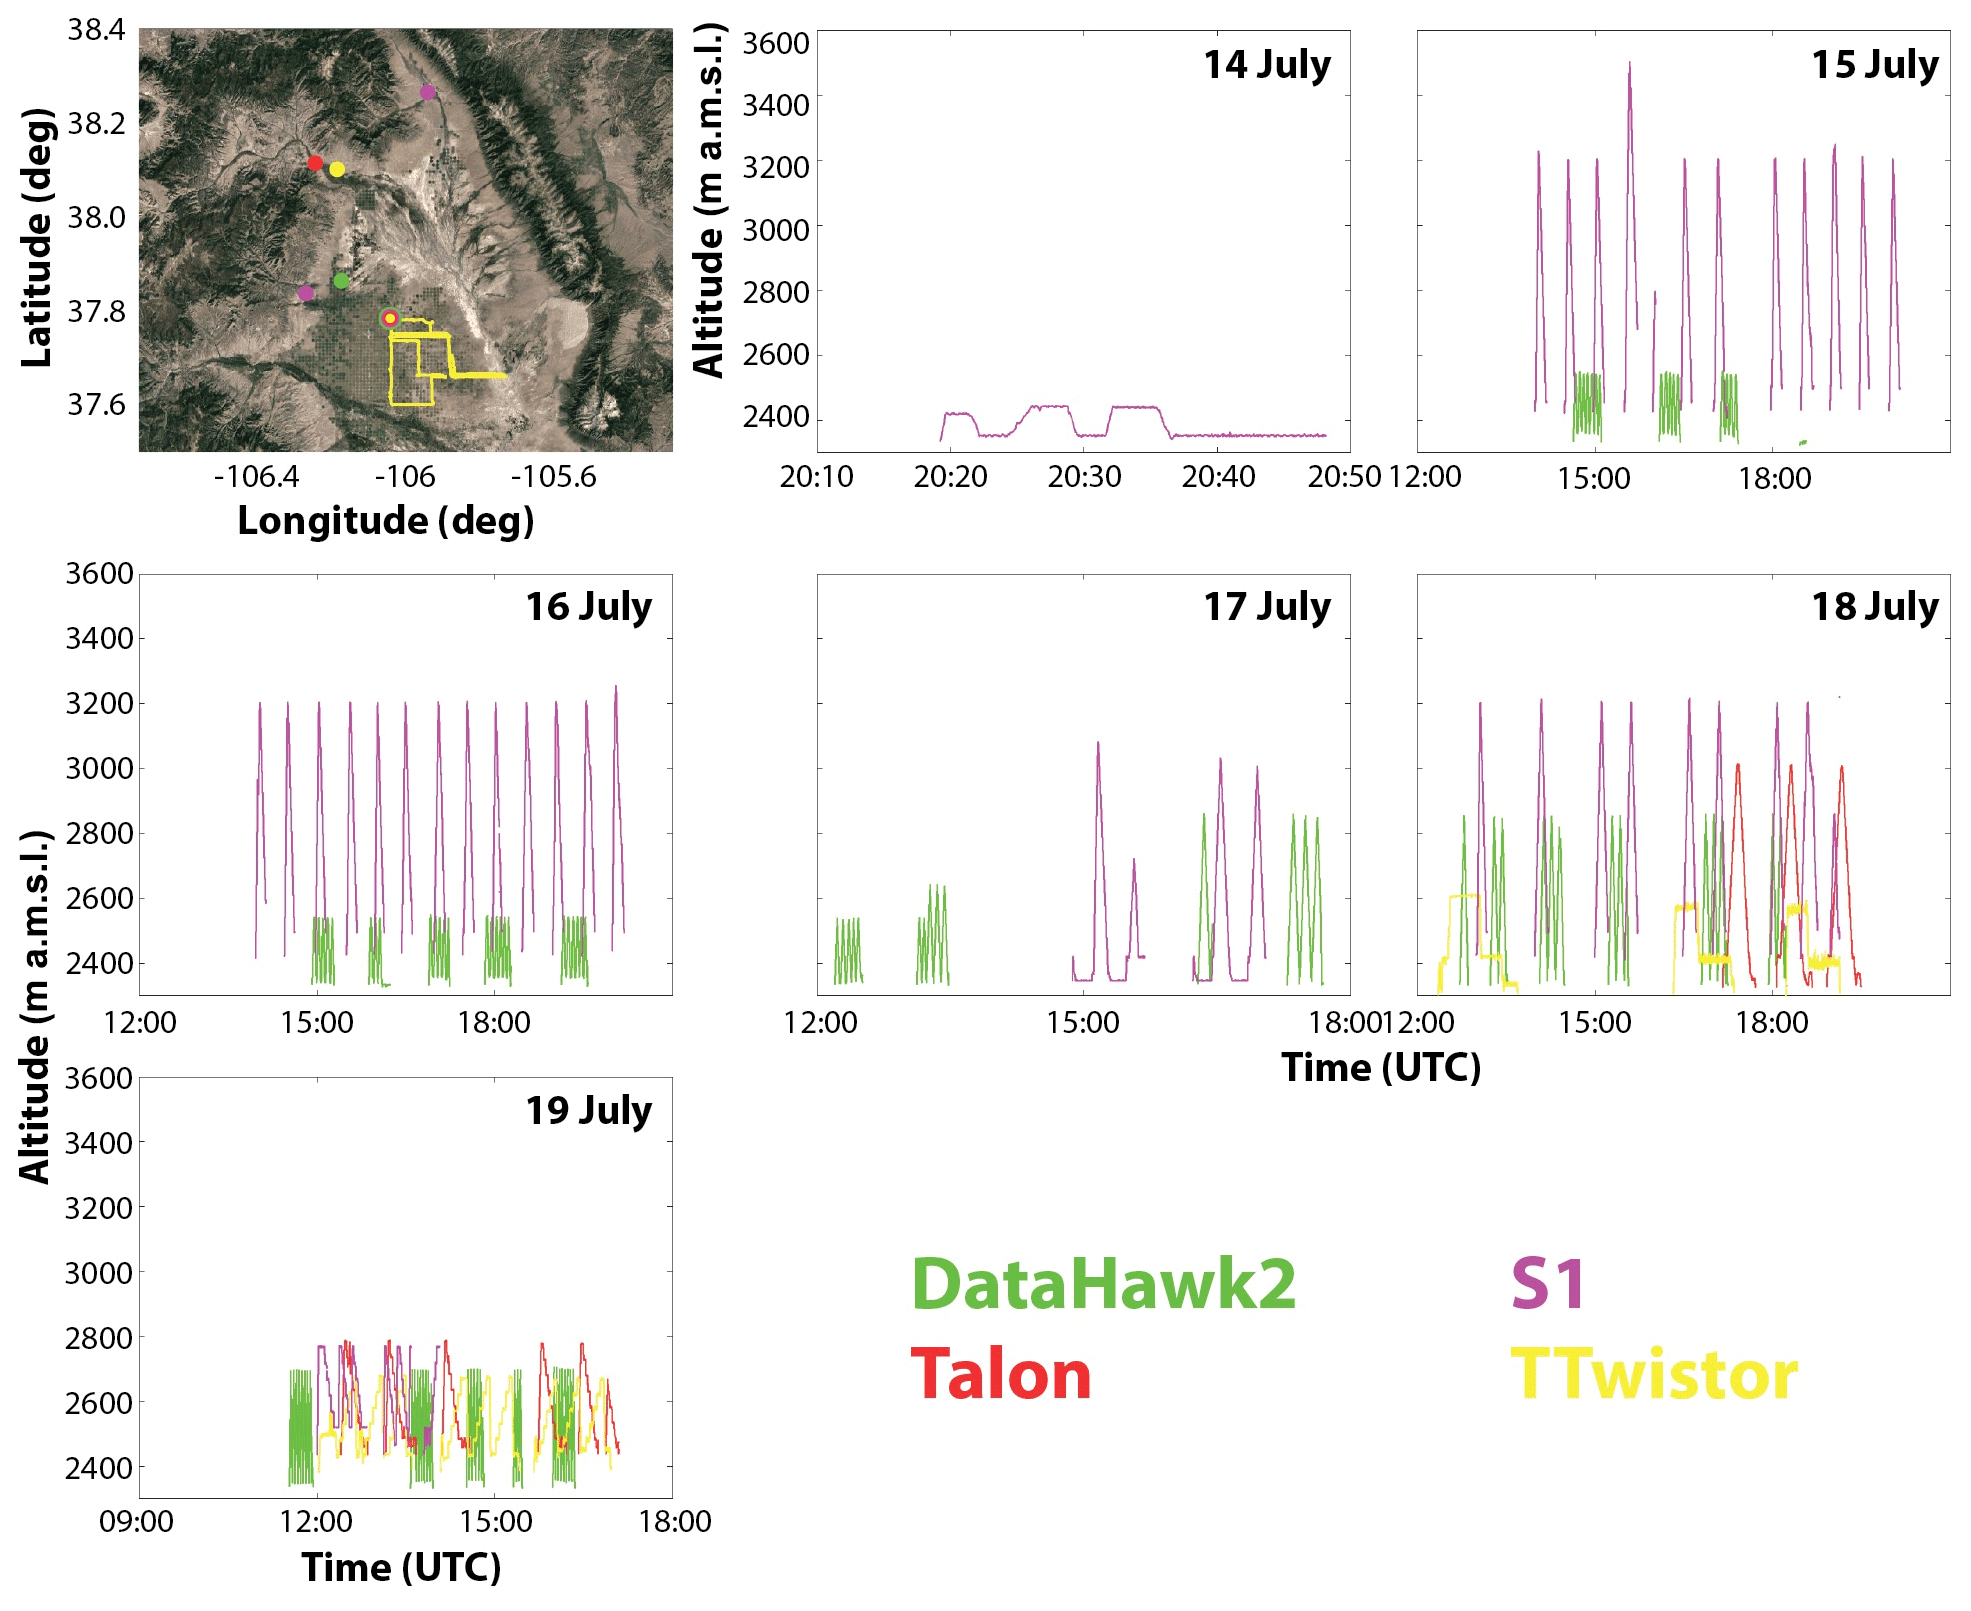
Figure 2The flight locations for each aircraft (left) and altitudes covered by the different aircraft broken down by day (right). Map backgrounds are © Google Maps 2021 and downloaded through their API.
Over the course of the 1-week LAPSE-RATE campaign, the platforms described above conducted flights over a variety of different areas to collect atmospheric data (Fig. 2). All of the aircraft involved conducted flights alongside the CU Mobile UAS Research Collaboratory (MURC; de Boer et al., 2021) at Leach Airport (37.79∘ N, 106.05∘ W) to allow for intercomparison of platforms and sensors. Unfortunately, the data from the Talon and TTwistor were not processed in time to be included in the formal intercomparison conducted through this effort (Barbieri et al., 2019).
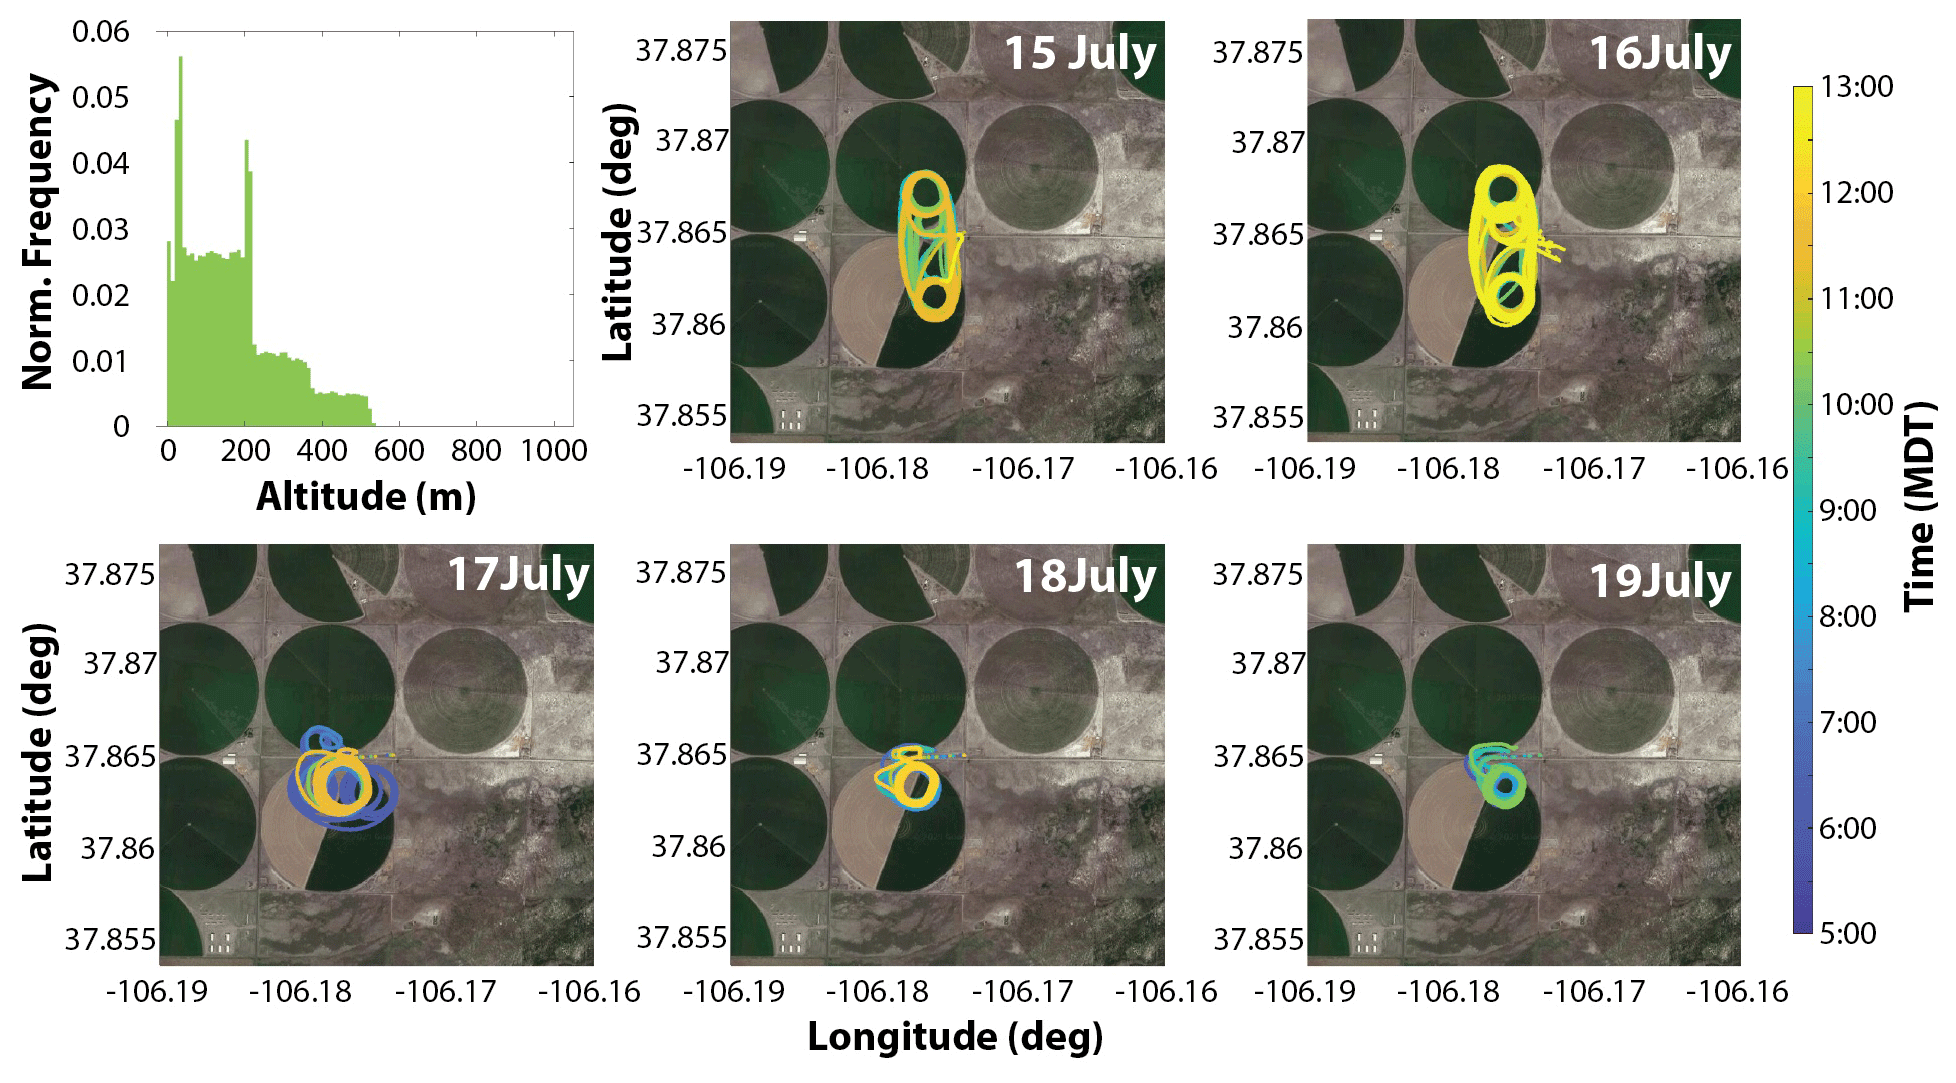
Figure 3A histogram of altitudes covered during LAPSE-RATE by the DataHawk2 (top left), along with the flight patterns covered by this aircraft during individual days of the campaign. See the map in Fig. 2 for additional details on flight location. Map backgrounds are © Google Maps 2021 and downloaded through their API.
Besides the limited flights conducted at Leach Airport, the remainder of the CU DataHawk2 LAPSE-RATE operations were conducted at a farm site in the western part of the San Luis Valley (approximately 37.86∘ N, 106.18∘ W; 2326 m above mean sea level, a.m.s.l.) near the intersection of County Road J and State Route 45 (see Fig. 3). This site featured large crop circles, each having different states of irrigation and plant activity. At this site, two primary flight modes were employed. The first of these was a basic profiling mode, where the aircraft conducted repeated vertical ascents and descents while following an orbital flight track. These flights were designed to evaluate the development of the boundary layer and temporal evolution of its structure during the morning hours. Profiles typically ranged between the surface and 500 m above ground level (a.g.l.). In addition to these profiling flights, additional emphasis was placed on attempting to measure differences in boundary layer development over different surface types, mainly between crop circles with different amounts of plant coverage and irrigation levels. For those flights, the aircraft were operated in a loiter pattern over two different crop circles for extended time periods.
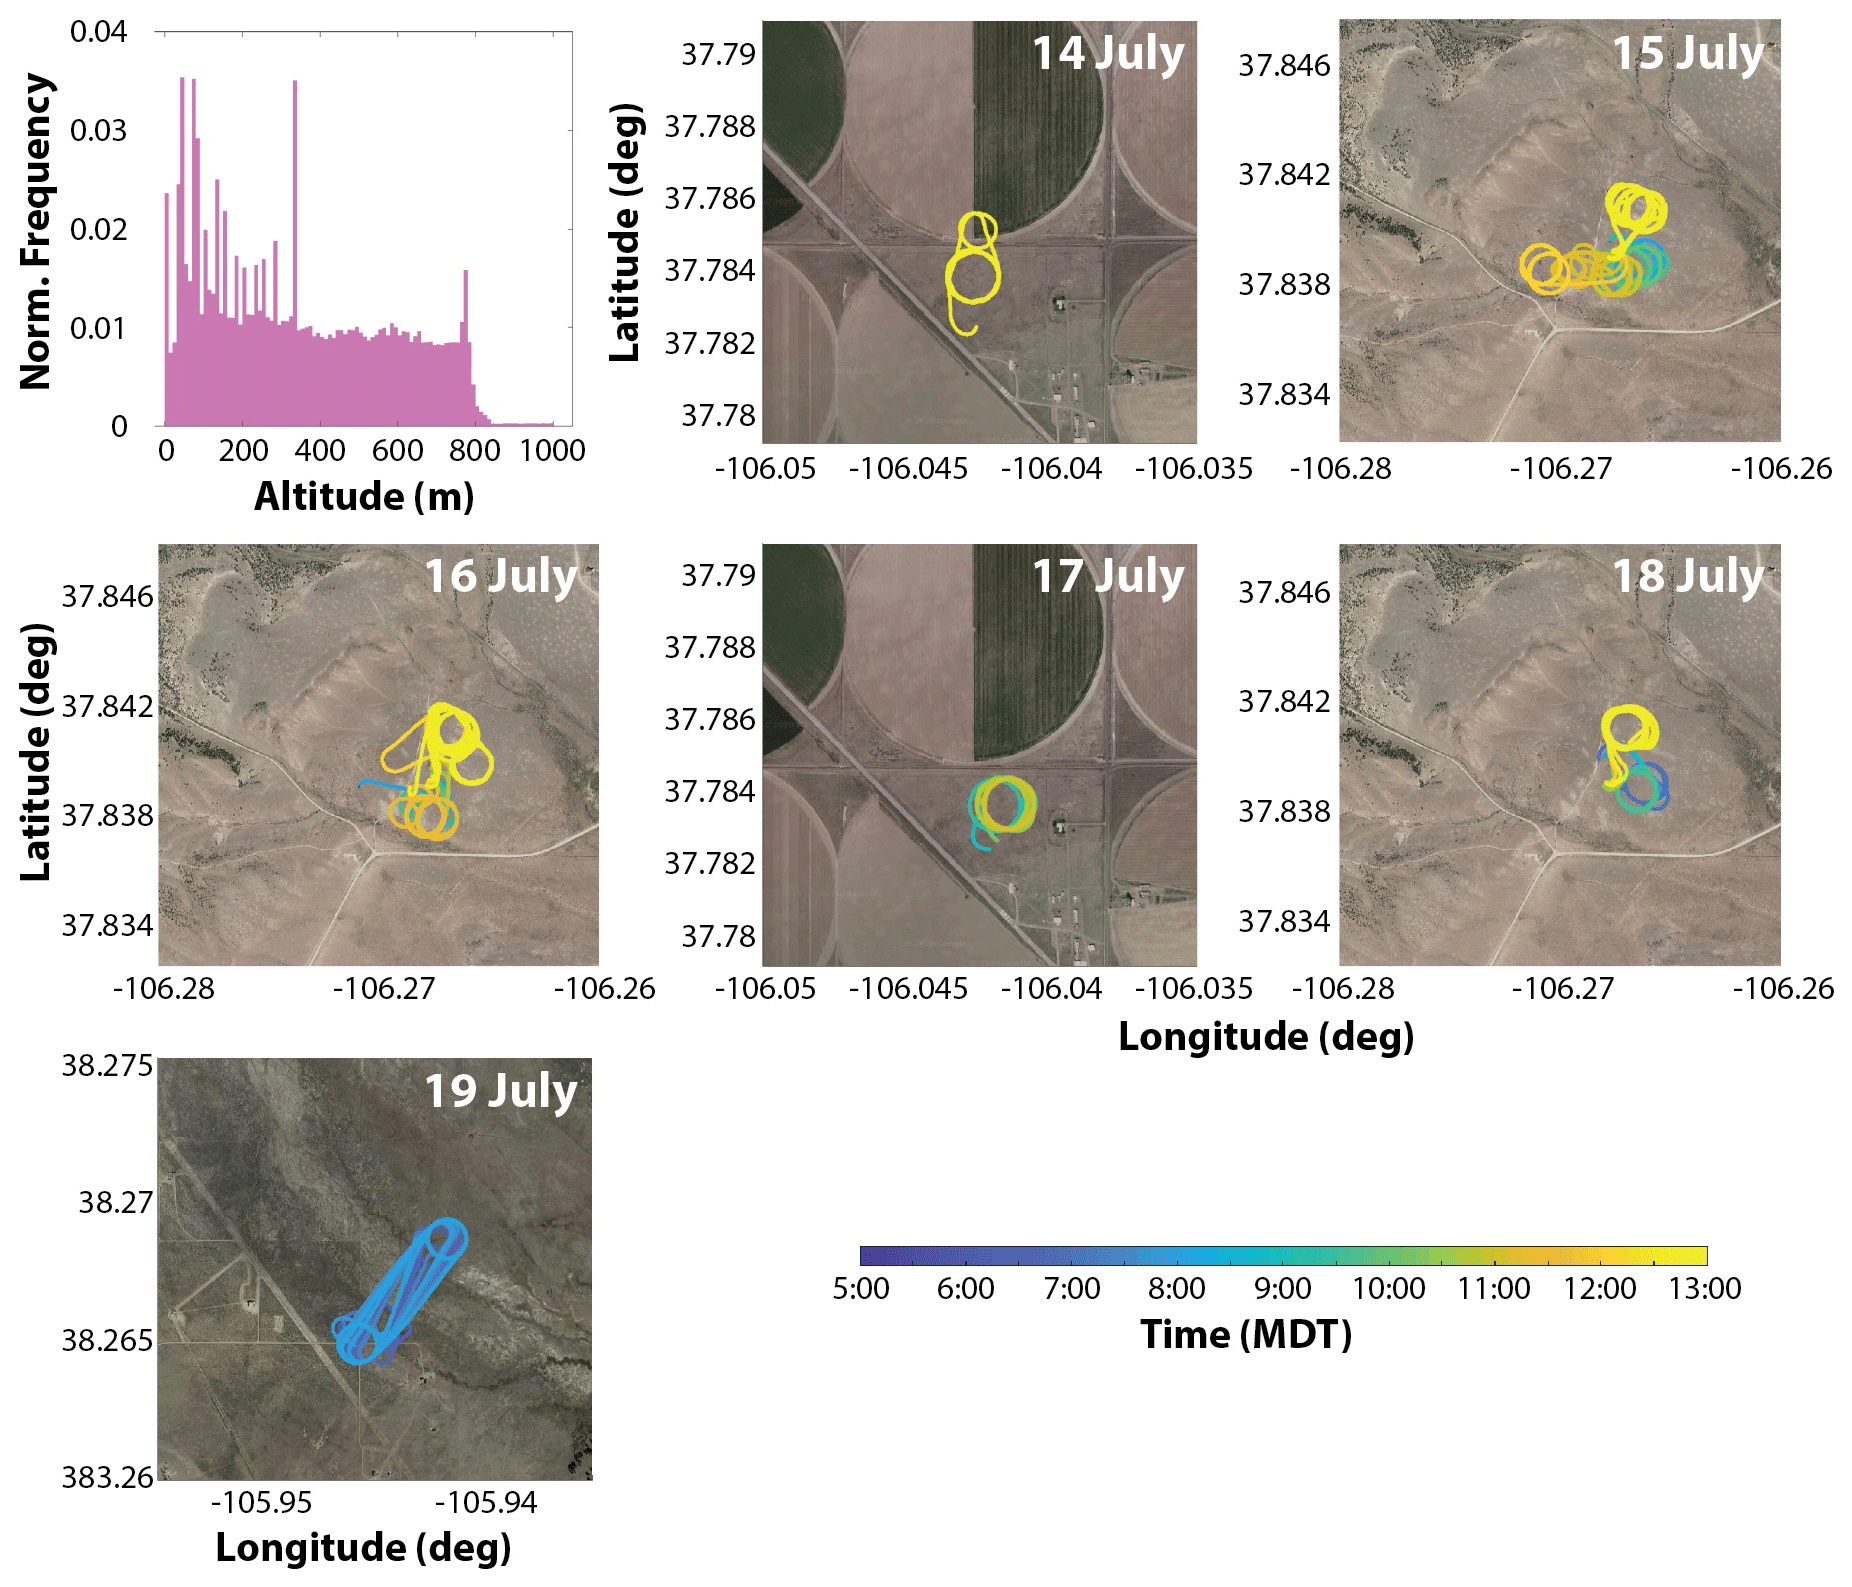
Figure 4A histogram of altitudes covered during LAPSE-RATE by the S1 (left), along with the flight patterns covered by this aircraft during individual days of the campaign. See the map in Fig. 2 for additional details on flight locations. Map backgrounds are © Google Maps 2021 and downloaded through their API.
With the exception of 19 July, the BST S1 was operated at the mouth of the Penitente Canyon, just to the north of the intersection between routes 38A and 40G (37.84∘ N, 106.27∘ W; 2400 m a.m.s.l.) (Fig. 4). At this location, the aircraft conducted nearly continuous profiling flights between the surface and approximately 800 m a.g.l. Flights were almost exclusively conducted in the morning and early afternoon (local time) hours. Flights on 19 July were conducted just to the north of the town of Villa Grove, Colorado, off of private property located off of County Road 57 at the end of an old airstrip (38.27∘ N, 105.94∘ W; 2415 m a.m.s.l.). These flights included a series of stepped racetracks between two points situated across a valley from one another and were designed to measure density-driven cold-air drainage flow into the main San Luis Valley. Flight altitudes for these drainage-flow flights spanned between the surface and approximately 350 m a.g.l.
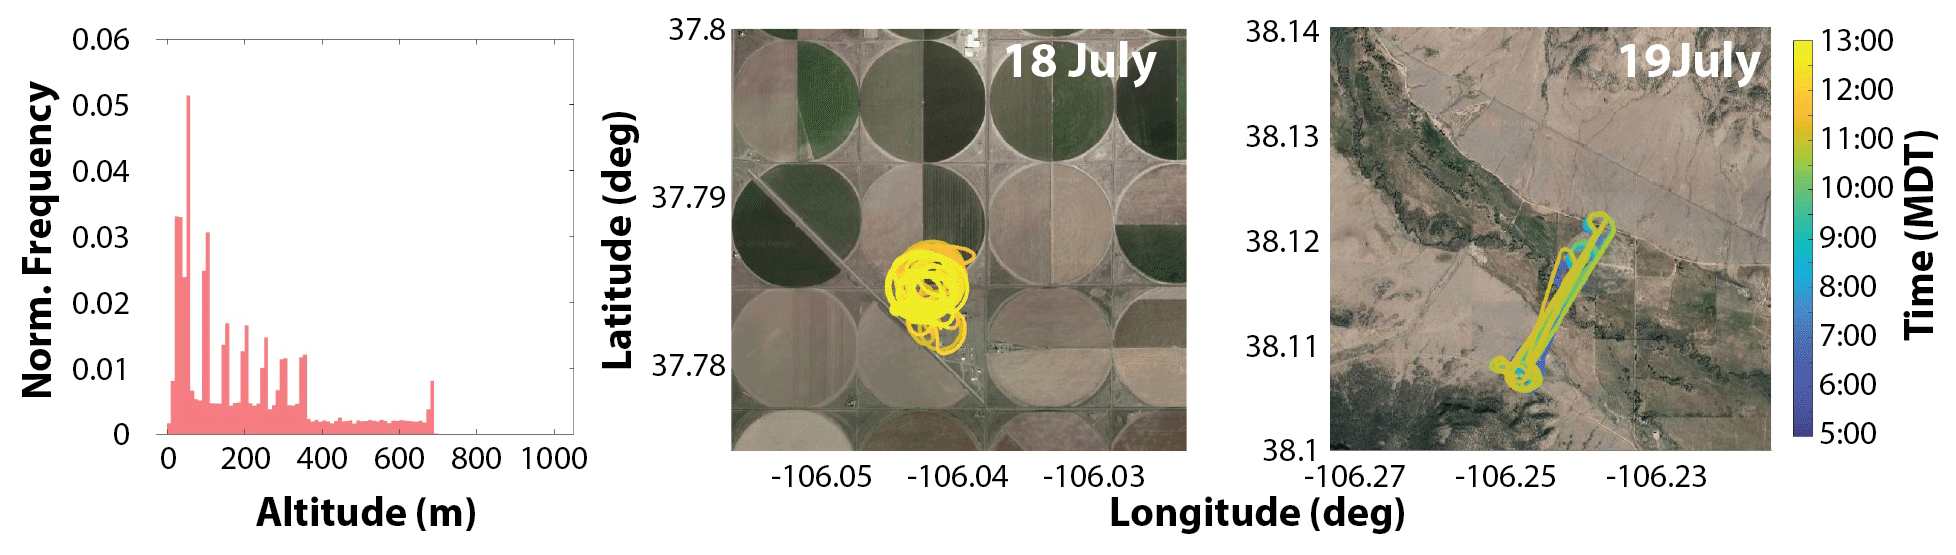
Figure 5A histogram of altitudes covered during LAPSE-RATE by the Talon (left), along with the flight patterns covered by this aircraft during individual days of the campaign. See the map in Fig. 2 for additional details on flight locations. Map backgrounds are © Google Maps 2021 and downloaded through their API.
The Talon conducted scientific flight operations on 18–19 July in two different locations, as shown in Fig. 5. Flight operations on 18 July were conducted at Leach Airport and included three profiling patterns to approximately 700 m a.g.l. These flights were meant to capture temporal variability of boundary layer structure and extend the vertical extent of the MURC measurements obtained at that location. Additionally, these flights offered an opportunity to compare the Talon observations with those from the MURC instrumentation tower, and some time was spent at the end of each flight operating at lower altitudes in proximity to the MURC. On 19 July, the Talon conducted six research flights in the Saguache Canyon starting around 06:15 local time, with operators perched above the valley floor off of County Road Cc36 (approximate location 38.105∘ N, 106.242∘ W). From here, the Talon was flown in a stepped racetrack pattern across the valley to the north-northeast, covering approximately 2 km of horizontal distance and transitioning between different altitudes at the conclusion of each racetrack to attempt to map out the spatial extent of the valley drainage flow. This included sampling at eight different altitudes, ranging between 350 and 30 m a.g.l., with the first six altitudes separated by 50 m and the last one by 20 m.
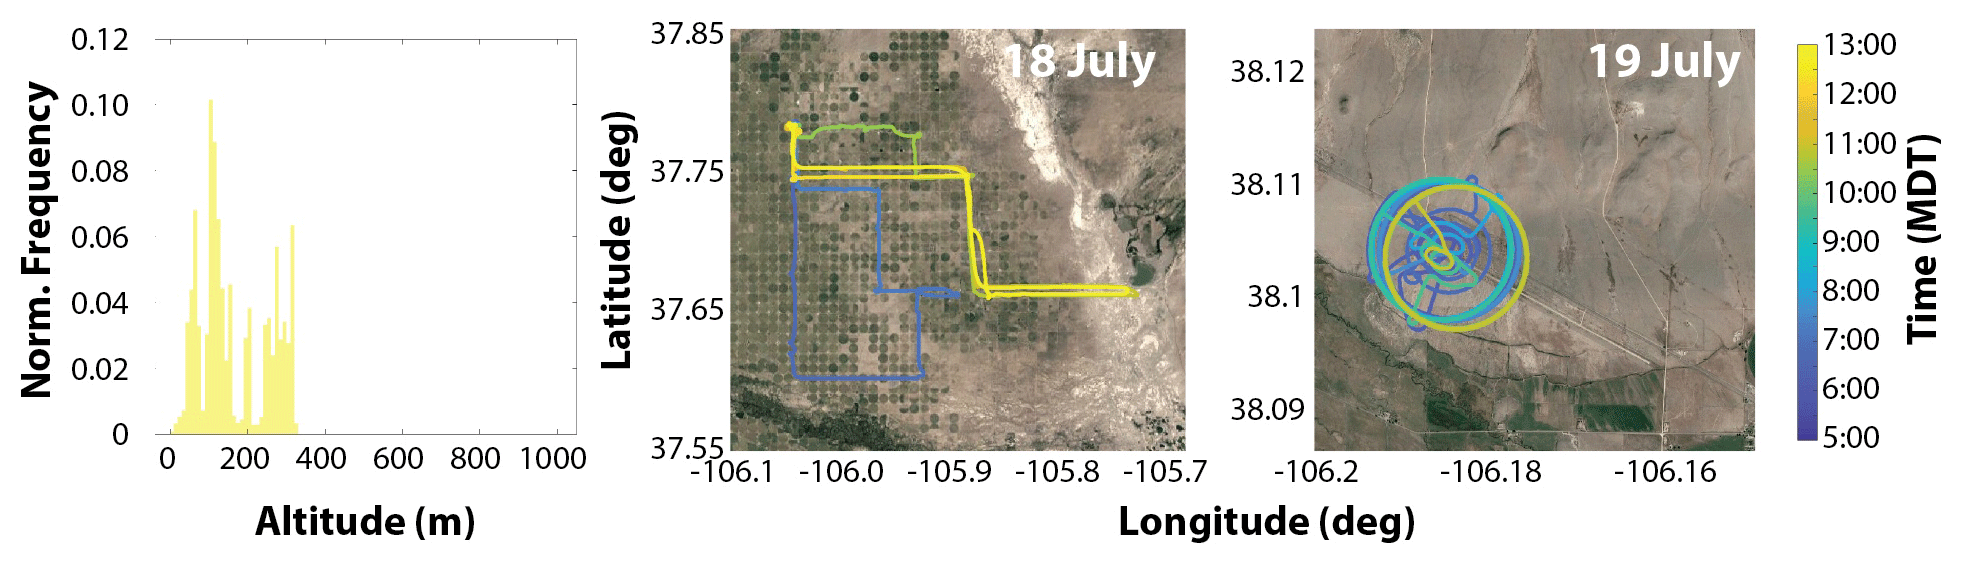
Figure 6A histogram of altitudes covered during LAPSE-RATE by the TTwistor (left), along with the flight patterns covered by this aircraft during individual days of the campaign. See the map in Fig. 2 for additional details on flight locations. Map backgrounds are © Google Maps 2021 and downloaded through their API.
Finally, the TTwistor was operated in two different modes during the LAPSE-RATE campaign, with flight locations illustrated in Fig. 6. On 18 July, the aircraft conducted flights in follow-me mode, where the aircraft operators are positioned in a vehicle-based mobile ground station. Under this mode of operation, the aircraft conducted extensive horizontal transects from Leach Airport through the eastern half of the San Luis Valley. These flights included sampling at various altitudes and were designed to document spatial variability between the more agricultural portions of the valley and the dry eastern shrubland. In total, three follow-me flights were conducted, with the earliest of these taking the aircraft directly south of Leach Airport, before completing an easterly transect and returning back to the north. The second follow-me flight took the aircraft further to the east and included a north–south leg approximately one-fourth and three-fourths of the way through the flight. The third flight followed a similar route to the second. In general, the first half of these follow-me flights were conducted at approximately 300 m a.g.l., with the second half conducted at approximately 120 m a.g.l. In addition, the first flight also included a short sampling period at approximately 25 m a.g.l. to foster comparison with the MURC tower. On 19 July, the TTwistor operated from the western end of the Saguache airport to conduct coordinated sampling of cold-air drainage in the Saguache Canyon. From there, the aircraft conducted three flights in which it stepped through altitudes between 45 and 270 m a.g.l. in 45 m increments, while operating in a large orbit. The large orbit was meant to capture spatial variability of the drainage flow within the width of the canyon, with the aircraft covering approximately one-third of that width in the northern portion of the valley. Flights on the 19 July were initiated at around 06:00 local time (MDT) in order to capture the most intense portions of the drainage flow, which begins to taper off with solar heating of the surface.
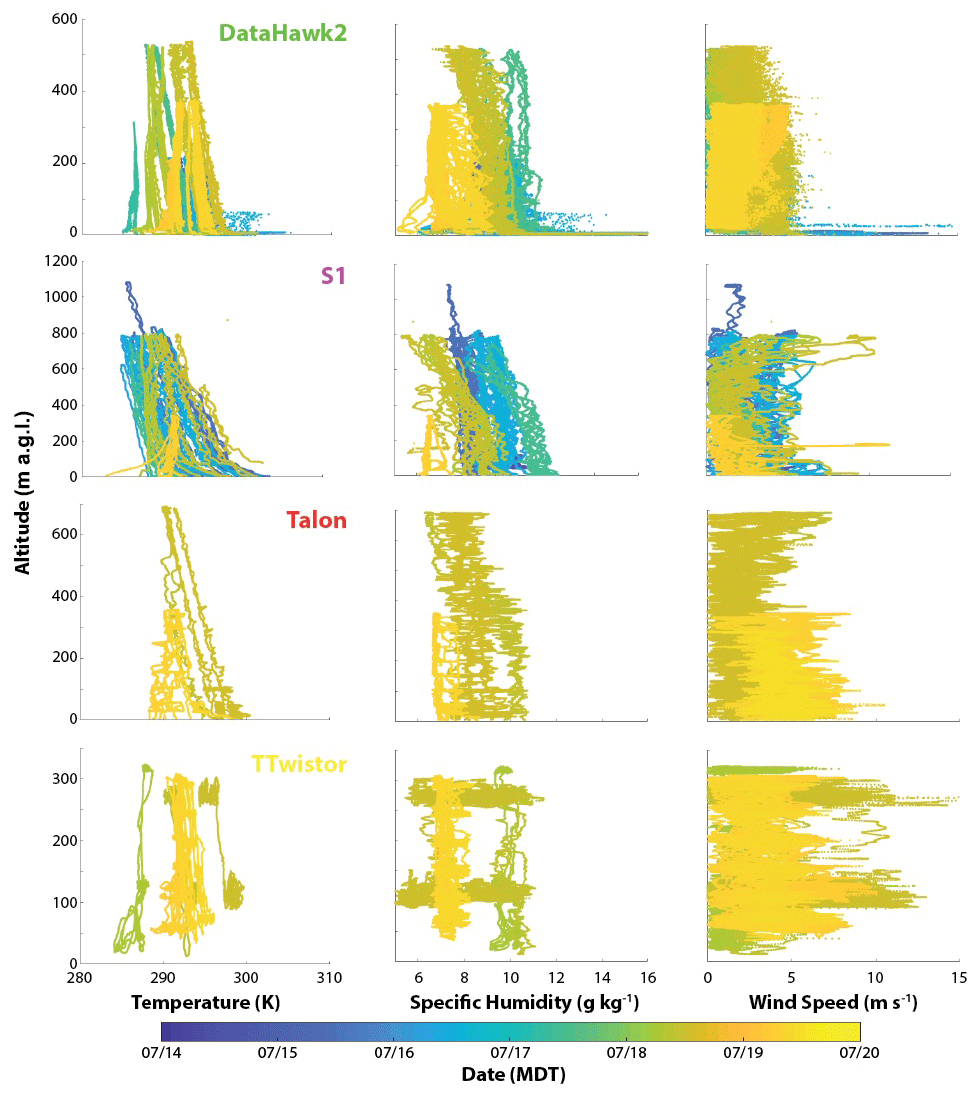
Figure 7Profiles of (left to right) temperature, specific humidity, and wind speed from the DataHawk2, S1, Talon, and TTwistor (top to bottom). Colors indicate the date of flight. Please note that the altitudes are shown as above ground level (a.g.l.), and some aircraft were operating at different locations each day and from one another, meaning that the ground levels in this figure represent different elevations relative to sea level.
Some of the primary measurements from these platforms and the flights conducted during LAPSE-RATE are included in Fig. 7. These figures show similar observations from the different platforms, with some notable exceptions. First, the S1 shows an influence of heating of the temperature sensors while the aircraft is on the ground. Because of this heating, the S1 temperature sensor provides excessive temperature readings for the first portion of the flight, resulting in super-adiabatic lapse rates extending from the surface to around 100 m altitude. This is resolved after the aircraft has been in the air for several seconds. The DataHawk2 slow temperature sensor shows similar structures, but their prevalence is greatly reduced if analyzing the cold-wire (fast) temperature measurement. Notably, both of these platforms have some variability near the surface that is likely to be a result of measurement error there rather than atmospheric features near the surface. In addition to these near-surface features, it is also notable that the TTwistor has more variability in its measured wind speed than the other platforms. Data shown in Fig. 7 do not include those collected during manual flight of the aircraft, eliminating the possibility of this factor impacting the estimated winds. The TTwistor was flown somewhat later in the day during 18 July and traversed a significant area during its follow-me flight operations. During these afternoon flights, the aircraft passed through several areas of gusty winds. While the exact cause for these winds is not determined, we speculate that they were associated with outflows from large convective eddies and the significant thermal gradients established in the valley due to the variability of solar exposure and surface land cover. The latter variability is noticeable in the specific humidity data shown in Fig. 7 as well.
Flight operations conducted by CU and BST were completed under certificates of authorization issued by the US Federal Aviation Administration (FAA). These certificates of authorization were developed to support the safe operation of these platforms to 914 m a.g.l., including alongside a moving control station.
Table 2Quality control limits applied to the different data b1 datasets. To date, S1 data are only available as a1 level files.
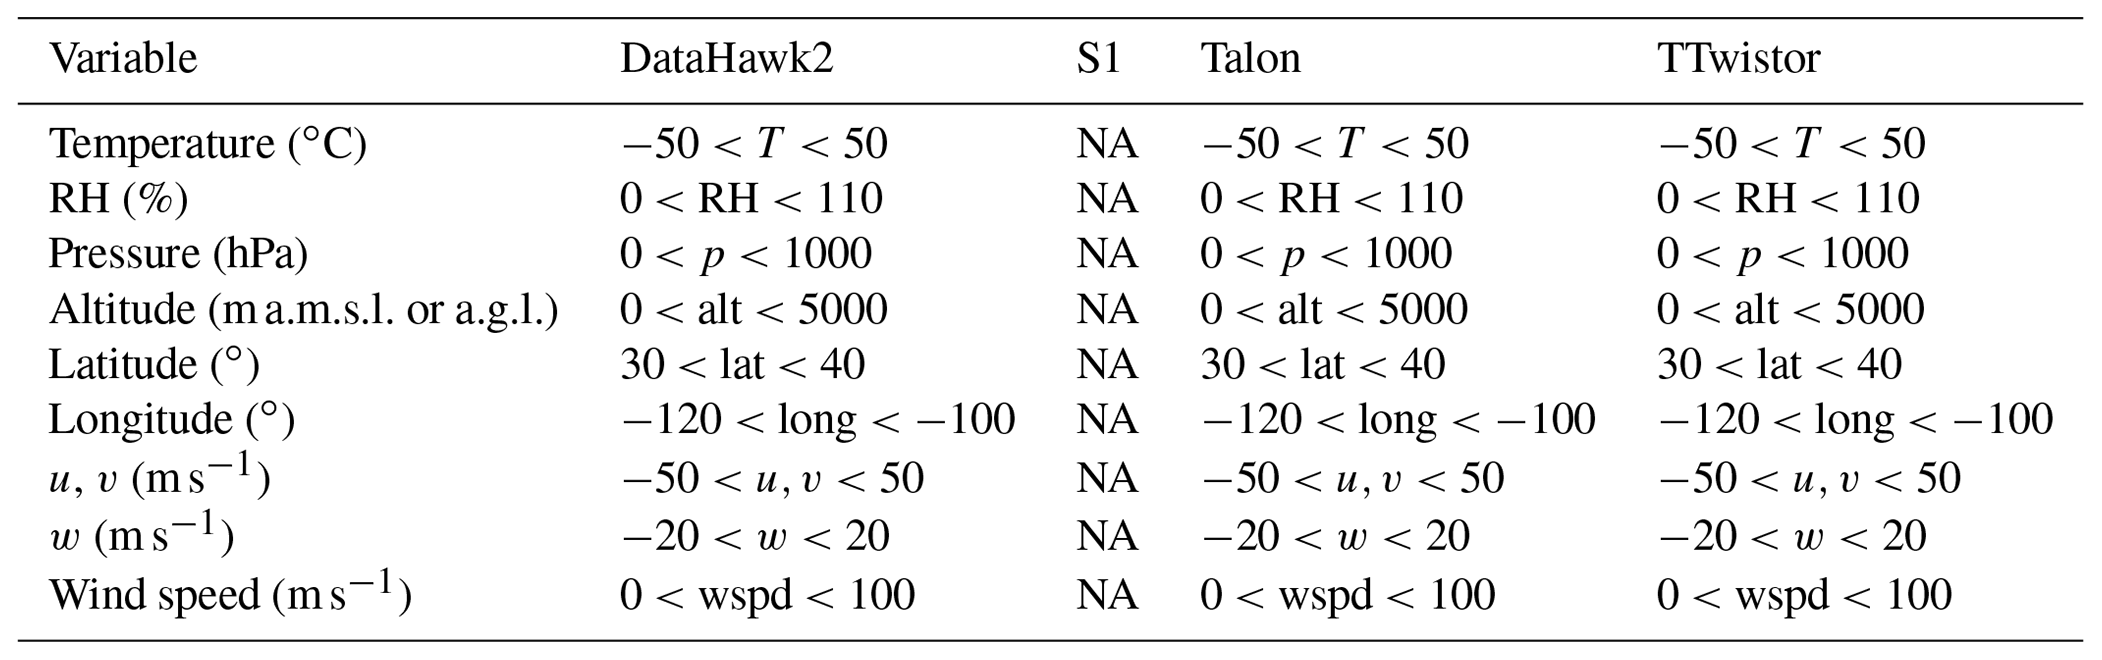
NA: not available
As discussed in de Boer et al. (2020c), LAPSE-RATE data files are provided in NetCDF format with a common file name structure. This common structure (xxx.ppppp.lv.yyyymmdd.hhmmss.cdf) provides information on the institute generating the data (xxx), the platform used to collect the data (ppppp), the level of data processing (lv), and the date and time that the measurements were obtained. The institutions covered in the current paper include the University of Colorado Boulder (UCB) and Black Swift Technologies (BST), with platform identifiers including the DataHawk2 (DATHK), the S1 (BSTS1), the Talon (TALN3), and the TTwistor (TWSTR).
The teams provided different levels of processing and quality control for the measurements from these platforms. Processing of the DataHawk2, Talon, and TTwistor resulted in files at the b1 level. The S1 files were only processed to the a1 level. Similar limits were applied to all three UCB datasets to provide a b1 level dataset. These values were selected as physical limits that should not be exceeded for data collected during LAPSE-RATE and are reviewed in Table 2. As a reminder, the levels that were defined for LAPSE-RATE in general included the following:
-
a0 – raw data converted to netCDF;
-
a1 – calibration factors applied and converted to geophysical units;
-
b1 – QC checks applied to measurements to ensure that they are “in bounds”; missing data points or those with bad values should be set to −9999.9;
-
c1 – derived or calculated value-added data product (VAP) using one or more measured or modeled data (a0 to c1) as input.
Processing of the DataHawk data included calibration of the cold-wire temperature and calculation of the winds. The cold-wire voltages were calibrated against temperatures derived from the SHT sensor. This relationship is expected to be linear, and the calibration relationship is derived using a first-order polynomial fit. This fit is calculated on a flight-by-flight basis, leveraging temperature measurements from parts of the dataset that were collected while the aircraft was in flight. In addition, the first 1000 data points (100 s at 10 Hz) are also omitted from this calculation to avoid contamination from the surface heating of the temperature sensor discussed earlier. DataHawk2 winds are calculated by leveraging observations from the pitot tube, the GPS, and the onboard inertial measurement unit (IMU). Leveraging information from these sensors, the autopilot computes wind in inertial coordinates as the vector difference of the velocity of the vehicle relative to the ground, minus the velocity of the vehicle relative to the air. The later vector is estimated in magnitude as the airspeed from the pitot-static sensor and in direction as the orientation of the vehicle longitudinal axis in inertial coordinates. This assumes that the vehicle is pointed into the relative wind (i.e., with only small deviations in sideslip and angle of attack), which is thought to be a good assumption for wind variations with timescales longer than about 1 s for a vehicle of this scale. Because the DataHawk2 winds calculated from these sensors include a periodic signal that corresponds to the frequency of an orbital circle, additional filtering is applied to these winds. This technique applies a 15th-order low-pass infinite impulse response (IIR) filter to the originally calculated winds to produce a smoothed version. Additionally, using yaw data from the autopilot, the mean wind is calculated over any single orbit. Finally, the high-frequency component of the originally calculated winds (difference between the calculated wind and the output from the low-pass filter) is added back to the wind calculated across the orbital means. As a result, these wind estimates are meant to primarily provide perspective on the mean wind structure with altitude, in addition to the higher-frequency turbulent structure.
The Talon and TTwistor data also require the calculation of wind components. For both datasets, winds are calculated using formulae available in van den Kroonenberg et al. (2008). This technique takes input from the onboard GPS, IMU, and airspeed sensor to calculate three-dimensional wind components. The TTwistor carried a multi-hole pressure probe to measure angle of attack and sideslip angles, while the Talon only carried a standard pitot tube for estimating airspeed. As a result the Talon angle of attack and sideslip were estimated to be a constant 1.75 and 0∘, respectively, for the entire flight. This assumption results in the omission of fine turbulent motion that would not be captured without understanding of the angle of airflow over the airspeed sensor. For both platforms, a series of corrections are applied to account for offsets in the calculated true airspeed (TAS) and potential angular offsets between the IMU and the airspeed sensor (yaw and pitch offsets). These offsets are calculated in an iterative manner by minimization of the variance of the calculated winds with an order of TAS, pitch, yaw, TAS, and yaw. The last two TAS and yaw corrections are applied to apply a finer-scale correction than possible in the first round.
Software developed to process and display the data from these aircraft is not publicly available and leverages licensed data analysis software (MATLAB). This software contains intellectual property that is not meant for public dissemination. Any parties interested in software related to these specific datasets are welcome to reach out to the authorship team to request information on these assets.
The data files from the LAPSE-RATE project are generally being archived under a LAPSE-RATE community established at the Zenodo data archive (https://zenodo.org/communities/lapse-rate/, last access: 27 May 2021). From here, LAPSE-RATE observations are available for public download and use. Digital object identifiers (DOIs) were automatically generated by the Zenodo archive at the data version and product level. Data from the different sources described above are posted as individual data streams on the archive, with each of the platforms described in the previous section having their own DOI. It is important to note that each platform may have several different levels of data available. Therefore, data products with different levels of processing and quality control may be provided with separate DOIs. This means the files and data described in this publication are spread across a variety of DOIs and that additional DOIs could be created in the future that include LAPSE-RATE data, as additional data products are developed.
As of the writing of this paper, the CU DataHawk2 dataset (de Boer et al., 2020e) is available at Zenodo (https://zenodo.org/record/3891620#.X48psy9h1dA, last access: 27 May 2021) under DOI https://doi.org/10.5281/zenodo.3891620. This version 2.0 of this dataset includes both a1 and b1 level files, with the b1 files featuring additional quality control and processing of wind data, as described in Sect. 4 above. Data from the CU Talon aircraft includes three versions (de Boer et al., 2020d). The original version had some issues with file names and the timestamp that was included in the files, which have been fixed in subsequent versions. Therefore, users should use the latest available version (currently 3.0), which is available at Zenodo (https://zenodo.org/record/4096451#.X48xYy9h1dA, last access: 27 May 2021) under https://doi.org/10.5281/zenodo.4096451. The CU TTwistor data (de Boer et al., 2020b) are also available at Zenodo (https://zenodo.org/record/4110626#.X48xsC9h1dA, last access: 27 May 2021) under DOI https://doi.org/10.5281/zenodo.4110626. As with the Talon data, there are multiple versions, and the most current version as of the writing of this paper is 3.0. Finally, the BST S1 datasets (Elston and Stachura, 2020) are also available at Zenodo (https://zenodo.org/record/3861831#.X48x4i9h1dA, last access: 27 May 2021) under DOI https://doi.org/10.5281/zenodo.3861831, with the most current version being 1.1.
This paper provides an overview of data collected by four different RPASs operated during the 2018 LAPSE-RATE campaign in the San Luis Valley of Colorado. These included the University of Colorado DataHawk2, Talon and TTwistor aircraft, and the Black Swift Technologies S1. In combination, these vehicles collected over 30 flight hours of meteorological data between 14–20 July 2018, covering altitudes between the surface and 915 m a.g.l. Data from these vehicles are available for public download from Zenodo, and the previous sections document processing conducted on this dataset before publication, as well as information on the expected accuracy of the sensors deployed on these systems. The contributions made by these RPASs and their operating teams to the broader LAPSE-RATE effort represent a significant component of the measurements obtained to gain understanding on boundary layer processes and phenomena in this high-altitude environment. In combination with surface-based and numerical data, these data are currently being used to evaluate a variety of scientific hypotheses related to the primary measurement objectives of LAPSE-RATE.
GdB was the PI for LAPSE-RATE and led the organization of the field campaign. Additionally, he processed data for the DataHawk2, Talon, and TTwistor aircraft and was the primary author of the current paper. CD, SB, SS, RL, KG, JE, and MS assisted with the processing of the data files described in this paper. CD, SB, DAL, JE, DH, MS, RL, SS, CMC, AD, AS, KG, ZL, and FQ were involved with field operation of the aircraft and data processing during LAPSE-RATE, with DH serving as chief pilot for the University of Colorado operations. BMA and EF were the PIs for the Talon and TTwistor aircraft deployed during LAPSE-RATE, while DAL was the PI for the DataHawk2. All authors contributed to the review and development of the paper.
This article is part of the special issue “Observational and model data from the 2018 Lower Atmospheric Process Studies at Elevation – a Remotely-piloted Aircraft Team Experiment (LAPSE-RATE) campaign”. It is not associated with a conference.
General support for salary and overhead associated with the collection of these datasets was provided by the NOAA Physical Sciences Laboratory, the University of Colorado's Integrated Remote and In Situ Sensing (IRISS) grand challenge project, and Black Swift Technologies. We would additionally like to recognize financial support for student participation and travel from the National Science Foundation (NSF AGS 1807199) and the US Department of Energy (DE-SC0018985). General support for the LAPSE-RATE campaign was provided by the International Society for Atmospheric Research using Remotely piloted Aircraft (ISARRA).
This research has been supported by the US Department of Energy (grant no. DE-SC0018985), the National Science Foundation (grant no. NSF AGS 1807199), the NOAA Physical Sciences Laboratory, the University of Colorado's Integrated Remote and In Situ Sensing (IRISS) grand challenge project, and Black Swift Technologies.
This paper was edited by Suzanne Smith and reviewed by two anonymous referees.
Balsley, B. B., Lawrence, D. A., Fritts, D. C., Wang, L., Wan, K., and Werne, J.: Fine Structure, Instabilities, and Turbulence in the Lower Atmosphere: High-Resolution In Situ Slant-Path Measurements with the DataHawk UAV and Comparisons with Numerical Modeling, J. Atmos. Ocean. Tech., 35, 619–642, https://doi.org/10.1175/JTECH-D-16-0037.1, 2018.
Barbieri, L., Kral, S. T., Bailey, S. C. C., Frazier, A. E., Jacob, J. D., Reuder, J., Brus, D., Chilson, P. B., Crick, C., Detweiler, C., Doddi, A., Elston, J., Foroutan, H., González-Rocha, J., Greene, B. R., Guzman, M. I., Houston, A. L., Islam, A., Kemppinen, O., Lawrence, D., Pillar-Little, E. A., Ross, S. D., Sama, M. P., Schmale, D. G., Schuyler, T. J., Shankar, A., Smith, S. W., Waugh, S., Dixon, C., Borenstein, S., and de Boer, G.: Intercomparison of Small Unmanned Aircraft System (sUAS) Measurements for Atmospheric Science during the LAPSE-RATE Campaign, Sensors, 19, 2179, https://doi.org/10.3390/s19092179, 2019.
Cassano, J. J.: Observations of atmospheric boundary layer temperature profiles with a small unmanned aerial vehicle, Antarct. Sci., 26, 205–213, https://doi.org/10.1017/S0954102013000539, 2014.
Cassano, J. J., Seefeldt, M. W., Palo, S., Knuth, S. L., Bradley, A. C., Herrman, P. D., Kernebone, P. A., and Logan, N. J.: Observations of the atmosphere and surface state over Terra Nova Bay, Antarctica, using unmanned aerial systems, Earth Syst. Sci. Data, 8, 115–126, https://doi.org/10.5194/essd-8-115-2016, 2016.
Cione, J. J., Bryan, G., Dobosy, R., Zhang, J., de Boer, G., Aksoy, A., Wadler, J., Kalina, E., Dahl, B., Ryan, K., Neuhaus, J., Dumas, E., Marks, F., Farber, A., Hock, T. and Chen, X.: Eye of the storm: Observing hurricanes with a small unmanned aircraft system, B. Am. Meteorol. Soc., 101, E186–E205, https://doi.org/10.1175/BAMS-D-19-0169.1, 2020.
de Boer, G., Palo, S., Argrow, B., LoDolce, G., Mack, J., Gao, R.-S., Telg, H., Trussel, C., Fromm, J., Long, C. N., Bland, G., Maslanik, J., Schmid, B., and Hock, T.: The Pilatus unmanned aircraft system for lower atmospheric research, Atmos. Meas. Tech., 9, 1845–1857, https://doi.org/10.5194/amt-9-1845-2016, 2016.
de Boer, G., Ivey, M. D., Schmid, B., Lawrence, D., Dexheimer, D., Mei, F., Hubbe, J., Hardesty, J. O. E., Bendure, A., Shupe, M. D., McComiskey, A., Telg, H., Schmitt, C., Matrosov, S., Brooks, I., Creamean, J. M., Solomon, A., Turner, D. D., Williams, C., Maahn, M., Argrow, B., Palo, S., Long, C. N., Gao, R.-S., and Mather, J.: A Bird's Eye View: Development of an Operational ARM Unmanned Aerial Systems Capability for Atmospheric Research in Arctic Alaska, B. Am. Meteorol. Soc., 99, 1197–1212, https://doi.org/10.1175/BAMS-D-17-0156.1, 2018.
de Boer, G., Argrow, B., Cassano, J., Cione, J., Frew, E., Lawrence, D., Wick, G., and Wolff, C.: Advancing unmanned aerial capabilities for atmospheric research, B. Am. Meteorol. Soc., 100, ES105–ES108, https://doi.org/10.1175/BAMS-D-18-0254.1, 2019a.
de Boer, G., Dexheimer, D., Mei, F., Hubbe, J., Longbottom, C., Carroll, P. J., Apple, M., Goldberger, L., Oaks, D., Lapierre, J., Crume, M., Bernard, N., Shupe, M. D., Solomon, A., Intrieri, J., Lawrence, D., Doddi, A., Holdridge, D. J., Hubbell, M., Ivey, M. D., and Schmid, B.: Atmospheric observations made at Oliktok Point, Alaska, as part of the Profiling at Oliktok Point to Enhance YOPP Experiments (POPEYE) campaign, Earth Syst. Sci. Data, 11, 1349–1362, https://doi.org/10.5194/essd-11-1349-2019, 2019b.
de Boer, G., Osborn, J., Cox, C., Intrieri, J., Borenstein, S., Dixon, C., and Foscue, G.: miniFlux data from Stratified Ocean Dynamics of the Arctic (SODA) campaign, Beaufort Sea and northern Alaska, 2018, Arctic Data Center, https://doi.org/10.18739/A2SJ19R18, 2019c.
de Boer, G., Diehl, C., Jacob, J., Houston, A., Smith, S. W., Chilson, P., Schmale III, D. G., Intrieri, J., Pinto, J., Elston, J., Brus, D., Kemppinen, O., Clark, A., Lawrence, D., Bailey, S. C. C., Sama, M. P., Frazier, A., Crick, C., Natalie, V., Pillar-Little, E. A., Klein, P., Waugh, S., Lundquist, J. K., Barbieri, L., Kral, S. T., Jensen, A. A., Dixon, C., Borenstein, S., Hesselius, D., Human, K., Hall, P., Argrow, B., Thornberry, T., Wright, R., and Kelly, J. T.: Development of community, capabilities and understanding through unmanned aircraft-based atmospheric research: The LAPSE-RATE campaign, B. Am. Meteorol. Soc., 101, E684–E699, https://doi.org/10.1175/BAMS-D-19-0050.1, 2020a.
de Boer, G., Dixon, C., Borenstein, S., Glasheen, K., Hesselius, D., Choate, C. M., Laouar, Z., Quimby, F., Frew, E., and Argrow, B.: TTWISTOR files from LAPSE-RATE (Version 3.0) [Data set], Zenodo, https://doi.org/10.5281/zenodo.4110626, 2020b.
de Boer, G., Houston, A., Jacob, J., Chilson, P. B., Smith, S. W., Argrow, B., Lawrence, D., Elston, J., Brus, D., Kemppinen, O., Klein, P., Lundquist, J. K., Waugh, S., Bailey, S. C. C., Frazier, A., Sama, M. P., Crick, C., Schmale III, D., Pinto, J., Pillar-Little, E. A., Natalie, V., and Jensen, A.: Data generated during the 2018 LAPSE-RATE campaign: an introduction and overview, Earth Syst. Sci. Data, 12, 3357–3366, https://doi.org/10.5194/essd-12-3357-2020, 2020c.
de Boer, G., Laurence III, R., Swenson, S., Borenstein, S., Dixon, S., and Argrow, B.: Talon files from LAPSE-RATE (Version 3.0) [Data set], Zenodo, https://doi.org/10.5281/zenodo.4096451, 2020d.
de Boer, G., Lawrence, D., and Doddi, A.: DataHawk2 files from LAPSE-RATE (Version 2.0) [Data set], Zenodo, https://doi.org/10.5281/zenodo.3891620, 2020e.
de Boer, G., Waugh, S., Erwin, A., Borenstein, S., Dixon, C., Shanti, W., Houston, A., and Argrow, B.: Measurements from mobile surface vehicles during the Lower Atmospheric Profiling Studies at Elevation – a Remotely-piloted Aircraft Team Experiment (LAPSE-RATE), Earth Syst. Sci. Data, 13, 155–169, https://doi.org/10.5194/essd-13-155-2021, 2021.
Elston, J. and Stachura, M.: Black Swift Technologies S1 Unmanned Aircraft System Observations from LAPSE-RATE (Version 1.1) [Data set], Zenodo, https://doi.org/10.5281/zenodo.3861831, 2020.
Elston, J., Argrow, B., Frew, E., Houston, A., and Straka, J.: Evaluation of Unmanned Aircraft Systems for Severe Storm Sampling using Hardware-in-the-Loop Simulations, J. Aerospace Comput. Inform. Commun., 8, 269–294, https://doi.org/10.2514/1.53737, 2011a.
Elston, J., Roadman, J., Stachura, M., Argrow, B., Houston, A., and Frew, E.: The Tempest Unmanned Aircraft System for In Situ Observations of Tornadic Supercells: Design and VORTEX2 Flight Results, J. Field Robotics, 28, 461–483, https://doi.org/10.1002/rob.20394, 2011b.
Elston, J., Argrow, B., Stachura, M., Weibel, D., Lawrence, D., and Pope, D.: Overview of Small Fixed-Wing Unmanned Aircraft for Meteorological Sampling, J. Atmos. Ocean. Tech., 32, 97–115, https://doi.org/10.1175/JTECH-D-13-00236.1, 2015.
Frew, E. W., Elston, J., Argrow, B., Houston, A., and Rasmussen, E.: Sampling Severe Local Storms and Related Phenomena, IEEE Robotics & Automation Magazine, 19, 85–95, https://doi.org/10.1109/MRA.2012.2184193, 2012.
Houston, A. L., Argrow, B., Elston, J., Lahowetz, J., Frew, E. W., and Kennedy, P. C.: The Collaborative Colorado–Nebraska Unmanned Aircraft System Experiment, B. Am. Meteorol. Soc., 93, 39–54, https://doi.org/10.1175/2011BAMS3073.1, 2012.
Intrieri, J. M., de Boer, G., Shupe, M. D., Spackman, J. R., Wang, J., Neiman, P. J., Wick, G. A., Hock, T. F., and Hood, R. E.: Global Hawk dropsonde observations of the Arctic atmosphere obtained during the Winter Storms and Pacific Atmospheric Rivers (WISPAR) field campaign, Atmos. Meas. Tech., 7, 3917–3926, https://doi.org/10.5194/amt-7-3917-2014, 2014.
Kantha, L., Lawrence, D., Luce, H., Hashiguchi, H., Tsuda, T., Wilson, R., Mixa, T., and Yabuki, M.: Shigaraki UAV-Radar Experiment (ShUREX): overview of the campaign with some preliminary results, Prog. Earth Planet. Sci., 4, 19, https://doi.org/10.1186/s40645-017-0133-x, 2017.
Knuth, S. L., Cassano, J. J., Maslanik, J. A., Herrmann, P. D., Kernebone, P. A., Crocker, R. I., and Logan, N. J.: Unmanned aircraft system measurements of the atmospheric boundary layer over Terra Nova Bay, Antarctica, Earth Syst. Sci. Data, 5, 57–69, https://doi.org/10.5194/essd-5-57-2013, 2013.
Koch, S. E., Fengler, M., Chilson, P. B., Elmore, K. L., Argrow, B., Andra Jr., D. L., and Lindley, T.: On the Use of Unmanned Aircraft for Sampling Mesoscale Phenomena in the Preconvective Boundary Layer, J. Atmos. Ocean. Tech., 35, 2265–2288, https://doi.org/10.1175/JTECH-D-18-0101.1, 2018.
Roadman, J., Elston, J. S., Argrow, B., and Frew, E.: Mission Performance of the Tempest Unmanned Aircraft System in Supercell Storms, J. Aircraft, 49, 1821–1830, https://doi.org/10.2514/1.C031655, 2012.
Scipión, D. E., Lawrence, D. A., Milla, M. A., Woodman, R. F., Lume, D. A., and Balsley, B. B.: Simultaneous observations of structure function parameter of refractive index using a high-resolution radar and the DataHawk small airborne measurement system, Ann. Geophys., 34, 767–780, https://doi.org/10.5194/angeo-34-767-2016, 2016.
Swenson, S., Argrow, B., Frew, E., Borenstein, S., and Keeler, J.: Development and Deployment of Air-Launched Drifters from Small RPAS, Sensors, 19, 2149, https://doi.org/10.3390/s19092149, 2019.
Van den Kroonenberg, A., Martin, T., Buschmann, M., Bange J., and Vörsmann, P.: Measuring the wind vector using the autonomous mini aerial vehicle M2AV, J. Atmos. Ocean. Tech., 25, 1969–1982, https://doi.org/10.1175/2008JTECHA1114.1, 2008.
- Abstract
- Introduction
- Overview of platforms and sensors
- Description of measurement locations, flight strategies, and completed flights/sampling
- Data processing and quality control
- Code availability
- Data availability
- Summary
- Author contributions
- Special issue statement
- Acknowledgements
- Financial support
- Review statement
- References