the Creative Commons Attribution 4.0 License.
the Creative Commons Attribution 4.0 License.
 | 02 Feb 2021
Dataset of Georeferenced Dams in South America (DDSA)
Bolivar Paredes-Beltran
Alvaro Sordo-Ward
Luis Garrote
Dams and their reservoirs generate major impacts on society and the environment. In general, its relevance relies on facilitating the management of water resources for anthropogenic purposes. However, dams could also generate many potential adverse impacts related to safety, ecology or biodiversity. These factors, as well as the additional effects that climate change could cause in these infrastructures and their surrounding environment, highlight the importance of dams and the necessity for their continuous monitoring and study. There are several studies examining dams both at regional and global scales; however, those that include the South America region focus mainly on the most renowned basins (primarily the Amazon basin), most likely due to the lack of records on the rest of the basins of the region. For this reason, a consistent database of georeferenced dams located in South America is presented: Dataset of Georeferenced Dams in South America (DDSA). It contains 1010 entries of dams with a combined reservoir volume of 1017 km3, and it is presented in the form of a list describing a total of 24 attributes that include the dams' names, characteristics, purposes and georeferenced locations. Also, hydrological information on the dams' catchments is also included: catchment area, mean precipitation, mean near-surface temperature, mean potential evapotranspiration, mean runoff, catchment population, catchment equipped area for irrigation, aridity index, residence time and degree of regulation. Information was obtained from public records, governments records, existing international databases and extensive internet research. Each register was validated individually and geolocated using public-access online map browsers, and then, hydrological and additional information was derived from a hydrological model computed using the HydroSHEDS (Hydrological data and maps based on SHuttle Elevation Derivatives at multiple Scales) dataset. With this database, we expect to contribute to the development of new research in this region. The database is publicly available at https://doi.org/10.5281/zenodo.4315647 (Paredes-Beltran et al., 2020).
- Article
(10254 KB) - Full-text XML
-
Supplement
(397 KB) - BibTeX
- EndNote


Dams and their reservoirs provide continuous water supply for different anthropogenic necessities such as electricity generation, water supply, irrigation, flood control, livestock feed or recreation. This becomes crucial in areas where water resources are scarce either by seasonality or due to the increasing effects of climate change. However, in many cases dams and their reservoirs are controversial because they can cause acute and chronic impacts in the environment and also in the nearby human settlements. These impacts are generally well known and include the modification of aquatic and terrestrial ecosystems, reduction of biodiversity, changes in the morphology of river systems, degradation of water quality and characteristics, alterations in sediment and nutrient discharge, changes in seasonal hydrological regimes, the migration of human settlements, or changes in land-use patterns (Barbarossa et al., 2020; Bednarek, 2001; Nilsson et al., 2005; Pekel et al., 2016; Stoate et al., 2009).
Due to the obvious importance of dams and their reservoirs, continuous monitoring and resources needs to be dedicated to these structures. The importance of dams and reservoirs also makes them relevant for research. For example, there are studies that assess or propose improvements on construction methods for dams (Ladd, 1992; Noorzaei et al., 2006; Xu et al., 2012), examine improvements on monitoring the structural health or safety of the dam (Gabriel-Martin et al., 2017; Li et al., 2004; Sjödahl et al., 2008), or evaluate their behaviour during seismic or failure events (Alonso et al., 2005; Zabala and Alonso, 2011). Reservoirs associated with dams are also relevant, for instance, by examining the effects, impacts and management alternatives of sediments fluxes (Dai and Liu, 2013; Kondolf et al., 2014). Usually, these studies require knowing a minimum set of characteristics of the dam, including their location, and, in most of the cases, need to be included into hydrological models.
The influence and effects of dams on their surrounding environments is also relevant for research. For instance, these include the impacts caused by dams and reservoirs on the water supply (Biemans et al., 2011; Bouwer, 2000; Khalkheili and Zamani, 2009), the potential effects of climate change on altered river networks (Döll et al., 2009; Nilsson et al., 2005), the prospective scenarios that climate change could cause on irrigation water (Chavez-Jimenez et al., 2015; Elliott et al., 2014; Garrote et al., 2015), the repercussions of dams on water resources and biodiversity (Bejarano et al., 2017; Liermann et al., 2012; Vörösmarty et al., 2010), or the hydrological alterations caused by dams and reservoirs (Batalla and Go, 2004; Ibàñez and Prat, 1996).
In South America, relevant studies about dams at a full regional scale are rather scarce and usually focus on aquatic biodiversity conservation (Barletta et al., 2010; Reis et al., 2016) or river segmentation (Castello et al., 2013; Fearnside, 2001; Latrubesse et al., 2017; Roberto et al., 2009), and in most of the cases their conclusions highlight that potential negative effects of dams are low to moderate. However, these studies generally present two important limitations when trying to reach a full regional scale: first, these focus only on the most relevant or renowned basins such as the Amazon, Paraná–Rio de la Plata or Orinoco, and second, these only consider a limited amount of dam records.
There are several published dam databases that include information from South America. The largest and most recognized database is the World Register of Dams published by the International Commission on Large Dams (ICOLD, 2020), which reports 1922 dams entries for South America; nonetheless, this database is not georeferenced, which limits its use. The AQUASTAT database was presented by FAO (2015), but it has not been updated since 2015, and for South America it only reports 344 entries of georeferenced dams. Finally, another relevant database is the GRaND database (Global Reservoir and Dam Database; Lehner et al., 2011) which has been updated for the year 2019 and accounts for 343 geolocated dam entries for South America.
Here, we present an extensive and revised database with 1010 registers of dams in South America, including information on their identification, the dam main characteristics, the dam purposes and their spatial location. Also, it includes hydrological information derived from the HydroSHEDS dataset (Hydrological data and maps based on SHuttle Elevation Derivatives at multiple Scales; Lehner et al., 2008): catchment area, mean near-surface temperature, mean precipitation and mean potential evapotranspiration from the Climatic Research Unit (CRU) time-series dataset (Harris et al., 2020); mean runoff from the University of New Hampshire Global Runoff Data Centre (UNH/GRDC) composite runoff field (Fekete et al., 2002); catchment population data from the Global Rural-Urban Mapping Project (GRUMP) (Center for International Earth Science Information Network CIESIN et al., 2011); catchment equipped area for irrigation from the Global Map of Irrigated Areas dataset (Siebert et al., 2005); aridity index; residence time; and degree of regulation. This database has been developed to provide researchers additional information on dams, reservoirs and dams' catchments in South America, with the expectation to further promote research on dams, hydrology, water resources, ecology environmental science, geography or sociology either on a local, regional or global scale.
This database is publicly available free for use at https://doi.org/10.5281/zenodo.4315647 (Paredes-Beltran et al., 2020).
2.1 Study area
The study area is the continent of South America and includes Argentina, Bolivia, Brazil, Chile, Colombia, Ecuador, Guyana, French Guiana, Paraguay, Peru, Suriname, Uruguay and Venezuela. A total of 1010 catchments were considered, which drain an area of approximately 5 283 000 km2 and discharge their waters to both the Pacific Ocean and the Atlantic Ocean. Within each of these catchments, necessary observations were made to accurately locate dams with their respective reservoirs.
The study area is diverse and full of contrasts due to its unique geography; for example, the Andes Mountains, which are a continuously seismic region that covers the entire western coast of the continent; the Amazon rainforest in the central part of the continent; large semi-arid plains in the southeast; and also the Atacama Desert, which is a region of extreme aridity in the southwest. In the Andes we have the presence of large glaciers that mostly drain east to form several rivers, including some of the largest in the world such as the Amazon, the Paraná–Rio de la Plata and the Orinoco river. On the eastern coast of the continent, there exist humid mountain formations that extend from Venezuela to northern Brazil.
The climate on the continent is diverse mainly due to its size and topography but also due to its wind patterns and ocean currents. Around the Equator, climate can be considered mainly as tropical and humid with large amounts of rain, which decreases while moving further north and south of the Equator, where different weather patterns are found. In the southern part of the continent, the humid winds of the Pacific Ocean provide rain to several areas on the coast of Chile, which are blocked due to the Andes Mountains and cause low precipitation around the year in the Patagonia region in the southeast. The climate within the Andes Mountains is characterized as dry and cold and covers the highest mountains with snow all year round. The driest region in the continent is the Atacama Desert due to its almost-zero humidity, and it is located in the north of Chile and the south of Peru.
Climate diversity in South America is also due to the occurrence of several interannual and interdecadal large-scale climate events. For example, these include the “El Niño–Southern Oscillation” (ENSO), which is a Pacific Ocean sea-surface temperature (SST) event that fluctuates from warm (“El Niño”) and cold (“La Niña”) phases and occurs in periods of between 2 and 7 years. The ENSO causes disruptions of precipitation and temperature in the continent and is often considered as the major source of interannual climate variability in most of South America.
In general, El Niño causes low precipitation over tropical South America, high precipitation over the southeast of the region, and high temperatures over tropical and subtropical areas. Also, El Niño is often associated not only with regionally diverse events like droughts in the Amazon rainforest and the northeast of South America but also with flooding events on the tropical western coast and in the southeast of the continent (Cai et al., 2020; Hao et al., 2020). On the other hand, La Niña generally causes the opposite precipitation and temperature events for the same areas (Garreaud et al., 2009).
Other regional climate events in South America like the sea-surface temperature (SST) anomalies in the tropical Atlantic (Garreaud et al., 2009; Jiménez-Muñoz et al., 2016), the Pacific Decadal Oscillation (PDO) (Nathan and Steven, 2002), or the Antarctic Oscillation (AAO) and the North Atlantic Oscillation (NAO) (Garreaud et al., 2009) also play an important role in the variability of South America's climate.
2.2 Data sources and assessment methods
2.2.1 Compilation of preliminary information
A preliminary compilation of data regarding dams and reservoirs in the continent was first carried out to serve as a basis prior to the creation of this database. For this, two types of bibliographic sources were used: first, dams and reservoirs information from currently published databases and second, records available about dams, reservoirs and water resources, from governments and other official sources. In the first case, we used two well-known open-access databases of dams and reservoirs: the GRaND database (http://globaldamwatch.org/grand/, last access: 23 May 2020) and the AQUASTAT database (http://www.fao.org/aquastat/es/databases/dams/, last access: 23 May 2020). In the second case, we found that many governments keep up-to-date and comprehensive records of their water resources including dams and reservoirs. However, there were cases in which official information is not available. Table 1 details the public sources from which most of the information was obtained for each of the countries.
Table 1Available public data records of dams per country.
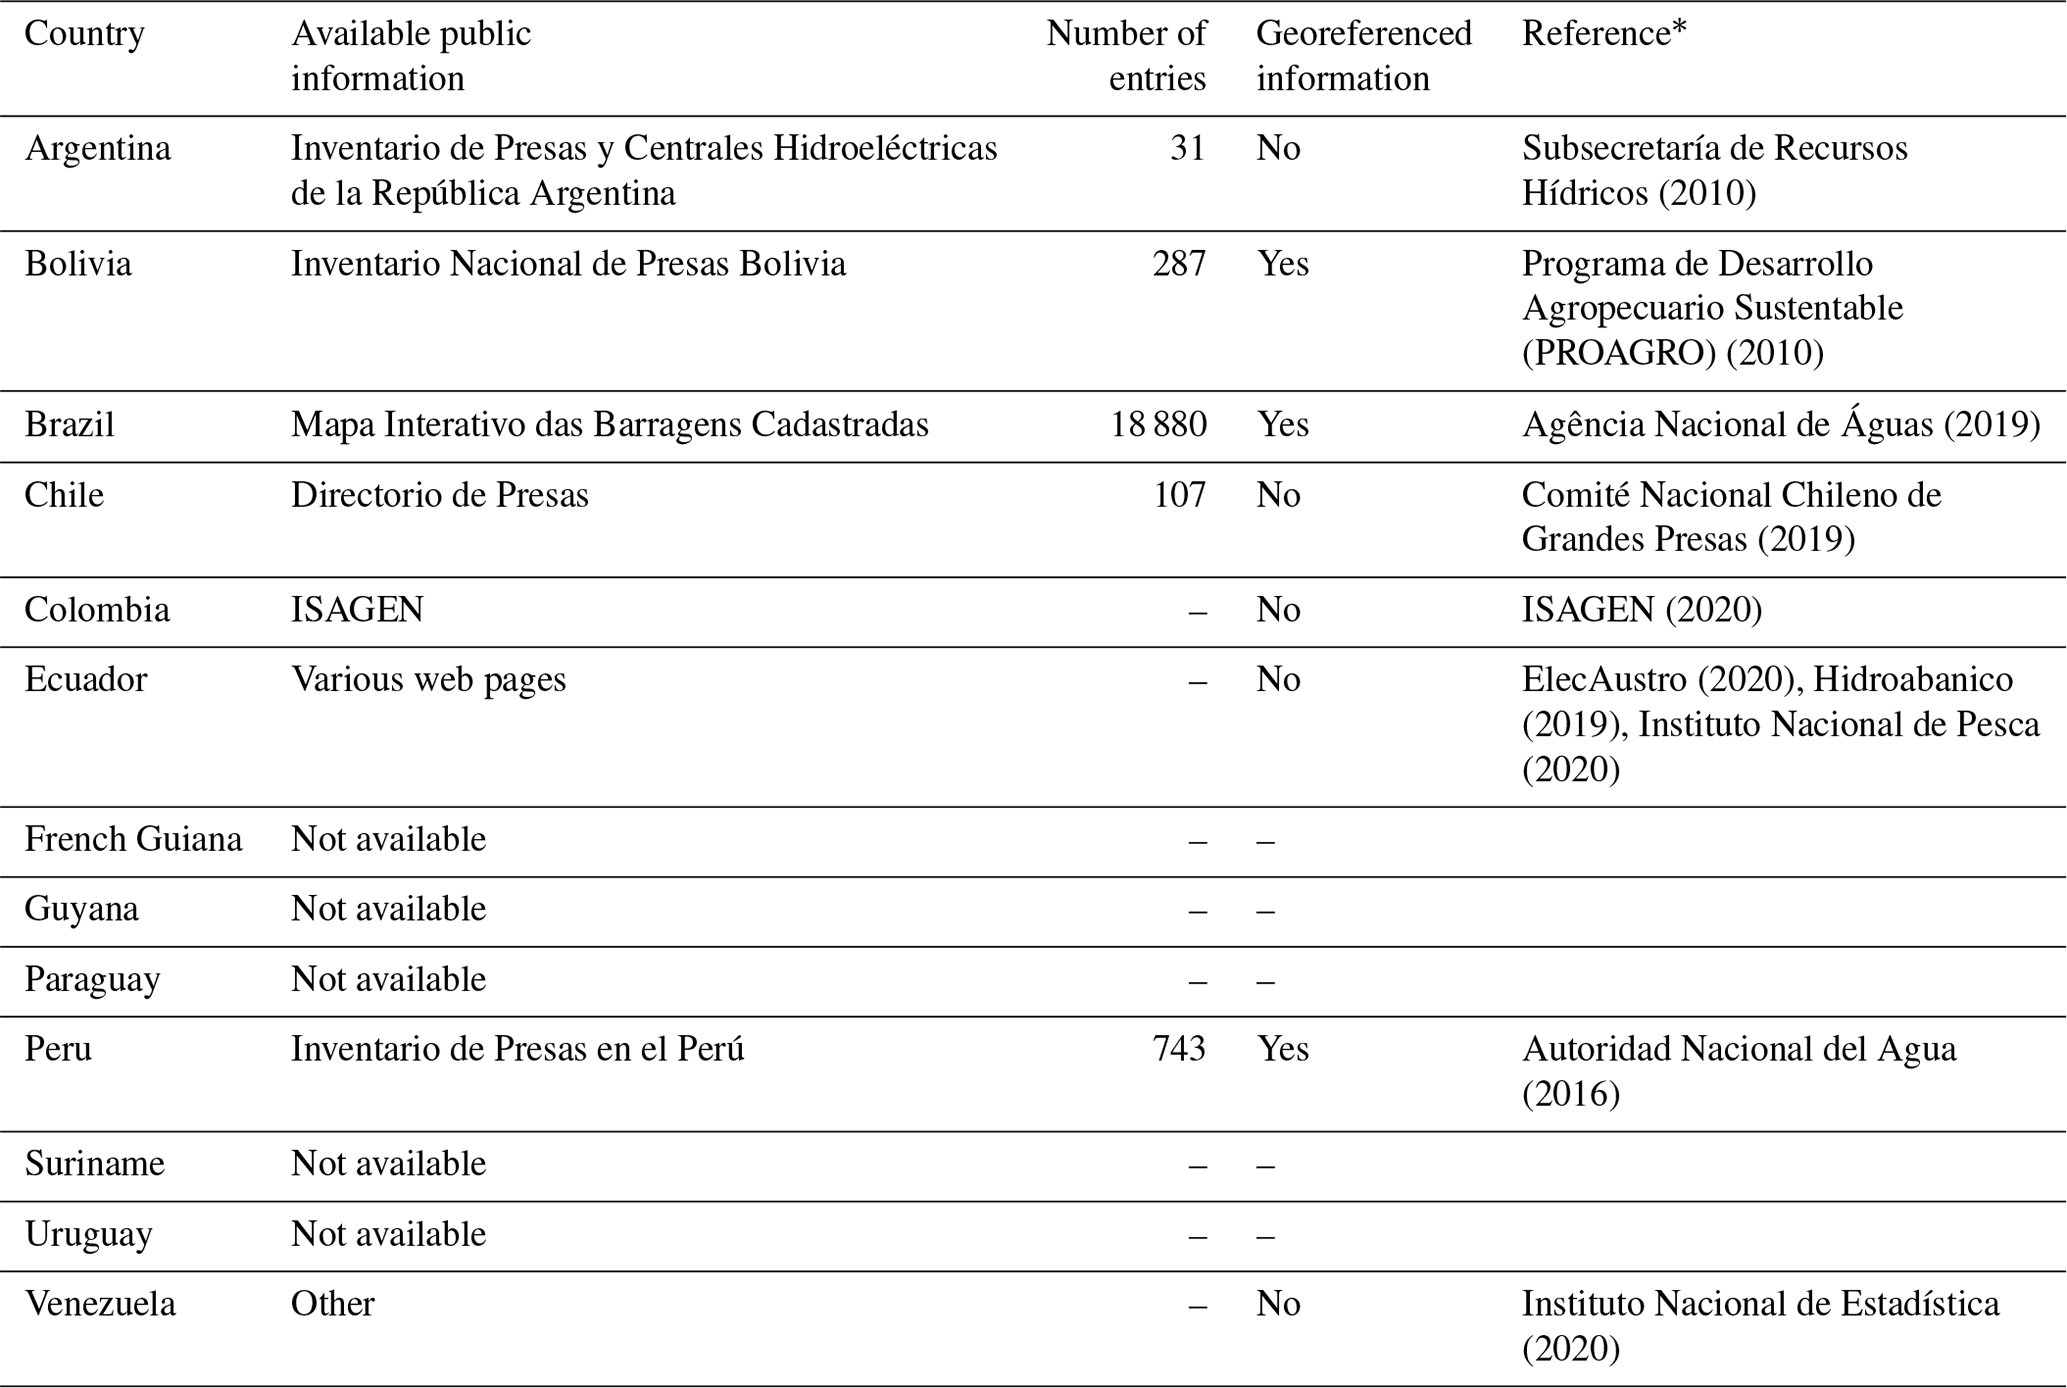
* The data records of each country's website links are detailed in the reference section.
After an extensive review, we determined that georeferenced information about dams in this continent is limited. This is one of the main reasons why we aimed to develop a new database that includes all current and consistent information available. We proceeded in three stages: first, we collected all the available published information on dams and reservoirs; second, we compared and validated these data with the existing information available from local and national governments; and finally, we determined the geolocation of each point. This information has been processed, and we carried out extensive data validation and error checking, elimination of duplicate or inaccurate entries, and completion of information where possible.
First, we researched for the most relevant databases of dams and reservoirs available and found three consistent results: the World Register of Dams from ICOLD, the GRaND database and the AQUASTAT database of dams. After the initial inspection, we discarded the ICOLD database because even though it is widely considered as the largest database on dams with over 57 985 entries worldwide and 1922 dam entries in South America, it is neither georeferenced nor an open-access database, which limits later validation of our results. Then, we inspected the AQUASTAT database (which has not been updated since 2015) and collected detailed information on more than 14 000 dams; nonetheless, in the case of South America the list consists of 1964 dams, of which only 344 entries are georeferenced. Finally, we examined the GRaND database, which presents 7320 entries; however, only 343 of those entries correspond to South America.
Once initial information was collected from open-access databases to assemble our preliminary list, we examined public records available from local and national governments in each country. We compiled them in order to compare these data with our preliminary list; data collected from governments and other public sources are available in different formats and in most cases required different types of approximation and treatment to obtain results. Each dam's record was compared individually, and in the case of correspondence it was accepted; in the case of countries where we did not find available public reports, we compared and verified our preliminary records with information available on the internet, focusing on dams with reservoir capacity greater than 1 hm3 (cubic hectometre), although some records with a smaller reservoir volume were included, as these could be verified in a reliable manner.
Finally, a supplementary search on the internet was performed to exclude gaps, mismatches or errors.
2.2.2 Geolocation of entries
Once we compiled and verified our preliminary list of dams and reservoirs, we proceeded with the geolocation of each individual record. First, we verified and corrected the data of the preliminary list, and then we carried out a second geolocation assessment for our final database using public-access online map browsers like Google Earth (https://earth.google.com/web/, last access: 23 May 2020), Bing Maps (https://www.bing.com/maps, last access: 23 May 2020) and Open Street Maps (https://www.openstreetmap.org/#map, last access: 23 May 2020).
Although these map browsers do not provide us with the analytical capabilities of geographic information system (GIS) files and programmes, these products are operative when visually searching for geographic locations and landmarks, and they provide data that are often up to date.
In most cases, it was necessary to carry out extensive examinations for each dam, since there were cases in which the names of the dams were not a sufficient reference to locate them; thus, it was necessary to use additional references such as the nearby cities or villages, reservoirs' names, rivers' names, or secondary or alternative names of the dams.
The coordinates in this database are described in decimal degrees using the WGS 84 (World Geodetic System 1984) reference coordinate system.
2.2.3 HydroSHEDS
To perform the analysis of the dams' catchments, the HydroSHEDS (Hydrological data and maps based on SHuttle Elevation Derivatives at multiple Scales) (Lehner et al., 2008) dataset was used. This product allows users to access consistent hydrographic information on a regional scale at a resolution of 15 arcsec and was derived primarily from the Shuttle Radar Topography Mission (SRTM). The dataset information was obtained from the project's public site (https://www.hydrosheds.org/downloads, last access: 23 May 2020) in raster format, and for this project we utilized three layers: void-free elevation, drainage direction and flow accumulation.
Once each dam's location was verified and accepted, each location point was aligned according to the HydroSHEDS raster dataset (Lehner et al., 2008) in order to determine the dams' catchments. First, flow direction of each of the model raster cells was computed by applying the “D8” (eight-direction) algorithm. Second, the ridge cells between catchments were identified to delineate them. Finally, the catchment areas were calculated by counting the contributing cells above each dam.
2.2.4 Climatic Research Unit time-series (CRU TS 4.03) dataset
Surface climate variables are commonly used inputs in studies like agriculture, ecology and biodiversity. For this reason, near-surface temperature (NST), precipitation (P) and potential evapotranspiration (PET) mean monthly values from 1901 to 2018 are included for each dam's catchment in this database. These data were derived from the Climatic Research Unit (CRU) time-series dataset (Harris et al., 2020), which is hosted by the UK's National Centre for Atmospheric Science (NCAS) and produced by the University of East Anglia's Climatic Research Unit (CRU). This dataset is a commonly used high-resolution gridded dataset and has been compared favourably with other climatic datasets (Beck et al., 2017; Jacob et al., 2007).
First, the datasets for each variable were downloaded in NetCDF (Network Common Data Form) format for monthly periods from 1901 to 2018. Then, these files were converted, resampled and aligned into raster format in order to match the dams' catchment models. Finally, we computed the long-term mean monthly values for precipitation, near-surface temperature and potential evapotranspiration for the complete time period (1901 to 2018) and for each of the dams' catchments.
This dataset is provided in a resolution of a 0.5∘ × 0.5∘ grid, covers the South American continent from 1901 to 2018 and is derived from a periodic interpolation of data from a network of meteorological stations. The NST units are expressed in degrees Celsius (∘C); the PRE units are in expressed in millimetres per month (mm per month); and the PET units are expressed in millimetres per month (mm per month).
For this database we used version 4.03, which is provided by the Center for Environmental Data Analysis (CEDA) website (https://crudata.uea.ac.uk/cru/data/hrg/#current, last access: 23 May 2020), in NetCDF format.
2.2.5 University of New Hampshire Global Runoff Data Centre (GRDC) composite runoff field
A basic requirement in the assessment of water resource systems is monthly runoff data. For this, the mean monthly runoff data for each dam was also included in this database. We used the University of New Hampshire and Global Runoff Data Centre (UNH/GRDC) composite runoff field v1.0 (Fekete et al., 2002), which is often regarded as the best available runoff dataset for large-scale models (Gonzàlez-Zeas et al., 2012; Lv et al., 2018). The GRDC dataset combines observed river discharge information with climate-driven water balance models in order to develop consistent composite runoff fields. The method applied in this product uses selected gauging stations' data archives for a simulated topological network and compares them with outputs from a water balance model (WBM) simulation performed by the authors.
The runoff dataset for South America was downloaded from the data product site in ASCII (American Standard Code for Information Interchange) grid format in a resolution of 0.5∘ × 0.5∘. Then, the file was converted, resampled and aligned in order to match the dams' catchment models. Finally, the mean monthly runoff data for each dam's catchment was derived. The units of runoff are expressed in millimetres per month (mm per month).
The dataset was obtained from the product's public site (http://www.compositerunoff.sr.unh.edu/, last access: 23 May 2020).
2.2.6 Population data from the Global Rural-Urban Mapping Project (GRUMP)
Demographic data are usually a necessary input for studies that include urban or rural information on water resource assessments. Population for each of the dams' catchments is included on this database and was derived from the Global Rural-Urban Mapping Project (GRUMP) (Center for International Earth Science Information Network CIESIN et al., 2011). The GRUMP dataset is provided by the Socioeconomic Data and Applications Center (SEDAC) and offers different georeferenced population datasets at continental, regional and national scales. This dataset is often used as a baseline for studies that require large-scale maps of urban or rural areas (Florczyk et al., 2020; Mcdonald et al., 2011) and is based on polygons defined by the extent of the nighttime light imagery and approximated urban extents from ground-based settlement points.
The dataset was downloaded from the data product's public site (https://sedac.ciesin.columbia.edu/data/collection/grump-v1, last access: 23 May 2020) in ASCII format in a 30 arcsec resolution. The files were converted, resampled and aligned in order to match the dam's catchment model, and then the population was computed for each dam's catchment. The units of population for each dam's catchment are expressed in number of people.
2.2.7 Equipped area for irrigation from the Global Map of Irrigated Areas dataset
The equipped area for irrigation (EAI) for each of the dams' catchments were extracted from the Global Map of Irrigated Areas dataset provided by the Food and Agriculture Organization of the United Nations (Siebert et al., 2005), which is often used to provide valuable information about irrigation in hydrological models (Wisser et al., 2008). This dataset is a global-scale dataset of irrigated areas based on cartographic information and FAO statistics, and it was developed by combining sub-national irrigation statistics with geospatial information.
The EAI data were downloaded from the data product's public site (http://www.fao.org/aquastat/en/geospatial-information/global-maps-irrigated-areas/, last access: 23 May 2020) in ASCII grid format; then, the file was converted, resampled and aligned in order to match the dams' catchment models, and then the equipped area for irrigation for each dam's catchment was computed. This dataset is presented in a resolution of 0.5∘, and it is presented in ASCII grid format. The units of EAI are expressed in hectares (ha).
2.2.8 Aridity index
The aridity index (AI) is a useful indicator to evaluate long-term climatic water deficiencies in a region. For this study, we determine the AI for each dam's catchment using the methodology proposed by UNESCO (United Nations Educational, Scientific and Cultural Organization; UNEP, 1992), which is represented by
where AIi is the aridity index for each dam's catchment, P is the mean annual value of precipitation for each dam's catchment (mm yr−1) and PET is the mean annual potential evapotranspiration for each dam's catchment (mm yr−1). The aridity index is unitless. Both the mean annual precipitation and potential evapotranspiration values are derived from the CRU dataset. The units for both P and PET values are expressed in millimetres per year.
In general, higher values of AI represent humid climates, while lower values represent dry or arid climates. Aridity indexes are commonly classified based on the following subtypes: hyper-arid (AI<0.03), arid (), semi-arid (), sub-humid () and humid (AI≥0.65) (Pour et al., 2020).
2.2.9 Residence time
The residence time (RT) or the “age” of water is a common indicator used to determine useful information about the storage, sediment transport, water quality or flow pathways of a catchment (Mcguire et al., 2005; Vörösmarty et al., 2003). This indicator usually refers to local conditions in a single reservoir and is usually represented by
where RTi is the residence time for each reservoir, “reservoir volumei” is the volume of the reservoir i and “discharge volume” is the average discharge volume per year at each dam i. If reservoir volume is expressed in cubic kilometres and discharge volume is expressed in cubic kilometres per year, residence time is expressed in years.
For the annual discharge volume, we used the information from the GRDC composite runoff field dataset and the area of each dam's catchment which was derived from the HydroSHEDS dataset.
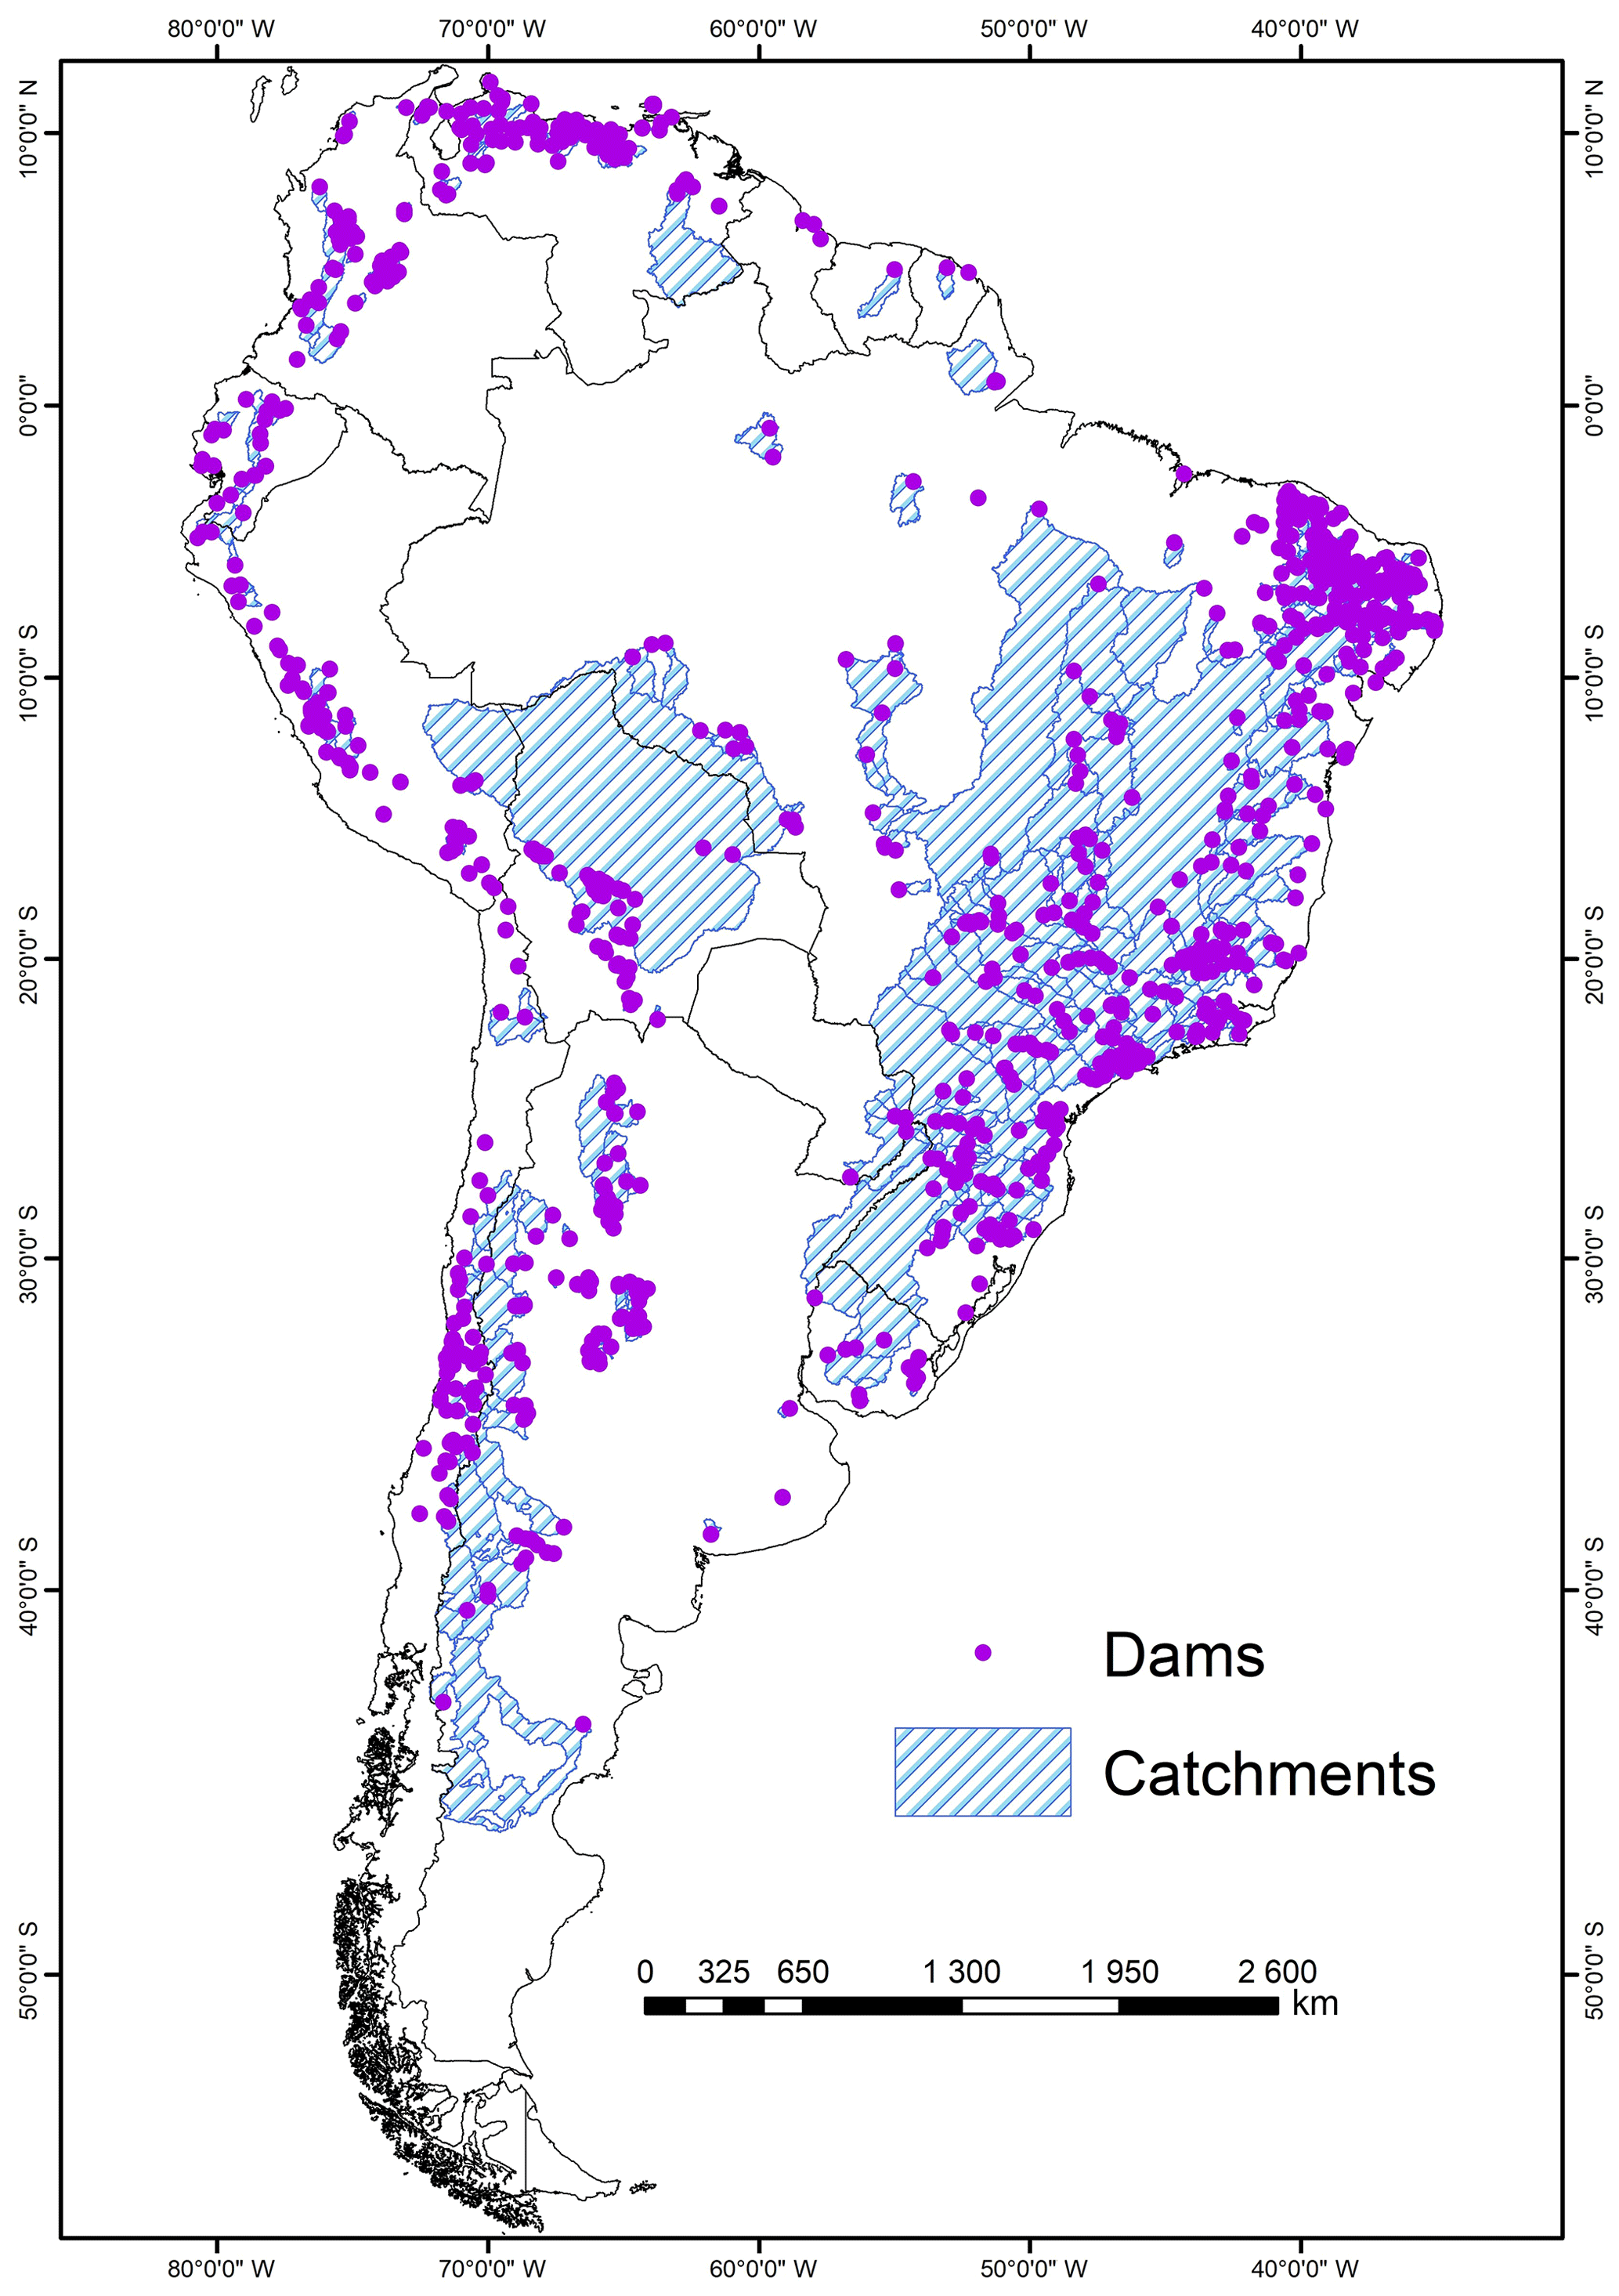
Figure 1Dataset of Georeferenced Dams in South America (DDSA).
2.2.10 Degree of regulation
The degree of regulation (DoR) provides a first approach to assess the potential impact of reservoirs on their downstream network. This index measures the degree of flow regulation that a dam or a cluster of dams can cause on a river network. This regulation alters the connectivity of the streams and can cause disruptions on seasonal flow events or can reduce the transport of sediments or species though the river network (Grill et al., 2019; Lehner et al., 2011).
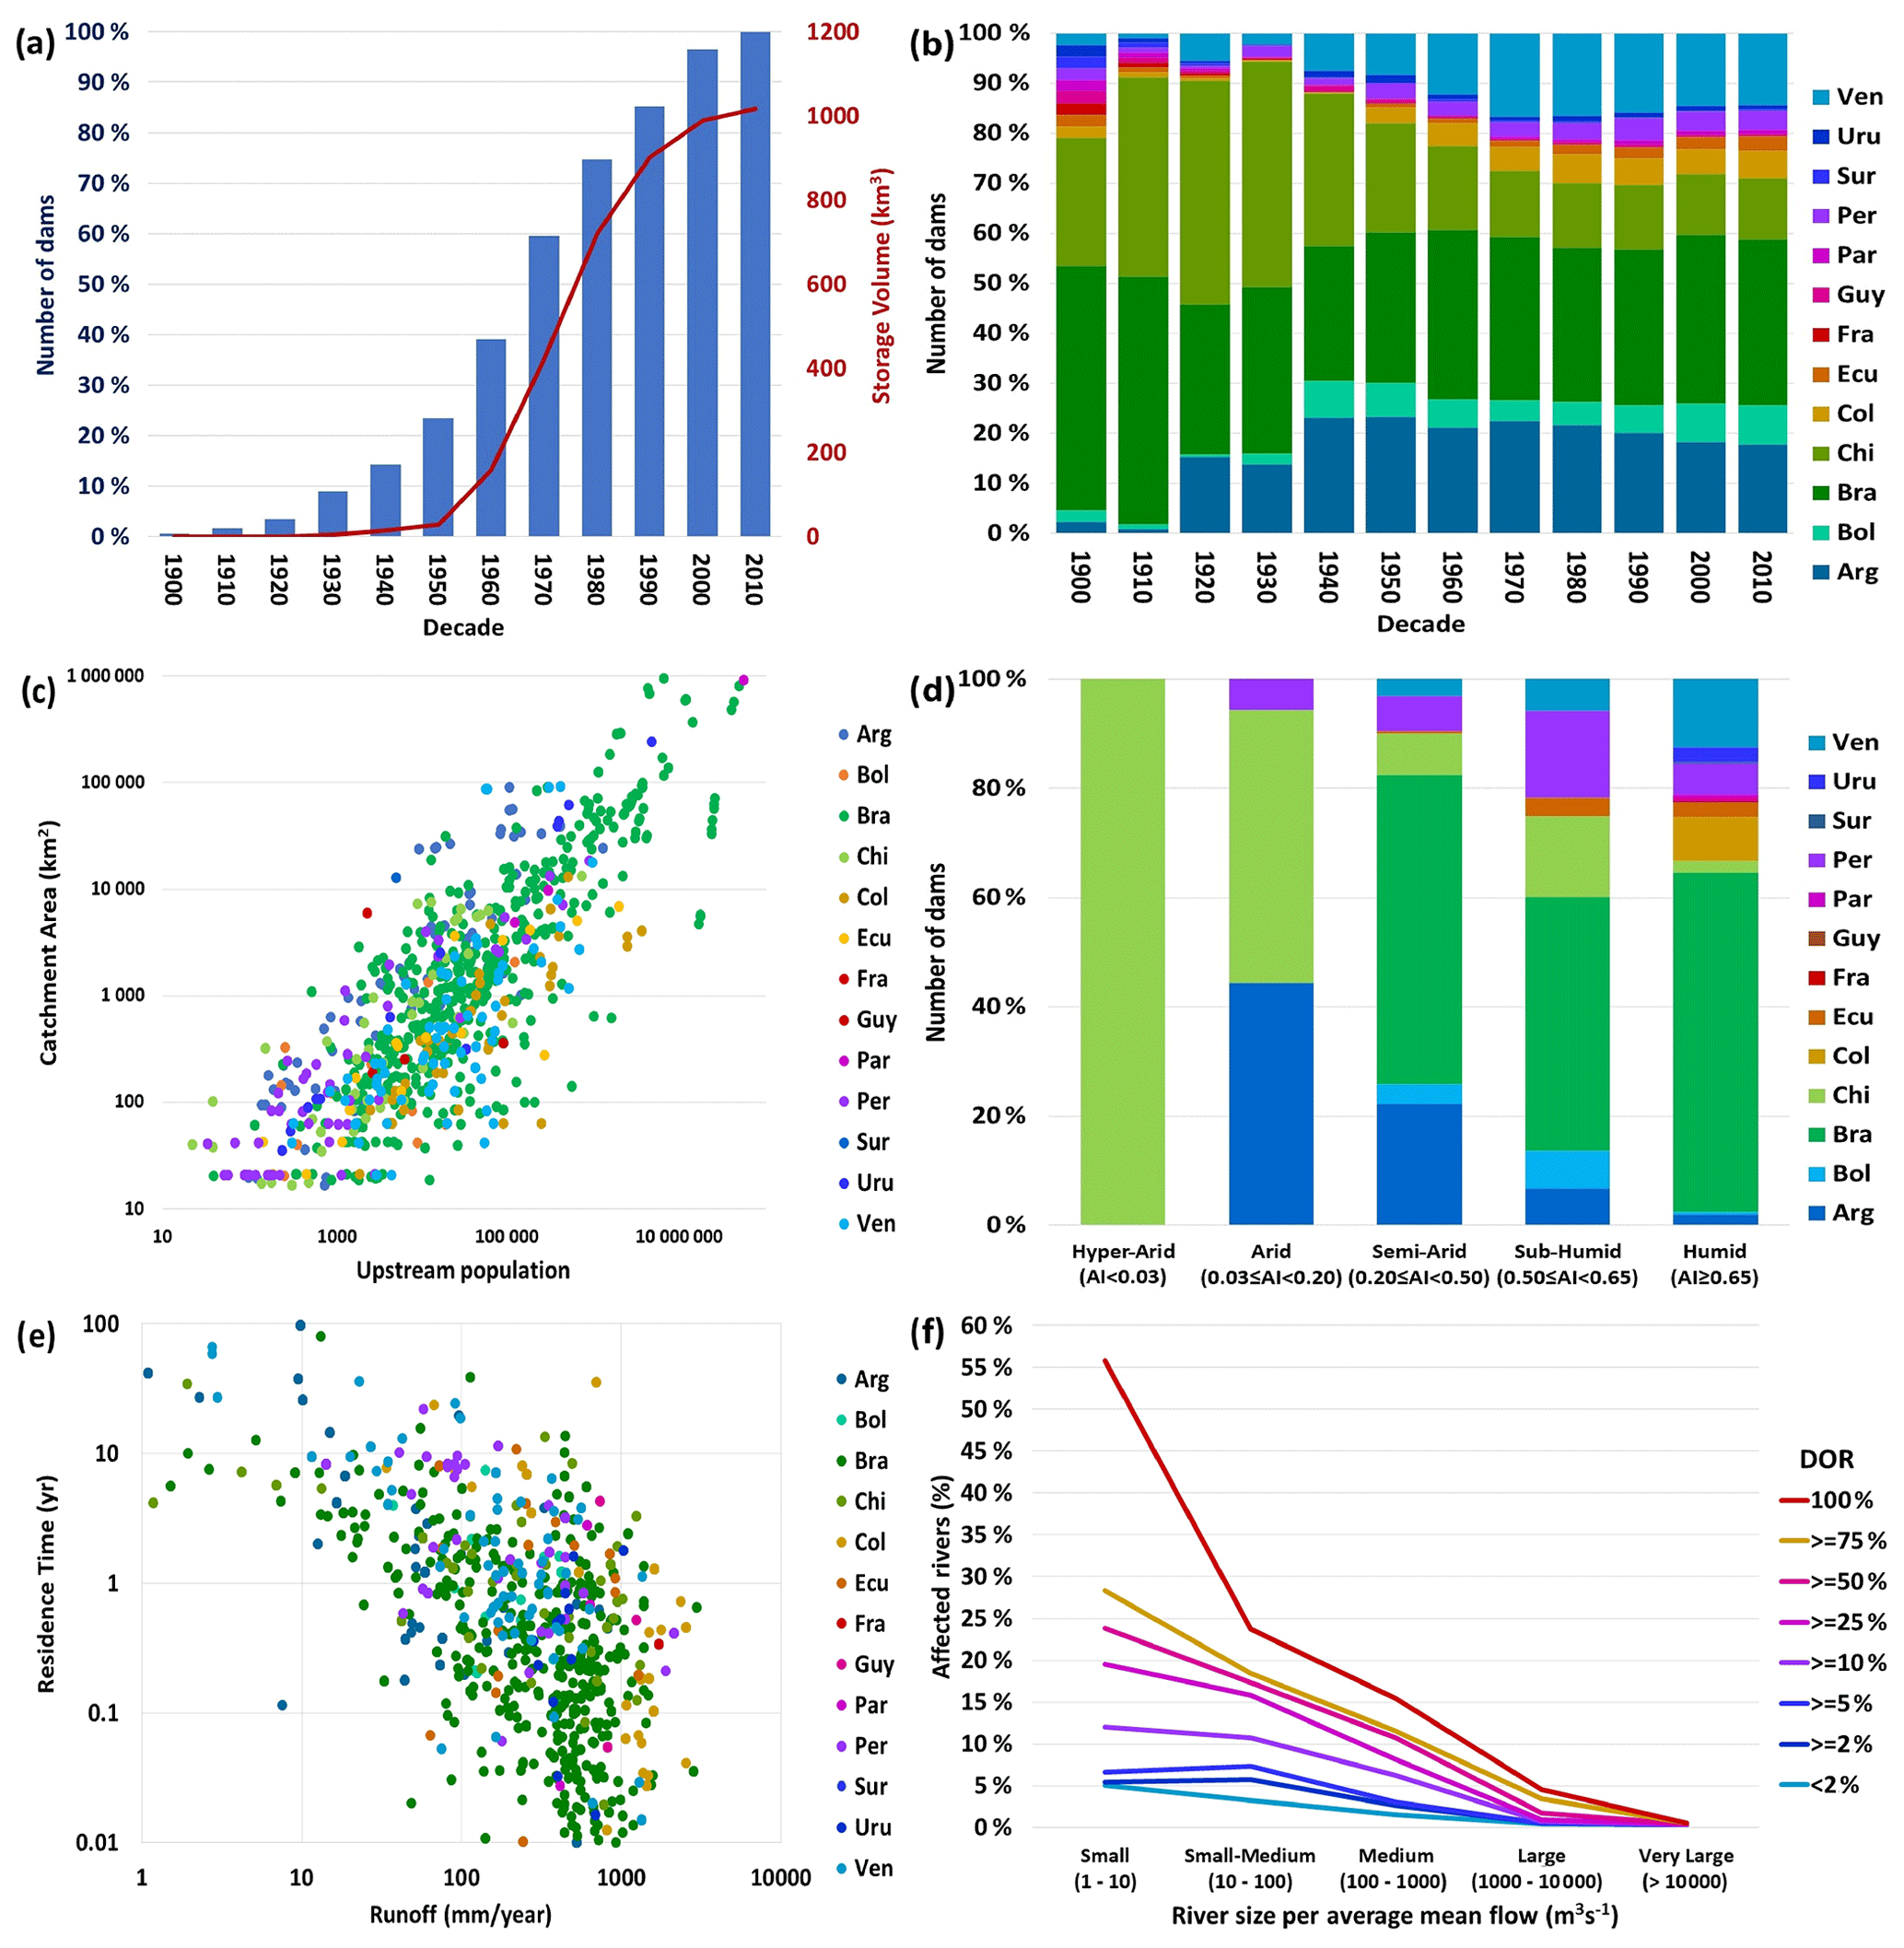
Figure 2(a) Cumulative number of dams per decade and per storage volume. (b) Cumulative number of dams per decade per country. (c) Upstream population per catchment area and per country. (d) Number of dams per aridity index type and per country. (e) Annual catchment runoff per residence time and per country. (f) Cumulative affected rivers per river size and per different DoR range. Ven: Venezuela; Uru: Uruguay; Sur: Suriname; Per: Peru; Par: Paraguay; Guy: Guyana; Fra: French Guiana; Ecu: Ecuador; Col: Columbia; Chi: Chile; Bra: Brazil; Bol: Bolivia; Arg: Argentina.
In order to determine the DoR index, we followed the methodology described by Grill et al. (2019) and computed the DoR index for each dam's location based on the relationship between the accumulated reservoir volume and the total annual flow river at each dam's location. This index is determined in percentage and is represented by
where DoRi is the degree of regulation index for each stream reach i, “reservoir volumej” is the reservoir volume of the dams j located upstream or the stream reach i, n is the total number of upstream dams, and “discharge volume” is the average discharge volume per year at the stream reach i. For this study we used a minimum threshold of 2 % to distinguish between free-flowing rivers (Dynesius and Nilsson, 1994), and also, we restricted the DoR value to 100 % to limit multi-year reservoirs to the same maximum DoR (Lehner et al., 2011).
We extracted the river network from the HydroSHEDS dataset and defined the rivers as the streams that exceeded an upstream catchment area of 10 km2. For the annual discharge volume, we used the information from the GRDC composite runoff field dataset and the area of each dam's catchment, which was derived from the HydroSHEDS dataset. Reservoir volume is expressed in cubic kilometres, and the discharge volume is expressed in cubic kilometres per year. The degree of regulation is expressed in percentage values.

Figure 3(a) Near-surface temperature, (b) precipitation, (c) potential evapotranspiration and (d) runoff maps for each dam's catchment.
Table 2Number of new dam entries per country.
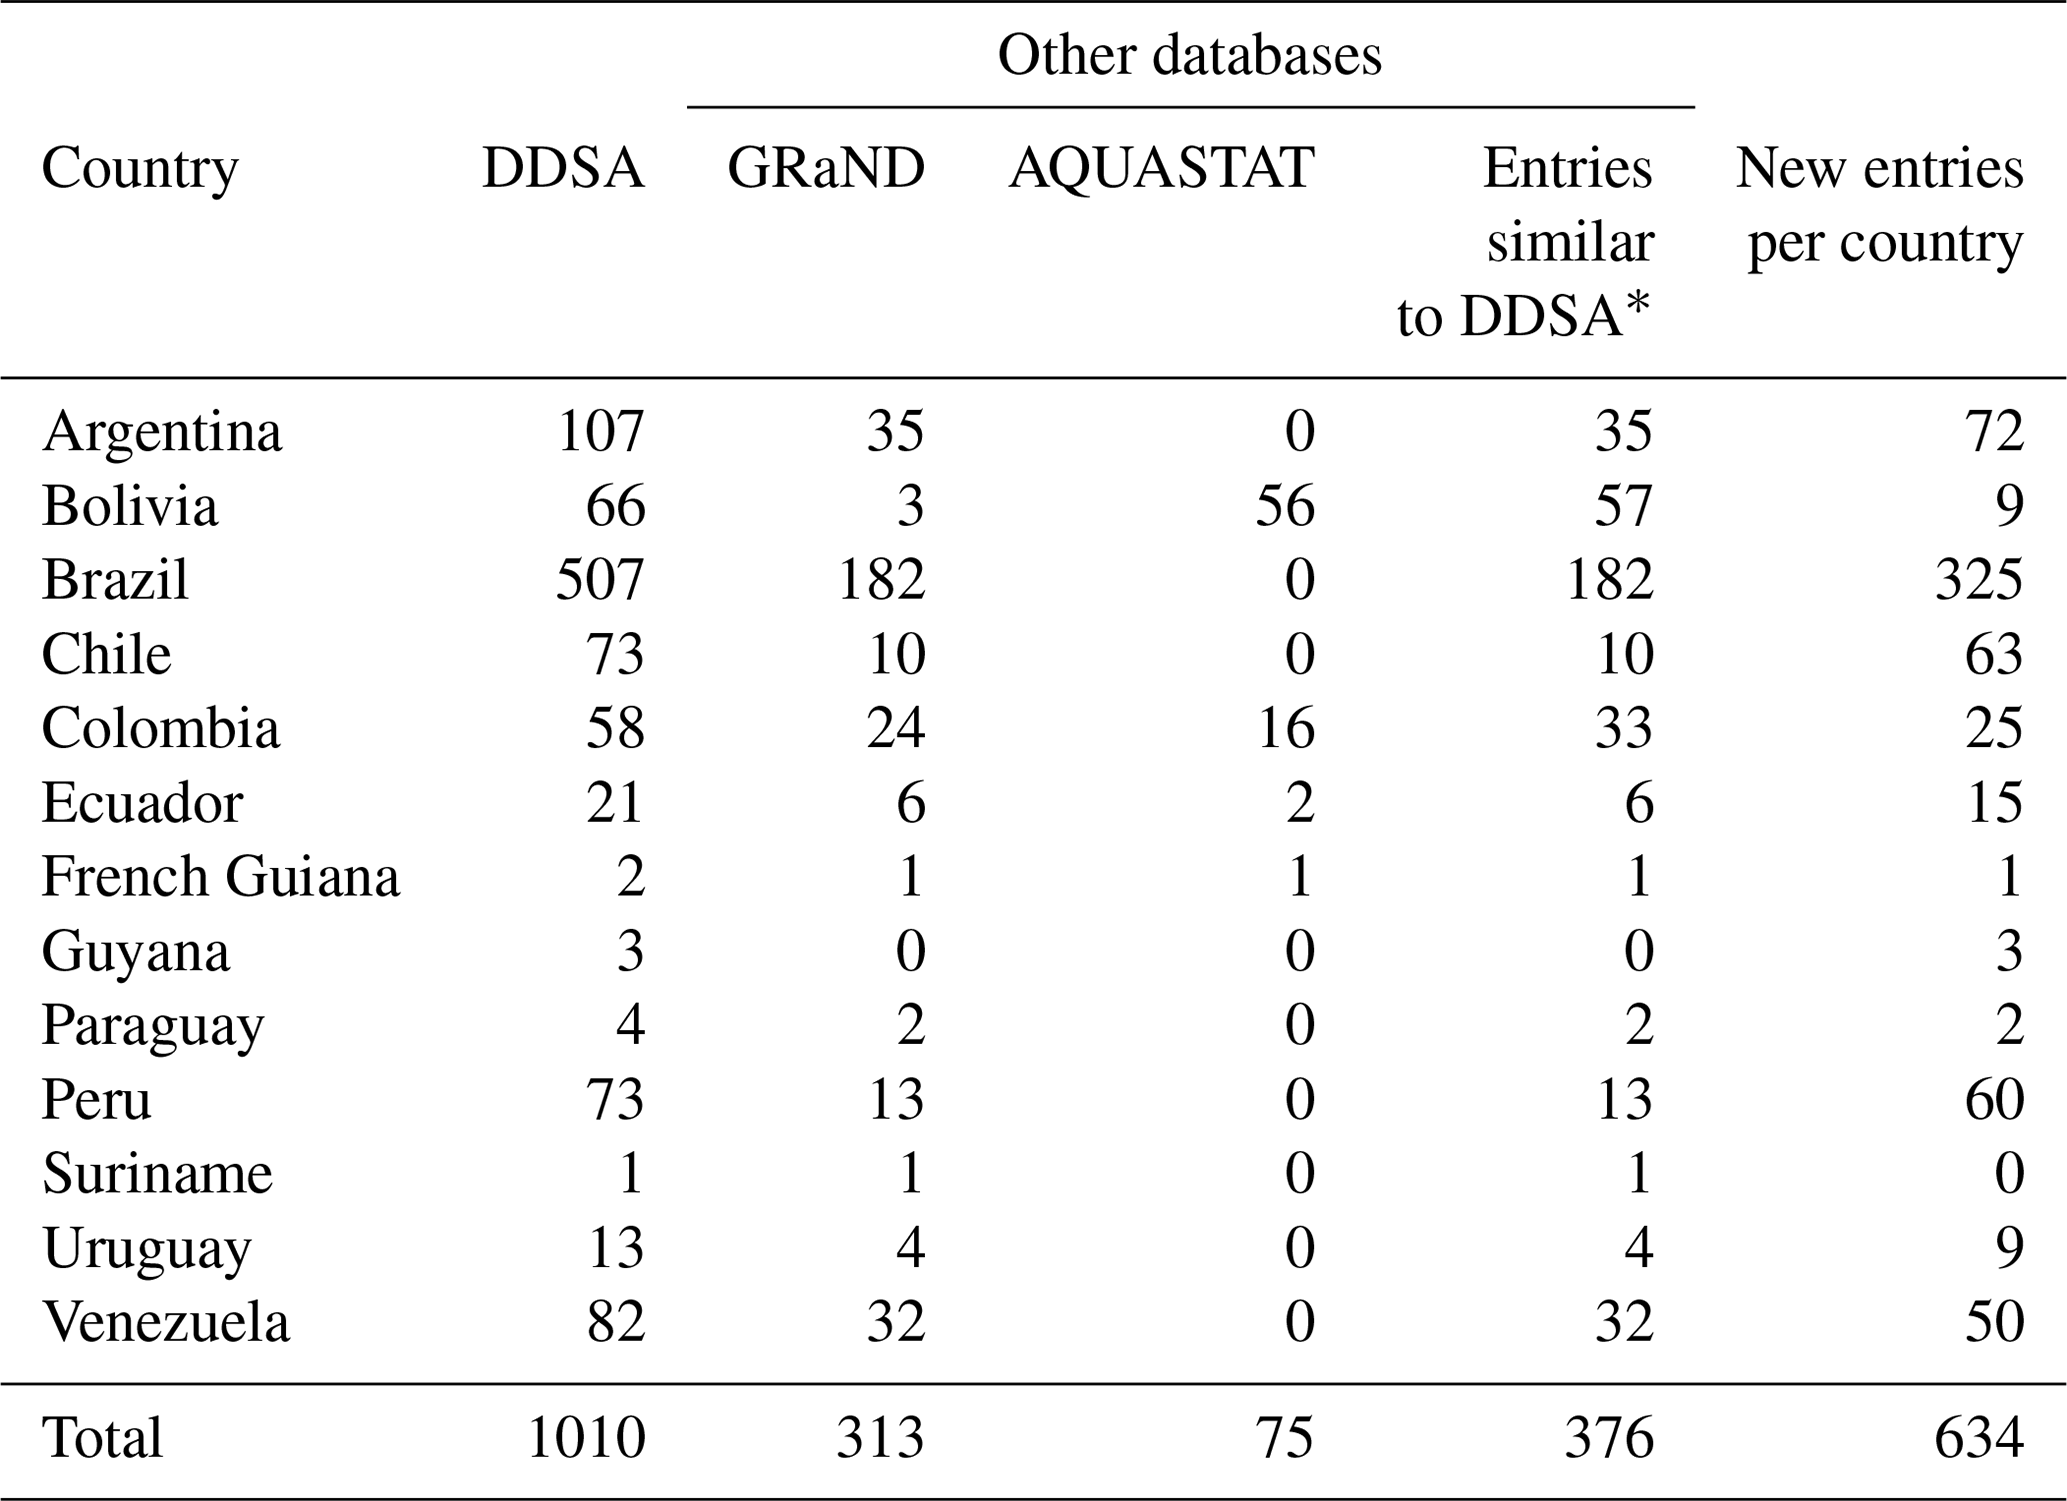
* In some cases, AQUASTAT and GRaND entries were duplicated, so they were considered as a single entry.

Table 4List of hydrological and additional information processed in this study.

n/a stands for not applicable.
3.1 Dams and reservoirs
Once the review, refinement and processing of the data were concluded, a total of 1010 dam entries were accepted for our database (Fig. 1). This represents a noticeable progress in the identification and geolocation of dams in the region and thus, enables the opportunity for new research that allows for a more precise understanding of the water resource systems in the region. After a comparison with other databases, 376 entries were similar to the AQUASTAT and GRaND databases; however, they were included in our database, since the 1010 entries were inspected and verified following the same procedure described in previous sections. Additionally, this database increases dam entries not only as a total regional number but also increases the number of entries per country, which means that with this database we also expect to contribute to new research in study areas that have not been considered to date due to the absence of reliable information. Table 2 details the entries in our database for each country considered in this study, including a comparison with the AQUASTAT and GRaND databases. Table 3 describes the 24 variables processed and accepted for this database. The estimated total reservoir volume of this database is 1017 km3, and the largest reservoir belongs to the “El Guri” dam in Venezuela with an estimated volume of 135 km3.
We also present an analysis on the implementation of dams in South America. This analysis is shown in Fig. 2a and b. Our results show that the largest number of dams have been built since the 1960s, a period in which more than 70 % of the dams on the continent were built. Similarly, the greatest increase in storage capacity occurred between the 1970s and the 1990s, which suggests that the largest projects were implemented in this period, including the El Guri dam. In the case of dams implemented by countries, we can observe the relevance of Brazil, the country with the highest number of dams in our database with more than 50 % of records. This predominance is also seen in the total storage volume, since Brazil has more than 60 % of the total volume of storage reported in our database, probably due to the vast amount of water resources in this country.
3.2 Hydrological information
The model derived from the HydroSHEDS dataset allowed us to determine the catchment areas of this database, which were necessary to carry out the subsequent hydrological calculations. The accumulated area of the dams' catchments is approximately 14 855 192 km2 with an average catchment of 18 385 km2. The largest catchment belongs to the “Jirau” dam in Brazil with an estimated area of 962 732 km2. Table 4 describes the variables processed for the hydrological information included in this database.
Figure 3 presents the annual values for NST, P, PET and runoff estimated for each dam's catchment. Both in the case of NST and P, higher values would seem to be mostly located near the Equator, while PET higher values are more noticeable in the northeast of Brazil. In the case of runoff, values are scattered, and there is no evident predominance, except for higher values localized in the southeast of Brazil.
Figures 2c and 4a represent the values of catchment population for each dam's catchment. We observe a clear connection between these attributes, with larger catchment areas corresponding to larger populations. Although this trend by itself is expected, Fig. 4a suggests a strong population pressure on downstream catchments, which is mainly inflicted by upstream population catchments. For example, the “Yacyretá” dam has the largest population with more than 55 million people. However, this value comes mainly due to the accumulated population of upstream catchments, including the “Itaipú” dam's catchment population of almost 49 million people, which in turn also receives most of its large catchment population from upstream catchments. Figure 4b presents the equipped area for irrigation for each dam's catchment. The dam with the largest equipped area for irrigation corresponds to the Yacyretá dam's catchment dam with more than 930 000 ha of equipped area for irrigation.
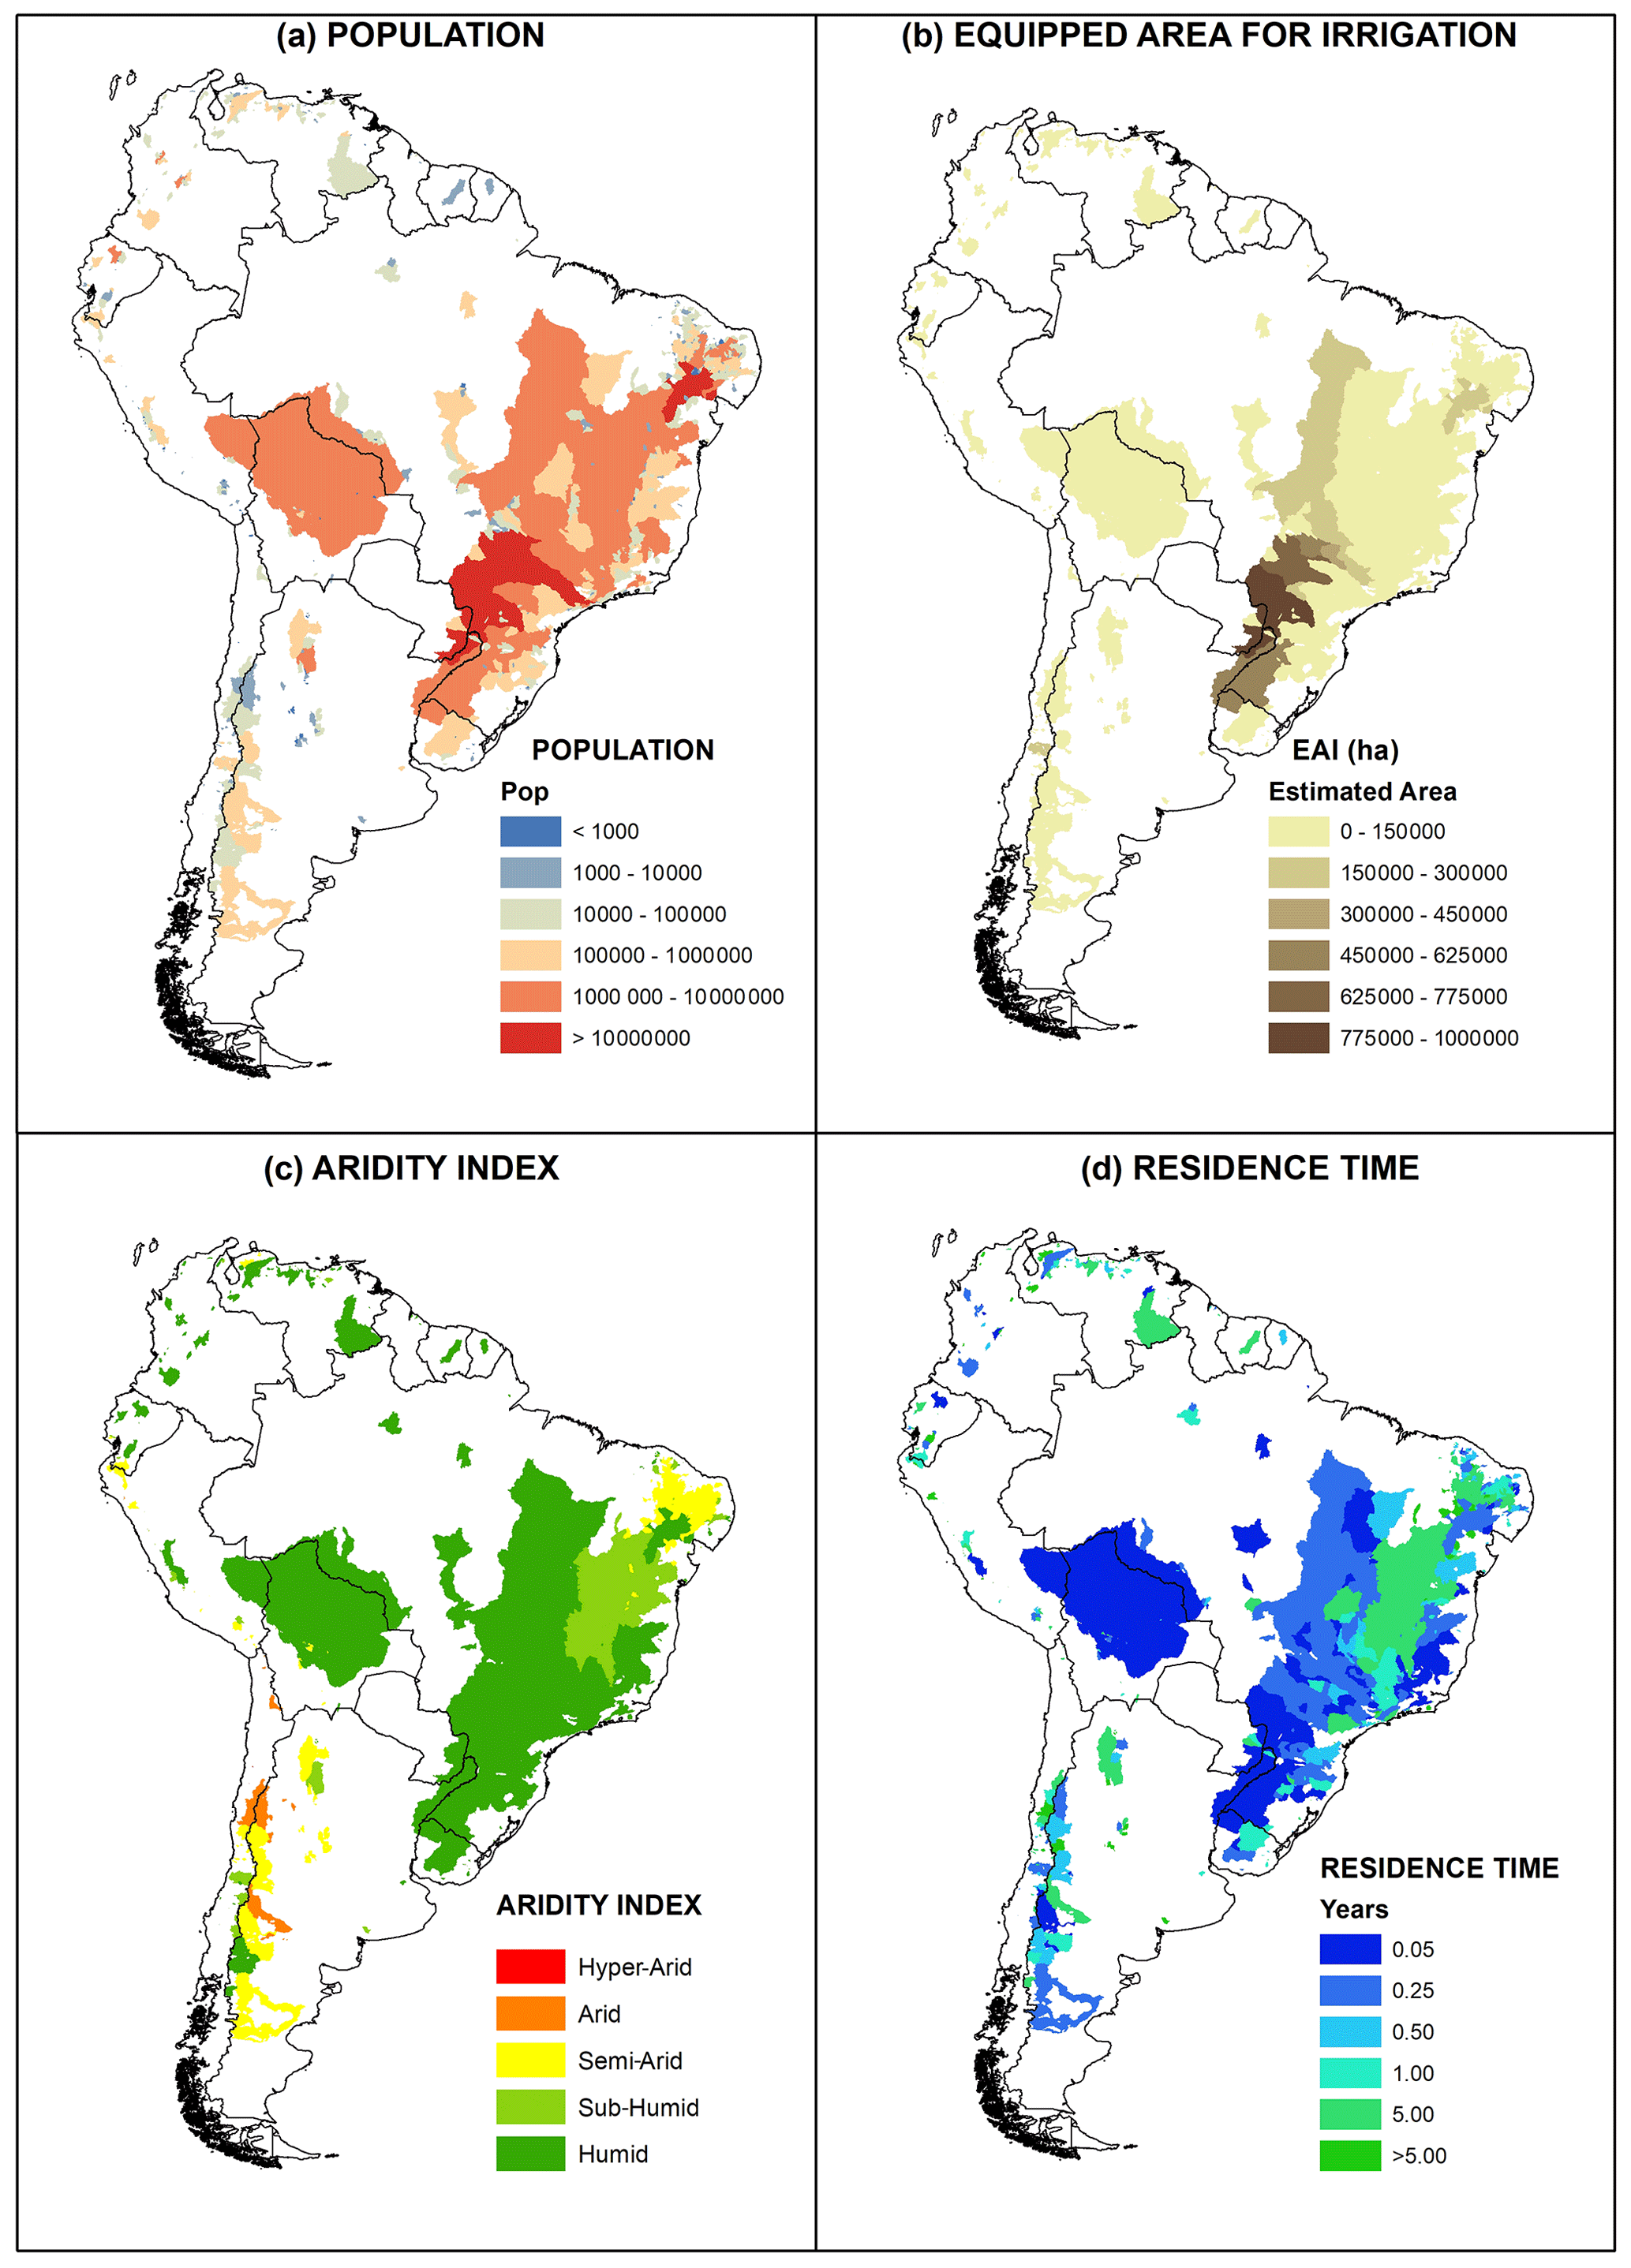
Figure 4(a) Population, (b) equipped area for irrigation, (c) aridity index and (d) residence time for each dam's catchment.
Figures 2d and 4c describe the number of dams per aridity index type and per country. In this case, we observe that dams located in arid areas are mostly located in the southwest of the continent, especially in Argentina, Chile and Peru. Most significantly, we observe that two dams, “Austral” and “Candelaria”, have their catchments located in hyper-arid areas. In the case of catchments located in humid areas, we observe that most of these dams are located near the Equator, largely due to the high precipitation values in this region.
Figure 2e describes the relationship of runoff and residence time per dam. We observe a clear relation between these two attributes, with reservoirs with larger specific capacities corresponding to catchments with lower runoff values. This indicates an “expected” performance from most of the dams in our database, from large reservoirs located in regions with low available water resources areas like the “Cocorobó” dam in Brazil or the “Las Maderas” dam in Argentina. On the other hand, we observe small reservoirs in large water resource areas like the “Chisaca” dam in Colombia or the “Suytococha” dam in Peru. Figure 4d describes the residence time for each dam. Again, if we visually compare this figure with Fig. 3d, we observe a clear relation between the residence time and runoff, with high residence time values located in areas with low runoff.
Finally, Fig. 2f provides information on the DoR index in the rivers of South America classified by river flow category and level of regulation. The river flow category refers to different values of average mean flow. Our results indicate that the regulation effects of reservoirs are more evident in the rivers with smaller average flows. Over 50 % of the total “affected rivers” in the region – these are the rivers with a DoR>=2 % – correspond to small flow rivers. The DoR affectation decreases as the mean river flow increases, which is observed in very large average flows, whose level of DoR affectation is less than 1 %. Rivers with multi-annual reservoirs – these are streams with a DoR=100 % – are more frequent in small flow rivers, with more than 27 % of the total observations. Figure 5 shows the degree of river regulation of the reservoirs of the DDSA database for the affected rivers of South America.
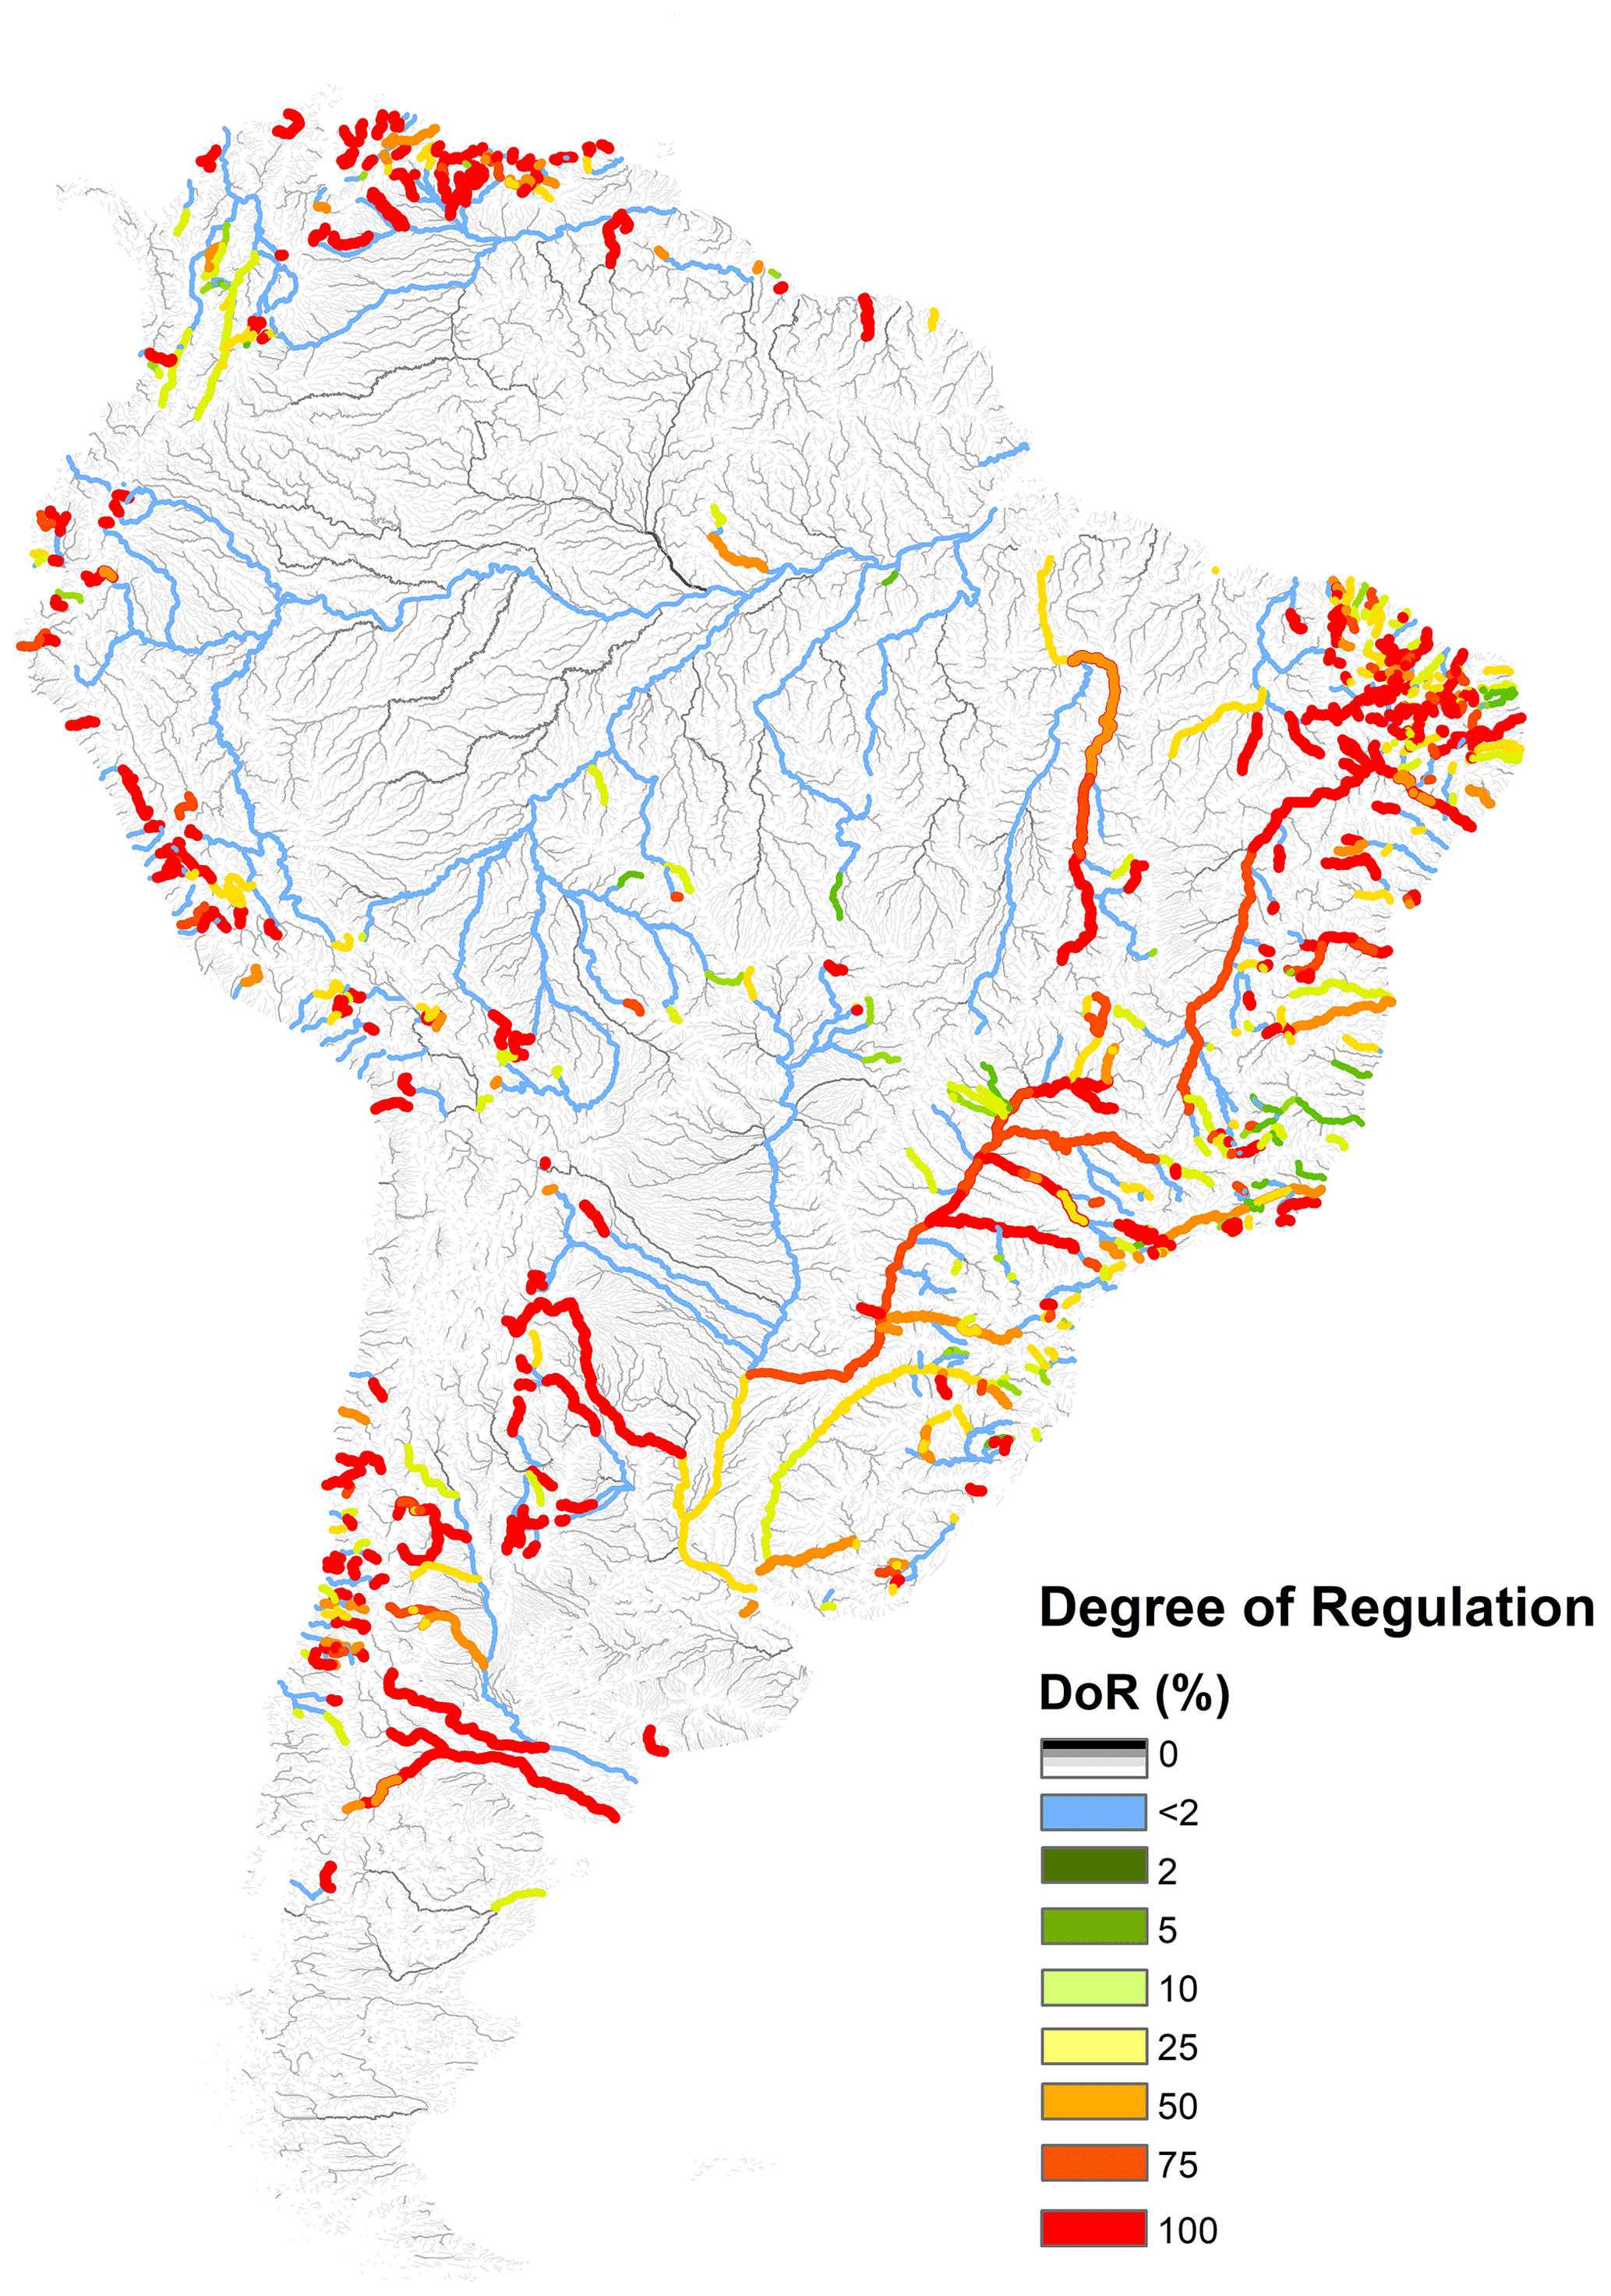
Figure 5Degree of regulation (DoR) of reservoirs of the DDSA database in downstream rivers of South America.
The information provided in this database cannot be considered error free, since it has been prepared using the information available at the time of its elaboration. It should also be noted that although our database was created independently, through an individual investigation and based primarily on reports and documents available from each of the countries in the region, the database may include attributes of dams that are also reported by other existing dam databases such as ICOLD, AQUASTAT and GRaND.
Hydrological inputs provided in this database also need careful interpretation to avoid misleading interpretations. First, the resolution of the hydrological datasets used in the DDSA database could affect the accuracy of results for small catchments. Although all the datasets considered in this database have been largely validated for large-scale or regional assessment models (Gonzàlez-Zeas et al., 2012; Lv et al., 2018), we suggest caution if the intention is to use these results in catchments with an area smaller than the cell size of each dataset.
Our results regarding aridity index, residence time and degree of regulation also need to be interpreted with caution. First, our results are intended to assess the dams' catchments and therefore, should be used carefully if intended for another type of assessment. Also, in the case of the DoR index, there are many important inputs in our assessment which have not been considered and may alter the assessment results. For example, given the scale of this study, we are not considering information about local water use, specific stream characteristics, or relevant and updated urban information. Also, two relevant inputs were not considered in our DoR assessment: unidentified small reservoirs and the reservoir's active storage instead of total reservoir storage. These inputs should be considered in order to obtain more accurate results of the flow regulation but were not considered due to the absence of this information. Furthermore, the impacts of river regulation also depend on a wide range of factors, e.g. local or international water management policies, which have not been considered either. Altogether, we consider that despite the aforementioned uncertainty factors, our results give a consistent first approximation of these indices at a regional scale.
Finally, in order to assess the robustness of our DoR assessment, we conducted a sensitivity analysis by comparing our findings with the results determined by Grill et al. (2019) in their paper, “Mapping the world's free-flowing rivers” (DoR_FFR). Figure 6 compares 409 stream matches from both studies and determines a strong correlation (r=0.702) between our results and the DoR_FFR paper. The correlation results are more evident on large and very large rivers.
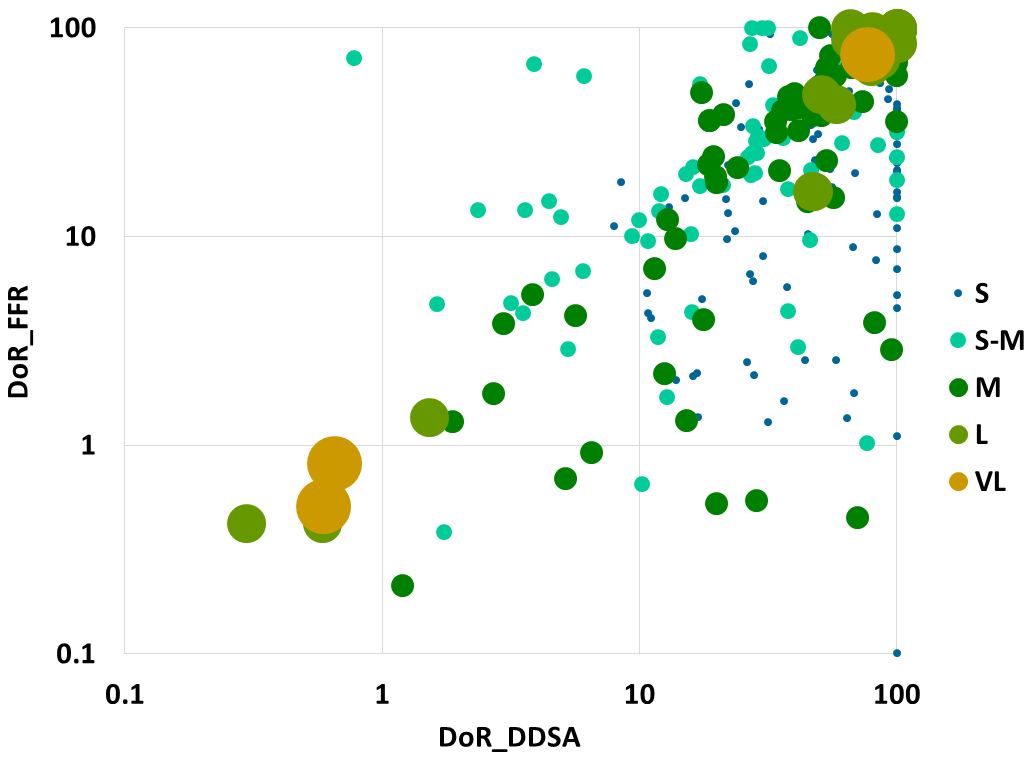
Figure 6DoR sensitivity analysis. Degree-of-regulation values from the DDSA database (DoR_DDSA) were compared with matching values from the degree-of-regulation values (DoR_FFR) of Grill et al. (2019). River were classified by their average mean flow; smaller dots represent small rivers, and bigger dots represent large to very large rivers. S: small; S–M: small to medium; M: medium; L: large; VL: very large.
The Database of Georeferenced Dams in South America (DDSA) is a joint effort of researchers from the Department of Civil Engineering: Hydraulics, Energy and Environment of the Universidad Politécnica de Madrid and the Carrera de Ingeniería Civil of the Universidad Técnica de Ambato. The DDSA database is available for both researchers and the general public through its ZENODO open-access repository at https://doi.org/10.5281/zenodo.4315647 (Paredes-Beltran et al., 2020), where we have detailed the contact information of the authors, in order to receive any valuable contribution which could allow us to improve our database. The files provided through the ZENODO repository include (i) 13 files that describe all the attributes of the database in CSV (comma-separated values) format, (ii) 1 file of the database in KML (Keyhole Markup Language) format to be used with online map browsers, (iii) 2 files in SHP (shapefile) format with information on the dams and watersheds of the database to be used with GIS (geographic information system) software, and (iv) 1 file in CSV format with information on future dams in South America.
The Dataset of Georeferenced Dams in South America (DDSA) has been developed to contribute to the improvement of water resource management in the region. The provision of reliable, high-resolution and available data on dams and reservoirs will contribute to the assessment of freshwater ecosystems and communities both for present and future scenarios in this region which, to date, have been restricted to a limited number of catchments due to the absence of available information and, thus, contribute to generate more informed decision-making processes in order to safeguard the future sustainability of the communities in this region.
The 1010 entries of dams present a total of 24 attributes. Each record has been included in the list after an individual review, and its position has been determined considering public digital terrain models. In addition, the database also provides mean monthly hydrological information. With this increased spatial coverage and attribute information, this database could be used as a baseline for further studies that address relevant issues regarding dams, hydrology, ecology and people in the region. Also, with the inclusion of data for all the countries in the continent we also expect to contribute to an in-depth understanding of the hydrological and environmental dynamics for the entire continent and encourage the generation of knowledge in areas that have not been considered in past studies.
One of the main goals of this endeavour is to foster the research of water resources in South America. To achieve this objective, we consider that we must make the necessary efforts to keep our database relevant to the international hydrology community.
For this, we believe it will be necessary to keep our database updated and, also, include additional information regarding hydrology and water resource management in future versions of our database. Future dams are one of the topics we need to observe to keep our database updated. In recent years, several South American countries have made public their intention to develop new dam projects, mainly for hydroelectric generation (Almeida et al., 2019; Anderson et al., 2018; Moran et al., 2018; Zhang et al., 2018). We have identified 574 future projects in South America, with 61 under construction during 2020 and 513 projects planned to be developed in the future. Table S1 in the Supplement details future dams in South America identified by country, name and implementation phase.
Monitoring the development of future dams in South America is necessary due to the relevance of these projects on the local and regional scales. It is not likely that all projects listed in Table S1 will be carried out due to different economic, social or political factors (Anderson et al., 2018). However, the likely ecological or social impacts that these projects may cause (Doria et al., 2018; Lees et al., 2016; Winemiller et al., 2016) highlight the necessity for the international hydrological community to be conscious of the status of these projects.
Similarly, we consider that future versions of our database may be extended with additional attributes. For example, information such as outflows of dams (discharge time series) or energy generation data from hydroelectric dams (energy generation time series) could also be included in the future. However, to date, including this type of information on a continental scale represents a significantly great effort due to the lack of readily available information on water resources in most countries of the region. There are countries, like Brazil, which make public their relevant information about water resources and energy generation through their official agencies, e.g. the National Agency of Water (Agência Nacional de Águas, ANA, https://www.ana.gov.br/sar/sin, last access: 9 November 2020) and the National Electric Energy Agency (Agência Nacional de Energia Elétrica, ANEEL, https://www.aneel.gov.br/siga, last access: 9 November 2020). Then again, other countries of the region keep this information restricted or outdated, which makes it difficult to complete these attributes for the entire database.
Finally, the data presented in this database are largely based on open-access information available to date; therefore, the valuable support of both public institutions and the international hydrology community will be necessary for extending future versions of our database. This will allow us to keep our database relevant, which in turn will support the development of future research initiatives on water resources in the region.
The supplement related to this article is available online at: https://doi.org/10.5194/essd-13-213-2021-supplement.
BEPB conceptualized the project and its methodology; performed the investigation, formal analysis, data curation and validation; used the appropriate software; wrote the original draft; and reviewed and edited the paper. ASW conceptualized and supervised the project, conceptualized the project's methodology, performed the formal analysis and validation, acquired funding and resources, and reviewed and edited the paper. LG administered and supervised the project, performed the formal analysis and validation, used the appropriate software, acquired funding and resources, and reviewed and edited the paper.
The authors declare that they have no conflict of interest.
The first author would like to acknowledge Universidad Técnica de Ambato for the financial support through its doctoral student mobility programme (award no. 1886-CU-P-2018, Resolución HCU). The authors acknowledge the financial support of the Ministerio de Ciencia e Innovación (Spain) through the project SECA-SRH (grant no. PID2019-105852RA-I00). The authors thank two anonymous reviewers and editor David Carlson for their valuable feedback on their paper.
This research has been supported by the Ministerio de Ciencia e Innovación (Spain) (project no. SECA-SRH, grant no. PID2019-105852RA-I00) and the Universidad Técnica de Ambato (Ecuador) (grant no. 1886-CU-P-2018).
This paper was edited by David Carlson and reviewed by two anonymous referees.
Agência Nacional de Águas: Mapa Interativo das Barragens Cadastradas no Sistema, Sist. Nac. Informações sobre Segurança Barragens SNISB, available at: http://www.snisb.gov.br/portal/snisb/mapas-tematicos-e-relatorios/mapa-interativo-das-barragens-cadastradas (last access: 11 November 2020), 2019.
Almeida, R. M., Shi, Q., Gomes-Selman, J. M., Wu, X., Xue, Y., Angarita, H., Barros, N., Forsberg, B. R., García-Villacorta, R., Hamilton, S. K., Melack, J. M., Montoya, M., Perez, G., Sethi, S. A., Gomes, C. P., and Flecker, A. S.: Reducing greenhouse gas emissions of Amazon hydropower with strategic dam planning, Nat. Commun., 10, 4281, https://doi.org/10.1038/s41467-019-12179-5, 2019.
Alonso, E. E., Olivella, S., and Pinyol, N. M.: A review of Beliche Dam, Geotechnique, 55, 267–285, https://doi.org/10.1680/geot.2005.55.4.267, 2005.
Anderson, E. P., Jenkins, C. N., Heilpern, S., Maldonado-Ocampo, J. A., Carvajal-Vallejos, F. M., Encalada, A. C., Rivadeneira, J. F., Hidalgo, M., Cañas, C. M., Ortega, H., Salcedo, N., Maldonado, M., and Tedesco, P. A.: Fragmentation of Andes-to-Amazon connectivity by hydropower dams, Sci. Adv., 4, 1–8, https://doi.org/10.1126/sciadv.aao1642, 2018.
Autoridad Nacional del Agua: Inventario de Presas en el Peru, Lima, available at: https://www.ana.gob.pe/etiquetas/inventario-de-presas (last access: 9 February 2020), 2016.
Barbarossa, V., Schmitt, R. J. P., Huijbregts, M. A. J., Zarfl, C., King, H., and Schipper, A. M.: Impacts of current and future large dams on the geographic range connectivity of freshwater fish worldwide, P. Natl. Acad. Sci. USA, 117, 3648–3655, https://doi.org/10.1073/pnas.1912776117, 2020.
Barletta, M., Jaureguizar, A. J., Baigun, C., Fontoura, N. F., Agostinho, A. A., Almeida-Val, V. M. F., Val, A. L., Torres, R. A., Jimenes-Segura, L. F., Giarrizzo, T., Fabré, N. N., Batista, V. S., Lasso, C., Taphorn, D. C., Costa, M. F., Chaves, P. T., Vieira, J. P., and Corrêa, M. F. M.: Fish and aquatic habitat conservation in South America: A continental overview with emphasis on neotropical systems, J. Fish Biol., 76, 2118–2176, https://doi.org/10.1111/j.1095-8649.2010.02684.x, 2010.
Batalla, R. J. and Go, C. M.: Reservoir-induced hydrological changes in the Ebro River basin (NE Spain), J. Hydrol., 290, 117–136, https://doi.org/10.1016/j.jhydrol.2003.12.002, 2004.
Beck, H. E., Van Dijk, A. I. J. M., Levizzani, V., Schellekens, J., and Miralles, D. G.: MSWEP: 3-hourly 0.25∘ global gridded precipitation (1979–2015) by merging gauge, satellite, and reanalysis data, Hydrol. Earth Syst. Sci., 21, 589–615, https://doi.org/10.5194/hess-21-589-2017, 2017.
Bednarek, A.: Undamming rivers: A review of the ecological impacts of dam removal, Environ. Manage., 27, 803–814, https://doi.org/10.1007/s002670010189, 2001.
Bejarano, M. D., Sordo-Ward, Á., Alonso, C., and Nilsson, C.: Characterizing effects of hydropower plants on sub-daily flow regimes, J. Hydrol., 550, 186–200, https://doi.org/10.1016/j.jhydrol.2017.04.023, 2017.
Biemans, H., Haddeland, I., Kabat, P., Ludwig, F., Hutjes, R. W. A., Heinke, J., Von Bloh, W., and Gerten, D.: Impact of reservoirs on river discharge and irrigation water supply during the 20th century, Water Resour. Res., 47, 1–15, https://doi.org/10.1029/2009WR008929, 2011.
Bouwer, H.: Integrated water management: Emerging issues and challenges, Agr. Water Manage., 45, 217–228, https://doi.org/10.1016/S0378-3774(00)00092-5, 2000.
Cai, W., McPhaden, M. J., Grimm, A. M., Rodrigues, R. R., Taschetto, A. S., Garreaud, R. D., Dewitte, B., Poveda, G., Ham, Y.-G., Santoso, A., Ng, B., Anderson, W., Wang, G., Geng, T., Jo, H.-S., Marengo, J. A., Alves, L. M., Osman, M., Li, S., Wu, L., Karamperidou, C., Takahashi, K., and Vera, C.: Climate impacts of the El Niño–Southern Oscillation on South America, Nat. Rev. Earth Environ., 1, 215–231, https://doi.org/10.1038/s43017-020-0040-3, 2020.
Castello, L., McGrath, D. G., Hess, L. L., Coe, M. T., Lefebvre, P. A., Petry, P., Macedo, M. N., Renó, V. F., and Arantes, C. C.: The vulnerability of Amazon freshwater ecosystems, Conserv. Lett., 6, 217–229, https://doi.org/10.1111/conl.12008, 2013.
Center for International Earth Science Information Network CIESIN, Global Rural-Urban Mapping Project, Version 1 (GRUMPv1): Population Count Grid, Columbia University, CIAT – The World Bank and Centro Internacional de Agricultura Tropical, Palisades, NY, https://doi.org/10.7927/H4VT1Q1H, 2011.
Chavez-Jimenez, A., Granados, A., Garrote, L., and Martín-Carrasco, F.: Adapting Water Allocation to Irrigation Demands to Constraints in Water Availability Imposed by Climate Change, Water Resour. Manage., 29, 1413–1430, https://doi.org/10.1007/s11269-014-0882-x, 2015.
Comité Nacional Chileno de Grandes Presas: Icold Chile – Directorio de Presas, available at: http://www.icoldchile.cl/directorio/, last access: 21 November 2019.
Dai, Z. and Liu, J. T.: Impacts of large dams on downstream fluvial sedimentation: An example of the Three Gorges Dam (TGD) on the Changjiang (Yangtze River), J. Hydrol., 480, 10–18, https://doi.org/10.1016/j.jhydrol.2012.12.003, 2013.
Döll, P., Fiedler, K., and Zhang, J.: Global-scale analysis of river flow alterations due to water withdrawals and reservoirs, Hydrol. Earth Syst. Sci., 13, 2413–2432, https://doi.org/10.5194/hess-13-2413-2009, 2009.
Doria, C. R. C., Athayde, S., Marques, E. E., Lima, M. A. L., Dutka-Gianelli, J., Ruffino, M. L., Kaplan, D., Freitas, C. E. C., and Isaac, V. N.: The invisibility of fisheries in the process of hydropower development across the Amazon, Ambio, 47, 453–465, https://doi.org/10.1007/s13280-017-0994-7, 2018.
Dynesius, M. and Nilsson, C.: Fragmentation and Flow Regulation of River Systems in the Northern Third of the World, Science, 266, 753–762, 1994.
ElecAustro: Represa El Labrado, available at: https://www.elecaustro.gob.ec/, last access: 9 February 2020.
Elliott, J., Deryng, D., Müller, C., Frieler, K., Konzmann, M., Gerten, D., Glotter, M., Flörke, M., Wada, Y., Best, N., Eisner, S., Fekete, B. M., Folberth, C., Foster, I., Gosling, S. N., Haddeland, I., Khabarov, N., Ludwig, F., Masaki, Y., Olin, S., Rosenzweig, C., Ruane, A. C., Satoh, Y., Schmid, E., Stacke, T., Tang, Q., and Wisser, D.: Constraints and potentials of future irrigation water availability on agricultural production under climate change, P. Natl. Acad. Sci. USA, 111, 3239–3244, https://doi.org/10.1073/pnas.1222474110, 2014.
FAO: AQUASTAT, available at: http://www.fao.org/aquastat/en/databases/dams (last access: 23 May 2020), 2015.
Fearnside, P. M.: Environmental impacts of Brazil's Tucuruí Dam: Unlearned lessons for hydroelectric development in amazonia, Environ. Manage., 27, 377–396, https://doi.org/10.1007/s002670010156, 2001.
Fekete, B. M., Vörösmarty, C. J., and Grabs, W.: High-resolution fields of global runoff combining observed river discharge and simulated water balances, Global Biogeochem. Cy., 16, 15-1–15-10, https://doi.org/10.1029/1999gb001254, 2002.
Florczyk, A. J., Melchiorri, M., Zeidler, J., Corbane, C., Schiavina, M., Freire, S., Sabo, F., Politis, P., Esch, T., and Pesaresi, M.: The Generalised Settlement Area: mapping the Earth surface in the vicinity of built-up areas, Int. J. Digit. Earth, 13, 45–60, https://doi.org/10.1080/17538947.2018.1550121, 2020.
Gabriel-Martin, I., Sordo-Ward, A., Garrote, L., and Castillo, L. G.: Influence of initial reservoir level and gate failure in dam safety analysis. Stochastic approach, J. Hydrol., 550, 669–684, https://doi.org/10.1016/j.jhydrol.2017.05.032, 2017.
Garreaud, R. D., Vuille, M., Compagnucci, R., and Marengo, J.: Present-day South American climate, Palaeogeogr. Palaeocl., 281, 180–195, https://doi.org/10.1016/j.palaeo.2007.10.032, 2009.
Garrote, L., Iglesias, A., Granados, A., Mediero, L., and Martin-Carrasco, F.: Quantitative Assessment of Climate Change Vulnerability of Irrigation Demands in Mediterranean Europe, Water Resour. Manage., 29, 325–338, https://doi.org/10.1007/s11269-014-0736-6, 2015.
Gonzàlez-Zeas, D., Garrote, L., Iglesias, A., and Sordo-Ward, A.: Improving runoff estimates from regional climate models: A performance analysis in Spain, Hydrol. Earth Syst. Sci., 16, 1709–1723, https://doi.org/10.5194/hess-16-1709-2012, 2012.
Grill, G., Lehner, B., Thieme, M., Geenen, B., Tickner, D., Antonelli, F., Babu, S., Borrelli, P., Cheng, L., Crochetiere, H., Macedo, H. E., Filgueiras, R., Goichot, M., Higgins, J., Hogan, Z., Lip, B., Mcclain, M. E., Meng, J., Mulligan, M., Nilsson, C., Olden, J. D., Opperman, J., Petry, P., Liermann, C. R., Sáenz, L., Salinas-Rodríguez, S., Schelle, P., Schmitt, R. J. P., Snider, J., Tan, F., Tockner, K., Valdujo, P. H., van Soesberge, A., and Zarl, C.: Mapping the world's free-flowing rivers, Nature, 569, 215–221, https://doi.org/10.1038/s41586-019-1111-9, 2019.
Hao, Z., Zhang, X., Singh, V. P., and Hao, F.: Joint modeling of precipitation and temperature under influences of El Niño Southern Oscillation for compound event evaluation and prediction, Atmos. Res., 245, 105090, https://doi.org/10.1016/j.atmosres.2020.105090, 2020.
Harris, I., Osborn, T. J., Jones, P., and Lister, D.: Version 4 of the CRU TS monthly high-resolution gridded multivariate climate dataset, Sci. Data, 7, 109, https://doi.org/10.1038/s41597-020-0453-3, 2020.
Hidroabanico: Hidroabanico, available at: http://www.hidroabanico.com.ec/portal/web/hidroabanico/descripcion (last access: 9 February 2020), 2019.
Ibàñez, C. and Prat, N.: Changes in the hydrology and sediment transport produced by large dams on the lower Ebro river and its estuary, Regul. Rivers Res. Manage., 12, 51–62, https://doi.org/10.1002/(SICI)1099-1646(199601)12:1<51::AID-RRR376>3.0.CO;2-I, 1996.
ICOLD: World Register of Dams, Paris, available at: https://www.icold-cigb.org/, last access: 23 May 2020.
Instituto Nacional de Estadística: Principales Indicadores Ambientales, available at: http://www.ine.gov.ve/index.php?option=com_content&view=category&id=68:princ-indicadores#, last access: 9 February 2020.
Instituto Nacional de Pesca: Embalse Chongón, available at: http://www.institutopesca.gob.ec/embalse-chongon/, last access: 9 February 2020.
ISAGEN: Generacion de Energia, available at: https://www.isagen.com.co/es/nuestro-negocio/generamos-energia, last access: 9 February 2020.
Jacob, D., Bärring, L., Christensen, O. B., Christensen, J. H., Castro, M. De, Hirschi, M., Jones, R., and Kjellström, E.: An inter-comparison of regional climate models for Europe: model performance in present-day climate, Climatic Change, 81, 31–52, https://doi.org/10.1007/s10584-006-9213-4, 2007.
Jiménez-Muñoz, J. C., Mattar, C., Barichivich, J., Santamaría-Artigas, A., Takahashi, K., Malhi, Y., Sobrino, J. A., and Van Der Schrier, G.: Record-breaking warming and extreme drought in the Amazon rainforest during the course of El Niño 2015–2016, Sci. Rep., 6, 1–7, https://doi.org/10.1038/srep33130, 2016.
Khalkheili, T. A. and Zamani, G. H.: Farmer participation in irrigation management: The case of Doroodzan Dam Irrigation Network, Iran, Agr. Water Manage., 96, 859–865, https://doi.org/10.1016/j.agwat.2008.11.008, 2009.
Kondolf, G. M., Gao, Y., Annandale, G. W., Morris, G. L., Jiang, E., Zhang, J., Cao, Y., Carling, P., Fu, K., Guo, Q., Hotchkiss, R., Peteuil, C., Sumi, T., Wang, H.-W., Wang, Z., Wei, Z., Wu, B., Wu, C., and Yang, C. T.: Sustainable sediment management in reservoirs and regulated rivers: Experiences from five continents, Earth's Future, 2, 256–280, https://doi.org/10.1002/2013ef000184, 2014.
Ladd, C. C.: Stability evaluation during staged construction, J. Geotech. Eng., 118, 1288–1289, https://doi.org/10.1061/(ASCE)0733-9410(1992)118:8(1288.2), 1992.
Latrubesse, E. M., Arima, E. Y., Dunne, T., Park, E., Baker, V. R., D'Horta, F. M., Wight, C., Wittmann, F., Zuanon, J., Baker, P. A., Ribas, C. C., Norgaard, R. B., Filizola, N., Ansar, A., Flyvbjerg, B., and Stevaux, J. C.: Damming the rivers of the Amazon basin, Nature, 546, 363–369, https://doi.org/10.1038/nature22333, 2017.
Lees, A. C., Peres, C. A., Fearnside, P. M., Schneider, M., and Zuanon, J. A. S.: Hydropower and the future of Amazonian biodiversity, Biodivers. Conserv., 25, 451–466, https://doi.org/10.1007/s10531-016-1072-3, 2016.
Lehner, B., Verdin, K., and Jarvis, A.: New global hydrography derived from spaceborne elevation data, Eos Trans. Am. Geophys. Union, 89, 93–94, https://doi.org/10.1029/2008EO100001, 2008.
Lehner, B., Liermann, C. R., Revenga, C., Vörösmarty, C., Fekete, B., Crouzet, P., Döll, P., Endejan, M., Frenken, K., Magome, J., Nilsson, C., Robertson, J. C., Rödel, R., Sindorf, N., and Wisser, D.: High-resolution mapping of the world's reservoirs and dams for sustainable river-flow management, Front. Ecol. Environ., 9, 494–502, https://doi.org/10.1890/100125, 2011.
Li, H. N., Li, D. S., and Song, G. B.: Recent applications of fiber optic sensors to health monitoring in civil engineering, Eng. Struct., 26, 1647–1657, https://doi.org/10.1016/j.engstruct.2004.05.018, 2004.
Liermann, C. R., Nilsson, C., Robertson, J., and Ng, R. Y.: Implications of Dam Obstruction for Global Freshwater Fish Diversity, Bioscience, 62, 539–548, https://doi.org/10.1525/bio.2012.62.6.5, 2012.
Lv, M., Lu, H., Yang, K., Xu, Z., Lv, M., and Huang, X.: Assessment of runoff components simulated by GLDAS against UNH-GRDC dataset at global and hemispheric scales, Water, 10, 969, https://doi.org/10.3390/w10080969, 2018.
Mcdonald, R. I., Douglas, I., Revenga, C., Hale, R., Fekete, B., Grimm, N., and Gro, J.: Global Urban Growth and the Geography of Water Availability, Quality, and Delivery, Ambio, 40, 437–446, https://doi.org/10.1007/s13280-011-0152-6, 2011.
Mcguire, K. J., Mcdonnell, J. J., Weiler, M., Kendall, C., Mcglynn, B. L., Welker, J. M., and Seibert, J.: The role of topography on catchment-scale water residence time, Water Resour. Res., 41, 1–14, https://doi.org/10.1029/2004WR003657, 2005.
Moran, E. F., Lopez, M. C., Moore, N., Müller, N., and Hyndman, D. W.: Sustainable hydropower in the 21st century, P. Natl. Acad. Sci. USA, 115, 11891–11898, https://doi.org/10.1073/pnas.1809426115, 2018.
Nathan, M. and Steven, H.: The Pacific Decadal Oscillation, J. Oceanogr., 58, 35–44, 2002.
Nilsson, C., Reidy, C. A., Dynesius, M., and Revenga, C.: Fragmentation and flow regulation of the world's large river systems, Science, 308, 405–408, https://doi.org/10.1126/science.1107887, 2005.
Noorzaei, J., Bayagoob, K. H., Thanoon, W. A., and Jaafar, M. S.: Thermal and stress analysis of Kinta RCC dam, Eng. Struct., 28, 1795–1802, https://doi.org/10.1016/j.engstruct.2006.03.027, 2006.
Paredes-Beltran, B. E., Sordo-Ward, A., and Garrote, L.: Dataset of Georeferenced Dams in South America (DDSA), Zenodo Open Respository, https://doi.org/10.5281/zenodo.4315647, 2020.
Pekel, J. F., Cottam, A., Gorelick, N., and Belward, A. S.: High-resolution mapping of global surface water and its long-term changes, Nature, 540, 418–422, https://doi.org/10.1038/nature20584, 2016.
Pour, S. H., Khairi, A., Wahab, A., and Shahid, S.: Spatiotemporal changes in aridity and the shift of drylands in Iran, Atmos. Res., 233, 104704, https://doi.org/10.1016/j.atmosres.2019.104704, 2020.
PROAGRO – Programa de Desarrollo Agropecuario Sustentable: Inventario Nacional de Presas, Viceministerio de Recursos Hídricos y Riego (VRHR), available at: https://www.bivica.org/file/view/id/2334 (last access: 11 November 2020), 2010.
Reis, R. E., Albert, J. S., Di Dario, F., Mincarone, M. M., Petry, P., and Rocha, L. A.: Fish biodiversity and conservation in South America, J. Fish Biol., 89, 12–47, https://doi.org/10.1111/jfb.13016, 2016.
Roberto, M., Santana, N., and Thomaz, S.: Limnology in the Upper Paraná River floodplain: large-scale spatial and temporal patterns, and the influence of reservoirs, Brazil. J. Biol., 69, 717–725, https://doi.org/10.1590/s1519-69842009000300025, 2009.
Siebert, S., Döll, P., Hoogeveen, J., Faures, J. M., Frenken, K., and Feick, S.: Development and validation of the global map of irrigation areas, Hydrol. Earth Syst. Sci., 9, 535–547, https://doi.org/10.5194/hess-9-535-2005, 2005.
Sjödahl, P., Dahlin, T., Johansson, S., and Loke, M. H.: Resistivity monitoring for leakage and internal erosion detection at Hällby embankment dam, J. Appl. Geophys., 65, 155–164, https://doi.org/10.1016/j.jappgeo.2008.07.003, 2008.
Stoate, C., Báldi, A., Beja, P., Boatman, N. D., Herzon, I., van Doorn, A., de Snoo, G. R., Rakosy, L., and Ramwell, C.: Ecological impacts of early 21st century agricultural change in Europe – A review, J. Environ. Manage., 91, 22–46, https://doi.org/10.1016/j.jenvman.2009.07.005, 2009.
Subsecretaría de Recursos Hídricos: Inventario de Presas y Centrales Hidroeléctricas de la República Argentina, Ministerio de Planificación Federal Inversión Pública y Servicios, Buenos Aires, available at: http://datos.minem.gob.ar/dataset/inventario-de-presas (last access: 11 November 2020), 2010.
UNEP: World atlas of desertification, edited by: Middleton, N. and Thomas, D., Edward Arnold, London, 15–45, 1992.
Vörösmarty, C. J., Meybeck, M., Fekete, B., Green, P., Syvitski, J. P. M., and Sharma, K.: Anthropogenic sediment retention: major global impact from registered river impoundments, Global Planet. Change, 39, 169–190, https://doi.org/10.1016/S0921-8181(03)00023-7, 2003.
Vörösmarty, C. J., McIntyre, P. B., Gessner, M. O., Dudgeon, D., Prusevich, A., Green, P., Glidden, S., Bunn, S. E., Sullivan, C. A., Liermann, C. R., and Davies, P. M.: Global threats to human water security and river biodiversity, Nature, 467, 555–561, https://doi.org/10.1038/nature09440, 2010.
Winemiller, K. O., Nam, S., Baird, I. G., Darwall, W., Lujan, N. K., Harrison, I., Stiassny, M. L. J., Silvano, R. A. M., Fitzgerald, D. B., Pelicice, F. M., Agostinho, A. A., Gomes, L. C., Albert, J. S., Baran Jr., E. M. P., Zarfl, C., Mulligan, M., Sullivan, J. P., Arantes, C. C., Sousa, L. M., Koning, A. A., Hoeinghaus, D. J., Sabaj, M., Lundberg, J. G., Armbruster, J., Thieme, M. L., Petry, P., Zuanon, J., Vilara, G. T., Snoeks, J., Ou, C., Rainboth, W., Pavanelli, C. S., Akama, A., Van Soesbergen, A., and Sáenz, L.: Balancing hydropower and biodiversity in the Amazon, Congo, and Mekong, Science, 351, 128–129, 2016.
Wisser, D., Frolking, S., and Douglas, E. M.: Global irrigation water demand: Variability and uncertainties arising from agricultural and climate data sets, Geophys. Res. Lett., 35. L24408, https://doi.org/10.1029/2008GL035296, 2008.
Xu, B., Zou, D., and Liu, H.: Three-dimensional simulation of the construction process of the Zipingpu concrete face rockfill dam based on a generalized plasticity model, Comput. Geotech., 43, 143–154, https://doi.org/10.1016/j.compgeo.2012.03.002, 2012.
Zabala, F. and Alonso, E. E.: Progressive failure of aznalcó llar dam using the material point method, Geotechnique, 61, 795–808, https://doi.org/10.1680/geot.9.P.134, 2011.
Zhang, X., Li, H. Y., Deng, Z. D., Ringler, C., Gao, Y., Hejazi, M. I., and Leung, L. R.: Impacts of climate change, policy and Water-Energy-Food nexus on hydropower development, Renew. Energy, 116, 827–834, https://doi.org/10.1016/j.renene.2017.10.030, 2018.