the Creative Commons Attribution 4.0 License.
the Creative Commons Attribution 4.0 License.
 | 11 May 2021
Historical K index data collection of Soviet magnetic observatories, 1957–1992
Natalia Sergeyeva
Alexei Gvishiani
Anatoly Soloviev
Lyudmila Zabarinskaya
Tamara Krylova
Mikhail Nisilevich
The K index is one of the oldest universal indices of geomagnetic activity, introduced in 1938 by Julius Bartels, that is still being widely used. Up to the present day, long-term time series of homogeneous K index records have been accumulated at data repositories all over the world. The multidecadal practice of its application makes it an indispensable source of information for the retrospective analysis of solar–terrestrial interaction for nearly eight solar cycles. Most significantly, while studying the historical geomagnetic data, K index data sheets are in certain cases far easier for automated analysis than the conventional analogue magnetograms. The presented collection includes the results of the K index determination at 41 geomagnetic observatories of the former USSR for the period from July 1957 to the early 1990s. This unique collection was formed at the World Data Center for Solar-Terrestrial Physics in Moscow. The historical data, which are offered to the international scientific community, cover the second half of the 20th century and can be used for the retrospective analysis and study of geomagnetic events in the past, as well as for data validation or forecasting (Sergeyeva et al., 2020). The dataset is available at: https://doi.org/10.1594/PANGAEA.922233, last access: 16 September 2020.
- Article
(4632 KB) - Full-text XML
- BibTeX
- EndNote


Preserving and providing access to historical observational data is an important and relevant problem in the Earth sciences. The World Data Center for Solar-Terrestrial Physics at the Geophysical Center of the Russian Academy of Sciences (GC RAS) consistently works on the organization of online open access to historical geomagnetic data stored in its archive. This paper presents the collection of the geomagnetic activity parameter – K index – obtained within the network of magnetic observatories and stations of the former USSR.
The most valuable part in this collection is the data of 1957–1959 related to the observation program of the International Geophysical Year (IGY), which was organized from July 1957 to December 1958, and the International Geophysical Cooperation of 1959 – the direct continuation of the IGY (Lyubovtseva et al., 2020; Nicolet, 1984).
To collect, archive, and disseminate the data of all types of observations obtained within the IGY program, the universal World Data Centers (WDCs) were established in the USA (WDC A) and the USSR (WDC B, consisting of two centers, B1 and B2) which received materials from the stations all over the world. The results of geomagnetic observations, studies of the ionosphere, solar observations, and data on cosmic rays and auroras were collected at WDC B2. It was established in 1956 at the Research Institute of Terrestrial Magnetism, Ionosphere and Radio Wave Propagation of the USSR Ministry of Communications (NIZMIR), which in 1959 was reassigned to the USSR Academy of Sciences (AS USSR) and renamed as the Institute of Terrestrial Magnetism, Ionosphere and Radio Wave Propagation of the AS USSR, widely known as IZMIRAN. Later, in 1971 WDC B2 was reassigned to the Interdepartmental Geophysical Committee of the AS USSR (currently GC RAS) and designated as the World Data Center for Solar-Terrestrial Physics (WDC for STP). Currently WDC for STP is the part of the World Data System (WDS) (Raspopov et al., 2007; Rodnikov et al., 2009).
In the Soviet Union, more than 30 observatories were involved in geomagnetic research within the IGY program. The WDC for STP preserves photocopies and digital images of magnetograms, hourly mean and minute values of the Earth's magnetic field vector components, values of indices of geomagnetic activity, data on magnetic storms, and other information obtained at these observatories.
It is difficult to overestimate the importance of data from high-latitude observatories established in the Arctic at various times. Among others worth mentioning are the following: Tikhaya Bay on Franz Josef Land (established in 1929 during the development of the Northern Sea Route); Dikson, Cape Wellen (Uelen), and Cape Chelyuskin (established in 1931–1933 within the Second International Polar Year program); and Heiss Island and Tixie Bay (established in 1957 within the IGY program). Magnetic observations were performed at Antarctic stations Mirny, Pionerskaya, Oasis, and Vostok that were established during the First and Second Soviet Complex Antarctic Expeditions in 1956–1957. During the same period, magnetic observations were made at the “North Pole” (transcribed from Cyrillic to Latin “Severnyj Polyus”) drifting stations NP-6, NP-7, and NP-8. These data were used for the daily calculation of the C index (Lyubovtseva et al., 2020).
At that time, the Soviet geomagnetic observatories were equipped mainly with foreign-manufactured instruments for the registration of geomagnetic variations. For example, in 1957–1959 the observatories in Irkutsk, Kiev, Lviv, Tbilisi, Tashkent, Yakutsk, Vladivostok, and Mirny were equipped with the Eschenhagen variation stations and La Cour variometers. The Edelman magnetometers and Lloyd scales were installed at the Kazan, Sverdlovsk, and Odessa observatories. The Tepfer variometers were installed at the Leningrad and Vladivostok observatories. The Schultz variometer was used at the Yuzhno-Sakhalinsk observatory. The Schmidt scales were used at the Srednikan observatory. Some observatories used domestically manufactured instruments: the Yanovsky variometer in Srednikan and the Brunelli magnetovariational station in Ashgabat. The polar observatories in the Arctic and Antarctic (including the North Pole drifting stations) were equipped with Soviet-manufactured Brunelli magnetovariational stations and La Cour variometers. The accuracy of these instruments was low due to the influence of temperature, humidity, and other factors (Belov et al., 2006).
In the mid-1960s the re-equipment of observatories (starting with Moscow, Odessa, and Tbilisi observatories in 1964) with the new Bobrov quartz variometers began (Bobrov, 1961; Belov et al., 2006). Automatic quartz magnetovariational stations were developed in IZMIRAN for polar geomagnetic stations that conducted research in severe climatic conditions in the Arctic and Antarctic (Burtsev et al., 1977). By the mid-1980s, the network of geomagnetic observatories in the USSR was equipped with digital quartz magnetovariational stations (Belov et al., 2006).
New geomagnetic observatories that were deployed in the USSR in the 1960s–1970s participated in major international projects: the International Year of the Quiet Sun (1964–1965), the International Year of the Active Sun (1969–1971), and the International Magnetospheric Study (1976–1979). The observatories continued transferring data to the WDC system (Raspopov et al., 2007).
With the collapse of the USSR in December 1991 the operation of a number of observatories was terminated. Some of them continued to transmit data to the WDC for STP until 1992.
To quantify geomagnetic disturbances caused by the interaction of solar corpuscular radiation with the magnetosphere, processes in the magnetosphere itself, the interaction of the magnetosphere and the ionosphere, and processes in the ionosphere itself, the geomagnetic community widely uses geomagnetic activity indices (Lincoln, 1967). The majority of the indices are derived from the measurements carried out at magnetic stations and observatories (Mayaud, 1980) (Fig. 1). The International Service of Geomagnetic Indices (http://isgi.unistra.fr/, last access: 30 September 2020) handles and disseminates indices that are officially accepted by the International Association of Geomagnetism and Aeronomy (IAGA). They are divided into regional, planetary, and source-driven indices and express responses from various magnetospheric–ionospheric current systems. The first and the simplest C index was introduced in 1906 to estimate magnetic field activity over a day on a three-point scale (0, 1, and 2). Since that time, the index evolved into the K index (Bartels, 1938), which is still widely used today (Gvishiani and Soloviev, 2020).
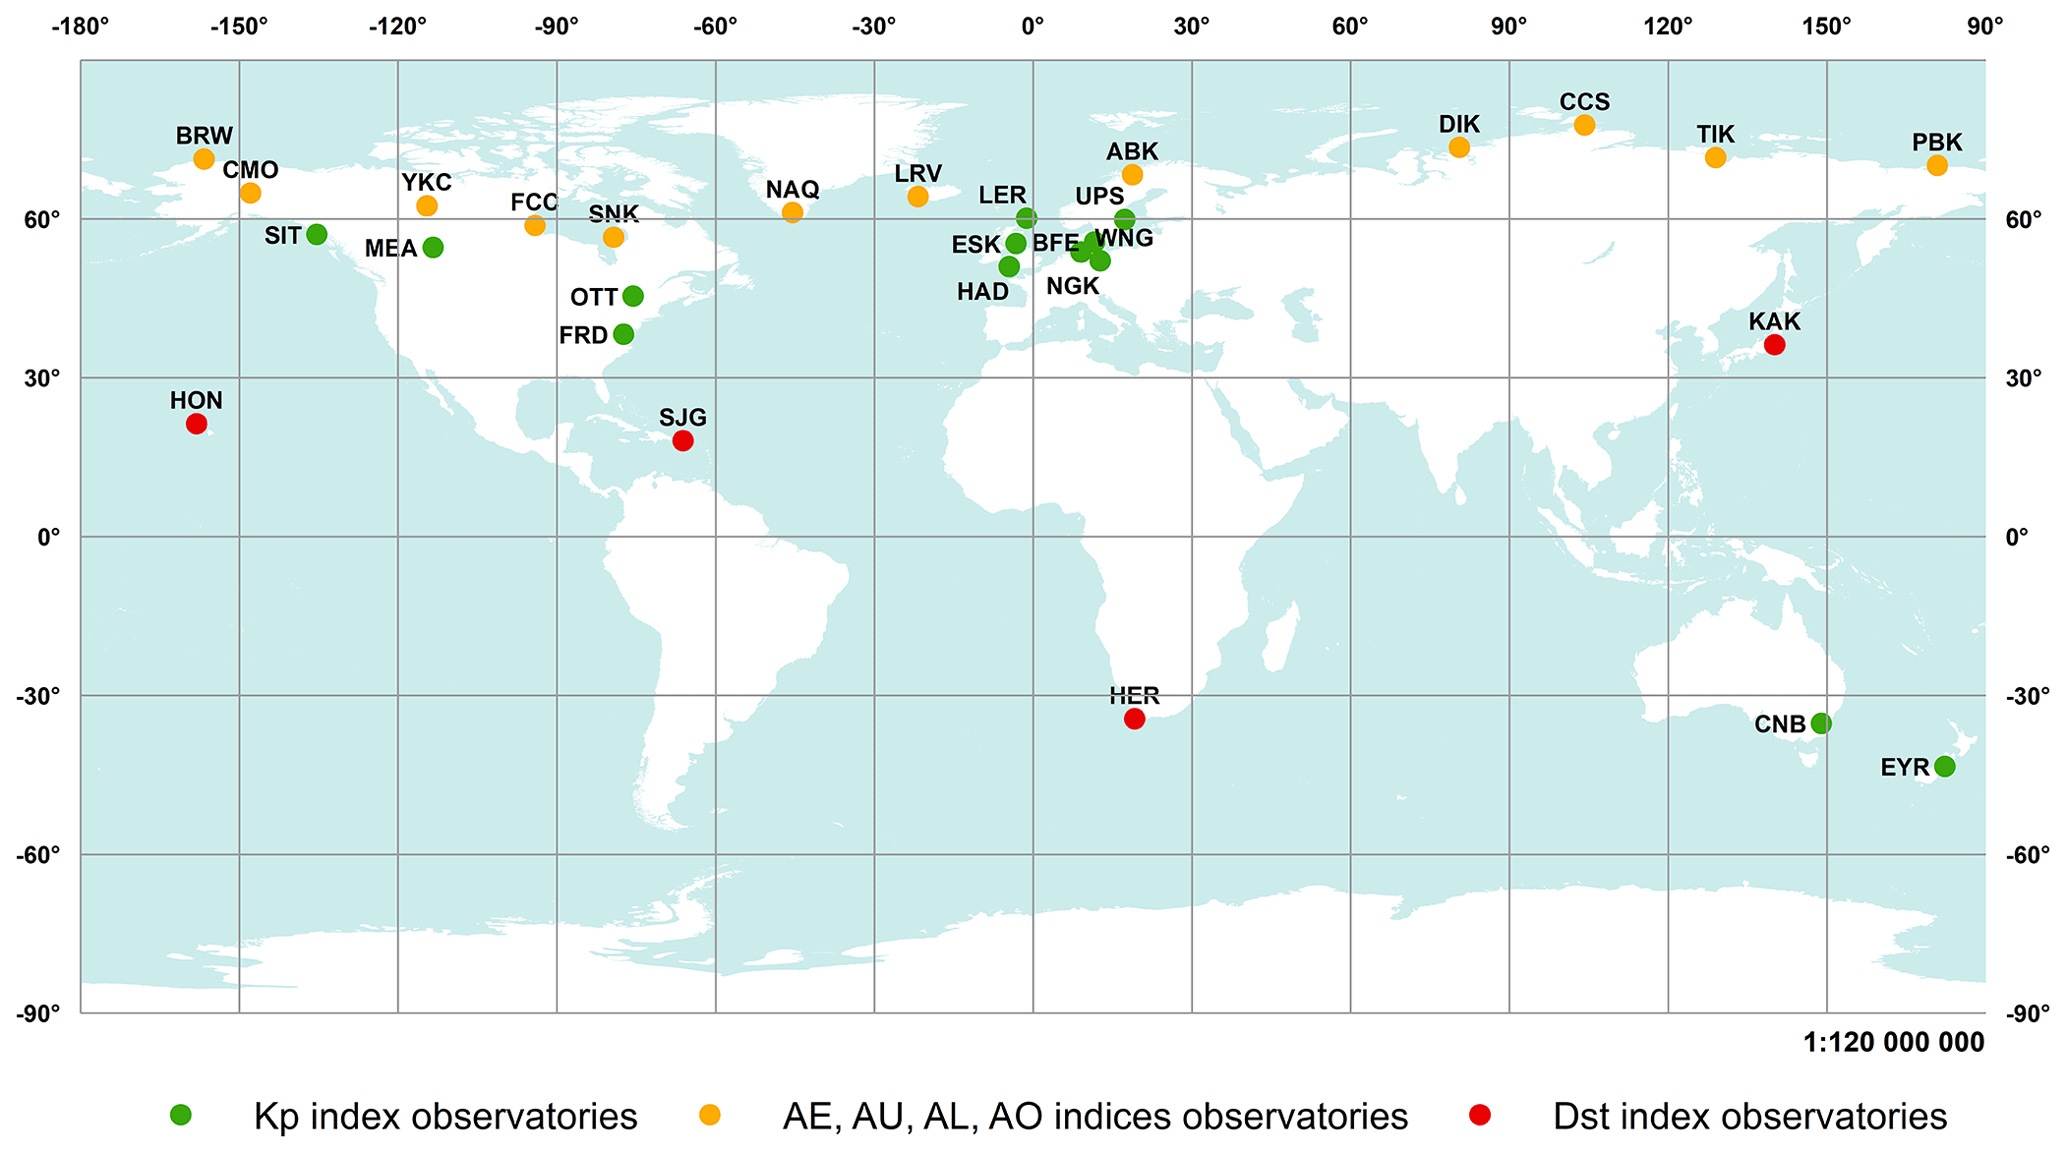
Figure 1The map shows the observatories used for calculating the geomagnetic indices: Kp (green circles), AE, AU, AL, and AO (orange circles), and Dst (red circles).
During the period from 1957 to 1971, all observatories and drifting stations NP-6, NP-7 and NP-8 determined C index and transferred it to the WDCs. Since July 1957, data on geomagnetic K and C indices were transferred to WDC B2 by 22 observatories, and since January 1958 – by 26 observatories.
Among them there are the oldest observatories, established in the Russian Empire in the 19th century – Kazan, St. Petersburg (Leningrad – Voyeykovo), Yekaterinburg (Sverdlovsk), Tiflis (Tbilisi), and Irkutsk – and observatories established in the Soviet Union in the 20th century before the IGY (in 1930s–1940s) – Yakutsk, Vladivostok, Kiev, Odessa, Lviv, Moscow, Tashkent, Srednikan, Tomsk, and Yuzhno-Sakhalinsk.
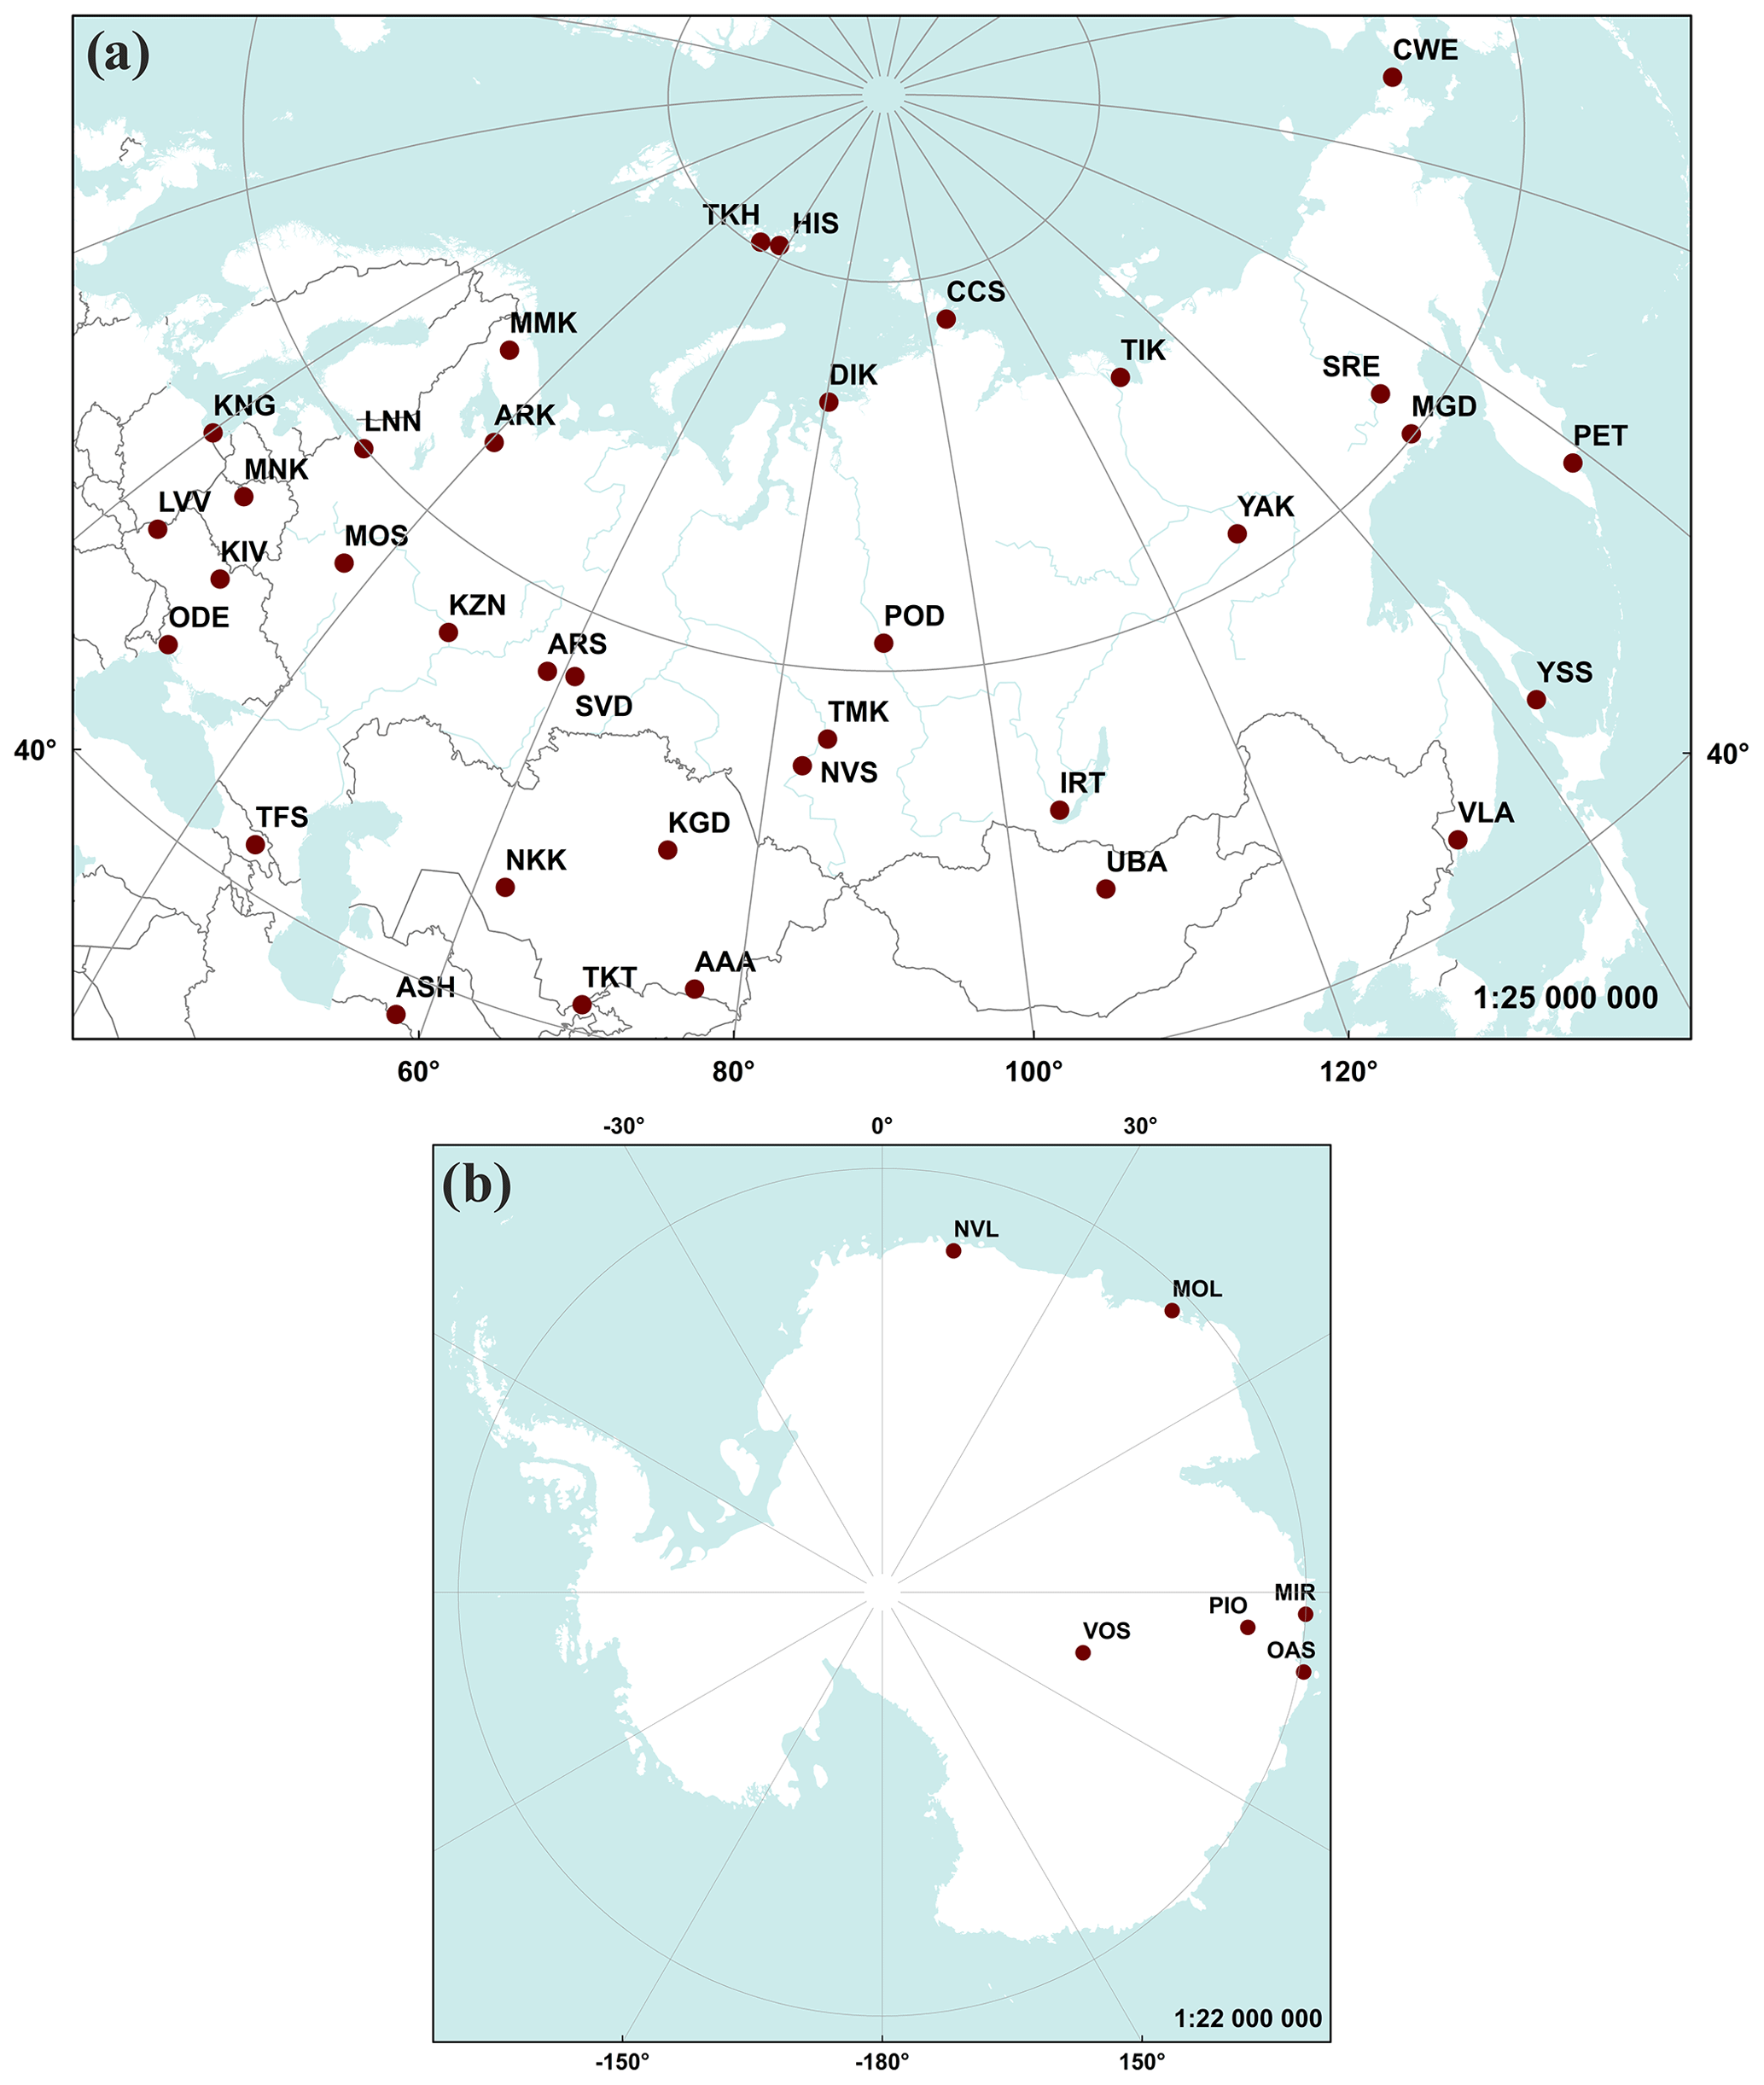
Figure 2Location of Soviet geomagnetic observatories that provided data for the presented collection: (a) continental territory of the USSR; (b) the Antarctic.
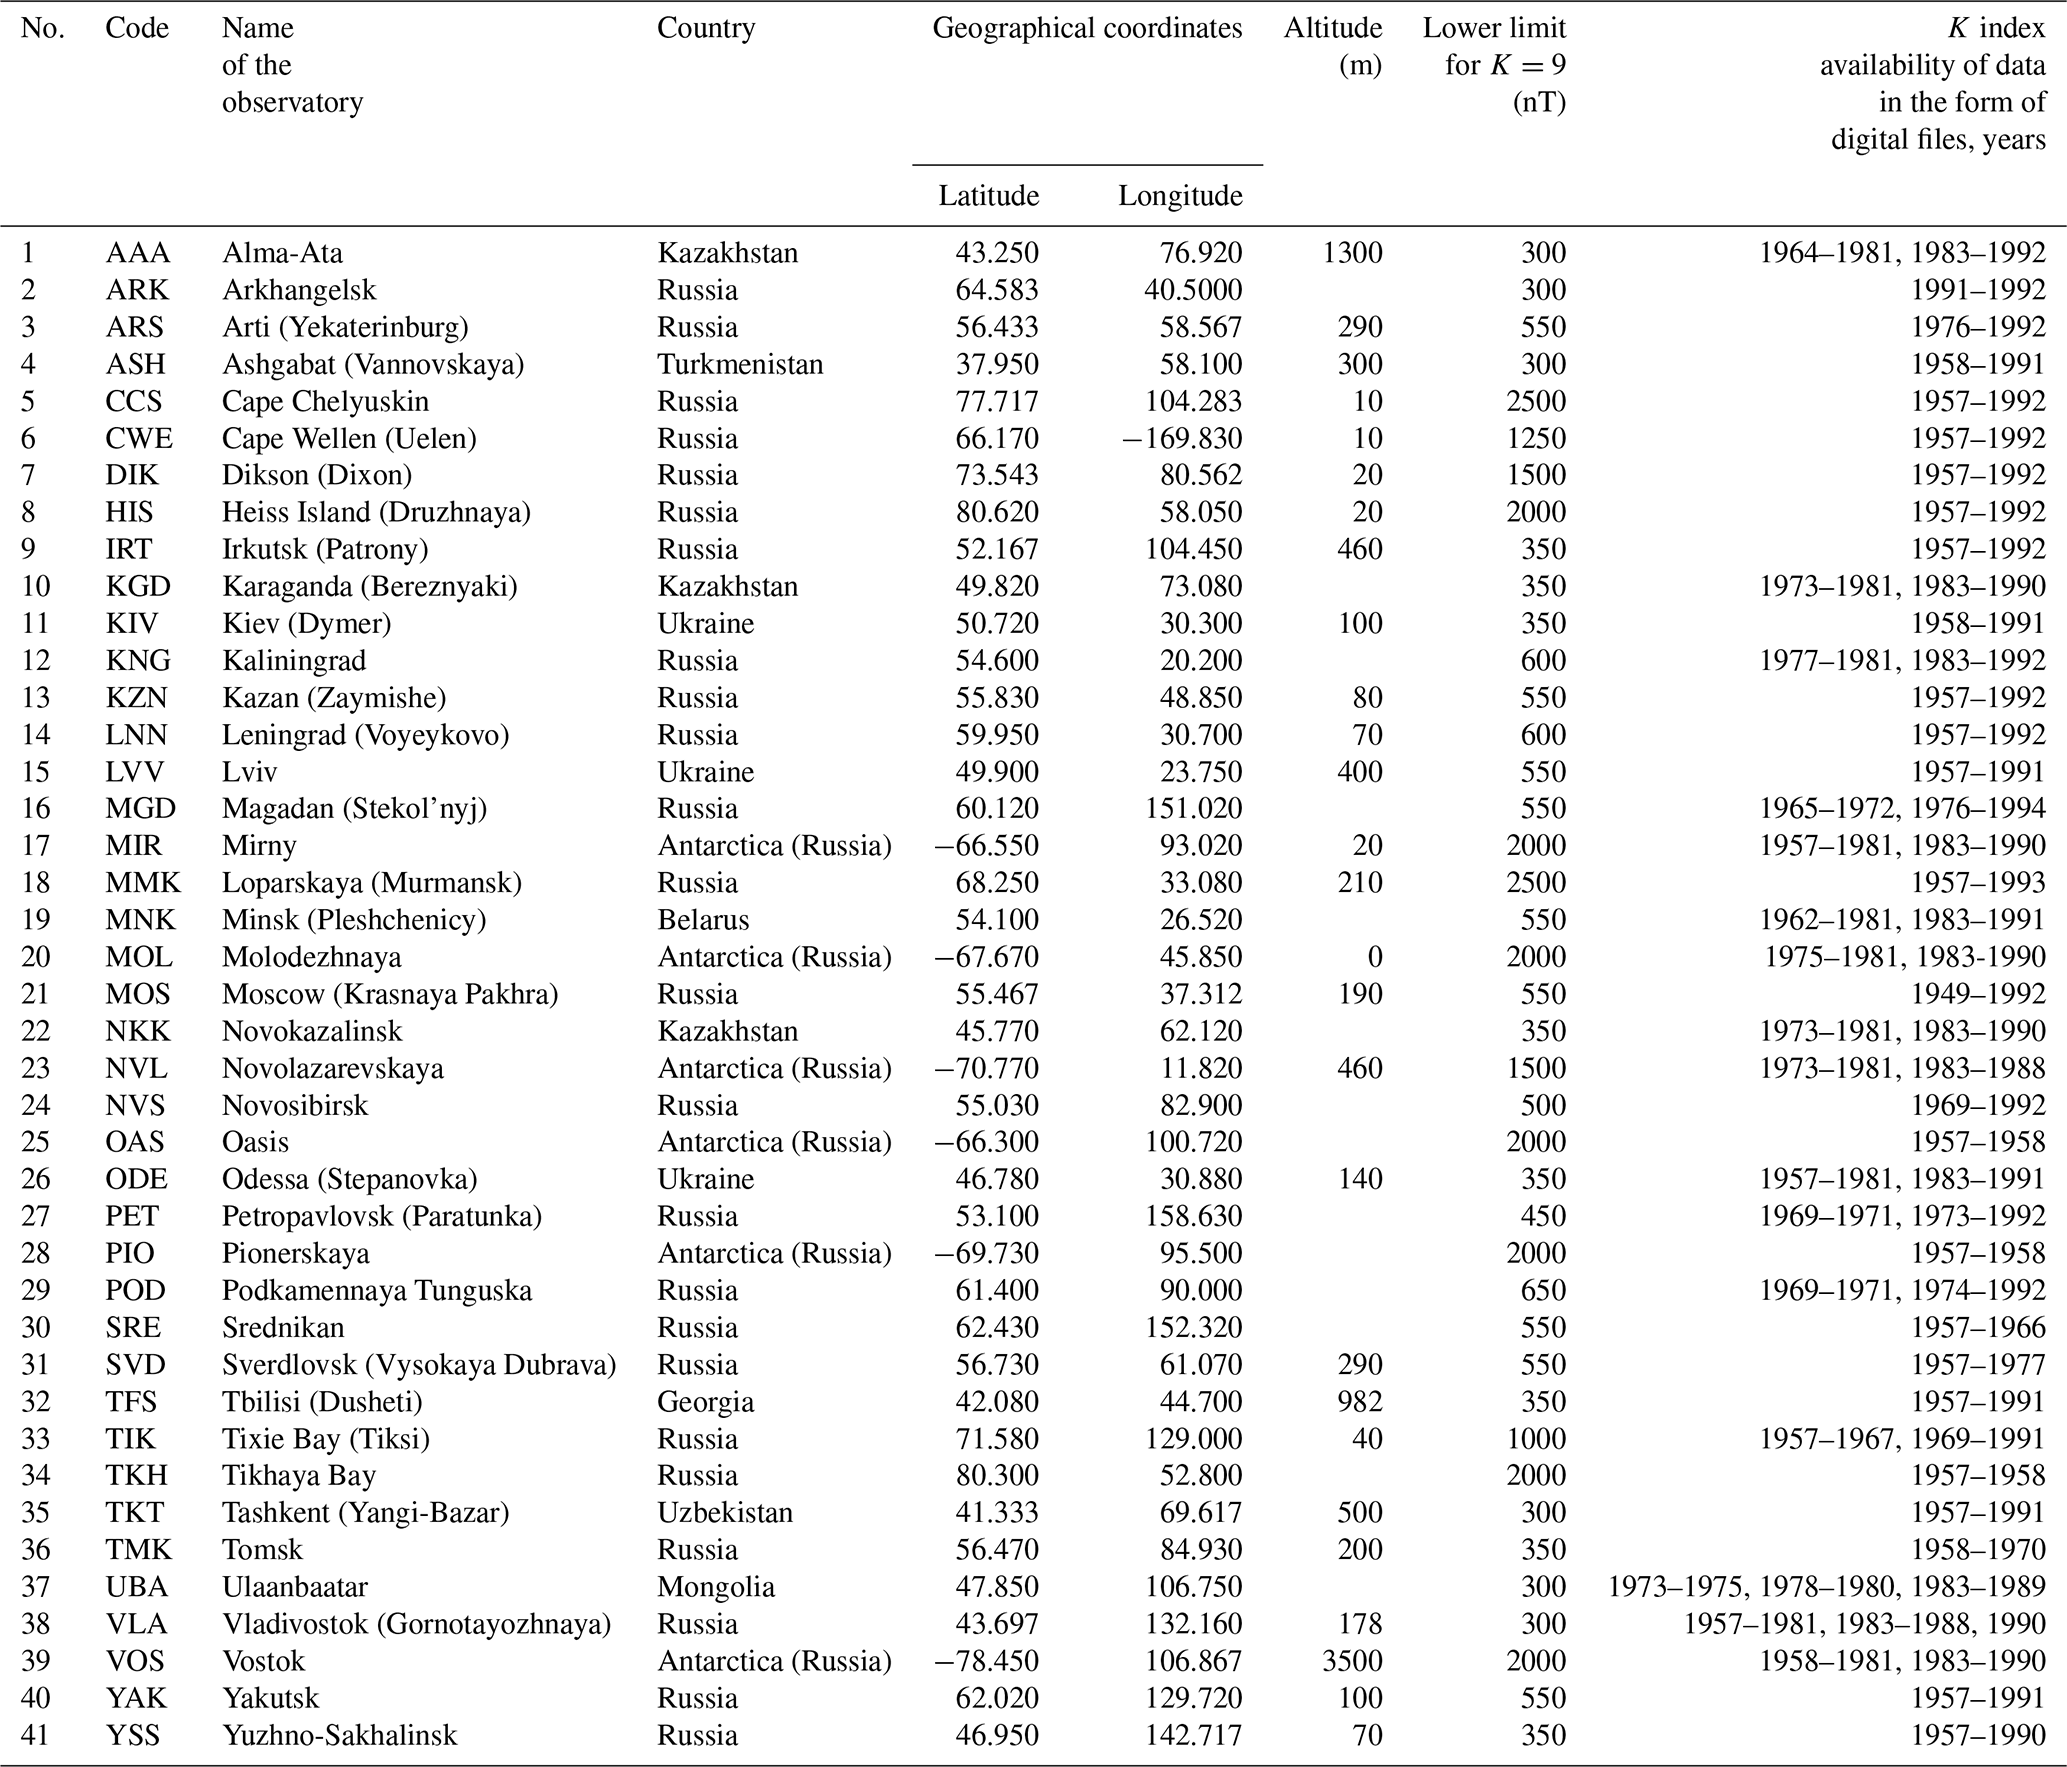
The collection of K index values, stored in the WDC for STP repository, contains data from 41 observatories located on the territory of the former USSR and the Antarctic (Table 1, Fig. 2). The collection is unique and representative because it includes data obtained over a large area covering high, medium, and low latitudes and consists of a long series of K index values.
Table 1Geomagnetic observatories of the former USSR. K index data availability.
Comprehensive studies of the Earth's magnetic field require more frequently defined geomagnetic activity measurements devoid of any subjectivity. Therefore, in 1939 the International Association of Terrestrial Magnetism and Electricity (now International Association of Geomagnetism and Aeronomy – IAGA) introduced a 3 h index K with a 10-point scale into the practice of magnetic observatories that was also proposed by Julius Bartels in 1938 (Bartels, 1938, 1939; Bartels et al., 1939). The designation Kderives from the German word Kennziffer (Bartels, 1938), which literally means a “characteristic parameter” or “identification number”. The K index was designed as a measure of the range of irregular and rapid geomagnetic activity, including geomagnetic storms. It implies that it is insensitive to the long-term components of magnetic variations (Love and Remick, 2007). It is a numerical characteristic of the variability in geomagnetic activity at a given observatory over 3 h intervals. In this particular case the variability is understood as the amplitude of the observed horizontal field minus the quiet daily variation Sq. The data source for the K index calculation is magnetograms. Initially, when only analogue magnetograms were available (Fig. 3), magnetologists determined the amplitudes of geomagnetic disturbances and, consequently, the K index values manually.

Figure 3Photocopies of analogue magnetograms: (a) Petropavlovsk (Paratunka) observatory, 16–17 August 1970, Bobrov variometer; (b) Irkutsk (Patrony), 14 July 1960, Yanovsky variometer (http://www.wdcb.ru/stp/geomag/magnetogr_list.en.html, last access: 1 September 2020).
At Soviet observatories, indices were calculated once per 10 d or month based on the results of the analog magnetograms' processing, following the procedure described in Bartels et al. (1939). According to the procedure, for the K index calculation it is necessary to determine and remove the regular Sq part of the record. Quiet daily variation Sq was determined based on five daily magnetograms with clear and distinguishable characteristics of quiet days. Then amplitudes of variations in geomagnetic vector horizontal components (H and D) for each 3 h interval were defined. The regular part of the quiet daily variation Sq was subtracted (Fig. 4). To facilitate this procedure, special transparent flexible gauges (transparent pallets on celluloid or other similar materials) were used. In each observatory, they were drawn using the quiet daily variation line and the observatory K scale from Table 2 (Nechaev, 2006; Zabolotnaya, 2007). Considering that the amplitude of the geomagnetic disturbance depends on the latitude of the observation site (the maximum amplitude is observed in the aurora zone), the value of the K scale division is selected for each observatory. The largest value of the two amplitudes obtained for each of the 3 h intervals using the observatory K scale was converted to the K index value and adopted as the final one. Only the horizontal H and D components are used to determine the K index. Component Z for observatories located 1000 or 2000 km from the auroral zone is extremely sensitive to the auroral electrojet, and more than H and D it is sensitive to local effects of induced underground currents (Mayaud, 1967).
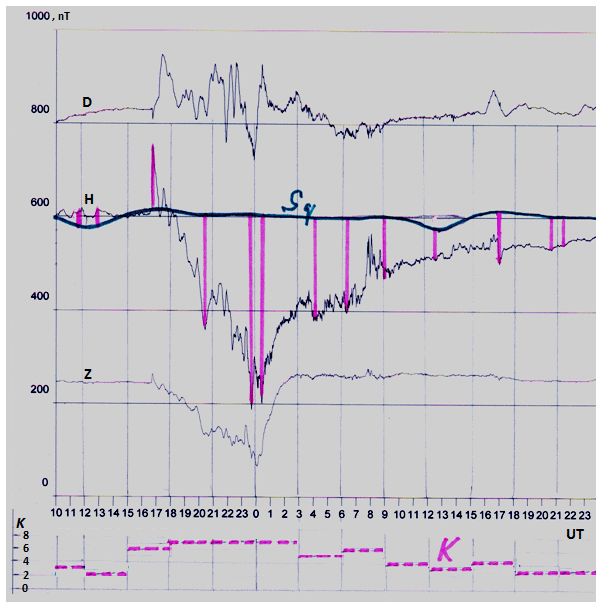
Figure 4A schematic representation of the manual determination of geomagnetic variations' amplitudes for K index calculation. Purple vertical lines correspond to the maximum disturbances in the H component in 3 h intervals. Similarly, the maximum disturbance amplitudes for the D component are determined. Then the values of the quiet daily variation Sq in each 3 h interval are subtracted from the amplitudes. The largest value of the two amplitudes obtained for each of the 3 h intervals using the observatory K index scale is converted into the K index value and adopted as the final one.
Table 2Correspondence of geomagnetic disturbance amplitudes (in nT) to K index values depending on the geomagnetic latitude of the observatory.

The K index for a particular observatory takes values from 0 to 9 for each 3 h interval, starting from 00:00 UT, where 9 corresponds to the strongest geomagnetic disturbances. The value K=9 corresponds to a disturbance exceeding 2500 nT in the auroral zone and about 300 nT at low latitudes (excluding the Equator). For each observatory, a correspondence between the value K=9 and the disturbance amplitude was obtained by considering the extremely strong geomagnetic disturbance observed on 16 April 1938. It was agreed that on this day between 06:00 and 09:00 UT the K index at all observatories was equal to 9 points, and the maximum value of the disturbance amplitude over the considered interval was taken as the lower amplitude limit corresponding to K=9. This fact is described in articles (Bartels et al., 1939; Lincoln, 1967). For observatories established after 1938, the lower limit of the amplitude for K=9 is chosen in consultation with the working group on geomagnetic activity indices, IAGA (before 1954 IATME) (Lincoln, 1967). An event with K≤2 is quiet, K=2–3 is slightly disturbed, K=4 is disturbed, K=5–6 is a magnetic storm, and K≥7 is a large magnetic storm. This version of the classification is published on the Paratunka Observatory website http://www.ikir.ru/ru/Departments/Paratunka/lfg/txt/k-index-doc.html (last access: 18 February 2021). Another classification is given in the work of Menvielle et al. (2011): “The modern consensus is that K=0–2 correspond to periods of magnetic quietness; K=3–5 correspond to periods of moderate geomagnetic activity; K=6–9 correspond to periods of intense to very intense geomagnetic activity”.
With the advent of magnetic variometers with digital registration, data processing and the calculation of the K index were carried out using computers. It became necessary to develop algorithms for calculating K index in automatic mode. Computer programs for calculating K index developed in the 1980s differ mainly in the method for the determination of the quiet daily variation Sq (Menvielle et al, 1995). Two main approaches are used: averaging the magnetograms of the nearest quiet days (Takahashi et al., 2001; Nechaev, 2006; Dmitriev and Filippov, 2010) and by smoothing the current magnetogram (Hopgood, 1986; Jankowski et al., 1988; Golovkov et al., 1989; Sucksdorff et al., 1991).
The ex-Soviet observatories, such as Irkutsk (IRT) and Borok (BOX), use algorithms that are as close as possible to the method of Julius Bartels, which allows us to preserve the continuity of the observatory K index time series for previous years (Anisimov et al., 2015; Dmitriev and Filippov, 2010; Nechaev, 2006).
But the K index is a local indicator, describing geomagnetic disturbances in the vicinity of a particular observatory. In 1949 Julius Bartels suggested a new planetary Kp index for estimating the geomagnetic activity on the planetary scale over 3 h intervals (Bartels, 1949). The planetary Kp index is calculated as the average of the K indices from 13 selected observatories situated in the subauroral zones. The K index values are currently used for the derivation of the IAGA planetary geomagnetic indices Kp (ap), am (Km), an (Kn), as (Ks), and aa (Berthelier, 1993; Mayaud, 1980; Menvielle and Berthelier, 1991; Menvielle et al., 1995).
Determination of the K index is a standard procedure for magnetic observatory practice. The data obtained using the abovementioned procedure were prepared as monthly arrays in the form of standard data sheets. The tables for these data sheets were developed and adopted by the beginning of the IGY (Fig. 5a). The IAGA data sheet was introduced in June 1977 (Fig. 5b). In the 1980s, data sheets with additional information on magnetic storms, recommended by IZMIRAN, were used to represent data from Soviet observatories (Fig. 6). Data sheets with K index determinations were sent to the WDC B2 by mail and stored as paper documents. Later, in the 1990s, data exchange via e-mail started. Each data sheet indicated the value of the lower limit for K=9.
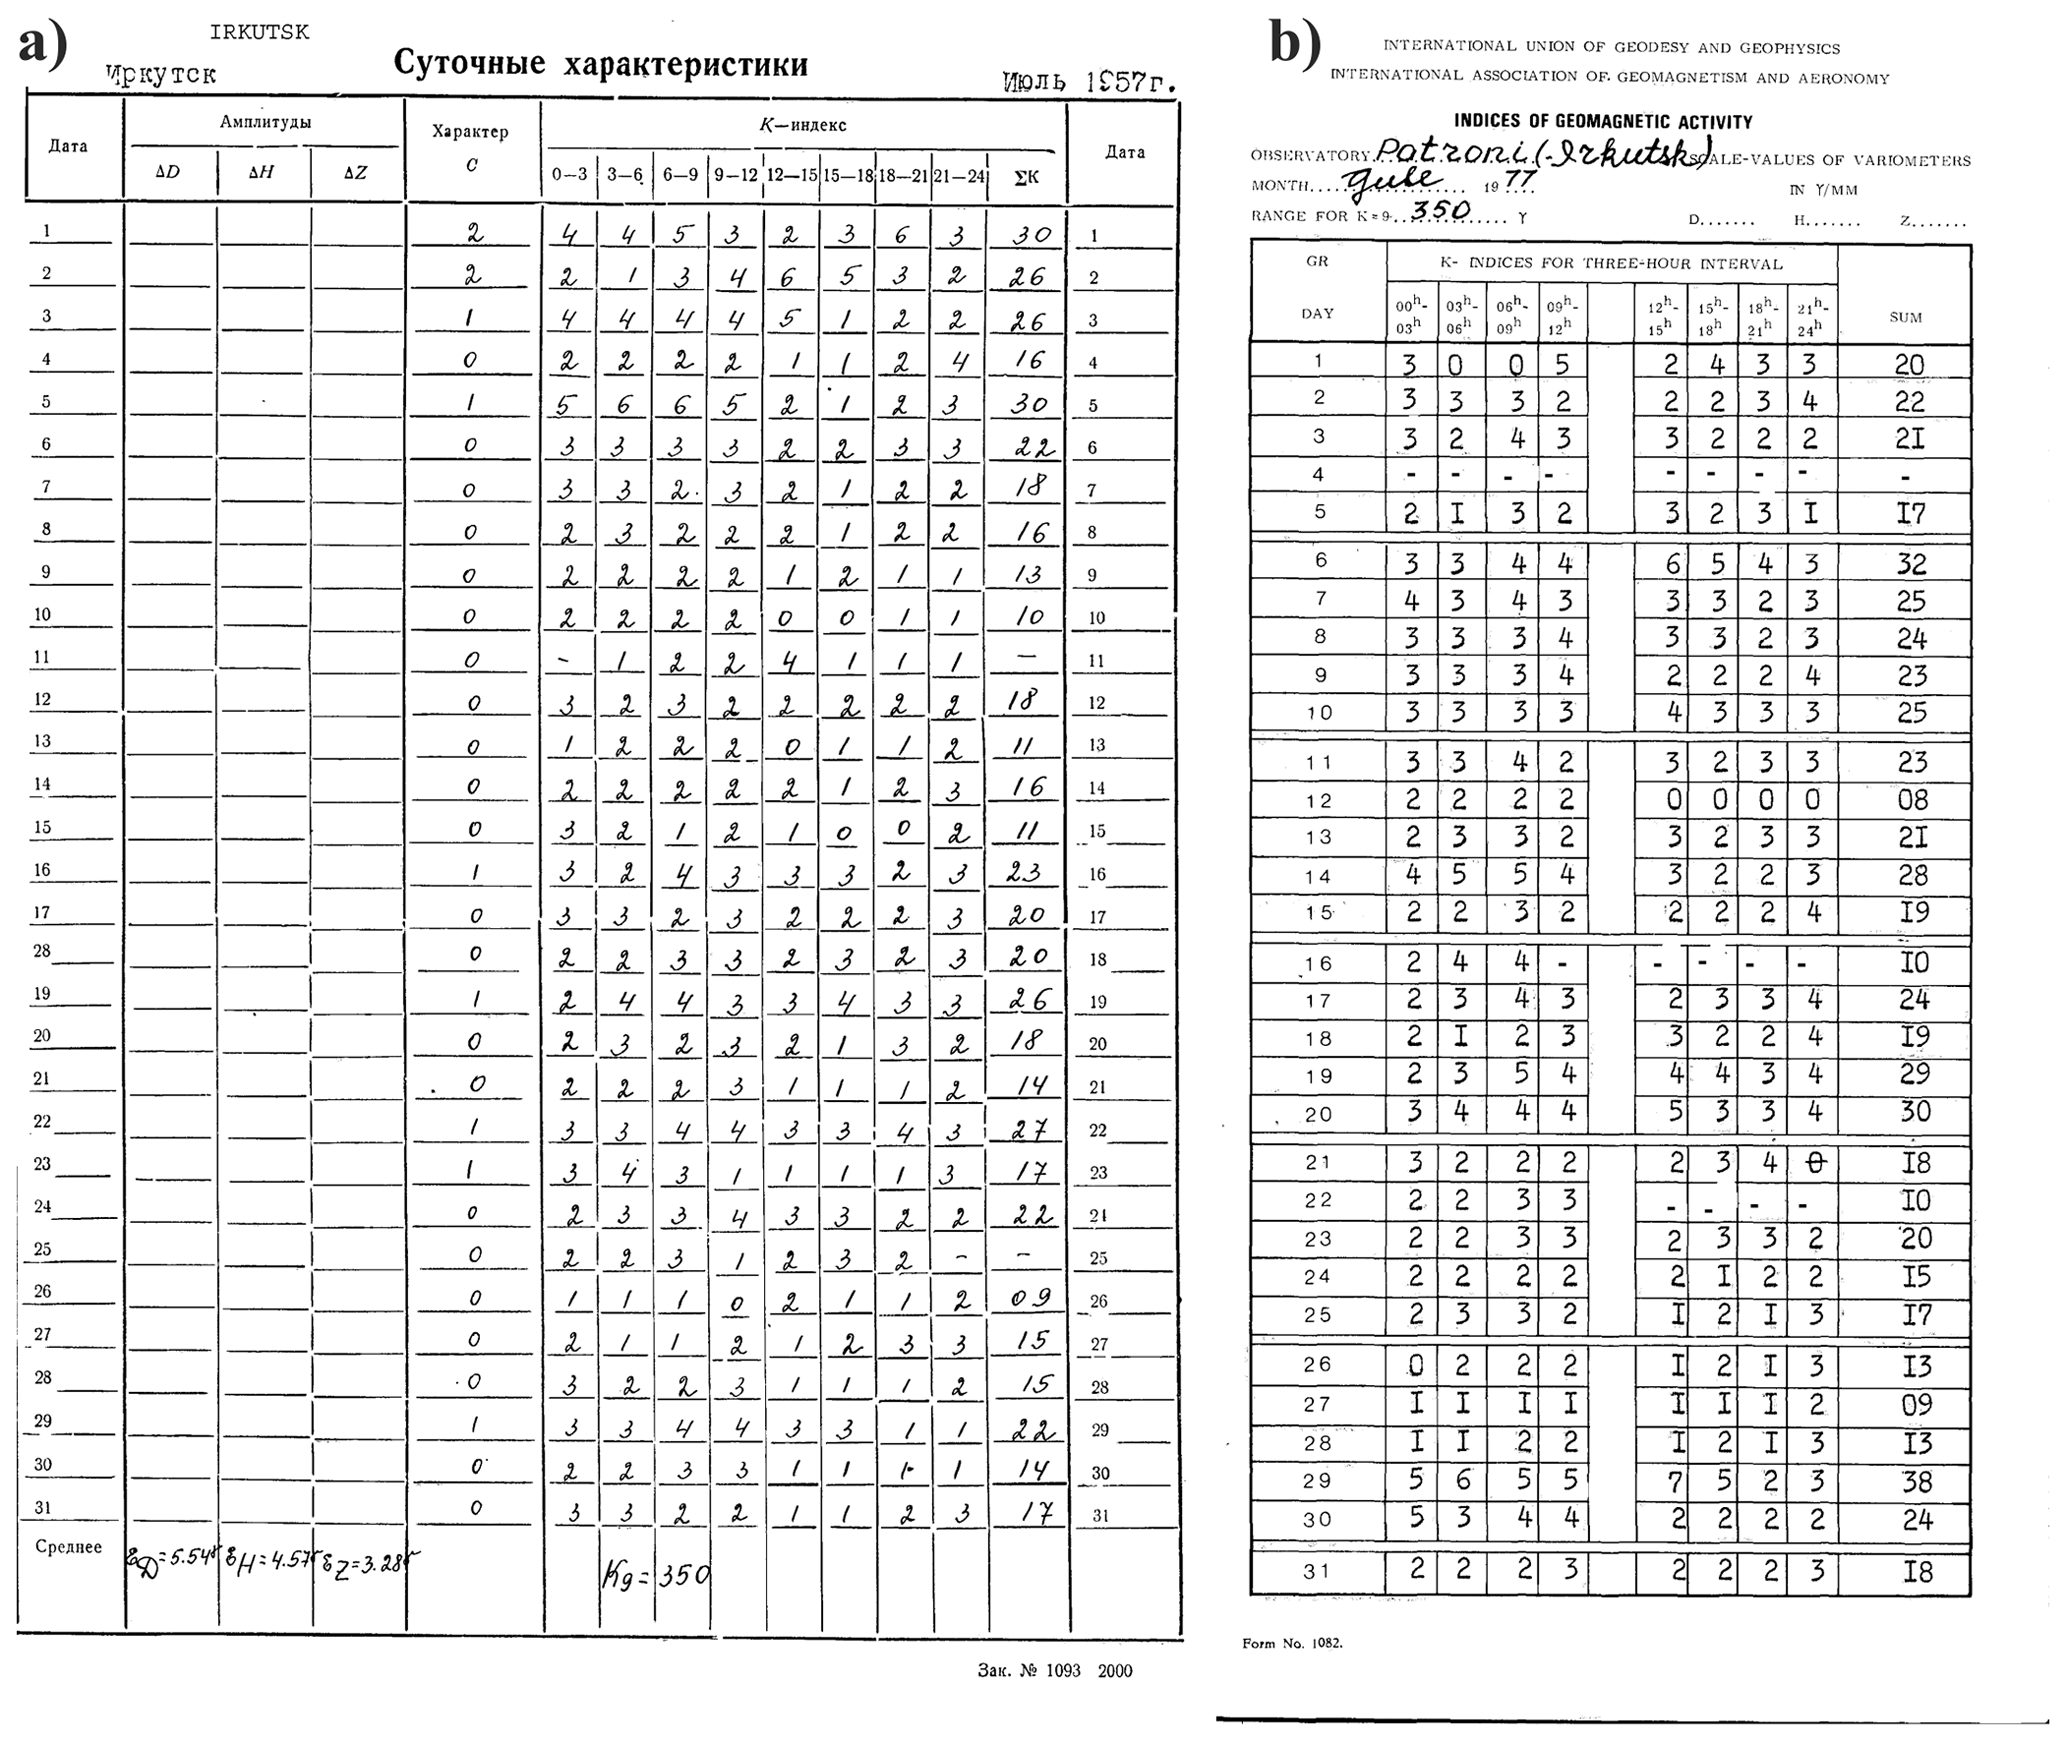
Figure 5Paper data sheets for K index values for observatory Irkutsk (Patrony): (a) data sheet form adopted for the IGY (July 1957); (b) data sheet form adopted by IAGA in 1977 (July 1977) (http://www.wdcb.ru/stp/data/K_indices/IRT_Irkutsk/, last access: 1 September 2020).
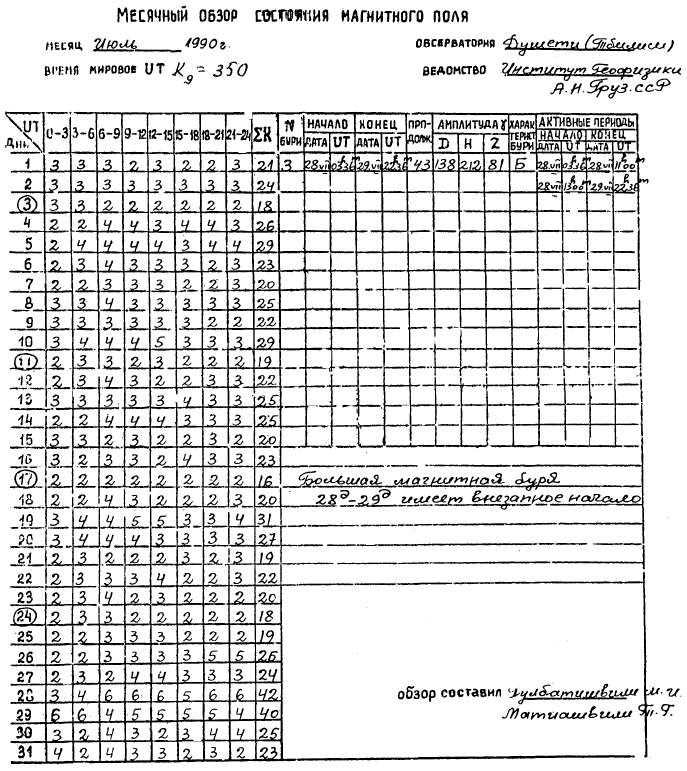
Figure 6Monthly K index values data sheet for observatory Tbilisi (TFS), Georgia (July 1990), compiled according to the form proposed by IZMIRAN (http://www.wdcb.ru/stp/data/K_indices/TFS_Tbilisi/TFS_1990_1-7+st.pdf, last access: 15 February 2021).
To guarantee the preservation of these data and provide convenient and continuous online access and more efficient use, the entire array of paper data sheets was converted into digital form. The conversion was performed by scanning paper documents and converting them into the PDF format. By means of ScanSoft PaperPort software, electronic documents were edited: image crop and alignment, and removal of stains and excessive inscriptions (elements of “noise”). Where it was possible, the text quality was manually improved. The following stage was the visual verification of the compliance of the digital version of documents with paper originals and necessary manual correction. The final structured data array in digital form (the array of digital documents) was published on the WDC for STP website with open access (http://www.wdcb.ru/stp/data/K_indices/, last access: 1 September 2020). Then the entire data set was converted into ASCII encoded text files. Most of the data represented as handwritten paper documents were digitized manually. A small part of data was digitized using formatted text recognition and structured data extraction software, particularly the technology implemented in ABBYY FineReader software. The data files were visually checked and validated by calculating the total values in table line and comparing them to tabular daily values in Microsoft Excel 2010 software suite. Finally, all data files were converted into the uniform standard format adopted in the WDC system (Fig. 7).
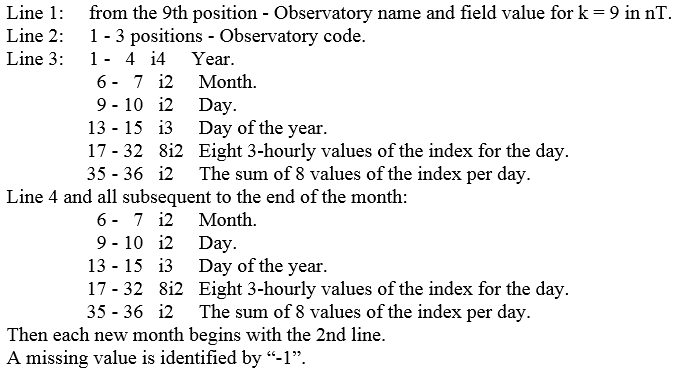
Figure 7Format description for K index data (http://www.wdcb.ru/stp/geomag/format_K_index.html, last access: 1 September 2020).
A detailed catalogue of data availability with monthly resolution was compiled. In total the collection includes 1054 annual files. The list of all observatories and stations that provided data for the presented collection is given in Table 1. It also shows the value of the K=9 lower amplitude limits for each of the observatories.
Data for 15 observatories (ASH, CCS, CWE, DIK, HIS, IRT, KIV, KZN, LNN, LVV, MMK, MOS, TKT, YAK, YSS) represent a single long time series of observations over 34–36 years without interruption. As an example, Fig. 8 shows the plots of K index daily mean values for the period 1958–1992 for three observatories – Heiss Island (HIS), Irkutsk (IRT), and Vostok (VOS).
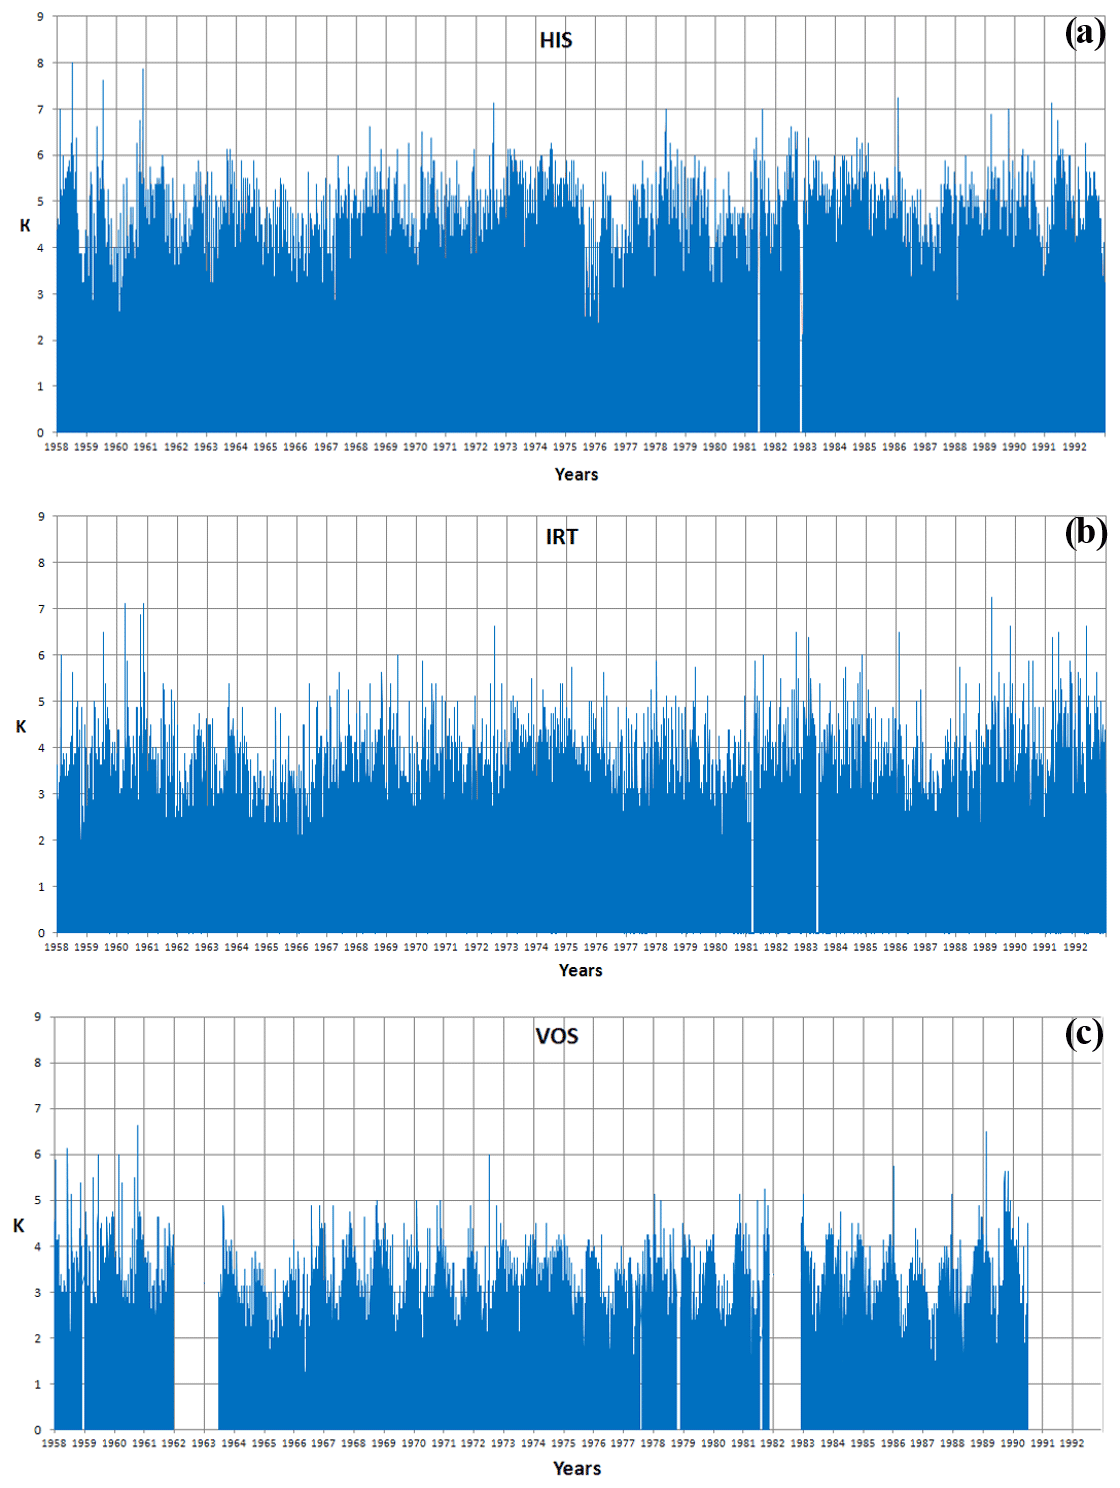
Figure 8K index daily mean values for the period 1958–1992 for three observatories: (a) Heiss Island (HIS); (b) Irkutsk (IRT); (c) Vostok (VOS).
The OAS and PIO observatories in Antarctica and TKH in the Arctic transferred their K index data to WDC only for 2 years during the IGY period of 1957–1958. They were closed shortly after the IGY ended. Unfortunately, some sets have omissions, or data were not transferred or simply lost.
In the last decade, the term “FAIR data” has become popular in scientific literature, as well as in general mass media. With time it became clear that FAIR data can significantly strengthen the results of scientific research and lead to their substantial and, sometimes, unexpected extensions. Scientists working in geophysics and the Earth sciences in general often claim nowadays that their results are obtained using FAIR pieces of information.
Following the FAIR principles (https://www.go-fair.org/fair-principles/, last access: 1 September 2020), we hereafter shortly present the FAIR data formalism while simultaneously showing that the historical K index data collection presented in this article fully satisfies the FAIR conditions.
The abbreviation FAIR stands for “Findable”, “Accessible”, “Interoperable”, and “Reusable” data sets. Hereafter are the most valuable clarifications of what each of these four features means (Wilkinson et al., 2016). Along with that we show how the requirements are satisfied for the data set of the K indices under consideration (in parentheses).
To be findable
- F1.
Data are assigned a unique and eternally persistent identifier (see the DOI of the K index collection at PANGAEA data repository).
- F2.
Data are described with rich metadata (provided in the PANGAEA system along with a comprehensive description given in this paper).
- F3.
Data are registered and indexed in a searchable resource (in the PANGAEA data repository itself).
To be accessible
- A1.
Data are retrievable by their identifier using a standardized communications protocol (implemented by DataCite system, which ensures adequate DOI retrievals).
- A2.
The protocol is open, free, and universally implementable (the DataCite system fully satisfies this requirement).
- A3.
Metadata are accessible even when the data are no longer available (this is provided by independent storage of the metadata in the DataCite system).
To be interoperable
- I1.
Data and metadata use a formal and broadly applicable means for knowledge representation (this is ensured by using the English language and ASCII text files for data storage).
- I2.
Data and metadata include qualified references from other resources (information description in this paper includes sufficient references on the dataset).
To be reusable
- R1.
Data have accurate and relevant attributes (in the PANGAEA system the data are attributed with abstracts, keywords, geographic coverage, dataset size, etc.).
- R2.
(Meta-)data are released with a clear and accessible data usage license (information on data usage license is provided by the PANGAEA system).
- R3.
(Meta-)data are associated with their provenance (information on the provenance of the K index collection is given in detail in this paper as well as in the dataset description in the PANGAEA system).
- R4.
(Meta-)data meet domain-relevant community standards (the presented K index collection fully meets the requirements of IAGA and WDS).
Hence, the FAIR requirements for the considered historical K index data collection are fully satisfied.
The data on the K index from paper catalogues were digitized at Geophysical Center of RAS by the team of the World Data Center for Solar-Terrestrial Physics. Digital data are available at: https://doi.org/10.1594/PANGAEA.922233, last access: 16 September 2020 (Sergeyeva et al., 2020). Photocopies of the data sheets and analogue magnetograms from geomagnetic observatories of the former USSR since 1957 are accessible via the web pages of the World Data Center for Solar-Terrestrial Physics: http://www.wdcb.ru/stp/data/K_indices, last access: 4 May 2021, World Data Center for Solar-Terrestrial Physics, 2021a; http://www.wdcb.ru/stp/geomag/magnetogr_list.en.html, last access: 4 May 2021, World Data Center for Solar-Terrestrial Physics, 2021b.
The implementation of digital magnetometers and data loggers that provide the near-real-time transfer of observational information to geophysical data repositories has become a pivotal moment in the observatory practice. But fast and convenient access to digital magnetograms from observatories all over the world did not completely substitute the traditional parameters of geomagnetic activity. K index – the classical, commonly used parameter of geomagnetic activity – serves as the measure of local magnetic field variations within 3 h intervals. The K index values defined at different observatories are used for calculating other geomagnetic activity indices such as Kp (ap), am (Km), an (Kn), as (Ks), and aa. The K index is used for studying magnetic storms – the most vivid reflection of the Sun's impact on the Earth's magnetosphere. The study of magnetic storms and the geomagnetic variations that they induce is important for analyzing their impact on meteorological processes, the biosphere, technological infrastructure, etc.
The long-time practice of the K index application makes it an important instrument for the retrospective complex analysis of solar–terrestrial interaction. The beginning of coordinated large-scale geomagnetic observations in the USSR was initiated during the International Geophysical Year of 1957–1958. Although some of the observatories were temporary and were discontinued by the end of 1958, the observational network of the former USSR remained relatively dense and provided the sufficient spatial coverage. The World Data Center B2 which later was renamed the WDC for Solar-Terrestrial Physics in Moscow became the main repository of data on geomagnetism in the former USSR. The K index data sheets were transferred from observatories to the WDC for STP where they were stored as paper documents. In the 2000s the WDC for STP initiated an ambitious project for digitizing this archive of paper documents. The presented unique collection of historical K index values (Sergeyeva et al., 2020) is the result of this activity. It is a vast quantity of homogeneous data that cover more than 3 decades of geomagnetic measurements at observatories of the former USSR. Considering the FAIR principles in regard to the presented data collection, in this article we come up with a new example of FAIR data.
NS, AG, AS, and RK were responsible for the preparation of the manuscript and figures. LZ, TK, and MN were responsible for the digitalization of analogue data, data validation, and the preparation of the K index data collection. MN was responsible for the publication of data in the PANGAEA system.
The authors declare that they have no conflict of interest.
The authors wish to thank the team of the World Data Center for Solar-Terrestrial Physics in Moscow, Russia, for the preservation and making publicly available historical geophysical data. This work employed data provided by the Shared Research Facility “Analytical Geomagnetic Data Center” of the Geophysical Center of RAS (http://ckp.gcras.ru/, last access: 1 September 2020).
This work was conducted in the framework of budgetary funding of the Geophysical Center of RAS, adopted by the Ministry of Science and Higher Education of the Russian Federation.
This paper was edited by Kirsten Elger and reviewed by two anonymous referees.
Anisimov, C. V., Dmitriev, E. M., Guryev, A. V., and Filippov, V. A.: Calculation of K-indices of geomagnetic activity in real time, Heliogeophys. Res., 13, 62–72, 2015 (in Russian).
Bartels, J.: Potsdamer erdmagnetische Kennziffern, 1. Mitteilung, Z. Geophys., 14, 68–78, 1938 (in German).
Bartels, J.: Potsdamer erdmagnetische Kennziffern, 4. Mitteilung, Z. Geophys., 15, 214–221, 1939 (in German).
Bartels, J.: The standardized index, Ks, and the planetary index, Kp, IATME Bull., 12b, Washington, DC, USA, 97–120, 1949.
Bartels, J., Heck, N. H., and Johnston, H. F.: The three-hour-range index measuring geomagnetic activity, J. Geophys. Res., 44, 411–454, https://doi.org/10.1029/te044i004p00411, 1939.
Belov, B. A., Burtsev, Y. A., Kiriakov, V. K., and Lyubimov, V. V.: Digital quartz magnetic variation stations, in: 170 years of observatory observations in the Urals: history and current state, Proceedings of the international seminar, Yekaterinburg, 17–23 July 2006, Yekaterinburg, 19–23, 2006 (in Russian).
Berthelier, A.: The K-derived planetary indices: derivation, meaning and uses in solar terrestrial physics, in: STPW-IV proceedings, 3, 3–20, edited by: Hruska, J., Shea, M. A., Smart, D. F., and Heckman, G., US Gov. Publications Office, Boulder CO, 1993.
Bobrov, V. N.: Universal highly stable sensitive element with zero temperature coefficient for magnetometers, variometers and microvariometers registering any component of the Earth's magnetic field, Trudy IZMIRAN (Works of IZMIRAN), 18, 55–67, 1961 (in Russian).
Burtsev, Y. A., Mansurov, S. M., and Timofeev, G. A.: Autonomous variation station for geomagnetic research in Antarctica, in: Geomagnetic instrument engineering, edited by: Dolginov, S., Nauka Press, Moscow, 1977 (in Russian).
Dmitriev, E. M. and Filippov, V. A.: Algorithm for calculation of indices of geomagnetic activity, in: V International conference “Solar-terrestrial relations and physics of earthquake precursors”, Paratunka, Kamchatka region, 2–7 August 2010, Collection of the reports, edited by: Shevtsov, B. M. and Bogdanov, V. V., IKIR, FEB RAS, Petropavlovsk-Kamchatsky, 110–113, 2010 (in Russian).
Golovkov, V. P., Papitashvili, V. O., and Papitashvili, N. E.: Automated calculation of K-indices using the method of natural orthogonal components, Geomagn. Aeronomy, 29, 514–517, 1989.
Gvishiani, A. and Soloviev, A.: EMF Observations and Data Processing, in: Observations, Modeling and Systems Analysis in Geomagnetic Data Interpretation, Springer Nature Switzerland AG, Cham, Switzerland, 29–96, https://doi.org/10.1007/978-3-030-58969-1_2, 2020.
Hopgood, P. A.: On the computer generation of geomagnetic K-indices from digital data, J. Geomagn. Geoelectr., 38, 861–871, https://doi.org/10.5636/jgg.38.861, 1986.
Jankowski, J. A., Ernst, T., Sucksdorff, C., Pirjola, R., and Ryno, J.: Experiences of a filter method and a standard curve method for determining K-indices, Ann. Geophys., 6, 589–594, 1988.
Lincoln, J. V.: Geomagnetic indices, in: Physics of Geomagnetic Phenomena, Vol. 1, edited by: Matsushita, S. and Campbell, W. H., Academic, New York, 67–100, 1967.
Love, J. J. and Remick, K. J.: Magnetic Indices, in: Encyclopedia of Geomagnetism and Paleomagnetism, Springer Netherlands, Dordrecht, 509–512, https://doi.org/10.1007/978-1-4020-4423-6_178, 2007.
Lyubovtseva, Y. S., Gvishiani, A. D., Soloviev, A. A., Samokhina, O. O., and Krasnoperov, R. I.: Sixtieth anniversary of the International Geophysical Year (1957–2017) – contribution of the Soviet Union, Hist. Geo Space. Sci., 11, 157–171, https://doi.org/10.5194/hgss-11-157-2020, 2020.
Mayaud, P. N.: Atlas of indices K, Part 1, IAGA Bull., 21, IUGG Publ. Office, Paris, 113 pp., 1967.
Mayaud, P. N.: Derivation, meaning and use of geomagnetic indices, Geophysical Monograph, 22, AGU, Washington, DC, 154 pp., https://doi.org/10.1002/9781118663837.fmatter, 1980.
Menvielle, M. and Berthelier, A.: The K-derived planetary indices: Description and availability, Rev. Geophys., 29, 415–432, https://doi.org/10.1029/91rg00994, 1991.
Menvielle, M., Papitashvili, N., Hakkinen, L., and Sucksdorff, C.: Computer production of K indices: review and comparison of methods, Geophys. J. Int., 123, 866–886, https://doi.org/10.1111/j.1365-246x.1995.tb06895.x, 1995.
Menvielle, M., Iyemori, T., Marchaudon, A., and Nosé, M.: Geomagnetic Indices, in: Geomagnetic Observations and Models, edited by: Mandea, M. and Korte, M., IAGA Special Sopron Book Series 5, Springer Science+Business Media B.V., 183–228, https://doi.org/10.1007/978-90-481-9858-0_8, 2011.
Nechaev, S. A.: Guide for stationary geomagnetic observations, Irkutsk: Institute of geography SB RAS, 140 pp., ISBN 5-94797-093-7, 2006 (in Russian).
Nicolet, M.: Historical aspects of the IGY, History of Geophysics, 1, 44–46, https://doi.org/10.1029/HG001p0044, 1984.
Raspopov, O. M., Kuz'min, I. A., and Kharin, E. P.: The 50th anniversary of International Geophysical Year (1957–1958): from the First International Polar Year (1882–1883) to the International Heliophysical Year (2007–2008) and International Polar Year (2007–2009), Geomagn. Aeronomy, 47, 1–7, https://doi.org/10.1134/s001679320701001x, 2007.
Rodnikov, A. G., Sergeyeva, N. A., and Zabarinskaya, L. P.: Research on the Earth's Interior Conducted by Russia after IGY: The Geotraverse Project and “INTERMARGINS”, Data Sci. J., 8, S24–S34, https://doi.org/10.2481/dsj.8.S24, 2009.
Sergeyeva, N., Gvishiani, A., Soloviev, A., Zabarinskaya, L., Krylova, T., Nisilevich, M., and Krasnoperov, R.: Historical K index data collection of Soviet magnetic observatories, 1957–1992, PANGAEA, https://doi.org/10.1594/PANGAEA.922233, 2020.
Sucksdorff, C., Pirjola, R., and Häkkinen, L.: Computer production of K-indices based on linear elimination, Geophys. Trans., 36, 333–345, 1991.
Takahashi, K., Toth, B. A., and Olson, J. V.: An automated procedure for near-real-time Kp estimates, J. Geophys. Res.-Space, 106, 21017–21032, https://doi.org/10.1029/2000ja000218, 2001.
Wilkinson, M. D., Dumontier, M., Aalbersberg, I. J., Appleton, G., Axton, M., Baak, A., Blomberg, N., Boiten, J-W., Santos, L., Bourne, P. E., Bouwman, J., Anthony J. Brookes, A. J., Clark, T., Crosas, M., Dillo, I., Dumon, O., Edmunds, S., Evelo, C. T., Finkers, R., Gonzalez-Beltran, A., Gray, A. J. G., Groth, P., Goble, C., Grethe, J. S., Heringa, J., C ’t Hoen, P. A., Hooft, R., Kuhn, T., Kok, R., Kok, J., Lusher, S. J., Martone, M. E., Mons, A., Packer, A. L., Persson, B., Rocca-Serra, P., Roos, M., van Schaik, R., Sansone, S.-A., Schultes, E., Sengstag, T., Slater, T., Strawn, G., Swertz, M. A., Thompson, M., van der Lei, J., van Mulligen, E., Velterop, J., Waagmeester, A., Wittenburg, P., Wolstencroft, K., Zhao, J., and Mons, B.: The FAIR Guiding Principles for scientific data management and stewardship, Sci. Data, 3, 160018, https://doi.org/10.1038/sdata.2016.18, 2016.
World Data Center for Solar-Terrestrial Physics: Digital Images of Magnetograms, available at: http://www.wdcb.ru/stp/geomag/magnetogr_list.en.html, last access: 4 May 2021a.
World Data Center for Solar-Terrestrial Physics: K and C indices according to the data of 40 observatories of Russia and the CIS countries and stations “North Pole”, available at: http://www.wdcb.ru/stp/data/K_indices/, last access: 4 May 2021b.
Zabolotnaya, N. A.: Indices of geomagnetic activity: reference guide, 2nd Edn., LKI Publishing house, Moscow, Russia, 88 pp., 2007 (in Russian).
- Abstract
- Introduction
- Description of K index
- Compilation of the historical K index data collection
- Applicability of FAIR principles to the historical K index data set
- Data availability
- Conclusions
- Author contributions
- Competing interests
- Acknowledgements
- Financial support
- Review statement
- References