the Creative Commons Attribution 4.0 License.
the Creative Commons Attribution 4.0 License.
 | 15 Apr 2021
The MALINA oceanographic expedition: how do changes in ice cover, permafrost and UV radiation impact biodiversity and biogeochemical fluxes in the Arctic Ocean?
Philippe Massicotte
Rainer M. W. Amon
David Antoine
Philippe Archambault
Sergio Balzano
Simon Bélanger
Ronald Benner
Dominique Boeuf
Annick Bricaud
Flavienne Bruyant
Gwenaëlle Chaillou
Malik Chami
Bruno Charrière
Jing Chen
Hervé Claustre
Pierre Coupel
Nicole Delsaut
David Doxaran
Jens Ehn
Cédric Fichot
Marie-Hélène Forget
Pingqing Fu
Jonathan Gagnon
Nicole Garcia
Beat Gasser
Jean-François Ghiglione
Gaby Gorsky
Michel Gosselin
Priscillia Gourvil
Yves Gratton
Pascal Guillot
Hermann J. Heipieper
Serge Heussner
Stanford B. Hooker
Yannick Huot
Christian Jeanthon
Wade Jeffrey
Fabien Joux
Kimitaka Kawamura
Bruno Lansard
Edouard Leymarie
Heike Link
Connie Lovejoy
Claudie Marec
Dominique Marie
Johannie Martin
Jacobo Martín
Guillaume Massé
Atsushi Matsuoka
Vanessa McKague
Alexandre Mignot
William L. Miller
Juan-Carlos Miquel
Alfonso Mucci
Kaori Ono
Eva Ortega-Retuerta
Christos Panagiotopoulos
Tim Papakyriakou
Marc Picheral
Louis Prieur
Patrick Raimbault
Joséphine Ras
Rick A. Reynolds
André Rochon
Jean-François Rontani
Catherine Schmechtig
Sabine Schmidt
Richard Sempéré
Yuan Shen
Guisheng Song
Dariusz Stramski
Eri Tachibana
Alexandre Thirouard
Imma Tolosa
Jean-Éric Tremblay
Mickael Vaïtilingom
Daniel Vaulot
Frédéric Vaultier
John K. Volkman
Huixiang Xie
Guangming Zheng
Marcel Babin
The MALINA oceanographic campaign was conducted during summer 2009 to investigate the carbon stocks and the processes controlling the carbon fluxes in the Mackenzie River estuary and the Beaufort Sea. During the campaign, an extensive suite of physical, chemical and biological variables were measured across seven shelf–basin transects (south–north) to capture the meridional gradient between the estuary and the open ocean. Key variables such as temperature, absolute salinity, radiance, irradiance, nutrient concentrations, chlorophyll a concentration, bacteria, phytoplankton and zooplankton abundance and taxonomy, and carbon stocks and fluxes were routinely measured onboard the Canadian research icebreaker CCGS Amundsen and from a barge in shallow coastal areas or for sampling within broken ice fields. Here, we present the results of a joint effort to compile and standardize the collected data sets that will facilitate their reuse in further studies of the changing Arctic Ocean. The data set is available at https://doi.org/10.17882/75345 (Massicotte et al., 2020).
- Article
(10230 KB) - Full-text XML
- BibTeX
- EndNote


The Mackenzie River is the largest source of terrestrial particles entering the Arctic Ocean (see Doxaran et al., 2015, and references therein). During the past decades, temperature rise, permafrost thawing, coastal erosion and increasing river runoff have contributed to intensifying the export of terrestrial carbon by the Mackenzie River to the Arctic Ocean (e.g., Tank et al., 2016). Furthermore, the environmental changes currently happening in the Arctic may have profound impacts on the biogeochemical cycling of this exported carbon. On one hand, reduction in sea ice extent and thickness exposes a larger fraction of the ocean surface to higher solar radiation and increases the mineralization of this carbon into atmospheric CO2 through photo-degradation (Miller and Zepp, 1995; Bélanger et al., 2006b). On the other hand, the possible increase in nutrients brought by Arctic rivers may contribute to higher autotrophic production and sequestration of organic carbon (Tremblay et al., 2014).
Given that these production and removal processes are operating simultaneously, the fate of Arctic river carbon transiting toward the Arctic Ocean is not entirely clear. Hence, detailed studies about these processes are needed to determine if the Arctic Ocean will become a biological source or a sink of atmospheric CO2. With regard to this question, the MALINA oceanographic expedition was designed to document and gain insight into the stocks and the processes controlling carbon fluxes in the Mackenzie River and the Beaufort Sea. Specifically, the main objective of the MALINA oceanographic expedition was to determine how (1) primary production, (2) bacterial activity and (3) organic-matter photo-oxidation influence carbon fluxes and cycling in the Canadian Beaufort Sea. In this article, we present an overview of an extensive and comprehensive data set acquired from a coordinated international sampling effort conducted in the Mackenzie River and in the Beaufort Sea in August 2009.
2.1 Study area and environmental conditions
The MALINA oceanographic expedition was conducted between 30 July and 25 August 2009 in the Mackenzie River and the Beaufort Sea systems (Fig. 1). Figure 2 shows an overview of the sea ice conditions that prevailed during the expedition. In Fig. 2a, a true-color image from MODIS Terra reveals how the sea ice pack was fragmented toward the end of the expedition, specially near the 200 m isobath (identified by the continuous red line). On the shelf, the sea ice concentration was higher at the beginning of the expedition. During the 4-week cruise, the ice concentration gradually decreased toward the north (Fig. 2b).
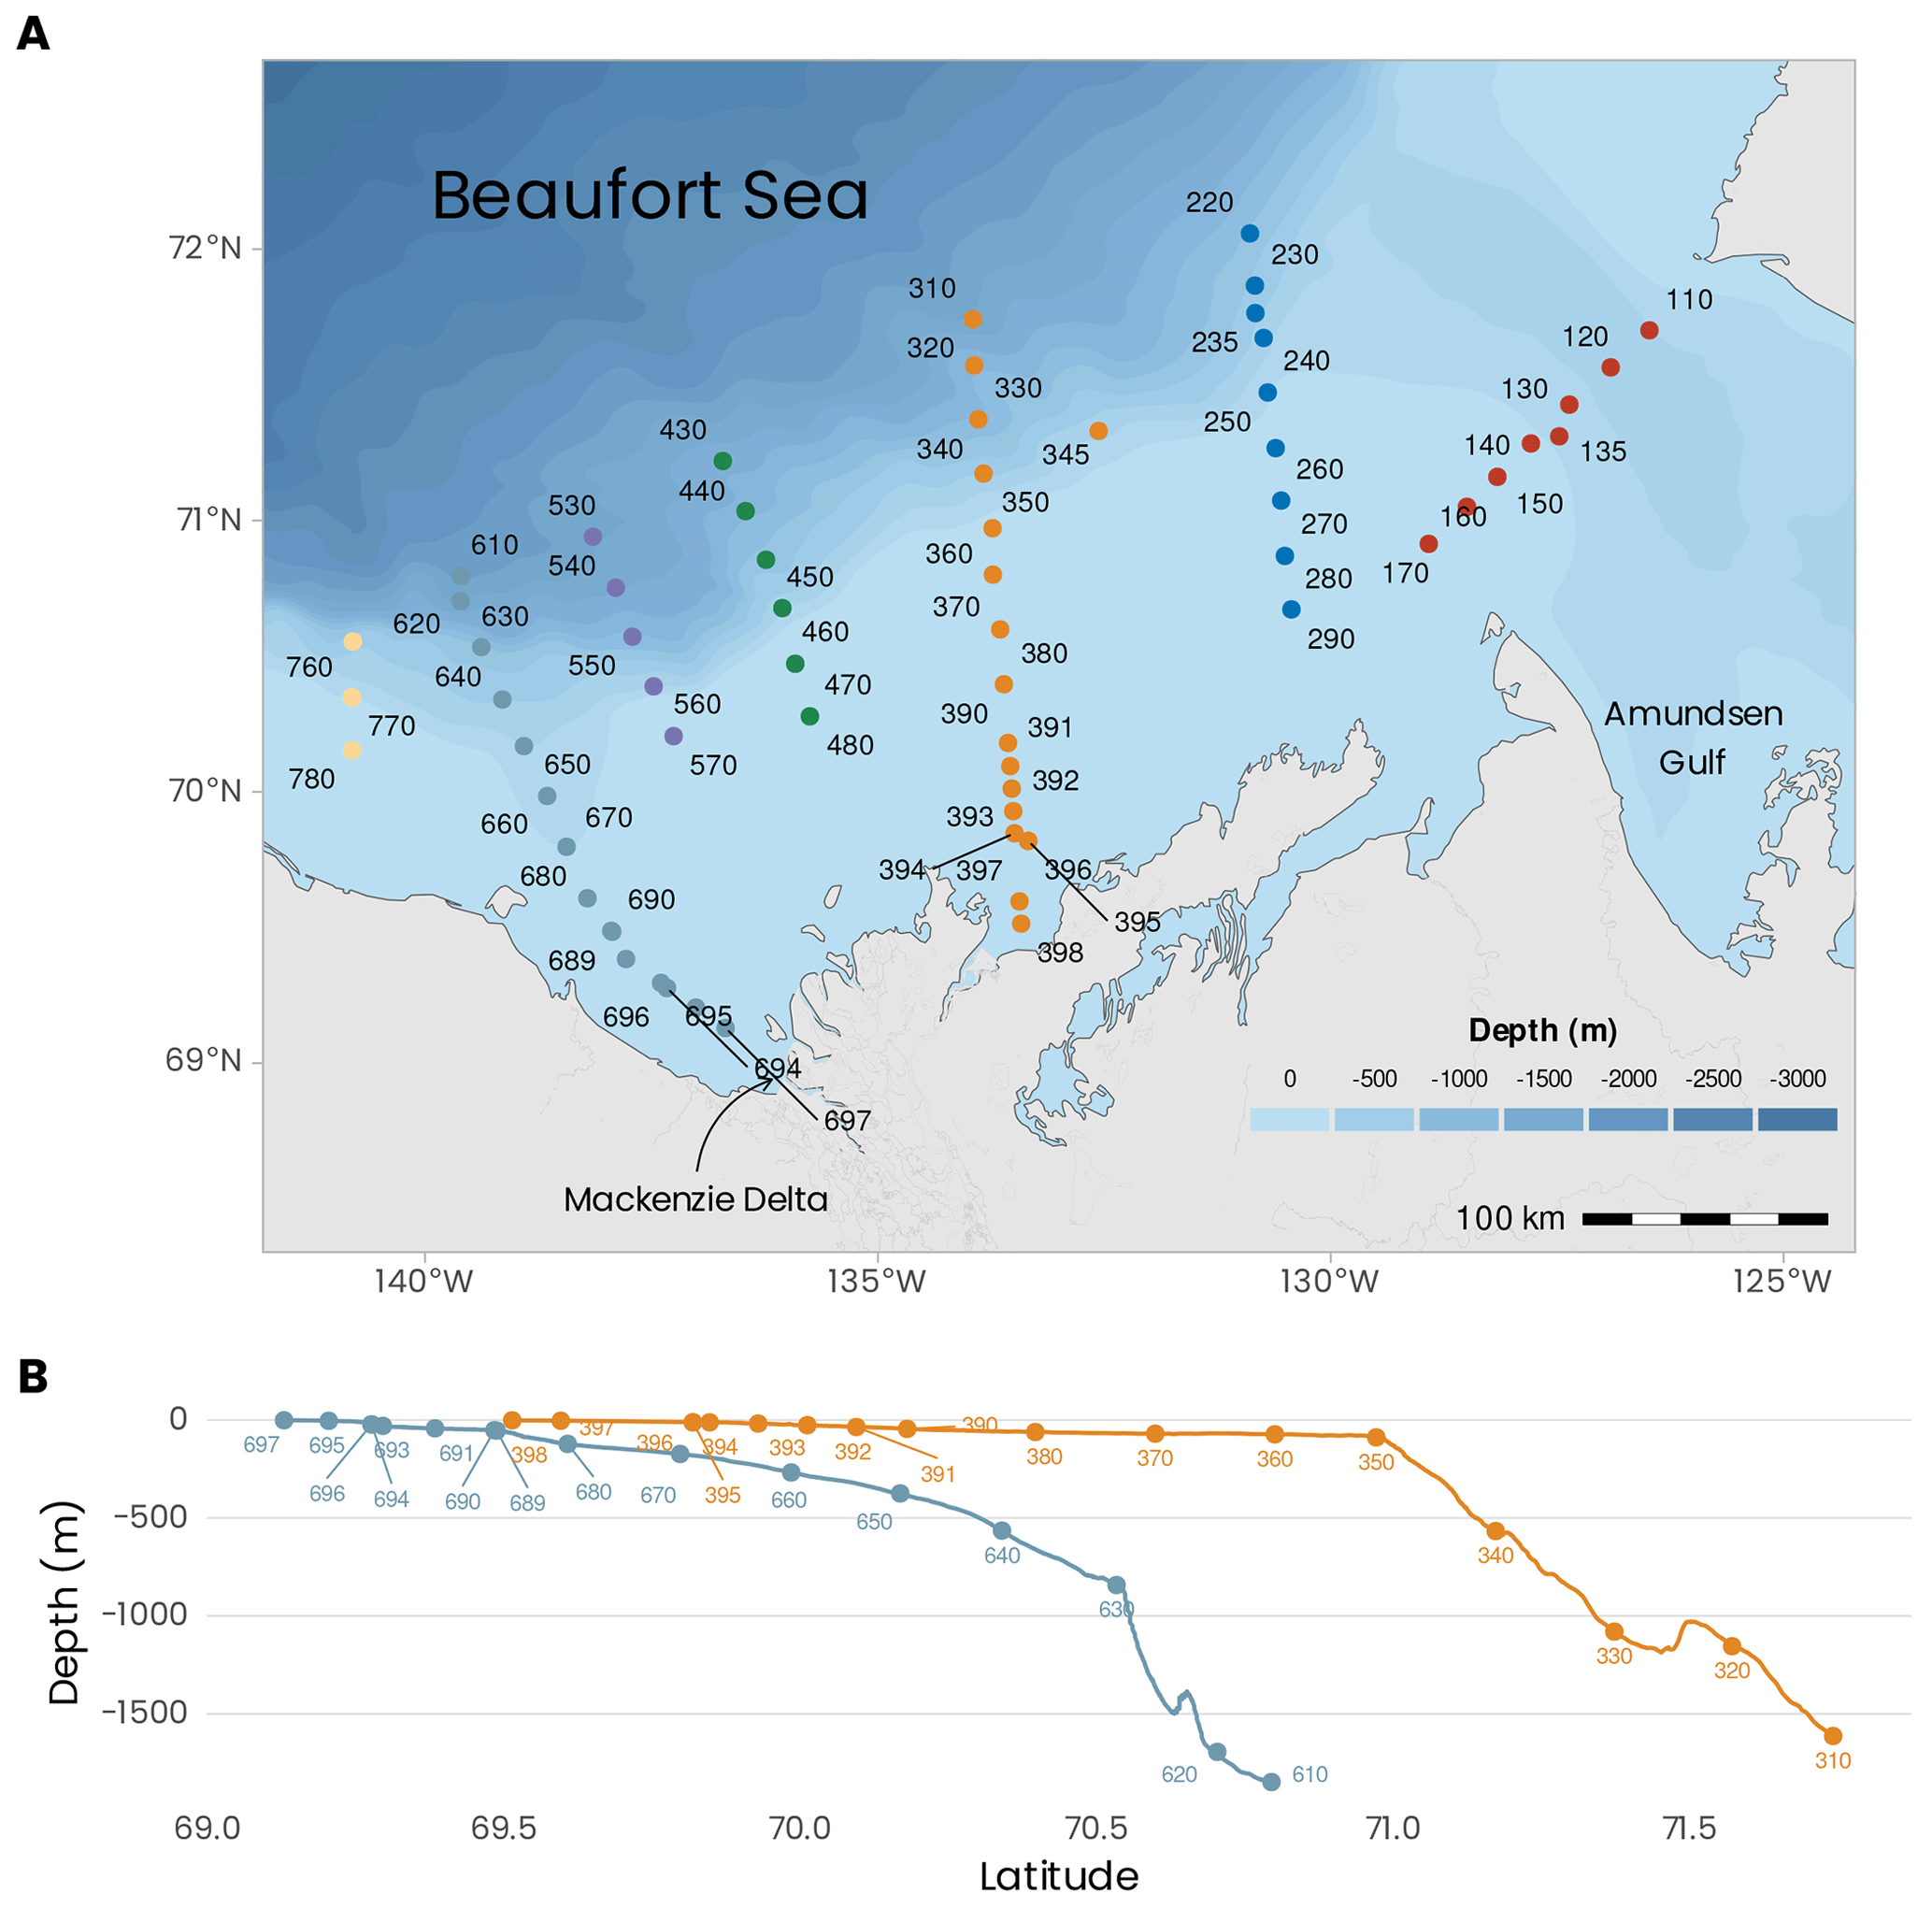
Figure 1(a) Localizations of the sampling sites visited during the MALINA 2009 campaign. The colors of the dots represent the seven transects visited during the mission. (b) Bathymetric profiles for transects 600 and 300. Bathymetric data from General Bathymetric Chart of the Oceans (GEBCO) (https://download.gebco.net/).
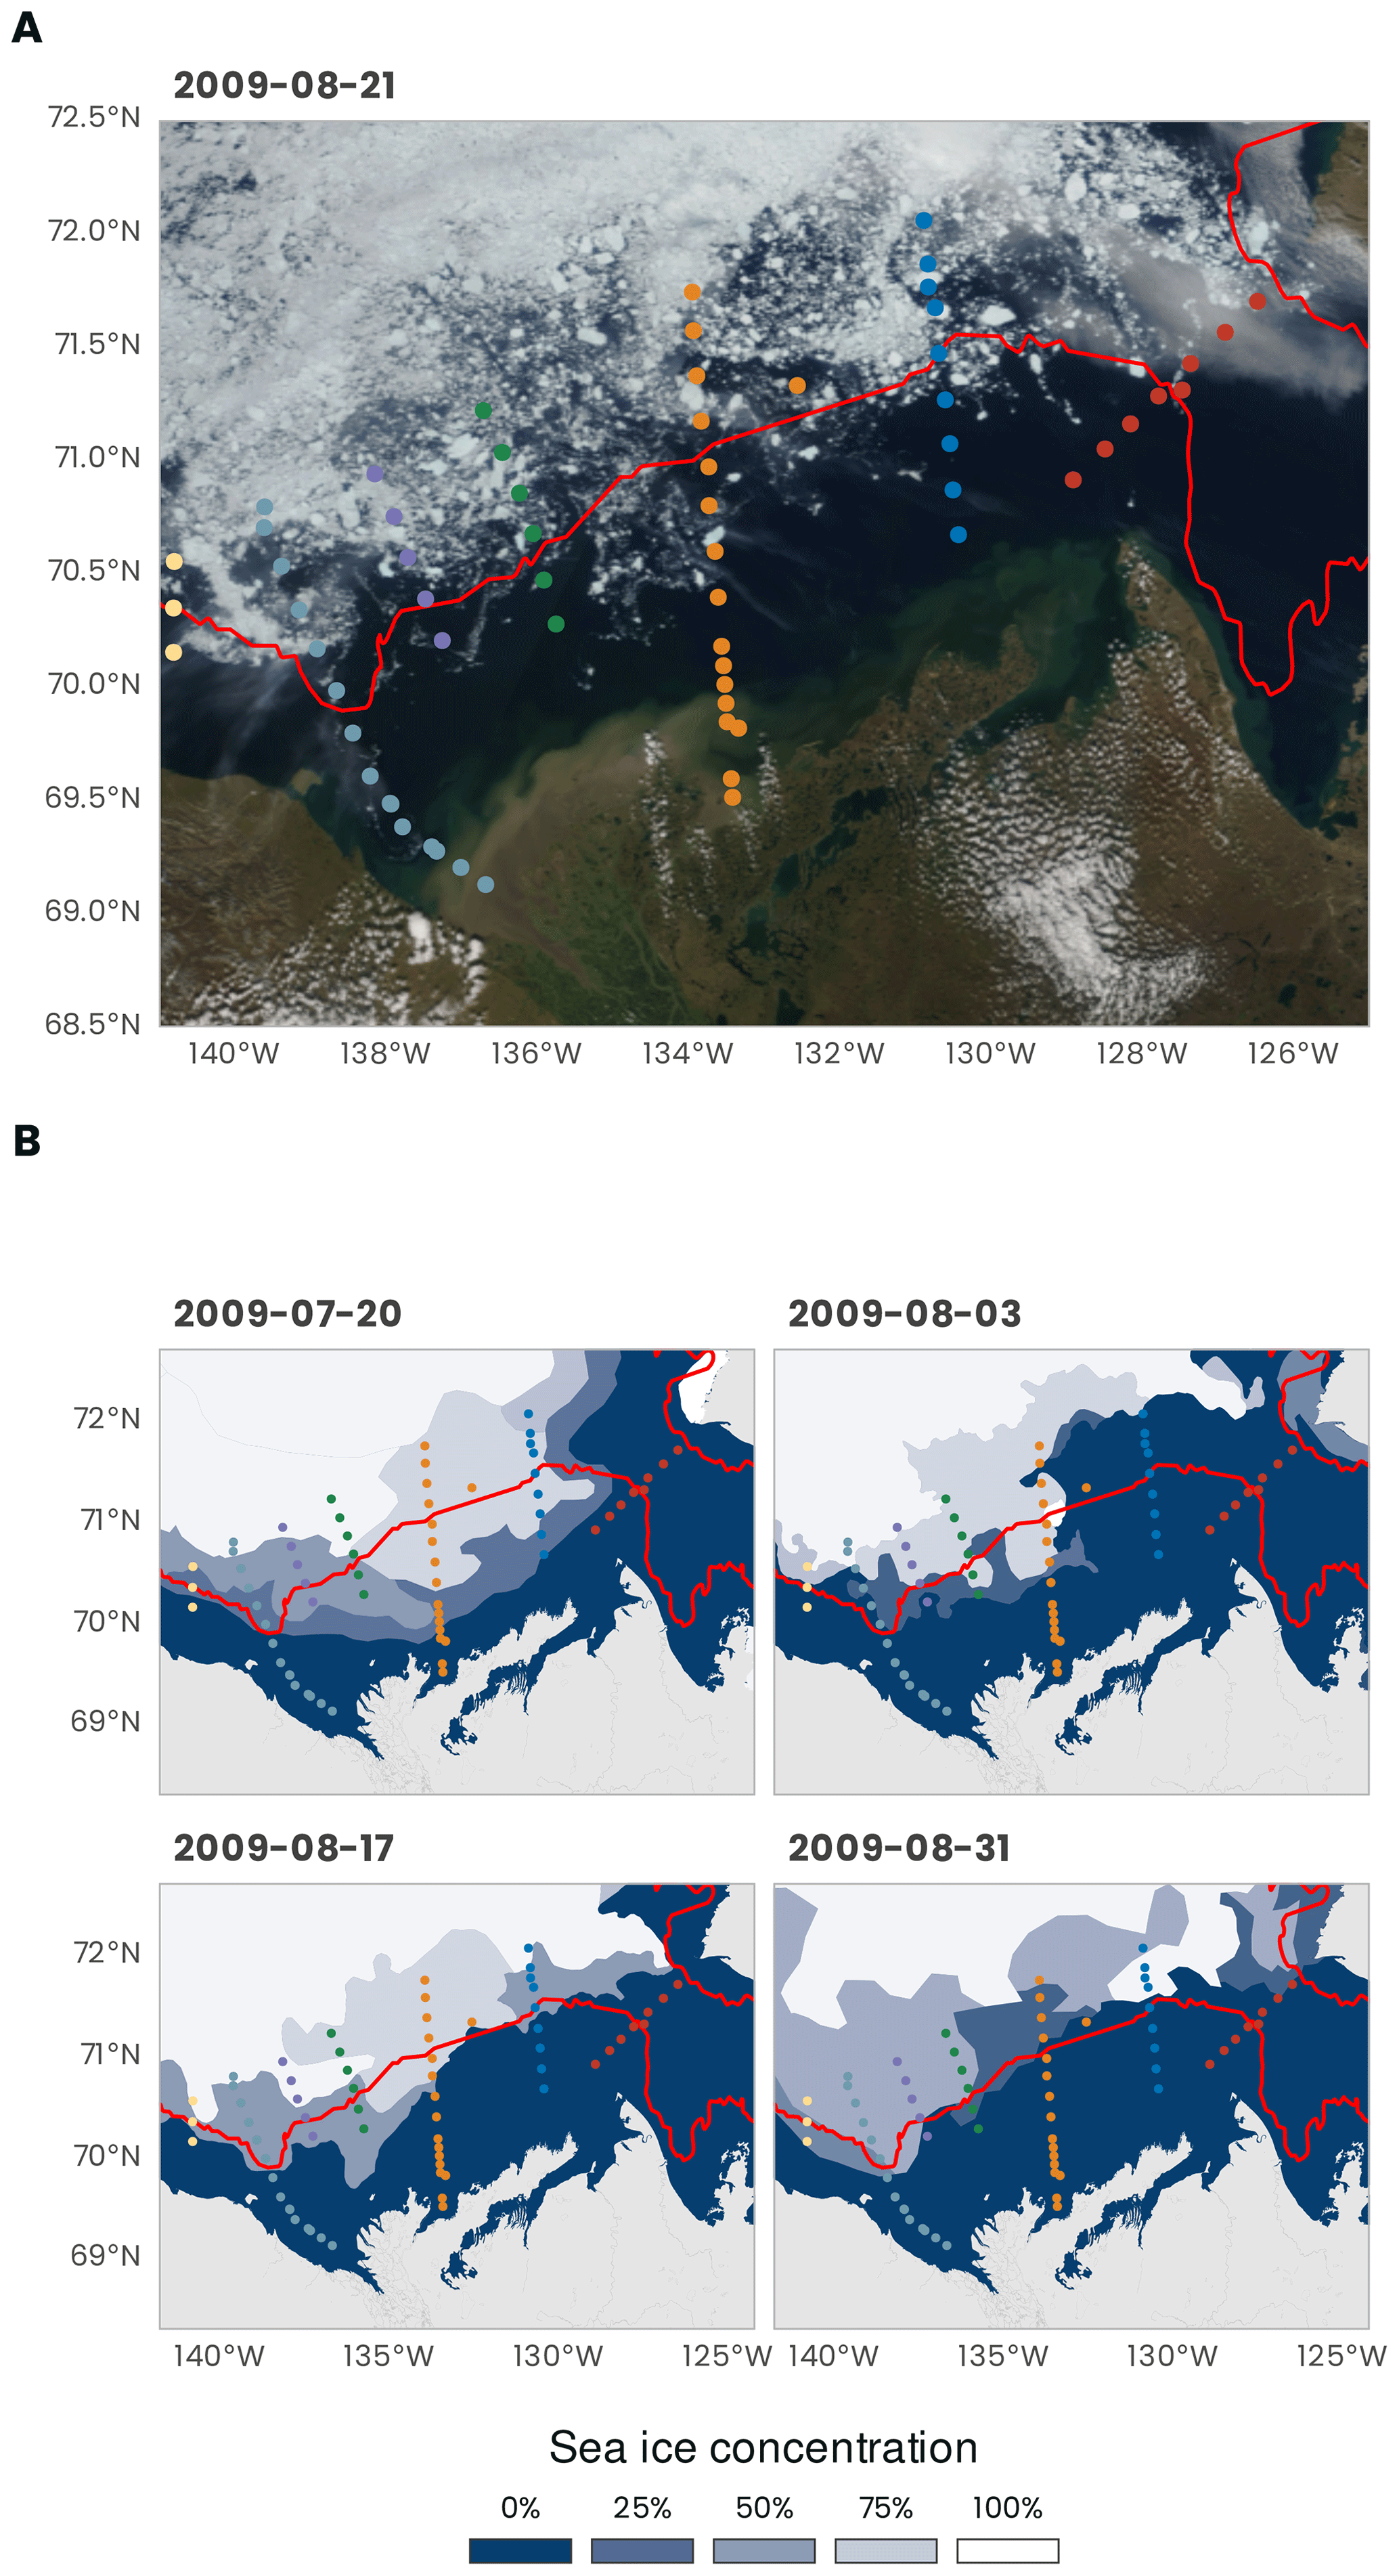
Figure 2(a) True-color image from MODIS Terra (data from https://wvs.earthdata.nasa.gov, last access: 1 February 2021). (b) Weekly sea ice concentration from the US National Ice Center (U.S. National Ice Center, 2020). The red line shows the 200 m isobath (data from http://www.naturalearthdata.com, last access: 1 February 2021). The dots represent the stations (see Fig. 1 for the legend).
The Mackenzie River basin is the largest in northern Canada and covers an area of approximately 1 805 000 km2, which represents around 20 % of the total land area of Canada (Abdul Aziz and Burn, 2006). Between 1972 and 2016, the average monthly discharge (recorded at the Arctic Red River station) varied between 3296 and 23 241 m3 s−1 (shaded area in Fig. 3a). The period of maximum discharge usually occurs at the end of May, with decreasing discharge until December, whereas the period of low and stable discharge extends between December and May. During the MALINA oceanographic cruise, the daily discharge varied between 12 600 and 15 100 m3 s−1 (red segment in Fig. 3a; see also Ehn et al., 2019). Draining a vast watershed, the Mackenzie River annually delivers on average 2100 and 1400 Gg C yr−1 of particulate organic carbon (POC) and dissolved organic carbon (DOC), respectively, into the Arctic Ocean (Stein and Macdonald, 2004; Raymond et al., 2007). During the expedition conducted onboard the CCGS Amundsen, the air temperature recorded by the foredeck meteorological tower varied between −2 and 11 ∘C (Fig. 3b). The average air temperature was 3 ∘C and usually remained above 0 ∘C.

Figure 3(a) Daily discharge of the Mackenzie River at the Arctic Red River junction (station 10LC014). The black line corresponds to the 2009 discharge, whereas the colored segment identifies the period of the MALINA campaign. The shaded area is the mean discharge calculated between 1972 and 2016. Discharge data from the government of Canada (https://wateroffice.ec.gc.ca/search/historical_e.html, last access: 6 September 2019). (b) Hourly air temperature recorded from the foredeck meteorological tower of the Amundsen during the campaign.
2.2 General sampling strategy
The sampling was conducted over a network of sampling stations organized into seven transects identified with three digits: 100, 200, 300, 400, 500, 600 and 700 (Fig. 1a). Stations were sampled across these seven shelf–basin transects (south–north) to capture the meridional gradient between the estuary and the open ocean (except for transect 100 across the mouth of the Amundsen Gulf). Within each transect, station numbers were listed in descending order from south to north. Because our goal was to sample in open waters, the order in which the transects were visited depended on the ice cover. On 20 July 2009, just before the mission, a relatively large portion of the shelf was still covered by sea ice (Fig. 2b). Soon after the beginning of the cruise, most of the shelf area was ice-free. The shelf region was not ice-free before mid-August. The bathymetry at the sampling stations varied between 2 and 1847 m (394 ± 512 m, mean ± standard deviation). The stations located in the Beaufort Sea were sampled onboard the Canadian research icebreaker CCGS Amundsen. Biological, chemical and optical water column sampling was almost always restricted to the first 400 m of the water column during daytime. Deeper profiles for sampling the whole water column and bottom sediment were usually repeated during nighttime at the same stations. Sediment sampling for fauna and biogeochemistry was conducted at eight stations (110, 140, 235, 260, 345, 390, 680, 690). Two transects (600 and 300) were extended to very shallow waters on the shelf and sampled from either a zodiac or a barge (the bathymetry profiles are shown in Fig. 1b). In the context of this data paper, these two transects were chosen to present an overview of the principal variables measured during the MALINA campaign. A summary of the various sampling strategies is presented below.
2.3 CTD and rosette deployment
Onboard the CCGS Amundsen, a general oceanic rosette equipped with a CTD (instrument for measuring conductivity, temperature, and depth; Sea-Bird SBE-911+) was deployed at each sampling station (Fig. 1). The rosette was equipped with twenty-four 12 L Niskin bottles. The rosette was also equipped with a transmissometer sensor (Wetlabs), a photosynthetic active radiation (PAR) sensor (Biospherical), an oxygen sensor (SBE-43), a pH sensor (SBE-18), a nitrate sensor (Satlantic ISUS), a fluorometer (Seapoint) and an altimeter (Benthos). A surface PAR (Biospherical) was also installed on the roof of the rosette control laboratory. A UVP5 (underwater vision profiler, Hydroptics) was also mounted on the rosette frame, providing size and abundance of particles above 200 µm and plankton above 700 µm. The rosette data processing and quality control are described in detail in Guillot and Gratton (2010). Data processing included the following steps: validation of the calibration coefficients, conversion of data to physical units, alignment correction and extraction of useless data. Oxygen sensor calibration was done using Winkler titrations, and salinity data were compared with water samples analyzed with a Guildline 8400B Autosal. The quality control tests were based on the International Oceanographic Commission's suggested procedures and UNESCO’s algorithm standards (Commission of the European Community, 1993). The recorded data were averaged every decibar. On 5 August, the pH sensor was replaced by a chromophoric dissolved organic matter (CDOM) fluorometer (excitation: 350–460 nm; emission: 550 nm; half-width (HW) 40 nm; Dr. Haardt Optik Mikroelektronik). The rosette depth range was restricted to the first 1000 m when carrying the pH, PAR and nitrate sensors because of their rating.
2.4 Sediment sampling
Surface sediments were sampled using an USNEL box corer (50 × 50 × 40 cm). Box cores with undisturbed surfaces were subsampled for (a) lipids (Rontani et al., 2012b) and isotopic signature of lipid biomarkers (Tolosa et al., 2013), stable isotopes (C, N), and manganese and iron oxides (Link et al., 2013a) in the 1 cm surface layer; (b) sediment pigment profiles down to 8 cm; and (c) fluxes at the sediment–water interface using onboard microcosm incubations on subcores (10 cm diameter, 20 cm deep) (Link et al., 2013a, 2019). At three stations (140, 345, 390), macrofauna abundance and diversity were determined from sieved and conserved samples (Link et al., 2019). At station 680, a core was subsampled at 1 cm to determine dinocyst abundance and dated using 210Pb and 137Cs (Durantou et al., 2012). Samples for (a)–(b) were stored frozen until analysis in the respective home labs.
Different quality control procedures were adopted to ensure the integrity of the data. First, the raw data were visually screened to eliminate errors originating from the measurement devices, including sensors (systematic or random) and errors inherent from measurement procedures and methods. Statistical summaries such as average, standard deviation and range were computed to detect and remove anomalous values in the data. Then, data were checked for duplicates and remaining outliers. The complete list of variables is presented in Table 1.
Table 1Parameters measured during the MALINA oceanographic expedition. Parameters are ordered alphabetically.
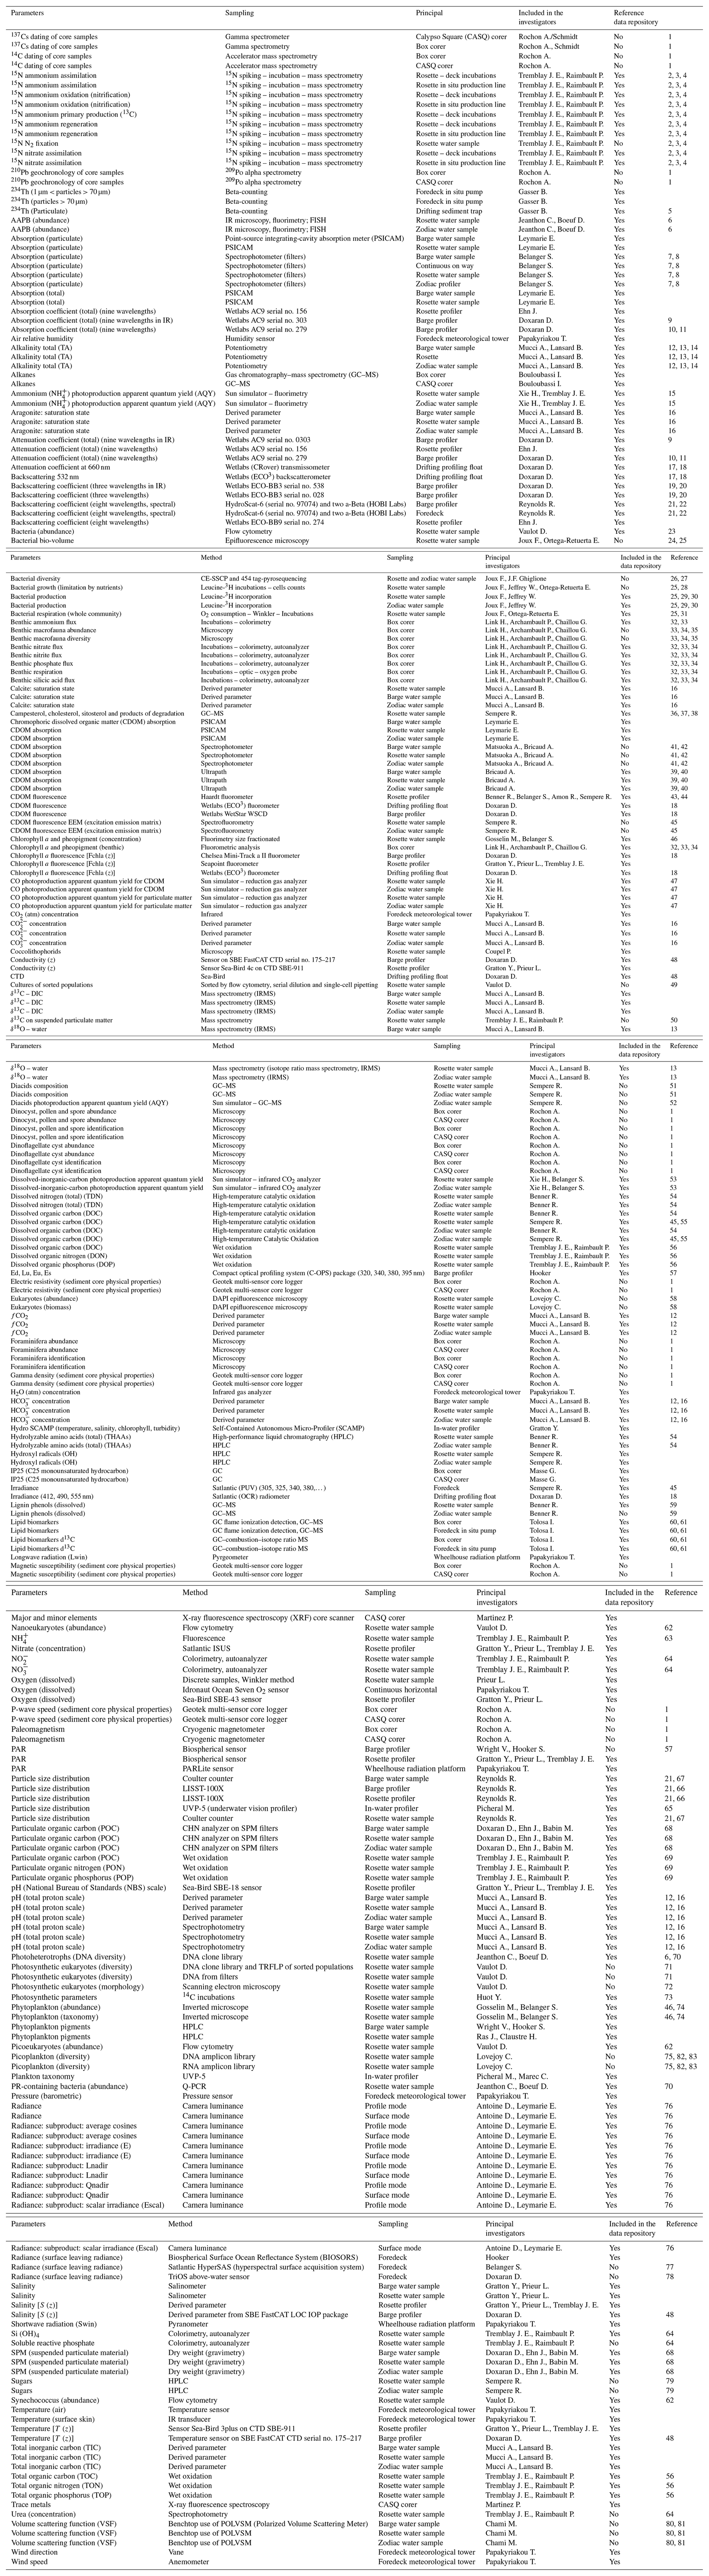
(1) Durantou et al. (2012); (2) Raimbault et al. (1999c); (3) Raimbault and Garcia (2008); (4) Fernández and Raimbault (2007); (5) Miquel et al. (2015); (6) Boeuf et al. (2013); (7) Bélanger et al. (2013a); (8) Röttgers and Gehnke (2012); (9) Doxaran et al. (2007); (10) Pegau et al. (1997); (11) Sullivan et al. (2006); (12) Mucci et al. (2010); (13) Lansard et al. (2012); (14) Dickson et al. (2007); (15) Xie et al. (2012); (16) Beaupré-Laperrière et al. (2020); (17) Poteau et al. (2017); (18) Xing et al. (2012); (19) Doxaran et al. (2016); (20) Boss and Pegau (2001); (21) Reynolds et al. (2016); (22) Neukermans et al. (2016); (23) Marie et al. (1997); (24) Cottrell and David (2003); (25) Ortega-Retuerta et al. (2012a); (26) Ortega-Retuerta et al. (2013); (27) Ghiglione et al. (2008); (28) Ortega-Retuerta et al. (2012b); (29) Kirchman (2018); (30) Smith and Azam (1992); (31) Carignan et al. (1998); (32) Link et al. (2013b); (33) Link et al. (2019); (34) Link et al. (2013c); (35) Wei et al. (2020); (36) Rontani et al. (2014); (37) Rontani et al. (2012a); (38) Rontani et al. (2012b); (39) Bricaud et al. (2010); (40) Matsuoka et al. (2012b); (41) Matsuoka et al. (2011); (42) Matsuoka et al. (2014); (43) Amon (2003); (44) Cooper et al. (2005); (45) Para et al. (2013); (46) Blais et al. (2017); (47) Song et al. (2013); (48) Sea-Bird Scientific. (2017); (49) Balzano et al. (2012a); (50) Andrisoa et al. (2019); (51) Sempéré et al. (2019); (52) Tedetti et al. (2007); (53) Bélanger et al. (2006b); (54) Shen et al. (2012); (55) Sohrin and Sempéré (2005); (56) Raimbault et al. (1999b); (57) Hooker et al. (2020); (58) Vaqué et al. (2008); (59) Fichot et al. (2016); (60) Tolosa et al. (2013); (61) Tolosa and de Mora (2004); (62) Marie et al. (2014); (63) Holmes et al. (1999); (64) Aminot and Kérouel (2007); (65) Picheral et al. (2010); (66) Reynolds et al. (2010); (67) Runyan et al. (2020); (68) Doxaran et al. (2012b); (69) Raimbault et al. (1999a); (70) Boeuf et al. (2016); (71) Balzano et al. (2012b); (72) Balzano et al. (2017); (73) Marcel et al. (1994); (74) Ardyna et al. (2017b); (75) Comeau et al. (2012); (76) Antoine et al. (2013b); (77) Mobley (1999); (78) Ruddick et al. (2006); (79) Panagiotopoulos et al. (2014); (80) Chami et al. (2014); (81) Harmel et al. (2016); (82) Monier et al. (2014); (83) Monier et al. (2015)
The following sections present an overview of a subset of selected variables from the water column. For these selected variables, a brief description of the data collection methods is presented along with general results.
4.1 Water mass distribution
According to previous studies (Carmack et al., 1989; Macdonald et al., 1989), five main source water types can be distinguished in the southeastern Beaufort Sea: (1) meteoric water (MW; Mackenzie River plus precipitation), (2) sea ice meltwater (SIM), (3) winter polar mixed layer (wPML), (4) upper-halocline water (UHW; modified Pacific water with core salinity of 33.1 PSU) and (5) lower-halocline water (LHW; water of Atlantic origin). In this study, we used the optimum multiparameter (OMP) algorithm to quantify the relative contributions of the different source water types to the observed data (https://omp.geomar.de/, last access: 1 February 2021). We used salinity, TA and δ18O as conservative tracers as well as temperature and O2 concentration as non-conservative tracers, to constrain the water mass analysis following Lansard et al. (2012). Briefly, the method finds the best-fitting fraction (x) of (n+1) source water types that contribute to the n observed values of the selected tracers in a parcel of water via a solution of an overdetermined system of linear equations that minimizes the residual error. Boundary conditions were applied to the method to guarantee that all fractions calculated were positive and that the sum of all fractions was 100 % (mass conservation).
During MALINA, the Mackenzie Shelf was for the most part entirely ice-free, and the ice pack was located beyond the shelf break (Fig. 2). The transition zone was characterized by different expanses of drifting sea ice. Significant contributions of meteoric water (> 25 %) to the surface mixed layer (SML) were only observed close to the Mackenzie River mouth and on the inner shelf (Fig. 4). A relatively small fraction of sea ice meltwater was detected beyond the shelf break, mostly along the transect 600. Below the SML, the wPML was the predominant water mass down to 100 m depth. The UHW extends from the interior ocean onto the outer shelf from 120 to 180 m depth. Relatively high fractions of UHW were also found at 50 m depth along the Mackenzie and Kugmallit canyons, which are recognized sites of enhanced shelf-break upwelling caused by wind- and ice-driven ocean surface stresses. Below 200 m depth, the LHW with an Atlantic origin was always the prevailing water mass.
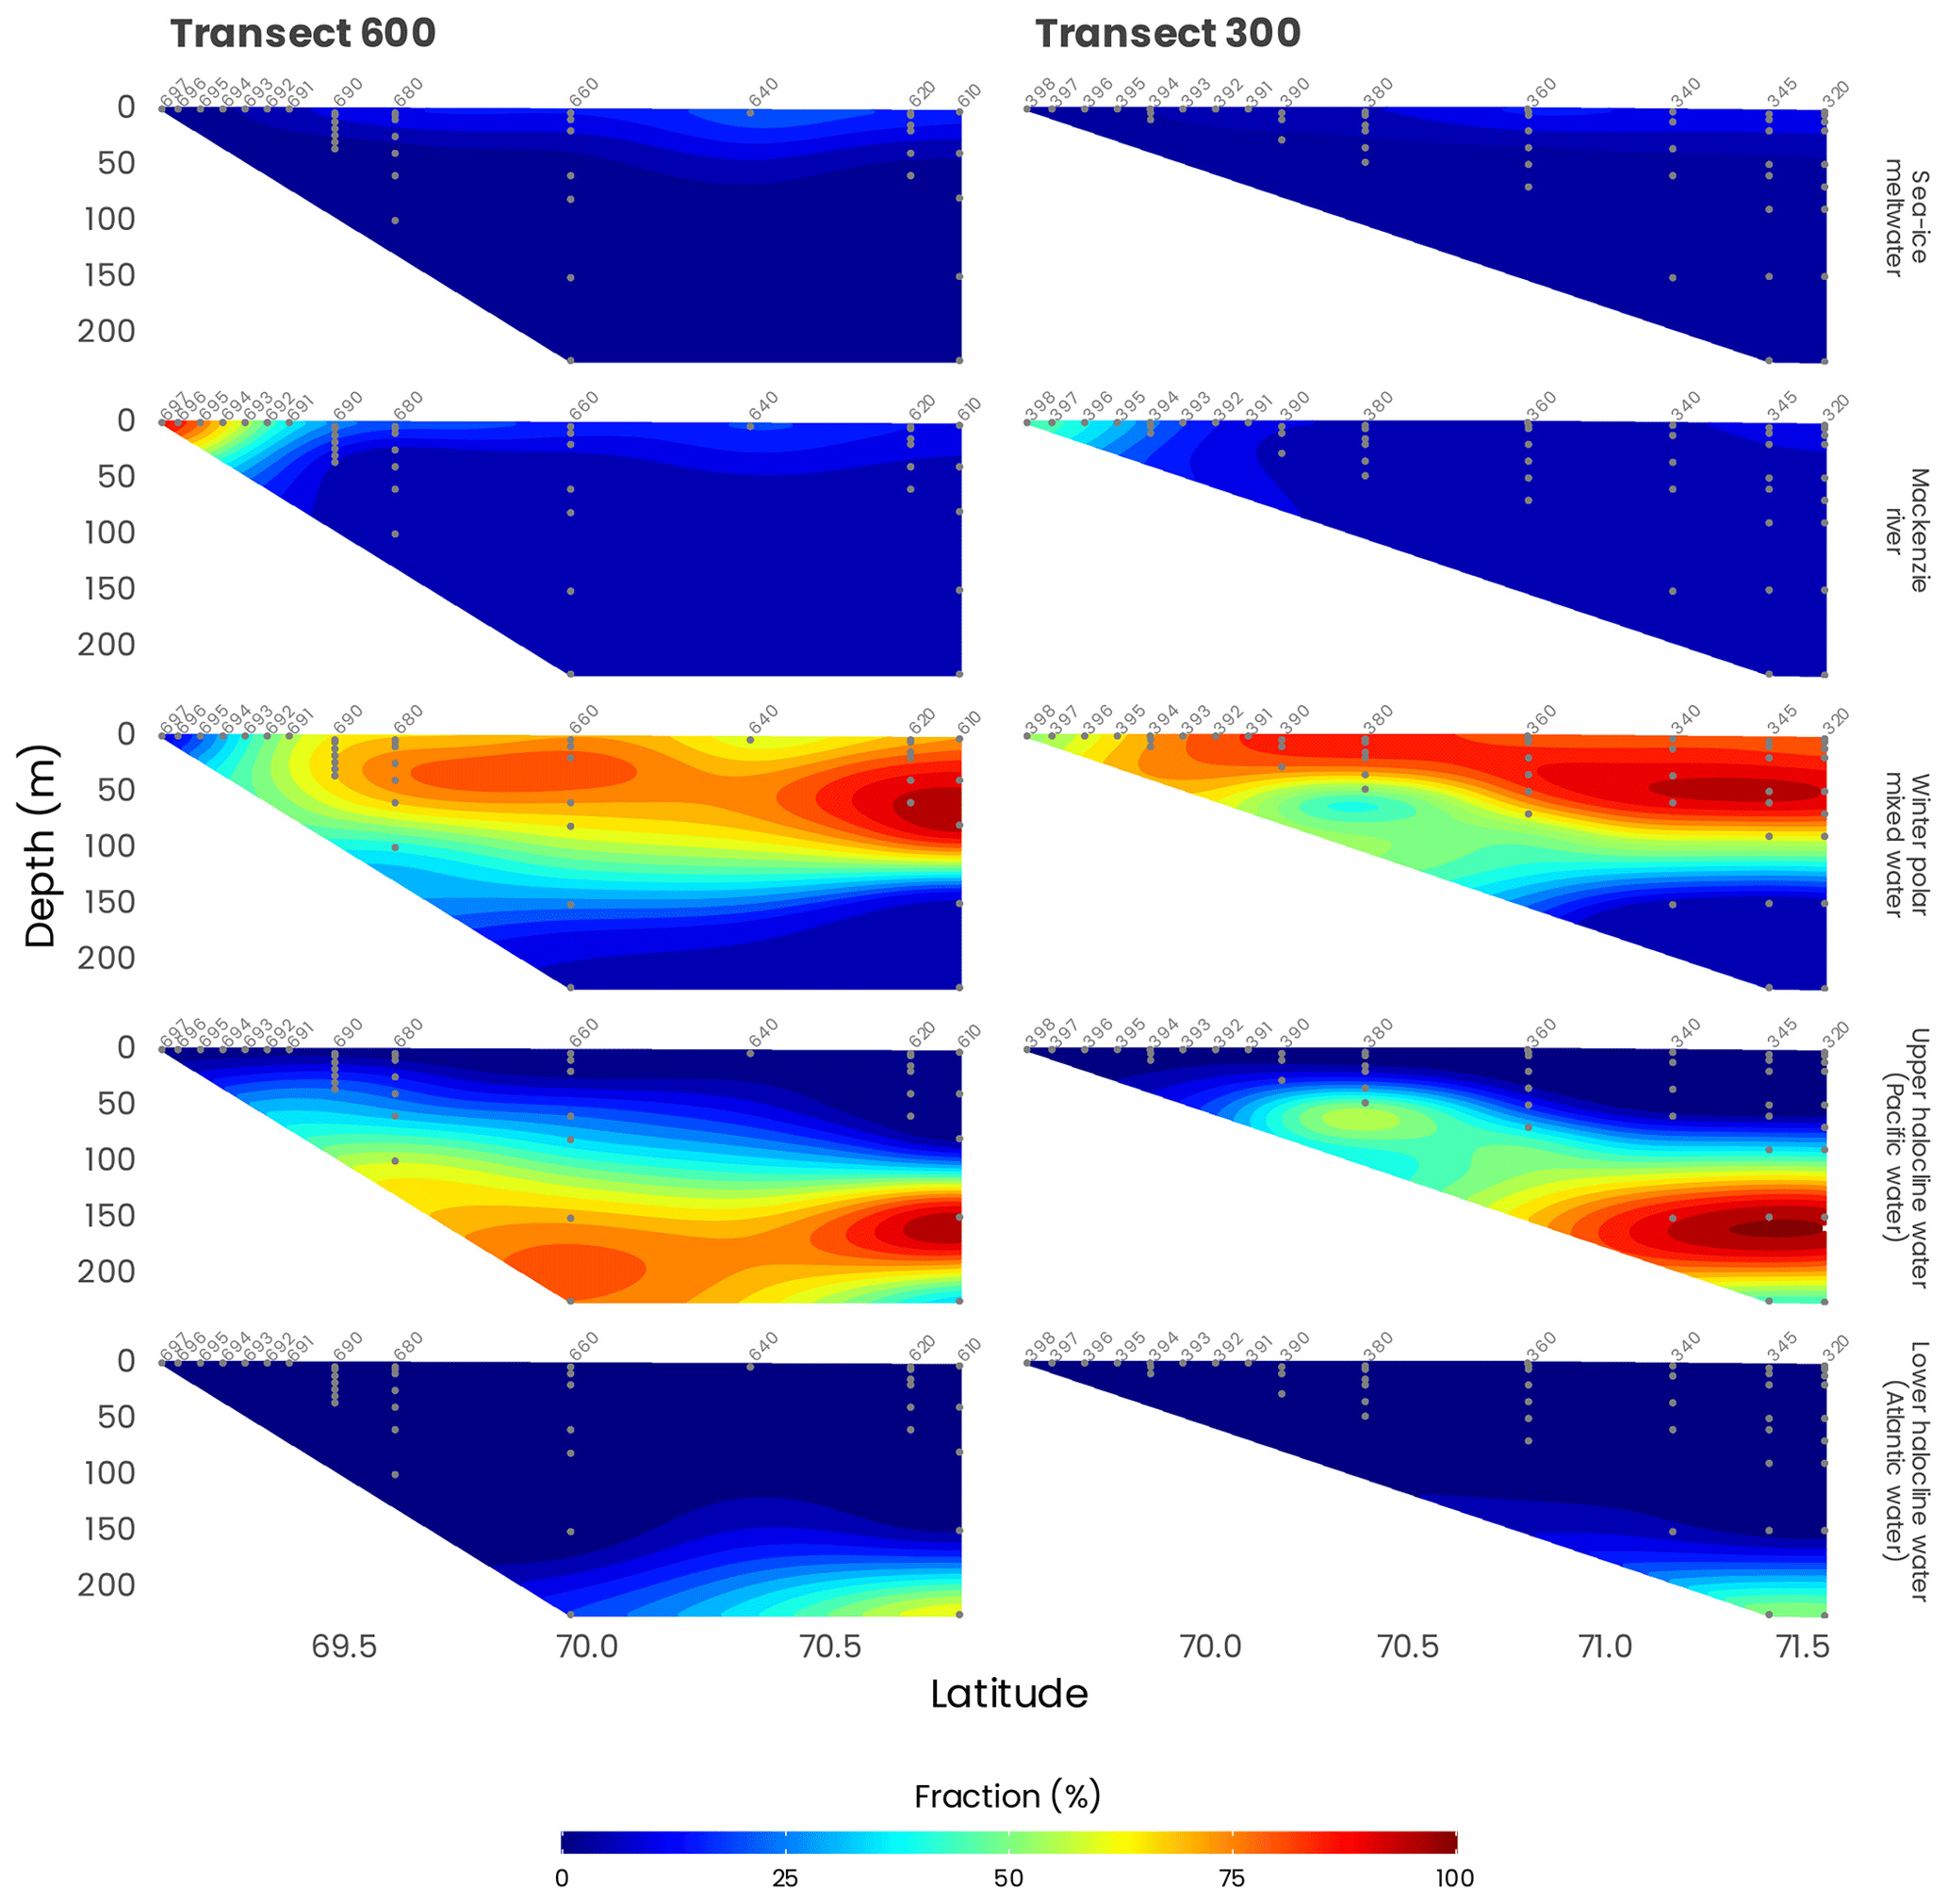
Figure 4Distribution of source water types along transects 600 and 300 (see Fig. 1). Station numbers are identified in light gray on top of each panel.
4.2 Temperature and salinity from the CTD
Temperature and salinity for the first 100 m of transects 600 and 300, the two transects originating from the Mackenzie River delta, are presented in Fig. 5. They confirm what was found by the water mass analysis (Sect. 4.1): most of the freshwater is coming from the western part of the Mackenzie River delta. This is also in accordance with many studies that documented that during the summer, a combination of ice melting and river runoff was generating a highly stratified surface layer (Carmack and Macdonald, 2002; Forest et al., 2013). The signature of an eddy may be observed at 75 m in the salinity data at 70∘ N, approximately 70 km from shore (Fig. 5b).
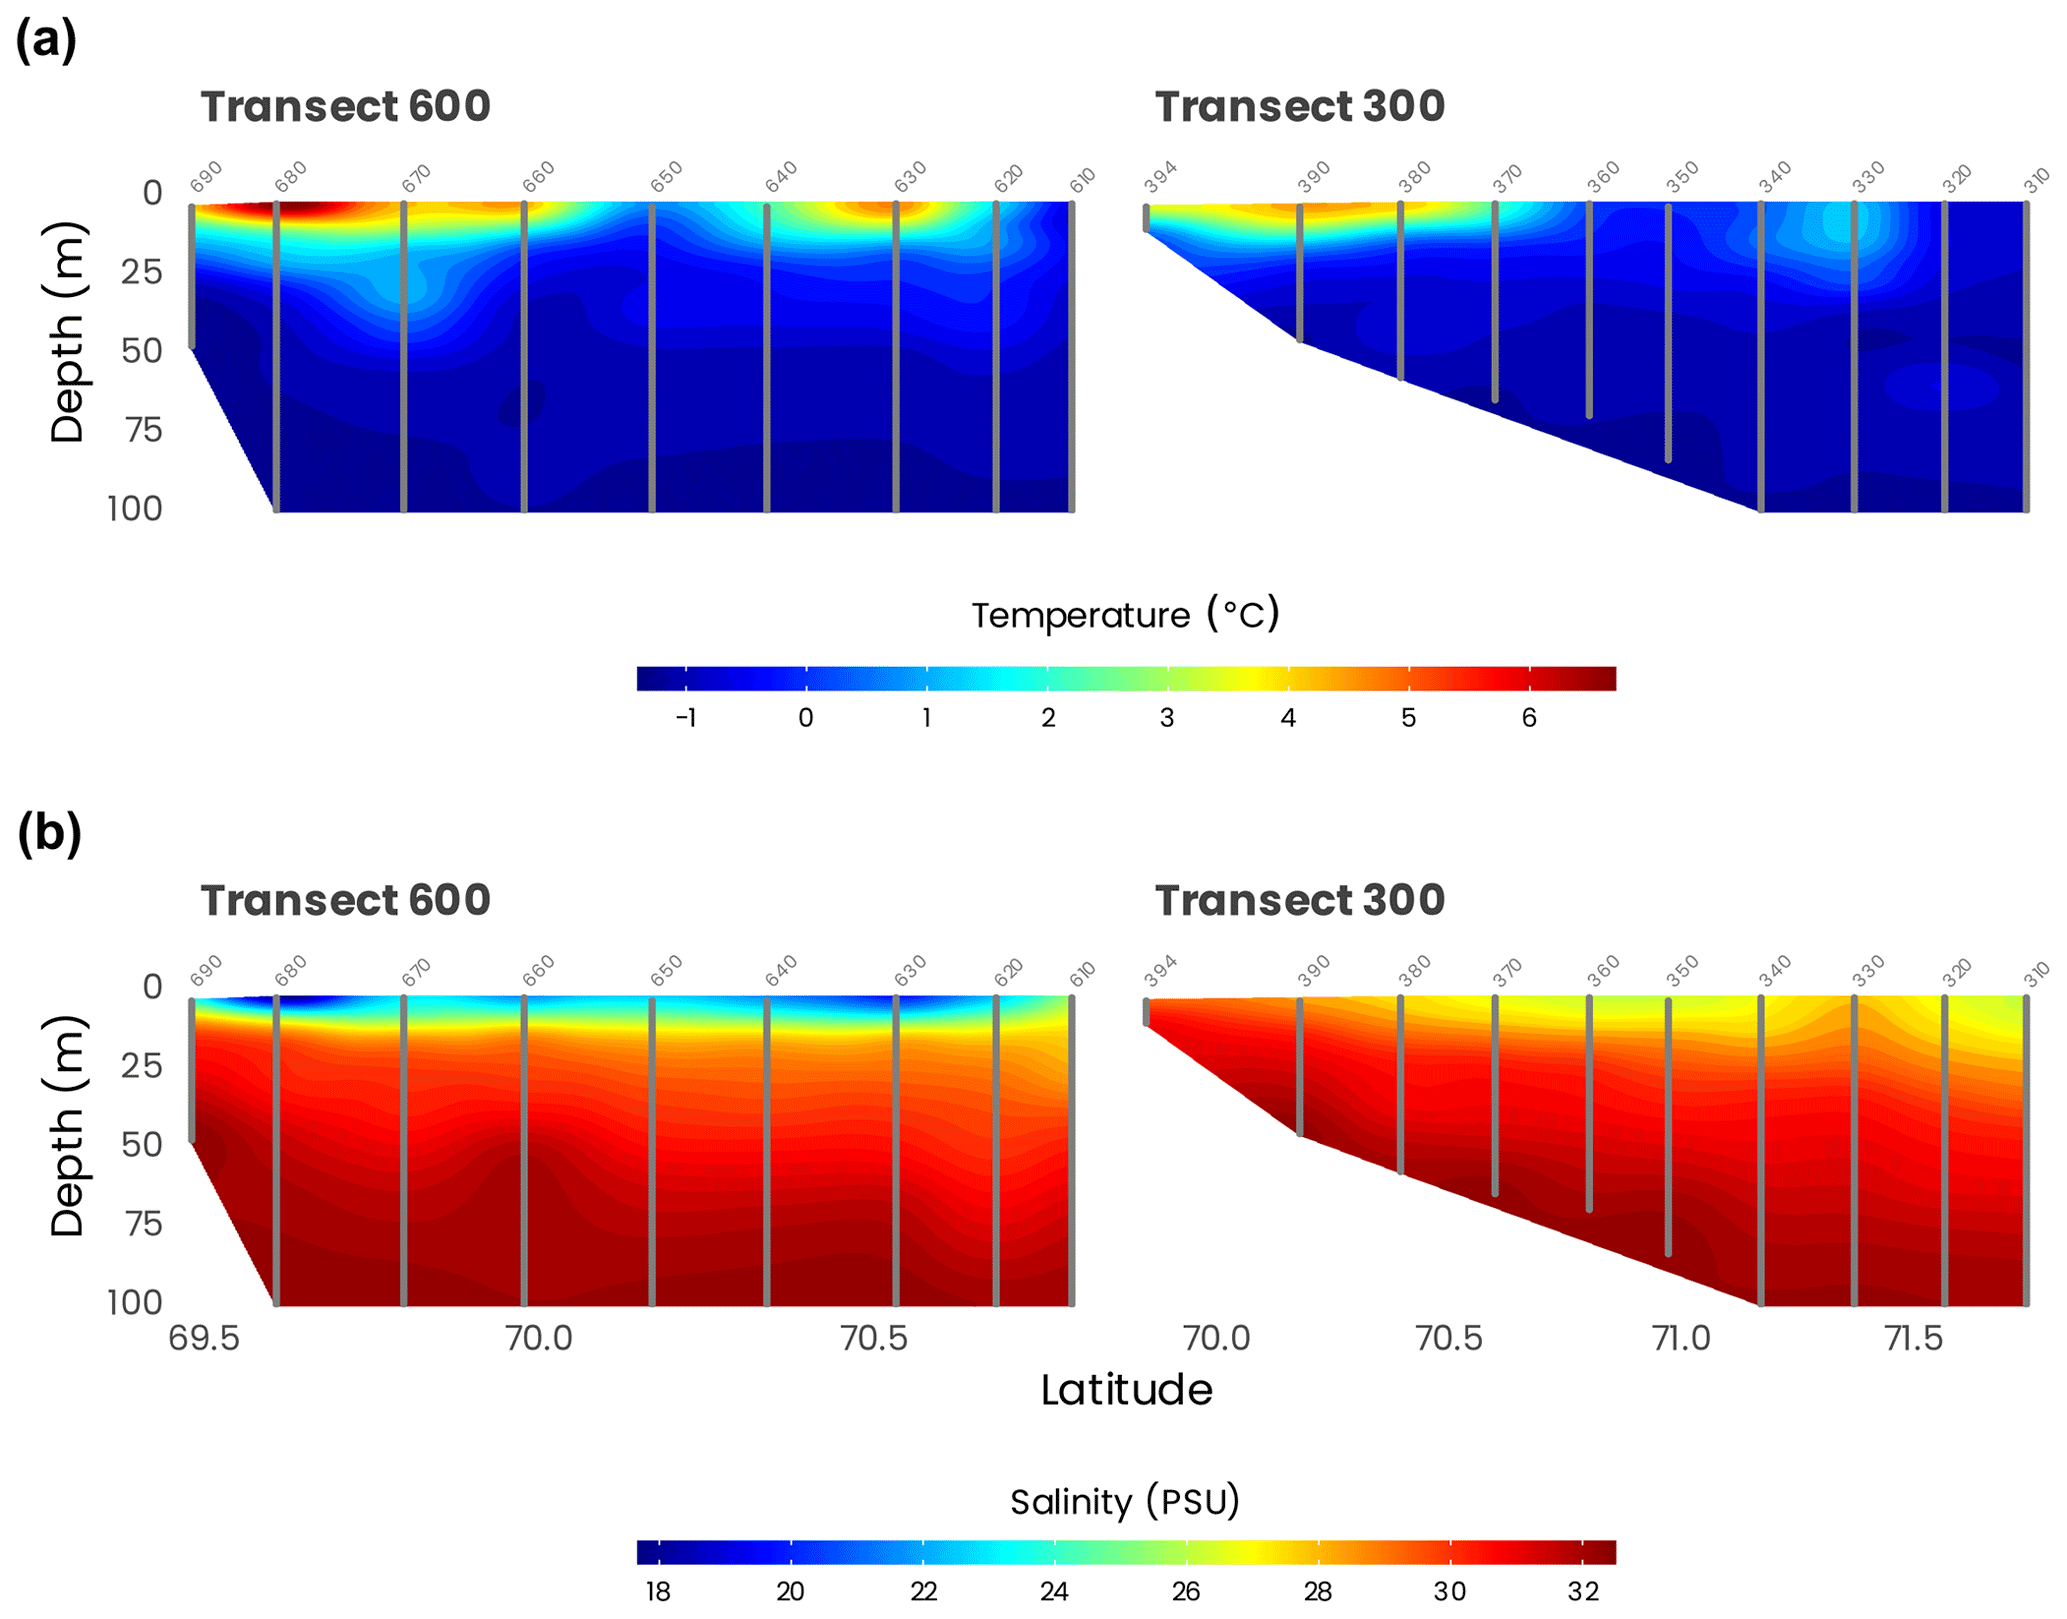
Figure 5Cross-sections of temperature (a) and salinity (b) measured by the CTD (gray dots) along transects 600 and 300. Station numbers are identified in light gray on top of each panel.
4.3 Underwater bio-optical data
4.3.1 Inherent optical property (IOP) profiling from the ship, the barge and the zodiac
The total, non-water, spectral absorption (a), attenuation (c) and backscattering (bb) coefficients were measured using an AC9 attenuation and absorption meter and a BB9 scattering meter (Wetlabs), a HydroScat-6, and a-Beta sensors (HOBI Labs) either attached to the CTD rosette frame onboard the CCGS Amundsen or deployed separately from the barge or the zodiac tender. These devices were using either 10 or 25 cm optical path lengths, depending on the turbidity of the water sampled. Detailed information about the deployment and the data processing of the IOP data can be found in Doxaran et al. (2012a).
Figure 6 shows cross-sections of the total absorption and backscattering coefficients at 440 nm (a(440) and bb(440)), derived as , where bbw is the backscattering coefficient of pure seawater (Morel, 1974). Both a(440) and bb(440) showed the same patterns along the transects 600 and 300. Close to the estuary, higher absorption (Fig. 6a) and total scattering (Fig. 6b) can be observed at the surface, likely reflecting the important quantities of dissolved and particulate organic matter delivered by the Mackenzie River. Higher values are also observed in transect 600 compared to transect 300, which is farther away from the mouth of the Mackenzie River. Both a(440) and bb(440) decreased rapidly toward higher latitudes, where the water of the Mackenzie River mixes with seawater from the Beaufort Sea.
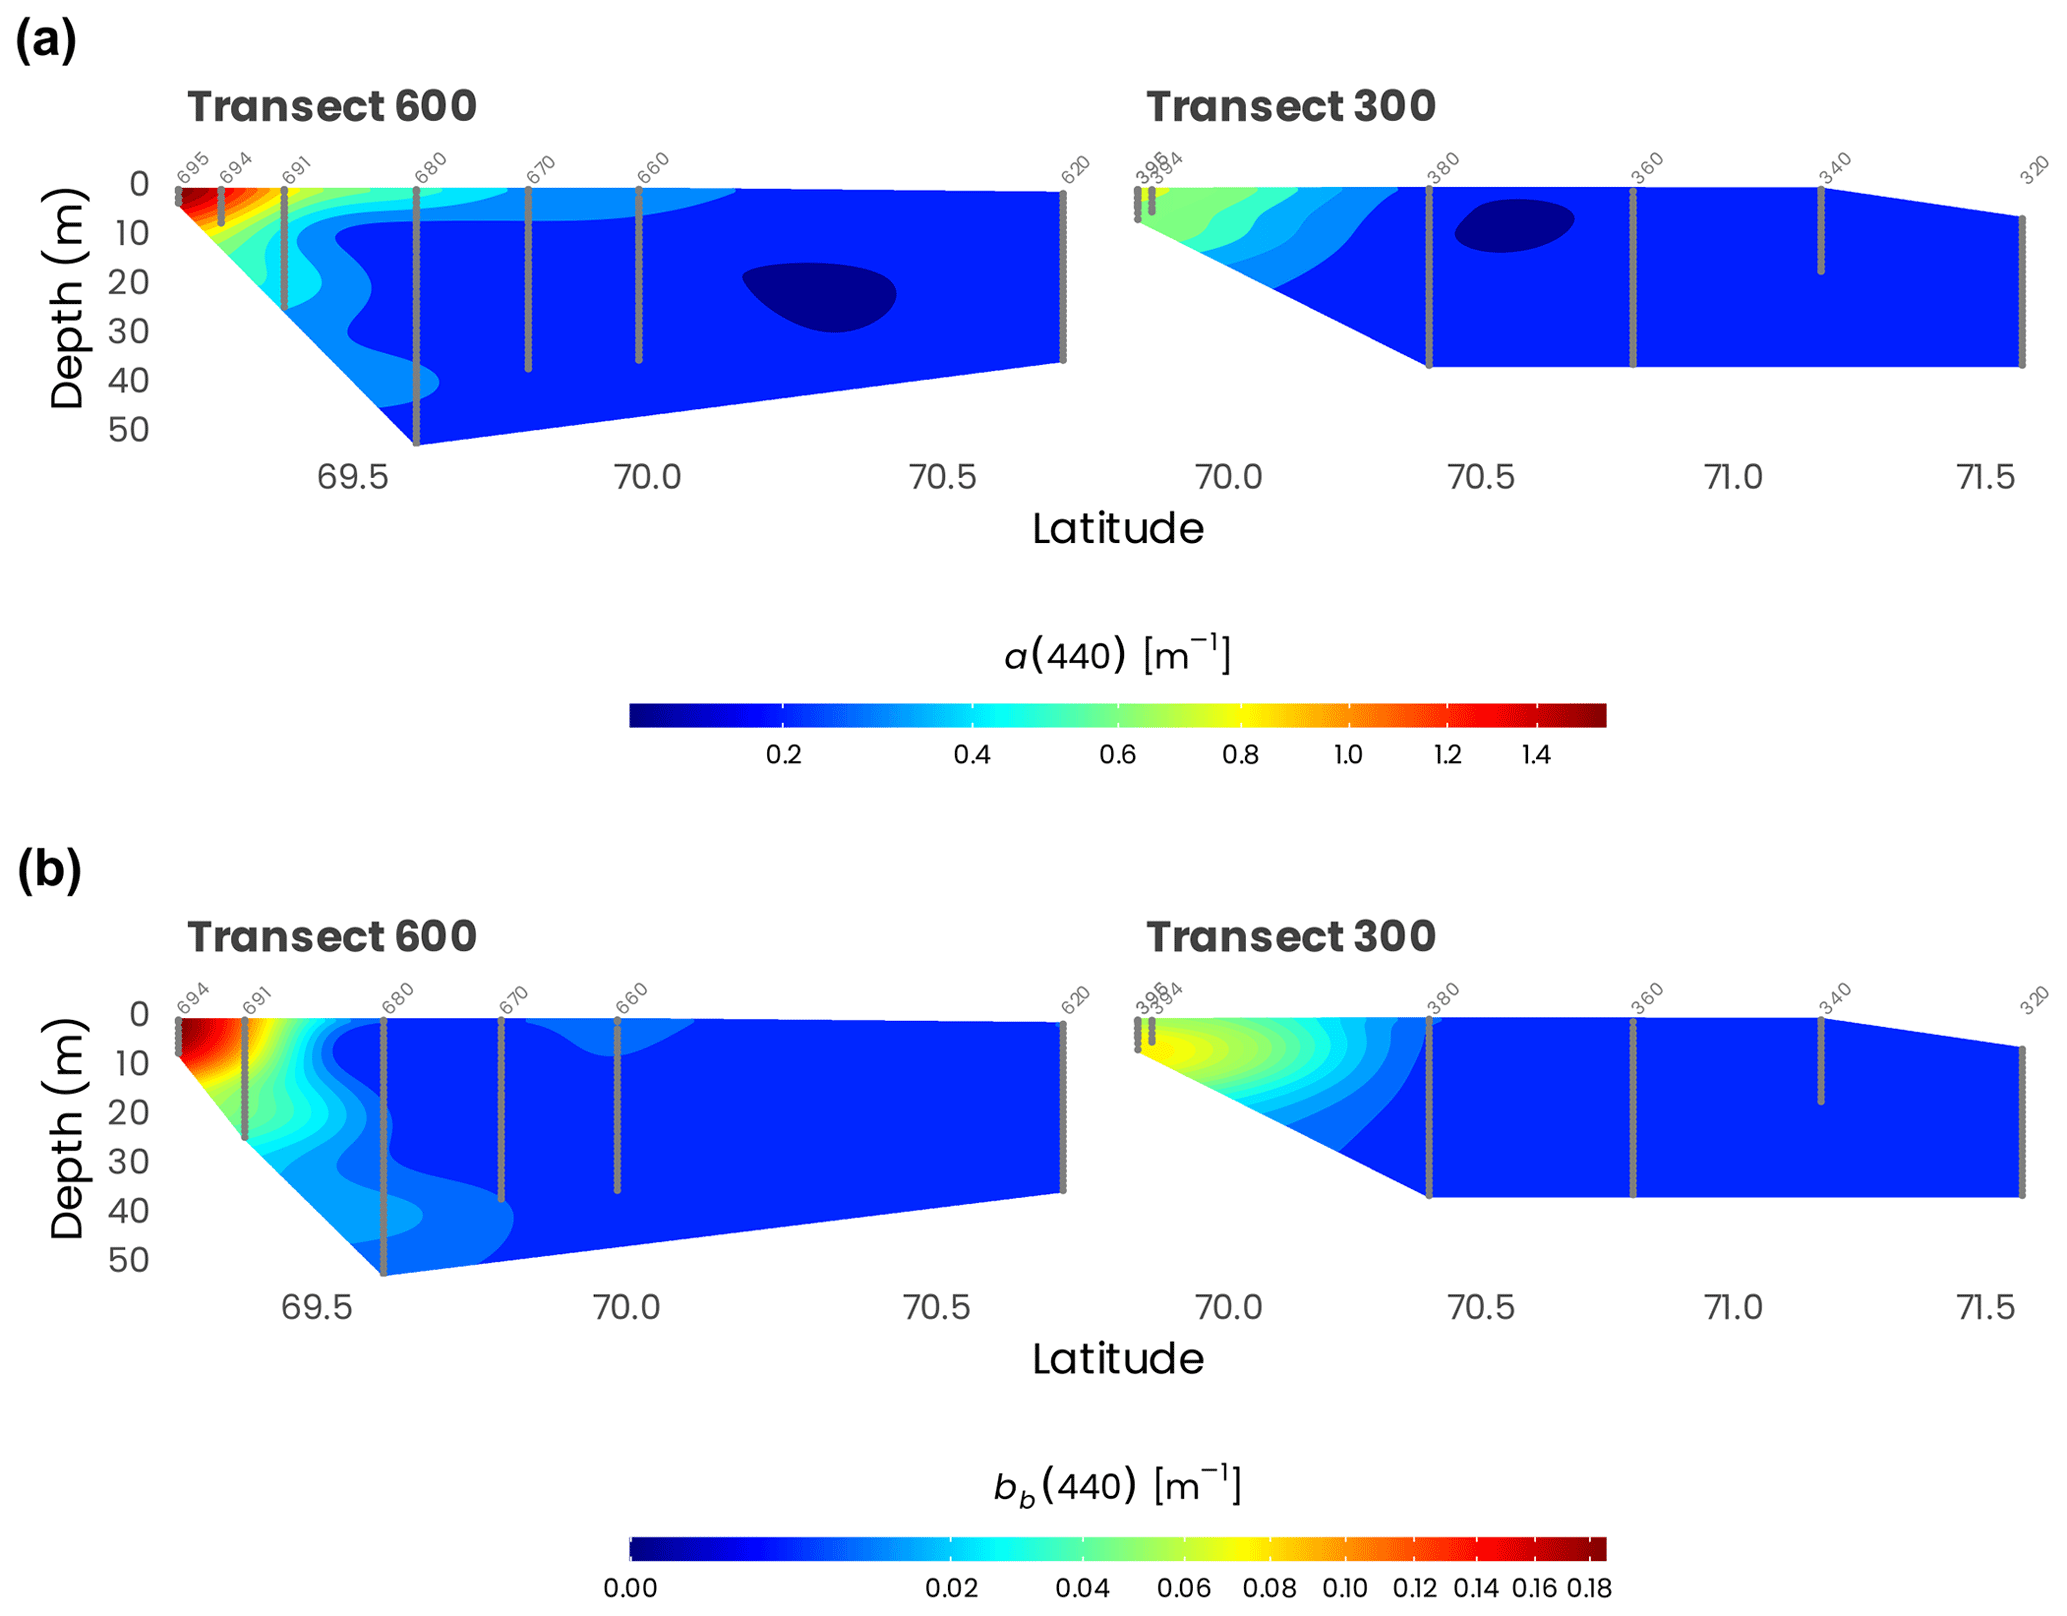
Figure 6Cross-sections of (a) absorption (a(440)) and (b) total scattering (bb(440)) measured from the barge at 440 nm with an AC9 and BB9, respectively, along transects 600 and 300. Station numbers are identified in light gray on top of each panel. Note that the data have been square-root-transformed for the visualization.
4.3.2 Particulate and CDOM absorption
Chromophoric dissolved organic matter absorption (aCDOM) was measured from water samples filtered with 0.2 µm GHP (glass fiber hydrophilic polypropylene) filters (Acrodisc Inc.) using an UltraPath (World Precision Instruments Inc.) between 200 and 735 nm. In most cases, a 2 m optical path length was used for the measurement, except for coastal waters near the Mackenzie River mouth (Fig. 1), where a 0.1 m optical path length was used. Particulate absorption (ap) was measured using a filter-pad technique modified from Röttgers and Gehnke (2012). Briefly, seawater was filtered through a 25 mm Whatman GF/F (glass fiber filters) less than 3 h after sampling. Filters were placed in the center of a 150 mm integrating sphere equipped with a handmade Spectralon filter holder. The spectral optical density (OD(λ)) of the particles retained on the filter was then measured using a PerkinElmer Lambda-19 spectrophotometer from 300 to 800 nm at 1 nm resolution. More details about particulate- and dissolved-absorption measurements can be found in Röttgers and Gehnke (2012), Bélanger et al. (2013b), and Matsuoka et al. (2012a).
Examples of aCDOM spectra measured at the surface for the northernmost and the southernmost stations of transects 600 and 300 are presented in Fig. 7a. The marked influence of the organic matter of terrestrial origin can be observed for the stations located at the mouth of the Mackenzie River (697 and 398). Because the organic matter delivered by the river is highly humic and colored, the absorption at 254 nm was approximately 15 times higher at the southern shelf stations for both transects compared to the northern stations (620 and 320). Likewise, the specific UV absorbance of dissolved organic carbon at 254 nm (SUVA254), a metric commonly used as a proxy for assessing both chemical (Weishaar et al., 2003; Westerhoff et al., 2004) and biological reactivity (Berggren et al., 2009; Asmala et al., 2013) of the dissolved organic matter (DOM) pool in natural aquatic ecosystems, decreased rapidly along the south–north gradient in both transects 600 and 300 (Fig. 7c). This observation is in accordance with a previous study that showed that SUVA254 was higher in inland ecosystems due to elevated lateral connectivity with the surrounding terrestrial landscape and organic-matter inputs from the tributaries (Massicotte et al., 2017). The decrease in SUVA254 toward northern stations (Fig. 7c) suggests that terrestrially derived DOM transiting toward the ocean is gradually degraded into smaller and more refractory molecules.
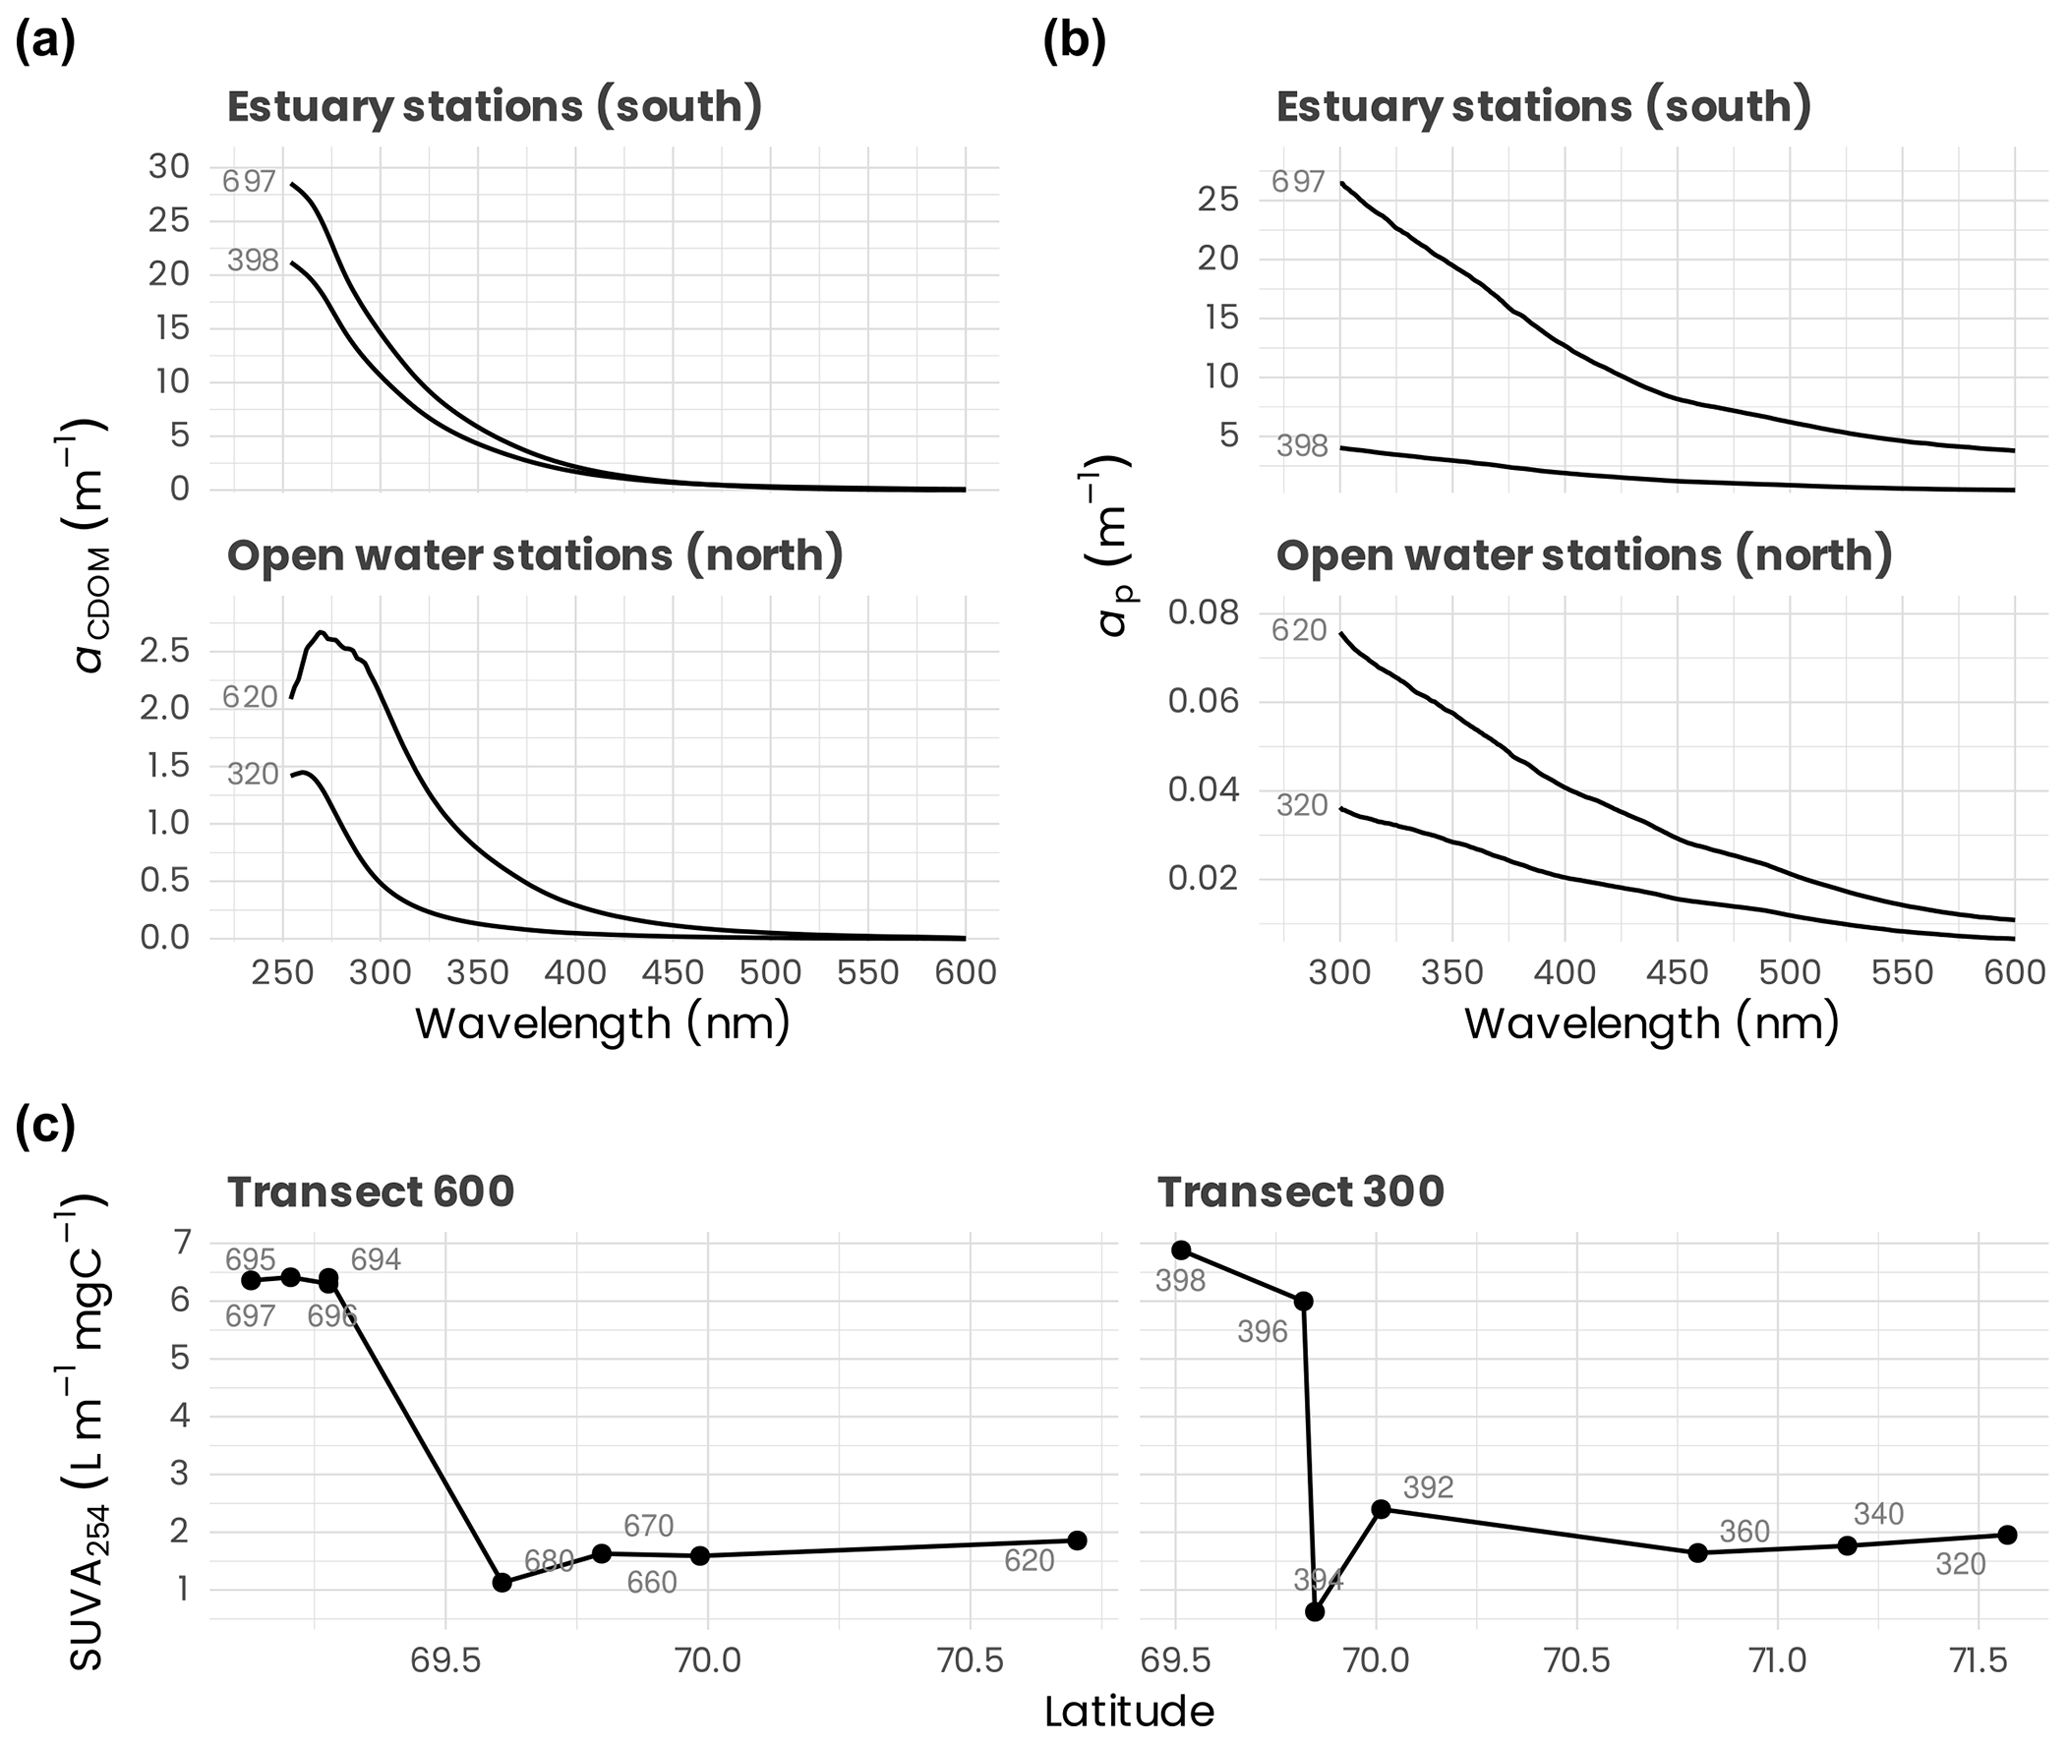
Figure 7(a) Absorption spectra between 254 and 600 nm of chromophoric dissolved organic matter (aCDOM) measured at the surface for the northern (620, 320) and southern (697, 398) stations of the transects 600 and 300. (b) Particulate-absorption spectra (ap) measured between 300 and 600 nm measured at the surface for the northernmost and the southernmost stations of the transects 600 and 300. (c) Specific UV absorbance at 254 nm (SUVA254, i.e., absorption of light at 254 nm per unit of carbon) at surface for stations along transects 600 and 300. Stations are identified in light gray (see Fig. 1 for an overview of the station locations). Note the difference in the y axes used in panels (a) and (b), which highlights the important differences in dissolved and particulate absorption between stations in the estuary and those offshore.
Particulate-absorption spectra (ap) for the northernmost and the southernmost stations of transects 600 and 300 are presented in Fig. 7b. Particulate absorption at the stations located in the estuary (697 and 398) was much higher than that measured at the open-water stations (620 and 320). For instance ap(443) measured at stations 620 (0.03 m−1) and 697 (8.62 m−1), the northernmost and the southernmost stations of transects at the mouth of the Mackenzie River, shows that ap decreases rapidly along the latitudinal axes. This can be possibly explained because the drained organic and inorganic material from the surrounding landscape of the Mackenzie's watershed is degraded or sediments rapidly as it is transferred to the ocean.
4.3.3 Other optical measurements and radiometric quantities
Other optical instruments were attached to the rosette sampler. These include a transmissometer (Wetlabs C-Star, path 25 cm) for beam attenuation measurement, a chlorophyll fluorometer (Seapoint) and a CDOM fluorometer (Optic & Mikro Elektronik, Germany; see Amon, 2003). Additionally, a LISST-100X (laser in situ scattering and transmissometry, Sequoia Scientific) was attached to the rosette and provided beam attenuation (532 nm) and forward light scattering measurements at 32 angles, from which particle size distribution was estimated. Various optical measurements were also made in the laboratory to determine other IOPs. These include the absorption of colored dissolved (aCDOM) and particulate (ap) organic matter and the absorption coefficients of non-algal particles (aNAP) and phytoplankton (aphi). Apparent-optical-property (AOPs) measurements included light transmittance (T), photosynthetically available radiation (PAR), downward irradiance (Ed), upwelled radiance (Lu) and global solar irradiance (Es). The latter three radiometric quantities were measured simultaneously using a compact optical-profiling system (C-OPS) manufactured by Biospherical Instruments Inc. (San Diego, California) that was deployed during MALINA Leg 2b. The principal data products obtained from the C-OPS data were the diffuse attenuation coefficient (Kd) plus the water-leaving radiance (LW), including all normalized forms. Detailed methodology and results derived from C-OPS measurements can be found in Doxaran et al. (2012a), Antoine et al. (2013a), Bélanger et al. (2013b) and Hooker et al. (2013).
4.4 Nutrients
Samples for nitrate, nitrite, soluble reactive phosphorus and silicate determination were collected into 20 mL polyethylene flasks, immediately poisoned with mercuric chloride (Kirkwood, 1992) and stored for subsequent laboratory analysis according to Raimbault et al. (1990) and Aminot and Kérouel (2007). Ammonium concentrations (40 mL collected into 60 mL polycarbonate tubes) were measured onboard using the sensitive method of Holmes et al. (1999), with a detection limit of 5 nmol L−1. Samples for organic-matter determination were collected into 50 mL glass Schott bottles, immediately acidified with 100 µL of 0.5 N H2SO4 and stored in the dark at 5 ∘C. Dissolved organic carbon (DOC), dissolved organic nitrogen (DON) and dissolved organic phosphorus (DOP) were determined at the laboratory using the wet-oxidation procedure according to Raimbault et al. (1999b).
Nitrate levels were always very low at the surface, with concentration generally lower than 0.01 µmol L−1, except in the Mackenzie plume (Fig. 8). It is interesting to note that nitrate was never entirely depleted, and some traces (0.005 to 0.01 µmol L−1) were always detectable in surface waters (Fig. 8a). Ammonium distribution showed the same pattern. Even if concentrations were very low (generally < 0.03 µmol L−1), this nutrient, like nitrate, was always detected, suggesting that in situ sources of nitrate and ammonium exist offshore, certainly due to biological processes. Phosphate concentrations showed the opposite distribution (Fig. 8b). Despite nitrogen depletion, surface waters were always phosphate-replete. The highest concentrations, around 0.5 µmol L−1, were observed far from Mackenzie’s mouth, revealing a clear west–east gradient. The silicate distribution was similar to that of nitrate. But surface waters were always silicate-replete, with concentrations largely above the detection limit (> 4 µmol L−1). The impact of the Mackenzie River was clear close to the coast for inorganic nutrients and farther offshore for dissolved organic nutrients. A quarter of the estimated annual nutrient supply by the Mackenzie River occurred during July–August. The supply of DON was 8 times larger than that of nitrate-N. By contrast, the amount of DOP supplied was only 2.5 times higher than the amount of phosphate (Tremblay et al., 2014). The Mackenzie River enriched the western Canadian Beaufort Shelf with inorganic and organic N, potentially supporting most of the primary production but not with phosphate or ammonium. Large deliveries of N relative to P by rivers relax coastal communities from N limitation, allowing them to tap into the excess P originating from the Pacific Ocean. Then, river inputs locally rectified the strong regional deficit of inorganic N, i.e., negative N* (Tremblay et al., 2014).
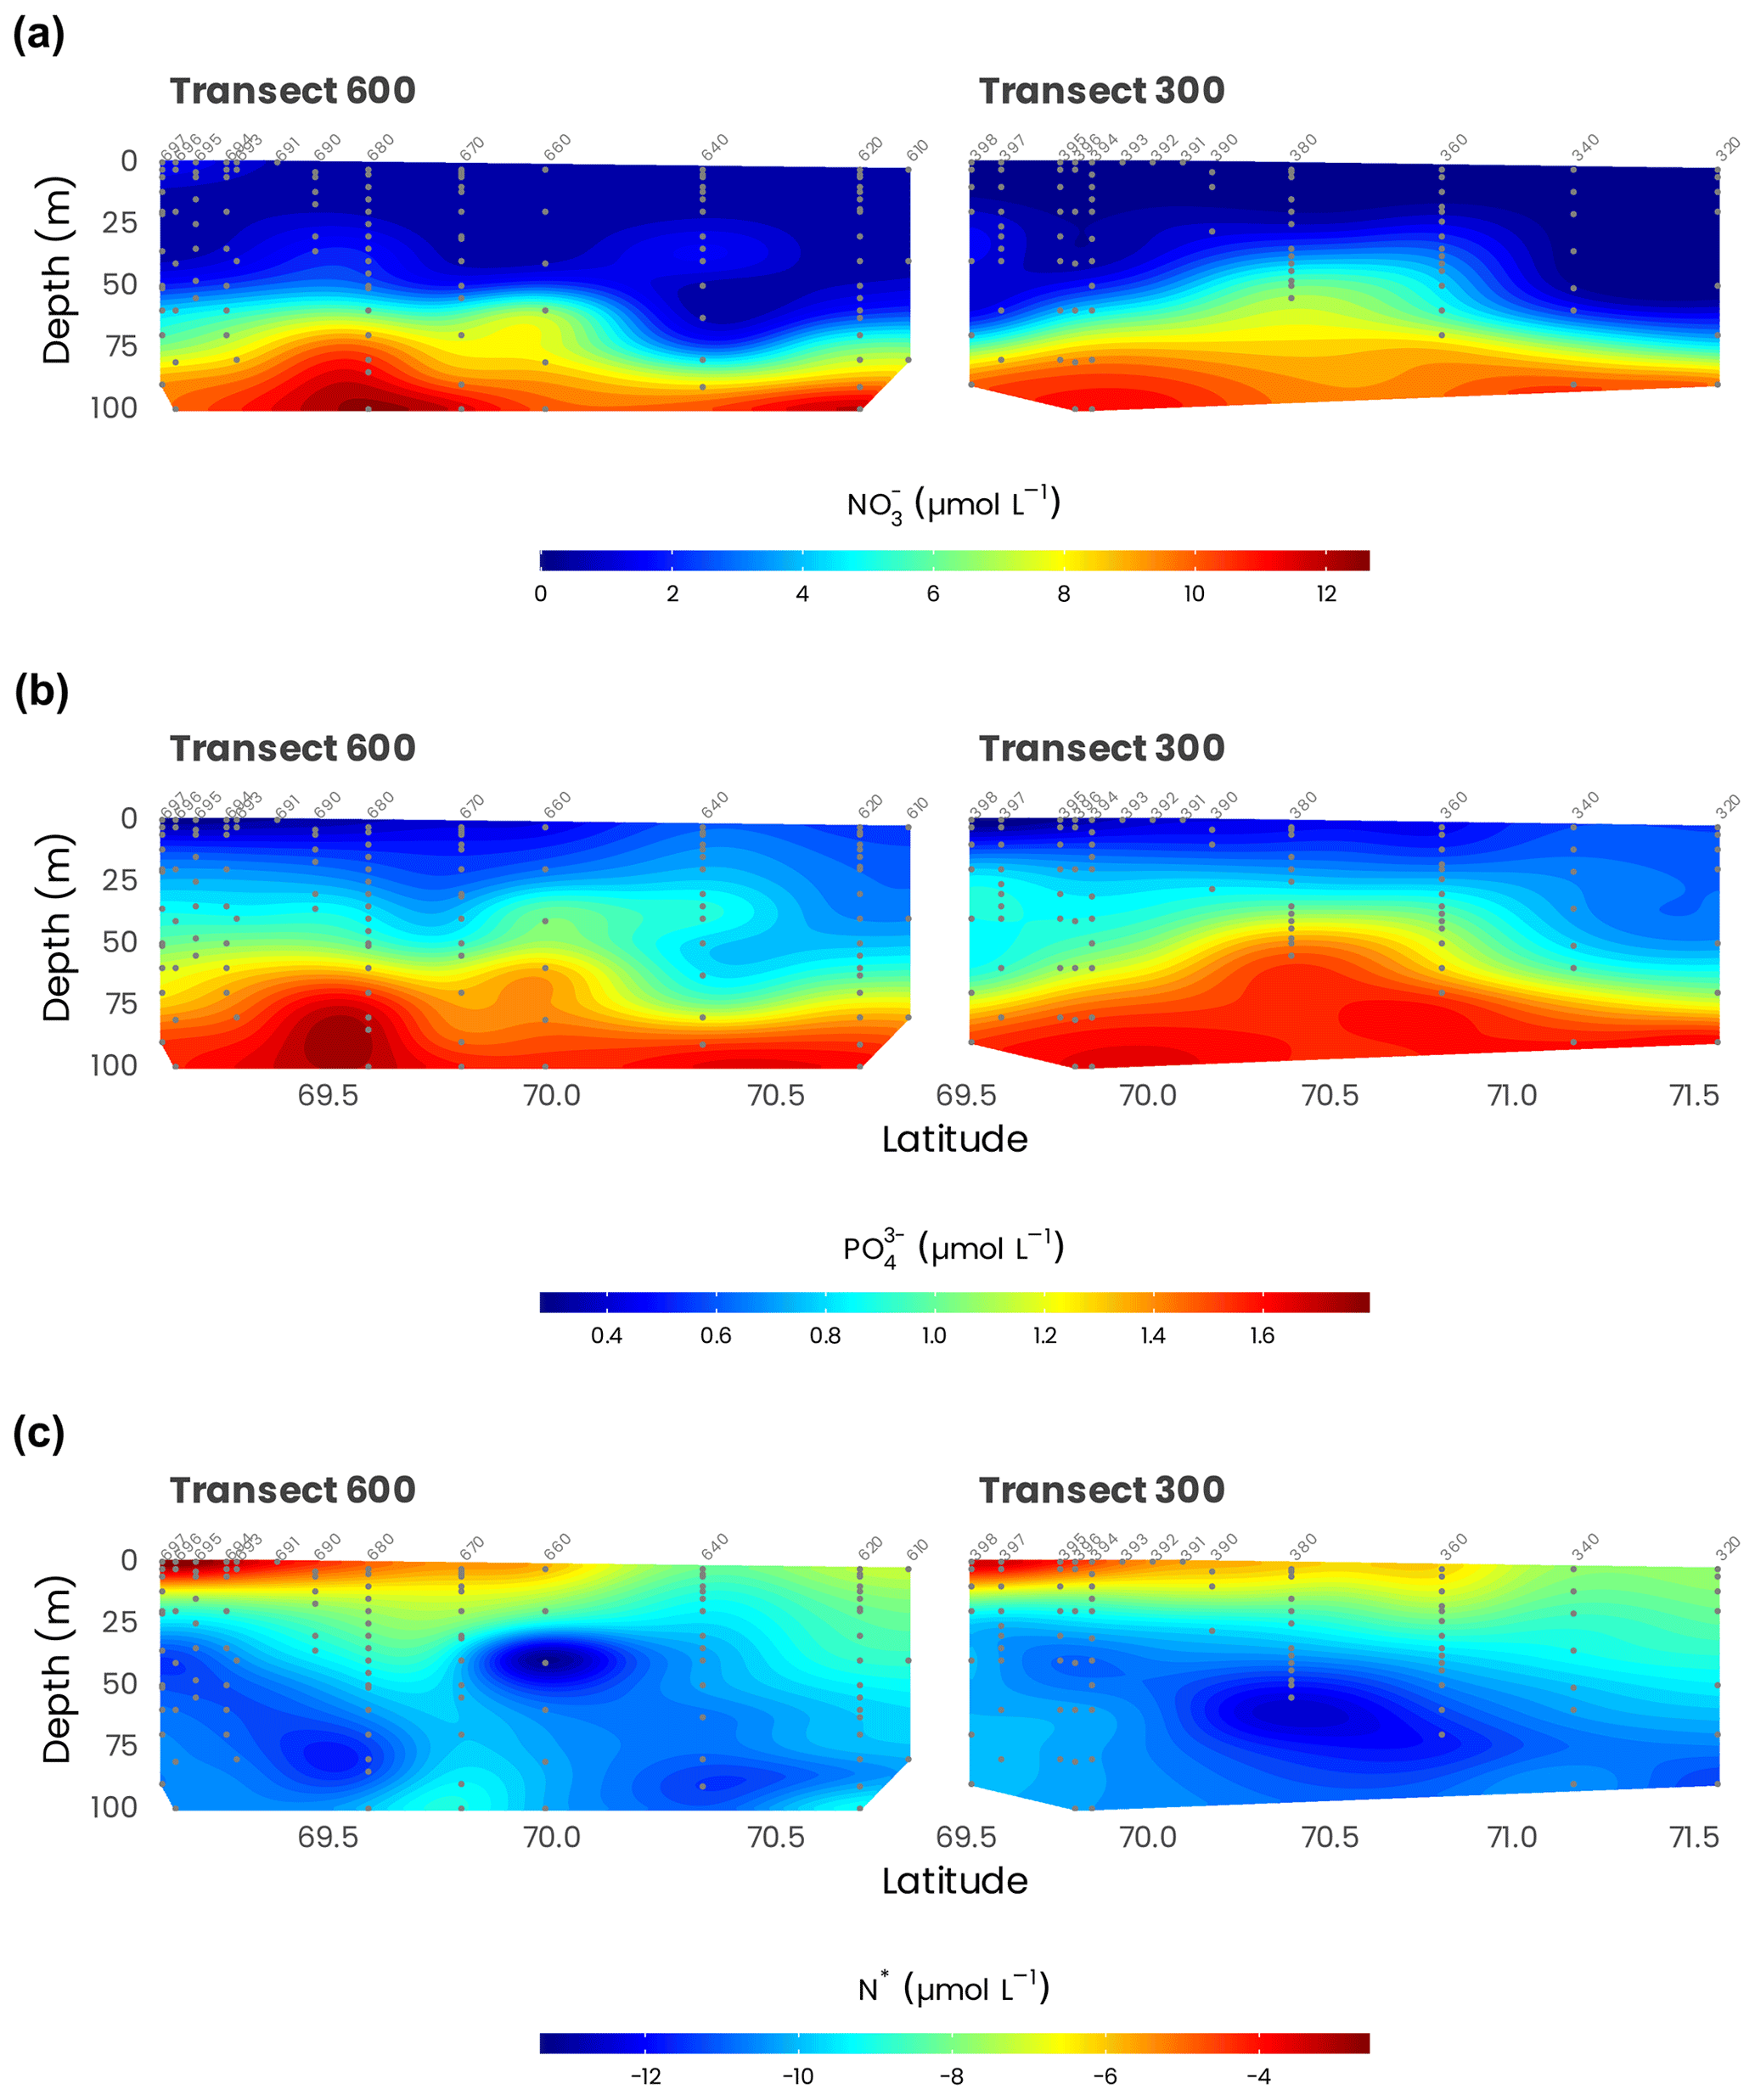
Figure 8Cross-sections of (a) NO and (b) PO measured from Niskin bottles (gray dots) along transects 600 and 300. (c) N* defined as N−rP, with (see the text for the details). Station numbers are identified in light gray on top of each panel.
4.5 Dissolved organic carbon, total dissolved nitrogen, total hydrolyzable amino acids and total dissolved lignin phenols
Water samples were collected at selected stations and water masses for analyses of dissolved organic carbon (DOC), total dissolved nitrogen (TDN), total hydrolyzable amino acid (THAA) and total dissolved lignin phenol (TDLP9) concentrations. Samples for DOC, TDN and THAAs were gravity-filtered from Niskin bottles using pre-combusted (GF/F) filters (0.7 µm pore size) and stored frozen (−20 ∘C) immediately after collection in pre-combusted borosilicate glass vials (Shen et al., 2012). Samples for TDLP9 analysis (between 1 and 10 L) were gravity-filtered from Niskin bottles using Whatman Polycap AS cartridges (0.2 µm pore size), acidified to pH between 2.5 and 3 with sulfuric acid, and extracted within a few hours using C-18 cartridges (Louchouarn et al., 2000; Fichot et al., 2013). The C-18 cartridges were stored at 4 ∘C until elution with 30 mL of methanol (high-precision-liquid-chromatography-grade, HPLC-grade), and the eluent was stored in sealed, pre-combusted glass vials at −20 ∘C until analysis. DOC and TDN concentrations were measured by high-temperature combustion using a Shimadzu total-organic-carbon analyzer (TOC-V) equipped with an inline chemiluminescence nitrogen detector and an autosampler (Benner and Strom, 1993). Blanks were negligible, and the coefficient of variation between injections of a given sample was typically less than 1 %. Analysis of a deep-seawater reference standard (University of Miami) every sixth sample was used to check the accuracy and consistency of measured DOC and TDN concentration. THAAs were determined as the sum of 18 dissolved amino acids using an Agilent high-performance liquid chromatography system equipped with a fluorescence detector (excitation: 330 nm; emission: 450 nm). Samples (100 µL) of filtered seawater were hydrolyzed with 6 mol L−1 hydrochloric acid using a microwave-assisted vapor-phase method (Kaiser and Benner, 2005). Free amino acids liberated during the hydrolysis were separated as o-phthaldialdehyde derivatives using a LiCrospher RP-18 or Zorbax SB-C18 column (Shen et al., 2012). Detailed methodological information can be found in Fichot et al. (2013) and Shen et al. (2012).
Surface DOC concentrations along the transects 300 and 600 behaved approximately conservatively with salinity, decreasing from 458 µmol L−1 in the Mackenzie River end-member (salinity =0.2 PSU) to 123 µmol L−1 at a salinity of 26.69 PSU (Fig. 9a). DOC concentrations in surface waters further decreased to minimum values of ≈ 66 µmol L−1 offshore (Fichot and Benner, 2011). Concentrations generally increased by a few µmol L−1 in the upper halocline relative to surface values but then generally decreased with depth, reaching 53–57 µmol L−1 in the lower halocline and ≈ 43–50 µmol L−1 in deep water masses (depth > 1000 m). Similarly to DOC, surface TDLP9 concentrations along transects 600 and 300 behaved approximately conservatively with salinity, decreasing from ≈ 93–96 nmol L−1 in the Mackenzie River end-member (salinity =0.2 PSU) to ≈ 12 nmol L−1 at a salinity of 26.69 PSU (Fig. 9b). Surface concentrations reached minimum values of ≈ 2.5 nmol L−1 offshore (Fichot et al., 2016). TDLP9 concentrations generally decreased with depth, reaching minimum values of <1.5 nmol L−1 below the halocline. Surface concentrations of THAAs along the transects 600 and 300 decreased from 576 nmol L−1 in the Mackenzie River end-member (salinity = 0.2 PSU) to 317 nmol L−1 at a salinity of 26.69 PSU (Fig. 9c). Unlike DOC and TDLP9's, concentrations of THAAs did not follow a conservative mixing line along the salinity gradient. Elevated concentrations of THAAs were observed in mid-salinity waters in both transects, suggesting plankton production in these regions. In comparison, THAA concentrations in the slope and basin waters were lower and decreased with depth, reaching minimal values of ≈ 70 nmol L−1 below the halocline (Shen et al., 2012).
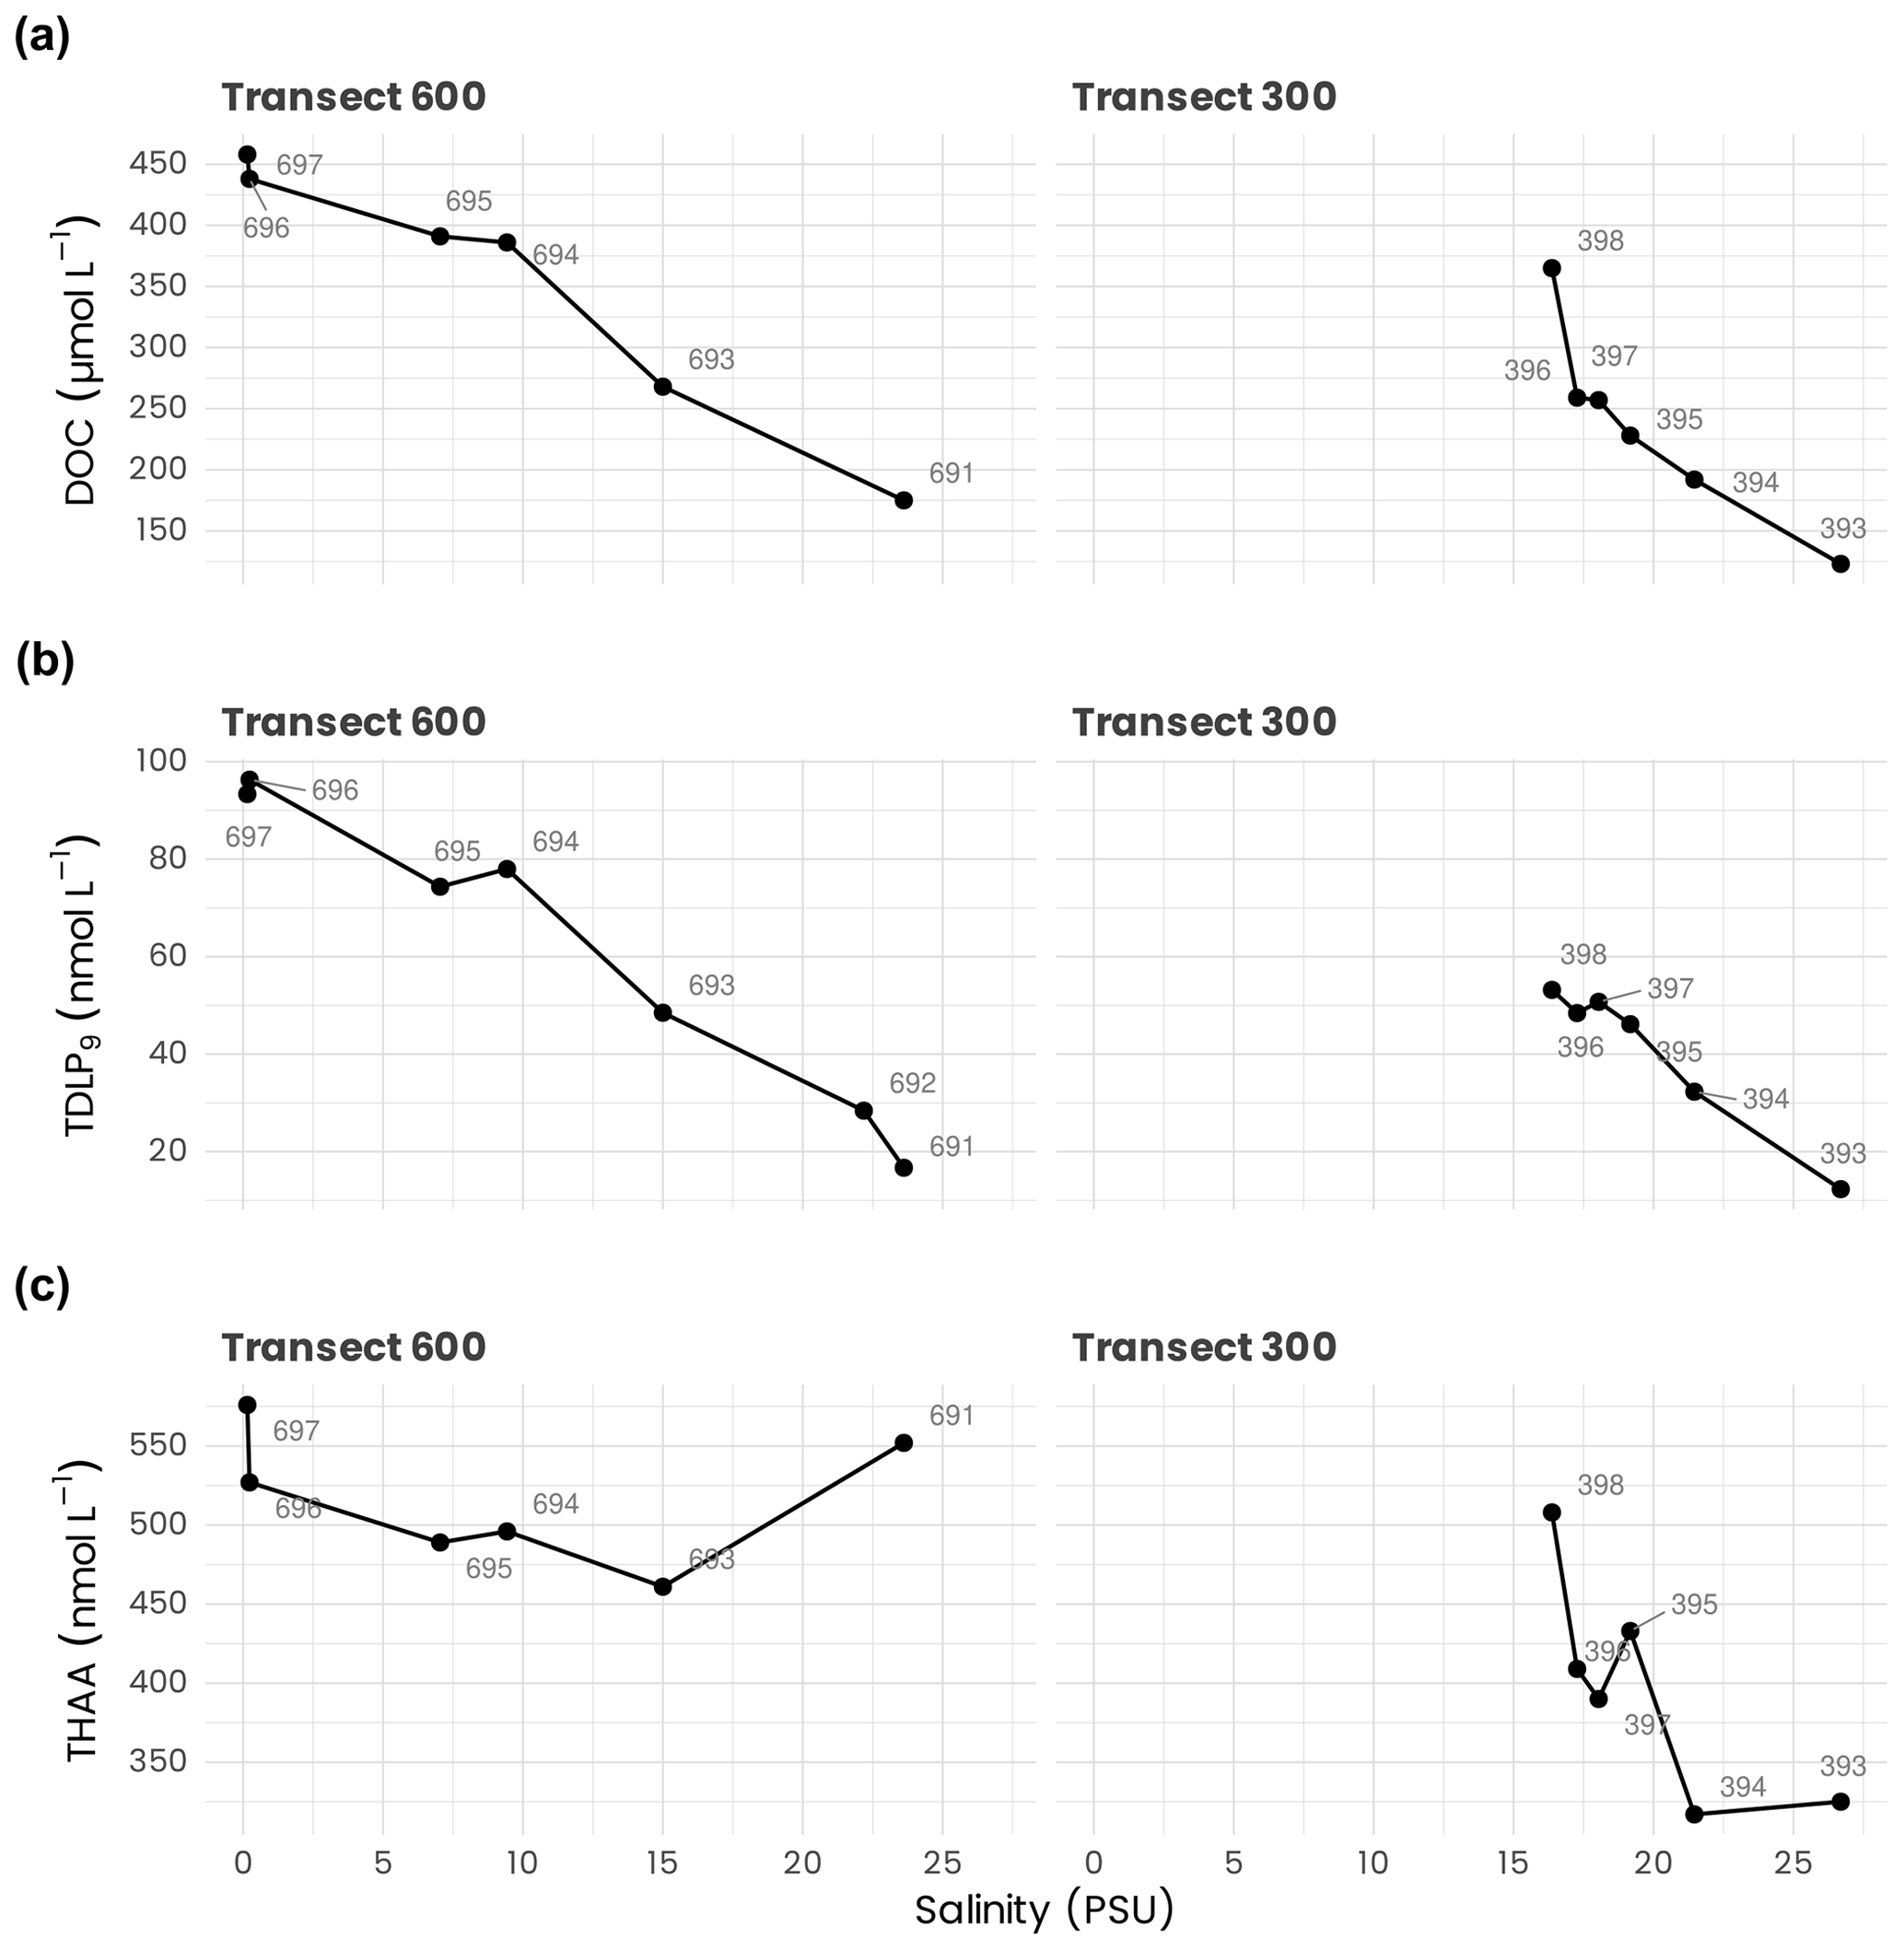
Figure 9Surface concentrations of (a) dissolved organic carbon (DOC), (b) total dissolved lignin phenols (TDLP9's) and (c) total hydrolyzable amino acids (THAAs) measured along transects 600 and 300 and plotted against salinity.
4.6 Pigments
Water samples (volumes between 0.25 and 2.27 L) were filtered through glass fiber GF/F filters (25 mm diameter, particle retention size 0.7 µm). They were immediately frozen at −80 ∘C, transported in liquid nitrogen and then stored at −80 ∘C until analysis on land. Samples were extracted in 3 mL HPLC-grade methanol for 2 h minimum. After sonication, the clarified extracts were injected (within 24 h) onto a reversed-phase C8 Zorbax Eclipse column (dimensions: 3 × 150 mm; 3.5 µm pore size). The instrumentation comprised an Agilent Technologies 1100 series HPLC system with diode array detection at 450, 667 and 770 nm of phytoplankton pigments (carotenoids; chlorophylls a, b and c; and bacteriochlorophyll a). A total of 22 pigments were analyzed and quantified. Details of the HPLC analytical procedure can be found in Ras et al. (2008).
As illustrated in Fig. 10, the phytoplankton biomass, indicated by total chlorophyll a concentrations, was the highest at the coast (up to 3.5 mg m−3), decreasing offshore (to about 0.010 mg m−3) with the formation of a subsurface chlorophyll maximum (SCM) around 60 m. In terms of biomass integrated over the sampled depth, values range from 6.2 and 8.9 mg m−2 at the coast to 14.3 and 13.2 mg m−2 offshore for transects 300 and 600, respectively. In general, the most predominant accessory pigment was fucoxanthin, indicating that diatoms constitute a large proportion of the phytoplankton assemblage. However, in offshore waters and around the SCM, 19'-hexanoyloxyfucoxanthin concentrations were equivalent to or sometimes higher than fucoxanthin, suggesting that, in these waters, haptophytes can predominate over diatoms. Other pigments such as chlorophyll b and prasinoxanthin suggest the presence of green algae and probably Micromonas-type cells, especially in coastal waters and at the surface. For more detailed information, see Coupel et al. (2015), who used this data set applied to the CHEMTAX (CHEMical TAXonomy) chemotaxonomic tool to assess the distribution of phytoplankton communities.
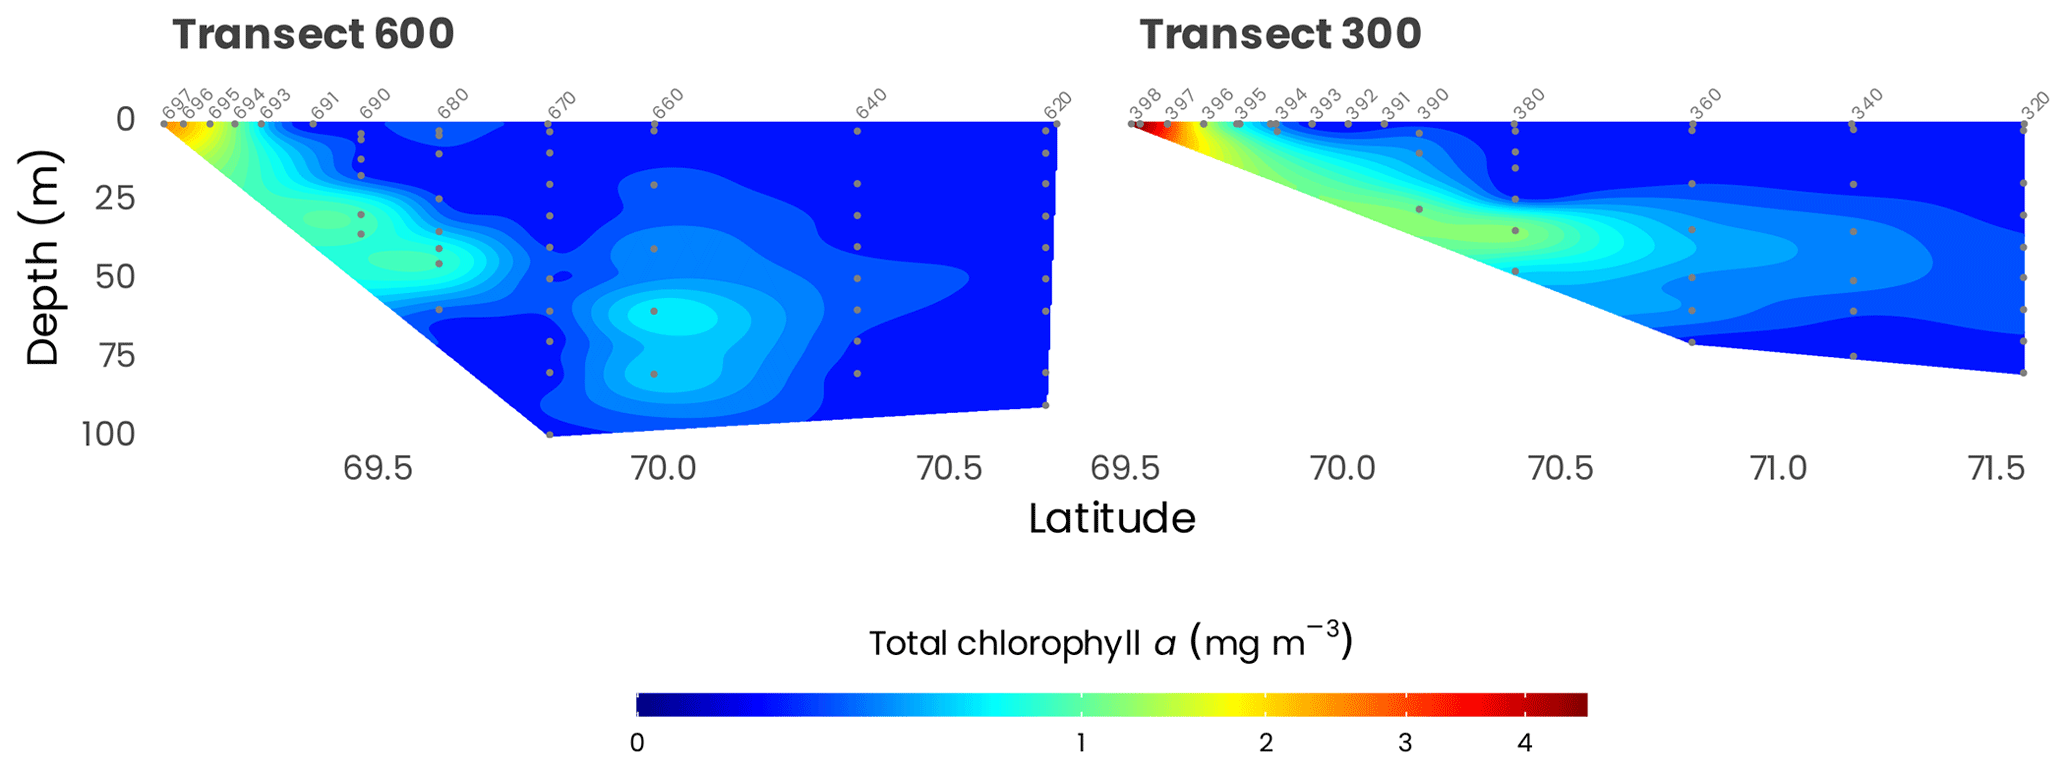
Figure 10Cross-sections of total chlorophyll a measured from HPLC (gray dots) along transects 600 and 300. Station numbers are identified in light gray on top of each panel. Note that the data have been square-root-transformed for the visualization.
4.7 Phytoplankton abundance and diversity
The abundance of the eukaryotic pico- and nano-phytoplankton was measured by flow cytometry onboard the Amundsen with a FACSAria instrument (Becton Dickinson, San Jose, CA, USA) following the protocol of Marie et al. (1999).
In transect 300 and 600 (Fig. 11), the abundance of pico- and nano-phytoplankton reached maximal values around 5000 and 3000 cells mL−1, respectively. On transect 600, pico-eukaryotes' higher abundances were restricted to the surface layer, with a 5- to 10-fold drop at 30 m. In contrast, nano-eukaryotes formed clear deep maxima, especially at stations 610 and 680. On transect 300, pico-eukaryotes were also abundant in the surface at the more off-shore stations. Still, they decreased sharply near shore, while nano-eukaryotes' highest concentrations were near the river mouth, linked to high diatom concentrations (Balzano et al., 2012a). The composition of eukaryotic phytoplankton was determined with two different approaches. We isolated 164 cultures using a range of techniques (single-cell isolation, serial dilution, flow cytometry sorting) that have been characterized morphologically and genetically (Balzano et al., 2012a, 2017) and deposited to the Roscoff Culture Collection (http://www.roscoff-culture-collection.org, last access: 16 March 2021). Among these cultures, several new species have been discovered such as the new species of green algae Mantoniella beaufortii (Yau et al., 2020) or the diatom Pseudo-nitzschia arctica (Percopo et al., 2016), but more await description, in particular among Pelagophyceae. One of the strains isolated (RCC2488, Chlamydomonas malina nomen nudum) has been recently found to be suitable for biotechnology applications (Morales-Sánchez et al., 2020). We also used molecular approaches by sorting pico- and nano-eukaryotic communities and characterizing their taxonomic composition by TRFLP (terminal-restriction fragment length polymorphism) analysis and cloning and sequencing of the 18S ribosomal RNA gene (Balzano et al., 2012a). While the pico-phytoplankton was dominated by the species Micromonas polaris, the nano-phytoplankton was more diverse and dominated by diatoms mostly represented by Chaetoceros neogracilis and C. gelidus, with the former mostly present at surface waters and the latter prevailing in the SCM (Balzano et al., 2012a). Furthermore, C. neogracilis sampled from the Beaufort Sea consists of at least four reproductively isolated genotypes (Balzano et al., 2017). The comparison between the taxonomy of natural communities and isolated cultures (Fig. 12) reveals that, although we succeeded at isolating some dominant species in the field such as M. polaris, C. neogracilis and C. gelidus, some other important taxa such as the diatom Fragilariopsis or the haptophyte Chrysochromulina were not recovered.
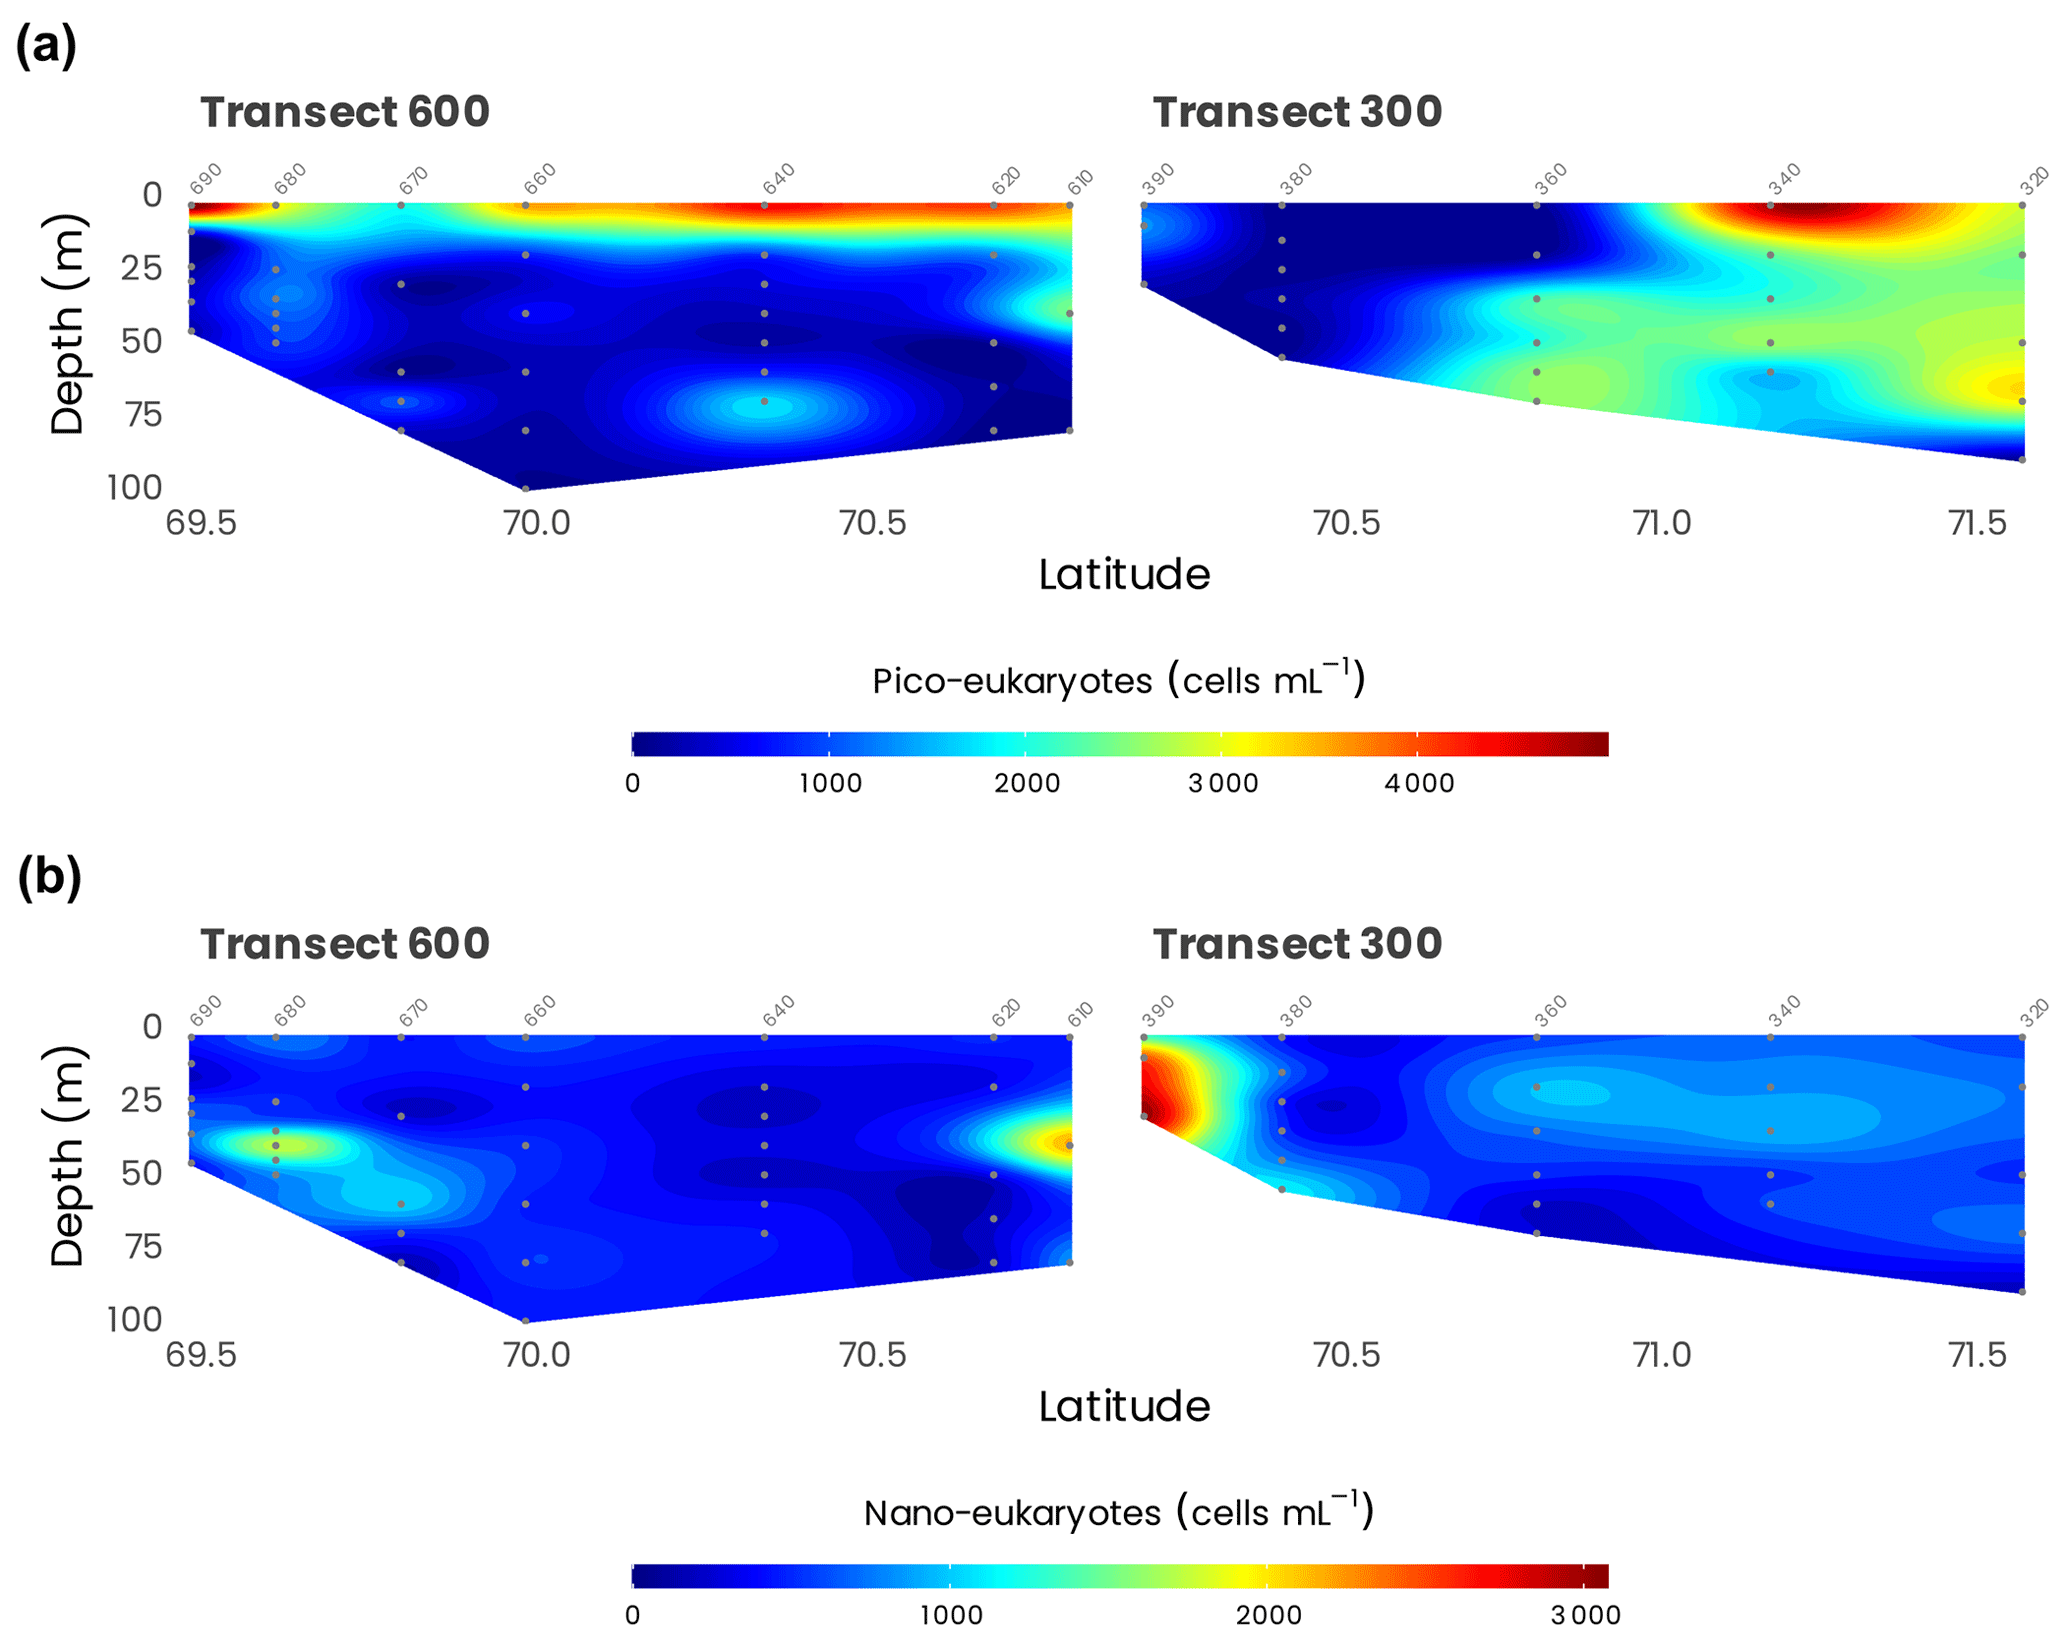
Figure 11Concentrations of photosynthetic (a) pico- and (b) nano-eukaryotes measured by flow cytometry during the MALINA cruise on transects 600 and 300.
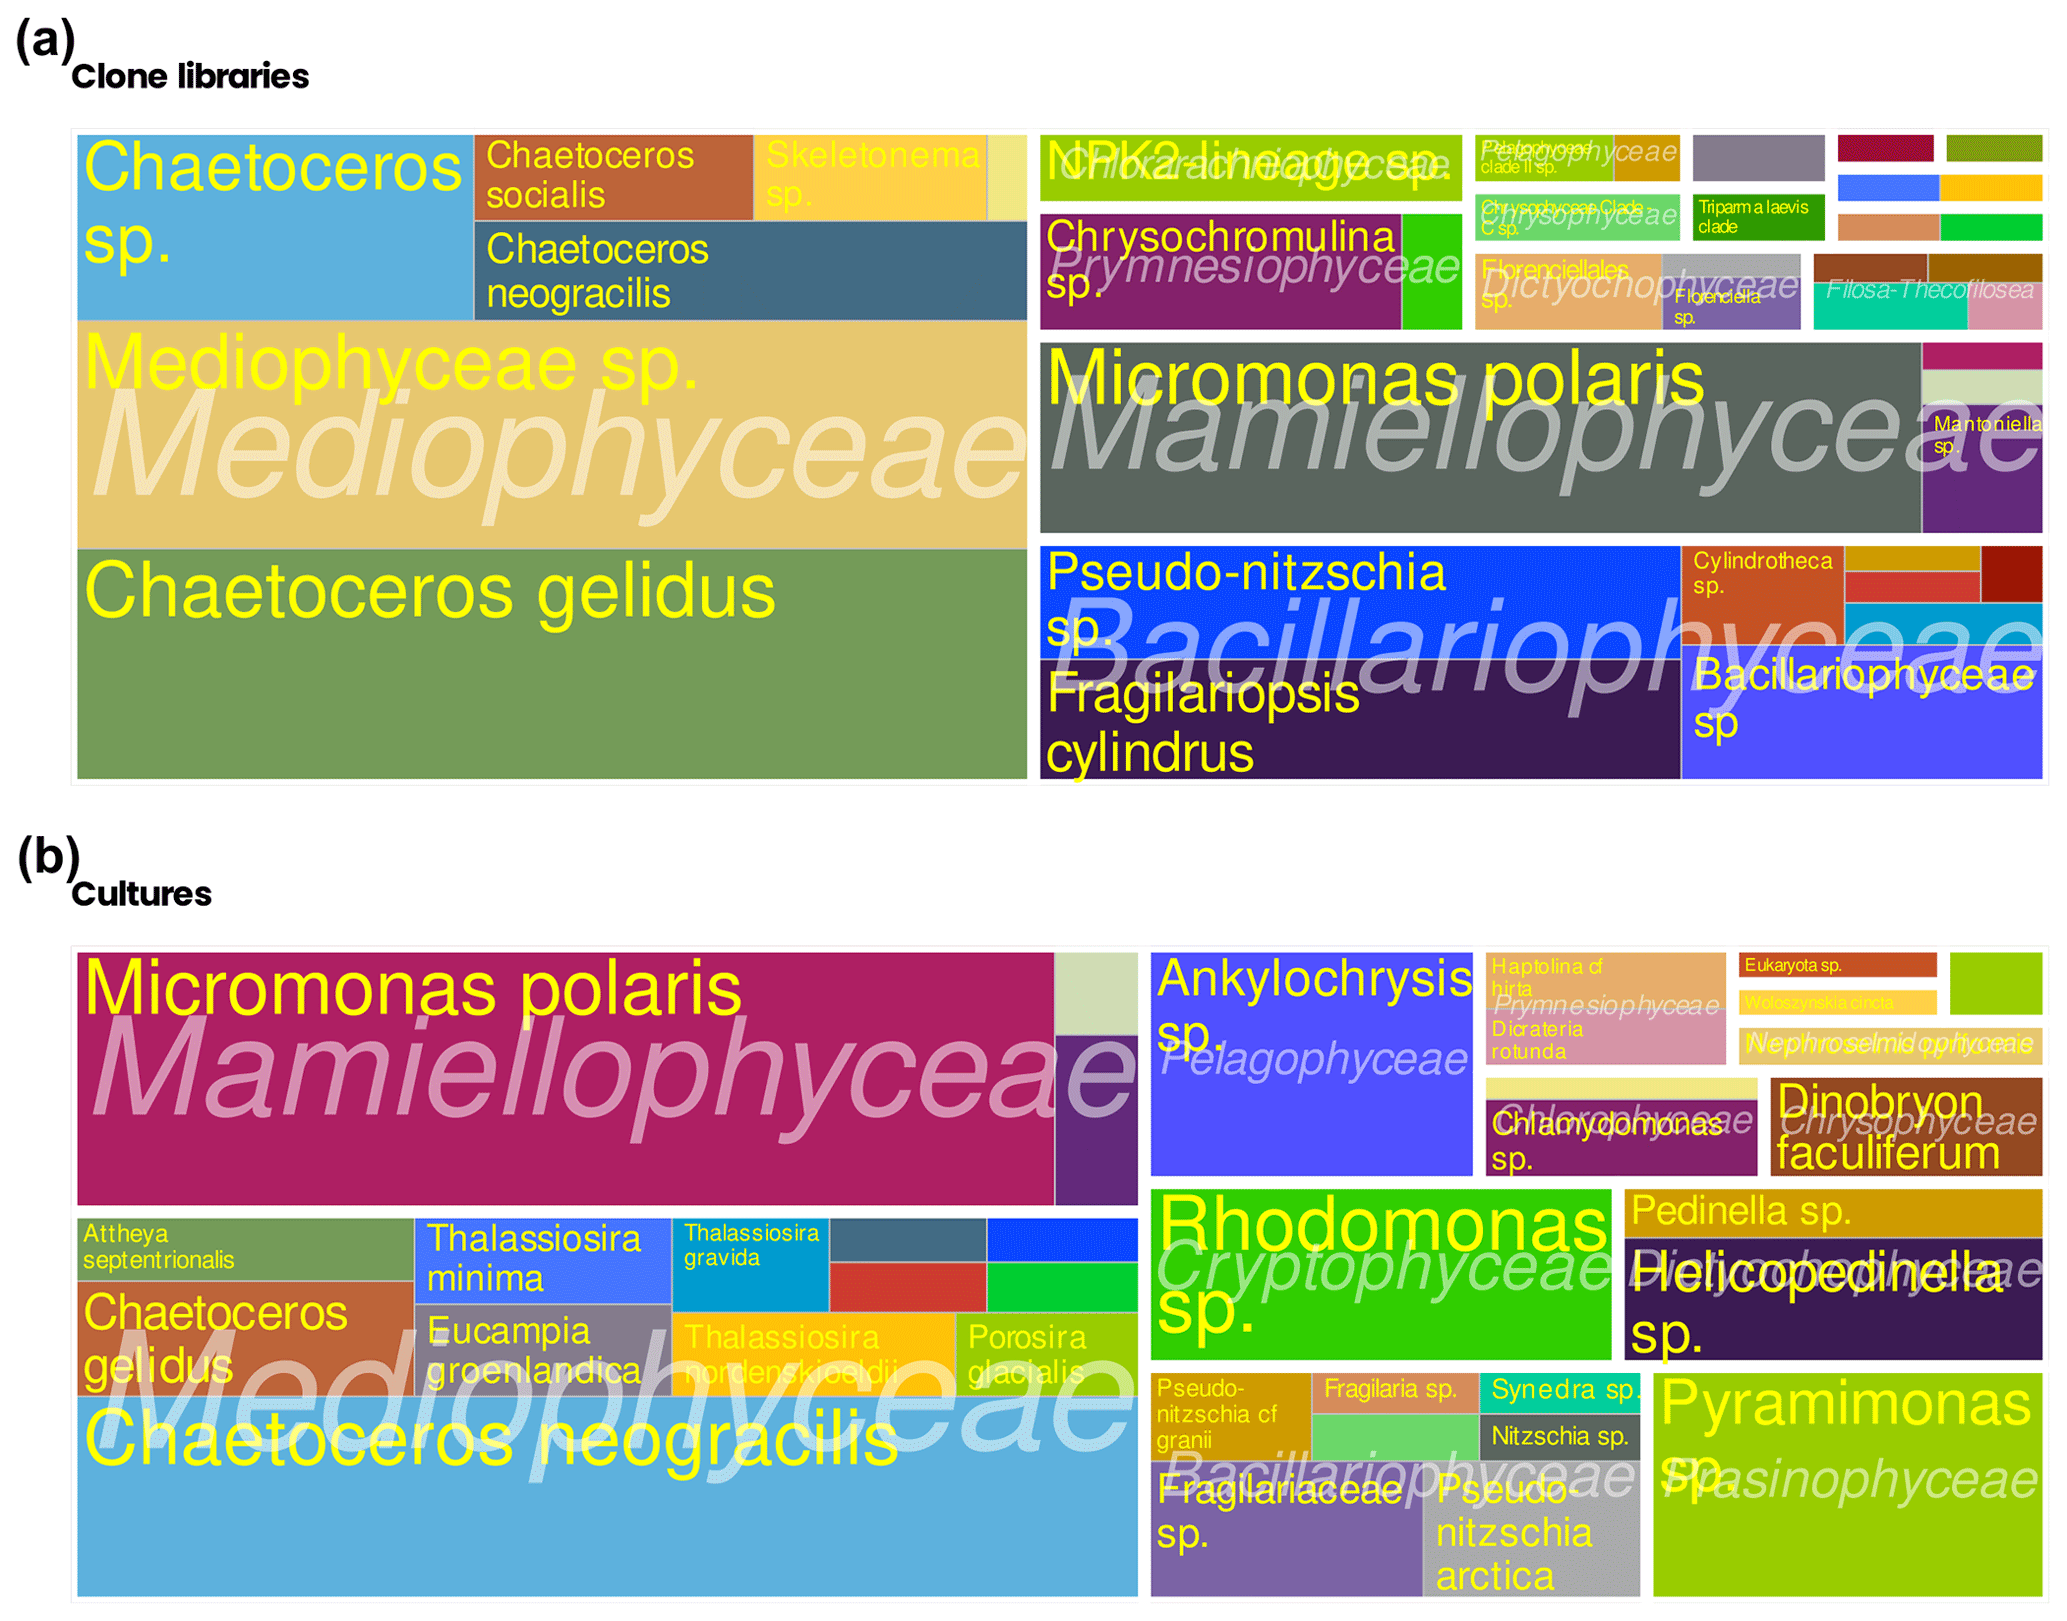
Figure 12(a) Taxonomic composition of populations of photosynthetic pico- and nano-eukaryotes sorted by flow cytometry from clone library sequences (Balzano et al., 2012a). (b) Taxonomic composition of cultures of phytoplankton isolated during the MALINA cruise (Balzano et al., 2012a).
4.8 Carbon fluxes
In the context of climate change, the main objective of the MALINA oceanographic expedition was to determine how (1) primary production, (2) bacterial activity and (3) photo-degradation influence carbon fluxes and cycling of organic matter in the Arctic. In the following sections, we present an overview of these processes in the water column that are detailed in Ortega-Retuerta et al. (2012a), Xie et al. (2012) and Tremblay et al. (2014) and refer to Link et al. (2013a), Tolosa et al. (2013) and Rontani et al. (2012b) for the related processes at the sediment–water interface.
4.8.1 Phytoplankton primary production
At each station, when productivity was quantified, rates of carbon fixation (primary production) were determined using a 13C isotopic technique (Raimbault and Garcia, 2008). For this purpose, three 580 mL samples were collected at minimum sun elevation or before sunrise at six to seven depths between the surface and the depth where irradiance was 0.3 % of the surface value and poured into acid-cleaned polycarbonate flasks. Incubations were carried out immediately following the tracer addition in an on-deck incubator. This consisted of six to seven opaque boxes, each with associated neutral and blue screens, allowing around 50 %, 25 %, 15 %, 8 %, 4 %, 1 % and 0.3 % light penetration. At five stations, incubations were also performed in situ on a drifting rig with incubation bottles positioned at the same depth where samples for on-deck incubations were collected. After 24 h, samples were filtered through pre-combusted (450 ∘C) Whatman GF/F filters (25 mm diameter). After filtration, filters were placed into 2 mL glass tubes, dried for 24 h in a 60 ∘C oven and stored dry until laboratory analysis. These filters were used to determine the final 13C enrichment ratio in the particulate organic matter on an Integra CN mass spectrometer. Filtrates were poisoned with HgCl2 and stored to estimate ammonium regeneration and nitrification rates. The isotopic enrichment of particulate organic matter and dissolved and at the end of incubations were used to calculate net C and N uptake and the recycling of and (Raimbault et al., 1999c).
Daily rates of primary production at the surface were generally very low across the survey area, ranging from 0.1 mg C m−3 d−1 offshore to a maximum of 545 mg C m−3 d−1 in Kugmallit Bay (Fig. 13), associated with the Mackenzie River discharge (Tremblay et al., 2014). Ammonification and nitrification followed the same coastal-offshore pattern, with rates driving most, if not all, of the and consumption in the surface layer. Primary production was generally maximum at the surface, but high rates were often observed at depth in the nitracline layer, associated with a chlorophyll maximum. The range of uptake rates of ammonium at the surface generally overlapped with the range of nitrate uptake rates. Nitrate uptake below the surface amounted to 40 %–60 % of total nitrogen uptake, a proportion that is approximately 2 times greater than at the surface (Ardyna et al., 2017a).
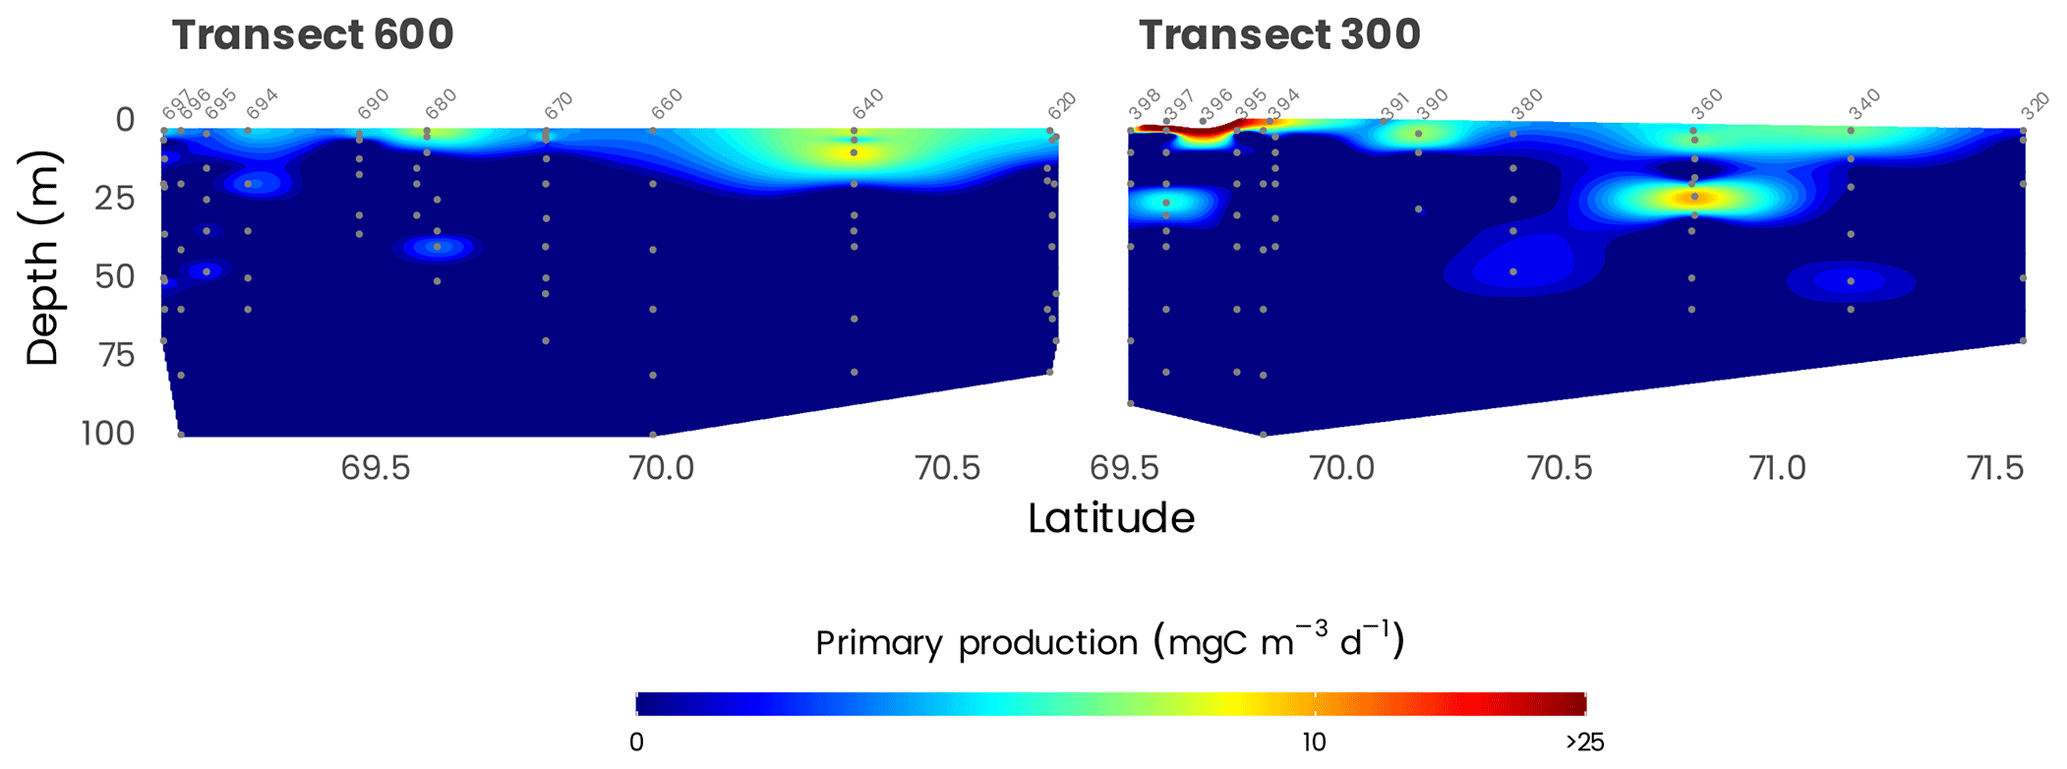
Figure 13Cross-sections of primary production (gray dots) along transects 600 and 300. Station numbers are identified in light gray on top of each panel. Note that the color scale is presented on a log10 scale.
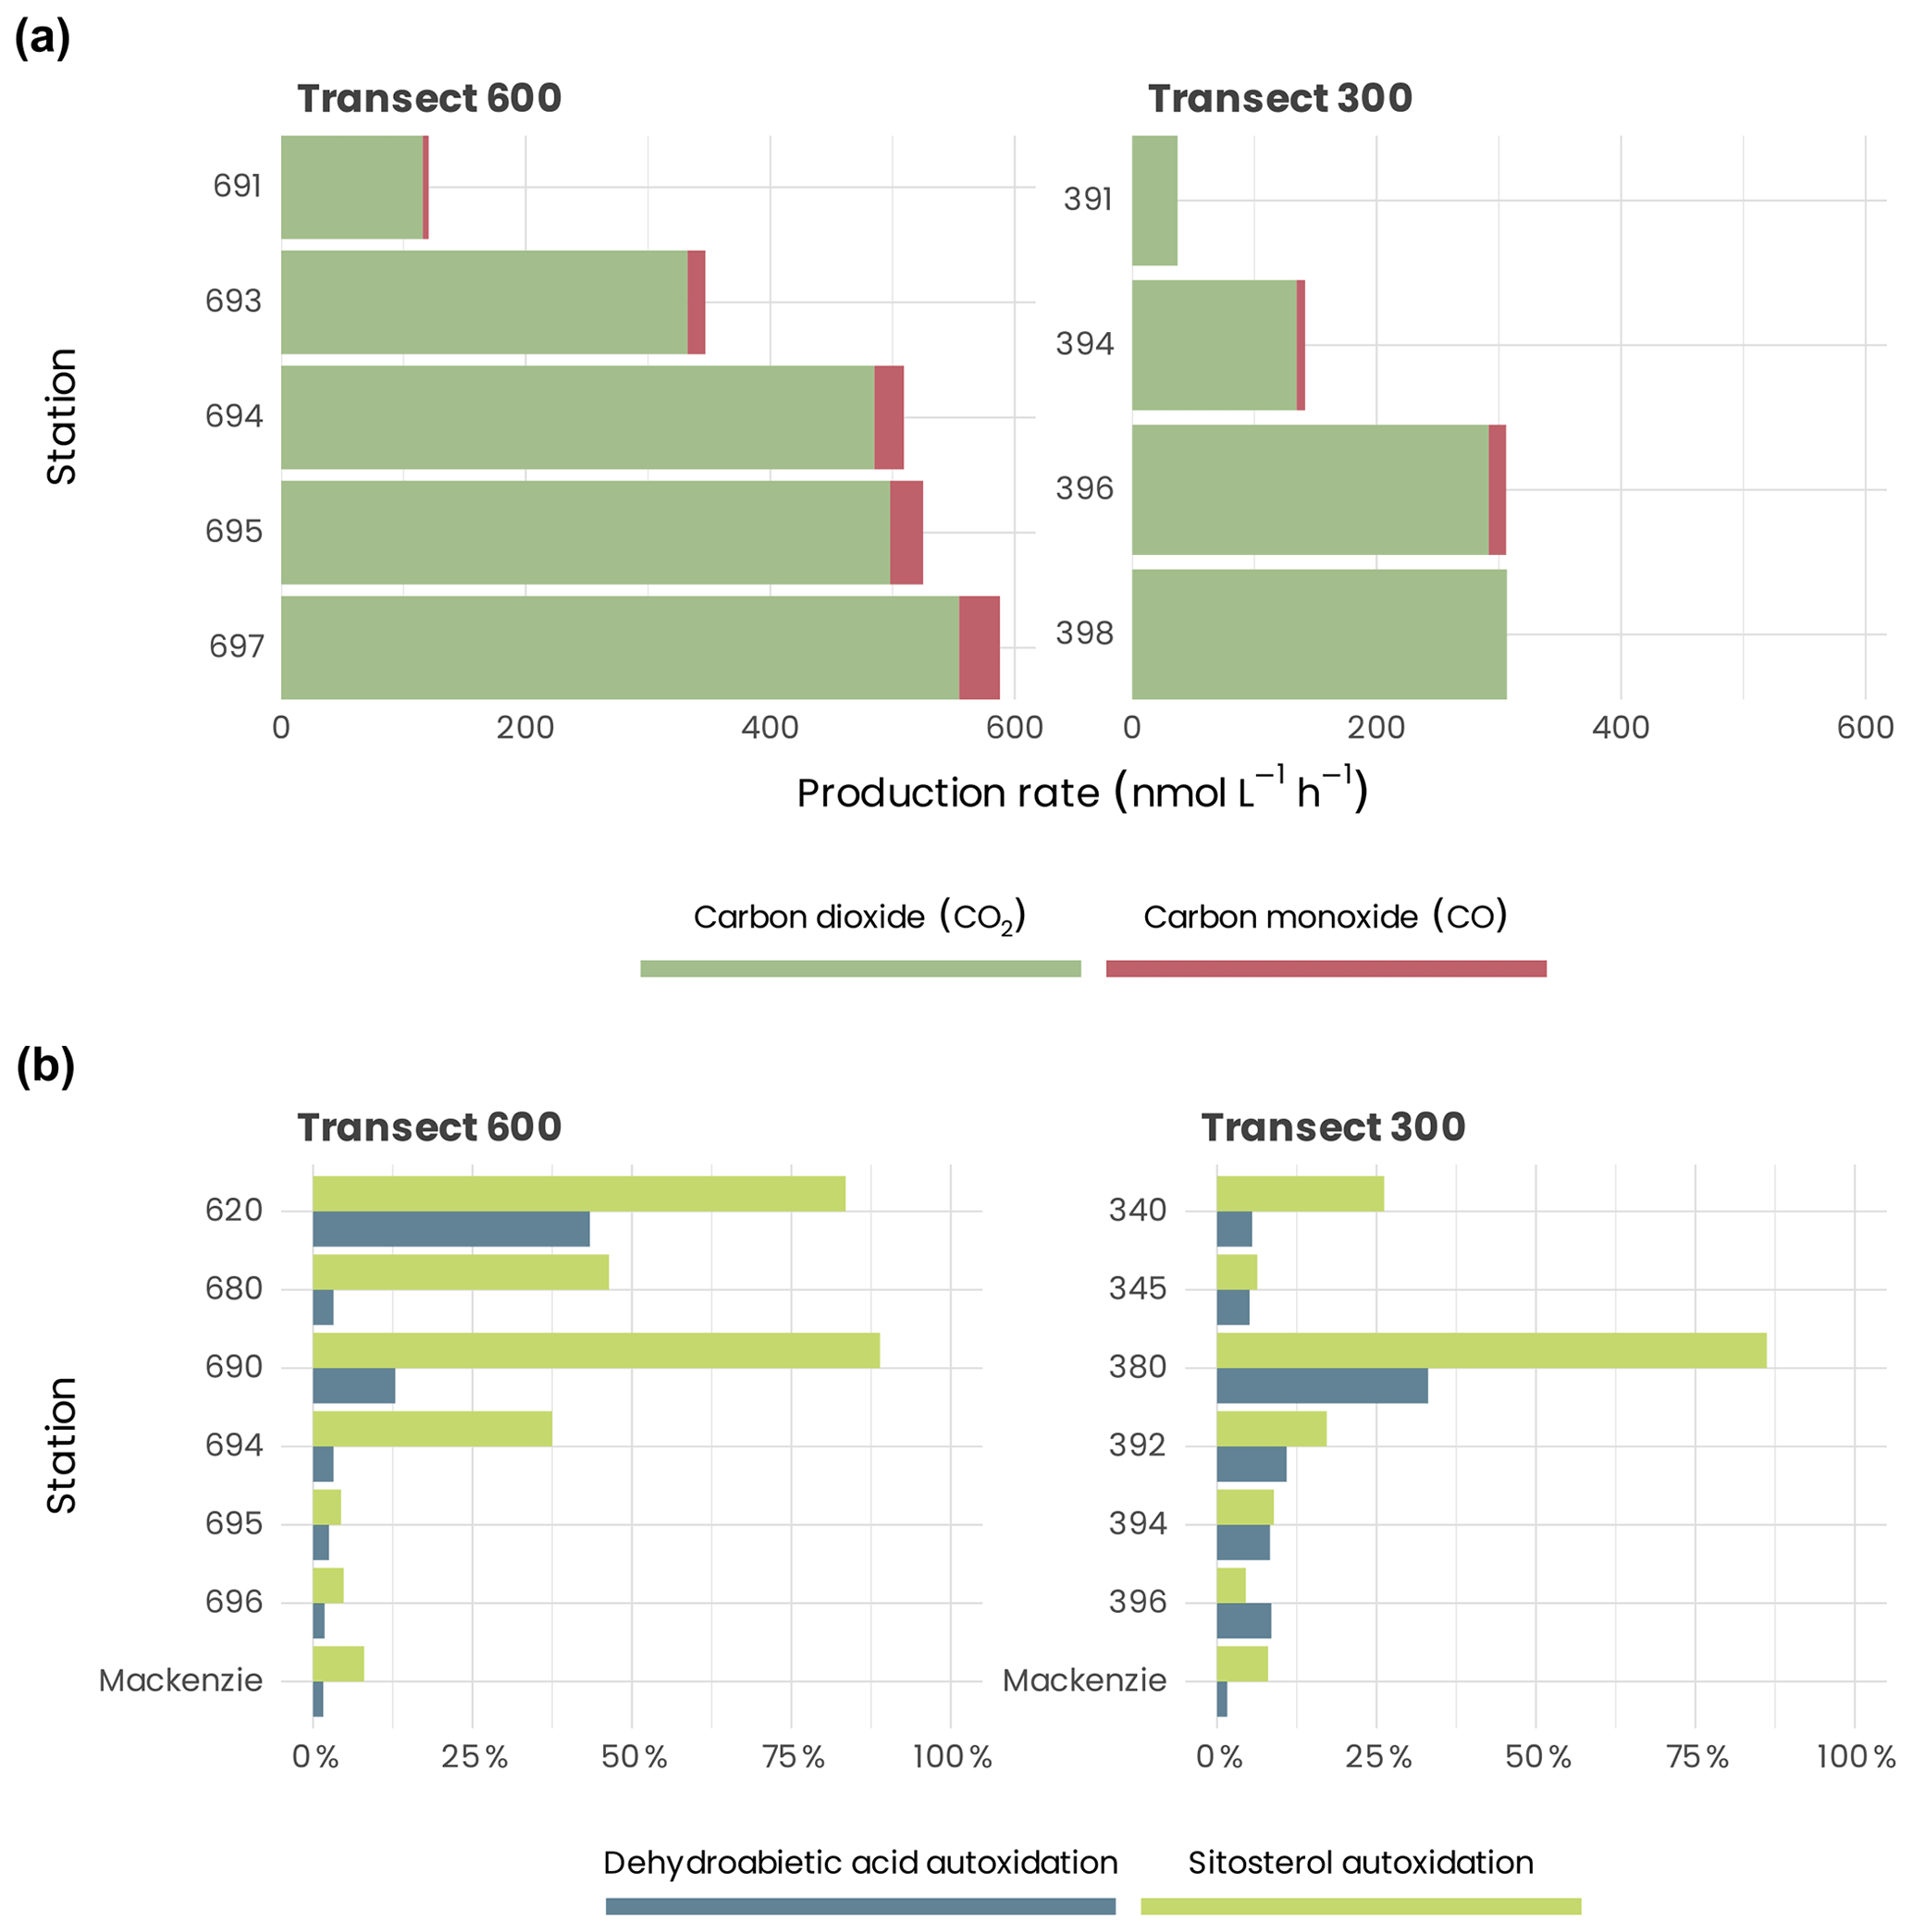
Figure 14(a) CO and CO2 production measured at 295 nm at the surface for stations of transects 600 and 300. (b) Autoxidation of suspended particulate material for stations of transects 600 and 300.
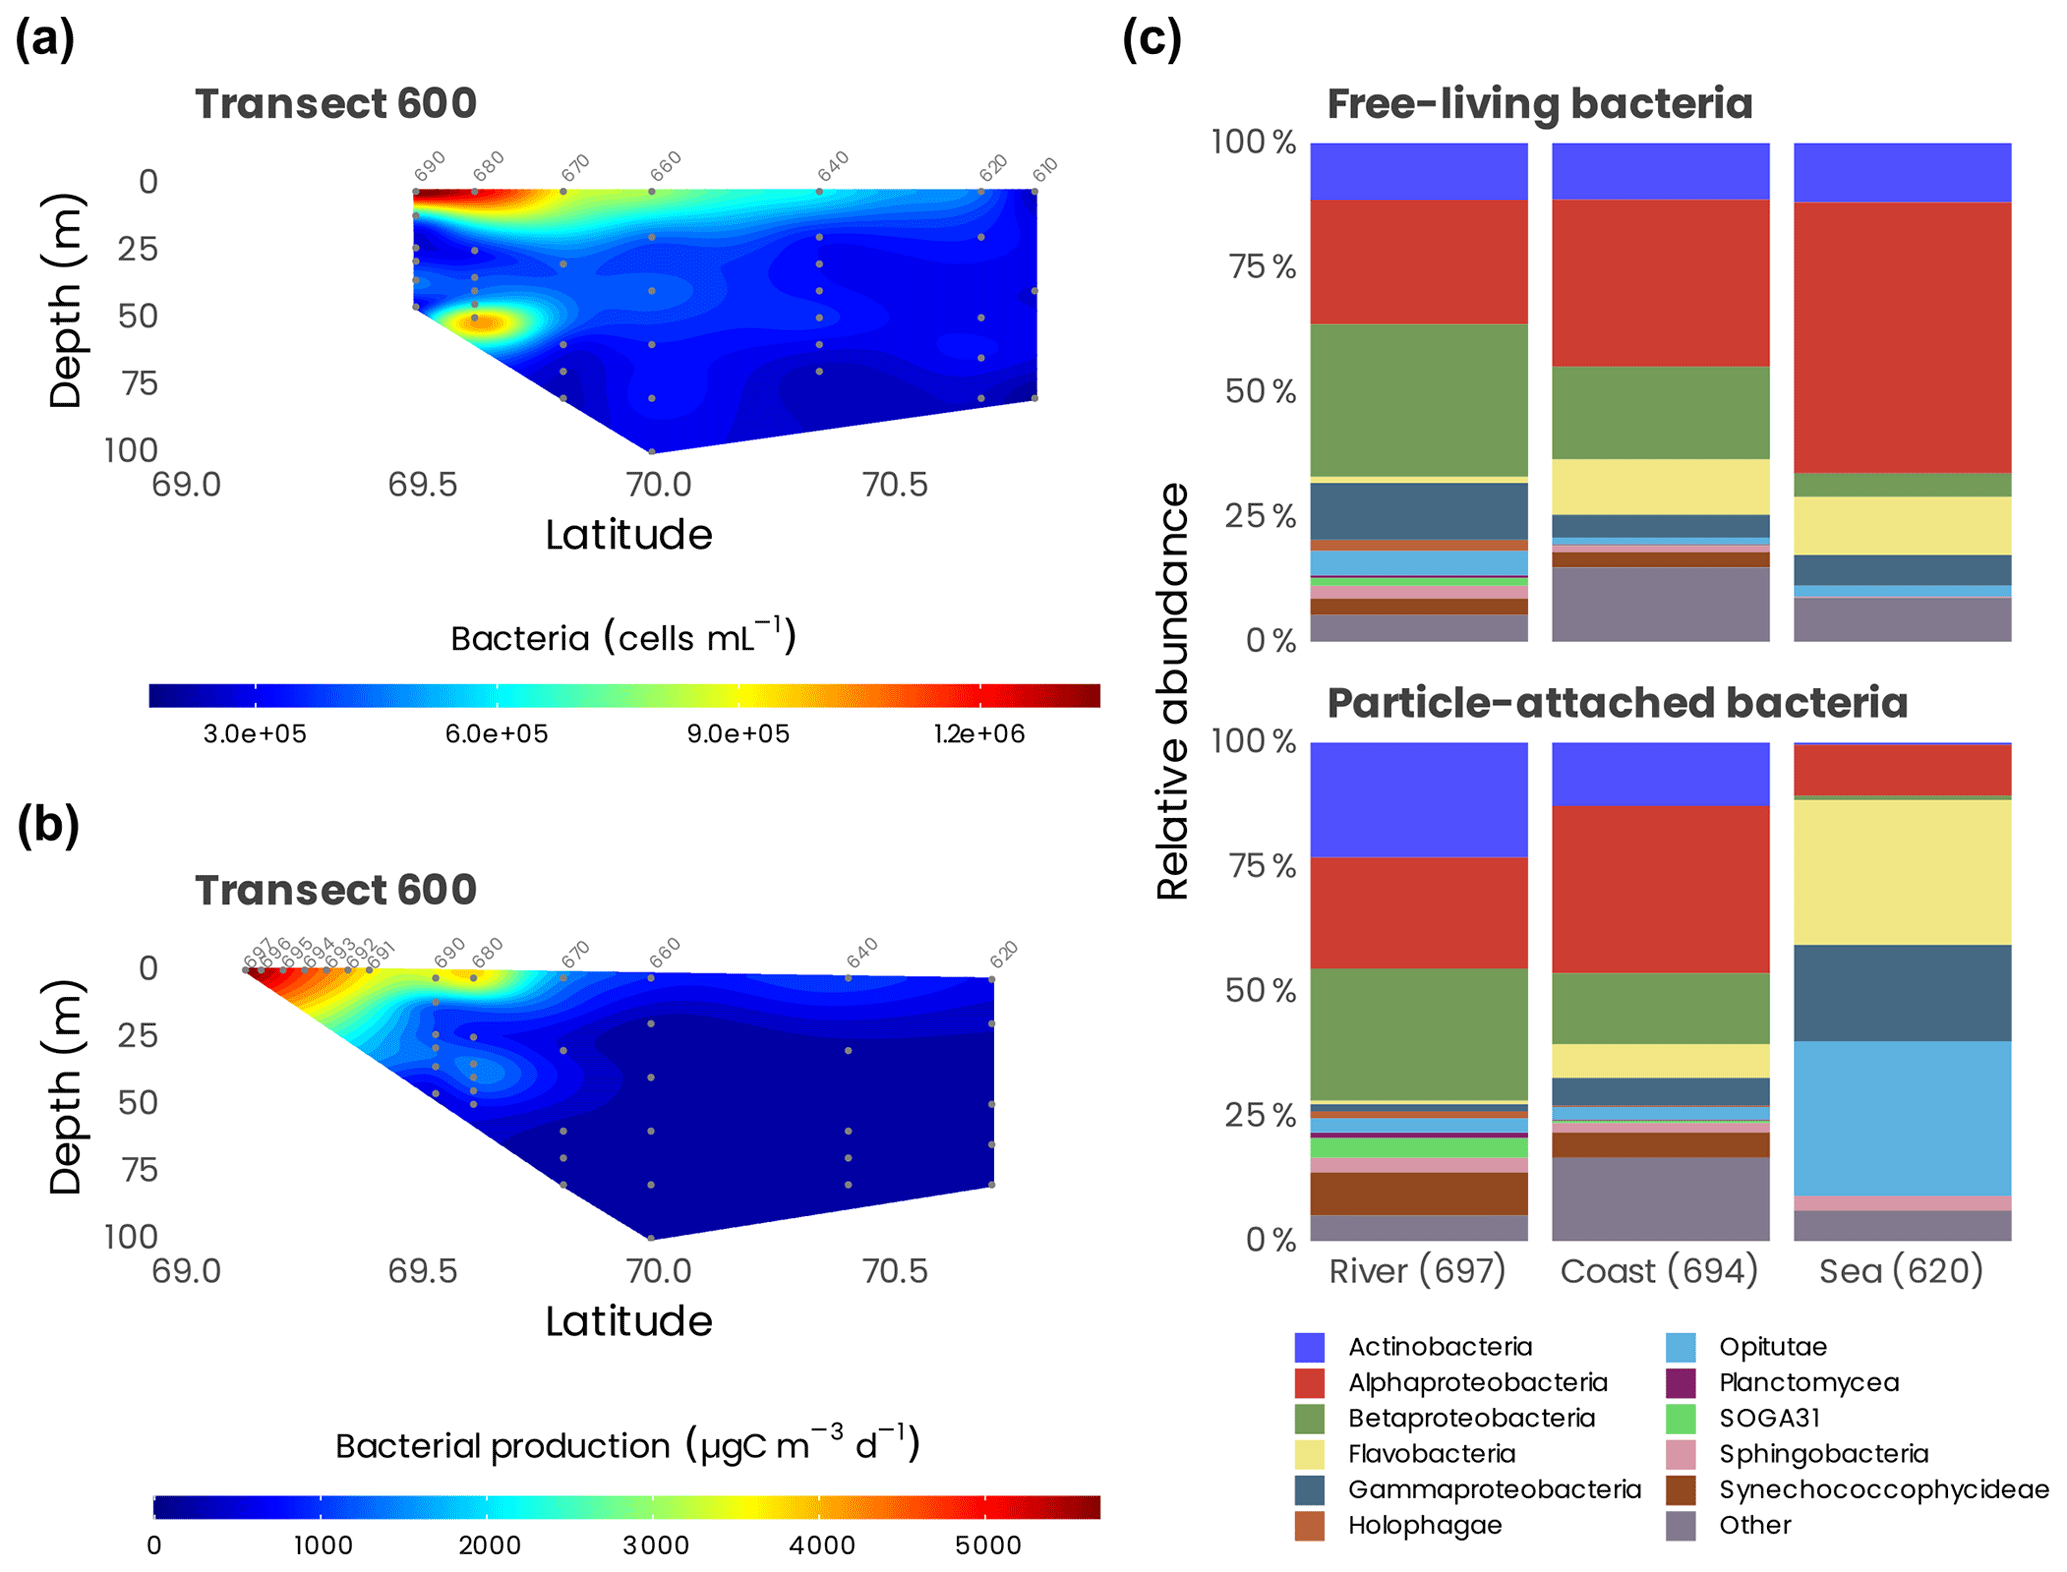
Figure 15(a) Cross-sections of bacterial abundance measured from flow cytometry and (b) bacterial production measured along transect 600. Station numbers are identified in light gray on top of each panel. (c) Cumulative bar charts comparing the relative class abundances in particle-attached (PA) and free-living (FL) bacteria for a selected number of samples in transect 600.
Nitrification and ammonium regeneration was detectable over the whole water column, ranging from 2 to 20 nmol L−1 d−1. The highest rates were generally located at the base of the euphotic zone, leading to the formation of subsurface ammonium- and nitrite-maximum layers. Surface communities and especially the accumulation of large cells thrived mostly on regenerative , and their reliance on increased with depth to reach a maximum in the subsurface chlorophyll maximum, where substantial levels of primary production occurred (Ardyna et al., 2017a). This is consistent with Ortega-Retuerta et al. (2012a), who reported elevated bacterial abundance and bacterial production rates in association with photoammonification of riverine organic matter (Le Fouest et al., 2013). Nitrification accounted for a variable and sometimes a large share of the demand, consistent with the persistence of trace amounts of at the surface. Collectively, the data indicate that the coastal Beaufort Sea is an active regenerative system during summer, probably fueled by large pools of organic matter brought by rivers. Consequently, new production was very low and often close to 0 in the 0–40 m layer. But high nitrate uptake rates can be observed at depth (Station 135), often associated with high primary production located in the chlorophyll-maximum layer, which is the place of significant new production. The impact of the Mackenzie River on shelf productivity during summer is moderate and associated mostly with localized nutrient recycling in the near-shore estuarine transition zone (Tremblay et al., 2014).
4.8.2 Photo-degradation
CO and CO2 production from dissolved organic matter
Surface water samples were gravity-filtered upon collection through a pre-cleaned Pall AcroPak 1000 filtration capsule sequentially containing 0.8 and 0.2 µm polyethersulfone membranes. Filtered water was stored in clear glass bottles at 4 ∘C in darkness. CO photoproduction rates (PCO, nmol L−1 h−1) were determined aboard the CCGS Amundsen immediately after sample collection, whereas CO2 photoproduction rates (, nmol L−1 h−1) were measured in a land-based laboratory in Rimouski, Québec, within 3 months of sample collection. The sample-pretreatment and irradiation procedures followed those reported previously (Bélanger et al., 2006b; Song et al., 2013). Briefly, after minimizing the background CO and CO2 concentrations, samples were transferred into combusted, quartz-windowed cylindrical cells (CO: interior diameter of 3.4 cm, length of 11.4 cm; CO2: interior diameter of 2.0 cm, length of 14 cm) and irradiated at 4 ∘C using a SUNTEST XLS+ solar simulator equipped with a 1.5 kW xenon lamp. The radiation emitted from the solar simulator was screened with a Schott long-pass glass filter to remove UV radiation < 295 nm. The irradiations lasted for 10 min to 2 h for CO and 24 to 48 h for CO2. The photon flux reaching the quartz windows of the cells was measured to be 835 for CO and 855 for CO2 over the wavelength range from 280 to 500 nm.
Both and PCO increased landward, with the difference between the most and least saline samples reaching a factor of ≈ 5 along transect 300 and ≈ 8 along transect 600 for and ≈ 7 along transect 600 for PCO (Fig. 14a). This landward increase in and PCO was due principally to the parallel augmentation in CDOM absorption, as demonstrated by the linear relationships between these two rates with CDOM absorption: () and (), where aCDOM(412) (m−1) is the CDOM absorption coefficient at 412 nm published previously (Song et al., 2013; Taalba et al., 2013). The irradiance-normalized ratio gradually decreased landward along transect 600, from 23.5 at station 691 to 16.2 at station 697, suggesting that the near-shore samples were more efficient at CO photoproduction relative to CO2 photoproduction than the shelf samples. The ratios at the two stations on transect 300 were, however, similar (18.9 for station 394 and 20.1 for station 396). Combining the ratios from both transects results in an average ratio of 19.8 (±2.5 SD), with a rather small relative standard deviation of 12.5 %.
It should be pointed out that extrapolating the lab-determined CO2 and CO photoproduction rates to the sampling area is practically infeasible due to the very different laboratory and real-environment conditions. For instance, the water column in the Mackenzie estuary and shelf areas contains large numbers of particles (Doxaran et al., 2012a), which are also optically active, whereas the irradiated samples were particle-free. Furthermore, the photoproduction rates in the water column would decrease rapidly with depth because of the strong light attenuation by CDOM and particles, while the laboratory radiation at best simulated the radiation of the top 1–2 cm layer of the water column even without considering the constant vs. varying irradiance from the solar simulator and natural sunlight, respectively. Estimating the areal photoproduction rates in the water column from lab-derived data often requires coupled optical–photochemical modeling that incorporates spectral apparent quantum yields of the photoproduct of interest (Bélanger et al., 2006b; Xie et al., 2009; Fichot and Miller, 2010). Using this approach and CO data from the MALINA cruise, Song et al. (2013) estimated a yearly averaged areal CO photoproduction rate of 9.6 µmol m−2 d−1 in the Mackenzie estuary and shelf areas, which implies a yearly averaged areal CO2 photoproduction rate of 191.1 µmol m−2 d−1 based on the average ratio of 19.8 obtained above. Aggregating the CO2 and CO rates gives a total photomineralization rate of 199.7 µmol C m−2 d−1.
Autoxidation of suspended particulate material
Water samples were filtered immediately after collection through a pre-combusted glass fiber filter (Whatman GF/F, 0.7 µm) under a low vacuum. The filters were frozen immediately at −20 ∘C until analysis and transported to the laboratory. Treatment of the filters involved NaBH4 reduction and classical alkaline hydrolysis (Rontani et al., 2012a). Reduction of labile hydroperoxides to alcohols is essential for estimating the importance of autoxidative degradation in natural samples by gas chromatography–electron impact mass spectrometry (GC–EIMS) (Marchand and Rontani, 2001). Autoxidative degradation of terrigenous particulate organic matter (POM) discharged by the Mackenzie River was monitored thanks to specific oxidation products of sitosterol (main sterol of higher plants) and dehydroabietic acid (a component of conifers).
The autoxidation state of these tracers increases strongly at the offshore stations (Fig. 14b) (reaching 89 % and 86 % at station 690 and station 380, respectively, in the case of sitosterol; see Rontani et al., 2014). These results allowed us to demonstrate that in surface waters of the Beaufort Sea, autoxidation strongly affects vascular plant lipids and probably also the other components of terrestrial organic matter (OM) delivered by the Mackenzie River. Initiation of these abiotic oxidation processes was attributed to the involvement of some enzymes producing radicals (lipoxygenases), which are present in higher plant debris and whose activity is enhanced at high salinities (Galeron et al., 2018).
Bacterial production and respiration
Bacterial production (BP; assessed by 3H-leucine incubations, n=171) and respiration (BR; assessed by changes in O2 by Winkler titration, n=13) were measured from the surface to 200 m at 44 sampling locations. Bacterial production ranged from 8.8 to 7078 µg C m−3 d−1 and showed a marked decreasing pattern from the mouth of the Mackenzie to the open Beaufort Sea and from the surface to deep waters (Fig. 15). Temperature and labile dissolved organic matter (indicated as dissolved amino acids) controlled BP variability (Ortega-Retuerta et al., 2012a), and the nitrogen limitation of surface BP during the summer period was demonstrated experimentally (Ortega-Retuerta et al., 2012b). BR ranged from 5500 to 45 500 µg C m−3 d−1, leading to a bacterial growth efficiency of 8 % on average. BP and BR were low with respect to lower latitudes but within the range of those in polar ecosystems, suggesting the role of low temperatures driving carbon fluxes through bacteria (Kirchman et al., 2009). Bacterial carbon demand (BP + BR), which averaged 21 500 ± 14 900 µg C m−3 d−1, was higher than primary production in the whole study area, indicating that the Mackenzie River platform and the Beaufort Sea are net heterotrophic during summer. This may suggest a temporal decoupling between carbon fixation and remineralization in the area.
4.8.3 Bacterial diversity
Spatial variations in bacterial-community structure were explored in surface waters from the Mackenzie River to the open Beaufort Sea (n=20). By using 16S rRNA-based analysis, we investigated both particle-attached (PA; > 3 µm size fraction) and free-living (FL; size fraction between 3 and 0.2 µm) bacteria along a river-to-open-sea transect. Multivariate statistical analysis revealed significant differences in community structure between the river, coastal and open-sea waters, mainly driven by salinity, particle loads, chlorophyll a and amino acid concentration (Ortega-Retuerta et al., 2013). Bacterial communities differed between PA and FL fractions only at open-sea stations, likely due to the higher organic-carbon content in particles with respect to particles from the river and coast, which were enriched in minerals. Alphaproteobacteria dominated in FL open-sea samples, while the PA fraction was mainly composed of Gammaproteobacteria, Opitutae (Verrucomicrobia) and Flavobacteria. The coastal and river samples were dominated by Betaproteobacteria, Alphaproteobacteria and Actinobacteria in both the PA and FL fractions (Fig. 15c). These results highlight the importance of particle quality, a variable that is predicted to change along with global warming, in influencing bacterial-community structure and thus likely altering the biogeochemical cycles that they mediate.
Metadata and detailed information about measurements can be found in associated MALINA papers presented in Table 1. Data are provided as a collection of comma-separated values (CSV) files that are regrouping measurements associated with a particular type of measure. To aid the user in merging these files, there is a lookup table file called stations.csv that can serve as a table to join all the data together based on date, time, station, cast, depth, longitude and latitude. Additionally, original data provided by all the researchers as well as additional metadata are available on the LEFE-CYBER repository (http://www.obs-vlfr.fr/proof/php/malina/x_datalist_1.php?xxop=malina&xxcamp=malina, last access: 8 February 2021). The processed and tidied version of the data is hosted at SEANOE (SEA scieNtific Open data Edition) under the CC-BY license (https://doi.org/10.17882/75345; Massicotte et al., 2020). The raw UVP5 large-particulate data and images are all available from the EcoPart and Ecotaxa website (https://ecotaxa.obs-vlfr.fr/, last access: 25 February 2021, Picheral et al., 2017). Note that Table 1 also indicates whether the measured variables are directly available in the data files or by contacting the responsible principal investigators. For specific questions, please contact the principal investigator associated with the data (see Table 1). If more data become available, they will be added to the SEANOE repository. The code used to produce the figures and the analysis presented in this paper is available under the GNU GPLv3 license (https://doi.org/10.5281/zenodo.4518943, Massicotte, 2021).
The comprehensive data set assembled during the MALINA oceanographic cruise has given unique insights into the stocks and the processes controlling carbon fluxes in the Mackenzie River and the Beaufort Sea. In this paper, only a handful of variables have been presented. The reader can find the complete list of measured variables in Table 1, all of which are also fully available in the data repository. The uniqueness and comprehensiveness of this data set offer more opportunities to reuse it for other applications.
MB and SB designed the MALINA project, including the scientific objectives and the sampling strategy. PM prepared the initial draft of the manuscript. SB was responsible for spectrophotometric measurement of particle absorption and fluorometric chlorophyll a determination onboard and with above-water radiometry (e.g., continuous incident irradiance measurements). JE was the logistic coordinator for the cruise and was responsible for IOP measurements from the CTD rosette and contributed to SPM, POC and particulate absorption measurements and processing. PF performed the GC–MS experiments on organic molecular compositions. AM and BL were in charge of determining carbonate system parameters (pH and total alkalinity) as well as the stable oxygen isotopic composition of the water and stable carbon isotopic composition of the dissolved inorganic carbon. BL participated in the cruise, collected the samples and compiled and processed most of the data. Carbonate system parameters were used to determine the saturation of waters concerning aragonite as well as calculate the surface water pCO2. These parameters and others were used by the proponents to identify and estimate the contribution of parental waters to the structure of the water column in the study area. CM, LP and YG operated the rosette during the MALINA cruise. CM was in charge of all the physical instruments during the cruise. She also operated the UVP5 sensor. YG was in charge of the physical data processing during and after the cruise. CM and LP processed the LADCP data during the cruise. MP developed and operated the UVP5 sensor and processed the data. GG contributed to the UVP development. CJ processed samples during the MALINA cruise, designed the experiments on photoheterotrophic bacteria and wrote the related manuscripts. DB designed and performed the experiments on photoheterotrophic bacteria and wrote the related manuscripts. DV and DM participated in the MALINA cruise and sampled for flow cytometry, DNA and cultures. DM performed flow cytometry measurements and cell sorting. DV also coordinated the work on phytoplankton culture and molecular analyses. SB performed molecular analyses of flow-cytometry-sorted photosynthetic pico- and nano-eukaryotes as well as phytoplankton cultures. PG isolated and characterized phytoplankton cultures. WJ, EOR and FJ participated in the MALINA cruise, collected samples for bacterial production and respiration and prokaryotic diversity, and performed nutrient limitation experiments. RB participated in the MALINA cruise and collected the samples for DOC, TDN, THAA and TDLP9. CF analyzed the samples for DOC, TDN and TDLP6. YS analyzed the samples for THAA. RA contributed advice for the leads and the measurements of CDOM fluorescence. PG was in charge of the processing and quality control of the CTD data. CL contributed material, protocols and advice for DNA sampling for planktonic material. HJH contributed to the data interpretation regarding bacterial diversity and activity. HX and GS participated in the MALINA cruise, designed and conducted the onboard CO photoproduction experiment, and collected samples for the CO2 photoproduction experiment. TP oversaw the measurement of meteorological elements from an instrumented tower on the ship's foredeck and the measurement of incoming solar shortwave, longwave, PAR and UV radiation from sensors mounted on top of the ship's wheelhouse. FB and YH participated in the MALINA cruise, performed the P vs. E curve and the FIRe fluorometer measurements (phytoplankton photosynthesis efficiency), and sampled for the photosynthetic protein analysis. FB also helped gather and merge the initial form of the MALINA database with the help of CAB, who coded for SQL formatting, and MHF, who coordinated the effort. DD participated in the MALINA field campaign; measured from the barge the water temperature, salinity and inherent optical properties as a function of depth; and processed the data. He was also in charge of measuring the suspended particulate matter and particulate organic carbon concentrations in collected water samples. RR and GZ participated in the MALINA field program and collected data on seawater optical properties and particle characteristics. Together with DS, they conducted processing and curation of these data, formal analysis, and publication of results. All three authors have reviewed and edited the current paper for accuracy. DA participated in MALINA Leg 1. He carried out radiometry measurements, including from the underwater radiance cameras, and then processing, analysis and publication of the results. He has contributed to editing the current paper. PA contributed material, protocols and advice of benthic sampling and participated in the interpretation of benthic biodiversity and biodiversity–ecosystem functioning through his ArcticNet funding. HL participated in the MALINA cruise; was in charge of sediment sampling with the box corer; designed and performed benthic incubation experiments onboard; analyzed sediment samples for pigments and macrofauna; processed, analyzed, interpreted and published results obtained from benthic incubations (benthic nutrient fluxes and respiration, macrofauna, TOC, pigments); and contributed to writing this paper. EL participated in the MALINA cruise and was involved in the radiance camera measurements and data processing as well as the POLVSM instrument. CS gathered data and metadata for the MALINA cruise through INSU-CNRS (Institut National des Sciences de l'Univers – Centre National de la Recherche Scientifique) funding. MC and AT participated in the MALINA cruise; they operated the POLVSM instrument to measure the particulate scattering phase function of the water sample. BG and JaM participated in the MALINA cruise, performed sampling of suspended particles with foredeck in situ pumps and assisted CM in the deployment of the drifting sediment trap line. Both performed sample treatment and analysis of 234Th, and JCM participated in the interpretation of the data and coordination of these operations prior to the cruise. IT performed data analysis and interpretation of lipid biomarkers and their carbon isotopic ratios in suspended particulate matter and sediment and sampled respectively with the foredeck in situ pumps and box corer. VM participated in the MALINA cruise, mainly on the barge to collect inherent optical properties, deploying the optical package to obtain vertical profiles. NG, PR and PC participated in the MALINA cruise by being in charge of experimental incubations for the determination of primary production and nitrogen assimilation rates as well as the preservation of samples for inorganic and organic nutrients in the euphotic zone. NG and PR performed the laboratory nutrient analysis and isotopic measurements of preserved samples, respectively. PR has compiled and processed the data and has contributed to editing the current paper. JÉT and JoM were responsible for the collection of inorganic nutrient samples in the entire water column and their analysis immediately on board (fresh). JFR carried out lipid analyses (lipid extraction, derivatization and GC–MS analyses) on SPM samples collected during the MALINA cruise, interpreted the results obtained and participated in the writing of the present paper. BC participated in the MALINA cruise, being in charge of sampling and analysis for DOC, CDOM, monosaccharides, diacids, and atmospheric underwater PAR and UV radiation. AM and AB participated in the MALINA cruise, measured CDOM absorption spectra, processed and analyzed the data, and published the results. RS defined the sampling strategy of DOC, CDOM, monosaccharides, diacids, and atmospheric underwater PAR and UV radiation; interpreted the results obtained; and wrote the related manuscripts. CP performed monosaccharide analysis and wrote the related manuscript. MV performed diacid analysis and wrote the related manuscript. SH interpreted the mass flux data and wrote the related paper. MG contributed material, equipment, protocols and advice for the determination of chlorophyll a and phaeopigments in the water column (fluorometric method) and participated in the interpretation of the phytoplankton biomass and community composition data. ND performed sediment trap sample preparation. AR and GM designed the MSc. project to study the evolution of sea surface conditions in the Beaufort Sea. SS performed the analysis and interpretation of sedimentary 210Pbxs and 137Cs profiles. SBH co-developed the C-OPS instrumentation, designed the experiments, co-developed the software to acquire the data by launching a small vessel from the much larger icebreaker and co-developed the software to process the data. HC and JR were in charge of HPLC measurements and participated in the interpretation of data. AM collected the samples for the HPLC analysis during the MALINA cruise. WLM advised on in situ optical sampling and photochemical experiments. JFG performed the data analysis on prokaryotic diversity (see the text above; together with the team WJ, EOR and FJ). FV was in charge of lipid extractions. JKV participated in the interpretation of lipid data. GC contributed materials and protocols to benthic incubations. She performed the analyses of diagenetic species and participated in the interpretation of redox conditions and benthic oxygen demand. She contributed to writing the related manuscripts. KK, KO and ET contributed to the analysis of the aerosol filter samples for organic species. JG analyzed all the nutrient samples and managed the data. JC performed the analysis of organic aerosols by GC–MS.
The authors declare that they have no conflict of interest.
This work is dedicated to the memory of Marc Thibault (commanding officer of the CCGS Amundsen, Canadian Coast Guard), Daniel Dubé (CCGS Amundsen helicopter pilot, Transport Canada) and Klaus Hochheim (research scientist at the Centre for Earth Observation Science, University of Manitoba), who died in the CCGS Amundsen helicopter crash on the evening of 9 September 2013 in the icy waters of McClure Strait in the Canadian Arctic. We are very grateful to the captain (Marc Thibault) and crews of the Canadian research icebreaker CCGS Amundsen during the MALINA cruise in the Beaufort Sea. The International Atomic Energy Agency is grateful to the government of the Principality of Monaco for the support provided to its Environment Laboratories. Abderrahmane Nassim Taalba performed the CO2 photoproduction experiment. Lise Durantou carried out the analyses and interpreted the data. Claude-Anne Bouin helped gather and merge the initial form of the MALINA database. ArcticNet and Québec-Océan funded several students and analyses for their project.
This study was conducted as part of the Malina scientific program funded by ANR (Agence Nationale de la Recherche), INSU-CNRS (Institut National des Sciences de l’Univers - Centre National de la Recherche Scientifique), the LEFE-CYBER program, CNES (Centre National d'Études Spatiales), the European Commission (Marie Skłodowska-Curie Actions), ESA (European Space Agency) and ArcticNet. US NSF grants 0713915 and 1504137 to Ronal Banner and 0229302, 0425582, 0713991 to Rainer M. W. Amon. US NASA (grant no. NNX07AR20G) awarded to Rick A. Reynolds and Dariusz Stramski. Natural Science and Engineerinng Council (Canada) Discovery and Northern supplement to Connie Lovejoy.
This paper was edited by Giuseppe M. R. Manzella and reviewed by two anonymous referees.
Abdul Aziz, O. I. and Burn, D. H.: Trends and variability in the hydrological regime of the Mackenzie River Basin, J. Hydrol., 319, 282–294, https://doi.org/10.1016/j.jhydrol.2005.06.039, 2006. a
Aminot, A. and Kérouel, R.: Dosage automatique des nutriments dans les eaux marines, in: Méthodes d'analyse en milieu marin, Ifremer, 188 pp., EAN13 Book 9782759200238, 2007. a, b
Amon, R.: Dissolved organic carbon distribution and origin in the Nordic Seas: Exchanges with the Arctic Ocean and the North Atlantic, J. Geophys. Res., 108, 3221, https://doi.org/10.1029/2002JC001594, 2003. a, b
Andrisoa, A., Stieglitz, T., Rodellas, V., and Raimbault, P.: Primary production in coastal lagoons supported by groundwater discharge and porewater fluxes inferred from nitrogen and carbon isotope signatures, Mar. Chem., 210, 48–60, https://doi.org/10.1016/j.marchem.2019.03.003, 2019. a
Antoine, D., Hooker, S. B., Bélanger, S., Matsuoka, A., and Babin, M.: Apparent optical properties of the Canadian Beaufort Sea – Part 1: Observational overview and water column relationships, Biogeosciences, 10, 4493–4509, https://doi.org/10.5194/bg-10-4493-2013, 2013a. a
Antoine, D., Morel, A., Leymarie, E., Houyou, A., Gentili, B., Victori, S., Buis, J.-P., Buis, N., Meunier, S., Canini, M., Crozel, D., Fougnie, B., and Henry, P.: Underwater Radiance Distributions Measured with Miniaturized Multispectral Radiance Cameras, J. Atmos. Ocean. Tech., 30, 74–95, https://doi.org/10.1175/JTECH-D-11-00215.1, 2013a. a
Ardyna, M., Babin, M., Devred, E., Forest, A., Gosselin, M., Raimbault, P., and Tremblay, J.-É.: Shelf-basin gradients shape ecological phytoplankton niches and community composition in the coastal Arctic Ocean (Beaufort Sea), Limnol. Oceanogr., 62, 2113–2132, https://doi.org/10.1002/lno.10554, 2017a. a, b
Ardyna, M., Babin, M., Devred, E., Forest, A., Gosselin, M., Raimbault, P., and Tremblay, J.-É.: Shelf-basin gradients shape ecological phytoplankton niches and community composition in the coastal Arctic Ocean (Beaufort Sea), Limnol. Oceanogr., 62, 2113–2132, https://doi.org/10.1002/lno.10554, 2017b. a
Asmala, E., Autio, R., Kaartokallio, H., Pitkänen, L., Stedmon, C. A., and Thomas, D. N.: Bioavailability of riverine dissolved organic matter in three Baltic Sea estuaries and the effect of catchment land use, Biogeosciences, 10, 6969–6986, https://doi.org/10.5194/bg-10-6969-2013, 2013. a
Balzano, S., Gourvil, P., Siano, R., Chanoine, M., Marie, D., Lessard, S., Sarno, D., and Vaulot, D.: Diversity of cultured photosynthetic flagellates in the northeast Pacific and Arctic Oceans in summer, Biogeosciences, 9, 4553–4571, https://doi.org/10.5194/bg-9-4553-2012, 2012a. a, b, c, d, e, f, g
Balzano, S., Marie, D., Gourvil, P., and Vaulot, D.: Composition of the summer photosynthetic pico and nanoplankton communities in the Beaufort Sea assessed by T-RFLP and sequences of the 18S rRNA gene from flow cytometry sorted samples, ISME J., 6, 1480–1498, https://doi.org/10.1038/ismej.2011.213, 2012b. a
Balzano, S., Percopo, I., Siano, R., Gourvil, P., Chanoine, M., Marie, D., Vaulot, D., and Sarno, D.: Morphological and genetic diversity of Beaufort Sea diatoms with high contributions from the Chaetoceros neogracilis species complex, J. Phycol., 53, 161–187, https://doi.org/10.1111/jpy.12489, 2017. a, b, c
Beaupré-Laperrière, A., Mucci, A., and Thomas, H.: The recent state and variability of the carbonate system of the Canadian Arctic Archipelago and adjacent basins in the context of ocean acidification, Biogeosciences, 17, 3923–3942, https://doi.org/10.5194/bg-17-3923-2020, 2020. a
Bélanger, S., Xie, H. X., Krotkov, N., Larouche, P., Vincent, W. F., and Babin, M.: Photomineralization of terrigenous dissolved organic matter in Arctic coastal waters from 1979 to 2003: Interannual variability and implications of climate change, Global Biogeochem. Cy., 20, GB4005, https://doi.org/10.1029/2006GB002708, 2006a. a, b, c, d
Bélanger, S., Babin, M., and Tremblay, J.-É.: Increasing cloudiness in Arctic damps the increase in phytoplankton primary production due to sea ice receding, Biogeosciences, 10, 4087–4101, https://doi.org/10.5194/bg-10-4087-2013, 2013a. a
Bélanger, S., Cizmeli, S. A., Ehn, J., Matsuoka, A., Doxaran, D., Hooker, S., and Babin, M.: Light absorption and partitioning in Arctic Ocean surface waters: impact of multiyear ice melting, Biogeosciences, 10, 6433–6452, https://doi.org/10.5194/bg-10-6433-2013, 2013b. a, b
Benner, R. and Strom, M.: A critical evaluation of the analytical blank associated with DOC measurements by high-temperature catalytic oxidation, Mar. Chem., 41, 153–160, https://doi.org/10.1016/0304-4203(93)90113-3, 1993. a
Berggren, M., Laudon, H., and Jansson, M.: Aging of allochthonous organic carbon regulates bacterial production in unproductive boreal lakes, Limnol. Oceanogr., 54, 1333–1342, https://doi.org/10.4319/lo.2009.54.4.1333, 2009. a
Blais, M., Ardyna, M., Gosselin, M., Dumont, D., Bélanger, S., Tremblay, J.-É., Gratton, Y., Marchese, C., and Poulin, M.: Contrasting interannual changes in phytoplankton productivity and community structure in the coastal Canadian Arctic Ocean, Limnol. Oceanogr., 62, 2480–2497, https://doi.org/10.1002/lno.10581, 2017. a
Boeuf, D., Cottrell, M., Kirchman, D. L., Lebaron, P., and Jeanthon, C.: Summer community structure of aerobic anoxygenic phototrophic bacteria in the western Arctic Ocean, FEMS Microbiol. Ecol., 85, 417–432, https://doi.org/10.1111/1574-6941.12130, 2013. a
Boeuf, D., Lami, R., Cunnington, E., and Jeanthon, C.: Summer Abundance and Distribution of Proteorhodopsin Genes in the Western Arctic Ocean, Front. Microbiol., 7, 1584, https://doi.org/10.3389/fmicb.2016.01584, 2016. a
Boss, E. and Pegau, W.: Relationship of light scattering at an angle in the backward direction to the backscattering coefficient, Appl. Optics, 40, 5503, https://doi.org/10.1364/AO.40.005503, 2001. a
Bricaud, A., Babin, M., Claustre, H., Ras, J., and Tièche, F.: Light absorption properties and absorption budget of Southeast Pacific waters, J. Geophys. Res., 115, C08009, https://doi.org/10.1029/2009JC005517, 2010. a
Carignan, R., Blais, A.-M., and Vis, C.: Measurement of primary production and community respiration in oligotrophic lakes using the Winkler method, Can. J. Fish. Aquat. Sci., 55, 1078–1084, https://doi.org/10.1139/cjfas-55-5-1078, 1998. a
Carmack, E. C. and Macdonald, R. W.: Oceanography of the Canadian Shelf of the Beaufort Sea: A Setting for Marine Life, Arctic, 55, 29–45, https://doi.org/10.14430/arctic733, 2002. a
Carmack, E. C., Macdonald, R. W., and Papadakis, J. E.: Water mass structure and boundaries in the Mackenzie shelf estuary, J. Geophys. Res., 94, 18043, https://doi.org/10.1029/JC094iC12p18043, 1989. a
Chami, M., Thirouard, A., and Harmel, T.: POLVSM (Polarized Volume Scattering Meter) instrument: an innovative device to measure the directional and polarized scattering properties of hydrosols, Opt. Express, 22, 26403, https://doi.org/10.1364/OE.22.026403, 2014. a
Comeau, A., Harding, T., Galand, P., Vincent, W., and Lovejoy, C.: Vertical distribution of microbial communities in a perennially stratified Arctic lake with saline, anoxic bottom waters, Sci. Rep., 2, 604, https://doi.org/10.1038/srep00604, 2012. a
Commission of the European Community: Manual of quality control procedures for validation of oceanographic data., 436 pp., available at: https://repository.oceanbestpractices.org/handle/11329/167?show=full (last access: 24 February 2014), 1993. a
Cooper, L., Benner, R., McClelland, J., Peterson, B., Holmes, R., Raymond, P., Hansell, D., Grebmeier, J., and Codispoti, L.: Linkages among runoff, dissolved organic carbon, and the stable oxygen isotope composition of seawater and other water mass indicators in the Arctic Ocean, J. Geophys. Res.-Biogeo., 110, G02013, https://doi.org/10.1029/2005JG000031, 2005. a
Cottrell, M. and David, K.: Contribution of major bacterial groups to bacterial biomass production (thymidine and leucine incorporation) in the Delaware estuary, Limnol. Oceanogr., 48, 168–178, https://doi.org/10.4319/lo.2003.48.1.0168, 2003. a
Coupel, P., Matsuoka, A., Ruiz-Pino, D., Gosselin, M., Marie, D., Tremblay, J.-É., and Babin, M.: Pigment signatures of phytoplankton communities in the Beaufort Sea, Biogeosciences, 12, 991–1006, https://doi.org/10.5194/bg-12-991-2015, 2015. a
Dickson, A., Sabine, C., and Christian, J. E.: Guide to Best Practices for Ocean CO2 Measurements, PICES Special Publication, 3, 191, ISBN 1-897176-07-4, 2007. a
Doxaran, D., Babin, M., and Leymarie, E.: Near-infrared light scattering by particles in coastal waters, Opt. Express, 15, 12834, https://doi.org/10.1364/OE.15.012834, 2007. a
Doxaran, D., Ehn, J., Bélanger, S., Matsuoka, A., Hooker, S., and Babin, M.: Optical characterisation of suspended particles in the Mackenzie River plume (Canadian Arctic Ocean) and implications for ocean colour remote sensing, Biogeosciences, 9, 3213–3229, https://doi.org/10.5194/bg-9-3213-2012, 2012a. a, b, c
Doxaran, D., Ehn, J., Bélanger, S., Matsuoka, A., Hooker, S., and Babin, M.: Optical characterisation of suspended particles in the Mackenzie River plume (Canadian Arctic Ocean) and implications for ocean colour remote sensing, Biogeosciences, 9, 3213–3229, https://doi.org/10.5194/bg-9-3213-2012, 2012b. a
Doxaran, D., Devred, E., and Babin, M.: A 50 % increase in the mass of terrestrial particles delivered by the Mackenzie River into the Beaufort Sea (Canadian Arctic Ocean) over the last 10 years, Biogeosciences, 12, 3551–3565, https://doi.org/10.5194/bg-12-3551-2015, 2015. a
Doxaran, D., Leymarie, E., Nechad, B., Dogliotti, A., Ruddick, K., Gernez, P., and Knaeps, E.: Improved correction methods for field measurements of particulate light backscattering in turbid waters, Opt. Express, 24, 3615, https://doi.org/10.1364/OE.24.003615, 2016. a
Durantou, L., Rochon, A., Ledu, D., Massé, G., Schmidt, S., and Babin, M.: Quantitative reconstruction of sea-surface conditions over the last 150 yr in the Beaufort Sea based on dinoflagellate cyst assemblages: the role of large-scale atmospheric circulation patterns, Biogeosciences, 9, 5391–5406, https://doi.org/10.5194/bg-9-5391-2012, 2012. a, b
Ehn, J. K., Reynolds, R. A., Stramski, D., Doxaran, D., Lansard, B., and Babin, M.: Patterns of suspended particulate matter across the continental margin in the Canadian Beaufort Sea during summer, Biogeosciences, 16, 1583–1605, https://doi.org/10.5194/bg-16-1583-2019, 2019. a
Fernández I., C. and Raimbault, P.: Nitrogen regeneration in the NE Atlantic Ocean and its impact on seasonal new, regenerated and export production, Mar. Ecol. Prog. Ser., 337, 79–92, https://doi.org/10.3354/meps337079, 2007. a
Fichot, C., Benner, R., Kaiser, K., Shen, Y., Amon, R., Ogawa, H., and Lu, C.-J.: Predicting Dissolved Lignin Phenol Concentrations in the Coastal Ocean from Chromophoric Dissolved Organic Matter (CDOM) Absorption Coefficients, Front. Mar. Sci., 3, 7, https://doi.org/10.3389/fmars.2016.00007, 2016. a, b
Fichot, C. G. and Benner, R.: A novel method to estimate DOC concentrations from CDOM absorption coefficients in coastal waters, Geophys. Res. Lett., 38, L03610, https://doi.org/10.1029/2010GL046152, 2011. a
Fichot, C. G. and Miller, W. L.: An approach to quantify depth-resolved marine photochemical fluxes using remote sensing: Application to carbon monoxide (CO) photoproduction, Remote Sens. Environ., 114, 1363–1377, https://doi.org/10.1016/j.rse.2010.01.019, 2010. a
Fichot, C. G., Kaiser, K., Hooker, S. B., Amon, R. M. W., Babin, M., Bélanger, S., Walker, S. A., and Benner, R.: Pan-Arctic distributions of continental runoff in the Arctic Ocean, Sci. Rep., 3, 1053, https://doi.org/10.1038/srep01053, 2013. a, b
Forest, A., Babin, M., Stemmann, L., Picheral, M., Sampei, M., Fortier, L., Gratton, Y., Bélanger, S., Devred, E., Sahlin, J., Doxaran, D., Joux, F., Ortega-Retuerta, E., Martín, J., Jeffrey, W. H., Gasser, B., and Carlos Miquel, J.: Ecosystem function and particle flux dynamics across the Mackenzie Shelf (Beaufort Sea, Arctic Ocean): an integrative analysis of spatial variability and biophysical forcings, Biogeosciences, 10, 2833–2866, https://doi.org/10.5194/bg-10-2833-2013, 2013. a
Galeron, M.-A., Radakovitch, O., Charrière, B., Vaultier, F., Volkman, J. K., Bianchi, T. S., Ward, N. D., Medeiros, P. M., Sawakuchi, H. O., Tank, S., Kerhervé, P., and Rontani, J.-F.: Lipoxygenase-induced autoxidative degradation of terrestrial particulate organic matter in estuaries: A widespread process enhanced at high and low latitude, Org. Geochem., 115, 78–92, https://doi.org/10.1016/j.orggeochem.2017.10.013, 2018. a
Ghiglione, J. F., Palacios, C., Marty, J. C., Mével, G., Labrune, C., Conan, P., Pujo-Pay, M., Garcia, N., and Goutx, M.: Role of environmental factors for the vertical distribution (0–1000 m) of marine bacterial communities in the NW Mediterranean Sea, Biogeosciences, 5, 1751–1764, https://doi.org/10.5194/bg-5-1751-2008, 2008. a
Guillot, P. and Gratton, Y.: Malina 0902 CTD Processing Notes, Quebec Ocean internal report, Technical Report, Rimouski, Canada, 102 pp., 2010. a
Harmel, T., Hieronymi, M., Slade, W., Röttgers, R., Roullier, F., and Chami, M.: Laboratory experiments for inter-comparison of three volume scattering meters to measure angular scattering properties of hydrosols, Opt. Express, 24, A234, https://doi.org/10.1364/OE.24.00A234, 2016. a
Holmes, R., Aminot, A., Kérouel, R., Hooker, B., and Peterson, B.: A simple and precise method for measuring ammonium in marine and freshwater ecosystems, Can. J. Fish. Aquat. Sci., 56, 1801–1808, https://doi.org/10.1139/f99-128, 1999. a, b
Hooker, S. B., Morrow, J. H., and Matsuoka, A.: Apparent optical properties of the Canadian Beaufort Sea – Part 2: The 1 % and 1 cm perspective in deriving and validating AOP data products, Biogeosciences, 10, 4511–4527, https://doi.org/10.5194/bg-10-4511-2013, 2013. a
Hooker, S. B., Matsuoka, A., Kudela, R. M., Yamashita, Y., Suzuki, K., and Houskeeper, H. F.: A global end-member approach to derive aCDOM(440) from near-surface optical measurements, Biogeosciences, 17, 475–497, https://doi.org/10.5194/bg-17-475-2020, 2020. a
Kaiser, K. and Benner, R.: Hydrolysis-induced racemization of amino acids, Limnol. Oceanogr.-Meth., 3, 318–325, https://doi.org/10.4319/lom.2005.3.318, 2005. a
Kirchman, D.: Leucine incorporation as a measure of biomass production by heterotrophic bacteria, in: Handbook of Methods in Aquatic Microbial Ecology, edited by: Kemp, P. F., Sherr, B. F., Sherr, E. B., Cole, J. J., CRC Press, Boca Raton, 509–512, https://doi.org/10.1201/9780203752746, 2018. a
Kirchman, D. L., Morán, X. A. G., and Ducklow, H.: Microbial growth in the polar oceans – role of temperature and potential impact of climate change, Nat. Rev. Microbiol., 7, 451–459, https://doi.org/10.1038/nrmicro2115, 2009. a
Kirkwood, D.: Stability of solutions of nutrient salts during storage, Mar. Chem., 38, 151–164, https://doi.org/10.1016/0304-4203(92)90032-6, 1992. a
Lansard, B., Mucci, A., Miller, L., Macdonald, R., and Gratton, Y.: Seasonal variability of water mass distribution in the southeastern Beaufort Sea determined by total alkalinity and δ18O, J. Geophys. Res.-Oceans, 117, C03003, https://doi.org/10.1029/2011JC007299, 2012. a, b
Le Fouest, V., Zakardjian, B., Xie, H., Raimbault, P., Joux, F., and Babin, M.: Modeling plankton ecosystem functioning and nitrogen fluxes in the oligotrophic waters of the Beaufort Sea, Arctic Ocean: a focus on light-driven processes, Biogeosciences, 10, 4785–4800, https://doi.org/10.5194/bg-10-4785-2013, 2013. a
Link, H., Chaillou, G., Forest, A., Piepenburg, D., and Archambault, P.: Multivariate benthic ecosystem functioning in the Arctic – benthic fluxes explained by environmental parameters in the southeastern Beaufort Sea, Biogeosciences, 10, 5911–5929, https://doi.org/10.5194/bg-10-5911-2013, 2013a. a, b, c
Link, H., Chaillou, G., Forest, A., Piepenburg, D., and Archambault, P.: Multivariate benthic ecosystem functioning in the Arctic – benthic fluxes explained by environmental parameters in the southeastern Beaufort Sea, Biogeosciences, 10, 5911–5929, https://doi.org/10.5194/bg-10-5911-2013, 2013b. a
Link, H., Piepenburg, D., and Archambault, P.: Are Hotspots Always Hotspots? The Relationship between Diversity, Resource and Ecosystem Functions in the Arctic, PLoS ONE, 8, e74077, https://doi.org/10.1371/journal.pone.0074077, 2013c. a
Link, H., Archambault, P., and Piepenburg, D.: Sediment oxygen uptake, benthic boundary fluxes, macrofaunal abundance and biodiversity, Chl a, phaeopigments and nitrogen and organic carbon content at the sediment-water interface in the Canadian Arctic in 2008 and 2009, Pangaea, https://doi.org/10.1594/PANGAEA.908091, 2019. a, b, c
Louchouarn, P., Opsahl, S., and Benner, R.: Isolation and Quantification of Dissolved Lignin from Natural Waters Using Solid-Phase Extraction and GC/MS, Anal. Chem., 72, 2780–2787, https://doi.org/10.1021/ac9912552, 2000. a
Macdonald, R. W., Carmack, E. C., McLaughlin, F. A., Iseki, K., Macdonald, D. M., and O'Brien, M. C.: Composition and modification of water masses in the Mackenzie shelf estuary, J. Geophys. Res., 94, 18057, https://doi.org/10.1029/JC094iC12p18057, 1989. a
Marcel, B., Morel, A., and Gagnon, R.: An incubator designed for extensive and sensitive measurements of phytoplankton photosynthetic parameters, Limnol. Oceanogr., 39, 694–702, https://doi.org/10.4319/lo.1994.39.3.0694, 1994. a
Marchand, D. and Rontani, J.-F.: Characterisation of photo-oxidation and autoxidation products of phytoplanktonic monounsaturated fatty acids in marine particulate matter and recent sediments, Org. Geochem., 32, 287–304, https://doi.org/10.1016/S0146-6380(00)00175-3, 2001. a
Marie, D., Partensky, F., Jacquet, S., and Vaulot, D.: Enumeration and Cell Cycle Analysis of Natural Populations of Marine Picoplankton by Flow Cytometry Using the Nucleic Acid Stain SYBR Green I., Appl. Environ. Microb., 63, 186–193, https://doi.org/10.1128/AEM.63.1.186-193.1997, 1997. a
Marie, D., Brussaard, C. P. D., Partensky, F., and Vaulot, D.: Flow cytometric analysis of phytoplankton, bacteria and viruses, in: Current protocols in cytometry, edited by: Robinson, J. P., John Wiley and Sons, New York, USA, 1–15, 1999. a
Marie, D., Rigaut-Jalabert, F., and Vaulot, D.: An improved protocol for flow cytometry analysis of phytoplankton cultures and natural samples, Cytom. Part. A., 85, 962–968, https://doi.org/10.1002/cyto.a.22517, 2014. a
Massicotte, P.: MALINA data paper source code, Zenodo,https://doi.org/10.5281/zenodo.4518943, 2021. a
Massicotte, P., Asmala, E., Stedmon, C., and Markager, S.: Global distribution of dissolved organic matter along the aquatic continuum: Across rivers, lakes and oceans, Sci. Total Environ., 609, 180–191, https://doi.org/10.1016/j.scitotenv.2017.07.076, 2017. a
Massicotte, P., Amon, R., Antoine, D., Archambault, P., Balzano, S., Bélanger, S., Benner, R., Boeuf, D., Bricaud, A., Bruyant, F., Chaillou, G., Chami, M., Charrière, B., Chen, J., Claustre, H., Coupel, P., Delsaut, N., Doxaran, D., Ehn, J., Fichot, C., Forget, M.-H., Fu, P., Gagnon, J., Garcia, N., Gasser, B., Ghiglione, J.-F., Gorsky, G., Gosselin, M., Gourvil, P., Gratton, Y., Guillot, P., Heipieper, H. J., Heussner, S., Hooker, S., Huot, Y., Jacq, V., Jeanthon, C., Jeffrey, W., Joux, F., Kawamura, K., Lansard, B., Leymarie, E., Link, H., Lovejoy, C., Marec, C., Marie, D., Martin, J., Massé, G., Matsuoka, A., McKague, V., Mignot, A., Miller, W. L., Miquel, J.-C., Mucci, A., Ono, K., Ortega, E., Panagiotopoulos, C., Papakyriakou, T., Para, J., Picheral, M., Piepenburg, D., Prieur, L., Raimbault, P., Ras, J., Reynolds, R. A., Rochon, A., Rontani, J.-F., Schmechtig, C., Schmidt, S., Sempéré, R., Shen, Y., Song, G., Stramski, D., Stroud, G., D., Tachibana, E., Thirouard, A., Tolosa, I., Tremblay, J.-É., Vaïtilingom, M., Vaulot, D., Vaultier, F., Volkman, J. K., Vonk, J. E., Xie, H., Zheng, G., and Babin, M.: The Malina oceanographic expedition: How do changes in ice cover, permafrost and UV radiation impact on biodiversity and biogeochemical fluxes in the Arctic Ocean?, SEANOE, https://doi.org/10.17882/75345, 2020. a, b
Matsuoka, A., Hill, V., Huot, Y., Babin, M., and Bricaud, A.: Seasonal variability in the light absorption properties of western Arctic waters: Parameterization of the individual components of absorption for ocean color applications, J. Geophys. Res., 116, C02007, https://doi.org/10.1029/2009JC005594, 2011. a
Matsuoka, A., Bricaud, A., Benner, R., Para, J., Sempéré, R., Prieur, L., Bélanger, S., and Babin, M.: Tracing the transport of colored dissolved organic matter in water masses of the Southern Beaufort Sea: relationship with hydrographic characteristics, Biogeosciences, 9, 925–940, https://doi.org/10.5194/bg-9-925-2012, 2012a. a
Matsuoka, A., Bricaud, A., Benner, R., Para, J., Sempéré, R., Prieur, L., Bélanger, S., and Babin, M.: Tracing the transport of colored dissolved organic matter in water masses of the Southern Beaufort Sea: relationship with hydrographic characteristics, Biogeosciences, 9, 925–940, https://doi.org/10.5194/bg-9-925-2012, 2012b. a
Matsuoka, A., Babin, M., Doxaran, D., Hooker, S. B., Mitchell, B. G., Bélanger, S., and Bricaud, A.: A synthesis of light absorption properties of the Arctic Ocean: application to semianalytical estimates of dissolved organic carbon concentrations from space, Biogeosciences, 11, 3131–3147, https://doi.org/10.5194/bg-11-3131-2014, 2014. a
Miller, W. L. and Zepp, R. G.: Photochemical production of dissolved inorganic carbon from terrestrial organic matter: Significance to the oceanic organic carbon cycle, Geophys. Res. Lett., 22, 417–420, https://doi.org/10.1029/94GL03344, 1995. a
Miquel, J.-C., Gasser, B., Martín, J., Marec, C., Babin, M., Fortier, L., and Forest, A.: Downward particle flux and carbon export in the Beaufort Sea, Arctic Ocean; the role of zooplankton, Biogeosciences, 12, 5103–5117, https://doi.org/10.5194/bg-12-5103-2015, 2015. a
Mobley, C.: Estimation of the remote-sensing reflectance from above-surface measurements, Appl. Optics, 38, 7442, https://doi.org/10.1364/AO.38.007442, 1999. a
Monier, A., Findlay, H., Charvet, S., and Lovejoy, C.: Late winter under ice pelagic microbial communities in the high Arctic Ocean and the impact of short-term exposure to elevated CO2 levels, Front. Microbiol., 5, 490, https://doi.org/10.3389/fmicb.2014.00490, 2014. a
Monier, A., Comte, J., Babin, M., Forest, A., Matsuoka, A., and Lovejoy, C.: Oceanographic structure drives the assembly processes of microbial eukaryotic communities, ISME J., 9, 990–1002, https://doi.org/10.1038/ismej.2014.197, 2015. a
Morales-Sánchez, D., Schulze, P. S., Kiron, V., and Wijffels, R. H.: Production of carbohydrates, lipids and polyunsaturated fatty acids (PUFA) by the polar marine microalga Chlamydomonas malina RCC2488, Algal Res., 50, 102016, https://doi.org/10.1016/j.algal.2020.102016, 2020. a
Morel, A.: Optical properties of pure water and pure sea water, in: Optical Aspects of Oceanography, edited by: Jerlov, N. and Nielsen, E. S., Academic Press, New York, USA, 1–24, 1974. a
Mucci, A., Lansard, B., Miller, L., and Papakyriakou, T.: CO2 fluxes across the air-sea interface in the southeastern Beaufort Sea: Ice-free period, J. Geophys. Res., 115, C04003, https://doi.org/10.1029/2009JC005330, 2010. a
Neukermans, G., Reynolds, R., and Stramski, D.: Optical classification and characterization of marine particle assemblages within the western Arctic Ocean, Limnol. Oceanogr., 61, 1472–1494, https://doi.org/10.1002/lno.10316, 2016. a
Ortega-Retuerta, E., Jeffrey, W. H., Babin, M., Bélanger, S., Benner, R., Marie, D., Matsuoka, A., Raimbault, P., and Joux, F.: Carbon fluxes in the Canadian Arctic: patterns and drivers of bacterial abundance, production and respiration on the Beaufort Sea margin, Biogeosciences, 9, 3679–3692, https://doi.org/10.5194/bg-9-3679-2012, 2012a. a, b, c, d
Ortega-Retuerta, E., Jeffrey, W. H., Ghiglione, J. F., and Joux, F.: Evidence of heterotrophic prokaryotic activity limitation by nitrogen in the Western Arctic Ocean during summer, Polar Biol., 35, 785–794, https://doi.org/10.1007/s00300-011-1109-8, 2012b. a, b
Ortega-Retuerta, E., Joux, F., Jeffrey, W. H., and Ghiglione, J. F.: Spatial variability of particle-attached and free-living bacterial diversity in surface waters from the Mackenzie River to the Beaufort Sea (Canadian Arctic), Biogeosciences, 10, 2747–2759, https://doi.org/10.5194/bg-10-2747-2013, 2013. a, b
Panagiotopoulos, C., Sempéré, R., Jacq, V., and Charrière, B.: Composition and distribution of dissolved carbohydrates in the Beaufort Sea Mackenzie margin (Arctic Ocean), Mar. Chem., 166, 92–102, https://doi.org/10.1016/j.marchem.2014.09.004, 2014. a
Para, J., Charrière, B., Matsuoka, A., Miller, W. L., Rontani, J. F., and Sempéré, R.: UV/PAR radiation and DOM properties in surface coastal waters of the Canadian shelf of the Beaufort Sea during summer 2009, Biogeosciences, 10, 2761–2774, https://doi.org/10.5194/bg-10-2761-2013, 2013. a
Pegau, W. S., Gray, D., and Zaneveld, J.: Absorption and attenuation of visible and near-infrared light in water: dependence on temperature and salinity, Appl. Optics, 36, 6035, https://doi.org/10.1364/AO.36.006035, 1997. a
Percopo, I., Ruggiero, M. V., Balzano, S., Gourvil, P., Lundholm, N., Siano, R., Tammilehto, A., Vaulot, D., and Sarno, D.: Pseudo-nitzschia arctica sp. nov., a new cold-water cryptic Pseudo-nitzschia species within the P. pseudodelicatissima complex, J. Phycol., 52, 184–199, https://doi.org/10.1111/jpy.12395, 2016. a
Picheral, M., Guidi, L., Stemmann, L., Karl, D., Iddaoud, G., and Gorsky, G.: The Underwater Vision Profiler 5: An advanced instrument for high spatial resolution studies of particle size spectra and zooplankton, Limnol. Oceanogr.-Meth, 8, 462–473, https://doi.org/10.4319/lom.2010.8.462, 2010. a
Picheral, M., Colin, S., and Irisson, J.-O.: EcoTaxa, a tool for the taxonomic classification of images, available at: http://ecotaxa.obs-vlfr.fr (last access: 25 February 2021), 2017. a
Poteau, A., Boss, E., and Claustre, H.: Particulate concentration and seasonal dynamics in the mesopelagic ocean based on the backscattering coefficient measured with Biogeochemical-Argo floats, Geophys. Res. Lett., 44, 6933–6939, https://doi.org/10.1002/2017GL073949, 2017. a
Raimbault, P. and Garcia, N.: Evidence for efficient regenerated production and dinitrogen fixation in nitrogen-deficient waters of the South Pacific Ocean: impact on new and export production estimates, Biogeosciences, 5, 323–338, https://doi.org/10.5194/bg-5-323-2008, 2008. a, b
Raimbault, P., Slawyk, G., Coste, B., and Fry, J.: Feasibility of using an automated colorimetric procedure for the determination of seawater nitrate in the 0 to 100 nM range: Examples from field and culture, Mar. Biol., 104, 347–351, https://doi.org/10.1007/BF01313277, 1990. a
Raimbault, P., Diaz, F., Pouvesle, W., and Boudjellal, B.: Simultaneous determination of particulate organic carbon, nitrogen and phosphorus collected on filters, using a semi-automatic wet-oxidation method, Mar. Ecol. Prog. Ser., 180, 289–295, https://doi.org/10.3354/meps180289, 1999a. a
Raimbault, P., Pouvesle, W., Diaz, F., Garcia, N., and Sempéré, R.: Wet-oxidation and automated colorimetry for simultaneous determination of organic carbon, nitrogen and phosphorus dissolved in seawater, Mar. Chem., 66, 161–169, https://doi.org/10.1016/S0304-4203(99)00038-9, 1999b. a, b
Raimbault, P., Slawyk, G., Boudjellal, B., Coatanoan, C., Conan, P., Coste, B., Garcia, N., Moutin, T., and Pujo-Pay, M.: Carbon and nitrogen uptake and export in the equatorial Pacific at 150∘W: Evidence of an efficient regenerated production cycle, J. Geophys. Res.-Oceans, 104, 3341–3356, https://doi.org/10.1029/1998JC900004, 1999c. a, b
Ras, J., Claustre, H., and Uitz, J.: Spatial variability of phytoplankton pigment distributions in the Subtropical South Pacific Ocean: comparison between in situ and predicted data, Biogeosciences, 5, 353–369, https://doi.org/10.5194/bg-5-353-2008, 2008. a
Raymond, P. A., McClelland, J. W., Holmes, R. M., Zhulidov, A. V., Mull, K., Peterson, B. J., Striegl, R. G., Aiken, G. R., and Gurtovaya, T. Y.: Flux and age of dissolved organic carbon exported to the Arctic Ocean: A carbon isotopic study of the five largest arctic rivers, Global Biogeochem. Cy., 21, GB4011, https://doi.org/10.1029/2007GB002934, 2007. a
Reynolds, R., Stramski, D., and Neukermans, G.: Optical backscattering by particles in Arctic seawater and relationships to particle mass concentration, size distribution, and bulk composition, Limnol. Oceanogr., 61, 1869–1890, https://doi.org/10.1002/lno.10341, 2016. a
Reynolds, R. A., Stramski, D., Wright, V. M., and Woźniak, S. B.: Measurements and characterization of particle size distributions in coastal waters, J. Geophys. Res., 115, C08024, https://doi.org/10.1029/2009JC005930, 2010. a
Rontani, J.-F., Charriere, B., Forest, A., Heussner, S., Vaultier, F., Petit, M., Delsaut, N., Fortier, L., and Sempéré, R.: Intense photooxidative degradation of planktonic and bacterial lipids in sinking particles collected with sediment traps across the Canadian Beaufort Shelf (Arctic Ocean), Biogeosciences, 9, 4787–4802, https://doi.org/10.5194/bg-9-4787-2012, 2012a. a, b
Rontani, J.-F., Charriere, B., Petit, M., Vaultier, F., Heipieper, H. J., Link, H., Chaillou, G., and Sempéré, R.: Degradation state of organic matter in surface sediments from the Southern Beaufort Sea: a lipid approach, Biogeosciences, 9, 3513–3530, https://doi.org/10.5194/bg-9-3513-2012, 2012b. a, b, c
Rontani, J.-F., Charrière, B., Sempéré, R., Doxaran, D., Vaultier, F., Vonk, J. E., and Volkman, J. K.: Degradation of sterols and terrigenous organic matter in waters of the Mackenzie Shelf, Canadian Arctic, Org. Geochem., 75, 61–73, https://doi.org/10.1016/j.orggeochem.2014.06.002, 2014. a, b
Röttgers, R. and Gehnke, S.: Measurement of light absorption by aquatic particles: improvement of the quantitative filter technique by use of an integrating sphere approach, Appl. Optics, 51, 1336, https://doi.org/10.1364/AO.51.001336, 2012. a, b, c
Ruddick, K., De Cauwer, V., Park, Y.-J., and Moore, G.: Seaborne measurements of near infrared water-leaving reflectance: The similarity spectrum for turbid waters, Limnol. Oceanogr., 51, 1167–1179, https://doi.org/10.4319/lo.2006.51.2.1167, 2006. a
Runyan, H., Reynolds, R., and Stramski, D.: Evaluation of Particle Size Distribution Metrics to Estimate the Relative Contributions of Different Size Fractions Based on Measurements in Arctic Waters, J. Geophys. Res.-Oceans, 125, e2020JC016218, https://doi.org/10.1029/2020JC016218, 2020. a
Sea-Bird Scientific.: Software Manual Seasoft V2: SBE Data Processing CTD Data Processing and Plotting Software, Sea-Bird Scientific, available at: https://www.seabird.com/asset-get.download.jsa?code=251446, last access: 9 December 2017. a
Sempéré, R., Vaïtilingom, M., Charrière, B., Kawamura, K., and Panagiotopoulos, C.: Dicarboxylic and Oxocarboxylic Acids in the Arctic Coastal Ocean (Beaufort Sea‐Mackenzie Margin), Global Biogeochem. Cy., 33, 927–940, https://doi.org/10.1029/2018GB006165, 2019. a
Shen, Y., Fichot, C. G., and Benner, R.: Dissolved organic matter composition and bioavailability reflect ecosystem productivity in the Western Arctic Ocean, Biogeosciences, 9, 4993–5005, https://doi.org/10.5194/bg-9-4993-2012, 2012. a, b, c, d, e
Smith, D. and Azam, F.: A simple, economical meth- od for measuring bacterial protein synthesis rates in seawater using 3H-leucine, Mar. Microb. Food Webs, 6, 107–114, 1992. a
Sohrin, R. and Sempéré, R.: Seasonal variation in total organic carbon in the northeast Atlantic in 2000–2001, J. Geophys. Res., 110, C10S90, https://doi.org/10.1029/2004JC002731, 2005. a
Song, G., Xie, H., Bélanger, S., Leymarie, E., and Babin, M.: Spectrally resolved efficiencies of carbon monoxide (CO) photoproduction in the western Canadian Arctic: particles versus solutes, Biogeosciences, 10, 3731–3748, https://doi.org/10.5194/bg-10-3731-2013, 2013. a, b, c, d
Stein, R. and Macdonald, R. W.: Organic Carbon Budget: Arctic Ocean vs. Global Ocean, in: The Organic Carbon Cycle in the Arctic Ocean, edited by: Stein, R. and MacDonald, R. W., Springer, Berlin and Heidelberg, Germany, 315–322, https://doi.org/10.1007/978-3-642-18912-8_8, 2004. a
Sullivan, J., Twardowski, M., Zaneveld, J., Moore, C., Barnard, A., Donaghay, P., and Rhoades, B.: Hyperspectral temperature and salt dependencies of absorption by water and heavy water in the 400–750 nm spectral range, Appl. Optics, 45, 5294, https://doi.org/10.1364/AO.45.005294, 2006. a
Taalba, A., Xie, H., Scarratt, M. G., Bélanger, S., and Levasseur, M.: Photooxidation of dimethylsulfide (DMS) in the Canadian Arctic, Biogeosciences, 10, 6793–6806, https://doi.org/10.5194/bg-10-6793-2013, 2013. a
Tank, S. E., Striegl, R. G., McClelland, J. W., and Kokelj, S. V.: Multi-decadal increases in dissolved organic carbon and alkalinity flux from the Mackenzie drainage basin to the Arctic Ocean, Environ. Res. Lett., 11, 054015, https://doi.org/10.1088/1748-9326/11/5/054015, 2016. a
Tedetti, M., Kawamura, K., Narukawa, M., Joux, F., Charrière, B., and Sempéré, R.: Hydroxyl radical-induced photochemical formation of dicarboxylic acids from unsaturated fatty acid (oleic acid) in aqueous solution, J. Photoch. Photobio. A, 188, 135–139, https://doi.org/10.1016/j.jphotochem.2006.11.029, 2007. a
Tolosa, I. and de Mora, S.: Isolation of neutral and acidic lipid biomarker classes for compound-specific-carbon isotope analysis by means of solvent extraction and normal-phase high-performance liquid chromatography, J. Chromatogr. A, 1045, 71–84, https://doi.org/10.1016/j.chroma.2004.06.037, 2004. a
Tolosa, I., Fiorini, S., Gasser, B., Martín, J., and Miquel, J. C.: Carbon sources in suspended particles and surface sediments from the Beaufort Sea revealed by molecular lipid biomarkers and compound-specific isotope analysis, Biogeosciences, 10, 2061–2087, https://doi.org/10.5194/bg-10-2061-2013, 2013. a, b, c
Tremblay, J.-É., Raimbault, P., Garcia, N., Lansard, B., Babin, M., and Gagnon, J.: Impact of river discharge, upwelling and vertical mixing on the nutrient loading and productivity of the Canadian Beaufort Shelf, Biogeosciences, 11, 4853–4868, https://doi.org/10.5194/bg-11-4853-2014, 2014. a, b, c, d, e, f
U.S. National Ice Center: U.S. National Ice Center Arctic and Antarctic Sea Ice Concentration and Climatologies in Gridded Format, NSIDC, G10033, https://doi.org/10.7265/46CC-3952, 2020. a
Vaqué, D., Guadayol, Ò., Peters, F., Felipe, J., Angel-Ripoll, L., Terrado, R., Lovejoy, C., and Pedrós-Alioó, C.: Seasonal changes in planktonic bacterivory rates under the ice-covered coastal Arctic Ocean, Limnol. Oceanogr., 53, 2427–2438, https://doi.org/10.4319/lo.2008.53.6.2427, 2008. a
Wei, C., Cusson, M., Archambault, P., Belley, R., Brown, T., Burd, B., Edinger, E., Kenchington, E., Gilkinson, K., Lawton, P., Link, H., Ramey‐Balci, P., Scrosati, R., and Snelgrove, P.: Seafloor biodiversity of Canada's three oceans: Patterns, hotspots and potential drivers, Divers. Distrib., 26, 226–241, https://doi.org/10.1111/ddi.13013, 2020. a
Weishaar, J. L., Aiken, G. R., Bergamaschi, B. A., Fram, M. S., Fujii, R., and Mopper, K.: Evaluation of Specific Ultraviolet Absorbance as an Indicator of the Chemical Composition and Reactivity of Dissolved Organic Carbon, Environ. Sci. Technol., 37, 4702–4708, https://doi.org/10.1021/es030360x, 2003. a
Westerhoff, P., Chao, P., and Mash, H.: Reactivity of natural organic matter with aqueous chlorine and bromine, Water Res., 38, 1502–1513, https://doi.org/10.1016/j.watres.2003.12.014, 2004. a
Xie, H., Bélanger, S., Demers, S., Vincent, W. F., and Papakyriakou, T. N.: Photobiogeochemical cycling of carbon monoxide in the southeastern Beaufort Sea in spring and autumn, Limnol. Oceanogr., 54, 234–249, https://doi.org/10.4319/lo.2009.54.1.0234, 2009. a
Xie, H., Bélanger, S., Song, G., Benner, R., Taalba, A., Blais, M., Tremblay, J.-É., and Babin, M.: Photoproduction of ammonium in the southeastern Beaufort Sea and its biogeochemical implications, Biogeosciences, 9, 3047–3061, https://doi.org/10.5194/bg-9-3047-2012, 2012. a, b
Xing, X., Morel, A., Claustre, H., D'Ortenzio, F., and Poteau, A.: Combined processing and mutual interpretation of radiometry and fluorometry from autonomous profiling Bio-Argo floats: 2. Colored dissolved organic matter absorption retrieval, J. Geophys. Res.-Oceans, 117, C04022, https://doi.org/10.1029/2011JC007632, 2012. a
Yau, S., Lopes dos Santos, A., Eikrem, W., Gérikas Ribeiro, C., Gourvil, P., Balzano, S., Escande, M.-L., Moreau, H., and Vaulot, D.: Mantoniella beaufortii and Mantoniella baffinensis sp. nov. (Mamiellales, Mamiellophyceae), two new green algal species from the high arctic 1, J. Phycol., 56, 37–51, https://doi.org/10.1111/jpy.12932, 2020. a