the Creative Commons Attribution 4.0 License.
the Creative Commons Attribution 4.0 License.
 | 15 Apr 2021
ADHI: the African Database of Hydrometric Indices (1950–2018)
Nathalie Rouché
Jean-Emmanuel Paturel
Gil Mahé
Jean-François Boyer
Ernest Amoussou
Ansoumana Bodian
Honoré Dacosta
Hamouda Dakhlaoui
Alain Dezetter
Denis Hughes
Lahoucine Hanich
Christophe Peugeot
Raphael Tshimanga
Patrick Lachassagne
The African continent is probably the one with the lowest density of hydrometric stations currently measuring river discharge despite the fact that the number of operating stations was quite important until the 1970s. This new African Database of Hydrometric Indices (ADHI) provides a wide range of hydrometric indices and hydrological signatures computed from different sources of data after a quality control. It includes 1466 stations with at least 10 years of daily discharge data over the period 1950–2018. The average record length is 33 years, and 131 stations have complete records over 50 years. With this new dataset spanning most climatic regions of the African continent, several hydrometric indices have been computed, representing mean flow characteristics and extremes (low flows and floods), and are accessible to the scientific community. The database will be updated on a regular basis to include more hydrometric stations and longer time series of river discharge. The ADHI is available for download at: https://doi.org/10.23708/LXGXQ9 (Tramblay and Rouché, 2020).
- Article
(3524 KB) - Full-text XML
- BibTeX
- EndNote


There is a growing need for large-scale streamflow archives (Addor et al., 2020; Hannah et al., 2011) that are extremely useful for evaluating continental land-surface simulations (Archfield et al., 2015; Newman et al., 2015; Ghiggi et al., 2019; Do et al., 2020) and remote sensing data products (Beck et al., 2017; Brocca et al., 2019; Forootan et al., 2019; Satgé et al., 2020), developing operational flood or drought monitoring systems (Alfieri et al., 2020; Harrigan et al., 2020; Lavers et al., 2019; Thiemig et al., 2011), and evaluating aquifer outflows and characteristics (Dewandel et al., 2003, 2004). In Africa, the density of active monitoring networks is lower compared to other continents, and there are challenges in the exchange of hydrometric data across countries (Mahé and Olivry, 1999; Viglione et al., 2010; Mahe et al., 2013; Stewart, 2015; Dixon et al., 2020).
African countries are largely underrepresented in large-scale databases such as the Global Runoff Data Center (GRDC) or the recent GSIM initiative (Do et al., 2018; Gudmundsson et al., 2018), and/or the time series are mostly not updated. At the African scale, there is still a lack of coordination for hydrological data collection and dissemination despite the launch in 1975 of the UNESCO Intergovernmental Hydrological Program (IHP) dedicated to water research and water resources management, as well as education and capacity building. This initiative enhanced the setup and management of international rainfall and runoff databases at the regional scale of the FRIEND programs (Van Lanen et al., 2014), but these are still largely not updated. There is still not enough partnership between the national hydrological services, and in many countries licensing issues prevent the distribution of the data collected.
The density of monitoring networks in Africa has been declining over time, a serious concern for hydrologists since data acquisition and experimental data analysis remain central to understanding hydrological processes and their spatiotemporal variability (Hannah et al., 2011; Roudier et al., 2014; Blume et al., 2017; Beven et al., 2020). There are several reasons for this decline: the budgetary austerity measures imposed by the international financial institutions, the lack of permanent funding of national hydrological services, and the typically low number of well-trained technical staff in these departments (Bodian et al., 2016, 2020; Hannah et al., 2011). As a result, hydrological monitoring is now often dependent on research projects that cannot support long-term observations. Studies focusing on regional river discharge variability are rare at the scale of Africa due to the lack of data. For instance, Conway et al. (2009) could only present a study on a reduced number of representative regional basins, and Roudier et al. (2014) compared only published anomaly results in their review of climate change impacts on the hydrology of West Africa.
Since in many cases, there are strict conditions related to the redistribution of unprocessed data (Do et al., 2018), it is very often not possible to provide the complete time series of discharge data. To address these challenges, the focus has been shifted to publishing hydrological indices and signatures, which are useful for characterizing the behavior of different components of river discharge, from low flows to annual runoff to floods (Addor et al., 2018; McMillan et al., 2017), and for assessing the potential impact of climate change and human activities on river regimes (Mahe et al., 2013). They can be used for various purposes, including basin classifications, aquifer properties characterization, and hydrological predictions in ungauged catchments (Westerberg et al., 2016; Gnann et al., 2020), and to investigate long-term trends for different hydrological processes (Do et al., 2017; Nka et al., 2015). We introduce here the African Dataset of Hydrometric Indices (ADHI) that aims at giving access to an ensemble of hydrometric indices computed from an unprecedentedly large ensemble of stations with daily discharge data (Tramblay et al., 2020; Tramblay and Rouché, 2020). Thus, useful information regarding the African rivers' variability over the last 68 years can be shared with the international community while respecting the confidentiality of the original records when these are not allowed to be publicly shared by the national authorities.
2.1 Data collection
The database used in the present work is based on the collection of stations from the Global Runoff Data Center (GRDC) and the SIEREM database (Boyer et al., 2006; Dieulin et al., 2019). The hydro-climatological data contained in SIEREM are the legacy of the former Laboratoire d'Hydrologie of the Office de la recherche scientifique et technique outre-mer (ORSTOM; now Institut de Recherche pour le Développement, IRD, France). It must be noted that in addition to the daily data, the SIEREM database also contains instantaneous rainfall and discharge for hundreds of experimental small catchments mostly established in the 1950s and 1960s. The criterion to include a station in the ADHI is that it has a minimum of 10 full years, not necessarily consecutive, of daily discharge data between 1950 and 2018. Most of the hydrological stations in French-speaking countries have been set up and managed for decades by the ORSTOM institute (Mahé and Olivry, 1999). At the time the data were processed, the SIEREM database included a total of 1046 series, with several of them being duplicates of the same monitoring station but for different time periods. There are a total of 101 stations with two times series, 42 stations with three time series, 24 stations with four time series, and 7 stations with five time series. In most cases, one time series includes the longest record, and that one was kept for the analysis in the present paper. For some stations, the different time series were differing substantially during the same period due to different rating curves. A visual inspection of these series led to the elimination of erroneous or doubtful data. Only for 17 stations were the time series concatenated after making sure the rating curve(s) applied on the different time periods to compute river discharge were adequate by comparing daily runoff on a common period. Additionally, to these 1046 series, 933 stations have been retrieved from the GRDC database. For 106 of these stations, there was a duplicate station in the SIEREM database with longer time series, and the latter was selected. After this data quality processing step, 672 stations were kept for SIEREM and 794 for the GRDC database for a total of 1466 stations (Fig. 1). The stations from SIEREM mostly cover the western, central, and northern African regions and stations from the GRDC the eastern and southern parts of Africa. Figure 2 depicts the number of stations available per year, showing a sharp decline at the end of the 1980s, and shows the number of stations having from 10 to 69 years of record. It can be seen that, for about 100 stations, complete records are available for over 50 years.
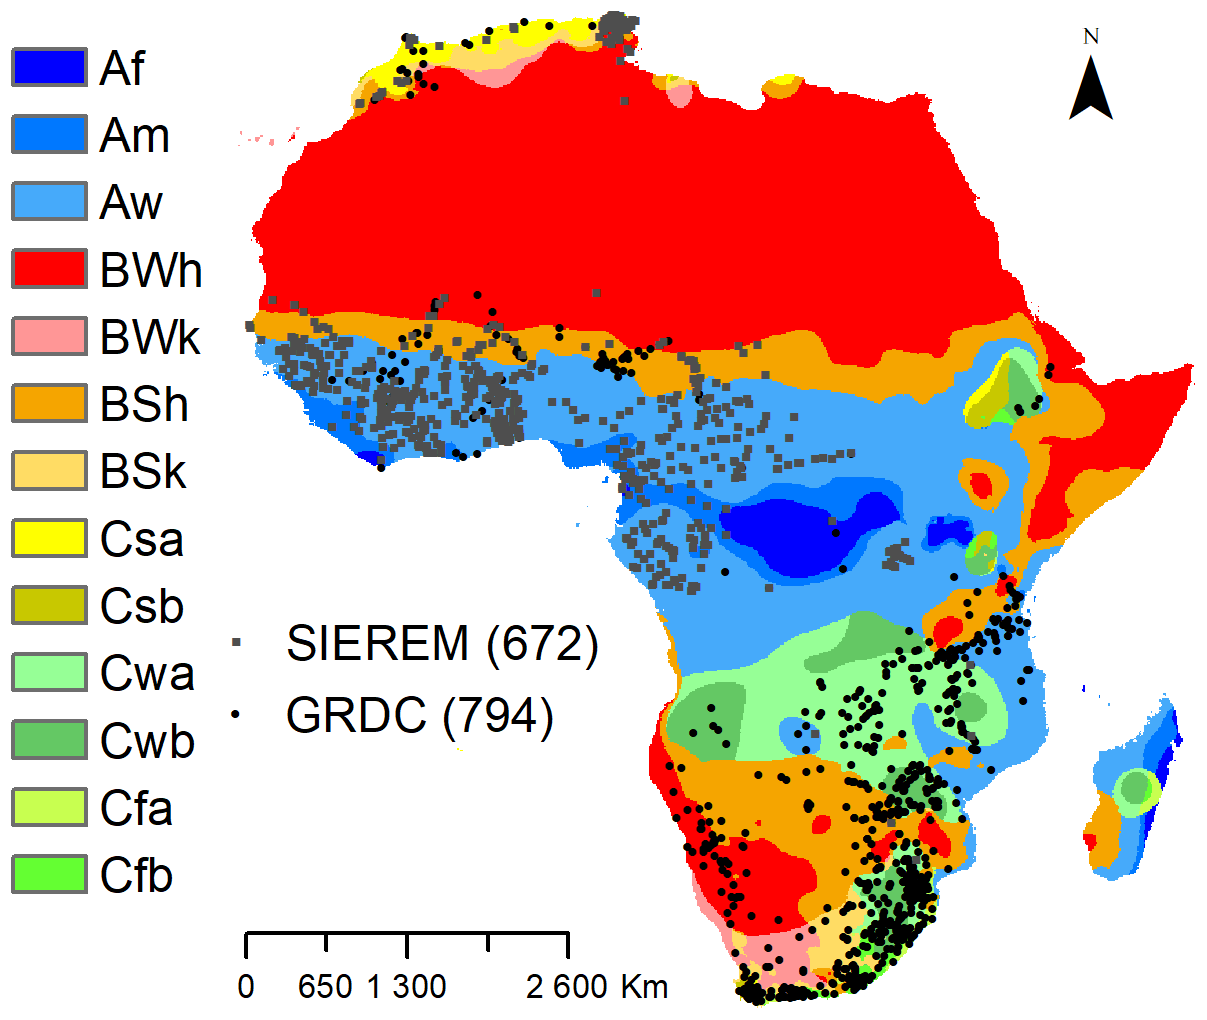
Figure 1Map of the selected stations for the ADHI from the SIEREM and GRDC datasets. The different colors represent the main climate zones in Africa from the Köppen–Geiger climate classification (Peel et al., 2007).

Figure 2Number of available stations per year with less than 5 % missing data (a) and number of stations available for different record lengths (b).
2.2 Data quality
Since the data collected are sometimes from manual records, they are subject to possible errors in the reporting of discharge values. For outlier detection, no single method can outperform visual inspection and local expert knowledge (Crochemore et al., 2020). Indeed, in rivers with a strong variability in the annual regime and extremes, the most important flood peaks may be wrongly reported as outliers. Consequently, we carried out a visual inspection of the data when the maximum value was exceeding 5 times the median discharge. For only a few data points in the discharge time series, some obvious errors were detected with daily discharge exceeding by several orders of magnitude the median flow. In these cases, the data have been reported as missing data in an absence of an objective criterion to correct the record. In addition, through visual inspection it was possible to identify stations to which some gap filling methods have been applied (13 stations) or for which the data are suspicious (28 stations). A flag has been added in the metadata to identify these stations. It is worth noting that, for the stations of the SIEREM database, most of the data were analyzed and criticized prior to the inclusion in the database by the former ORSTOM hydrology laboratory with therefore a reduced level of error in the archived data.
In addition, to detect possible shifts in the data due to non-natural influences, such as an artificial drift in the monitoring devices, changing instrumentation, recalibration of the rating curve, or river regulation by dams or reservoirs, the Pettitt test (Pettitt, 1979) was applied to mean annual runoff series. We reported the cases when the null hypothesis of homogeneity was rejected at the 5 % significance level. A total of 14 stations are reported with homogeneity breaks in the metadata, and this result was consistent with a visual inspection. Since the possible causes of these changes in flow regime could be manyfold and should be investigated with a more detailed case-by-case analysis, we choose to keep these stations in the database but to flag them accordingly.
2.3 Climate characteristics
This data collection results in the largest ever database built of daily discharge data in Africa. These stations belong to different climate zones (Fig. 1) according to the Köppen–Geiger climate classification (Peel et al., 2007). The main climate zone represented is savannah (class Aw) for 687 stations corresponding to the western and central African basins. The second most represented climate zone is steppe-hot (Bsh) for 207 stations located in the Sahel region and southern Africa (Botswana, Namibia). The temperate with dry winter classes (Cwa and Cwb) include 187 and 125 stations, respectively, located in southern Africa (Zambia, Angola, Rwanda, Mozambique, South Africa, and Zimbabwe). The 98 stations belonging to the desert-hot class (Bwh) are mostly located in the northern and southern boundaries of the Sahara Desert. A total of 87 stations under a temperate climate with dry hot summer, corresponding to Mediterranean climate (Csa), are found in North Africa and the southwestern part of South Africa. Thus, the selected river basins are representative of most of the climate zones in Africa. It must be noted that for large basins, such as the Congo, Niger, or even the Orange rivers, the climate type at the outlet may not be representative of the whole catchment that may span over diverse climate zones.
To document the mean annual precipitation and evapotranspiration at the catchment scale, the CRU4 dataset has been considered (Harris et al., 2020). However, without long-term and homogeneous ground monitoring networks over the African continent, no best precipitation database could be identified for Africa as a whole (Sylla et al., 2013; Beck et al., 2017; Awange et al., 2019; Satgé et al., 2020). For some regions, such as northern or equatorial Africa, there are large differences between different remote-sensing- or gauged-based precipitation products (Gehne et al., 2016; Harrison et al., 2019; Nogueira, 2020), in particular for extreme precipitation events. This is the reason why we choose to provide only mean annual precipitation, evapotranspiration, and temperature. This implies that the ADHI dataset does not provide metrics relying on time series of precipitation or evapotranspiration, such as the runoff ratio, streamflow precipitation elasticity, or catchment response time. To calculate these indices requiring climatic time series for a given catchment, the user is advised to check first the best available data for that area.
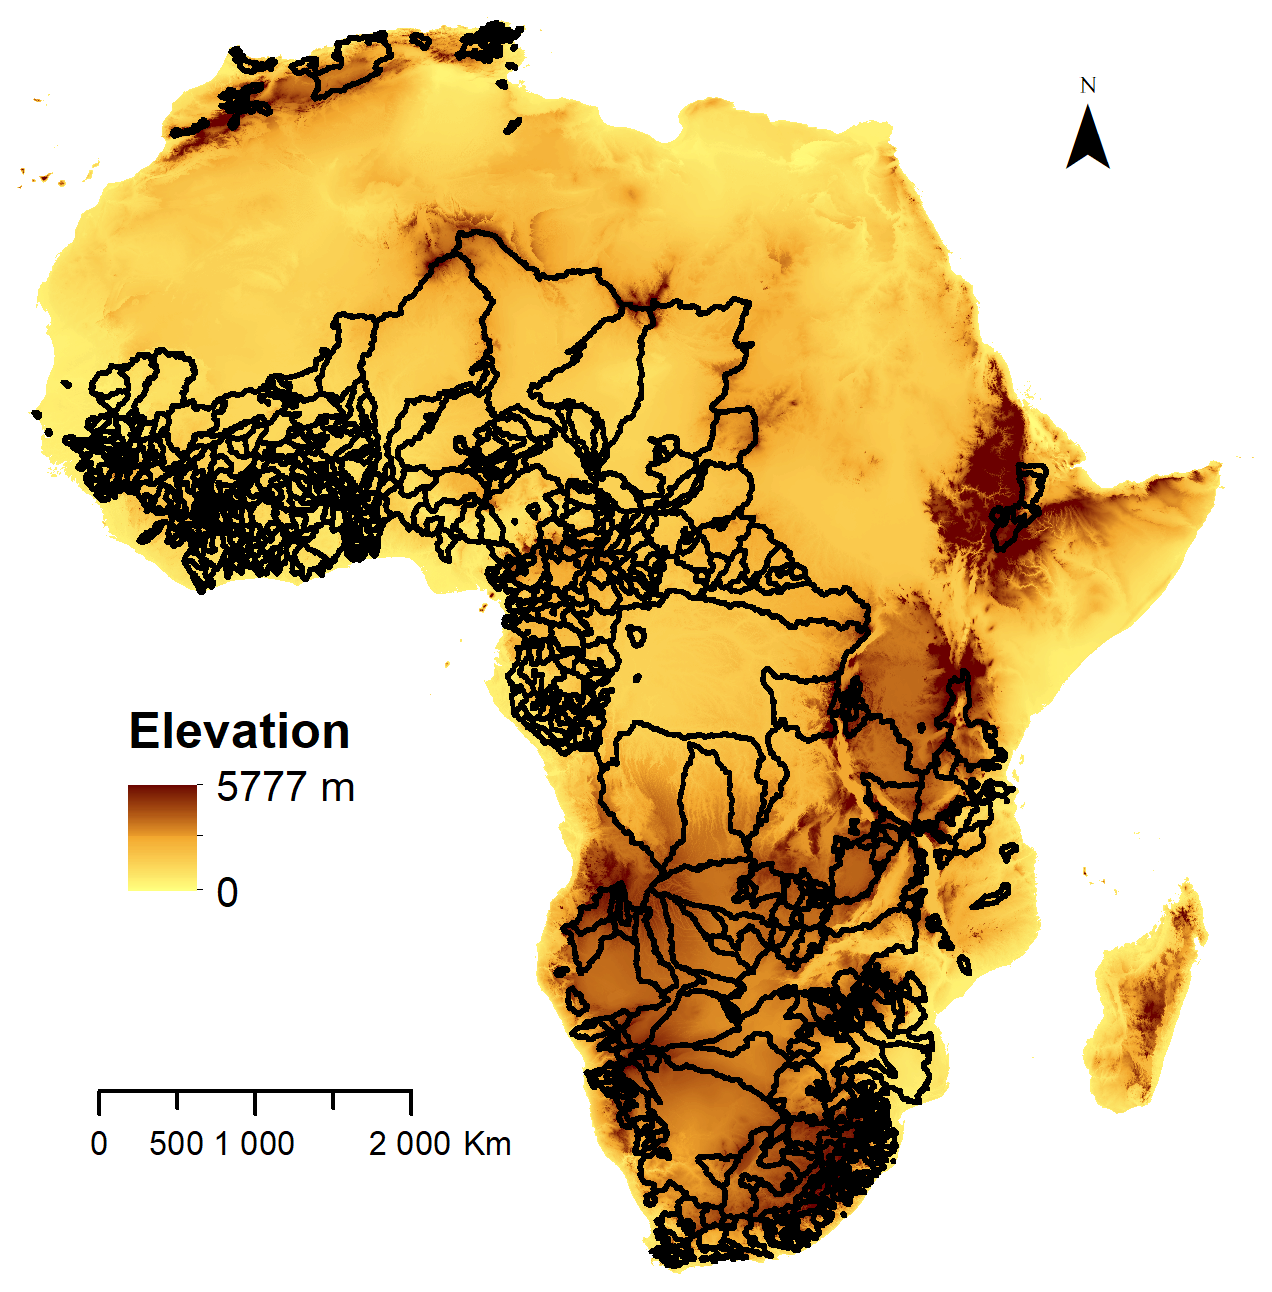
Figure 3Map of the delineated catchment boundaries in black with elevation from HydroSHEDS digital elevation model (https://www.hydrosheds.org/, last access: 13 April 2021).
2.4 Catchment delineation
Station catchment areas have been delineated with the HydroSHEDS digital elevation model (DEM) at 15 s resolution using the TopoToolbox2 algorithm (Schwanghart and Scherler, 2014). The map of the catchments is shown in Fig. 3. Despite a careful check of the geographic coordinates of the stations, this type of automatic catchment delineation procedure is prone to some errors, in particular in regions with low elevation and flat terrain properties. This is particularly the case of catchments with endorheic areas, such as the Niger, Chari, and Logone basins, where the precision of the DEM is crucial to identify these areas. Since the gauge locations are not necessarily located on the streams derived from the DEM, the TopoToolbox2 makes it possible to relocate automatically the gauges on the nearest river stream. However, this procedure did not work for 61 catchments, with a catchment area error exceeding 10 % compared to the available metadata. For these basins, a manual procedure with the Arcmap® software has been implemented to delineate the catchment boundaries from flow direction maps. In addition, for several hundred catchments it was possible to compare the results of the catchment delineation procedure with the catchment areas available in the SIEREM database and the ORSTOM reports (available online at the address: https://horizon.documentation.ird.fr, last access: 13 April 2021), which have been most often individually delineated and carefully checked from ground knowledge over the years (Boyer et al., 2006).
From the delineated catchments, the mean, maximum, and minimum altitudes from the HydroSHEDS DEM have been extracted and included in the metadata. In addition, the European Space Agency Climate Change Initiative Land Cover (ESA-CCI LC) data (ESA, 2017) have been extracted for each catchment for the year 2015. This database contains land cover maps at a 300 m spatial resolution for 38 classes, compliant with the UN Land Cover Classification System (LCCS). The classes have been grouped into eight new classes: forest, urban areas, cropland, irrigated croplands, grassland, shrubland, sparse vegetation, and bare land. Overall, the basins are characterized by a low proportion of urban areas, a large proportion of forests, especially in the intertropical zone (mean = 41 %, median = 37 %), and a majority of non-irrigated cultivated areas, on average covering 31 % of the total area of the basins. Indeed, the irrigated crops represent only 0.43 % on average.
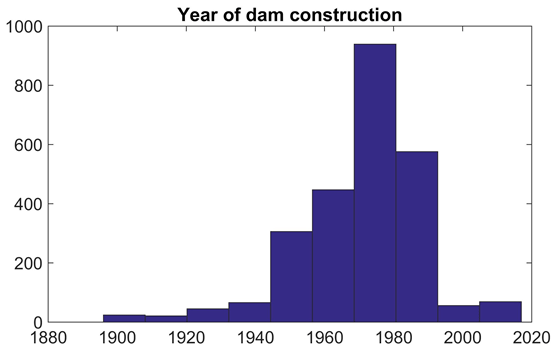
Figure 4Years of building date for dams located in the catchment database (data from the Global Reservoir and Dam Database v1.3).
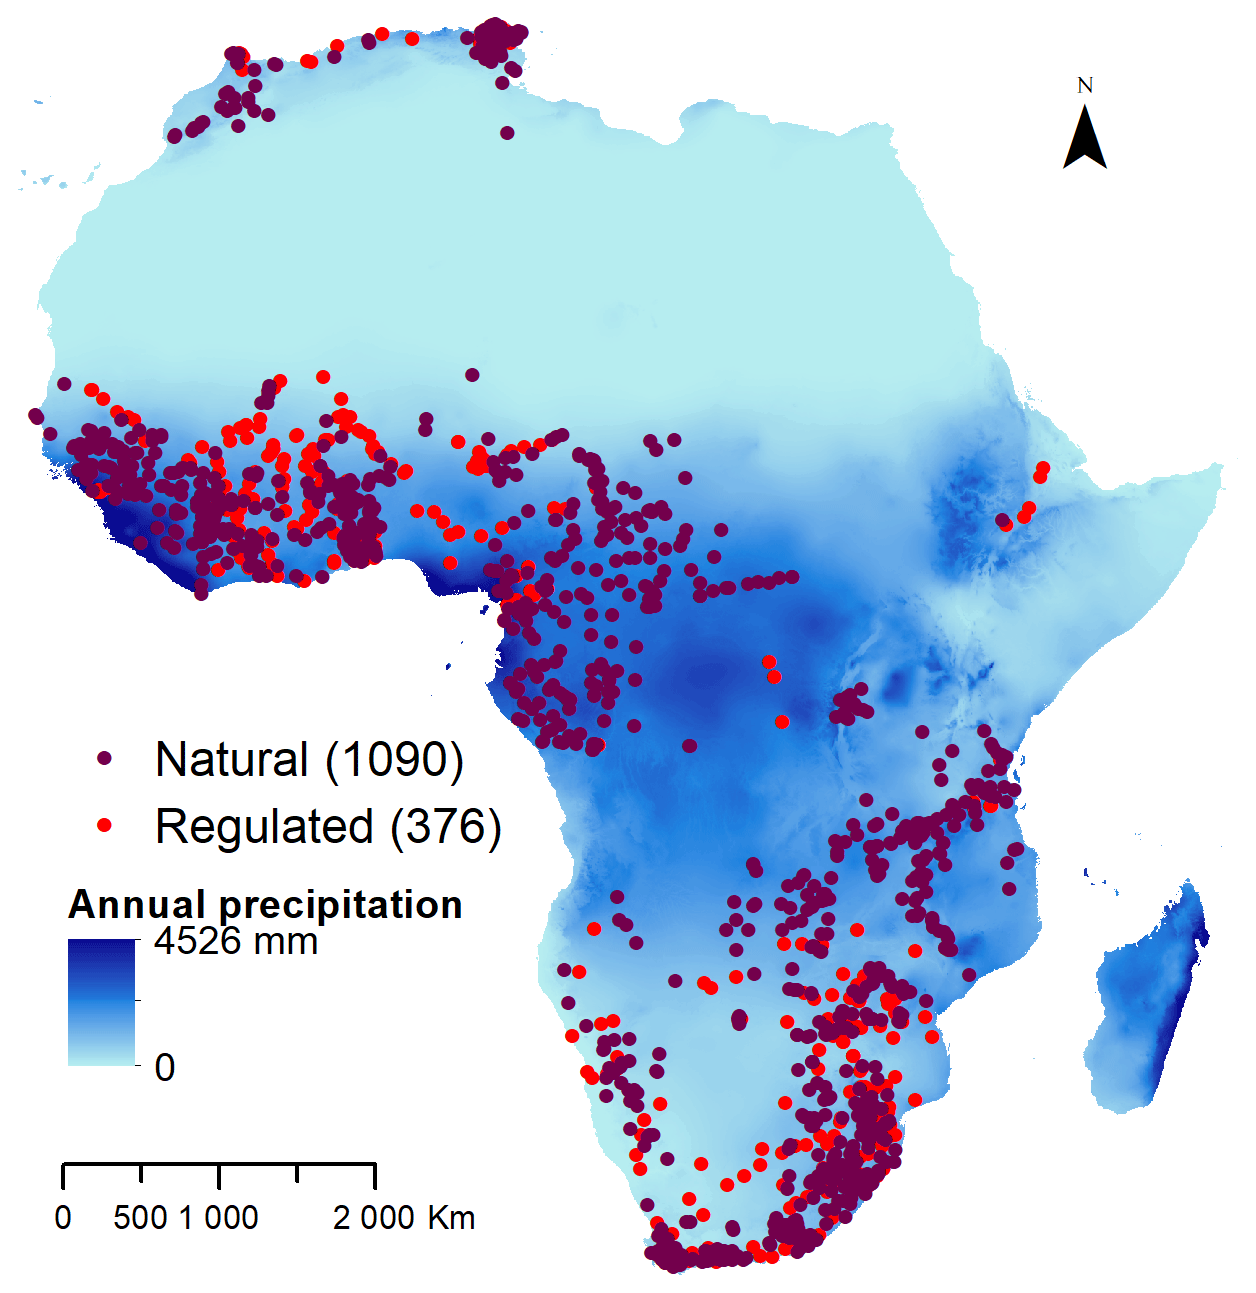
Figure 5Map of stations with a natural or regulated flow regime. Basins are considered regulated if they contain at least one dam or reservoir from GRanD (Lehner et al., 2011). Mean annual precipitation between 1970 and 2000 is provided from the WorldClim database (Fick and Hijmans, 2017).
2.5 River regulation
Dams and reservoirs have also been extracted and added in the metadata of the stations. The Global Reservoir and Dam Database (GRanD) v1.3 (Lehner et al., 2011) has also been considered to identify regulated basins. The number of dams included in each river basin has been extracted using the catchment boundaries. As shown in the metadata of GRanD, most of the dams in African basins were constructed around the 1970s (Fig. 4). The rivers could be considered regulated if at least one dam exists in the catchment area, otherwise the river is considered natural (Fig. 5). However, the influence of dams and reservoirs on the flow regime are linked to the location of the regulation structure, the portion of the basin controlled, and the management strategies. For instance, in a large basin with only one dam located on a small headwater catchment, its influence may not be distinguishable at the river outlet. On the other hand, a station located immediately downstream of a dam outlet may have its flow regime strongly impacted by dam operations. It should also be noted that other regulation structures like small dams or water diversion channels that may not be included in GRanD could be present in the catchments considered natural (Lehner et al., 2011; Pekel et al., 2016). This is particularly the case in semi-arid areas where earthen-made channels, often informal, draw their water supply from the river itself through the building of small diverting structures (Underhill, 1984; Kimmage, 1991). They can represent a large number of structures but a variable amount of water withdrawal at the basin scale (Barbier et al., 2009; Bouimouass et al., 2020). Similarly, no data are available yet on the importance and impact of groundwater abstraction, if any, on the flow regime measured at the stations.
Here is presented the list of indices computed from daily discharge data. While hydrological indices refer to standard statistical metrics, such as the mean, maximum, or percentiles computed from time series of discharge data, hydrological signatures can be defined as metrics describing the hydrological behavior and the dominant processes in a river basin (Addor et al., 2018). Most of the indices are computed with the Toolbox for Streamflow Signatures in Hydrology (TOSSH; available at the address: https://github.com/TOSSHtoolbox/, last access: 13 April 2021) (Gnann et al., 2021). The indices and signatures selected span a large variety of runoff characteristics from high to low flows from previous literature (Poff et al., 1997; Richter et al., 1996; Baker et al., 2004; Yadav et al., 2007; Clark et al., 2009; Estrany et al., 2010; Sawicz et al., 2011; Euser et al., 2013; Safeeq et al., 2013; Addor et al., 2018; McMillan, 2020).
3.1 Available streamflow signatures and indices derived from daily discharge
Several signatures characterizing baseflow rely on the application of a baseflow filter. Since the choice of the baseflow separation method can introduce uncertainties in the calculation of these signatures (Su et al., 2016), two baseflow filtering methods are compared: the Lyne and Hollick recursive digital filter (Ladson et al., 2013), with the default values for the filter parameter (0.925) and the number of passes (3), and alternatively the UKIH smoothed minima method (UKIH, 1980) that does not require any calibration parameters. The baseflow index (BFI) is the ratio between the baseflow volume and the total streamflow volume. The baseflow recession (BaseflowR) is the baseflow recession constant assuming an exponential recession behavior (Safeeq et al., 2013). The base baseflow magnitude calculates the difference between the minimum and the maximum of the baseflow regime, defined as the average baseflow on each calendar day. The two baseflow separation methods compared to compute the baseflow-related indices provide very similar results, with a correlation above 0.9 for all indices obtained with the two approaches.
To compute the mean half flow date and the mean half flow interval, the beginning of the hydrological year has been defined as the month following the month with the minimum average runoff. Indeed, the hydrological year has different starting dates across the African continent: in North Africa the hydrological year usually starts in September, in western Africa around March–April, and in January for southern Africa. The mean half flow date is the day when the cumulative discharge reaches half of the annual discharge. The mean half flow interval is the time span between (i) the date on which the cumulative discharge since the start of the water year reaches a quarter of the annual discharge and (ii) the date on which the cumulative discharge since the start of the water year reaches three quarters of the annual discharge.
Some metrics are derived from the calculation of the flow duration curve (FDC), such as its slope between the 33rd and 66th flow percentiles (McMillan et al., 2017), the peak distribution, the slope between the 10th and the 50th percentiles of the FDC constructed only with hydrographs peaks (Euser et al., 2013), and the variability index, the standard deviation of the logarithms of discharge from the 10th to the 90th percentiles of the FDC (Estrany et al., 2010). It must be noted that 194 rivers have more than 50 % of days with zero flow, and for these stations but also all the others with an intermittent regime, several metrics derived from the FDC are not adapted. For these basins, specific methods to estimate the FDC should be applied (Rianna et al., 2013). Similarly, there is no baseflow in these basins. Consequently, the indices relying on baseflow or the flow duration curve are not computed for these basins.
In addition, different hydrological signatures describing the hydrologic responses of the basins are also provided. The flashiness index is defined as the sum of absolute differences between consecutive daily flows (Baker et al., 2004), and it reflects the frequency and rapidity of short-term changes in streamflow, especially during high runoff events. The number of master recession curves (MRCs) is computed from the changes in recession slopes, and they represent different reservoirs contributing to the runoff response (Clark et al., 2009; Estrany et al., 2010). This signature can help us to understand the functional forms of storage–discharge relationships and identify model structures adapted to represent it. The rising limb density is the ratio between the number of rising limbs and the total amount of time steps in the hydrograph (Sawicz et al., 2011). It is a descriptor of the hydrograph shape and smoothness without consideration for the flow magnitude. Small values of the rising limb density indicate a smooth hydrograph.
From the supplied indices, some other useful indicators could be derived. For example, for hydrogeology applications it would be interesting to compute the low-stage-specific discharge that is the ratio between the low-stage discharge and the area of the watershed. This can be an indicator of aquifers' contribution to river discharge. The main issue is related to the definition of the low-stage discharge. From the indices proposed in the present database, it could be the 5th percentiles of daily streamflow or the minimum of 7 d consecutive streamflow per year. Similarly, the low-flow index could be computed from the ratio of the 90th and 50th percentiles of daily streamflow (Smakhtin, 2001).
3.2 Indices computed on the whole record
These indices have been computed using the whole time series available for each station. Consequently, they are computed on different base periods depending on the stations, with the period of record for each station being made available in the metadata. These indices are listed in Table 1.
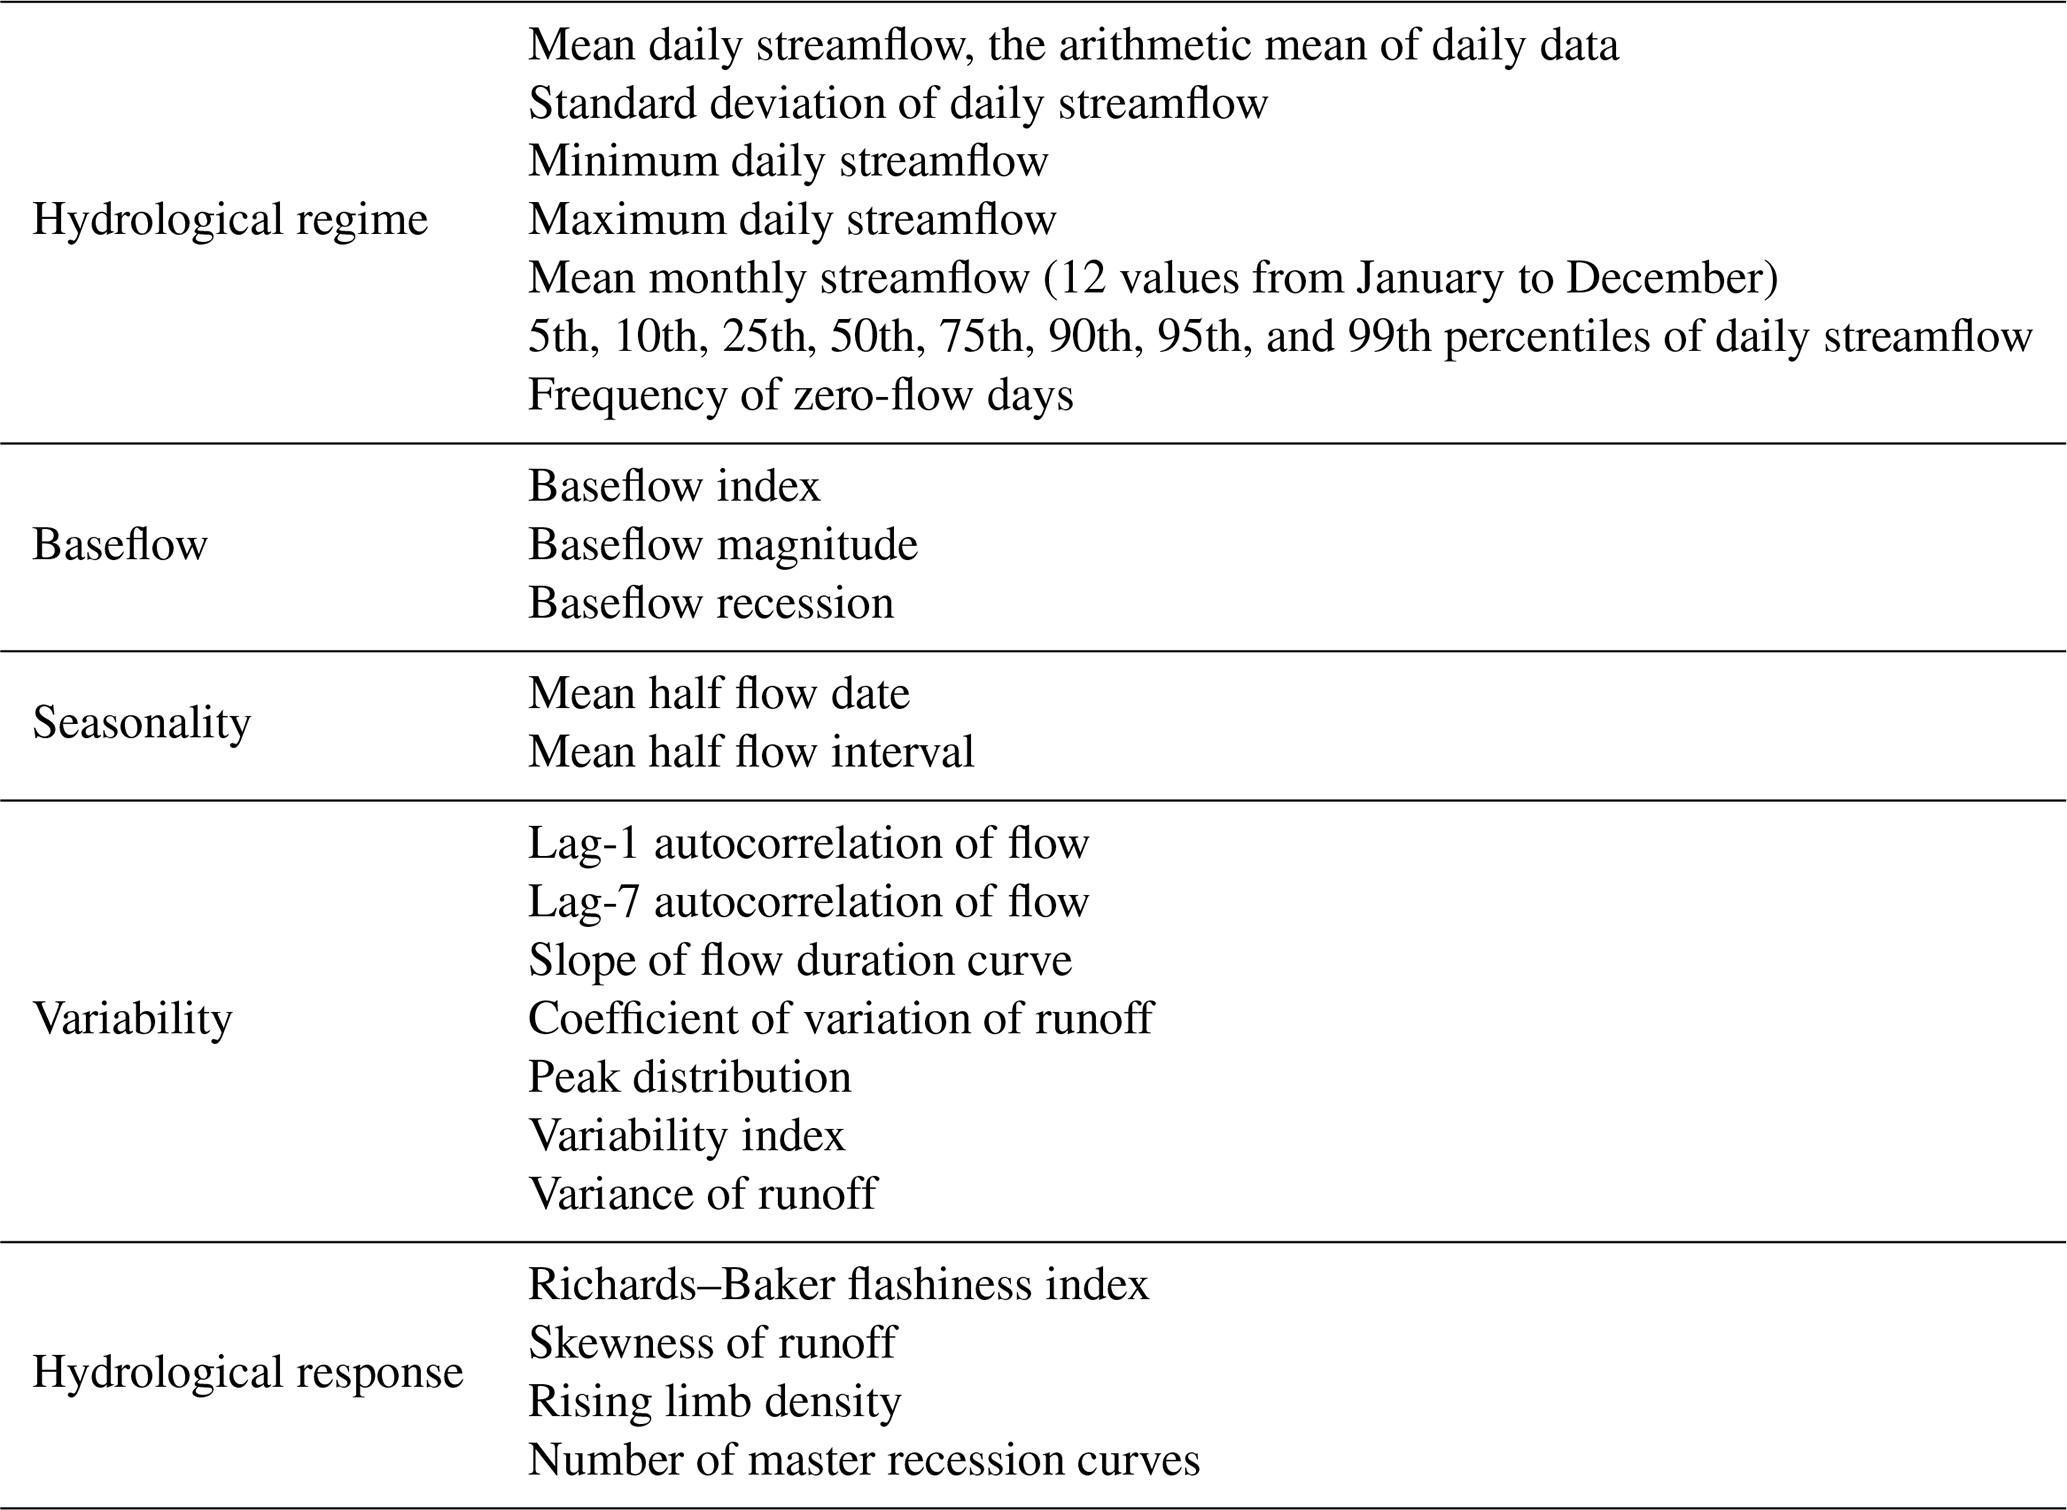
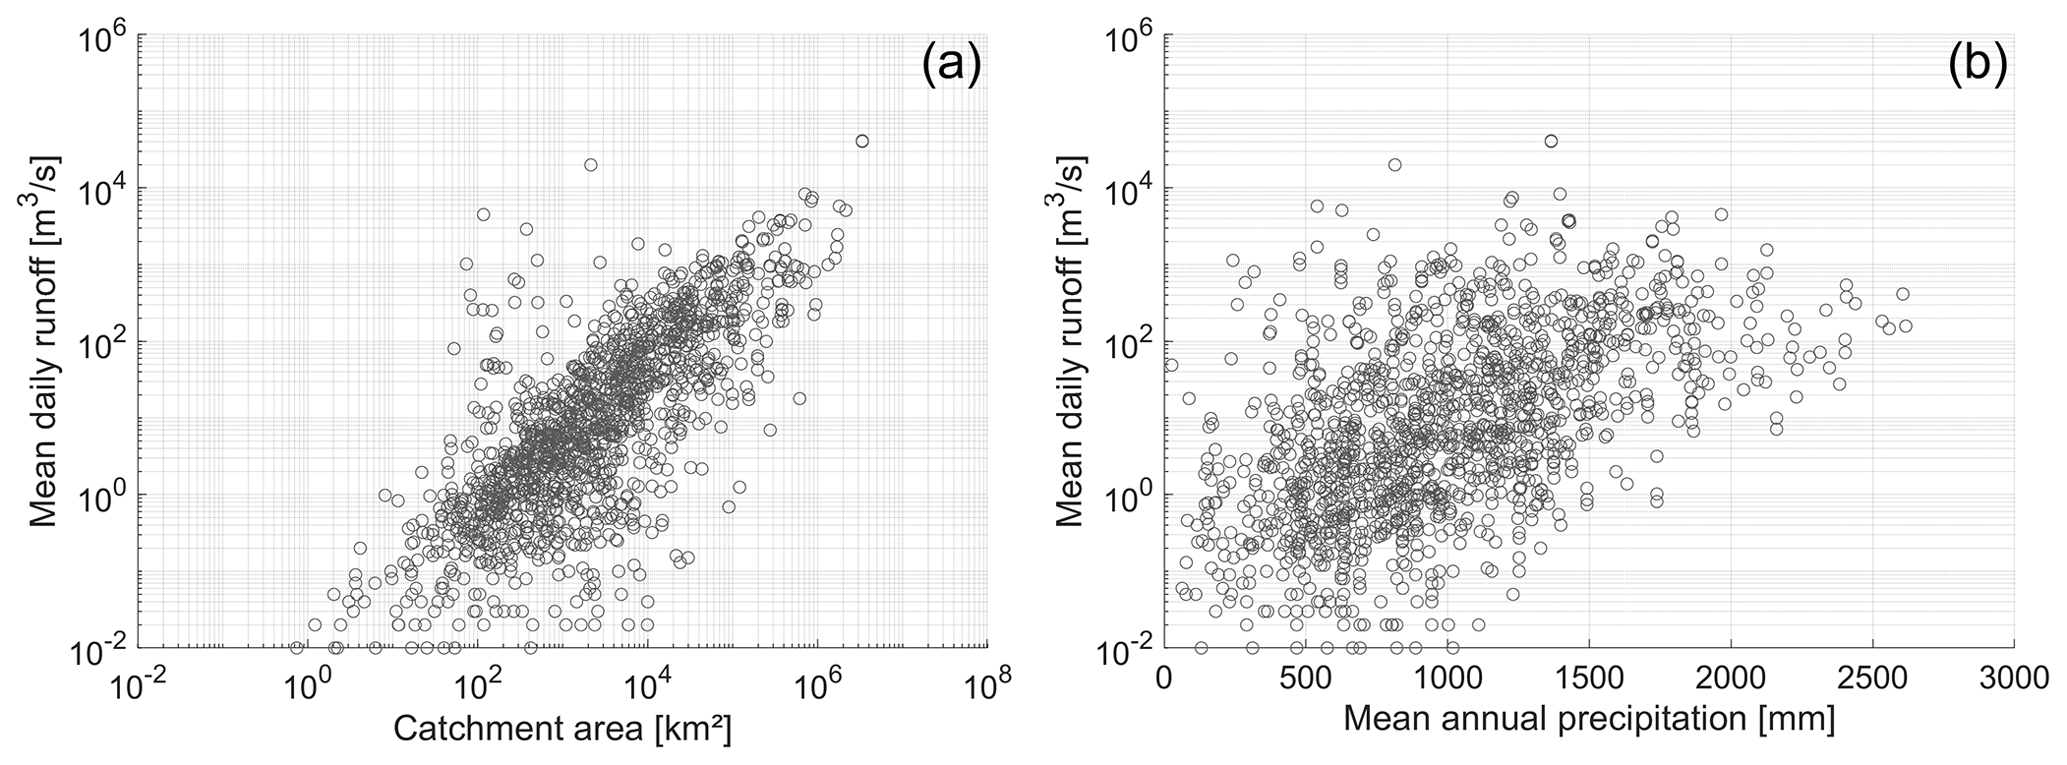
Figure 6Relationship between mean daily river discharge and catchment area (a) and mean annual precipitation (b).
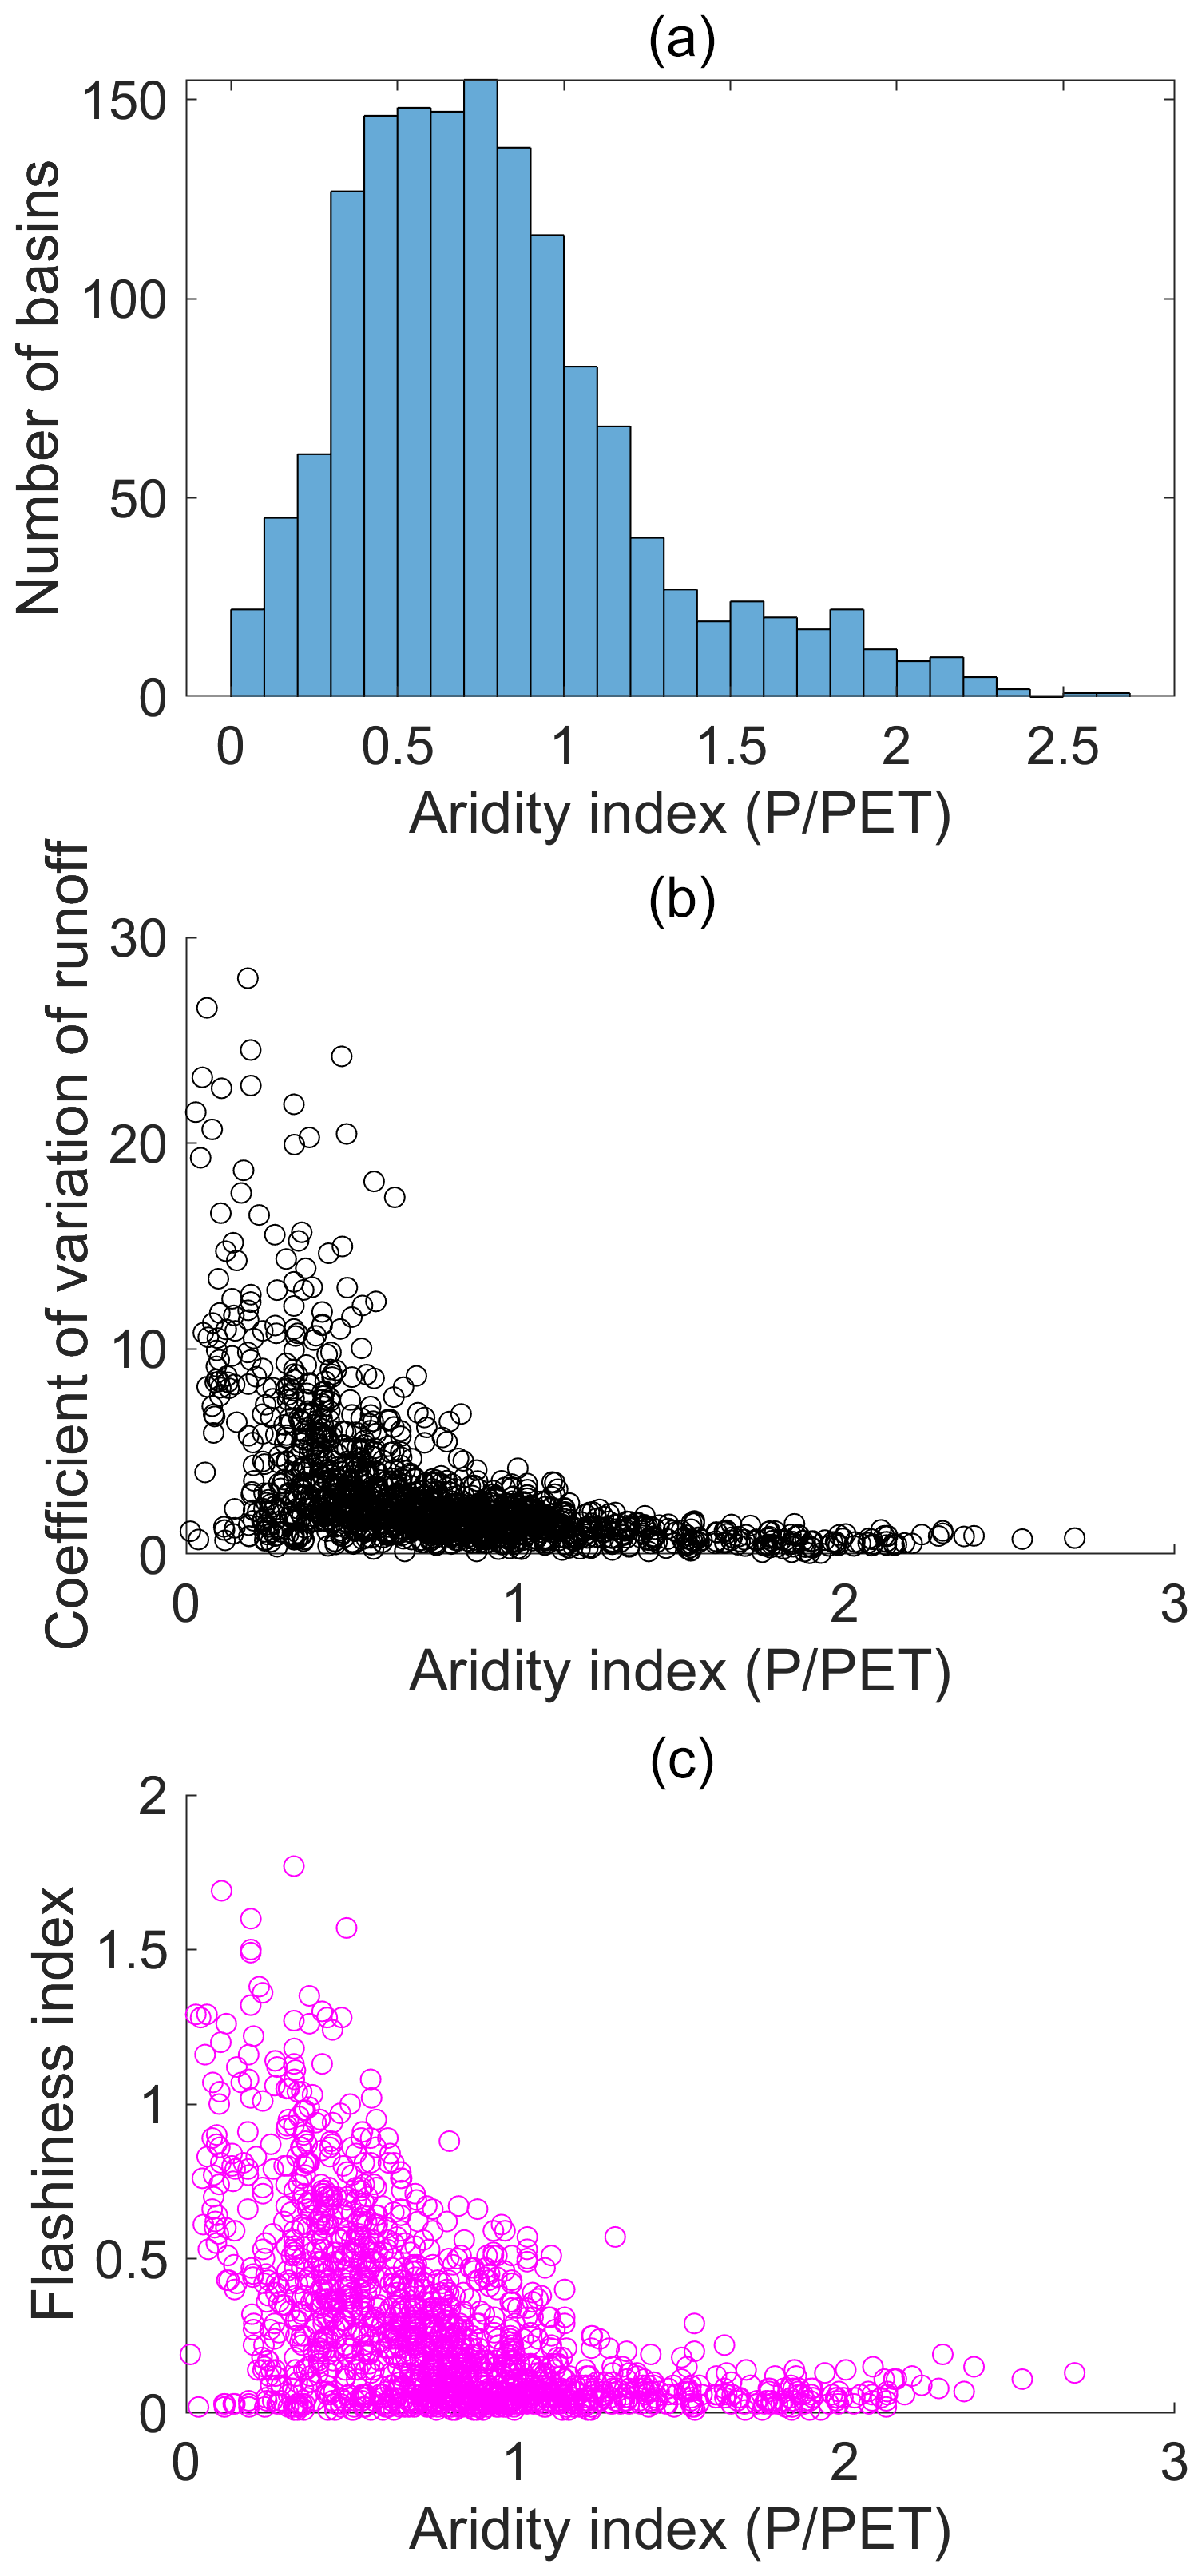
Figure 7Histogram of the aridity index per basin (a), relationship between the aridity index and the coefficient of variation of runoff (b), and relationship between the aridity index and the flashiness index (c).
The basins included in the ADHI include a wide range of catchment areas, from a few square kilometers to several hundred thousand in the case of large rivers such as the Congo, Niger, Orange, Zambezi, Senegal, Okavango, and Volta. As shown in Fig. 6, the average runoff is generally well correlated to the size of the basins with nevertheless a variability linked to local climatic and geological conditions. The mean annual precipitation is one of the explanatory factors of the observed ranges of mean river runoff but is also strongly modulated by local conditions. A large number of basins have an aridity index (ratio between precipitation and potential evapotranspiration) of less than 0.60, indicative of arid to semi-arid conditions (Fig. 7a). The varying degrees of aridity encountered in the basins are an important explanatory factor for the hydrological response at the African scale. For instance, the coefficient of variation of runoff (Fig. 7b) or the flashiness index (Fig. 7c) have greater values under conditions of increasing aridity.
3.3 Indices computed on monthly or annual basis
These indices have been computed for each calendar year for consistency with other databases such as GSIM (Do et al., 2018; Gudmundsson et al., 2018). These indices have been computed for the years with less than 5 % missing data:
-
mean annual runoff
-
minimum of 7 d consecutive streamflow per year and corresponding date
-
annual maximum runoff and the corresponding date
-
annual values for the 5th, 10th, 25th, 50th 75th, 90th, 95th, and 99th percentiles of daily streamflow.
In addition to these annual series, the monthly time series contains for each month the mean, maximum, and minimum runoff, the last column being the number of missing days per month. There is one file per station. It is advised to consider the monthly values only for the months with no missing values or missing values less than 10 % or 5 %.
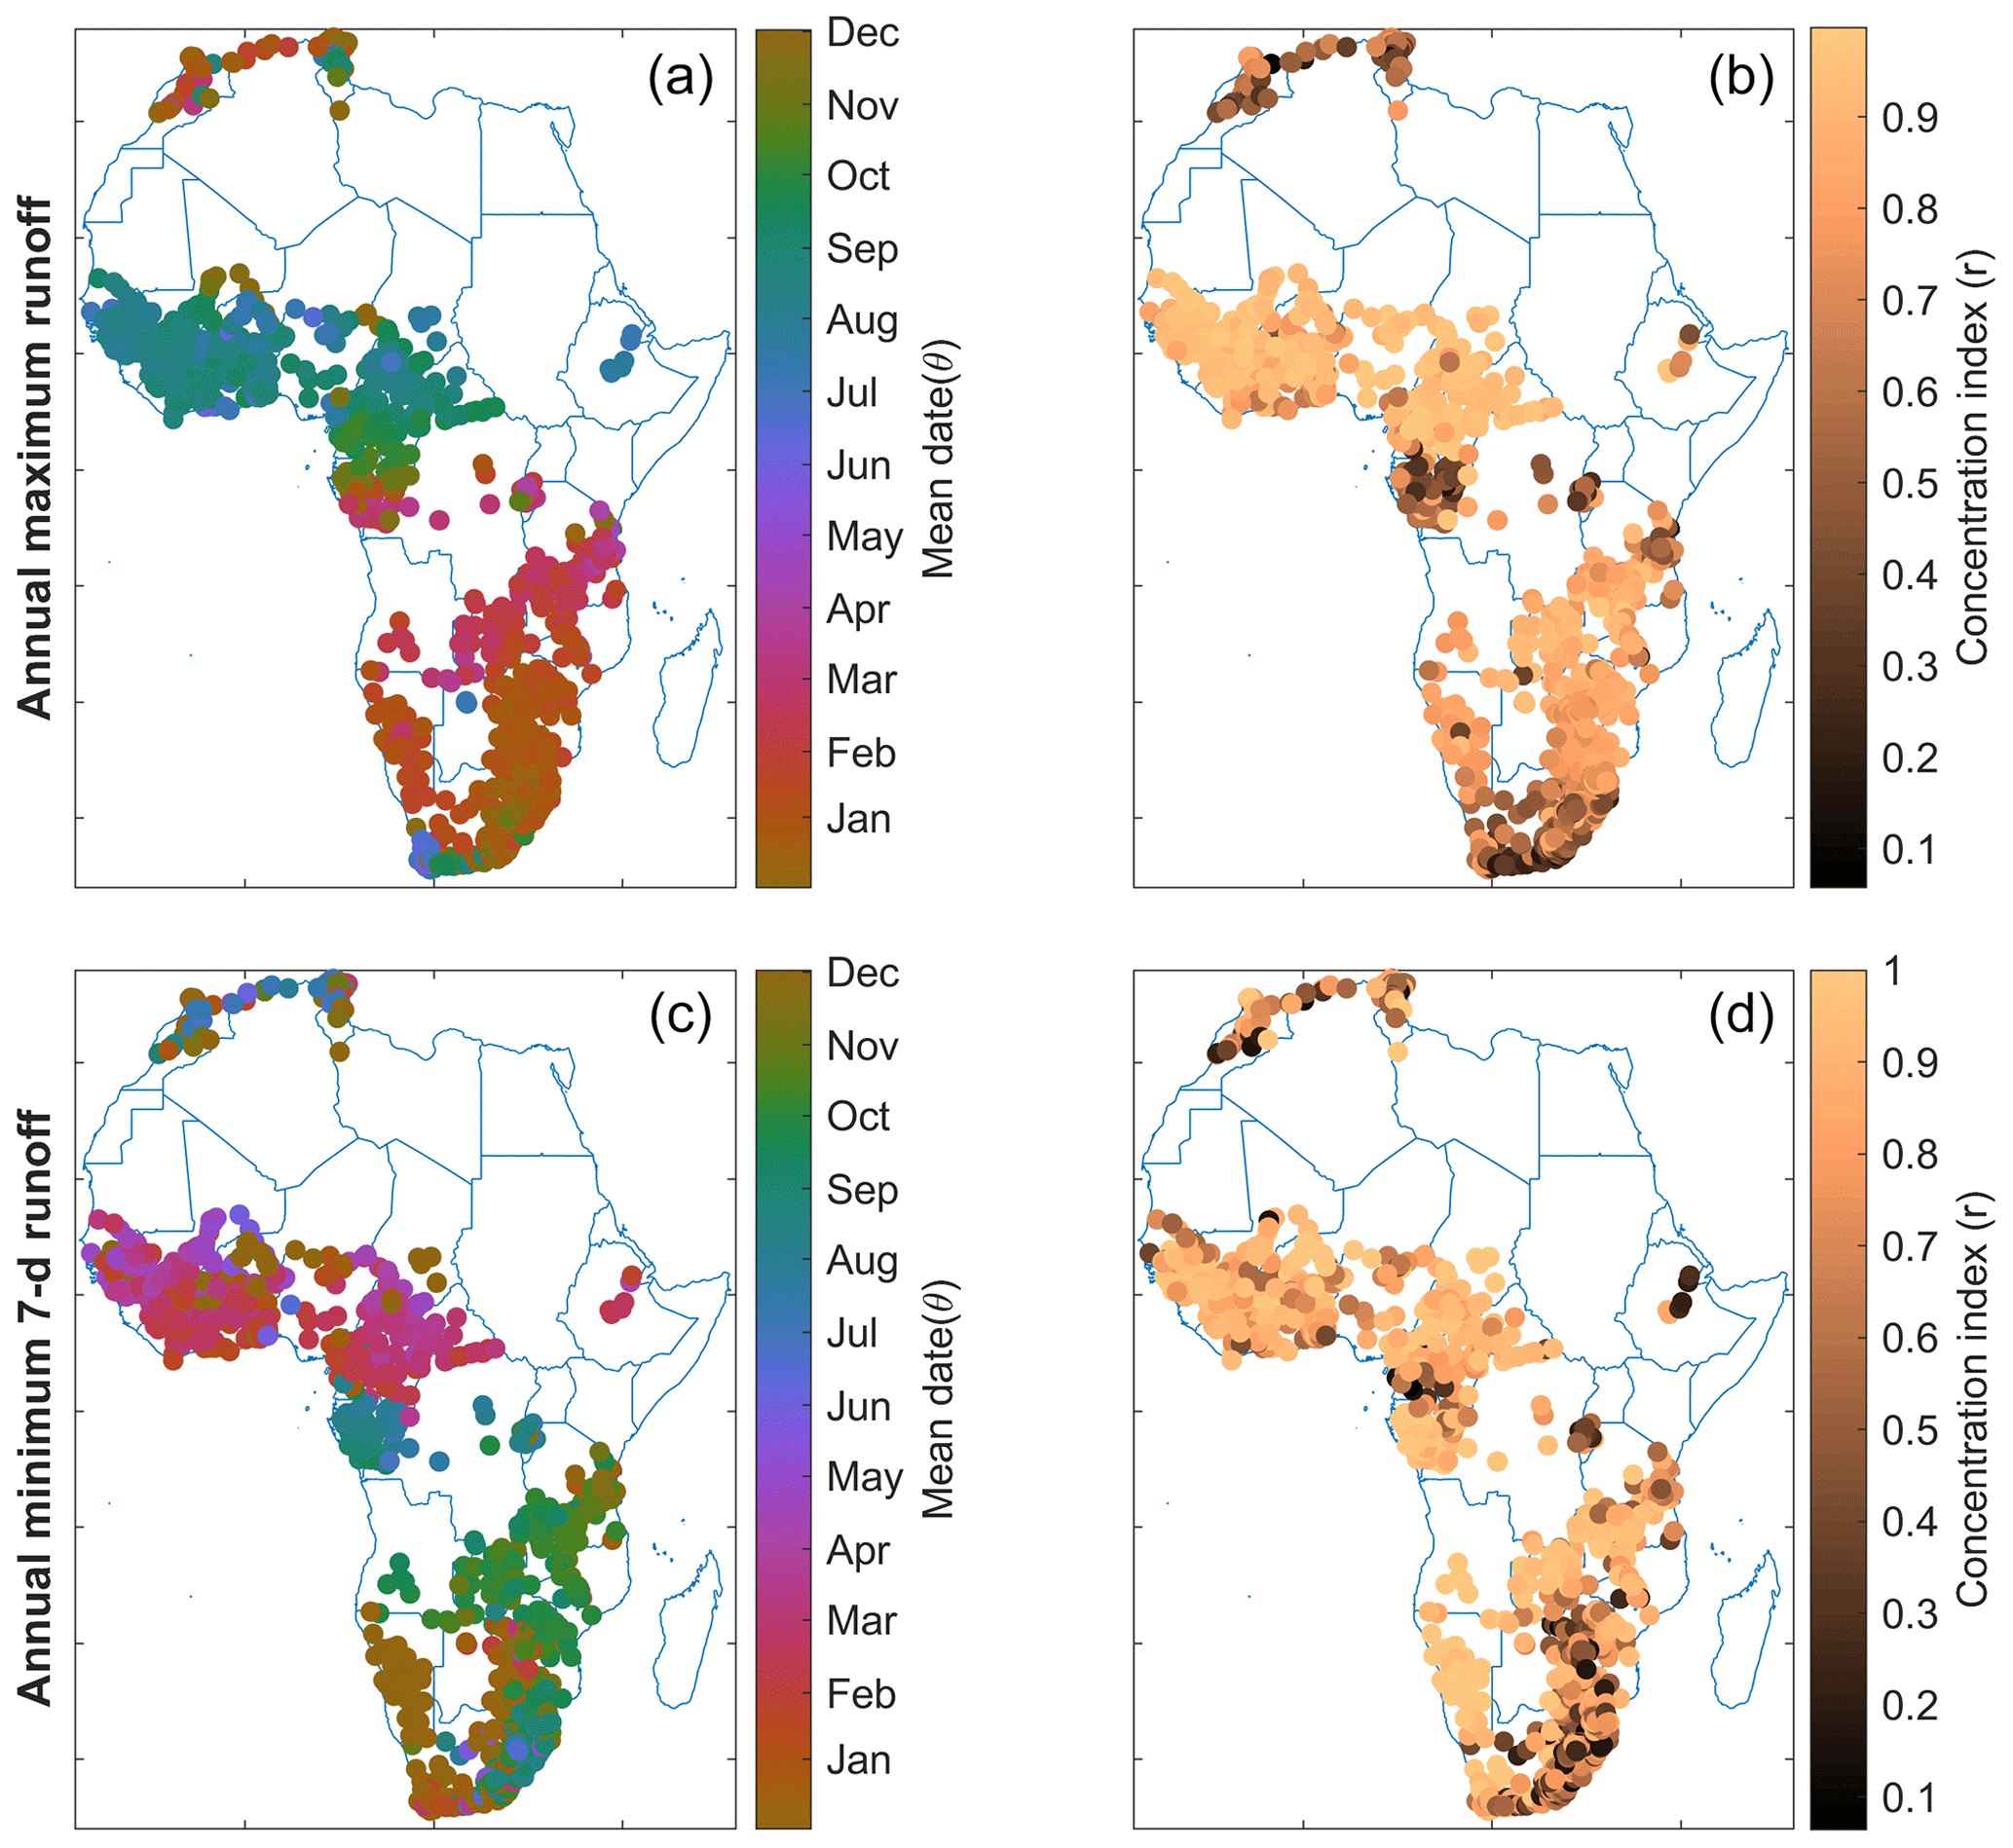
Figure 8Mean date of occurrence (a, c) of annual maximum runoff and annual minimum of 7 d runoff, together with the variability around the mean date (b, d) represented by the concentration index.
These time series make it possible to analyze the long-term evolution of mean and extreme runoff (Tramblay et al., 2020) but can also be useful to validate hydrological modeling results. Focusing on extreme high and low runoff, very different seasonal patterns of occurrence could be observed for different regions of Africa. In Fig. 8, the mean dates of annual maximum runoff and the annual minimum of 7 d runoff are plotted. This seasonal analysis has been performed with directional statistics (Burn, 1997; Mardia et al., 2015): the dates of occurrence were converted into angular values to compute the mean date of occurrence (θ) together with the concentration index (r), which is a measure of the flood occurrence variability around the mean date. The annual maximum runoff shows three distinct patterns (Fig. 8): first, stations with floods occurring during December–February in northern and southern Africa with a strong variability in their date of occurrence; second, the stations in western Africa with floods occurring during summer and a low seasonal variability; and third, the stations in south-central Africa, with floods occurring in boreal spring and early summer with various degrees of variability depending on the subregion considered and the level of aridity. For annual minimum runoff, the patterns are usually reversed, with the low flow period spanning on average during June–October in North Africa, January–March in western Africa, and between September and November in southeast Africa. Yet this global picture hides local behaviors such as the east–west contrast in southern Africa or the north–south gradient in West Africa (Mahe et al., 2013). Similarly, the observed variability even for some neighboring catchments reflects the local influences of topography, soils, and land cover. As noted previously, the seasonal variability in extreme high or low runoff events is also strongly related to the catchment aridity.
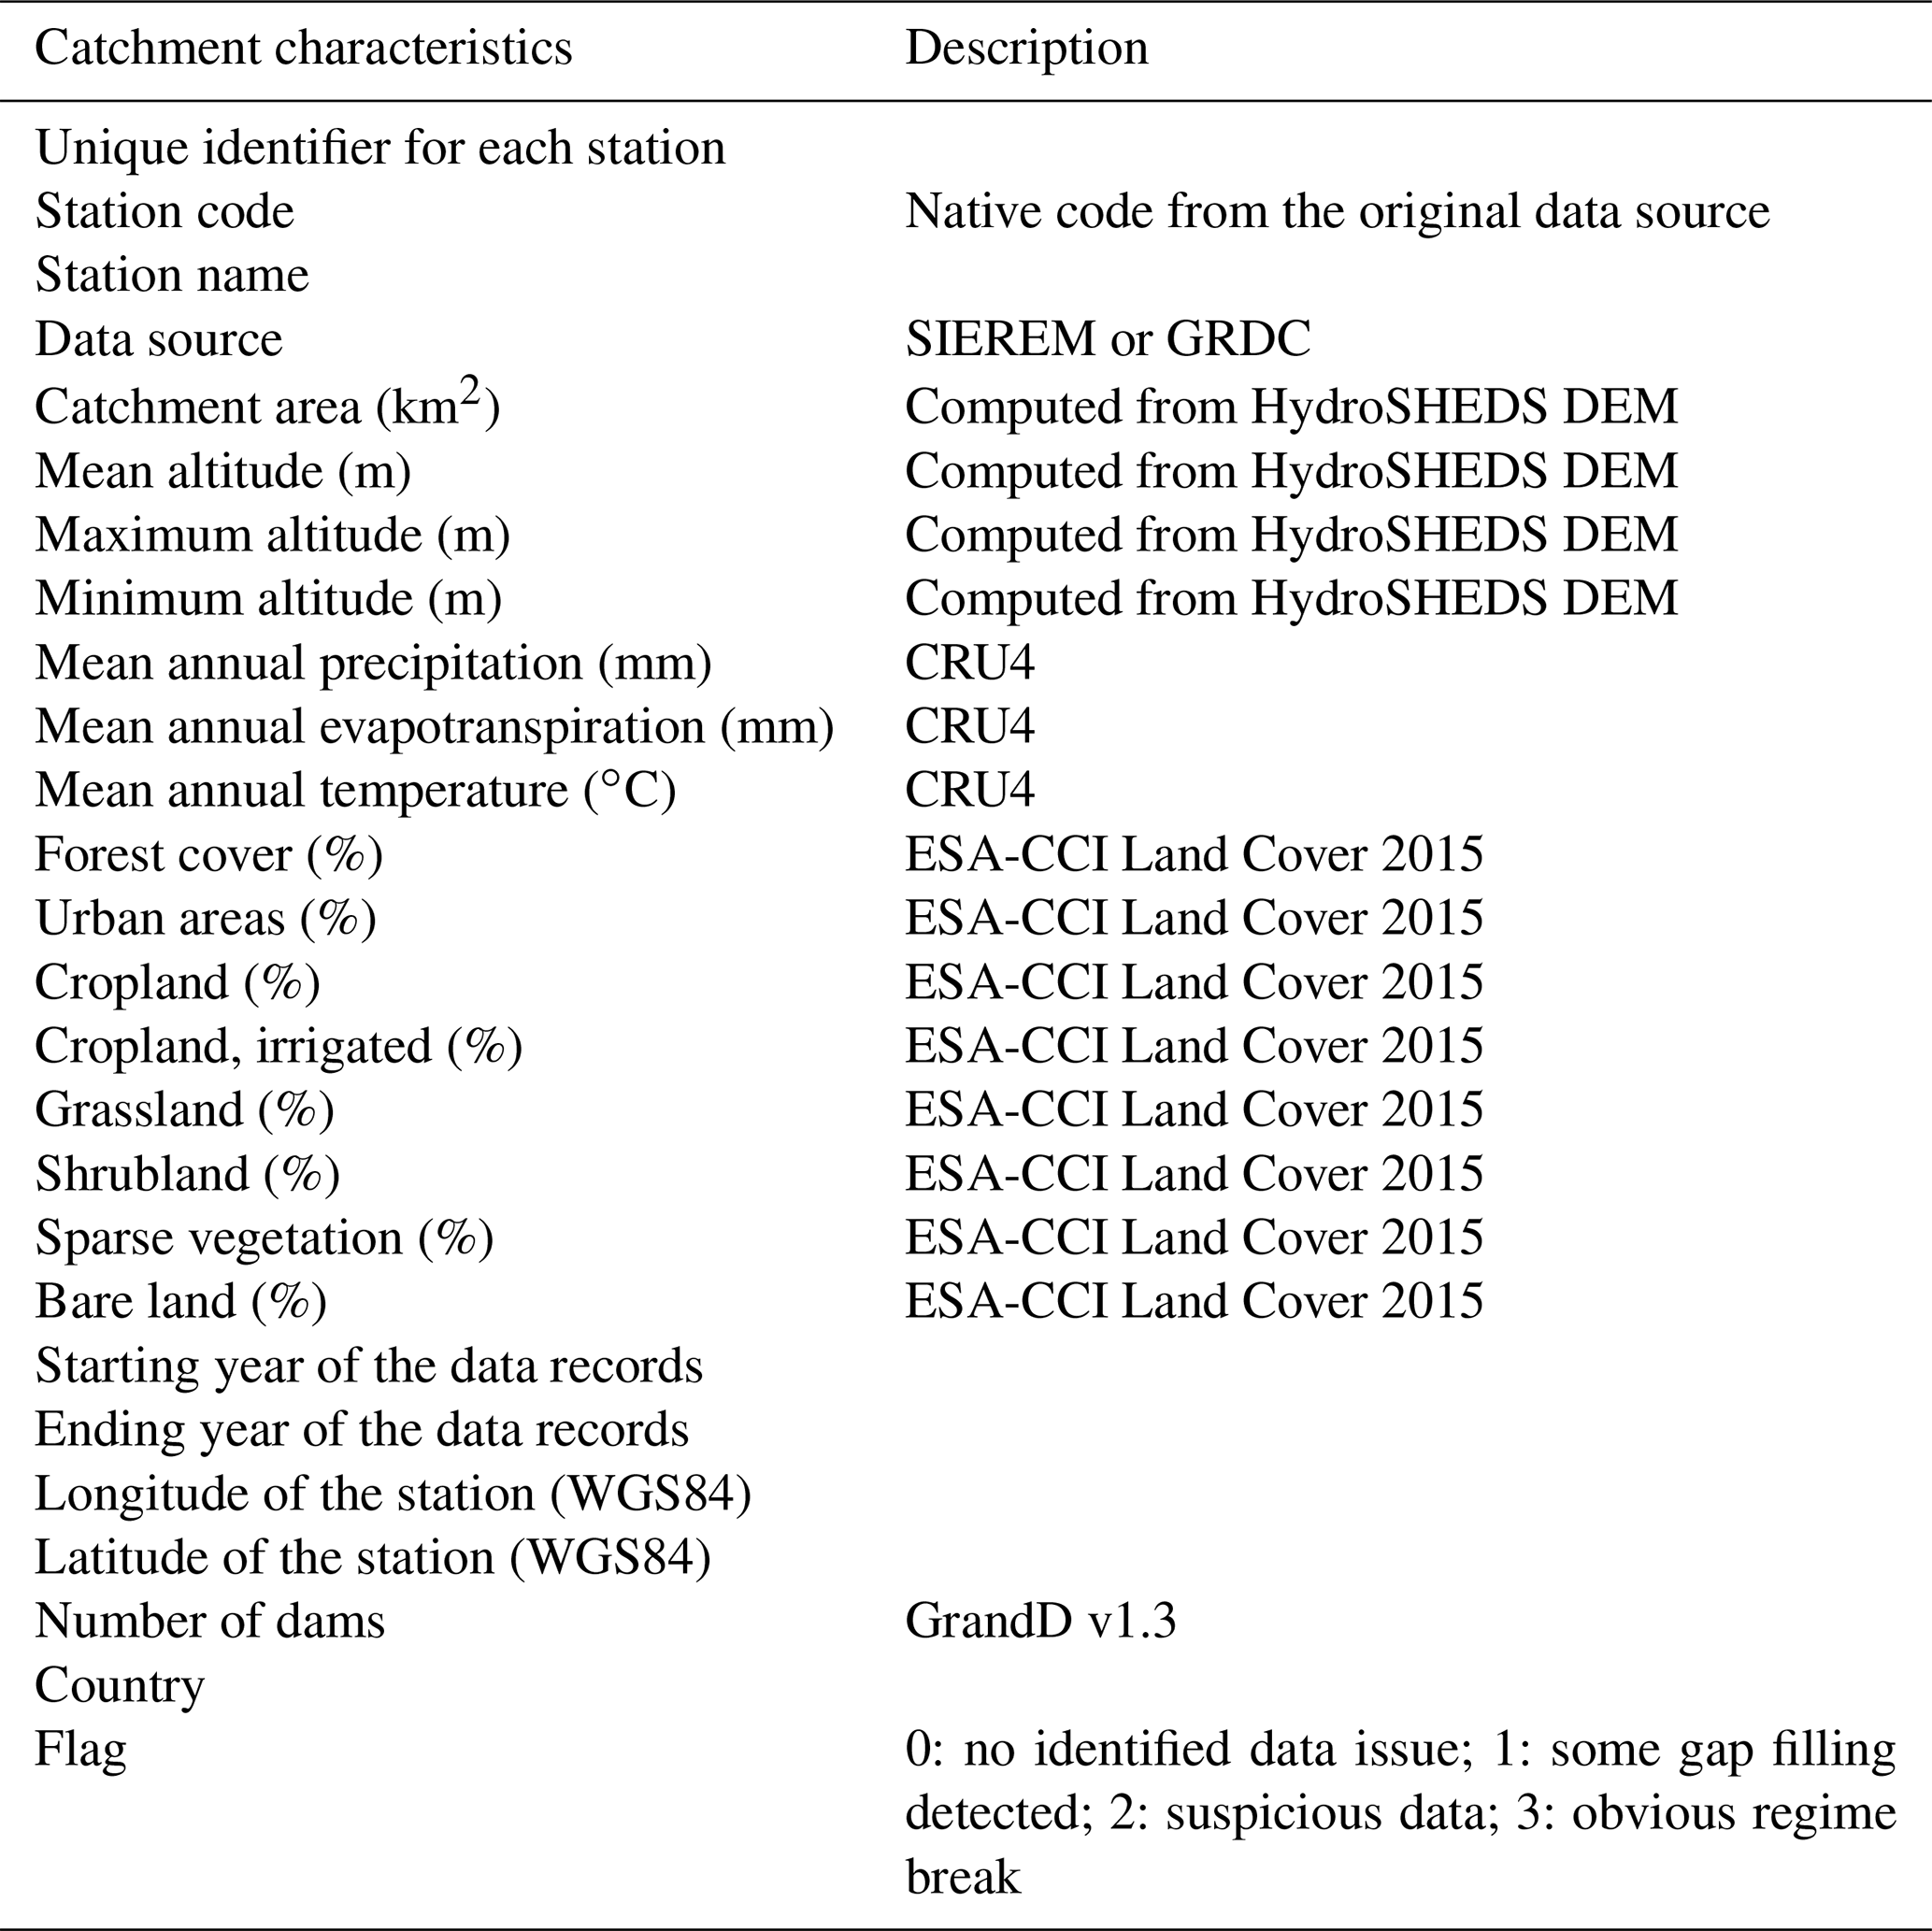
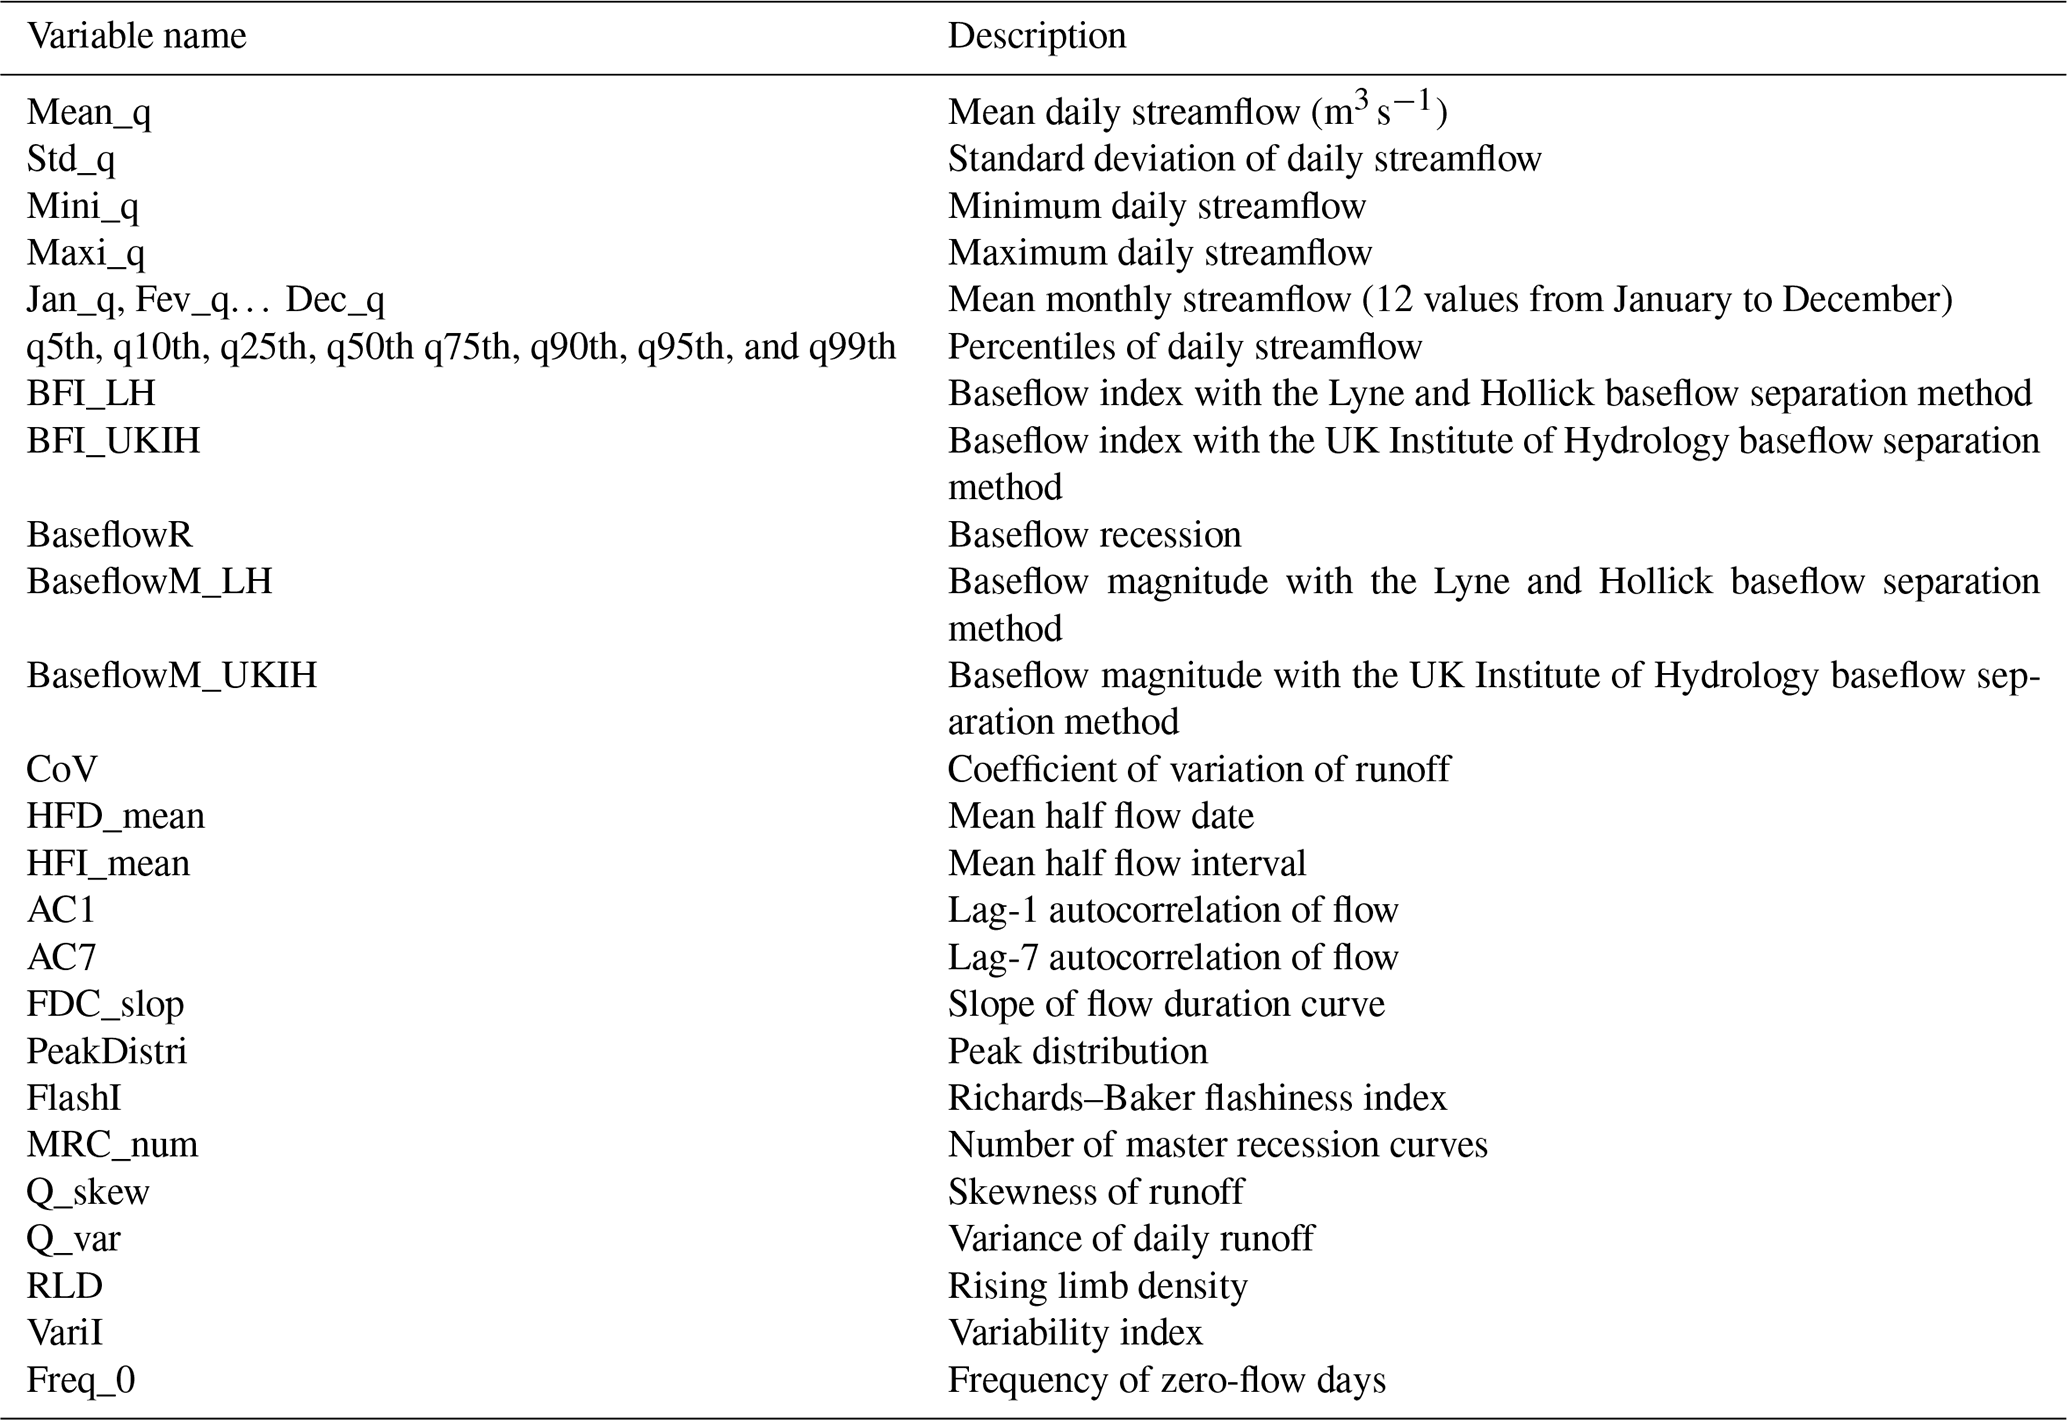
The ADHI is available for download at: https://doi.org/10.23708/LXGXQ9 (Tramblay and Rouché, 2020). Different files are supplied in the ADHI database. The ADHI_stations.tab file contains the station metadata (Table 2), and the ADHI_summary.tab file contains for each station the variables described in Table 3.
The compressed folders AnnualMean.zip, AnnualMax.zip, Annual7DayMin.zip, and AnnualPercentiles.zip contain time series for mean annual runoff, annual maximum runoff, annual minimum of 7 d discharge, and annual values for the 5th, 10th, 25th, 50th 75th, 90th, 95th, and 99th percentiles of daily streamflow. There is one file per station. The data files for the annual mean, maximum, and 7 d minimum contain as columns the year, month, day, and the data as the last column. The data files for the percentiles contain the year as the first column, and then the other columns contain the percentile values.
The compressed folder MonthlySeries.zip contains as columns (after the year and month) the mean, maximum, and minimum monthly runoff, and the last column is the number of missing days per month. There is one file per station.
The compressed folder Plots.zip contains for each station a plot of the daily discharge data available.
The compressed folder Catchment_boundaries.zip contains the catchment boundaries in the shapefile format (one .shp file per basin).
The compressed folder Catchment_plots.zip contains for each basin a plot of the catchment area in PNG format.
Additional indices could be computed upon reasonable request to the corresponding author.
This new hydrological database brings together the largest number of African river flow measurement stations in comparison with other previously published datasets. In this ADHI dataset, we included a total of 1466 stations with at least 10 years of discharge data between 1950 and 2018 for a mean record length of 33.3 years. Half of the stations have more than 30 years of data. By comparison, the recent GSIM database contains 979 stations in Africa, with a record length varying from 1 to 110 years until 2015 and a mean record length of 33.8 years. This ADHI results from a pooling of the GRDC and SIEREM databases, built from contributions of several agencies in African countries in charge of the management of hydrological measurement networks. This database will be regularly updated with data from SIEREM and GRDC. Since most of the preprocessing steps have been automated, it would be possible to increase the number of stations considered or the length of the data series if more data would become available. The data from the SIEREM database are already regularly updated from contributions of different institutes. In the future, individual contributions from researchers or institutes will be also welcome to increase the spatiotemporal coverage of the data. The FRIEND program (UNESCO/IHP) will also contribute to increase the number of stations through coordinated efforts at the regional level. The dataset provides a series of indices that describe a wide range of mean and extreme runoff properties, allowing for the characterization of the hydrological regime and applications linked to the management of water resources and hydrological risks. This database includes different catchment sizes and rivers with different hydrological regimes that make it possible to analyze the behavior of rivers in very different contexts for a wide range of scales.
More broadly, this ADHI could contribute to a better knowledge of African hydrology. For instance, the impacts of dams on river discharge remain largely unquantified at the scale of Africa (Biemans et al., 2011). From these indices, various applications can be sought. For example, the percentiles of the daily streamflow could be useful to calibrate hydrological models using the flow duration curve (McMillan et al., 2017) and to constrain model outputs (Tumbo and Hughes, 2015; Ndzabandzaba and Hughes, 2017). Flow duration curves are also useful for catchment classification according to their rainfall–runoff response (Cheng et al., 2012). In the recent years, global runoff simulations have been provided by the Global Flow Awareness System, with land surface or global hydrological models driven by reanalysis data (Alfieri et al., 2020; Harrigan et al., 2020). Yet, due to the small number of stations representing African basins in the currently available databases preventing a robust calibration of the models, the hydrological simulations have a poor performance (Harrigan et al., 2020). More generally, this new ADHI could open perspectives to apply hydrological models in African basins, in particular combined with recent remote sensing data products (Brocca et al., 2019; Satgé et al., 2020). Beside deterministic hydrological modeling approaches, several statistical methods to estimate the return levels of floods have been proposed in order to safely design dams, reservoirs, sewers, or other water regulation structures. Regional frequency analysis methods have been applied to estimate floods in ungauged basins in several African countries such as Morocco (Zkhiri et al., 2017), Tunisia (Ellouze and Abida, 2008), South Africa (Nathanael et al., 2018; Smakhtin et al., 1997), and the Volta basin (Komi et al., 2016). However, studies at a larger regional scale remain very scarce (Farquharson et al., 1992; Padi et al., 2011) while there is a strong need to improve the knowledge of hydrological hazards in African countries (Di Baldassarre et al., 2010). With this recent database becoming available, it could be possible to develop regional frequency analysis techniques for floods or low flows tailored for the African context, taking also into account the impacts of global changes.
YT wrote the manuscript, YT, NR, JEP, and RT collected and processed the data, and GM, JFB, EA, AB, HoD, HaD, AD, DH, LH, CP, RT, and PL edited the manuscript. All authors contributed to manuscript discussion and revision.
The authors declare that they have no conflict of interest.
River runoff has been obtained from the Global Runoff Data Centre, 56068 Koblenz, Germany, and included in the database with their authorization. We would like to thank the GRDC (https://www.bafg.de/GRDC/, last access: 13 April 2021) for granting access to their data. A large part of the data processed in the present study comes from the SIEREM database (http://www.hydrosciences.fr/sierem, last access: 13 April 2021), and the authors wish to express their gratitude to all the persons who contributed to this database over the years. The authors wish to thank Sebastian Gnann for his assistance with and feedback on the TOSSH toolbox (https://github.com/TOSSHtoolbox/, last access: 13 April 2021).
This work is dedicated to the memory of Claudine Dieulin who passed away in January 2020 during the course of this project.
This paper was edited by Lukas Gudmundsson and reviewed by Hong Do and one anonymous referee.
Addor, N., Nearing, G., Prieto, C., Newman, A. J., Le Vine, N., and Clark, M. P.: A Ranking of Hydrological Signatures Based on Their Predictability in Space, Water Resour. Res., 54, 8792–8812, https://doi.org/10.1029/2018WR022606, 2018.
Addor, N., Do, H. X., Alvarez-Garreton, C., Coxon, G., Fowler, K., and Mendoza, P. A.: Large-sample hydrology: recent progress, guidelines for new datasets and grand challenges, Hydrol. Sci. J., 65, 712–725, https://doi.org/10.1080/02626667.2019.1683182, 2020.
Alfieri, L., Lorini, V., Hirpa, F. A., Harrigan, S., Zsoter, E., Prudhomme, C., and Salamon, P.: A global streamflow reanalysis for 1980–2018, J. Hydrol. X, 6, 100049, https://doi.org/10.1016/j.hydroa.2019.100049, 2020.
Archfield, S. A., Clark, M., Arheimer, B., Hay, L. E., McMillan, H., Kiang, J. E., Seibert, J., Hakala, K., Bock, A., Wagener, T., Farmer, W. H., Andréassian, V., Attinger, S., Viglione, A., Knight, R., Markstrom, S., and Over, T.: Accelerating advances in continental domain hydrologic modeling, Water Resour. Res., 51, 10078–10091, https://doi.org/10.1002/2015WR017498, 2015.
Awange, J. L., Hu, K. X., and Khaki, M.: The newly merged satellite remotely sensed, gauge and reanalysis-based Multi-Source Weighted-Ensemble Precipitation: Evaluation over Australia and Africa (1981–2016), Sci. Total Environ., 670, 448–465, https://doi.org/10.1016/j.scitotenv.2019.03.148, 2019.
Baker, D. B., Richards, R. P., Loftus, T. T., and Kramer, J. W.: A new flashiness index: characteristics and applications to midwestern rivers and streams, J. Am. Water Resour. Assoc., 40, 503–522, https://doi.org/10.1111/j.1752-1688.2004.tb01046.x, 2004.
Barbier, B., Yacouba, H., Maïga, A. H., Mahé, G., and Paturel, J.-E.: Le retour des grands investissements hydrauliques en Afrique de l'Ouest: les perspectives et les enjeux, Géocarrefour, 1–2, 31–41, https://doi.org/10.4000/geocarrefour.7205, 2009.
Beck, H. E., Vergopolan, N., Pan, M., Levizzani, V., van Dijk, A. I. J. M., Weedon, G. P., Brocca, L., Pappenberger, F., Huffman, G. J., and Wood, E. F.: Global-scale evaluation of 22 precipitation datasets using gauge observations and hydrological modeling, Hydrol. Earth Syst. Sci., 21, 6201–6217, https://doi.org/10.5194/hess-21-6201-2017, 2017.
Beven, K., Asadullah, A., Bates, P., Blyth, E., Chappell, N., Child, S., Cloke, H., Dadson, S., Everard, N., Fowler, H. J., Freer, J., Hannah, D. M., Heppell, K., Holden, J., Lamb, R., Lewis, H., Morgan, G., Parry, L., and Wagener, T.: Developing observational methods to drive future hydrological science: Can we make a start as a community?, Hydrol. Process., 34, 868–873, https://doi.org/10.1002/hyp.13622, 2020.
Biemans, H., Haddeland, I., Kabat, P., Ludwig, F., Hutjes, R. W. A., Heinke, J., von Bloh, W., and Gerten, D.: Impact of reservoirs on river discharge and irrigation water supply during the 20th century, Water Resour. Res., 47, W03509, https://doi.org/10.1029/2009WR008929, 2011.
Blume, T., van Meerveld, I., and Weiler, M.: The role of experimental work in hydrological sciences – insights from a community survey, Hydrol. Sci. J., 62, 334–337, https://doi.org/10.1080/02626667.2016.1230675, 2017.
Bodian, A., Dezetter, A., and Dacosta, H.: Rainfall-runoff modelling of water resources in the upper Senegal River basin, Int. J. Water Resour. Dev., 32, 89–101, https://doi.org/10.1080/07900627.2015.1026435, 2016.
Bodian, A., Diop, L., Panthou, G., Dacosta, H., Deme, A., Dezetter, A., Ndiaye, P. M., Diouf, I., and Vischel, T.: Recent Trend in Hydroclimatic Conditions in the Senegal River Basin, Water, 12, 436, https://doi.org/10.3390/w12020436, 2020.
Bouimouass, H., Fakir, Y., Tweed, S., and Leblanc, M.: Groundwater recharge sources in semiarid irrigated mountain fronts, Hydrol. Process., 34, 1598–1615, https://doi.org/10.1002/hyp.13685, 2020.
Boyer, J.-F., Dieulin, C., Rouche, N., Cres, A., Servat, E., Paturel, J.-E., and Mahé, G.: SIEREM: an environmental information system for water resources, IAHS Publ, 308, 19–25, 2006.
Brocca, L., Filippucci, P., Hahn, S., Ciabatta, L., Massari, C., Camici, S., Schüller, L., Bojkov, B., and Wagner, W.: SM2RAIN–ASCAT (2007–2018): global daily satellite rainfall data from ASCAT soil moisture observations, Earth Syst. Sci. Data, 11, 1583–1601, https://doi.org/10.5194/essd-11-1583-2019, 2019.
Burn, D. H.: Catchment similarity for regional flood frequency analysis using seasonality measures, J. Hydrol., 202, 212–230, https://doi.org/10.1016/S0022-1694(97)00068-1, 1997.
Cheng, L., Yaeger, M., Viglione, A., Coopersmith, E., Ye, S., and Sivapalan, M.: Exploring the physical controls of regional patterns of flow duration curves – Part 1: Insights from statistical analyses, Hydrol. Earth Syst. Sci., 16, 4435–4446, https://doi.org/10.5194/hess-16-4435-2012, 2012.
Clark, M. P., Rupp, D. E., Woods, R. A., Tromp-van Meerveld, H. J., Peters, N. E., and Freer, J. E.: Consistency between hydrological models and field observations: linking processes at the hillslope scale to hydrological responses at the watershed scale, Hydrol. Process., 23, 311–319, https://doi.org/10.1002/hyp.7154, 2009.
Conway, D., Persechino, A., Ardoin-Bardin, S., Hamandawana, H., Dieulin, C., and Mahé, G.: Rainfall and Water Resources Variability in Sub-Saharan Africa during the Twentieth Century, J. Hydrometeorol., 10, 41–59, https://doi.org/10.1175/2008JHM1004.1, 2009.
Crochemore, L., Isberg, K., Pimentel, R., Pineda, L., Hasan, A., and Arheimer, B.: Lessons learnt from checking the quality of openly accessible river flow data worldwide, Hydrol. Sci. J., 65, 699–711, https://doi.org/10.1080/02626667.2019.1659509, 2020.
Dewandel, B., Lachassagne, P., Bakalowicz, M., Weng, P., and Al-Malki, A.: Evaluation of aquifer thickness by analysing recession hydrographs. Application to the Oman ophiolite hard-rock aquifer, J. Hydrol., 274, 248–269, https://doi.org/10.1016/S0022-1694(02)00418-3, 2003.
Dewandel, B., Lachassagne, P., and Qatan, A.: Spatial measurements of stream baseflow, a relevant method for aquifer characterization and permeability evaluation. Application to a hard-rock aquifer, the Oman ophiolite, Hydrol. Process., 18, 3391–3400, https://doi.org/10.1002/hyp.1502, 2004.
Di Baldassarre, G., Montanari, A., Lins, H., Koutsoyiannis, D., Brandimarte, L., and Blöschl, G.: Flood fatalities in Africa: From diagnosis to mitigation, Geophys. Res. Lett., 37, L22402, https://doi.org/10.1029/2010GL045467, 2010.
Dieulin, C., Mahé, G., Paturel, J.-E., Ejjiyar, S., Tramblay, Y., Rouché, N., and EL Mansouri, B.: A New 60-year 1940/1999 Monthly-Gridded Rainfall Data Set for Africa, Water, 11, 387, https://doi.org/10.3390/w11020387, 2019.
Dixon, H., Sandström, S., Cudennec, C., Lins, H. F., Abrate, T., Bérod, D., Chernov, I., Ravalitera, N., Sighomnou, D., and Teichert, F.: Intergovernmental cooperation for hydrometry – what, why and how?, Hydrol. Sci. J., in press, https://doi.org/10.1080/02626667.2020.1764569, 2020.
Do, H. X., Westra, S., and Leonard, M.: A global-scale investigation of trends in annual maximum streamflow, J. Hydrol., 552, 28–43, https://doi.org/10.1016/j.jhydrol.2017.06.015, 2017.
Do, H. X., Gudmundsson, L., Leonard, M., and Westra, S.: The Global Streamflow Indices and Metadata Archive (GSIM) – Part 1: The production of a daily streamflow archive and metadata, Earth Syst. Sci. Data, 10, 765–785, https://doi.org/10.5194/essd-10-765-2018, 2018.
Do, H. X., Zhao, F., Westra, S., Leonard, M., Gudmundsson, L., Boulange, J. E. S., Chang, J., Ciais, P., Gerten, D., Gosling, S. N., Müller Schmied, H., Stacke, T., Telteu, C.-E., and Wada, Y.: Historical and future changes in global flood magnitude – evidence from a model–observation investigation, Hydrol. Earth Syst. Sci., 24, 1543–1564, https://doi.org/10.5194/hess-24-1543-2020, 2020.
Ellouze, M. and Abida, H.: Regional Flood Frequency Analysis in Tunisia: Identification of Regional Distributions, Water Resour. Manag., 22, 943–957, https://doi.org/10.1007/s11269-007-9203-y, 2008.
ESA: Land Cover CCI Product User Guide Version 2, Tech. Rep., available at: http://maps.elie.ucl.ac.be/CCI/viewer/download/ESACCI-LC-Ph2-PUGv2_2.0.pdf (last access: 13 April 2021), 2017.
Estrany, J., Garcia, C., and Batalla, R. J.: Hydrological response of a small mediterranean agricultural catchment, J. Hydrol., 380, 180–190, https://doi.org/10.1016/j.jhydrol.2009.10.035, 2010.
Euser, T., Winsemius, H. C., Hrachowitz, M., Fenicia, F., Uhlenbrook, S., and Savenije, H. H. G.: A framework to assess the realism of model structures using hydrological signatures, Hydrol. Earth Syst. Sci., 17, 1893–1912, https://doi.org/10.5194/hess-17-1893-2013, 2013.
Farquharson, F. A. K., Meigh, J. R., and Sutcliffe, J. V.: Regional flood frequency analysis in arid and semi-arid areas, J. Hydrol., 138, 487–501, https://doi.org/10.1016/0022-1694(92)90132-F, 1992.
Fick, S. E. and Hijmans, R. J.: WorldClim 2: new 1km spatial resolution climate surfaces for global land areas, Int. J. Climatol., 37, 4302–4315, https://doi.org/10.1002/joc.5086, 2017.
Forootan, E., Khaki, M., Schumacher, M., Wulfmeyer, V., Mehrnegar, N., van Dijk, A. I. J. M., Brocca, L., Farzaneh, S., Akinluyi, F., Ramillien, G., Shum, C. K., Awange, J., and Mostafaie, A.: Understanding the global hydrological droughts of 2003–2016 and their relationships with teleconnections, Sci. Total Environ., 650, 2587–2604, https://doi.org/10.1016/j.scitotenv.2018.09.231, 2019.
Gehne, M., Hamill, T. M., Kiladis, G. N., and Trenberth, K. E.: Comparison of Global Precipitation Estimates across a Range of Temporal and Spatial Scales, J. Climate, 29, 7773–7795, https://doi.org/10.1175/JCLI-D-15-0618.1, 2016.
Ghiggi, G., Humphrey, V., Seneviratne, S. I., and Gudmundsson, L.: GRUN: an observation-based global gridded runoff dataset from 1902 to 2014, Earth Syst. Sci. Data, 11, 1655–1674, https://doi.org/10.5194/essd-11-1655-2019, 2019.
Gnann, S. J., Howden, N. J. K., and Woods, R. A.: Hydrological signatures describing the translation of climate seasonality into streamflow seasonality, Hydrol. Earth Syst. Sci., 24, 561–580, https://doi.org/10.5194/hess-24-561-2020, 2020.
Gnann, S. J., Coxon, G., Woods, R. A., Howden, N. J. K., and McMillan, H. K.: TOSSH: Pre-release, Zenodo, https://doi.org/10.5281/zenodo.4313276, 2021.
Gudmundsson, L., Do, H. X., Leonard, M., and Westra, S.: The Global Streamflow Indices and Metadata Archive (GSIM) – Part 2: Quality control, time-series indices and homogeneity assessment, Earth Syst. Sci. Data, 10, 787–804, https://doi.org/10.5194/essd-10-787-2018, 2018.
Hannah, D. M., Demuth, S., van Lanen, H. A. J., Looser, U., Prudhomme, C., Rees, G., Stahl, K., and Tallaksen, L. M.: Large-scale river flow archives: importance, current status and future needs, Hydrol. Process., 25, 1191–1200, https://doi.org/10.1002/hyp.7794, 2011.
Harrigan, S., Zsoter, E., Alfieri, L., Prudhomme, C., Salamon, P., Wetterhall, F., Barnard, C., Cloke, H., and Pappenberger, F.: GloFAS-ERA5 operational global river discharge reanalysis 1979–present, Earth Syst. Sci. Data, 12, 2043–2060, https://doi.org/10.5194/essd-12-2043-2020, 2020.
Harris, I., Osborn, T. J., Jones, P., and Lister, D.: Version 4 of the CRU TS monthly high-resolution gridded multivariate climate dataset, Sci. Data, 7, 109, https://doi.org/10.1038/s41597-020-0453-3, 2020.
Harrison, L., Funk, C., and Peterson, P.: Identifying changing precipitation extremes in Sub-Saharan Africa with gauge and satellite products, Environ. Res. Lett., 14, 085007, https://doi.org/10.1088/1748-9326/ab2cae, 2019.
Kimmage, K.: Small-scale irrigation initiatives in Nigeria: the problems of equity and sustainability, Appl. Geogr., 11, 5–20, https://doi.org/10.1016/0143-6228(91)90002-Q, 1991.
Komi, K., Amisigo, B., Diekkrüger, B., and Hountondji, F.: Regional Flood Frequency Analysis in the Volta River Basin, West Africa, Hydrology, 3, 5, https://doi.org/10.3390/hydrology3010005, 2016.
Ladson, A. R., Brown, R., Neal, B., and Nathan, R.: A Standard Approach to Baseflow Separation Using The Lyne and Hollick Filter, Australasian Journal of Water Resources, 17, 25–34, https://doi.org/10.7158/13241583.2013.11465417, 2013.
Lavers, D. A., Harrigan, S., Andersson, E., Richardson, D. S., Prudhomme, C., and Pappenberger, F.: A vision for improving global flood forecasting, Environ. Res. Lett., 14, 121002, https://doi.org/10.1088/1748-9326/ab52b2, 2019.
Lehner, B., Liermann, C. R., Revenga, C., Vörösmarty, C., Fekete, B., Crouzet, P., Döll, P., Endejan, M., Frenken, K., Magome, J., Nilsson, C., Robertson, J. C., Rödel, R., Sindorf, N., and Wisser, D.: High-resolution mapping of the world's reservoirs and dams for sustainable river flow management, Front. Ecol. Environ., 9, 494–502, https://doi.org/10.1890/100125, 2011.
Mahé, G. and Olivry, J.-C.: Assessment of freshwater yields to the ocean along the intertropical Atlantic coast of Africa (1951–1989), Comptes Rendus Académie Sci. – Ser. IIA – Earth Planet. Sci., 328, 621–626, https://doi.org/10.1016/S1251-8050(99)80159-1, 1999.
Mahe, G., Lienou, G., Descroix, L., Bamba, F., Paturel, J. E., Laraque, A., Meddi, M., Habaieb, H., Adeaga, O., Dieulin, C., Chahnez Kotti, F., and Khomsi, K.: The rivers of Africa: witness of climate change and human impact on the environment, Hydrol. Process., 27, 2105–2114, https://doi.org/10.1002/hyp.9813, 2013.
Mardia, K. V., Birnbaum, Z. W., and Lukacs, E.: Statistics of Directional Data, Elsevier Science, Saint Louis, available at: http://qut.eblib.com.au/patron/FullRecord.aspx?p=1901433 (last access: 21 January 2021), 2015.
McMillan, H.: Linking hydrologic signatures to hydrologic processes: A review, Hydrol. Process., 34, 1393–1409, https://doi.org/10.1002/hyp.13632, 2020.
McMillan, H., Westerberg, I., and Branger, F.: Five guidelines for selecting hydrological signatures, Hydrol. Process., 31, 4757–4761, https://doi.org/10.1002/hyp.11300, 2017.
Nathanael, J., Smithers, J., and Horan, M.: Assessing the performance of regional flood frequency analysis methods in South Africa, Water SA, 44, 387–398, https://doi.org/10.4314/wsa.v44i3.06, 2018.
Ndzabandzaba, C. and Hughes, D. A.: Regional water resources assessments using an uncertain modelling approach: The example of Swaziland, J. Hydrol. Reg. Stud., 10, 47–60, https://doi.org/10.1016/j.ejrh.2017.01.002, 2017.
Newman, A. J., Clark, M. P., Sampson, K., Wood, A., Hay, L. E., Bock, A., Viger, R. J., Blodgett, D., Brekke, L., Arnold, J. R., Hopson, T., and Duan, Q.: Development of a large-sample watershed-scale hydrometeorological data set for the contiguous USA: data set characteristics and assessment of regional variability in hydrologic model performance, Hydrol. Earth Syst. Sci., 19, 209–223, https://doi.org/10.5194/hess-19-209-2015, 2015.
Nka, B. N., Oudin, L., Karambiri, H., Paturel, J. E., and Ribstein, P.: Trends in floods in West Africa: analysis based on 11 catchments in the region, Hydrol. Earth Syst. Sci., 19, 4707–4719, https://doi.org/10.5194/hess-19-4707-2015, 2015.
Nogueira, M.: Inter-comparison of ERA-5, ERA-interim and GPCP rainfall over the last 40 years: Process-based analysis of systematic and random differences, J. Hydrol., 583, 124632, https://doi.org/10.1016/j.jhydrol.2020.124632, 2020.
Padi, P. T., Baldassarre, G. D., and Castellarin, A.: Floodplain management in Africa: Large scale analysis of flood data, Phys. Chem. Earth Parts ABC, 36, 292–298, https://doi.org/10.1016/j.pce.2011.02.002, 2011.
Peel, M. C., Finlayson, B. L., and McMahon, T. A.: Updated world map of the Köppen-Geiger climate classification, Hydrol. Earth Syst. Sci., 11, 1633–1644, https://doi.org/10.5194/hess-11-1633-2007, 2007.
Pekel, J.-F., Cottam, A., Gorelick, N., and Belward, A. S.: High-resolution mapping of global surface water and its long-term changes, Nature, 540, 418–422, https://doi.org/10.1038/nature20584, 2016.
Pettitt, A. N.: A Non-Parametric Approach to the Change-Point Problem, Appl. Stat., 28, 126, https://doi.org/10.2307/2346729, 1979.
Poff, N. L., Allan, J. D., Bain, M. B., Karr, J. R., Prestegaard, K. L., Richter, B. D., Sparks, R. E., and Stromberg, J. C.: The Natural Flow Regime, BioScience, 47, 769–784, https://doi.org/10.2307/1313099, 1997.
Rianna, M., Efstratiadis, A., Russo, F., Napolitano, F., and Koutsoyiannis, D.: A stochastic index method for calculating annual flow duration curves in intermittent rivers, Irrig. Drain., 62, 41–49, https://doi.org/10.1002/ird.1803, 2013.
Richter, B. D., Baumgartner, J. V., Powell, J., and Braun, D. P.: A Method for Assessing Hydrologic Alteration within Ecosystems, Conserv. Biol., 10, 1163–1174, https://doi.org/10.1046/j.1523-1739.1996.10041163.x, 1996.
Roudier, P., Ducharne, A., and Feyen, L.: Climate change impacts on runoff in West Africa: a review, Hydrol. Earth Syst. Sci., 18, 2789–2801, https://doi.org/10.5194/hess-18-2789-2014, 2014.
Safeeq, M., Grant, G. E., Lewis, S. L., and Tague, C. L.: Coupling snowpack and groundwater dynamics to interpret historical streamflow trends in the western United States, Hydrol. Process., 27, 655–668, https://doi.org/10.1002/hyp.9628, 2013.
Satgé, F., Defrance, D., Sultan, B., Bonnet, M.-P., Seyler, F., Rouché, N., Pierron, F., and Paturel, J.-E.: Evaluation of 23 gridded precipitation datasets across West Africa, J. Hydrol., 581, 124412, https://doi.org/10.1016/j.jhydrol.2019.124412, 2020.
Sawicz, K., Wagener, T., Sivapalan, M., Troch, P. A., and Carrillo, G.: Catchment classification: empirical analysis of hydrologic similarity based on catchment function in the eastern USA, Hydrol. Earth Syst. Sci., 15, 2895–2911, https://doi.org/10.5194/hess-15-2895-2011, 2011.
Schwanghart, W. and Scherler, D.: Short Communication: TopoToolbox 2 – MATLAB-based software for topographic analysis and modeling in Earth surface sciences, Earth Surf. Dynam., 2, 1–7, https://doi.org/10.5194/esurf-2-1-2014, 2014.
Smakhtin, V. U.: Low flow hydrology: a review, J. Hydrol., 240, 147–186, https://doi.org/10.1016/S0022-1694(00)00340-1, 2001.
Smakhtin, V. Y., Hughes, D. A., and Creuse-Naudin, E.: Regionalization of daily flow characteristics in part of the Eastern Cape, South Africa, Hydrol. Sci. J., 42, 919–936, https://doi.org/10.1080/02626669709492088, 1997.
Stewart, B.: Measuring what we manage – the importance of hydrological data to water resources management, Proc. Int. Assoc. Hydrol. Sci., 366, 80–85, https://doi.org/10.5194/piahs-366-80-2015, 2015.
Su, C.-H., Costelloe, J. F., Peterson, T. J., and Western, A. W.: On the structural limitations of recursive digital filters for base flow estimation, Water Resour. Res., 52, 4745–4764, https://doi.org/10.1002/2015WR018067, 2016.
Sylla, M. B., Giorgi, F., Coppola, E., and Mariotti, L.: Uncertainties in daily rainfall over Africa: assessment of gridded observation products and evaluation of a regional climate model simulation, Int. J. Climatol., 33, 1805–1817, https://doi.org/10.1002/joc.3551, 2013.
Thiemig, V., de Roo, A., and Gadain, H.: Current status on flood forecasting and early warning in Africa, Int. J. River Basin Manag., 9, 63–78, https://doi.org/10.1080/15715124.2011.555082, 2011.
Tramblay, Y. and Rouché, N.: ADHI: African Database of Hydrometric Indices, DataSuds, IRD, https://doi.org/10.23708/LXGXQ9, 2020.
Tramblay, Y., Villarini, G., and Zhang, W.: Observed changes in flood hazard in Africa, Environ. Res. Lett., 15, 1040b5, https://doi.org/10.1088/1748-9326/abb90b, 2020.
Tumbo, M. and Hughes, D. A.: Uncertain hydrological modelling: application of the Pitman model in the Great Ruaha River basin, Tanzania, Hydrol. Sci. J., 60, 2047–2061, https://doi.org/10.1080/02626667.2015.1016948, 2015.
UKIH: Institute of Hydrology. Low Flow Studies Report No 3, Institute of Hydrology, Wallingford, UK, 1980.
Underhill, H. W.: Small-scale irrigation in Africa in the context of rural development, FAO, Land and Water Development Division, Rome, Italy, 1984.
Van Lanen, H. A. J., Demuth, S., Daniell, T., Hannah, D. M., Laaha, G., Mahe, G., and Tallaksen, L. N.: Over 25 years of FRIEND-Water: an overview, in: Hydrology in a Changing World: Environmental and Human Dimensions, Proceedings of FRIEND-Water 2014, Montpellier, France, October 2014, edited by: Daniell, T. M., Van Lanen, H. A. J., Demuth, S., Laaha, G., Servat, E., Mahe, G., Boyer, J.-F., Paturel, J.-E., Dezetter, A., and Ruelland, D., Sci. Ed., IAHS Publ., 363, 1–7, 2014.
Viglione, A., Borga, M., Balabanis, P., and Blöschl, G.: Barriers to the exchange of hydrometeorological data in Europe: Results from a survey and implications for data policy, J. Hydrol., 394, 63–77, https://doi.org/10.1016/j.jhydrol.2010.03.023, 2010.
Westerberg, I. K., Wagener, T., Coxon, G., McMillan, H. K., Castellarin, A., Montanari, A., and Freer, J.: Uncertainty in hydrological signatures for gauged and ungauged catchments, Water Resour. Res., 52, 1847–1865, https://doi.org/10.1002/2015WR017635, 2016.
Yadav, M., Wagener, T., and Gupta, H.: Regionalization of constraints on expected watershed response behavior for improved predictions in ungauged basins, Adv. Water Resour., 30, 1756–1774, https://doi.org/10.1016/j.advwatres.2007.01.005, 2007.
Zkhiri, W., Tramblay, Y., Hanich, L., and Berjamy, B.: Regional flood frequency analysis in the High Atlas mountainous catchments of Morocco, Nat. Hazards, 86, 953–967, https://doi.org/10.1007/s11069-016-2723-0, 2017.