the Creative Commons Attribution 4.0 License.
the Creative Commons Attribution 4.0 License.
 | 30 Mar 2021
The Rocklea Dome 3D Mineral Mapping Test Data Set
Maarten Haest
Thomas Cudahy
The integration of surface and subsurface geoscience data is critical for efficient and effective mineral exploration and mining. Publicly accessible data sets to evaluate the various geoscience analytical tools and their effectiveness for characterisation of mineral assemblages and lithologies or discrimination of ore from waste are however scarce. The open-access Rocklea Dome 3D Mineral Mapping Test Data Set (Laukamp, 2020; https://doi.org/10.25919/5ed83bf55be6a) provides an opportunity for evaluating proximal and remote sensing data, validated and calibrated by independent geochemical and mineralogical analyses, for exploration of channel iron deposits (CIDs) through cover. We present hyperspectral airborne, surface, and drill core reflectance spectra collected in the visible–near-infrared and shortwave infrared wavelength ranges (VNIR–SWIR; 350 to 2500 nm), as well as whole-rock geochemistry obtained by means of X-ray fluorescence analysis and loss-on-ignition measurements of drill core samples.
The integration of surface with subsurface hyperspectral data collected in the frame of previously published Rocklea Dome 3D Mineral Mapping case studies demonstrated that about 30 % of exploration drill holes were sunk into barren ground and could have been of better use, located elsewhere, if airborne hyperspectral imagery had been consulted for drill hole planning. The remote mapping of transported Tertiary detritals (i.e. potential hosts of channel iron ore resources) versus weathered in situ Archaean bedrock (i.e. barren ground) has significant implications for other areas where “cover” (i.e. regolith and/or sediments covering bedrock hosting mineral deposits) hinders mineral exploration. Hyperspectral remote sensing represents a cost-effective method for regolith landform mapping required for planning drilling programmes. In the Rocklea Dome area, vegetation unmixing methods applied to airborne hyperspectral data, integrated with subsurface data, resulted in seamless mapping of ore zones from the weathered surface to the base of the CID – a concept that can be applied to other mineral exploration and mineral deposit studies. Furthermore, the associated, independent calibration data allowed the quantification of iron oxide phases and associated mineralogy from hyperspectral data. Using the Rocklea Dome data set, novel geostatistical clustering methods were applied to the drill core data sets for ore body domaining that introduced scientific rigour to a traditionally subjective procedure, resulting in reproducible objective domains that are critical for the mining process.
Beyond the previously published case studies, the Rocklea Dome 3D Mineral Mapping Test Data Set has the potential to develop new methods for advanced resource characterisation and develop new applications that aid exploration for mineral deposits through cover. The white mica and chlorite abundance maps derived from airborne hyperspectral, presented here for the first time, highlight the additional applications of remote sensing for geological mapping and could help to evaluate newly launched hyper- and multispectral spaceborne systems for geoscience and mineral exploration.
- Article
(21155 KB) - Full-text XML
- BibTeX
- EndNote


The three-dimensional (3D) geologic case history of the Rocklea Dome located in the Hamersley Province (Western Australia) targeted the use of reflectance and emission spectroscopy for measuring mineralogy and geochemistry specific to the exploration and characterisation of economic Tertiary channel iron ore deposits in a terrain obscured by weathered, transported materials. This public case history was generated by CSIRO's Western Australian Centre of Excellence for 3D Mineral Mapping (C3DMM), which was operated from 2009 to 2012 and had the primary aim of generating and demonstrating the capabilities for “scalable” 3D mineral mapping from the continental to the prospect scales (Cudahy, 2016). The Rocklea Dome project was established in collaboration with Murchison Metal Ltd, who granted C3DMM access to their drill hole data set, consisting of 14 diamond cores and 180 reverse-circulation drill holes. These drill holes were designed using traditional exploration mapping technologies, such as published geology maps and geophysical data (magnetics and radiometrics).
Key achievements of the Rocklea Dome 3D Mineral Mapping case study include the following:
-
Based on the kaolin crystallinity index derived from surface and subsurface hyperspectral data (Cudahy, 2016), drill holes were identified that were sunk at surface into barren (i.e. bedrock) weathered material. If surface mineral mapping data, such as airborne hyperspectral imagery, had been used during drill hole planning, approximately one-third of the drill holes would not have needed to be drilled or would have been located differently. This represents potential significant savings in time, money, and environmental disturbance.
-
Characterisation of clay mineralogy associated with distinct domains of the channel iron deposit (CID) and its cover (i.e. kaolin group vs. Al-smectites vs. Fe-smectites) suggested that clay mineral assemblages as well as calcrete atop buried CIDs have a different composition when compared to regolith covering adjacent areas. That could represent useful information when exploring for CIDs through regolith cover.
-
Quantification of iron oxide phases and associated mineralogy derived from hyperspectral data and validated using X-ray diffractometry and geochemistry (Haest et al., 2012a, b) enabled the prediction and modelling of
-
iron (oxyhydr-)oxide content: RMSE of 9.1 wt % Fe;
-
Al clay content: RMSE of 3.9 wt % Al2O3;
-
hematite / goethite ratio: RMSE of 9.0 wt % goethite;
-
spatial characterisation of vitreous vs. ochreous goethite.
-
-
The integration of drill core hyperspectral and geochemistry data enabled the geological modelling of the iron ore resource of the Rocklea Dome CID (Haest et al., 2012a, b; Cudahy, 2016; Fouedjio et al., 2018), which was reported by Dragon Resources in 2012 to be 72.6 Mt (at 53 % Fe cut-off) with 54.4 % Fe, 7.2 % SiO2, 2.7 % Al2O3, 0.031 % P, and 11.2 % loss on ignition (LOI).
-
The vegetation unmixing methods (Haest et al., 2013) led to an improvement of the quality of the mineral maps, resulting in seamless mapping of ore zones from the weathered surface to the base of the deposit (Cudahy, 2016).
All the above points showcase how hyperspectral data can be used for critical parts of the mining cycle, especially exploration and 3D resource characterisation.
This article aims to provide an overview of the publicly available hyperspectral data set of the Rocklea Dome, which ought to be used as a test data set for (1) data mining for exploration and mining, (2) integration of independent geoscience data sets (i.e. hyperspectral, geochemical), (3) resource modelling, and (4) different approaches for routine processing of hyperspectral data.
The geological setting of the Rocklea Dome area, as well as analytical and processing methods, will be discussed first, after which the publicly available test data are listed as a table. Example applications of the geochemical and mineralogical data for exploration, 3D mineral mapping and resource estimation are summarised briefly in the section on data products and applications.
The Rocklea Dome channel iron deposit is located in the Hamersley Province, which is the dominant source of Australia's iron ore exports. CIDs are economically significant formations, providing a substantial percentage of the iron ore mined in Australia. A detailed overview of the geology of the Rocklea Dome and the formation of the CID was provided by Haest et al. (2012b) and is briefly summarised here. The bedrock geology of the Rocklea Dome comprises a monzogranite pluton and cross-cutting mafic and ultramafic intrusives that form part of the Pilbara Craton. The Archean age pluton is overlain by Archaean–Proterozoic metasedimentary and volcanic rocks of the Hamersley Basin, enveloping the central monzogranite dome (Fig. 1; Thorne and Tyler, 1996). Folding is attributed to development of both the Ophthalmia and the Ashburton fold belts (Thorne and Tyler, 1996).
A meandering Tertiary palaeochannel passes over the Archean and Proterozoic rocks, containing local CIDs, such as the Beasley River CID, which cross-cuts the northwestern part of the Rocklea Dome. Channel iron ore was also drilled along the 8 km strike length of a palaeochannel on the eastern side of the Rocklea Dome, which was described by Haest et al. (2012a, b; 2013) as the Rocklea Dome CID (Fig. 1). The bedrocks and Tertiary channel are covered partly by regolith (e.g. Quaternary alluvium). Green vegetation and dry vegetation (mostly Spinifex grass and bushes) cover the area partly.
A mixture of Fe-Ox pelletoids and ferruginised wood fragments below 10 mm in size represent the major components of CIDs (Morris and Ramanaidou, 2007). In CID systems, the base of the palaeochannel often consists of a clay horizon of variable composition. The CID is capped in places by calcrete and silcrete.
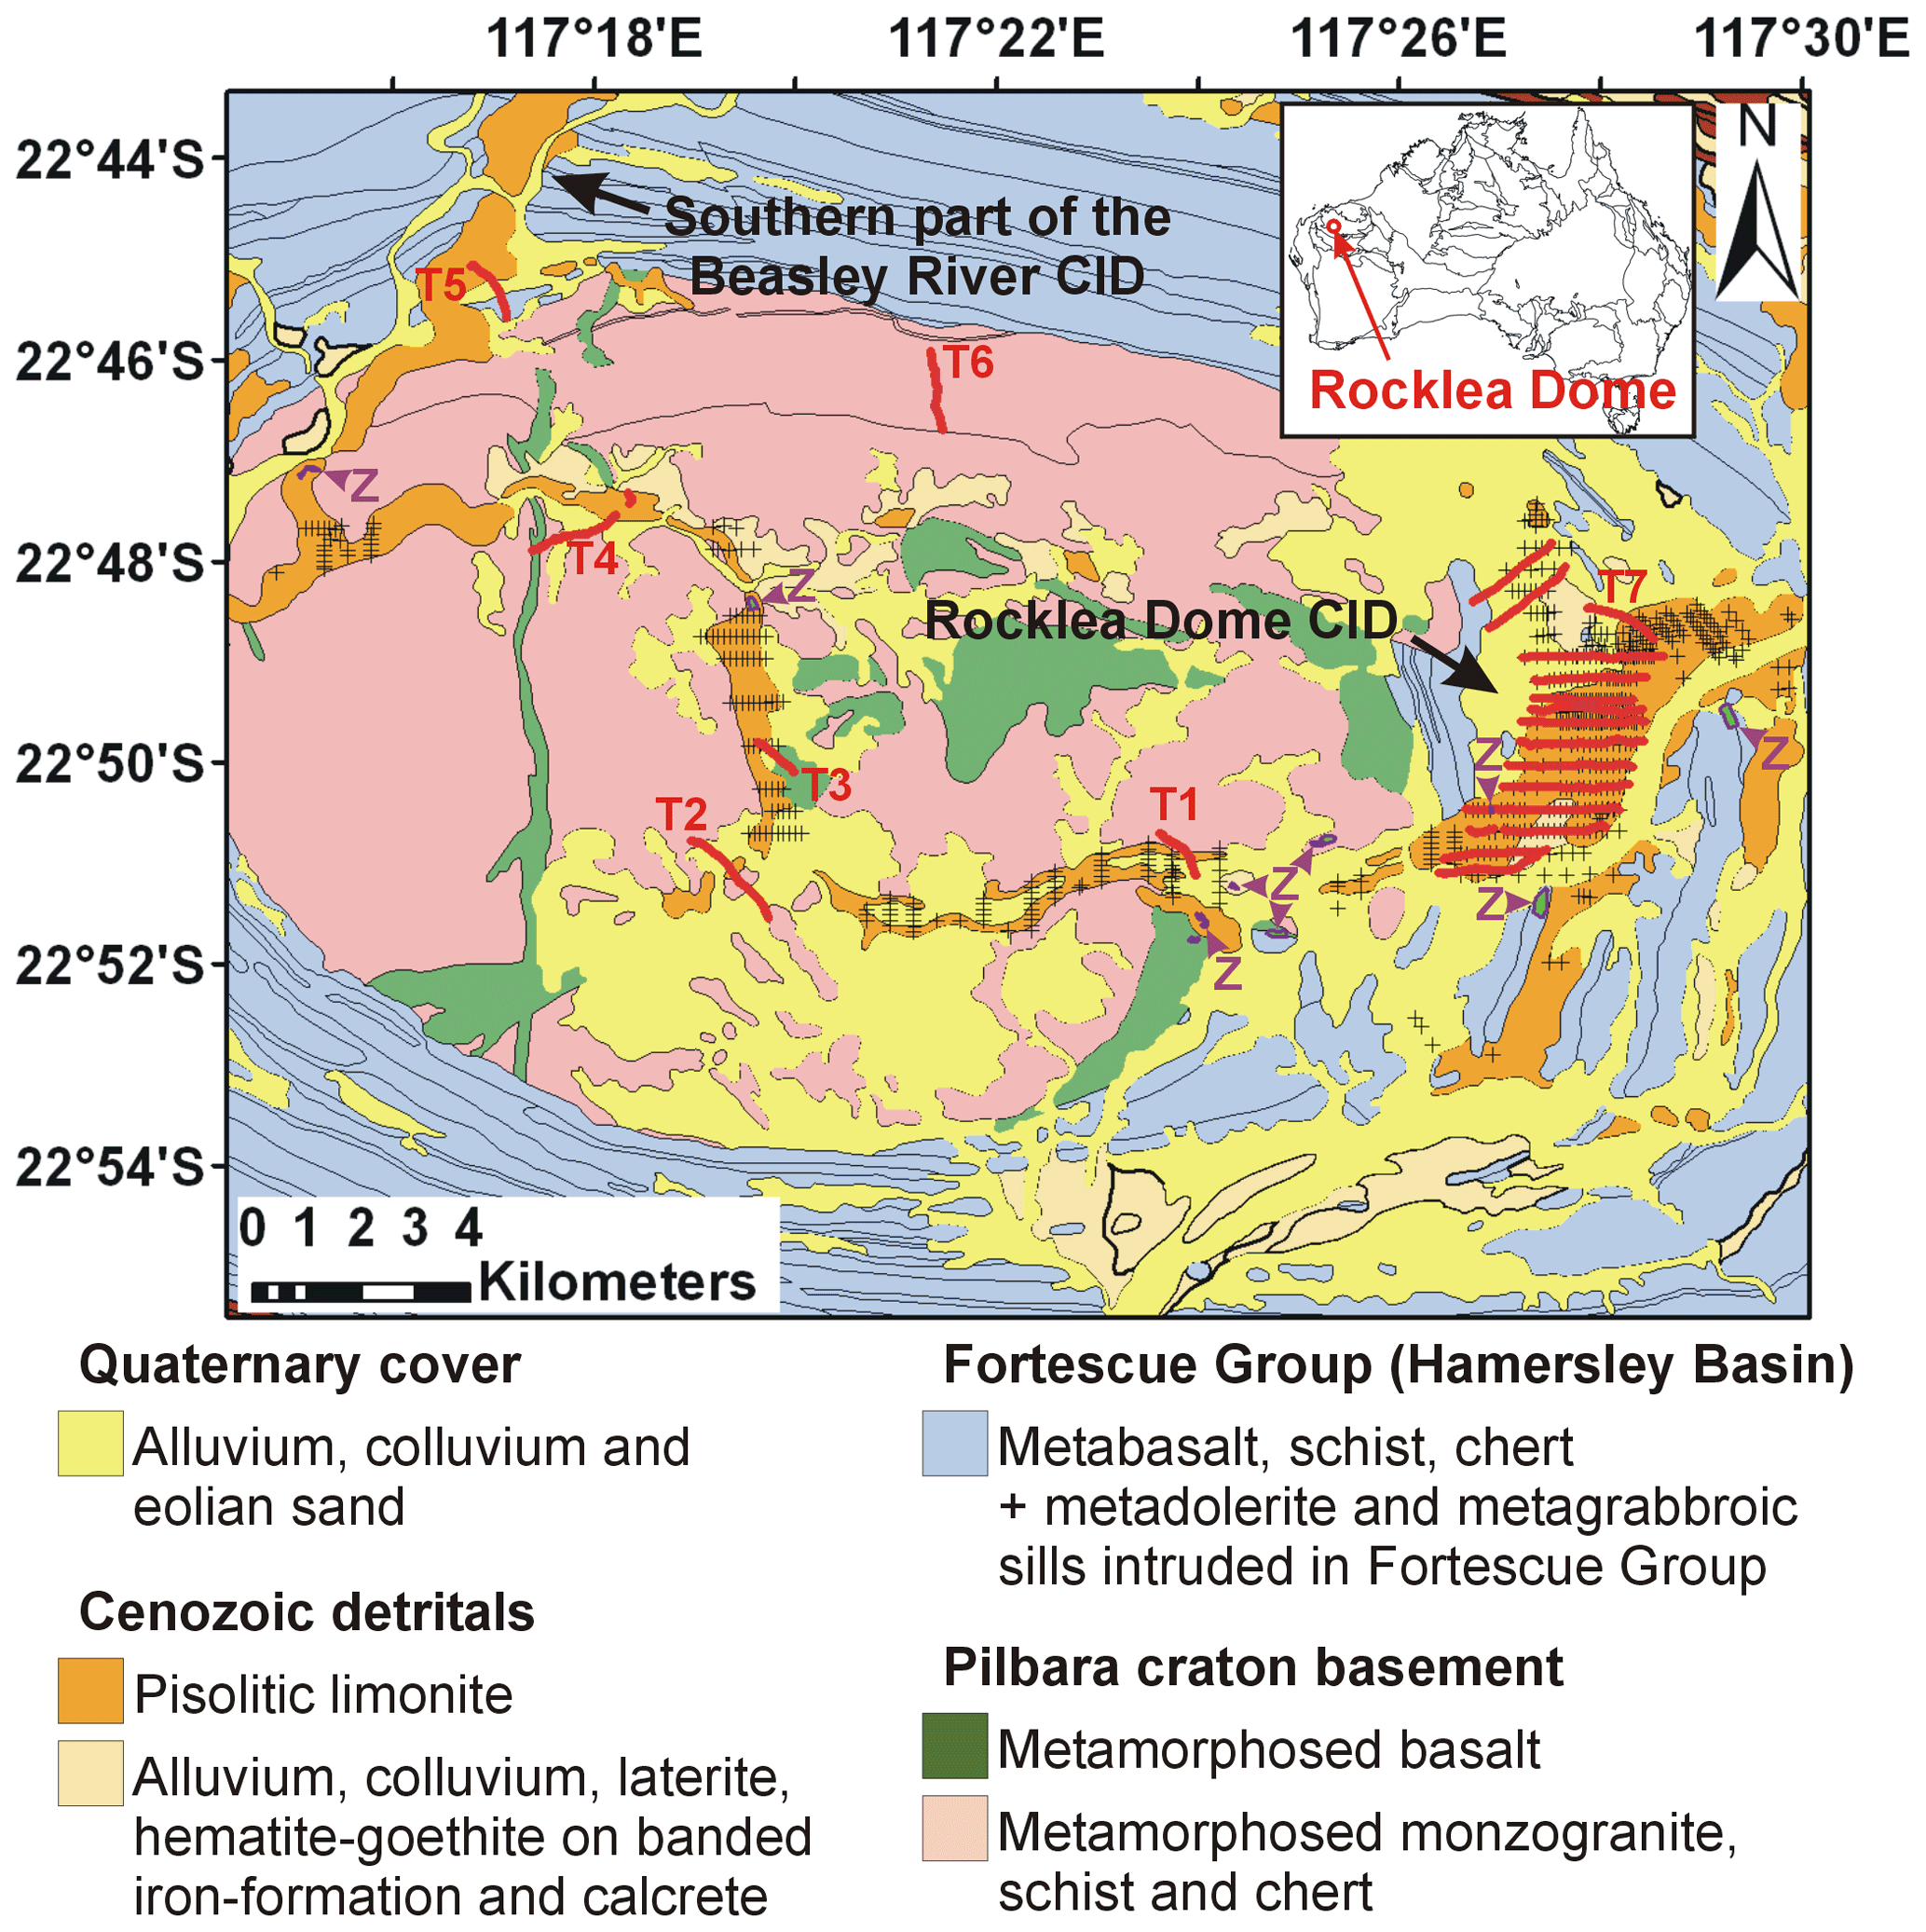
Figure 1Geological map of the core of the Rocklea Dome (Haest et al., 2013; Thorne and Tyler, 1996). Validation transects are indicated as red lines. T1 to T7 refer to transects described in Haest et al. (2012a). The black crosses identify the position of all reverse-circulation drill cores intersecting the palaeochannel (i.e. pisolitic limonite in map) in the core of the Rocklea Dome.
3.1 VNIR–SWIR drill core spectroscopy
Reflectance spectra of 180 rock chips (RCs) and 14 diamond drill cores (RKDs) were measured using CSIRO's HyChips™ system (cf. Huntington et al., 2004), which comprises a TerraSpec™-based spectrometer (Malvern Panalytical) system. In total, 7520 reflectance spectra were collected from RC samples, and 66 853 reflectance spectra were collected from RKD samples (Haest et al., 2012a). An automated x–y table moves the drill core tray in a snake-like pattern below the TerraSpec™ optical fibre at a distance of ∼ 6 to 13 cm (depending on sample type, i.e. diamond core or drill chips), while the spectral data are collected. Each sample spectrum is collected from a 1 × 1 cm area. Four light globes are positioned 40 cm above and at a small angle (off the backscatter/specular angle) to the measurement/sample point. In addition to hyperspectral data, high-spatial-resolution (0.1 mm pixel) images are collected from the core or chip tray, and the sample height in the tray is measured using a laser profilometer. Reflectance spectra were calibrated using a Spectralon™ panel (see Haest et al., 2012a, for more details). TerraSpec™ spectra were collected in the visible to near infrared (VNIR: 380–1000 nm) and shortwave infrared (SWIR: 1000–2500 nm), with sampling intervals of 1.4 nm in the VNIR and 2.0 nm in the SWIR and a wavelength accuracy of ±1 nm. The spectral resolution is 5 nm in the VNIR and between 11 and 12 nm in the SWIR. The TerraSpec™ radiance spectra of each sample are first converted to apparent bidirectional reflectance using the Teflon signal, which is collected at the beginning/end of each drill core/drill chip tray measurement cycle. This signal is then converted to absolute reflectance, based on the measurement of a Spectralon™ panel.
3.2 Remote sensing
Airborne VNIR–SWIR imagery was collected using the Airborne Multispectral Scanner (AMS), which is an earlier version of HyVista Corporation's HyMap™ system (Cocks et al., 1998). The AMS system collects 96 bands over the VNIR–SWIR, excluding the atmospheric bands from ∼ 1000 to ∼ 1400 nm and from ∼ 1800 to ∼ 1950 nm. For each spectral band, the average spacing of collected bands is 15 nm and the average full width at half maximum is 17 nm. The AMS data over Rocklea Dome were collected in a north–south direction between 31 July 2000 and 2 August 2000, comprising a set of 14 flight lines, resulting in a combined length of ∼ 280 km at a pixel size of approximately 7 m. Atmospheric correction was done using MODTRAN5 (Berk et al., 2005, 2006) and SODA (Rodger, 2011), based on a combination of the AMS at-sensor radiance with in-scene flight parameters (e.g. latitude, longitude, sensor height). For more details about georeferencing and mosaicking the single flight lines, see Haest et al. (2013).
3.3 X-ray fluorescence analysis (XRF)
XRF analysis of 11 900 RC samples (1 m interval) for weight percentages of FeO, P, S, SiO2, Al2O3, Mn, CaO, K2O, MgO, and TiO2 was conducted by Kalassay Ltd (now Bureau Veritas Minerals Pty Ltd, Western Australia). A Bruker Pioneer X-ray fluorescence instrument with an end window 4 kW rhodium X-ray tube was used. Sample preparation included drying at 105 ∘C for 12 h or for 1 h, depending on whether the sample was wet or dry, respectively. Samples were then crushed to a nominal 90 % passing 75 µm. The sample powders were fused in a Herzog automated fusion furnace and cast into 40 mm diameter beads using a 12:22 flux containing 5 % sodium nitrate. Matrix corrections were applied using a calculated alpha correction for this combination of flux, tube, and instrument geometry. Previously determined weight ranges were used for both the sample and the flux weight. Kalassay Ltd used lab duplicates, internationally certified reference materials, and reference materials of the same ore type as standards and reported a precision better than 0.01 % for all analyses. In order to evaluate the accuracy of XRF analyses undertaken by Kalassay Ltd, duplicate samples were also sent to the Amdel laboratory in Cannington (Western Australia), with good correlation observed (Haest et al., 2012a).
3.4 Loss on ignition (LOI)
In order to characterise the mineral assemblages present in the samples in more detail, LOI measurements were undertaken on 11 900 RC samples to record the mass loss of samples on heating (Haest et al., 2012a). A pre-dried portion of all samples was heated in an electric furnace to 1000 ∘C. During this process, goethite releases its strongly bonded water and its OH groups between 260 and 425 ∘C (Strezov et al., 2010), organic matter completely ignites by 550 ∘C (Dean, 1974), aluminosilicate clay materials decompose between 530 and 605 ∘C (Strezov et al., 2010), and inorganic carbon is oxidised and lost as CO2 between 700 and 850 ∘C (Dean, 1974).
3.5 Sample storage
Drill core trays, field samples, and XRF standards are all stored at the Australian Resources Research Centre (ARRC) in Kensington (Western Australia). Samples can be viewed and investigated at the ARRC, using local analytical facilities.
4.1 Processing of hyperspectral drill core data
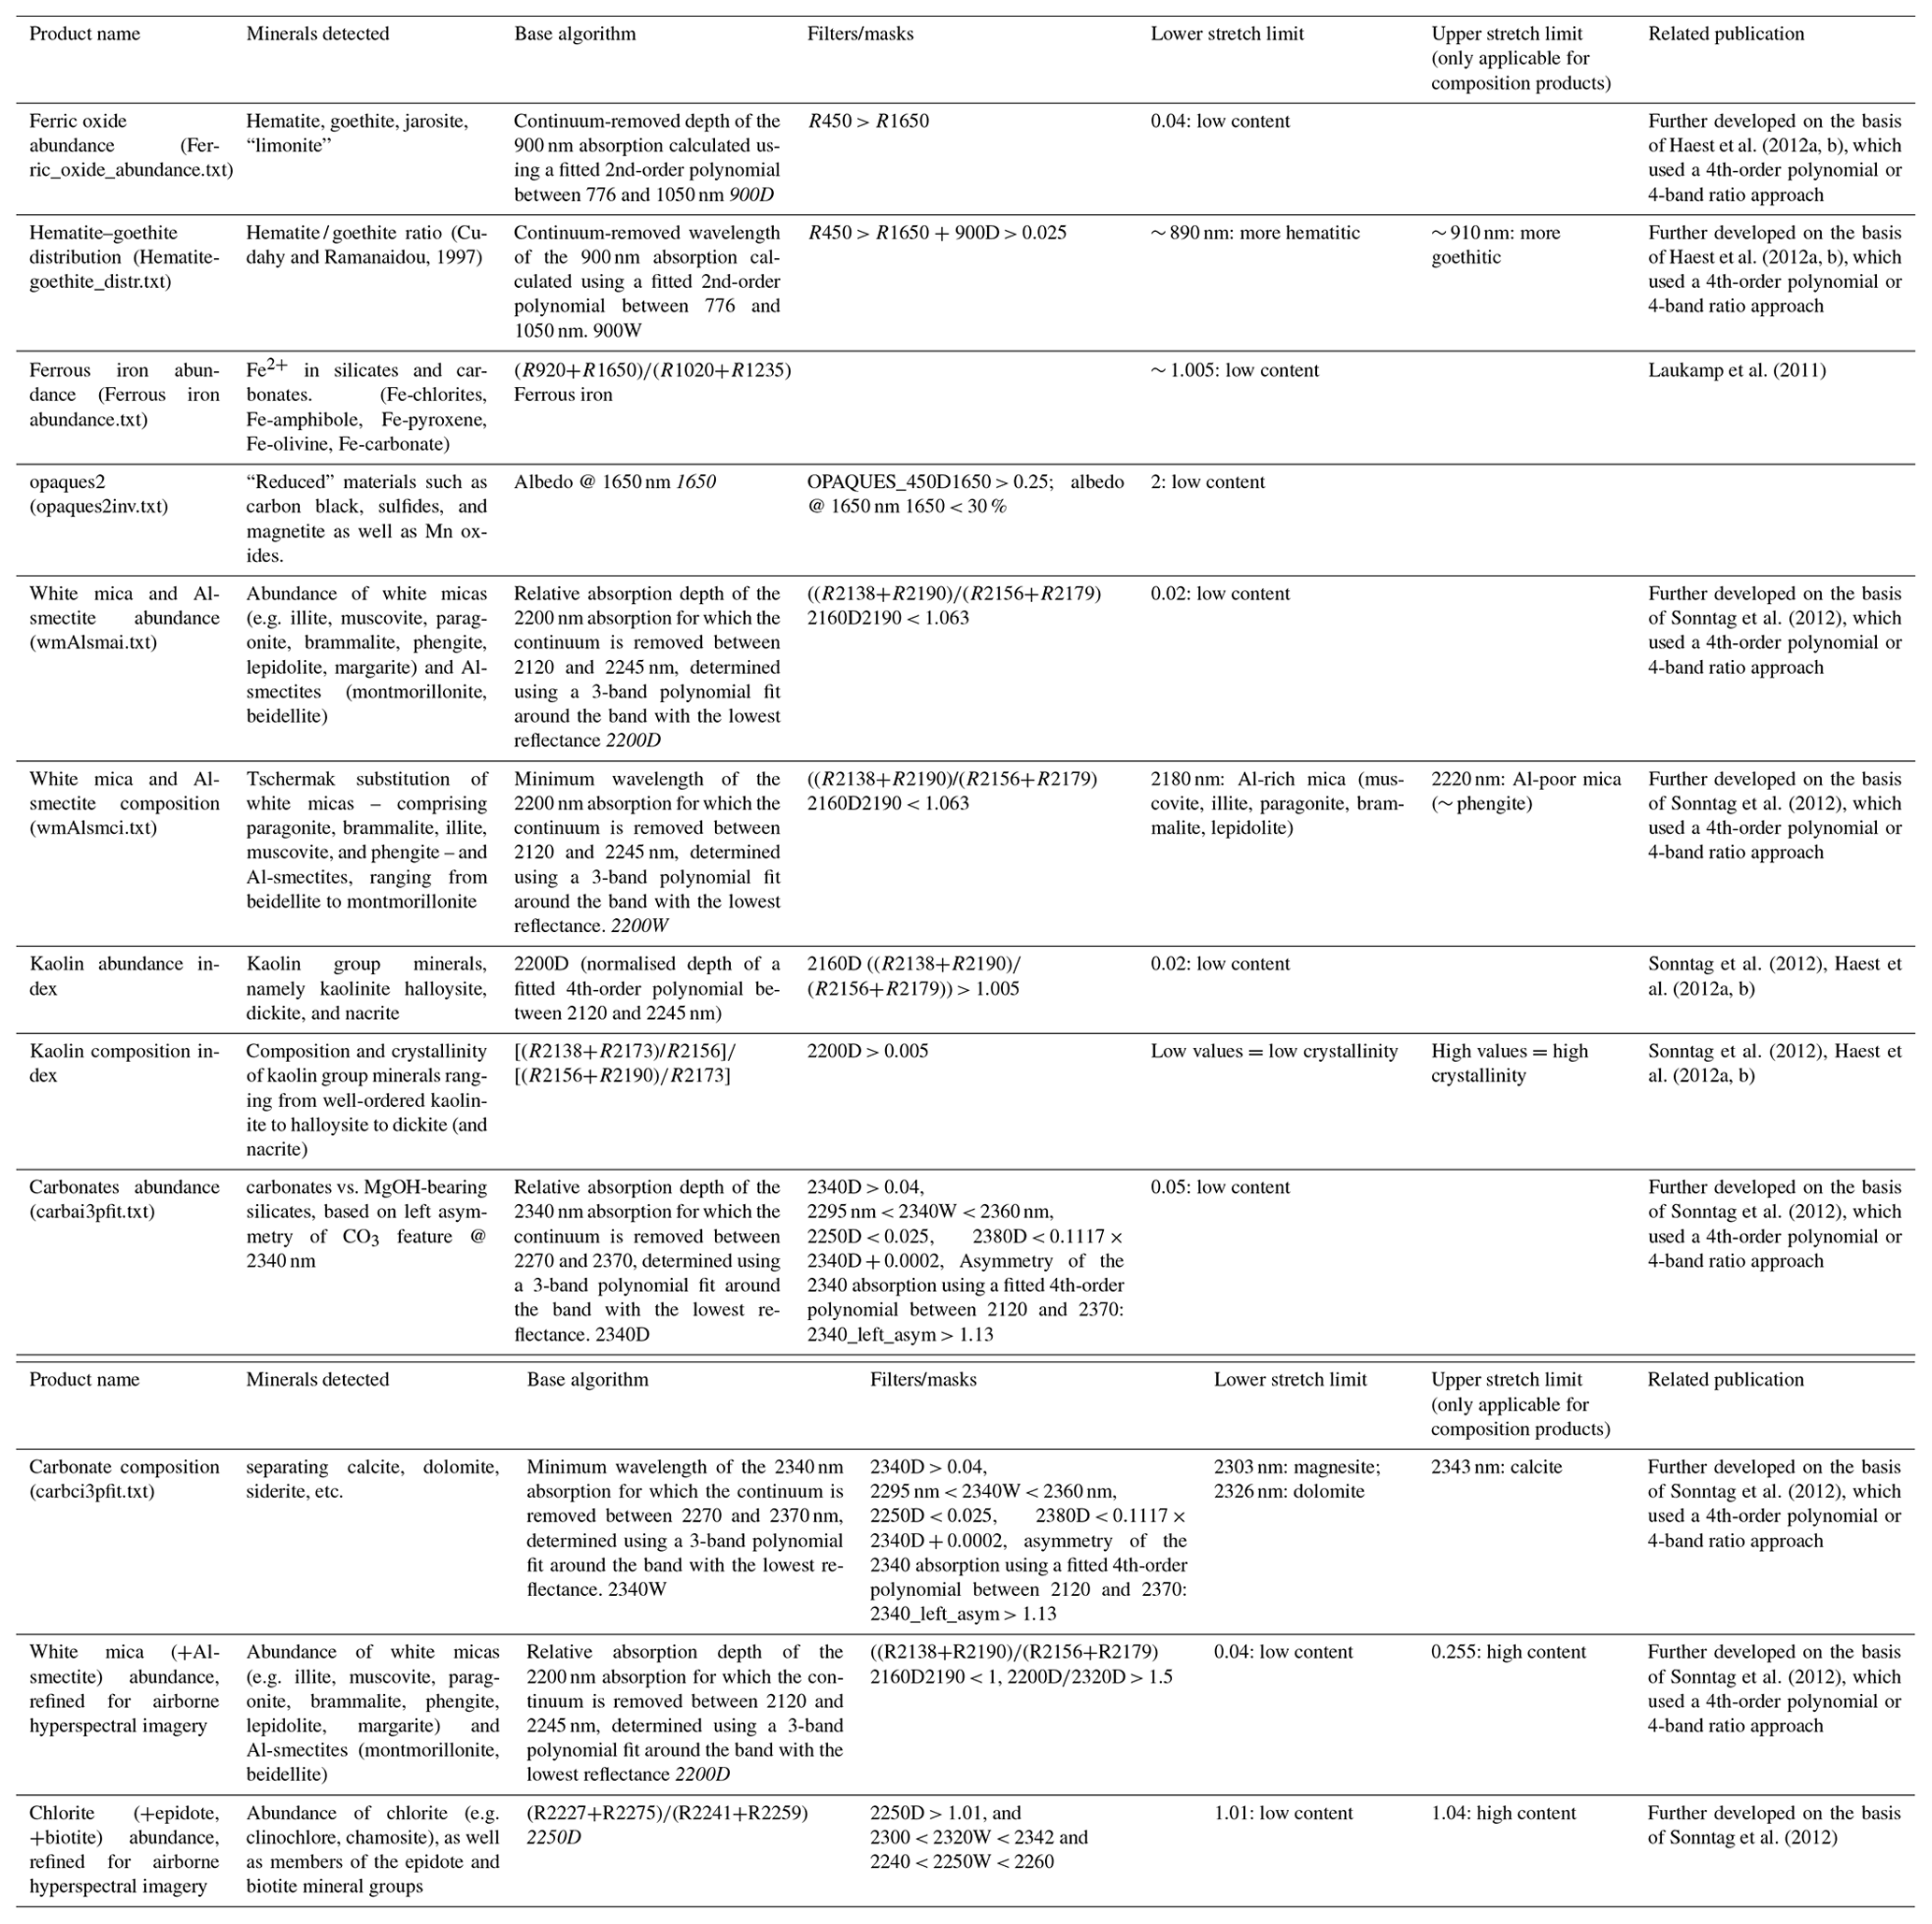
Hyperspectral drill core data were analysed using CSIRO's The Spectral Geologist software (TSG™) by interpreting the abundance, composition, and/or crystallinity of selected mineral groups and species using the multiple-feature extraction method. A list of scripts applied to the hyperspectral drill core and rock chip data can be found in Table 1.
Table 1Base scripts and multiple-feature extraction method scripts used for the Rocklea Dome 3D Mineral Mapping project (R = reflectance value at given wavelength).
4.2 Image processing
The processing strategy for generating geoscience products from AMS data, such as the kaolin crystallinity (Table 1) builds on the quality control of the acquired data (Cudahy et al., 2008). Well-calibrated radiance-at-sensor or surface reflectance data are required for the processing of airborne hyperspectral imagery. Commonly applied levelling and statistics-based methods were avoided as these introduce undesirable scene dependencies, making a comparison of image products from different areas impossible. Physics-based reduction models were applied to the remote sensing data, using the image processing software ENVI™. Complicating effects were removed in their order of development (i.e. 1 instrument, 2 atmospheric, 3 surface effects) through either normalisation or offsets.
4.3 The multiple-feature extraction method
In hyperspectral proximal (e.g. HyLogging™) and remote (e.g. AMS) sensing technologies, the VNIR, SWIR, and thermal infrared (TIR: ca. 6000–14 500 nm) wavelength ranges are used to infer abundance and composition of various rocks and minerals in a wide range of sample types, including drill core, rock chips, and pulps. The relative intensity and wavelength position of absorption features in the reflectance spectra relate to the physicochemical characteristics of the various minerals. Feature extraction methods can be used to determine the mineralogy of a sample material (Cudahy et al., 2008). The advantage of the multiple-feature extraction method is that the associated scripts are not based on a training data set or spectral reference libraries, but are based only on the visible and/or infrared active functional groups of minerals (see Laukamp et al., 2010, 2021, for more details). As they are instrument independent, the same scripts can be applied to remote sensing and proximal hyperspectral data, easing the integration of, for example, surface (e.g. HyMap™) and subsurface data (e.g. HyLogging™) for the purpose of visualisation in 3D or advanced data analytics. Interferences of mineralogical information with other surface materials such as vegetation can be evaluated by using a multiple linear regression model for unmixing vegetation from hyperspectral remote sensing data (Rodger and Cudahy, 2009; Haest et al., 2013). Other complications, such as spectrally overlapping materials, are removed by the application of thresholds.
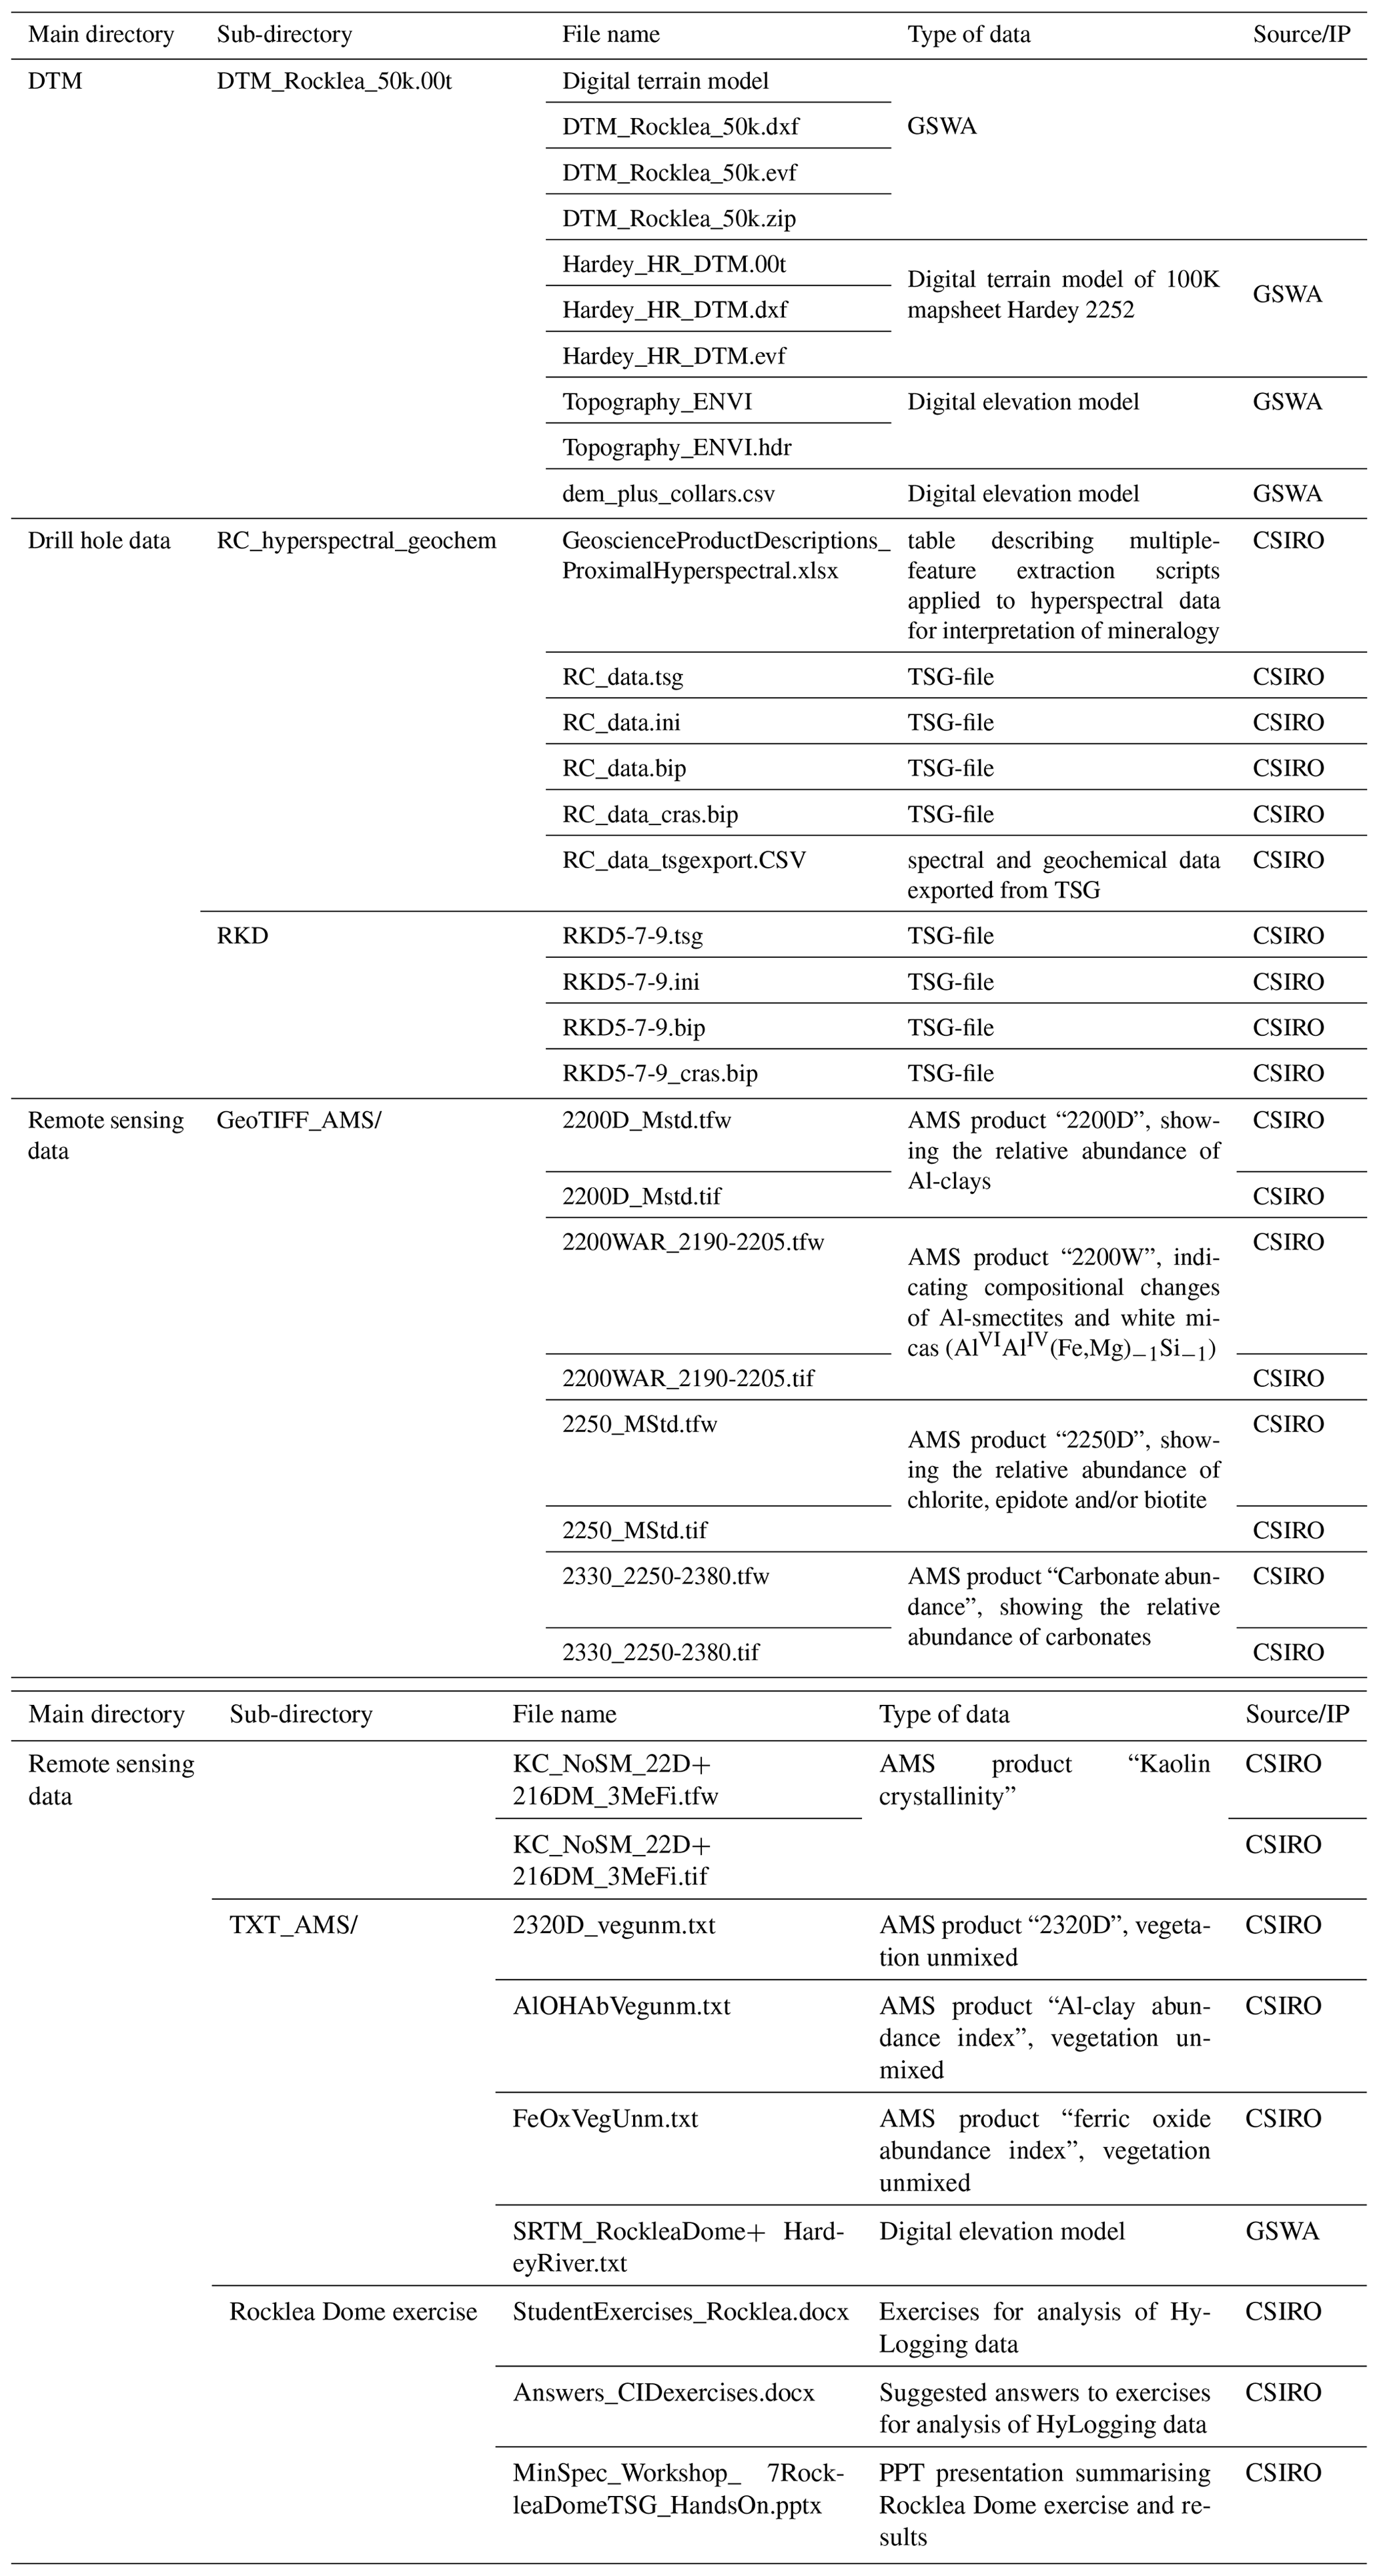
Publicly accessible data of the Rocklea Dome 3D Mineral Mapping project can be found on CSIRO's Data Access Portal (https://data.csiro.au/collections/#collection/CIcsiro:44783 (last access: 15 March 2021), https://doi.org/10.25919/5ed83bf55be6a, Laukamp, 2020) and are listed in Table 2. Data and other content on this site are scientific research data collected by CSIRO and third parties and are made available on an “as-is” basis. If any data or other material are downloaded from this site, the user does so at his or her own risk and acknowledges that such data or other content (1) may contain general statements based on scientific research and may be incomplete and not applicable to all situations; (2) is not professional, scientific, medical, technical, or expert advice and is subject to the usual uncertainties of scientific and technical research; and (3) should not be relied upon as specific to the user and therefore as the basis for doing or failing to do something. Expert professional scientific and technical advice should be sought prior to acting in reliance on data and other material from this site. To the extent permitted by law, CSIRO excludes all liability to any person for any consequences – including but not limited to all losses, damages, costs, expenses, and any other compensation – arising directly or indirectly from using any information or material contained in it.
Table 2Publicly accessible data of the Rocklea Dome 3D Mineral Mapping project (https://data.csiro.au/collections/#collection/CIcsiro:44783, last access: 15 March 2021; https://doi.org/10.25919/5ed83bf55be6a, Laukamp, 2020).
The following sections briefly describe examples of how the provided hyperspectral and geochemical proximal and remote sensing data sets can be used to address challenges for the mineral resources sector.
5.1 Drill core mineralogy and geochemistry
Reflectance spectra collected from RCs and RKDs using CSIRO's HyChips™ system presented a cost-effective way to spatially map the major ore (i.e. goethite ± hematite) and gangue minerals (i.e. kaolinite, smectite, carbonate), apart from quartz, in detail. To achieve this, the relative intensity of mineral-diagnostic absorption features was calculated using a suite of batch scripts (“geoscience products” in Haest et al., 2012a). The relative intensity of the respective absorption features correlates with the relative abundance of the respective mineral, whereas the wavelength position of key absorption features relates to mineral speciation (e.g. ochreous versus vitreous goethite) or determining the mineral chemistry. For example, the relative abundance of iron oxides was calculated from the relative depth of the ferric-iron-related absorption at around 900 nm (Cudahy and Ramanaidou, 1997), whereas goethite was distinguished from hematite by tracking the wavelength position of the same absorption feature (Table 2 in Haest et al., 2012a).
Whole-rock geochemistry obtained from the same drill core material showed significant correlations with the geoscience products. Haest et al. (2012a, b) determined an RMSE of 9.1 wt % Fe for the correlation between the hyperspectrally derived iron oxide abundance and the XRF wt % Fe data and an RMSE of 3.9 wt % Al2O3 for the correlation between the hyperspectrally derived Al-clay abundance and the XRF wt % Al2O3 data. The errors associated with the correlations were found to be due to a combination of grain size variations and the transopaque behaviour of iron oxides and/or different amounts of silica, causing variations in the optical depth of sample material.
5.2 Surface mineral mapping
Airborne hyperspectral surveys provide spatially contiguous mineralogical information of the Earth's surface at high spatial resolution (down to circa 1 m). The relative intensity of mineral diagnostic absorption features and their wavelength positions can be used to infer the relative abundance of the respective minerals and even variations of single mineral species in terms of their cation composition, crystallinity, and hydroxylation. The Rocklea Dome case study data set was used by Haest et al. (2013) to demonstrate how quantitative mineral maps can be produced by validation of airborne hyperspectral data against field data, including reflectance spectra and XRF data collected from surface samples. The effect of both green and dry vegetation cover was unmixed at the pixel level using the normalised difference vegetation index (NDVI; e.g. Tucker, 1979) and the continuum-removed depth of the cellulose–lignin absorption centred at around 2100 nm, respectively. The resulting mineral mapping products have a higher spatial continuity, as well as higher accuracy of, for example, mineral abundance or composition values shown in single pixels. This proved to be especially useful in areas with outcropping CID, which appeared to be sub-economic from the original iron oxide abundance mineral maps but appeared to be potentially economic CID resources when the vegetation cover was unmixed (Fig. 2).
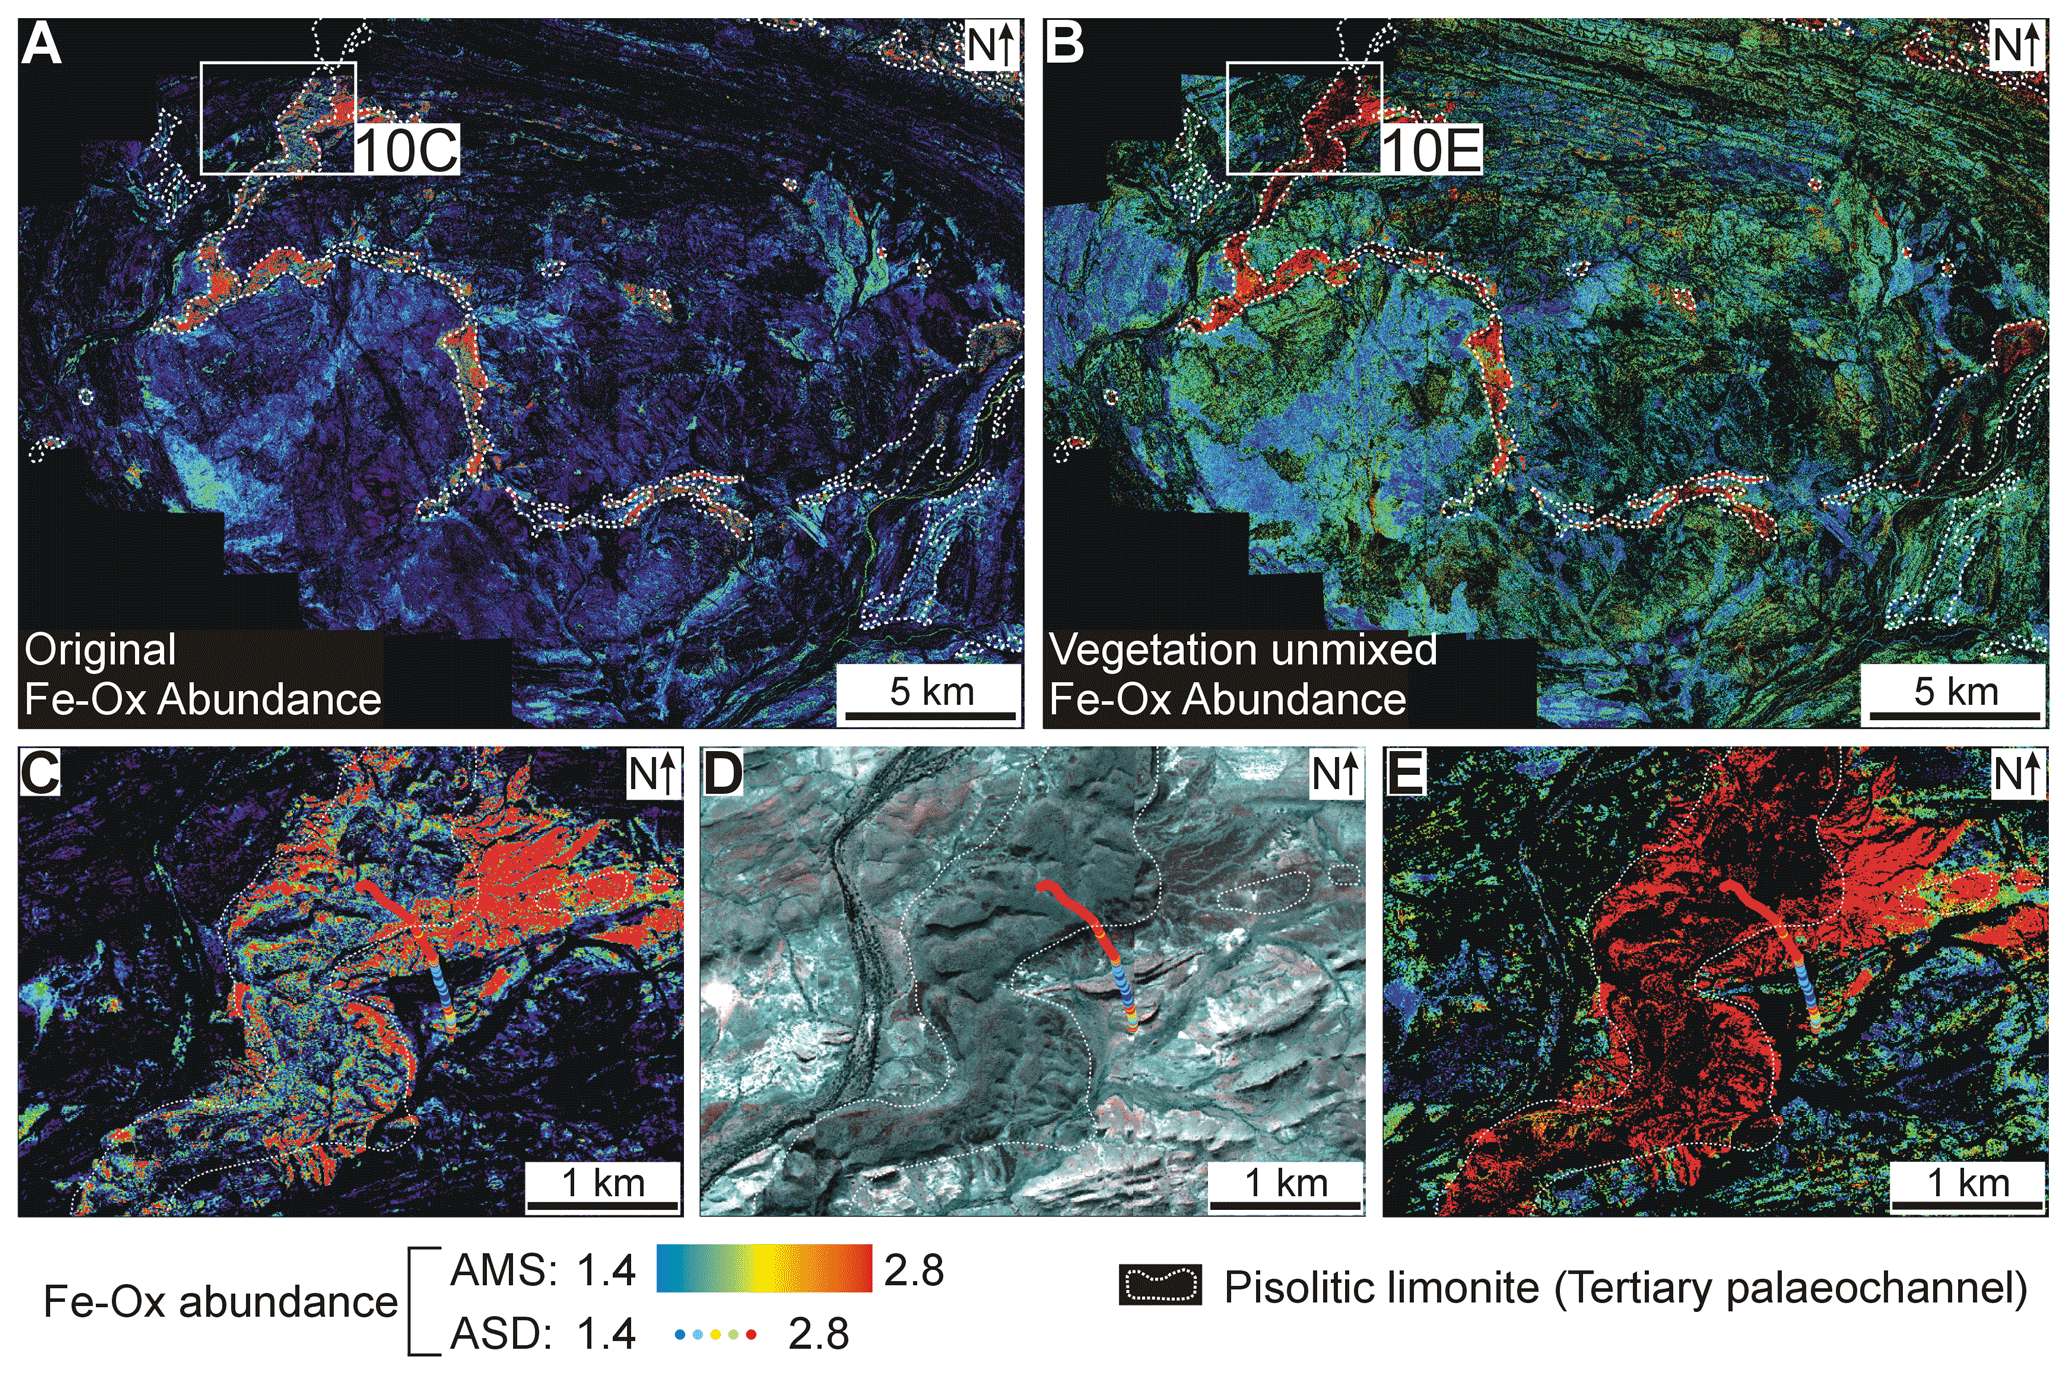
Figure 2(a–b) Fe-(oxyhydr-)oxide (Fe-Ox) abundance maps of the Rocklea Dome without (a) and with (b) vegetation unmixing. (c–e) Fe-Ox abundance maps of the southern part of the Beasley River CID with (c) and without (e) vegetation removal and the false-colour image of this area (d). The Beasley River CID has a plateau-like surface expression, with the edges of the plateau clearly visible in the false-colour image. These edges were mapped by the Geological Survey of Western Australia as representing the boundary of the pisolitic limonite (Fe-rich palaeochannel; stippled white line) (the Fe-Ox abundance measurements collected along transects 1 to 7 with the TerraSpec™ are also shown for reference).
Beyond the iron oxide, kaolin, and carbonate mineral maps published by Haest et al. (2013), airborne hyperspectral data can be used to create numerous additional mineral mapping products that can be used to address other geoscientific questions. For example, the Rocklea Dome presents a wide variety of igneous units that are part of the Proterozoic basement of the Pilbara Craton (Fig. 1). These include (1) metamorphosed monzogranite, schist, and chert; (2) metamorphosed basalt; and (3) amphibolite dykes. According to the white mica abundance derived from airborne hyperspectral data (green in Fig. 3a), the metamorphosed monzogranite contains less white mica when compared to the metamorphosed schists which are striking east–west and occur in the northern part of the Rocklea Dome (red in Fig. 3a). In the eastern half of the Proterozoic basement in the Rocklea Dome, white mica is much less abundant to absent. This coincides with elevated amounts of chlorite (folded lithologies in the centre of Fig. 3b), which map out metamorphosed basalt (Fig. 1). The north–south striking occurrence of chlorite in the western half of the Proterozoic basement traces an amphibolite dyke. Both the white mica abundance and chlorite abundance maps can also be used to map out different lithologies in the metasediments and metabasalts of the Fortescue that crop out to the north and south of the investigated area, demonstrating how the airborne hyperspectral data can be used to map out all major lithologies occurring in the Rocklea Dome case study area.
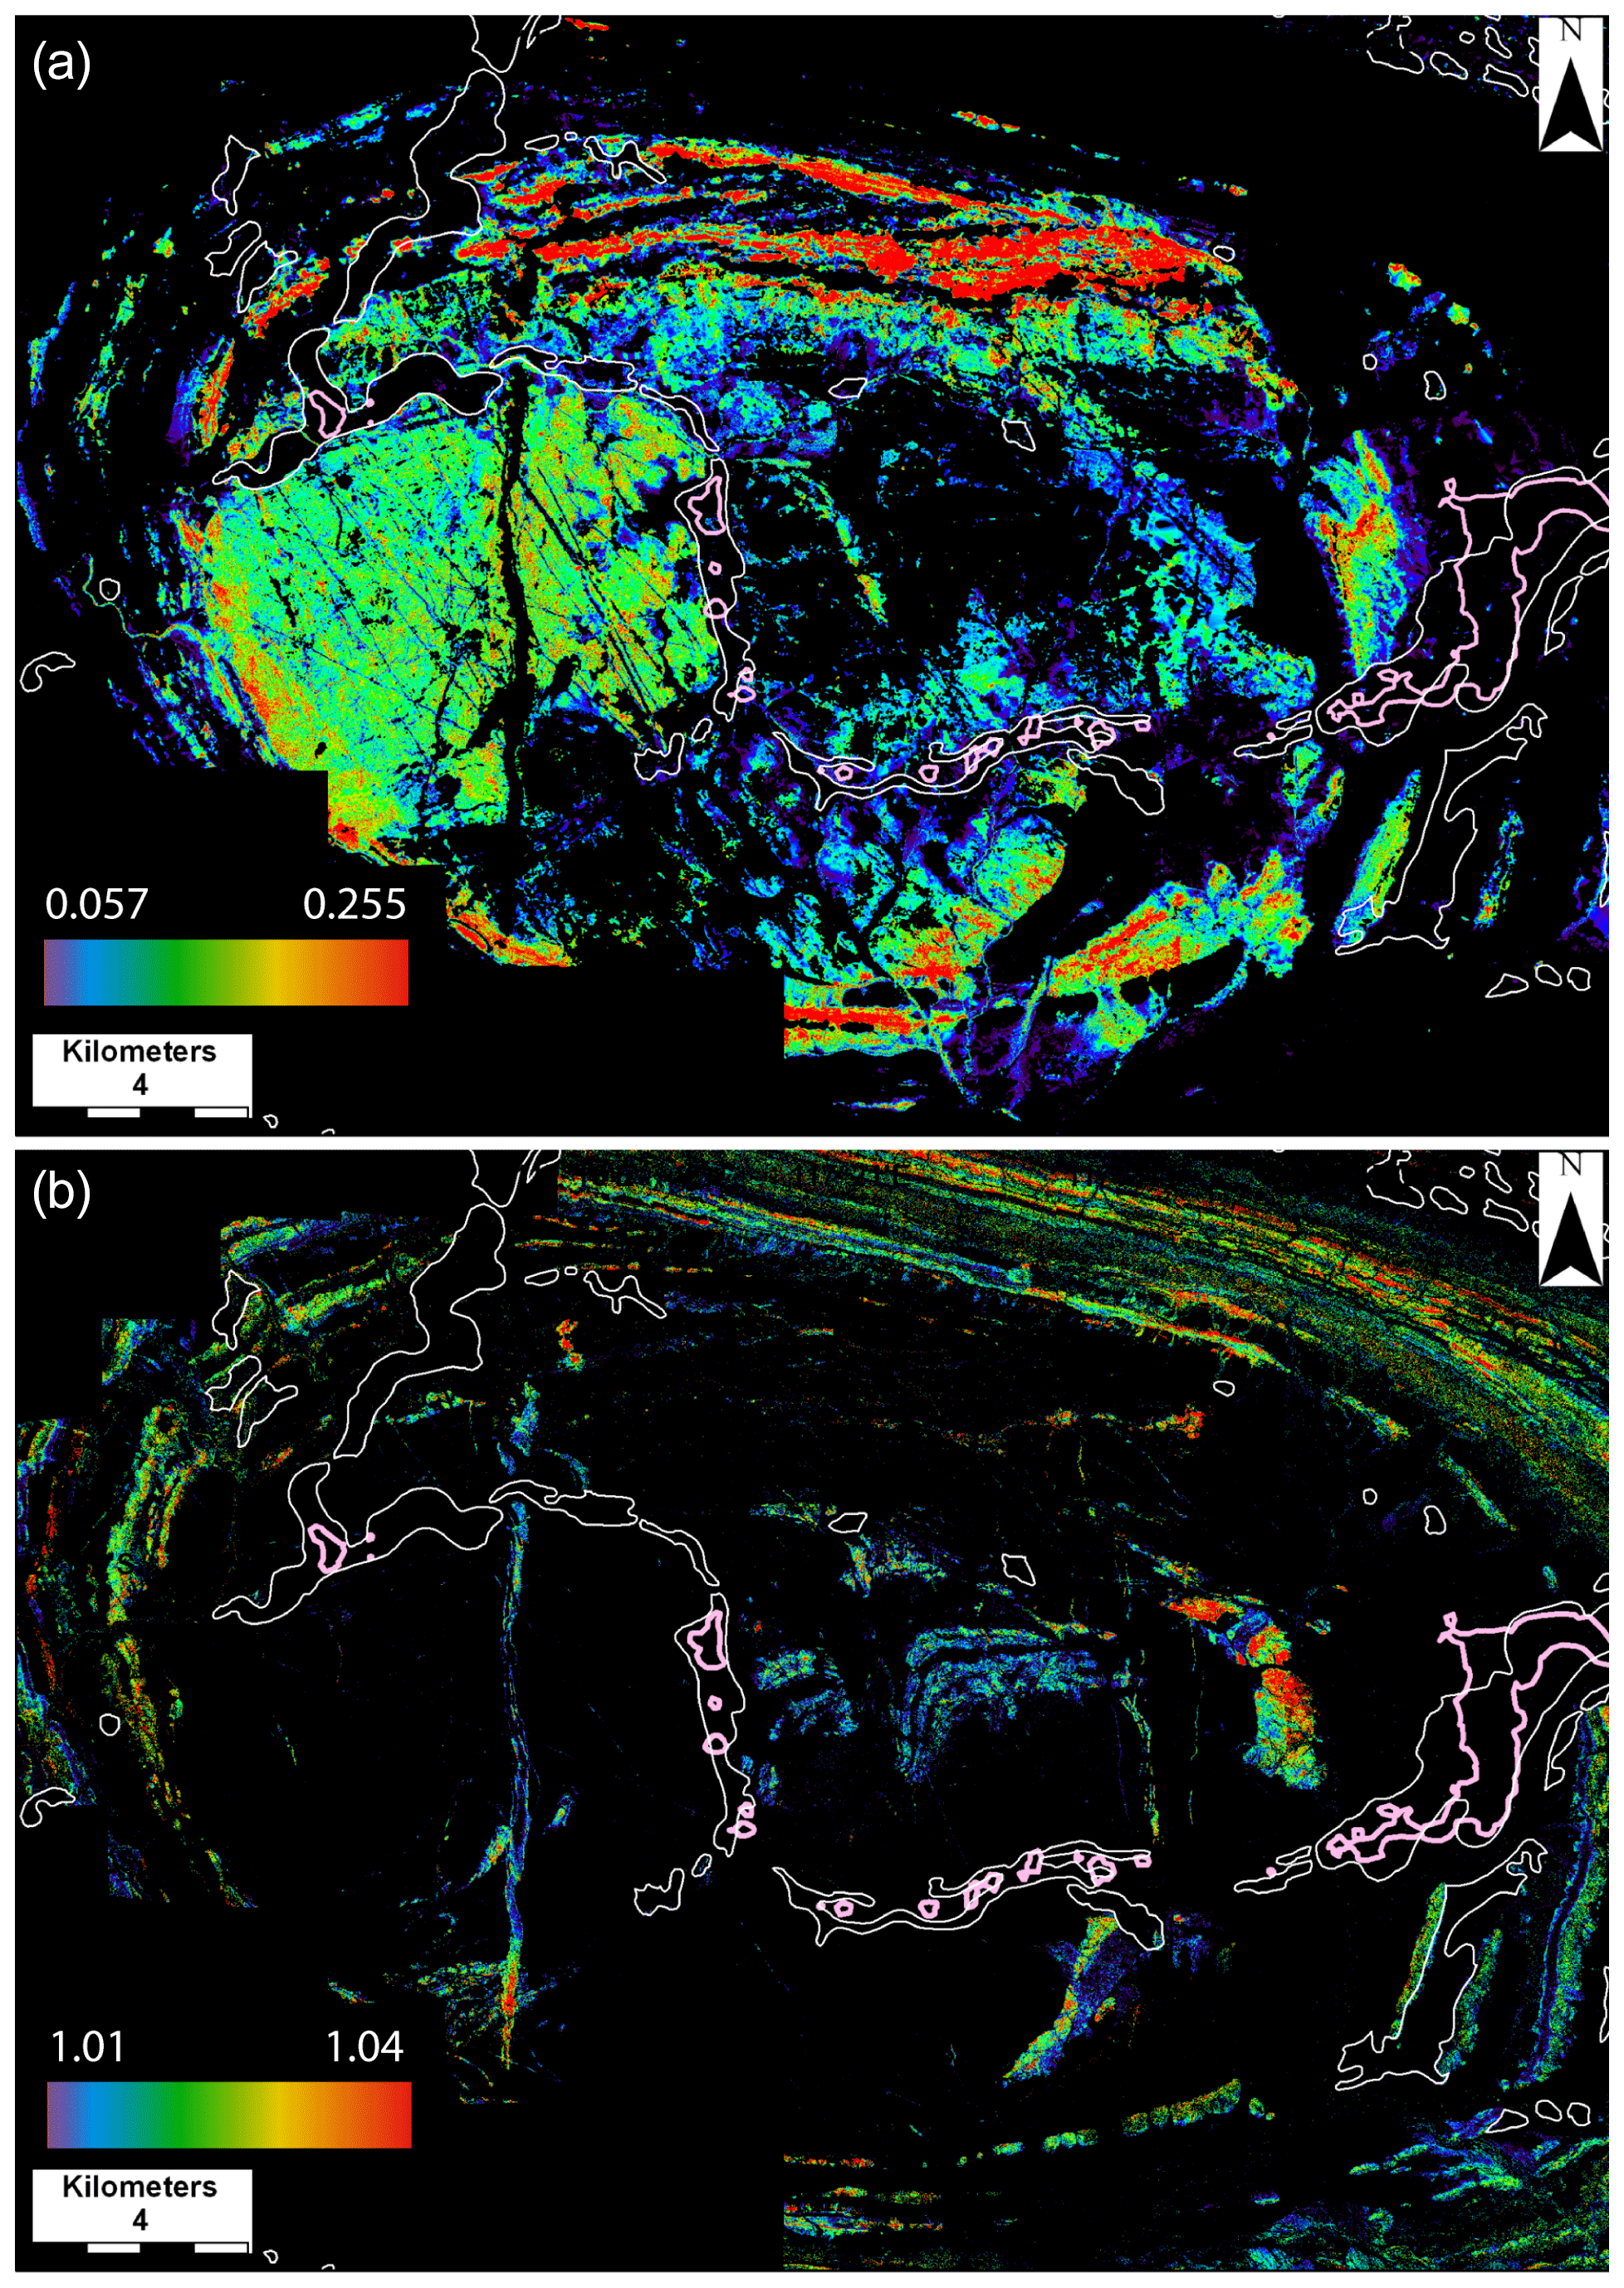
Figure 3(a) White mica (+Al-smectite) and (b) chlorite (+epidote, +biotite) abundance maps of the Rocklea Dome area, calculated from airborne hyperspectral data using algorithms described in Table 1. Warm colours represent high abundance, and cool colours low abundance of the respective minerals. Black pixels have been masked out as relative intensity of the absorption feature mapped in the respective mineral map is below a given threshold (Table 1) and/or because of non-mineralogical effects (e.g. vegetation, clouds). Panel (a) shows monzogranites in the western part of the dome in green colours and the Fortescue Group in the northern fringe of the dome in red colours. Panel (b) highlights Archean metamorphosed basalts in the eastern part of the dome structure and an N–S-trending amphibolite dyke in the western part of the dome. White lines indicate the surface extension of the Tertiary palaeochannel as mapped by Thorne and Tyler (1996). Pink lines indicate the horizontal extension of the Tertiary palaeochannel as mapped by the hyperspectral data.
5.3 3D mineral mapping
The hyperspectral drill core data can be combined with airborne hyperspectral data into a seamless 3D mineral model of the Rocklea Dome CID (Fig. 4). For this, all hyperspectral data were resampled to the same spatial resolution and imported into the 3D modelling software SKUA-GOCAD™. The channel basement contact that was delineated at depth using the kaolin crystallinity products could also be delineated at the surface from the airborne hyperspectral image. A combination of both provided a seamless surface of the channel bottom (grey surface in Fig. 4) that separates the basement characterised by well-crystalline kaolinite from the tertiary channel sediments characterised by poorly crystalline kaolinite. The channel basement contact identified here deviates at the surface significantly from the area mapped by the geological survey as palaeochannel. This suggests that drilling patterns could have been much better defined if the airborne hyperspectrally based surface outline had been available prior to drilling (Cudahy, 2016).
As part of their 3D Geomodel Series, the Geological Survey of Western Australia (GSWA) provides access to 3D models of the Rocklea Dome area via their online portal: https://dmpbookshop.eruditetechnologies.com.au/product/rocklea-inlier-2016-3d-geomodel-series.do (last access: 15 March 2021). The data can be viewed in three different formats (3D PDF, Geoscience ANALYST, and GOCAD).
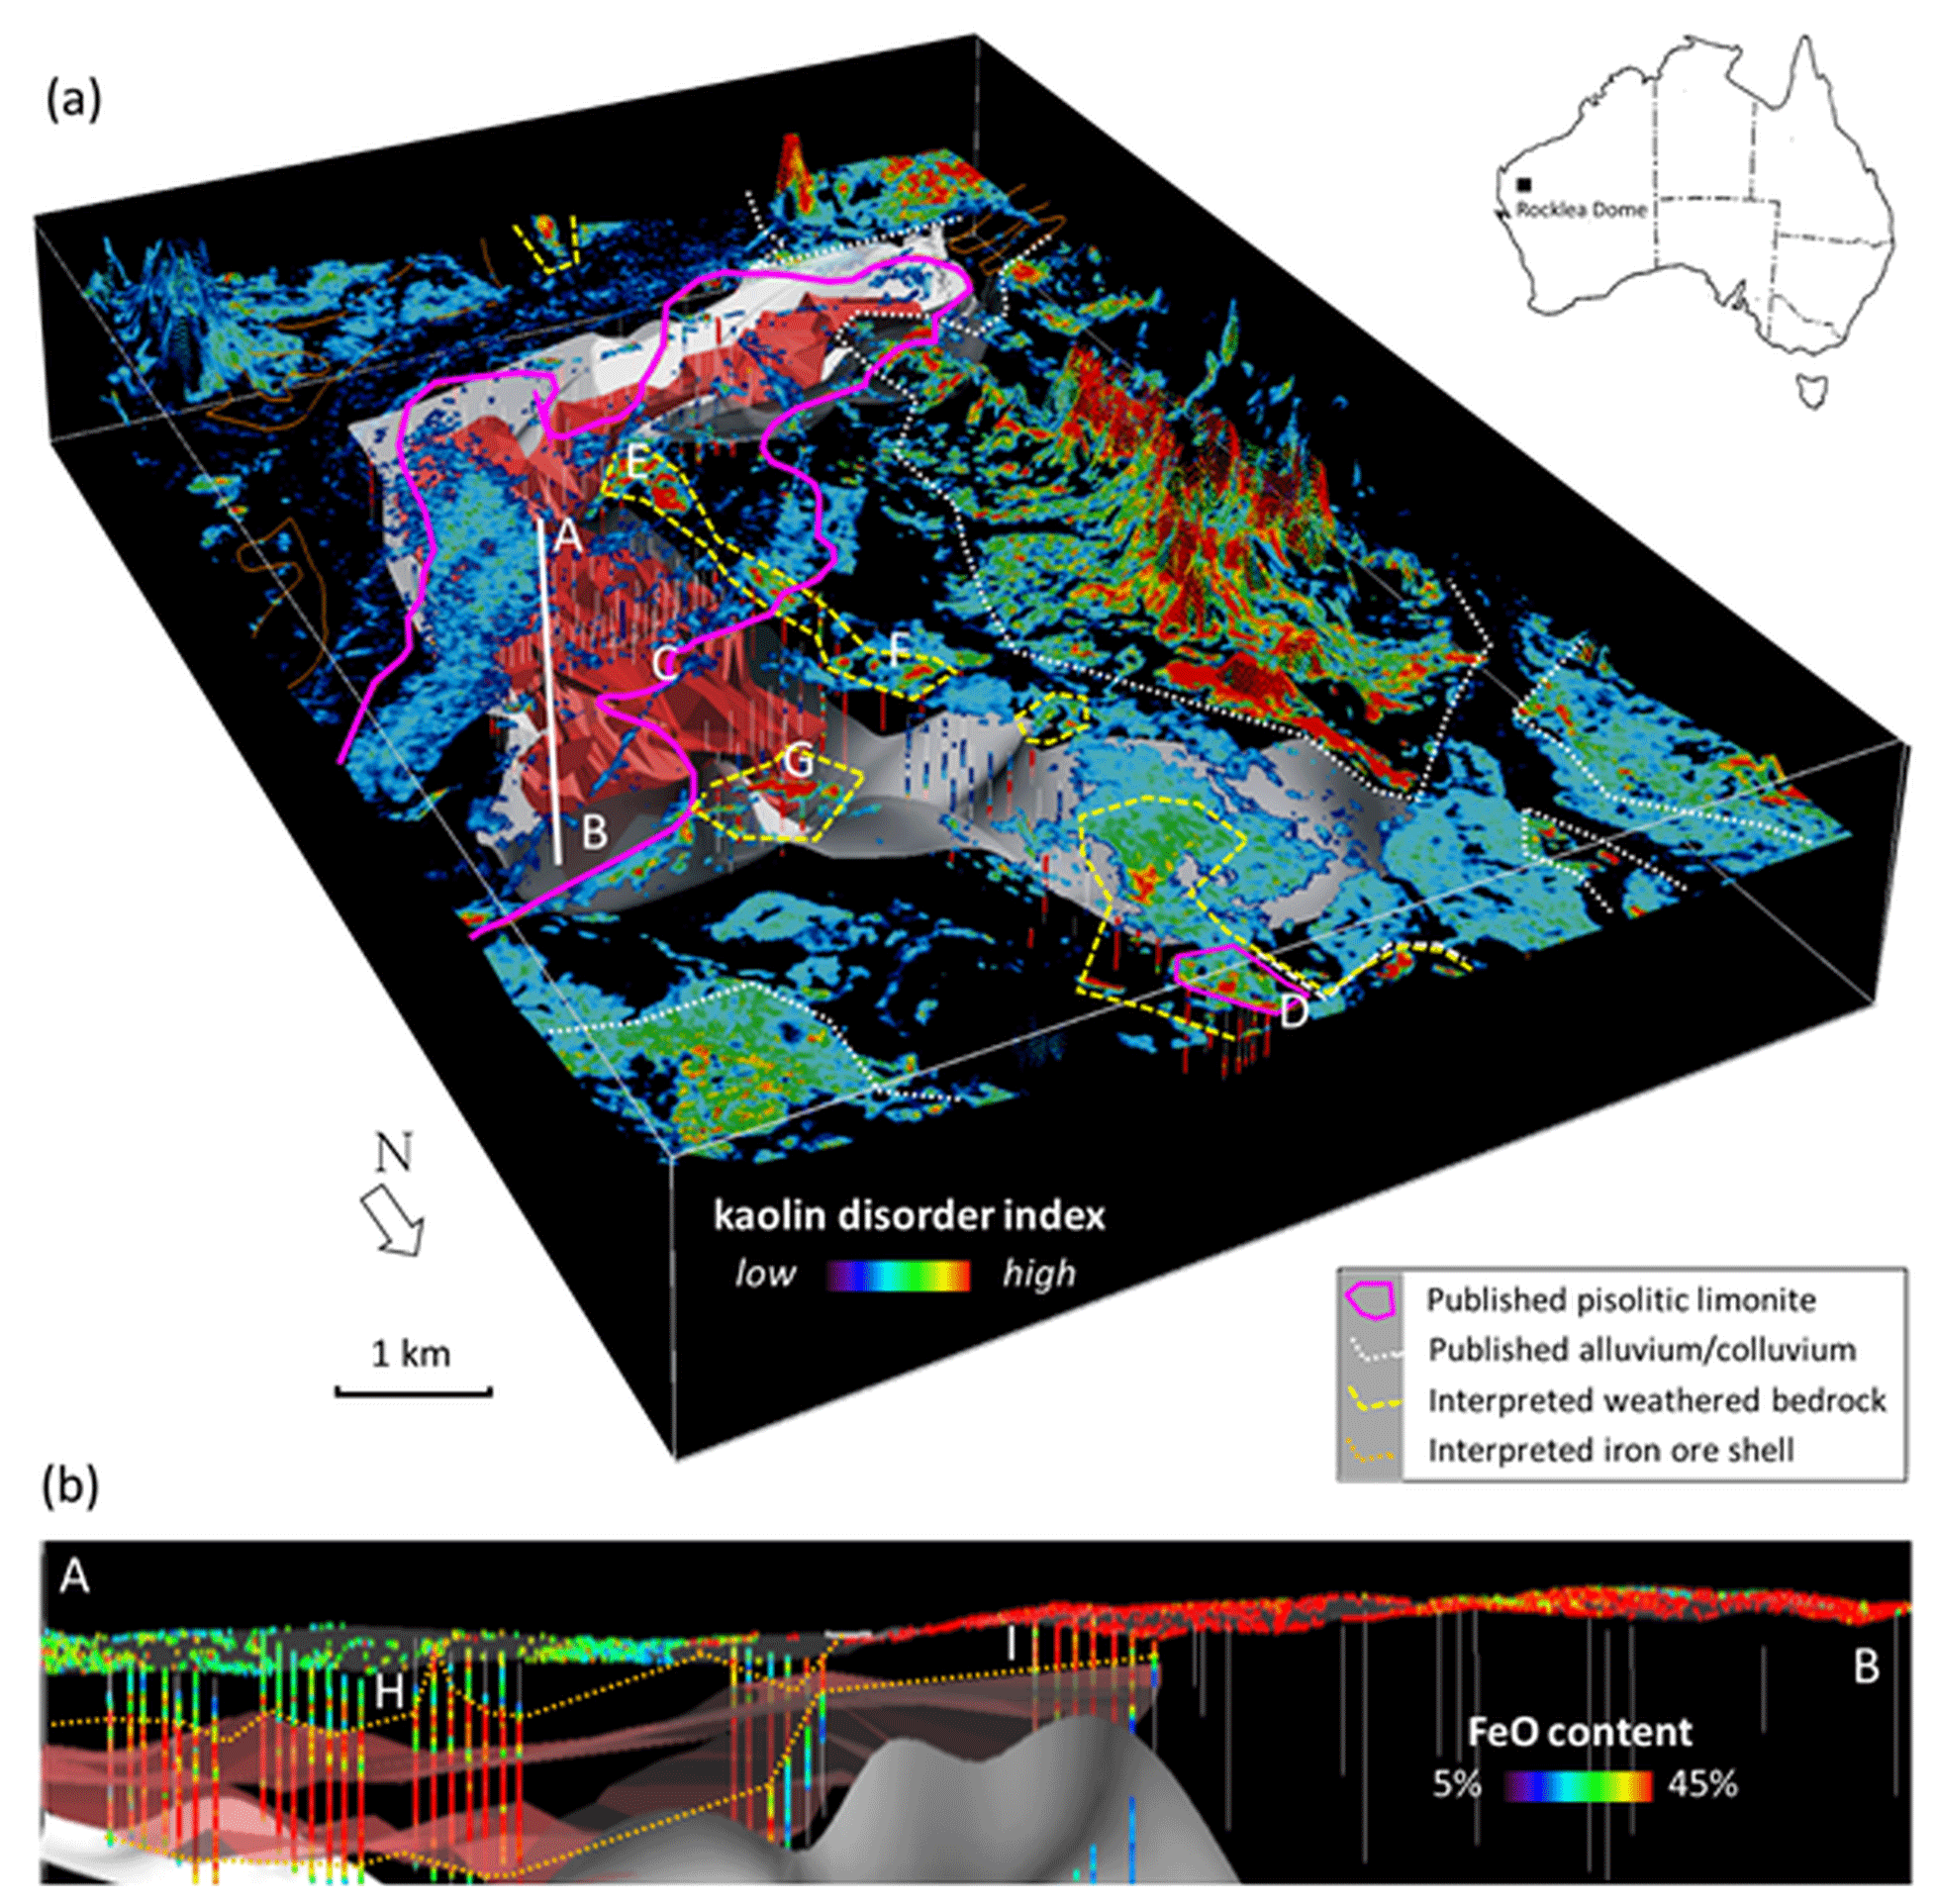
Figure 43D mineral models of the Rocklea Dome area (Cudahy, 2016). Scene centre is approximately lat 22.8216∘, long 117.4652∘. (a) A southwest oblique 3D view of the Rocklea Dome study area showing kaolin disorder measured using airborne HyMap™ (surface) and drill core HyLogger™ (coloured vertical pegs) reflectance spectra. Warmer colours (well-ordered kaolin) relate to weathered, in situ bedrock, while cooler colours (poorly ordered kaolin) relate to transported (alluvium/colluvium) materials. The interpolated model of the base of the channel iron system calculated using the 3D kaolin crystallinity map is shown by the shaded grey surface. The CID, which was calculated from the XRF-derived weight percent FeO (Haest et al., 2012a), is shown by a shaded red volume (C). Areas of weathered bedrock (Haest et al., 2012b; Cudahy, 2016) are highlighted by yellow-coloured hashed lines and highlight which drill cores were sunk into barren ground (D, E, F, G). A straight white line shows the location of the cross section (A–B) presented in panel (b). (b) Cross section A–B in panel (a) of the % FeO measured from the drill core and airborne imagery, which was vegetation unmixed (Haest et al., 2013). Dotted orange polygon indicates the shell of iron ore, which extends from under cover of ∼ 20 m of alluvium (H) to exposed at the surface (I).
5.4 Resource estimation
Resource estimation of base and precious metal deposits requires the grouping of drill hole data into domains that represent zones of homogenous properties for accurate grade estimation and practical exploitation purposes. In practice, this is usually performed through a subjective, time-consuming, manual interpretation of sample analytical data. Traditional automated clustering techniques, such as multivariate clustering and k means, tend to show poor spatial contiguity of domains in a mineral deposit. Fouedjio et al. (2018) used the Rocklea Dome drill core data set to showcase how geostatistical clustering methods can take spatial dependency into account (Fig. 5). By integrating whole-rock geochemistry and hyperspectral drill core data, Fouedjio et al. (2018) revealed two distinct domains in the Rocklea Dome channel iron ore deposit that are mainly characterised by four geochemical variables (FeO, Al2O3, SiO2, and TiO2) and two mineralogical variables derived from hyperspectral data (ferric oxide abundance and kaolinite abundance). Ore body domaining through geostatistical clustering represents a method for objective sample clustering that introduces scientific rigour to a traditionally subjective procedure. The robust domaining is based on genuine multivariate geostatistics combining all available data. The flexible and reproducible automatic domaining technique saves time, improves the understanding of domains critical for exploitation of the ore, and allows an easy integration of new data sets.
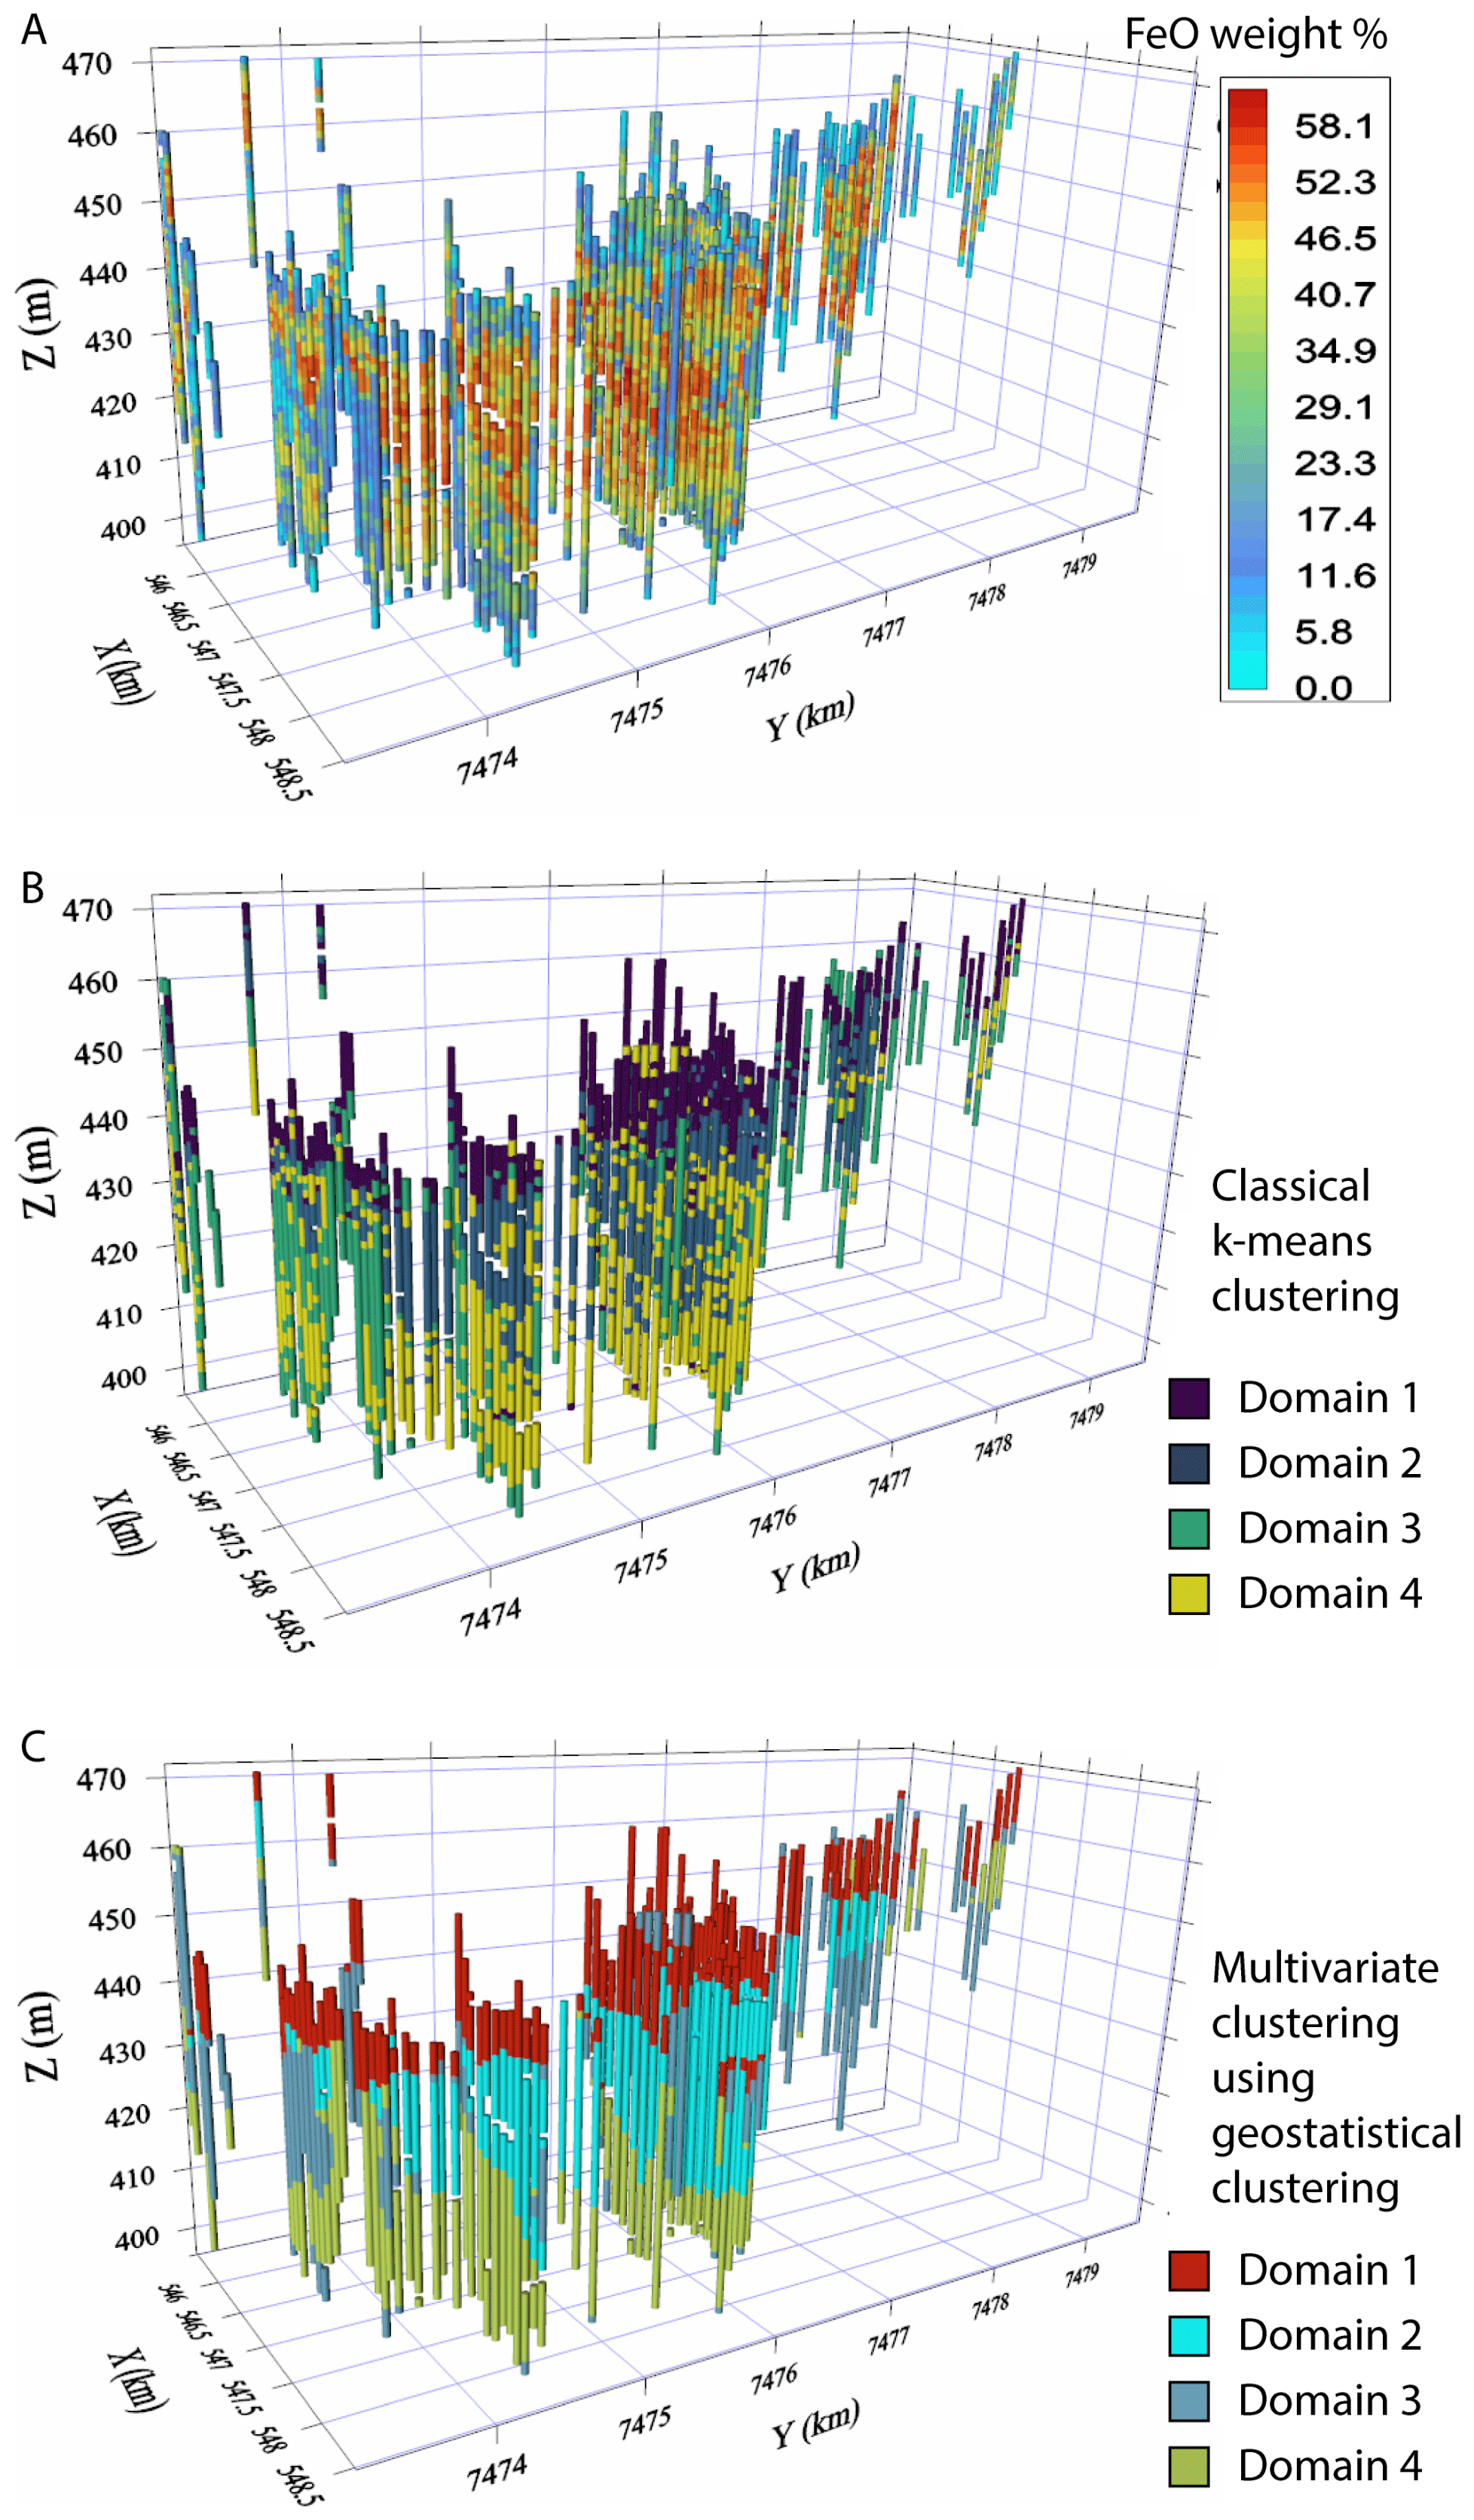
Figure 5(a) Spatial plot of FeO distribution in the Rocklea Dome channel iron deposit. (b) Classical k-means clustering method using four domains. (c) Geostatistical spectral clustering using four domains. Z axis was scaled to ease visualisation. Modified from Fouedjio et al. (2017).
5.5 Teaching material
The publicly available Rocklea Dome data set provided an opportunity to compile training and teaching material about the application of hyperspectral drill core and chip data for iron ore resource characterisation using TSG™ software (https://research.csiro.au/thespectralgeologist/, last access: 15 March 2021). Student exercises and example answers, as well as a PowerPoint (PPT) for teaching, are part of the data package:
-
exercise: StudentExercises_Rocklea.docx;
-
answers: Answers_CIDexercises.docx;
-
PPT for teaching: MinSpec_Workshop_7RockleaDomeTSG_ HandsOn.pptx.
The data discussed in this article are available online at: https://doi.org/10.25919/5ed83bf55be6a (Laukamp, 2020). A 3D model of the Rocklea Dome data set is also available from the Geological Survey of Western Australia: https://dasc.dmp.wa.gov.au/DASC?productAlias=Rocklea3D (State of Western Australia, 2021).
We have established an open-access data set comprising drill core, surface, and airborne hyperspectral data of the Rocklea Dome area in the Hamersley Basin of Western Australia, which features a wide variety of lithologies and morphologies and is prospective for channel-hosted iron ore resources. The proximal and remote sensing data, together with associated whole-rock geochemistry, are ideal for researching the geology of this economically significant area and allow a thorough comparison of different geoanalytical techniques and their effectiveness for resource characterisation. Combining the surface and subsurface data into 3D mineral maps provides a better visual understanding of the geological environment.
In addition to the previously published surface and subsurface mineral mapping products, many more geoscience products can be generated to better understand this geologically complex area. The white mica and chlorite abundance maps presented here for the first time clearly highlight the potential for mapping out different sections of the Archaean monzogranitic basement as well as different generations of mafic intrusives. Of particular interest are the contact zones between the mafic dykes and their host rocks, as they could help to better elucidate the intensity of alteration within the dyke and within the host granite as well as the associated fluid–rock interaction processes.
The teaching material provided together with this open-access data set aims to support training of geoscience graduates and post-graduates in the potential applications of hyperspectral proximal and remote sensing data for mineral exploration and resource characterisation.
All analytical technologies used for collection of the geoscience data, as well as software packages used for processing the data, are commercially available. However, it should be noted that the HyChips™ system is now superseded by HyLogger3, which collects thermal infrared wavelengths (6000 to 14 500 nm) in addition to the VNIR–SWIR data. The collection of the TIR wavelength range enables the characterisation of major rock-forming minerals such as quartz, which are of major importance for characterisation of iron ore resources but were not detectable with HyChips™. The HyLogger3 technology is in operation at the six nodes of the Australian National Virtual Core Library (https://www.auscope.org.au/nvcl, last access: 15 March 2021), which provides online open access to more than 3500 drill cores from the Australian continent.
CL, TC, and MH contributed equally to the manuscript preparation. CL is the custodian of the Rocklea Dome data set stored on the CSIRO Data Access Portal.
The authors declare that they have no conflict of interest.
The Rocklea Dome 3D Mineral Mapping project was funded by the Western Australian Government through their support to the Western Australian Centre of Excellence for Three-dimensional Mineral Mapping (C3DMM) in Kensington and by Murchison Metals Ltd. M. Cardy, A. Hackett, and S. Travaglione are acknowledged for the acquisition of the infrared spectroscopic data. This work profited from fruitful discussions with CSIRO colleagues C. Ong, A. Rodger, E. Ramanaidou, and M. Wells and with Murchison Metals Ltd geologists J. Johnson and S. Peterson. E. Ramanaidou (CSIRO) and staff of Murchison Metals were instrumental in securing this site for public demonstration. The Geological Survey of Western Australia covered part of the costs for the diamond drilling through their Exploration Incentive Scheme's Co-funded Exploration Drilling programme. Two anonymous reviewers are thanked for their constructive feedback.
This paper was edited by Giulio G. R. Iovine and reviewed by two anonymous referees.
Berk, A., Anderson, G. P., Acharya, P. K., Bernstein, L. S., Muratov, L., Lee, J., Fox, M., Adler-Golden, S. M., Chetwynd, J. H., Hoke, M. L., Lockwood, R. B., Cooley, T. W., and Gardner, J. A.: MODTRAN5: A reformulated atmospheric band model with auxiliary species and practical multiple scattering options, in: SPIE Proceeding, Multispectral and Hyperspectral Remote Sensing Instruments and Applications II, Society of Photo-Optical Instrumentation Engineers, Volume 5655, 2005.
Berk, A., Anderson, G. P., Acharya, P. K., Bernstein, L. S., Muratov, L., Lee, J., Fox, M., Adler-Golden, S. M., Chetwynd, J. H., Hoke, M. L., Lockwood, R. B., Gardner, J. A., Cooley, T. W., Borel, C. C., Lewis, P. E., and Shettle, E. P.: MODTRAN5: 2006 update, in: SPIE Proceeding, Algorithms and Technologies for Multispectral, Hyperspectral, and Ultraspectral Imagery XII, Society of Photo-Optical Instrumentation Engineers, Volume 6233, 2006.
Cocks, T., Jenssen, R., Stewart, A., Wilson, I., and Shields, T.: The HyMap™airborne hyperspectral sensor: The system, calibration and performance, 1st EARSEL Workshop on Imaging Spectroscopy, Zurich, October 1998, 1998.
Cudahy, T. J.: Mineral Mapping for Exploration: An Australian Journey of Evolving Spectral Sensing Technologies and Industry Collaboration, Geosciences, 6, 52, https://doi.org/10.3390/geosciences6040052, 2016.
Cudahy, T. J. and Ramanaidou, E. R.: Measurement of the hematite: goethite ratio using field visible and near-infrared reflectance spectrometry in channel iron deposits, Western Australia, Aust. J. Earth Sci., 44, 411–420, 1997.
Cudahy, T., Jones, M., Thomas, M., Laukamp, C., Caccetta, M., Hewson, R., Rodger, A., and Verrall, M.: Next Generation Mineral Mapping: Queensland airborne HyMap and satellite ASTER surveys 2006–2008, CSIRO report P2007/364, 161 pp., 2008.
Dean, W. E.: Determination of carbonate and organic-matter in calcareous sediments and sedimentary-rocks by loss on ignition–comparison with other methods, J. Sediment. Petrol., 44, 242–248, 1974.
Fouedjio, F., Hill, E. J., and Laukamp, C.: Ore Body Domaining through Geostatistical Clustering: Case Study at the Rocklea Dome Channel Iron Ore Deposit, Western Australia, Appl. Earth Sci., 127, 15–29, 2018.
Haest, M., Cudahy, C., Rodger, A., Laukamp, C., Martens, C., and Caccetta, M.: Unmixing vegetation from airborne visible-near to shortwave infrared spectroscopy-based mineral maps over the Rocklea Dome (Western Australia), with a focus on iron rich palaeochannels, Remote Sens. Environ., 129, 17–31, 2013.
Haest, M., Cudahy, T., Laukamp, C., and Gregory, S.: Quantitative mineralogy from visible to shortwave infrared spectroscopic data - I. Validation of mineral abundance and composition products of the Rocklea Dome channel iron deposit in Western Australia, Econ. Geol., 107, 209–228, 2012a.
Haest, M., Cudahy, T., Laukamp, C., and Gregory, S.: Quantitative mineralogy from visible to shortwave infrared spectroscopic data – II. 3D mineralogical characterisation of the Rocklea Dome channel iron deposit, Western Australia, Econ. Geol., 107, 229–249, 2012b.
Huntington, J., Mauger, A., Skirrow, R., Bastrakov, E., Connor, P., Mason, P., Keeling, J., Coward, D., Berman, M., Phillips, R., Whitbourn, L., and Heithersay, P.: Automated mineralogical logging of core from the Emmie Bluff, iron oxide copper-gold prospect, South Australia, Pacrim 2004 Congress, 2004, Parkville Victoria, Australas. I. Min. Met., 223–230, 2004.
Laukamp, C.: Rocklea Dome C3DMM. v1, CSIRO, Data Collection, https://doi.org/10.25919/5ed83bf55be6a, 2020.
Laukamp, C., Cudahy, T., Caccetta, M., Chia, J., Gessner, K., Haest, M., Liu, Y. C., and Rodger, A.: The uses, abuses and opportunities for hyperspectral technologies and derived geoscience information, AIG Bulletin 51, Geo-Computing 2010 Conference, Brisbane, Australia, September 2010, 73–76, 2010.
Laukamp, C., Cudahy, T., Cleverley, J., Oliver, N., and Hewson, R.: Airborne hyperspectral imaging of hydrothermal alteration zones in granitoids of the Eastern Fold Belt (Mount Isa Inlier, Australia), Geochemistry: Exploration, Environment, Analysis, 11, 3–24, 2011.
Laukamp, C., Rodger, A., LeGras, M., Lampinen, H., Lau, I., Pejcic, B., Stromberg, J., Francis, N., and Ramanaidou, E.: Mineral physicochemistry underlying feature-based extraction of mineral abundance and composition from shortwave, mid and thermal infrared reflectance spectra, Minerals (ISSN 2075-163X), accepted, 2021.
Morris, R. C. and Ramanaidou, E. R.: Genesis of the channel iron deposits (CID) of the Pilbara region, Western Australia, Aust. J. Earth Sci., 54, 733–756, 2007.
Rodger, A.: SODA: A new method of in-scene atmospheric water vapor estimation and post-flight spectral recalibration for hyperspectral sensors: Application to the HyMap sensor at two locations, Remote Sens. Environ., 115, 536–547, 2011.
Rodger, A. and Cudahy, T.: Vegetation corrected continuum depths at 2.20 mm: An approach for hyperspectral sensors, Remote Sens. Environ., 113, 2243–2257, 2009.
Sonntag, I., Laukamp, C., and Hagemann, S.: Low potassium hydrothermal alteration in low sulfidation epithermal systems as detected by IRS and XRD: an example from the Co-O Mine, Eastern Mindanao, Philippines, Ore Geol. Rev., 45, 47–60, 2012.
State of Western Australia (Department of Mines, Industry Regulation and Safety): Rocklea Inlier 3D geology, available at: https://dasc.dmp.wa.gov.au/DASC?productAlias=Rocklea3D, last access: 16 March 2021.
Strezov, V., Ziolkowski, A., Evans, T. J., and Nelson, P. F.: Assessment of evolution of loss on ignition matter during heating of iron ores, J. Therm. Anal. Calorim., 100, 901–907, 2010.
Thorne, A. M. and Tyler, I. M.: Geology of the Rocklea 1:100 000 Sheet: Geological Survey of Western Australia, 1:100 000 Geological Series Explanatory Notes, 15 pp., 1996.
Tucker, C. J.: Red and photographic infrared linear combinations for monitoring vegetation, Remote Sens. Environ., 8, 127–150, 1979.