the Creative Commons Attribution 4.0 License.
the Creative Commons Attribution 4.0 License.
A global viral oceanography database (gVOD)
Wei Wei
Lanlan Cai
Xiaowei Chen
Yuhong Huang
Nianzhi Jiao
Rui Zhang
Virioplankton are a key component of the marine biosphere in maintaining diversity of microorganisms and stabilizing ecosystems. They also contribute greatly to nutrient cycles/cycling by releasing organic matter after lysis of hosts. In this study, we constructed the first global viral oceanography database (gVOD) by collecting 10 931 viral abundance (VA) data and 727 viral production (VP) data, along with host and relevant oceanographic parameters when available. Most VA data were obtained in the North Atlantic (32 %) and North Pacific (29 %) oceans, while the southeast Pacific and Indian oceans were quite undersampled. The VA in the global ocean was particles mL−1. The lytic and lysogenic VP in the global ocean was and , respectively. Average VA in coastal oceans was higher than that in surface open oceans ( versus particles mL−1), while average VP in coastal and surface open oceans was close. Vertically, VA, lytic VP and lysogenic VP deceased from surface to deep oceans by about 1 order of magnitude. The total number of viruses in the global ocean estimated by bin-averaging and the random forest method was 1.56×1030 and 1.49×1030 particles, leading to an estimate of global ocean viral biomass at 35.9 and 34.4 Tg C, respectively. We expect that the gVOD will be a fundamental and very useful database for laboratory, field and modeling studies in marine ecology and biogeochemistry. The full gVOD database (Xie et al., 2020) is stored in PANGAEA (https://doi.org/10.1594/PANGAEA.915758).
- Article
(9229 KB) - Full-text XML
-
Supplement
(1208 KB) - BibTeX
- EndNote
Virioplankton are the most abundant biological entities and one of the largest genetic reservoirs in the ocean (Breitbart, 2012; Fuhrman, 1999). With an estimation of ∼1023 marine microbes being infected every second, viruses play important roles in affecting microbial mortality, regulating community composition and impacting biogeochemical cycles (Suttle, 2005; Zhang et al., 2007). Viruses were estimated to kill ∼20 %–40 % of marine bacterioplankton every day, a rate similar to that caused by zooplankton grazing (Fuhrman, 1999). In particular, virus-mediated cell lysis effectively “shunts” approximately 25 % of the photosynthetically fixed carbon, which otherwise would be transferred to higher trophic levels, to the dissolved organic matter (DOM) pool, partly forming the basis of the microbial loop and leading to the recycling of nutrients (Suttle, 2007; Wilhelm and Suttle, 1999). Furthermore, viral lysis can contribute to the biological pump through the release of sticky lysates that accelerate the aggregation and sink of carbon into the deep sea (Suttle, 2005).
Compilation of the observations of viral abundance and activity in the global ocean is very necessary and urgent in understanding spatiotemporal distributions of viruses, exploring the controlling factors of viral processes, qualitatively and quantitatively assessing virus–host interactions and viral functioning in marine ecosystems, and even improving predictions of large-scale marine ecosystem and Earth system models. Two previous studies (Bar-On and Milo, 2019; Wigington et al., 2016) summarized viral abundance data in the ocean and estimated viral biomass as well as the virus-to-prokaryote ratio. However, the lack of host parameters, such as bacterial production, and oceanographic parameters, such as temperature, salinity and nutrient concentrations, limits the usage of these datasets in broader oceanographic contexts. More importantly, there is no public database of viral activity in the global ocean, which substantially hinders our understandings of the ecological and biogeochemical roles of virioplankton on a global scale. In addition, the ecological functions of the viruses are tightly linked to their life strategies, mainly including the lytic and the lysogenic infection (Wommack and Colwell, 2000). The significance of viruses in oceanic biogeochemistry is mainly reflected through the lytic infection, which results in cell lysis and the release of DOM. In contrast, other more temperate viruses choosing the lysogenic infection can influence microbial diversity and metabolism by transferring new genes to their hosts, altering the expression of host genes, and not killing hosts for many generations until an environmental or cellular trigger causes them to enter the lytic cycle. The lysogenic infection hence serves as a molecular time bomb (Paul, 2008). Therefore, it is necessary to include the quantity and quality data of viral life strategies in a viral oceanographic database.
In this study, we construct the first global viral oceanography database, namely gVOD, by collecting data of viral abundance (VA), lytic viral production (VP) and lysogenic VP, as well as other related viral, host and oceanographic metadata when available. Based on the database, we estimate the total viral number and biomass in the global ocean. In addition, the data of VA and VP generated with different techniques were compared to provide references for evaluating possible technical biases.
2.1 Database summary
In the gVOD, direct measurements of three core parameters (VA, lytic VP and lysogenic VP), as well as accessary viral, prokaryotic and oceanographic parameters when available, were collected from published papers or acquired from lead authors or principal investigators (Table 1). Sampling information including date, latitude, longitude, depth and methods was included for each data record. We used ocean depth shallower or deeper than 200 m as a criterion to identify coastal or open-ocean samples. The open-ocean samples were further separated into surface and deep samples that collected in 0–200 m and >200 m, respectively.
Table 1Number of accessory viral, host and oceanographic parameters associated with each of the core viral parameters (VA, lytic VP and lysogenic VP).
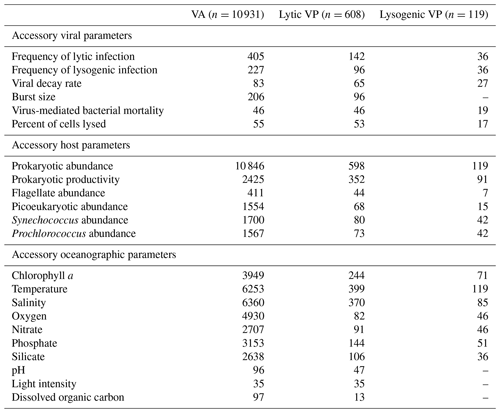
The quality-controlled database consists of 10 931 VA data points (Table A1), 608 lytic VP data points and 119 lysogenic VP data points (Table A2). Most of VA (99.2 %) and lytic VP (98.4 %) and all lysogenic VP data have accompanying data of prokaryotic abundance (Table 1). For some samples, the abundances of flagellate, picoeukaryotes, Synechococcus and Prochlorococcus are also available. Prokaryotic productivity measurements cover 22.1 % of VA, 57.7 % of lytic VP and 76.5 % of lysogenic VP data. The most available environmental parameters are salinity and temperature, providing oceanographic information for about half of VA, two-thirds of lytic VP and nearly all lysogenic VP data. Oxygen and chlorophyll a concentration data are also adequate, particularly for VA. The concentrations of different types of nutrient, including nitrate, silicate and phosphate, are available for many samples. Other environmental parameters (pH, light intensity, dissolved organic carbon concentration) are relatively scarce. Moreover, given that the frequency of viral infected cells was calculated, independently or together with VP, usually to quantify the impact of viral infection within the microbial community (Chen et al., 2019; Payet and Suttle, 2013; Weinbauer et al., 2003), the reported frequencies of lytic infection (n=438) and lysogenic infection (n=266) in the literature were also collected into the database to facilitate the future exploration of marine viral activities. Lastly, we collected 83 viral decay rate data, 206 viral burst size data and 111 virus-mediated mortality data, which can be useful for certain studies. The gVOD is a compilation of all the available data, to our best knowledge, by 2019. We plan to update the database every 5 years.
2.2 Viral abundance
The viral abundance in this database was counted using one of the following three methods. In the first method, viruses were harvested by ultracentrifuging onto copper grids, stained with uranyl acetate and then enumerated using transmission election microscopy (TEM) (Akaike, 1974). In the second method, viruses were collected onto 0.02 µm filters, stained with a nucleic-acid-specific fluorescent dye (e.g., SYBR Green I) and then counted under an epifluorescence microscope (EFM) (Noble and Fuhrman, 1998). The third method counted viruses by using a flow cytometer (FCM), before which viruses were stained with fluorescent dye (e.g., SYBR Green I or SYBR Gold) and identified on the basis of the green fluorescence versus side scatter signal (Brussaard, 2004; Marie et al., 1999). The details of these three approaches have been described elsewhere (Weinbauer, 2004).
2.3 Lytic viral activity
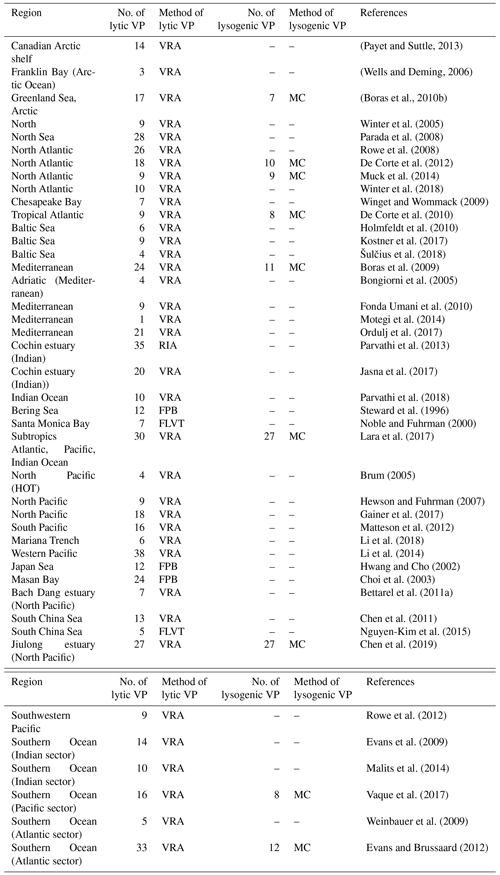
Lytic VP is paramount and widely employed to assess the activity of lytic viruses at the community level and the roles of viruses in marine ecosystems. In this database, the lytic VP was estimated by one of the following five methods. The first method estimated VP by calculating expected viral release rates by multiplying the fraction of viral infected cells (mainly prokaryotes), prokaryotic productivity (assuming equal prokaryotic mortality rate), and burst size obtained from TEM studies (Noble and Steward, 2001) or virus-dilution approach (Weinbauer et al., 2002). For notational simplicity, in this paper we label this method as FPB to represent the three variables (fraction of viral infected cells, prokaryotic productivity and burst size) listed above and used in the estimation. In the second method, called radioactive incorporation approach (RIA), lytic VP was estimated by determining viral DNA synthesis rates using a labeled radiotracer (e.g., 3H-, 32P-, or 14C-labeled thymidine or leucine) and a conversion factor to quantify the incorporated radiotracer into viral particles (Noble and Steward, 2001; Zimina et al., 1973). The third method estimated the lytic VP from the viral decay rates (VDRs), assuming that the abundance of virus particles is in a steady state, and then the loss rate of virus particles should be balanced by the production rate (Heldal and Bratbak, 1991). The fourth method used fluorescently labeled viral tracers (FLVTs) to measure the dilution rates from the decay of labeled viruses and net changes in the non-labeled viruses in a natural viral community (Noble and Fuhrman, 2000). The fifth method quantified the increase in viral abundance during time course incubation using a virus dilution or virus reduction approach (VRA) (Weinbauer et al., 2010; Winget et al., 2005), which effectively avoided new viral infection by reducing viral abundances using pore-size filters or tangential flow filtration systems.
2.4 Lysogenic viral activity
Lysogenic VP is generally measured by detecting the proviruses (temperate viruses) that choose lysogenic infection in the environment. Lysogenic VP in this database was estimated using VRA described above after the provirus induction by mitomycin C (Weinbauer et al., 2002). Hence, the lysogenic VP was estimated as the difference in viral abundance per unit time between the mitomycin-C-treated and the control samples.
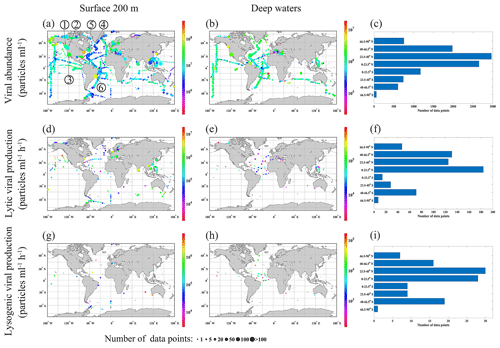
Figure 1Collected viral abundance (a, b), lytic viral production (d, e) and lysogenic viral production (g, h) in surface (≤200 m) (a, d and g) and in deep (>200 m) waters (b, e and h), binned on grids. Color of each grid codes the mean value of the parameters, and the size of the circles represents the number of samples in each bin. Also shown is the number of samples in latitudinal bands (c, f and i). Numbers in panel (a) represent long-term time-series observations of viral abundance: 1 – Rivers Inlet, 2 – Saanich Inlet, 3 – San Pedro Ocean Time Series Microbial Observatory, 4 – Bedford Basin Plankton Monitoring Program, 5 – Bermuda Atlantic Time-series Study, and 6 – Guanabara Bay.
2.5 Quality control
We conducted quality control for the VA, lytic VP and lysogenic VP data of the database. A negative lytic VP (Wells and Deming, 2006) was removed. All zero-value (below detection limit) data were kept in the database but were not included in the following analyses. For those positive-value data, we applied the Chauvenet's criterion to their log-transformed values to identify outliers (Glover et al., 2011): a datum was treated as an outlier when its probability of deviating from the observed mean was lower than , where n was the number of data samples. Outliers were marked in the database and not included in the following analyses.
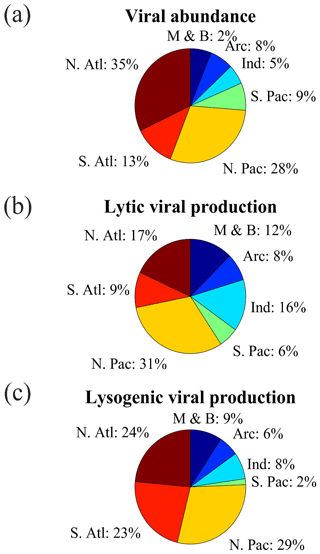
Figure 2The fraction of (a) viral abundance, (b) lytic viral production and (c) lysogenic viral production data points in different oceans (N. Atl: North Atlantic, S. Atl: South Atlantic, N. Pac: North Pacific, S. Pac: South Pacific, Ind: Indian Ocean, Arc: Arctic Ocean, M & B: Mediterranean Sea and Baltic Sea).
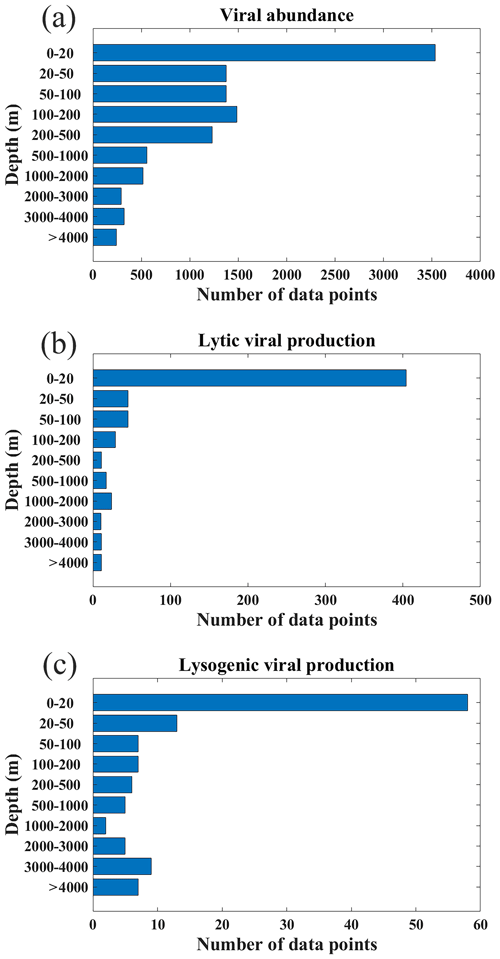
Figure 3Depth distribution of the data for (a) viral abundance, (b) lytic viral production and (c) lysogenic viral production.
2.6 Total number and biomass of viruses in the global ocean
Based on the VA data of our database, we estimated the total number of viruses in the global ocean using two methods. In the first method, we separately estimated the total number of viruses in different ocean basins, including the North and South Atlantic Ocean, the North and South Pacific Ocean, the Indian Ocean, the Arctic Ocean, and the Mediterranean and Baltic seas. For each basin, viral numbers were calculated for coastal and open oceans separately. The mean VA in each depth bin (coastal oceans: bins separated at 5, 10, 25, 50 and 100 m; open oceans: bins separated at 10, 20, 30, 40, 50, 60, 70, 80, 90, 100, 200, 500, 1000 and 2000 m) was multiplied by its water volume to calculate the number of viruses in that bin. Please note that due to the insufficient data, mean VA values in deep waters of the Arctic Ocean, Mediterranean Sea and Baltic Sea were substituted by the value of the North Atlantic Ocean. The total number of viruses in the global ocean was then calculated by summing up the estimates of the coastal and open-ocean regions of all the counted ocean basins.
The second method used the random forest (MATLAB machine-learning toolbox) (Breiman, 2001) to construct a model of VA based on sampling latitude, longitude, months and depths. VA data were binned to with 44 vertical layers, and the mean VA of each bin, if data were available, was fed into the random forest. When implementing the random forest, 75 % of samples were randomly selected for training the model while the rest data were used for model validation. The trained model was then used to predict VA for each bin and then to estimate the total viral number in the global ocean.
The viral biomass of the global ocean was calculated from the virus numbers using a conversion factor of 0.023 fg C per viral particle, which was based on an empirical relationship between carbon contents in heads of marine viruses (Chead) and their sizes (Jover et al., 2014):
where r was the radium of viral head for which an average of 26.3 nm from the Tara Ocean expedition data was used (Brum et al., 2015).
In this paper, all the uncertainties reported in parentheses after the means are standard deviations, except that the standard errors of the mean are reported for the estimates of total viral number and biomass of the global ocean, because the mean values are used in the estimates, and therefore the uncertainties of the means are the most interested.
3.1 Data distribution
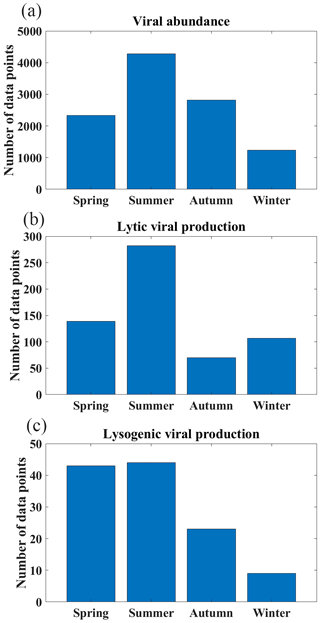
Most VA data were collected in the Northern Hemisphere (particularly in tropical and subtropical regions), while fewer data were collected in the Southern Hemisphere (Fig. 1a–c). In total, nearly two-thirds of the VA data were sampled in the North Atlantic Ocean (32 %) and North Pacific Ocean (29 %) (Fig. 2a). In addition, six long-term time series of VA were included in the compilation (Fig. 1a, b): the Bermuda Atlantic Time-series Study (BATS) in 2000–2009, the San Pedro Ocean Time Series (SPOTS) Microbial Observatory in 2000–2011, the Bedford Basin Plankton Monitoring Program (BBPM) in 1996–2000, the Rivers Inlet (RI) in 2008–2010, the Saanich Inlet (SI) in 2010–2012 and 2014–2015, and the Guanabara Bay (GB) in 2011–2014. Weekly VAs were measured at BBPM; approximately monthly samples were collected at BATS, SPOTS, SI and GB year-round; and monthly samples were collected at RI only in spring and summer. Vertically, most VA data were sampled in the surface ocean (≤200 m, 71 %), while fewer data were sampled in the deep ocean (>200 m, 29 %), particularly below 1000 m (Fig. 3a). Summer VA samples were most abundant, while winter had the fewest data (Fig. 4a).
Lytic VP data in the Northern Hemisphere are much more than those in the Southern Hemisphere (Fig. 1d–f), with almost half of lytic VP data sampled in the North Pacific Ocean (31 %) and North Atlantic Ocean (18 %) (Fig. 2b). A majority of lytic VP data (86 %) was collected in the surface ocean (Fig. 3b), while the deep samples were mostly from the North Atlantic and the western and northeastern Pacific oceans (Fig. 1e). There were seasonal biases in lytic VP data, most of which were sampled in summer while rarely sampled in autumn (Fig. 4b). More lytic VP data were sampled in open oceans (63 %) than in coastal waters (37 %) (Fig. 5). Almost every lytic and lysogenic VP data was accompanied by VA measurements.
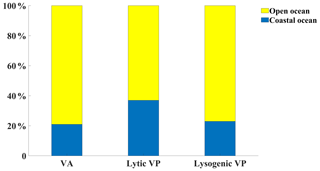
Figure 5The fraction of viral abundance (VA), lytic viral production (VP) and lysogenic VP data points in coastal versus in open oceans.
There was a very limited number of lysogenic VP data in both surface and deep oceans (Fig. 1g and h), with those deep samples being even much fewer than the already scarce surface ones (Fig. 3c). The Northern Hemisphere had slightly more lysogenic VP data than the Southern Hemisphere (Fig. 1i), with most lysogenic VP data sampled in the North Pacific (29 %), the North Atlantic (24 %) and the South Atlantic (23 %) oceans (Fig. 2c). Similar to lytic VP data, lysogenic VP data tended to be collected in spring and summer compared to other seasons, particularly winter (Fig. 4c). Lysogenic VP data in the open ocean (77 %) were also much more than those in coastal waters (23 %) (Fig. 5).
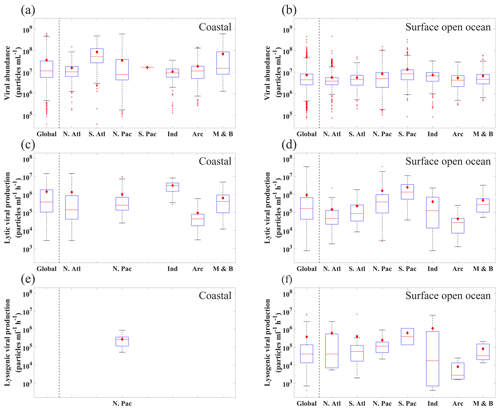
Figure 6The range of (a, b) viral abundance, (c, d) lytic viral production and (e, f) lysogenic viral production in the different oceans (N. Atl: North Atlantic, S. Atl: South Atlantic, N. Pac: North Pacific, S. Pac: South Pacific, Ind: Indian Ocean, Arc: Arctic Ocean, M & B: Mediterranean Sea and Baltic Sea), grouping in coastal ocean (a–c) and open-ocean samples in surface (≤200 m) waters (d–f). All data are shown in logarithmic scales. The red diamonds mark the mean value. The central red lines indicate the median, and the bottom and top edges of the box indicate the 25th and 75th percentiles of the data. Error bars extend to the 5th and 95th percentiles, and the remaining outliers are marked with red plus signs.
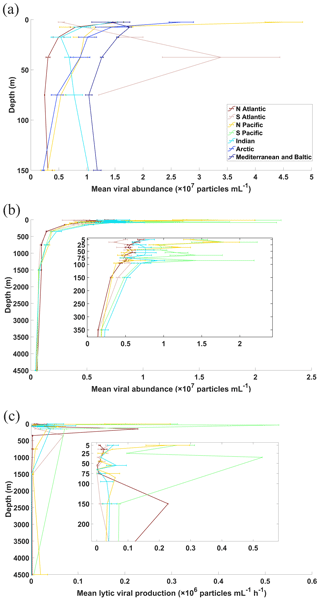
Figure 7Vertical profiles of average viral abundance of each ocean basin in (a) coastal and (b) open-ocean waters. Also shown are the vertical profiles for open-water lytic viral production (c), while those for coastal samples were not constructed because of limited data points. Error bars represent 1 standard error of the mean.
In summary, most viral data were sampled in North Atlantic and northeast Pacific oceans (Figs. 1 and 2), and more data were sampled in the surface than in the deep oceans (Fig. 3). Viral data also tended to be sampled in summer (Fig. 4). Although the total viral data in the coastal samples were fewer than the open-ocean samples (Fig. 5), they were more concentrated in the coastal zones considering their relatively small area in the global ocean.
3.2 Viral abundance in the global ocean
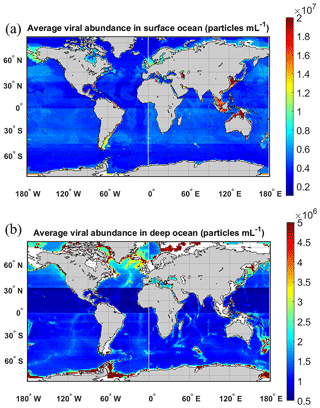
In the surface oceans, VA (n=7768) mostly varied in the order of 106 to 108 particles mL−1, with mean VA in coastal waters ( particles mL−1) about 5 times higher than that in the open oceans ( particles mL−1) (Fig. 6a and b). VA in the coastal South Atlantic Ocean and Mediterranean and Baltic seas was higher than that in other coastal oceans (Fig. 6a). Although the VA across different surface open oceans was distributed in similar ranges, the average VA in the Pacific (particularly in its southern portion) was higher than those in other basins (Fig. 6b), a pattern previously found in another study (Lara et al., 2017) using fewer data than this study. VA decreased with depth, with those in the global deep ocean [ particles mL−1, n=3164] about 1 order of magnitude lower than those in the surface (Fig. 7a and b). The vertical profiles in different open-ocean basins more clearly showed that the VA in the Pacific was higher than that in the Atlantic in surface (1000 m) waters, while the difference did not exist in deeper oceans (Fig. 7b).
In our database, most VA samples were measured using FCM (7353, 67.26 %) and EFM (3465, 31.71 %), while only 112 (1.03 %) VA samples were counted using TEM (Table A1). Previous studies have shown that the VA counted using FCM, which became more popular in studies after 2014 (Table A1), had a strong correlation with those using EFM (Brussaard et al., 2010; Marie et al., 1999; Payet and Suttle, 2008). Our data demonstrated that the VA obtained by FCM and EFM methods has consistent results in similar environments. For deep open-ocean samples, VAs using TEM are substantially lower than those using the other two methods (Fig. 8). But considering much fewer VA data points using TEM than others (Fig. 8 and Table A1), we cannot conclude TEM substantially underestimated VA in the deep water samples. Nevertheless, our database provides references for methodological comparison in the future.
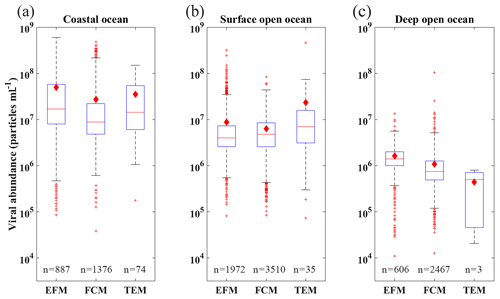
Figure 8Box plots of distribution of viral abundance using different measurement methods (EFM, FCM and TEM; see text for more details) in coastal (a), surface open-ocean and (b) deep open-ocean (c) waters. See caption of Fig. 6 for details of lines and symbols of the box plots.
The total number of global ocean viruses estimated by binning the VA data (Fig. 7a and b) is particles (mean±s.e.), which is very close to the estimate of particles (mean±s.e.) using the random forest method (Fig. A1). Both values are consistent with the previous estimates of 1×1030 (Suttle, 2007), 1.29×1030 (Cobian Guemes et al., 2016) and 1.5×1030 (Bar-On and Milo, 2019) viral particles for the global ocean. Using a conversion factor of 0.023 fg C per viral particle (see Methods), our two values of total viral number give the estimates of total viral biomass in the global ocean at 35.9±0.46 and 34.4±0.32 Tg C, respectively, confirming a recent estimate of 30 Tg C (Bar-On and Milo, 2019).
3.3 Viral production
In the surface ocean, lytic VP (n=523) varied greatly from 103 to 107 in different ocean basins (Fig. 6c and d). The overall mean and standard deviation of lytic VP in the global ocean were (ranging 0.00746×10⁵–350×105) . Lytic VP values in the surface open Pacific Ocean were about 1 order of magnitude higher than those in the surface open Atlantic Ocean (Fig. 6d), a pattern consistent with VA (Fig. 6b). Lytic VP in the surface Arctic Ocean was much lower than that in other basins, which was expected considering its much lower biological productivity (Fig. 6c, d). Although insufficient lytic VP data (n=82) were available for meaningful statistical analyses in the deep waters (Fig. 9), the existing data showed a general trend that VP decreased by 1 order of magnitude from the surface to the deep open oceans (Fig. 7c). Unlike VA, average lytic VP in coastal waters was close to that in the surface open ocean (Fig. 6c).
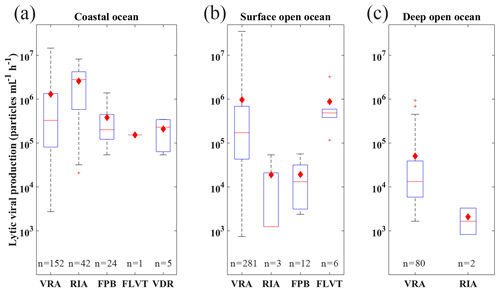
Figure 9Comparison of lytic viral production using different measurement methods including VRA, RIA, FPB, FLVT and VDR (FPB: calculated by multiplying the fraction of viral infected cells, prokaryotic production and burst size; RIA: radioactive incorporation approach; FLVT: fluorescently labeled viral tracer method; VRA: virus reduction approach; VDR: estimated by viral decay rate; see text for details) in coastal (a), surface open-ocean and (b) deep open-ocean (c) waters. See caption of Fig. 6 for details of lines and symbols of the box plots.
Most of the lytic VP (84.4 %) in this database was estimated by VRA, suggesting that VRA was widely utilized in literature and became a standard method to estimate VP across different marine environments. Several studies have tried to compare different approaches estimating the lytic VP, revealing that the VRA method was more reliable and less laborious, compared to the probable overestimation by the FLVT approach and the potential underestimation by the RIA method, though such comparisons were mainly constrained to the coastal ocean (Helton et al., 2005; Karuza et al., 2010; Rastelli et al., 2016; Winget et al., 2005). Additionally, although a meaningful comparison of reported lytic VP values between disparate marine ecosystems is complicated by the inherent variability among approaches, the lytic VP rates in this database might provide a tentative global-scale insight into methodological comparison. Our statistics showed that, in similar environments, the lytic VP rates determined by FLVT and VRA were higher than those measured by RIA. For coastal samples, such difference among methods was not obvious (Fig. 9). However, due to the limited number of samples using the methods other than VRA (Fig. 9 and Table A2), we did not have adequate data to tell if the difference in VP was caused by the measurement methods or the randomness of the samples. Hence, more measurements of lytic VP using multiple approaches simultaneously will be certainly needed to better evaluate the differences among them.
The lysogenic VP data were too few (surface n=85, deep ocean n=34) for meaningful comparisons across different ocean basins or between the surface and deep waters, although the results were plotted for readers' reference (Fig. 6e and f). The overall lysogenic VP in the global ocean was estimated at (ranging 0.00132×10⁵–68.8×10⁵) , which was about one-third of the level of lytic VP, although more data will be needed to better compare the two types of VP.
The MATLAB codes for calculating the total number of viruses can be found in the Supplement or be obtained by requesting the corresponding authors.
The gVOD database (Xie et al., 2020) can be downloaded from PANGAEA at https://doi.org/10.1594/PANGAEA.915758.
We constructed a global ocean viral database (gVOD) by compiling 10 931 VA data, 608 lytic VP data and 119 lysogenic VP data. This database may be useful for global-scale studies of viral processes and their roles in marine ecosystems and biogeochemical cycles. The VA, lytic VP and lysogenic VP data were greatly variable. Most VAs were counted using flow cytometers and epifluorescence microscopes, while the virus reduction approach was the most popular method in estimating VP. The lytic VP is about 3 times higher than the lysogenic VP. The calculation using the database also confirms the previous estimates of viral numbers and biomass in the global ocean.
Our database shows that the current investigations have the limitation in spatiotemporal coverage. The VA dataset has a poor coverage in the South Pacific and Indian Ocean. The lytic VP dataset does not have a good coverage in the South Pacific, northwest Pacific, Indian and South Atlantic oceans. The lysogenic VP data are very few in the global ocean. Vertically, all viral data were sampled much less in mesopelagic and deep oceans than in the surface oceans. Thus, the measurements of viral parameters in these regions and depths should be given high priority. In addition, more viral data should be sampled in winter to avoid seasonal biases.
The database is stored in a public data repository (PANGAEA) and will be updated regularly when new data become available. We hope that the database will be valuable for field and modeling studies in marine ecology, biogeochemistry and other areas of oceanography.
Table A1Sources and methods of viral abundance data. EFM: counted by epifluorescence microscopes; FCM: counted by flow cytometer; TEM: counted by transmission election microscopy. Data marked by * are those collected in a previous dataset (Wigington et al., 2016).

Table A2Sources and methods of VP data. FPB: calculated by multiplying the fraction of viral infected cells, prokaryotic production and burst size; RIA: radioactive incorporation approach; FLVT: fluorescently labeled viral tracers method; VRA: virus reduction approach (see main text Sect. 2.3 for details). MC: virus reduction approach with addition of inducing agent such as mitomycin C (see main text Sect. 2.4 for details).
The supplement related to this article is available online at: https://doi.org/10.5194/essd-13-1251-2021-supplement.
RZ and YWL conceived and designed structure of database and mathematical analyses of the data. LX, WW, LC, XC and YH collected the data and described the metadata. LX, NJ, RZ and YWL conducted quality control and analyses of the data. LX, RZ and YWL led the writing of the paper, with contribution from all the co-authors.
The authors declare that they have no conflict of interest.
We would like to thank all the scientists and crews who collected the historical data.
This research has been supported by the National Natural Science Foundation of China (grant nos. 91951209, 41890802 and 42076153) and the MEL internal research fund (grant no. MELRI2003).
This paper was edited by David Carlson and reviewed by two anonymous referees.
Akaike, H.: A new look at the statistical model identification, IEEE Trans. Automat. Contr., 19, 716–723, https://doi.org/10.1007/978-1-4612-1694-0_16, 1974.
Auguet, J. C., Montanie, H., Delmas, D., Hartmann, H. J., and Huet, V.: Dynamic of virioplankton abundance and its environmental control in the Charente estuary (France), Microb. Ecol., 50, 337–349, https://doi.org/10.1007/s00248-005-0183-2, 2005.
Balsom, A. L.: Macroinfaunal community composition and biomass, and bacterial and viral abundances from the gulf of Alaska to the Canadian Archipelago: A biodiversity study, M.S., University of Tennessee, Tennessee, 2003.
Bar-On, Y. M. and Milo, R.: The biomass composition of the oceans: a blueprint of our blue planet, Cell, 179, 1451–1454, https://doi.org/10.1016/j.cell.2019.11.018, 2019.
Bettarel, Y., Dolan, J. R., Hornak, K., Lemee, R., Masin, M., Pedrotti, M. L., Rochelle-Newall, E., Simek, K., and Sime-Ngando, T.: Strong, weak, and missing links in a microbial community of the N. W. Mediterranean Sea, FEMS Microbiol. Ecol., 42, 451–462, https://doi.org/10.1111/j.1574-6941.2002.tb01034.x, 2002.
Bettarel, Y., Arfi, R., Bouvier, T., Bouvy, M., Briand, E., Colombet, J., Corbin, D., and Sime-Ngando, T.: Virioplankton distribution and activity in a tropical eutrophicated bay, Estuar. Coast. Shelf Sci., 80, 425–429, https://doi.org/10.1016/j.ecss.2008.08.018, 2008.
Bettarel, Y., Bouvier, T., Agis, M., Bouvier, C., Chu, T. V., Combe, M., Mari, X., Nghiem, M. N., Nguyen, T. T., Pham, T. T., Pringault, O., Rochelle-Newall, E., Torreton, J. P., and Tran, H. Q.: Viral distribution and life strategies in the Bach Dang Estuary, Vietnam, Microb. Ecol., 62, 143–154, https://doi.org/10.1007/s00248-011-9835-6, 2011a.
Bettarel, Y., Bouvier, T., Bouvier, C., Carre, C., Desnues, A., Domaizon, I., Jacquet, S., Robin, A., and Sime-Ngando, T.: Ecological traits of planktonic viruses and prokaryotes along a full-salinity gradient, FEMS Microbiol. Ecol., 76, 360–372, https://doi.org/10.1111/j.1574-6941.2011.01054.x, 2011b.
Bongiorni, L., Magagnini, M., Armeni, M., Noble, R., and Danovaro, R.: Viral production, decay rates, and life strategies along a trophic gradient in the North Adriatic Sea, Appl. Environ. Microbiol., 71, 6644–6650, https://doi.org/10.1128/AEM.71.11.6644-6650.2005, 2005.
Boras, J. A., Sala, M. M., Vazquez-Dominguez, E., Weinbauer, M. G., and Vaque, D.: Annual changes of bacterial mortality due to viruses and protists in an oligotrophic coastal environment (NW Mediterranean), Environ. Microbiol., 11, 1181–1193, https://doi.org/10.1111/j.1462-2920.2008.01849.x, 2009.
Boras, J. A., Sala, M. M., Arrieta, J. M., Sà, E. L., Felipe, J., Agustí, S., Duarte, C. M., and Vaqué, D.: Effect of ice melting on bacterial carbon fluxes channelled by viruses and protists in the Arctic Ocean, Polar Biol., 33, 1695–1707, https://doi.org/10.1007/s00300-010-0798-8, 2010a.
Boras, J. A., Sala, M. M., Baltar, F., Arístegui, J., Duarte, C. M., and Vaque, D.: Effect of viruses and protists on bacteria in eddies of the Canary Current region (subtropical northeast Atlantic), Limnol. Oceanogr., 55, 885–898, https://doi.org/10.4319/lo.2009.55.2.0885, 2010b.
Bouvier, T. and Maurice, C. F.: A single-cell analysis of virioplankton adsorption, infection, and intracellular abundance in different bacterioplankton physiologic categories, Microb. Ecol., 62, 669–678, https://doi.org/10.1007/s00248-011-9862-3, 2011.
Bouvy, M., Combe, M., Bettarel, Y., Dupuy, C., Rochelle-Newall, E., and Charpy, L.: Uncoupled viral and bacterial distributions in coral reef waters of Tuamotu Archipelago (French Polynesia), Mar. Pollut. Bull., 65, 506–515, https://doi.org/10.1016/j.marpolbul.2012.01.001, 2012.
Breiman, L.: Random forests, Mach. Learn., 45, 5–32, https://doi.org/10.1023/A:1010933404324, 2001.
Breitbart, M.: Marine viruses: truth or dare, Ann. Rev. Mar. Sci., 4, 425–448, https://doi.org/10.1146/annurev-marine-120709-142805, 2012.
Brum, J. R.: Concentration, production and turnover of viruses and dissolved DNA pools at Stn ALOHA, North Pacific Subtropical Gyre, Aquat. Microb. Ecol., 41, 103–113, https://doi.org/10.3354/ame041103, 2005.
Brum, J. R., Ignacio-Espinoza, J. C., Roux, S., Doulcier, G., Acinas, S. G., Alberti, A., Chaffron, S., Cruaud, C., de Vargas, C., Gasol, J. M., Gorsky, G., Gregory, A. C., Guidi, L., Hingamp, P., Iudicone, D., Not, F., Ogata, H., Pesant, S., Poulos, B. T., Schwenck, S. M., Speich, S., Dimier, C., Kandels-Lewis, S., Picheral, M., Searson, S., Bork, P., Bowler, C., Sunagawa, S., Wincker, P., Karsenti, E., and Sullivan, M. B.: Patterns and ecological drivers of ocean viral communities, Science, 348, 1261498, https://doi.org/10.1126/science.1261498, 2015.
Brum, J. R., Hurwitz, B. L., Schofield, O., Ducklow, H. W., and Sullivan, M. B.: Seasonal time bombs: dominant temperate viruses affect Southern Ocean microbial dynamics, ISME J., 10, 437–449, https://doi.org/10.1038/ismej.2015.125, 2016.
Brussaard, C. P.: Optimization of procedures for counting viruses by flow cytometry, Appl. Environ. Microbiol., 70, 1506–1513, https://doi.org/10.1128/AEM.70.3.1506-1513.2004, 2004.
Brussaard, C. P. D., Payet, J. P., Winter, C., and Weinbauer, M. G.: Quantification of aquatic viruses by flow cytometry, in: Manual of aquatic viral ecology, edited by: Wilhelm, S., Weinbauer, M., and Suttle, C., ASLO, Texas, 102–109, available at:, https://www.aslo.org/limnology-and-oceanography-e-bookstore/manual-of-aquatic-viral-ecology/ (last access: 23 March 2021), 2010.
Cabral, A. S., Lessa, M. M., Junger, P. C., Thompson, F. L., and Paranhos, R.: Virioplankton dynamics are related to eutrophication levels in a tropical urbanized bay, PLoS One, 12, e0174653, https://doi.org/10.1371/journal.pone.0174653, 2017.
Chen, X., Liu, H., Weinbauer, M., Chen, B., and Jiao, N.: Viral dynamics in the surface water of the western South China Sea in summer 2007, Aquat. Microb. Ecol., 63, 145–160, https://doi.org/10.3354/ame01490, 2011.
Chen, X., Wei, W., Wang, J., Li, H., Sun, J., Ma, R., Jiao, N., and Zhang, R.: Tide driven microbial dynamics through virus-host interactions in the estuarine ecosystem, Water Res., 160, 118–129, https://doi.org/10.1016/j.watres.2019.05.051, 2019.
Choi, D. H., Hwang, C. Y., and Cho, B. C.: Comparison of virus- and bacterivory-induced bacterial mortality in the eutrophic Masan Bay, Korea, Aquat. Microb. Ecol., 30, 117–125, https://doi.org/10.3354/ame030117, 2003.
Clasen, J. L., Brigden, S. M., Payet, J. P., and Suttle, C. A.: Evidence that viral abundance across oceans and lakes is driven by different biological factors, Freshwater Biol., 53, 1090–1100, https://doi.org/10.1111/j.1365-2427.2008.01992.x, 2008.
Cobian Guemes, A. G., Youle, M., Cantu, V. A., Felts, B., Nulton, J., and Rohwer, F.: Viruses as winners in the game of life, Annu. Rev. Virol., 3, 197–214, https://doi.org/10.1146/annurev-virology-100114-054952, 2016.
Cochran, P. K. and Paul, J. H.: Seasonal abundance of lysogenic bacteria in a subtropical estuary, Appl. Environ. Microbiol., 64, 2308–2312, https://doi.org/10.1128/AEM.64.6.2308-2312.1998, 1998.
De Corte, D., Sintes, E., Winter, C., Yokokawa, T., Reinthaler, T., and Herndl, G. J.: Links between viral and prokaryotic communities throughout the water column in the (sub)tropical Atlantic Ocean, ISME J., 4, 1431–1442, https://doi.org/10.1038/ismej.2010.65, 2010.
De Corte, D., Sintes, E., Yokokawa, T., Reinthaler, T., and Herndl, G. J.: Links between viruses and prokaryotes throughout the water column along a North Atlantic latitudinal transect, ISME J., 6, 1566–1577, https://doi.org/10.1038/ismej.2011.214, 2012.
De Corte, D., Sintes, E., Yokokawa, T., Lekunberri, I., and Herndl, G. J.: Large-scale distribution of microbial and viral populations in the South Atlantic Ocean, Environ. Microbiol. Rep, 8, 305–315, https://doi.org/10.1111/1758-2229.12381, 2016.
Evans, C. and Brussaard, C. P.: Regional variation in lytic and lysogenic viral infection in the Southern Ocean and its contribution to biogeochemical cycling, Appl. Environ. Microbiol., 78, 6741–6748, https://doi.org/10.1128/AEM.01388-12, 2012.
Evans, C., Pearce, I., and Brussaard, C. P.: Viral-mediated lysis of microbes and carbon release in the sub-Antarctic and Polar Frontal zones of the Australian Southern Ocean, Environ. Microbiol., 11, 2924–2934, https://doi.org/10.1111/j.1462-2920.2009.02050.x, 2009.
Finke, J. F., Hunt, B. P. V., Winter, C., Carmack, E. C., and Suttle, C. A.: Nutrients and other environmental factors influence virus abundances across oxic and hypoxic marine environments, Viruses, 9, 152, https://doi.org/10.3390/v9060152, 2017.
Fonda Umani, S., Malisana, E., Focaracci, F., Magagnini, M., Corinaldesi, C., and Danovaro, R.: Disentangling the effect of viruses and nanoflagellates on prokaryotes in bathypelagic waters of the Mediterranean Sea, Mar Ecol Prog Ser, 418, 73-85, https://doi.org/10.3354/meps08803, 2010.
Fuhrman, J. A.: Marine viruses and their biogeochemical and ecological effects, Nature, 399, 541–548, https://doi.org/10.1038/21119, 1999.
Fuhrman, J. A., Hewson, I., Schwalbach, M. S., Steele, J. A., Brown, M. V., and Naeem, S.: Annually reoccurring bacterial communities are predictable from ocean conditions, Proc Natl Acad Sci U S A, 103, 13104–13109, https://doi.org/10.1073/pnas.0602399103, 2006.
Gainer, P. J., Pound, H. L., Larkin, A. A., LeCleir, G. R., DeBruyn, J. M., Zinser, E. R., Johnson, Z. I., and Wilhelm, S. W.: Contrasting seasonal drivers of virus abundance and production in the North Pacific Ocean, PLoS One, 12, e0184371, https://doi.org/10.1371/journal.pone.0184371, 2017.
Glover, D. M., Jenkins, W. J., and Doney, S. C.: Modeling Methods for Marine Science, Cambridge University Press, New York, https://doi.org/10.1017/cbo9780511975721, 2011.
Gregoracci, G. B., Soares, A. C., Miranda, M. D., Coutinho, R., and Thompson, F. L.: Insights into the microbial and viral dynamics of a coastal downwelling-upwelling transition, PLoS One, 10, e0137090, https://doi.org/10.1371/journal.pone.0137090, 2015.
Heldal, M. and Bratbak, G.: Production and Decay of Viruses in Aquatic Environments, Mar. Ecol. Prog. Ser., 72, 205–212, https://doi.org/10.3354/meps072205, 1991.
Helton, R. R., Cottrell, M. T., Kirchman, D. L., and Wommack, K. E.: Evaluation of incubation-based methods for estimating virioplankton production in estuaries, Aquat. Microb. Ecol., 41, 209–219, https://doi.org/10.3354/ame041209, 2005.
Hewson, I. and Fuhrman, J. A.: Covariation of viral parameters with bacterial assemblage richness and diversity in the water column and sediments, Deep-Sea Res. Pt. I, 54, 811–830, https://doi.org/10.1016/j.dsr.2007.02.003, 2007.
Holmfeldt, K., Titelman, J., and Riemann, L.: Virus production and lysate recycling in different sub-basins of the northern Baltic Sea, Microb. Ecol., 60, 572–580, https://doi.org/10.1007/s00248-010-9668-8, 2010.
Hwang, C. Y. and Cho, B. C.: Virus-infected bacteria in oligotrophic open waters of the East Sea, Korea, Aquat. Microb. Ecol., 30, 1–9, https://doi.org/10.3354/ame030001, 2002.
Jasna, V., Parvathi, A., Pradeep Ram, A. S., Balachandran, K. K., Madhu, N. V., Nair, M., Jyothibabu, R., Jayalakshmy, K. V., Revichandran, C., and Sime-Ngando, T.: Viral-induced mortality of prokaryotes in a tropical monsoonal estuary, Front. Microbiol., 8, 895, https://doi.org/10.3389/fmicb.2017.00895, 2017.
Jasna, V., Pradeep Ram, A. S., Parvathi, A., and Sime-Ngando, T.: Differential impact of lytic viruses on prokaryotic morphopopulations in a tropical estuarine system (Cochin estuary, India), Plos One, 13, e0194020, https://doi.org/10.1371/journal.pone.0194020, 2018.
Jiang, S. C. and Paul, J. H.: Occurrence of lysogenic bacteria in marine microbial communities as determined by prophage induction, Mar. Ecol. Prog. Ser., 142, 27–38, https://doi.org/10.3354/meps142027, 1996.
Jover, L. F., Effler, T. C., Buchan, A., Wilhelm, S. W., and Weitz, J. S.: The elemental composition of virus particles: implications for marine biogeochemical cycles, Nat. Rev. Microbiol., 12, 519–528, https://doi.org/10.1038/nrmicro3289, 2014.
Karuza, A., Del Negro, P., Crevatin, E., and Fonda Umani, S.: Viral production in the Gulf of Trieste (Northern Adriatic Sea): Preliminary results using different methodological approaches, J. Exp. Mar. Biol. Ecol., 383, 96–104, https://doi.org/10.1016/j.jembe.2009.12.003, 2010.
Kopylov, A. I., Sazhin, A. F., Zabotkina, E. A., Romanenko, A. V., Romanova, N. D., and Boltenkova, Ì. A.: Virioplankton of the Kara Sea and the Yenisei River estuary in early spring, Estuar. Coast. Shelf Sci., 217, 37–44, https://doi.org/10.1016/j.ecss.2018.10.015, 2019.
Kostner, N., Scharnreitner, L., Jurgens, K., Labrenz, M., Herndl, G. J., and Winter, C.: High viral abundance as a consequence of low viral decay in the Baltic Sea redoxcline, PLoS One, 12, e0178467, https://doi.org/10.1371/journal.pone.0178467, 2017.
Lara, E., Vaqué, D., Sà, E. L., Boras, J. A., Gomes, A., Borrull, E., Díez-Vives, C., Teira, E., Pernice, M. C., Garcia, F. C., Forn, I., Castillo, Y. M., Peiró, A., Salazar, G., Morán, X. A. G., Massana, R., Catalá, T. S., Luna, G. M., Agustí, S., Estrada, M., Gasol, J. M., and Duarte, C. M.: Unveiling the role and life strategies of viruses from the surface to the dark ocean, Sci. Adv., 3, e1602565, https://doi.org/10.1126/sciadv.1602565, 2017.
Li, W. K. and Dickie, P. M.: Monitoring phytoplankton, bacterioplankton, and virioplankton in a coastal inlet (Bedford Basin) by flow cytometry, Cytometry, 44, 236–246, https://doi.org/10.1002/1097-0320(20010701)44:3<236::aid-cyto1116>3.0.co;2-5, 2001.
Li, Y., Luo, T., Sun, J., Cai, L., Liang, Y., Jiao, N., and Zhang, R.: Lytic viral infection of bacterioplankton in deep waters of the western Pacific Ocean, Biogeosciences, 11, 2531–2542, https://doi.org/10.5194/bg-11-2531-2014, 2014.
Li, Z. S., Wang, M., Luo, Z. X., Liu, L., Xia, J., Gong, Z., Jiang, Y., Shao, H. B., Chen, H. T., and Tian, J. W.: Vertical distribution and dynamic variation of virioplankton in the mariana trench., Oceanol. Limnol. Sinica, 49, 1251–1258, https://doi.org/10.11693/hyhz20180400105, 2018.
Liang, Y., Li, L., Luo, T., Zhang, Y., Zhang, R., and Jiao, N.: Horizontal and vertical distribution of marine virioplankton: a basin scale investigation based on a global cruise, PLoS One, 9, e111634, https://doi.org/10.1371/journal.pone.0111634, 2014.
Liang, Y., Zhang, Y., Zhang, Y., Luo, T., Rivkin, R. B., and Jiao, N.: Distributions and relationships of virio- and picoplankton in the epi-, meso- and bathypelagic zones of the Western Pacific Ocean, FEMS Microbiol. Ecol., 93, fiw238, https://doi.org/10.1093/femsec/fiw238, 2017.
Long, A., McDaniel, L. D., Mobberley, J., and Paul, J. H.: Comparison of lysogeny (prophage induction) in heterotrophic bacterial and Synechococcus populations in the Gulf of Mexico and Mississippi River plume, ISME J., 2, 132–144, https://doi.org/10.1038/ismej.2007.102, 2008.
Ma, Y., Wang, M., Xia, J., Song, X., Liu, Q., Li, Y., Jiang, Y., Shao, H. B., and Zhang, Y. Y.: Studies on abundance and diversity of microplankton during brown tide around Qin-huangdao area, Period. Ocean Univ. China, 46, 142–150, https://doi.org/10.16441/j.cnki.hdxb.20150426, 2016.
Magagnini, M., Corinaldesi, C., Monticelli, L. S., De Domenico, E., and Danovaro, R.: Viral abundance and distribution in mesopelagic and bathypelagic waters of the Mediterranean Sea, Deep-Sea Res. Pt. I, 54, 1209–1220, https://doi.org/10.1016/j.dsr.2007.05.006, 2007.
Magiopoulos, I. and Pitta, P.: Viruses in a deep oligotrophic sea: Seasonal distribution of marine viruses in the epi-, meso- and bathypelagic waters of the Eastern Mediterranean Sea, Deep-Sea Res. Pt. I, 66, 1–10, https://doi.org/10.1016/j.dsr.2012.03.009, 2012.
Malits, A., Christaki, U., Obernosterer, I., and Weinbauer, M. G.: Enhanced viral production and virus-mediated mortality of bacterioplankton in a natural iron-fertilized bloom event above the Kerguelen Plateau, Biogeosciences, 11, 6841–6853, https://doi.org/10.5194/bg-11-6841-2014, 2014.
Marie, D., Brussaard, C. P. D., Thyrhaug, R., Bratbak, G., and Vaulot, D.: Enumeration of marine viruses in culture and natural samples by flow cytometry, Appl. Environ. Microbiol., 65, 45–52, https://doi.org/10.1128/AEM.65.1.45-52.1999, 1999.
Matteson, A. R., Loar, S. N., Pickmere, S., DeBruyn, J. M., Ellwood, M. J., Boyd, P. W., Hutchins, D. A., and Wilhelm, S. W.: Production of viruses during a spring phytoplankton bloom in the South Pacific Ocean near of New Zealand, FEMS Microbiol. Ecol., 79, 709–719, https://doi.org/10.1111/j.1574-6941.2011.01251.x, 2012.
Maurice, C. F., Mouillot, D., Bettarel, Y., De Wit, R., Sarmento, H., and Bouvier, T.: Disentangling the relative influence of bacterioplankton phylogeny and metabolism on lysogeny in reservoirs and lagoons, ISME J., 5, 831–842, https://doi.org/10.1038/ismej.2010.181, 2011.
Maurice, C. F., Bouvier, C., de Wit, R., and Bouvier, T.: Linking the lytic and lysogenic bacteriophage cycles to environmental conditions, host physiology and their variability in coastal lagoons, Environ. Microbiol., 15, 2463–2475, https://doi.org/10.1111/1462-2920.12120, 2013.
Mojica, K. D. A., van de Poll, W. H., Kehoe, M., Huisman, J., Timmermans, K. R., Buma, A. G. J., van der Woerd, H. J., Hahn-Woernle, L., Dijkstra, H. A., and Brussaard, C. P. D.: Phytoplankton community structure in relation to vertical stratification along a north-south gradient in the northeast Atlantic Ocean, Limnol. Oceanogr., 60, 1498–1521, https://doi.org/10.1002/lno.10113, 2015.
Motegi, C. and Nagata, T.: Enhancement of viral production by addition of nitrogen or nitrogen plus carbon in subtropical surface waters of the South Pacific, Aquat. Microb. Ecol., 48, 27–34, https://doi.org/10.3354/ame048027, 2007.
Motegi, C., Nagata, T., Miki, T., Weinbauer, M. G., Legendre, L., and Rassoulzadegand, F.: Viral control of bacterial growth efficiency in marine pelagic environments, Limnol. Oceanogr., 54, 1901–1910, https://doi.org/10.4319/lo.2009.54.6.1901, 2009.
Motegi, C., Kaiser, K., Benner, R., and Weinbauer, M. G.: Effect of P-limitation on prokaryotic and viral production in surface waters of the northwestern Mediterranean Sea, J. Plankton Res., 37, 16–20, https://doi.org/10.1093/plankt/fbu089, 2014.
Muck, S., Griessler, T., Kostner, N., Klimiuk, A., Winter, C., and Herndl, G. J.: Fracture zones in the Mid Atlantic Ridge lead to alterations in prokaryotic and viral parameters in deep-water masses, Front. Microbiol., 5, 264, https://doi.org/10.3389/fmicb.2014.00264, 2014.
Nguyen-Kim, H., Bettarel, Y., Bouvier, T., Bouvier, C., Doan-Nhu, H., Nguyen-Ngoc, L., Nguyen-Thanh, T., Tran-Quang, H., Brune, J., and Wommack, K. E.: Coral mucus is a hot spot for viral infections, Appl. Environ. Microbiol., 81, 5773–5783, https://doi.org/10.1128/aem.00542-15, 2015.
Ni, Z., Huang, X., and Zhang, X.: Picoplankton and virioplankton abundance and community structure in Pearl River estuary and Daya Bay, South China, J. Environ. Sci. China, 32, 146–154, https://doi.org/10.1016/j.jes.2014.12.019, 2015.
Noble, R. T. and Fuhrman, J. A.: Use of SYBR Green I for rapid epifluorescence counts of marine viruses and bacteria, Aquat. Microb. Ecol., 14, 113-118, https://doi.org/10.3354/ame014113, 1998.
Noble, R. T. and Fuhrman, J. A.: Rapid virus production and removal as measured with fluorescently labeled viruses as tracers, Appl. Environ. Microbiol., 66, 3790–3797, https://doi.org/10.1128/aem.66.9.3790-3797.2000, 2000.
Noble, R. T. and Steward, G. F.: Estimating viral proliferation in aquatic samples, Methods Microbiol., 30, 67–82, https://doi.org/10.1016/S0580-9517(01)30040-5, 2001.
Ordulj, M., Krstulović, N., Šantić, D., Jozić, S., and Šolić, M.: Viral dynamics in two trophically different areas in the central Adriatic Sea, Helgoland Mar. Res., 71, 22, https://doi.org/10.1186/s10152-017-0502-2, 2017.
Parada, V., Sintes, E., van Aken, H. M., Weinbauer, M. G., and Herndl, G. J.: Viral abundance, decay, and diversity in the meso- and bathypelagic waters of the North Atlantic, Appl. Environ. Microbiol., 73, 4429–4438, https://doi.org/10.1128/AEM.00029-07, 2007.
Parada, V., Baudoux, A. C., Sintes, E., Weinbauer, M. G., and Herndl, G. J.: Dynamics and diversity of newly produced virioplankton in the North Sea, ISME J., 2, 924–936, https://doi.org/10.1038/ismej.2008.57, 2008.
Parsons, R. J., Breitbart, M., Lomas, M. W., and Carlson, C. A.: Ocean time-series reveals recurring seasonal patterns of virioplankton dynamics in the northwestern Sargasso Sea, ISME J., 6, 273–284, https://doi.org/10.1038/ismej.2011.101, 2012.
Parsons, R. J., Nelson, C. E., Carlson, C. A., Denman, C. C., Andersson, A. J., Kledzik, A. L., Vergin, K. L., McNally, S. P., Treusch, A. H., and Giovannoni, S. J.: Marine bacterioplankton community turnover within seasonally hypoxic waters of a subtropical sound: Devil's Hole, Bermuda, Environ. Microbiol., 17, 3481–3499, https://doi.org/10.1111/1462-2920.12445, 2015.
Parvathi, A., Jasna, V., Haridevi, K. C., Jina, S., Greeshma, M., Breezy, J., and Nair, M.: Diurnal variations in bacterial and viral production in Cochin estuary, India, Environ. Monit. Assess., 185, 8077–8088, https://doi.org/10.1007/s10661-013-3156-9, 2013.
Parvathi, A., Jasna, V., Aparna, S., Pradeep Ram, A. S., Aswathy, V. K., Balachandran, K. K., Muraleedharan, K. R., Mathew, D., and Sime-Ngando, T.: High incidence of lysogeny in the oxygen minimum zones of the Arabian Sea (southwest coast of India), Viruses, 10, 588, https://doi.org/10.3390/v10110588, 2018.
Pasulka, A. L., Samo, T. J., and Landry, M. R.: Grazer and viral impacts on microbial growth and mortality in the southern California Current Ecosystem, J. Plankton Res., 37, 320–336, https://doi.org/10.1093/plankt/fbv011, 2015.
Paul, J. H.: Prophages in marine bacteria: dangerous molecular time bombs or the key to survival in the seas?, ISME J., 2, 579–589, https://doi.org/10.1038/ismej.2008.35, 2008.
Payet, J. P. and Suttle, C. A.: Physical and biological correlates of virus dynamics in the southern Beaufort Sea and Amundsen Gulf, J. Mar. Syst., 74, 933–945, https://doi.org/10.1016/j.jmarsys.2007.11.002, 2008.
Payet, J. P. and Suttle, C. A.: To kill or not to kill: The balance between lytic and lysogenic viral infection is driven by trophic status, Limnol. Oceanogr., 58, 465–474, https://doi.org/10.4319/lo.2013.58.2.0465, 2013.
Proctor, L. M. and Fuhrman, J. A.: Viral Mortality of Marine-Bacteria and Cyanobacteria, Nature, 343, 60–62, https://doi.org/10.1038/343060a0, 1990.
Rastelli, E., Dell'Anno, A., Corinaldesi, C., Middelboe, M., Noble, R. T., and Danovaro, R.: Quantification of viral and prokaryotic production rates in benthic ecosystems: A methods comparison, Front. Microbiol., 7, 1501, https://doi.org/10.3389/fmicb.2016.01501, 2016.
Rowe, J. M., Saxton, M. A., Cottrell, M. T., DeBruyn, J. M., Berg, G. M., Kirchman, D. L., Hutchins, D. A., and Wilhelm, S. W.: Constraints on viral production in the Sargasso Sea and North Atlantic, Aquat. Microb. Ecol., 52, 233–244, https://doi.org/10.3354/ame01231, 2008.
Rowe, J. M., DeBruyn, J. M., Poorvin, L., LeCleir, G. R., Johnson, Z. I., Zinser, E. R., and Wilhelm, S. W.: Viral and bacterial abundance and production in the western Pacific Ocean and the relation to other oceanic realms, FEMS Microbiol. Ecol., 79, 359–370, https://doi.org/10.1111/j.1574-6941.2011.01223.x, 2012.
Sabbagh, E. I., Huete-Stauffer, T. M., Calleja, M. L. L., Silva, L., Viegas, M., and Moran, X. A. G.: Weekly variations of viruses and heterotrophic nanoflagellates and their potential impact on bacterioplankton in shallow waters of the central Red Sea, FEMS Microbiol. Ecol., 96, fiaa033, https://doi.org/10.1093/femsec/fiaa033, 2020.
Steward, G. F., Smith, D. C., and Azam, F.: Abundance and production of bacteria and viruses in the Bering and Chukchi Seas, Mar. Ecol. Prog. Ser., 131, 287–300, https://doi.org/10.3354/meps131287, 1996.
Strzepek, R. F., Maldonado, M. T., Higgins, J. L., Hall, J., Safi, K., Wilhelm, S. W., and Boyd, P. W.: Spinning the “Ferrous Wheel”: The importance of the microbial community in an iron budget during the FeCycle experiment, Global Biogeochem. Cycles, 19, GB4S26, https://doi.org/10.1029/2005GB002490, 2005.
Šulčius, S., Reunamo, A., Paškauskas, R., and Leskinen, P.: Influence of environmental variation on the bacterioplankton community and its loss to viral lysis in the Curonian Lagoon, Estuar. Coast. Shelf Sci., 204, 76–85, https://doi.org/10.1016/j.ecss.2018.02.029, 2018.
Suttle, C. A.: Viruses in the sea, Nature, 437, 356–361, https://doi.org/10.1038/nature04160, 2005.
Suttle, C. A.: Marine viruses – major players in the global ecosystem, Nat. Rev. Microbiol., 5, 801–812, https://doi.org/10.1038/nrmicro1750, 2007.
Taylor, G. T., Hein, C., and Iabichella, M.: Temporal variations in viral distributions in the anoxic Cariaco Basin, Aquat. Microb. Ecol., 30, 103–116, https://doi.org/10.3354/ame030103, 2003.
Thompson, F., Winter, C., Garcia, J. A. L., Weinbauer, M. G., DuBow, M. S., and Herndl, G. J.: Comparison of deep-water viromes from the Atlantic Ocean and the Mediterranean Sea, PLoS ONE, 9, e100600, https://doi.org/10.1371/journal.pone.0100600, 2014.
Vaque, D., Boras, J. A., Torrent-Llagostera, F., Agusti, S., Arrieta, J. M., Lara, E., Castillo, Y. M., Duarte, C. M., and Sala, M. M.: Viruses and protists induced-mortality of prokaryotes around the Antarctic Peninsula during the austral summer, Front. Microbiol., 8, 241, https://doi.org/10.3389/fmicb.2017.00241, 2017.
Wang, K., Wommack, K. E., and Chen, F.: Abundance and distribution of Synechococcus spp. and cyanophages in the Chesapeake Bay, Appl. Environ. Microbiol., 77, 7459–7468, https://doi.org/10.1128/AEM.00267-11, 2011.
Weinbauer, M. G.: Ecology of prokaryotic viruses, FEMS Microbiol. Rev., 28, 127–181, https://doi.org/10.1016/j.femsre.2003.08.001, 2004.
Weinbauer, M. G. and Suttle, C. A.: Potential significance of lysogeny to bacteriophage production and bacterial mortality in coastal waters of the gulf of Mexico, Appl. Environ. Microbiol., 62, 4374–4380, https://doi.org/10.1128/AEM.62.12.4374-4380.1996, 1996.
Weinbauer, M. G. and Suttle, C. A.: Lysogeny and prophage induction in coastal and offshore bacterial communities, Aquat. Microb. Ecol., 18, 217–225, https://doi.org/10.3354/ame018217, 1999.
Weinbauer, M. G., Fuks, D., and Peduzzi, P.: Distribution of Viruses and Dissolved DNA along a Coastal Trophic Gradient in the Northern Adriatic Sea, Appl. Environ. Microbiol., 59, 4074–4082, https://doi.org/10.1128/AEM.59.12.4074-4082.1993, 1993.
Weinbauer, M. G., Winter, C., and Hofle, M. G.: Reconsidering transmission electron microscopy based estimates of viral infection of bacterio-plankton using conversion factors derived from natural communities, Aquat. Microb. Ecol., 27, 103–110, https://doi.org/10.3354/ame027103, 2002.
Weinbauer, M. G., Brettar, I., and Hofle, M. G.: Lysogeny and virus-induced mortality of bacterioplankton in surface, deep, and anoxic marine waters, Limnol. Oceanogr., 48, 1457–1465, https://doi.org/10.4319/lo.2003.48.4.1457, 2003.
Weinbauer, M. G., Arrieta, J.-M., Griebler, C., and Herndl, G. J.: Enhanced viral production and infection of bacterioplankton during an iron-induced phytoplankton bloom in the Southern Ocean, Limnol. Oceanogr., 54, 774–784, https://doi.org/10.4319/lo.2009.54.3.0774, 2009.
Weinbauer, M., Rowe, J., and Wilhelm, S.: Determining rates of virus production in aquatic systems by the virus reduction approach, in: Manual of Aquatic Viral Ecology, edited by: Wilhelm, S., Weinbauer, M., and Suttle, C., ASLO, Taxes, 1–8, available at: https://www.aslo.org/limnology-and-oceanography-e-bookstore/manual-of-aquatic-viral-ecolog (last access: 23 March 2021), 2010.
Wells, L. E. and Deming, J. W.: Significance of bacterivory and viral lysis in bottom waters of Franklin Bay, Canadian Arctic, during winter, Aquat. Microb. Ecol., 43, 209–221, https://doi.org/10.3354/ame043209, 2006.
Wigington, C. H., Sonderegger, D., Brussaard, C. P. D., Buchan, A., Finke, J. F., Fuhrman, J. A., Lennon, J. T., Middelboe, M., Suttle, C. A., Stock, C., Wilson, W. H., Wommack, K. E., Wilhelm, S. W., and Weitz, J. S.: Re-examination of the relationship between marine virus and microbial cell abundances, Nat. Microbiol., 1, 15024, https://doi.org/10.1038/nmicrobiol.2015.24, 2016.
Wilhelm, S. W. and Suttle, C. A.: Viruses and Nutrient Cycles in the Sea – Viruses play critical roles in the structure and function of aquatic food webs, Bioscience, 49, 781–788, https://doi.org/10.2307/1313569, 1999.
Wilhelm, S. W., Jeffrey, W. H., Dean, A. L., Meador, J., Pakulski, J. D., and Mitchell, D. L.: UV radiation induced DNA damage in marine viruses along a latitudinal gradient in the southeastern Pacific Ocean, Aquat. Microb. Ecol., 31, 1–8, https://doi.org/10.3354/ame031001, 2003.
Williamson, S. J., Houchin, L. A., McDaniel, L., and Paul, J. H.: Seasonal variation in lysogeny as depicted by prophage induction in Tampa Bay, Florida, Appl. Environ. Microbiol., 68, 4307–4314, https://doi.org/10.1128/aem.68.9.4307-4314.2002, 2002.
Winget, D. M. and Wommack, K. E.: Diel and daily fluctuations in virioplankton production in coastal ecosystems, Environ. Microbiol., 11, 2904–2914, https://doi.org/10.1111/j.1462-2920.2009.02038.x, 2009.
Winget, D. M., Williamson, K. E., Helton, R. R., and Wommack, K. E.: Tangential flow diafiltration: an improved technique for estimation of virioplankton production, Aquat. Microb. Ecol., 41, 221–232, https://doi.org/10.3354/ame041221, 2005.
Winter, C., Herndl, G. J., and Weinbauer, M. G.: Diel cycles in viral infection of bacterioplankton in the North Sea, Aquat. Microb. Ecol., 35, 207–216, https://doi.org/10.3354/ame035207, 2004.
Winter, C., Smit, A., Szoeke-Denes, T., Herndl, G. J., and Weinbauer, M. G.: Modelling viral impact on bacterioplankton in the North Sea using artificial neural networks, Environ. Microbiol., 7, 881–893, https://doi.org/10.1111/j.1462-2920.2005.00768.x, 2005.
Winter, C., Moeseneder, M. M., Herndl, G. J., and Weinbauer, M. G.: Relationship of geographic distance, depth, temperature, and viruses with prokaryotic communities in the eastern tropical Atlantic Ocean, Microb. Ecol., 56, 383–389, https://doi.org/10.1007/s00248-007-9343-x, 2008.
Winter, C., Kerros, M.-E., and Weinbauer, M. G.: Seasonal and depth-related dynamics of prokaryotes and viruses in surface and deep waters of the northwestern Mediterranean Sea, Deep-Sea Res. Pt. I, 56, 1972–1982, https://doi.org/10.1016/j.dsr.2009.07.003, 2009.
Winter, C., Köstner, N., Kruspe, C. P., Urban, D., Muck, S., Reinthaler, T., and Herndl, G. J.: Mixing alters the lytic activity of viruses in the dark ocean, Ecology, 99, 700–713, https://doi.org/10.1002/ecy.2135, 2018.
Wommack, K. E. and Colwell, R. R.: Virioplankton: viruses in aquatic ecosystems, Microbiol. Mol. Biol. Rev., 64, 69–114, https://doi.org/10.1128/mmbr.64.1.69-114.2000, 2000.
Xie, L., Wei, W., Cai, L., Chen, X., Huang, Y., Zhang, R., and Luo, Y.-W.: A global viral oceanography database (gVOD) from 1987 to 2018, PANGAEA, https://doi.org/10.1594/PANGAEA.915758, 2020.
Yang, Y., Yokokawa, T., Motegi, C., and Nagata, T.: Large-scale distribution of viruses in deep waters of the Pacific and Southern Oceans, Aquat. Microb. Ecol., 71, 193–202, https://doi.org/10.3354/ame01677, 2014.
Zhang, R., Weinbauer, M. G., and Qian, P. Y.: Viruses and flagellates sustain apparent richness and reduce biomass accumulation of bacterioplankton in coastal marine waters, Environ. Microbiol., 9, 3008–3018, https://doi.org/10.1111/j.1462-2920.2007.01410.x, 2007.
Zhao, Y., Zhao, Y., Zheng, S., Zhao, L., Li, X., Zhang, W., Gregori, G., and Xiao, T.: Virioplankton distribution in the tropical western Pacific Ocean in the vicinity of a seamount, Microbiologyopen, e1031, https://doi.org/10.1002/mbo3.1031, 2020.
Zimina, I. D., Maksimov, A. I., and Svettsov, V. I.: Investigation of excitation of ammonia decomposition products in a high-frequency discharge, J. Appl. Spectrosc., 18, 771–772, https://doi.org/10.1007/bf00614106, 1973.


