the Creative Commons Attribution 4.0 License.
the Creative Commons Attribution 4.0 License.
 | 24 Mar 2021
Meteorological observations collected during the Storms and Precipitation Across the continental Divide Experiment (SPADE), April–June 2019
Julie M. Thériault
Stephen J. Déry
John W. Pomeroy
Hilary M. Smith
Juris Almonte
André Bertoncini
Robert W. Crawford
Aurélie Desroches-Lapointe
Mathieu Lachapelle
Zen Mariani
Selina Mitchell
Jeremy E. Morris
Charlie Hébert-Pinard
Peter Rodriguez
Hadleigh D. Thompson
The continental divide along the spine of the Canadian Rockies in southwestern Canada is a critical headwater region for hydrological drainages to the Pacific, Arctic, and Atlantic oceans. Major flooding events are typically attributed to heavy precipitation on its eastern side due to upslope (easterly) flows. Precipitation can also occur on the western side of the divide when moisture originating from the Pacific Ocean encounters the west-facing slopes of the Canadian Rockies. Often, storms propagating across the divide result in significant precipitation on both sides. Meteorological data over this critical region are sparse, with few stations located at high elevations. Given the importance of all these types of events, the Storms and Precipitation Across the continental Divide Experiment (SPADE) was initiated to enhance our knowledge of the atmospheric processes leading to storms and precipitation on either side of the continental divide. This was accomplished by installing specialized meteorological instrumentation on both sides of the continental divide and carrying out manual observations during an intensive field campaign from 24 April–26 June 2019. On the eastern side, there were two field sites: (i) at Fortress Mountain Powerline (2076 m a.s.l.) and (ii) at Fortress Junction Service, located in a high-elevation valley (1580 m a.s.l.). On the western side, Nipika Mountain Resort, also located in a valley (1087 m a.s.l.), was chosen as a field site. Various meteorological instruments were deployed including two Doppler light detection and ranging instruments (lidars), three vertically pointing micro rain radars, and three optical disdrometers. The three main sites were nearly identically instrumented, and observers were on site at Fortress Mountain Powerline and Nipika Mountain Resort during precipitation events to take manual observations of precipitation type and microphotographs of solid particles. The objective of the field campaign was to gather high-temporal-frequency meteorological data and to compare the different conditions on either side of the divide to study the precipitation processes that can lead to catastrophic flooding in the region. Details on field sites, instrumentation used, and collection methods are discussed. Data from the study are publicly accessible from the Federated Research Data Repository at https://doi.org/10.20383/101.0221 (Thériault et al., 2020). This dataset will be used to study atmospheric conditions associated with precipitation events documented simultaneously on either side of a continental divide. This paper also provides a sample of the data gathered during a precipitation event.
- Article
(5202 KB) - Full-text XML
- BibTeX
- EndNote


Precipitation over the Canadian Western Cordillera has high spatial variability and is influenced by the complex orography of the region and its interaction with air masses from a variety of sources (Stoelinga et al., 2013). The continental divide is oriented north–south along the Canadian Rockies and drains into several major bodies of water including westward into the Pacific Ocean, northeastward into the Arctic Ocean, and eastward into the Atlantic Ocean. Therefore, the location where precipitation occurs can determine into which watershed it drains. Usually, the prevailing westerly winds transport moisture-laden Pacific air off the coast of British Columbia (BC) with orographic lift along the Coast Mountains. These maritime air masses lose moisture as they move inland as much of it is precipitated along the Coast Mountains and other interior ranges. Some moisture, however, travels farther inland to the Canadian Rockies. Moisture to the region can also originate from the Great Plains and the Gulf of Mexico, which is forced upslope on the eastern flanks of the Canadian Rockies. This is a mechanism that has previously led to extreme flooding, such as in southern Alberta and British Columbia in 2013 (Pomeroy et al., 2016; Kochtubajda et al., 2016; Liu et al., 2016).
To understand the contribution of these different moisture flows on precipitation across the Canadian Rockies, the Storms and Precipitation Across the continental Divide Experiment (SPADE) was initiated wherein precipitation events across the continental divide were investigated from 24 April–26 June 2019. Over the 2-month period, 13 precipitation events with varying atmospheric conditions and precipitation amounts and types were documented on both sides of the continental divide in southwestern Canada. This project enhances knowledge of both the large- and fine-scale atmospheric processes that contribute to storms and precipitation across the continental divide and that may lead to major flooding events in western Canada.
Past field experiments focused on cold season precipitation such as rain–snow transitions and snowfall were held in mountainous regions around the world. In North America, the occurrence of rain–snow transitions has been studied in the Western Cordillera of the United States for many decades. This includes research in the Sierra Nevada (Marwitz, 1986), in Washington state with the Improvement of Microphysical Parameterization through Observational Verification Experiment (IMPROVE; Stoelinga et al., 2003) as well as the Olympic Mountains Experiment (OLYMPEX; Houze et al., 2017), and in the Idaho Mountains to study orographic precipitation and weather modification (Tessendorf et al., 2019). In the foothills of the Canadian Rockies in Alberta, the Foothills Orographic Precipitation Experiment (FOPEX; Smith, 2008) studied the changes in precipitation amount and elevation along an east–west transect from 2001 to 2005. Other projects around the world were also held to study cold season precipitation processes such as in the Swiss Alps (Steiner et al., 2003) as well as in China, where a recent field study occurred in the Haituo Mountains north of Beijing (Ma et al., 2017). Nevertheless, none focused specifically on collecting high-resolution automatic and manual precipitation data simultaneously across a major continental divide using a combination of sophisticated instruments such as micro rain radars, laser disdrometers, and microphotography, as well as using Doppler light detection and ranging instruments (lidars) to measure air flow at two elevations in mountainous terrain.
SPADE expands upon a previous study and field campaign by Thériault et al. (2018) in March and April 2015 that investigated precipitation characteristics and associated atmospheric driving mechanisms on the eastern slopes of the Canadian Rockies. Although that field campaign occurred during a period of above-normal temperatures and less precipitation than normal, 17 precipitation events were observed. Precipitation events were categorized as either upslope (easterly) or downslope (westerly) flow, and the precipitation events associated with downslope flows typically had deeper precipitation layers and greater instability (Thériault et al., 2018). It was also observed that liquid, solid, and mixed-phase precipitation could all occur within the same event. Of the solid precipitation particles that were observed, 62 % of those particles were rimed, with rimed irregular particles being the most common particle type. Additionally, rimed and unrimed particles were observed simultaneously during precipitation events, although the riming of particles was independent of whether flows were westerly or easterly (Thériault et al., 2018).

Figure 1Map of the SPADE field campaign domain in British Columbia and Alberta with the location of the field sites (white dots), which are Nipika Mountain Resort (NMR), Storm Mountain Lodge (SML), Fortress Mountain Powerline (FMP), Fortress Junction Service (FJS), the University of Calgary Biogeoscience Institute (BGI), the major city of Calgary (grey dot), and the continental divide (red line). Local rivers are shown in blue and labelled. The inset map shows the SPADE field campaign area (red outline) in relation to western Canada.
The SPADE domain spans both the western and eastern sides of the continental divide in the Canadian Rockies (Fig. 1) from 117 to 114∘ W longitude and 50 to 52∘ N latitude. This region is subject to spatially variable weather conditions, with large orographic features acting as the major catalyst for precipitation. The highest peak in the domain is Mount Assiniboine, at an elevation of 3612 m above sea level (a.s.l.). The elevation of the continental divide varies from 1130 to over 3600 m a.s.l. Meteorological data over the continental divide remain sparse and predominantly lie in the valleys where sites are accessible by road and AC power is more readily available (Vionnet et al., 2020). There are even fewer stations at higher elevations, hence the paucity of meteorological data over high-elevation regions (Pepin et al., 2015; Hernández-Henríquez et al., 2018). Short, cool summers and long, cold winters characterize the region's climate. Precipitation typically peaks in June (Liu et al., 2016) with 60 % of the precipitation falling as snow in the mountains, which can occur in all months (DeBeer and Pomeroy, 2010). Maximum snow water equivalent (SWE) occurs in May and decreases throughout June and early July (Pomeroy et al., 2016). The three main atmospheric circulation types that induce snow to the Canadian Rocky Mountains were categorized by Moran et al. (2007) as northwesterly, westerly, and leeside (upslope). Westerly and northwesterly flows often result in significant precipitation accumulation on the western side of the continental divide, while upslope (easterly) flows often result in heavy precipitation and greater accumulation on the eastern side of the continental divide. Upslope events typically occur from March–May (Sinclair and Marshall, 2009). Additionally, several significant flooding events have recently impacted the eastern slopes of the Canadian Rockies such as in June 2002 (Szeto et al., 2011), June 2005 (Ou, 2008; Shook, 2016), and the recent major flooding in June 2013 (Pomeroy et al., 2016; Liu et al., 2016; Kochtubajda et al., 2016). Whitfield and Pomeroy (2016) showed that flooding due to rain-on-snow events occurred more frequently in the late 19th and early 20th centuries than it does in the more recent period.
The objective of this paper is to describe the methods of data collection during the SPADE project. It fills in key gaps in the otherwise well-instrumented hydrometeorological measurements and long-standing research conducted at Fortress Mountain, a Canadian Rockies Hydrological Observatory (https://research-groups.usask.ca/hydrology/science/research-facilities/crho.php#Overview, last access: 16 June 2020). Section 2 outlines the study area and its climatology. Section 3 describes the instrumentation used and specific observations conducted during the project, and Sect. 4 provides examples of the meteorological variables and observations. Finally, Sect. 5 details the online location of the database, with concluding remarks in Sect. 6.
The study region consisted of two main areas separated by the continental divide. Table 1 summarizes information on the SPADE field sites. On the eastern side, there were two main field sites and two secondary sites. The main sites were (i) Fortress Mountain Powerline (FMP) at 2076 m a.s.l. and (ii) Fortress Junction Service (FJS), located in a high-elevation valley (1580 m a.s.l.) along Alberta Provincial Highway No. 40 (Fig. 1). FMP was chosen as it is the primary field site in the Canadian Rockies Hydrological Observatory (https://research-groups.usask.ca/hydrology/science/research-facilities/crho.php#Overview), operated by the University of Saskatchewan Centre for Hydrology, and is already well-instrumented with hydrometeorological equipment. It is the site of long-standing research (Smith et al., 2017; Conway et al., 2018; Schirmer and Pomeroy, 2020). A maintained road from FJS up to FMP allowed researchers to collect meteorological data during a precipitation phase transition along the mountainside. The frequent phase transition between FJS and FMP justified having two main sites located at valley floor and at higher elevation. Select data were also gathered on an intermittent basis at two secondary sites but not simultaneously. These were (i) from the University of Calgary Biogeoscience Institute (BGI) at 1418 m a.s.l. located on the eastern side of the continental divide, off Alberta Highway No. 40, ∼ 25 km north of FMP, and (ii) from the Storm Mountain Lodge (SML) at 1723 m a.s.l. that was used temporarily on 7 June 2019 in anticipation of a forecasted significant precipitation event. SML is located approximately 5 km east of the continental divide, near the midway point between the Fortress Mountain and NMR sites, along BC Highway 93 (Fig. 1).
Table 1A summary of the field sites that were used during the field campaign including information about their location, elevation, access to AC power, and dates that instruments were operational.
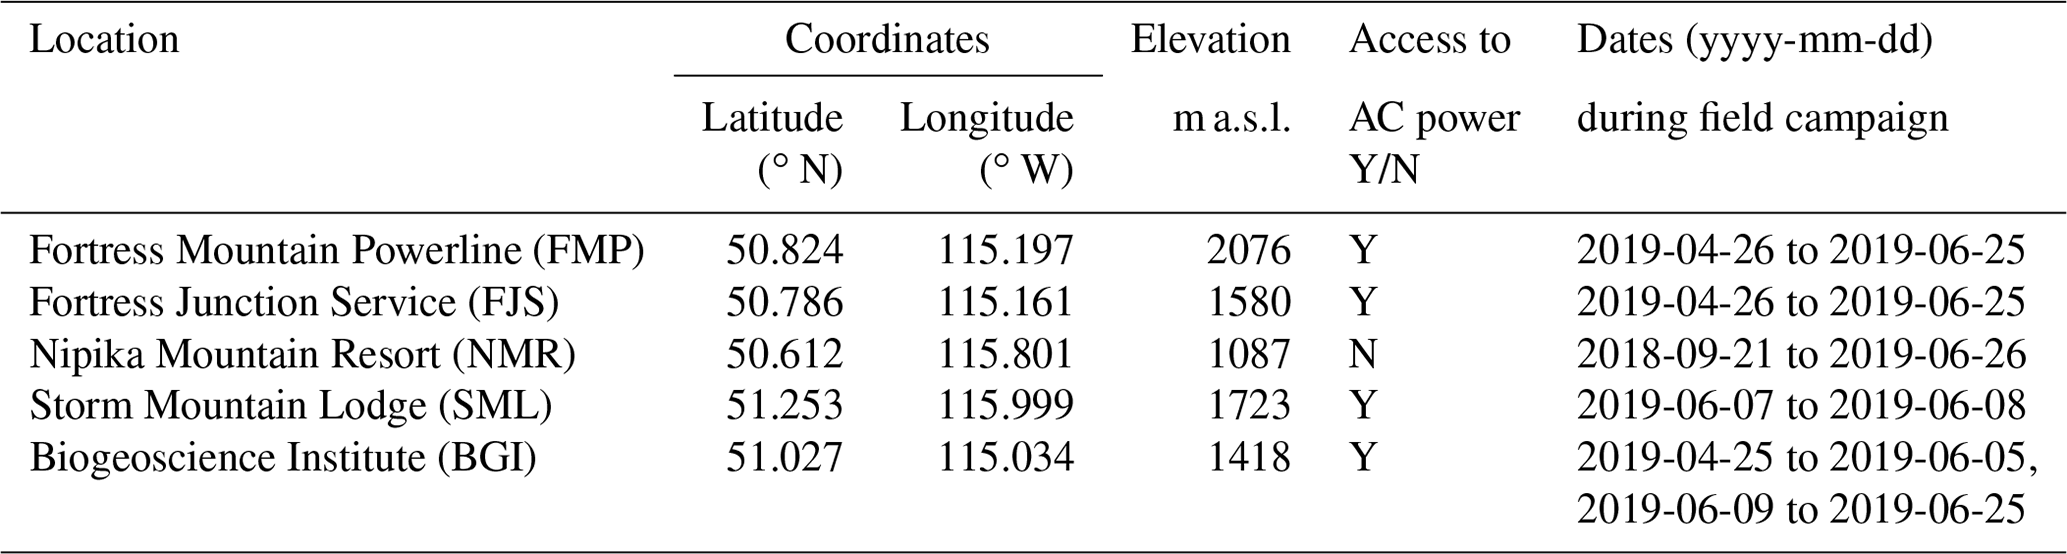
The Nipika Mountain Resort (NMR) site was located in a valley on the western side of the divide and was chosen to be comparable to FJS on the eastern side of the divide (Fig. 1). It approaches the latitude of the Fortress Mountain area and has an elevation of 1087 m a.s.l. NMR is easily accessible via an active logging road off the Banff–Windermere Highway (BC Highway 93). This area has a paucity of active meteorological stations, and basic weather instruments were deployed on 21 September 2018, well before the start of the field experiment, to collect baseline data.
3.1 Instruments used
Varying meteorological equipment was deployed at each field location (Fig. 2). A complete list of all instruments used and their locations is given in Appendix A, Table A1. All data available in the repository are in UTC. The appendix also includes a table giving the uncertainty of each instrument (Table A2). The three main sites were nearly identically instrumented, but due to power constraints and limited equipment, NMR was not equipped with a Doppler lidar. Cameras were also set up at FMP and FJS to monitor conditions while observers were not on site. The instruments are described in detail in Sect. 3.2–3.9. The FMP site is also known as the Fortress Mountain Snow Laboratory and operates within the regional Canadian Rockies Hydrological Observatory. Other projects and instrumentation at this site are described in Smith et al. (2017), Conway et al. (2018), and Schirmer and Pomeroy (2020). Only the MRR-2 files were processed and quality controlled using the Maahn and Kollias (2012) algorithm. All other data files have not been processed or quality controlled by the authors and are the output of the instrument or manufacturer's software.
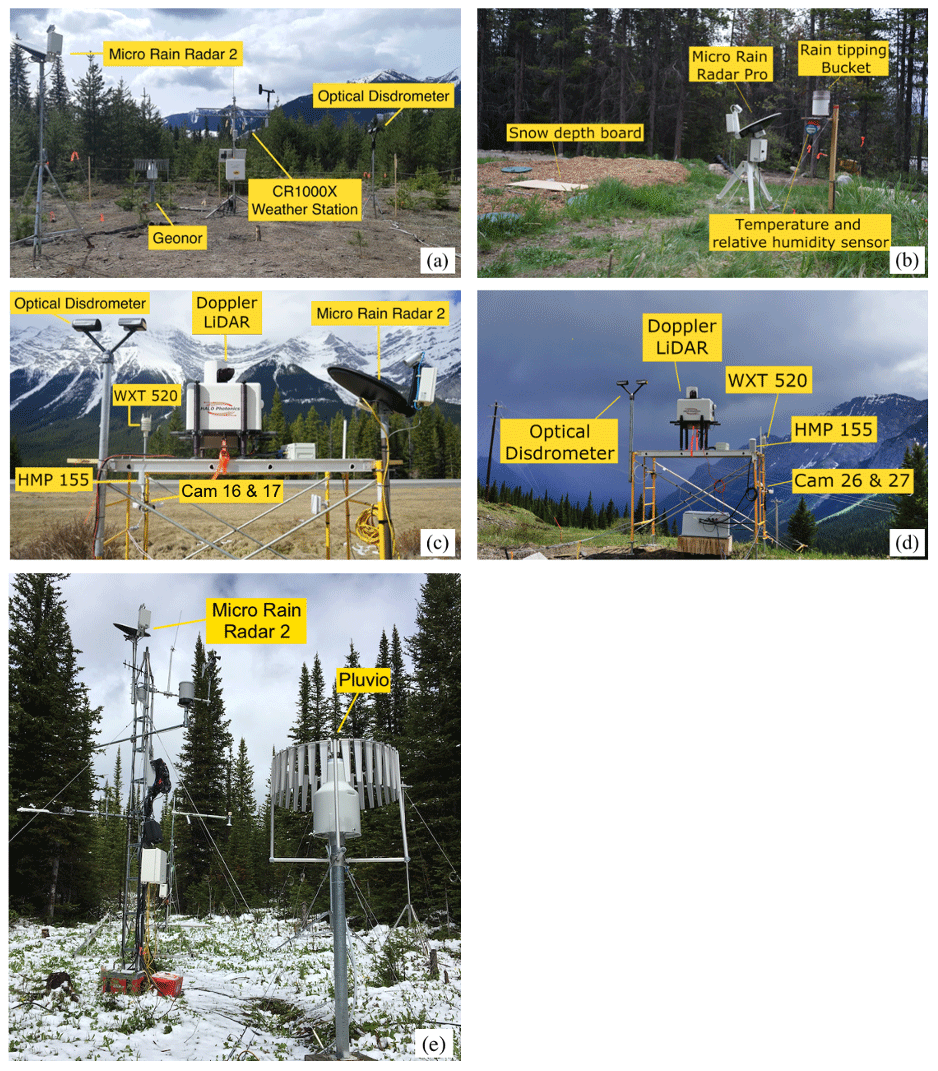
Figure 2Instrumentation set-up at (a) Nipika Mountain Resort (NMR), (b) Storm Mountain Lodge (SML), (c) Fortress Junction Service (FJS), and (d, e) Fortress Mountain Powerline (FMP) with instruments labelled. See Fig. 1 for location of the field sites on a map. Note that not all instruments may be in the photos as some are located a short distance from the scaffolding. Only the instruments used are labelled. The Geonor at Nipika Mountain Resort is located approximately 10 m from the weather station mast. A Pluvio was also used at FJS and was located approximately 7 m from the other instruments on the scaffold. The instruments in panel (d) are located approximately 200 m from the instruments in panel (e). The Pluvio at FMP is located approximately 3 m from the MRR-2 weather mast. A complete list of the instruments is given in Appendix A.
3.2 Weather station
A 3 m tall meteorological station from Campbell Scientific Canada was set up at NMR on 21 September 2018 (Fig. 3a). A CR1000X data logger powered by a 30 W solar panel and 12 V 42 AH battery was used to operate sensors and collect data. The data logger was configured to sample every 60 s and generate 15 min averages for baseline data from 21 September 2018; this was changed to 5 min average data on 6 May 2019 for the remainder of the field campaign. Given the reliance on a solar-charged battery, the 5 min interval was chosen as a compromise between high temporal data and a limited power supply to ensure that there were no outages and resulting losses of critical data. Parameters measured were 2 m air temperature and relative humidity (HC2-S3-L), 3 m wind speed and direction (RMY 05103AP-L), snow depth (SR50), atmospheric pressure (CS106), soil and snow temperatures at a depth of 17 cm below ground (i.e., −17 cm) and heights of 15 and 33 cm above bare ground (T109), and precipitation using a Geonor (T200B) (see Sect. 3.6.4).
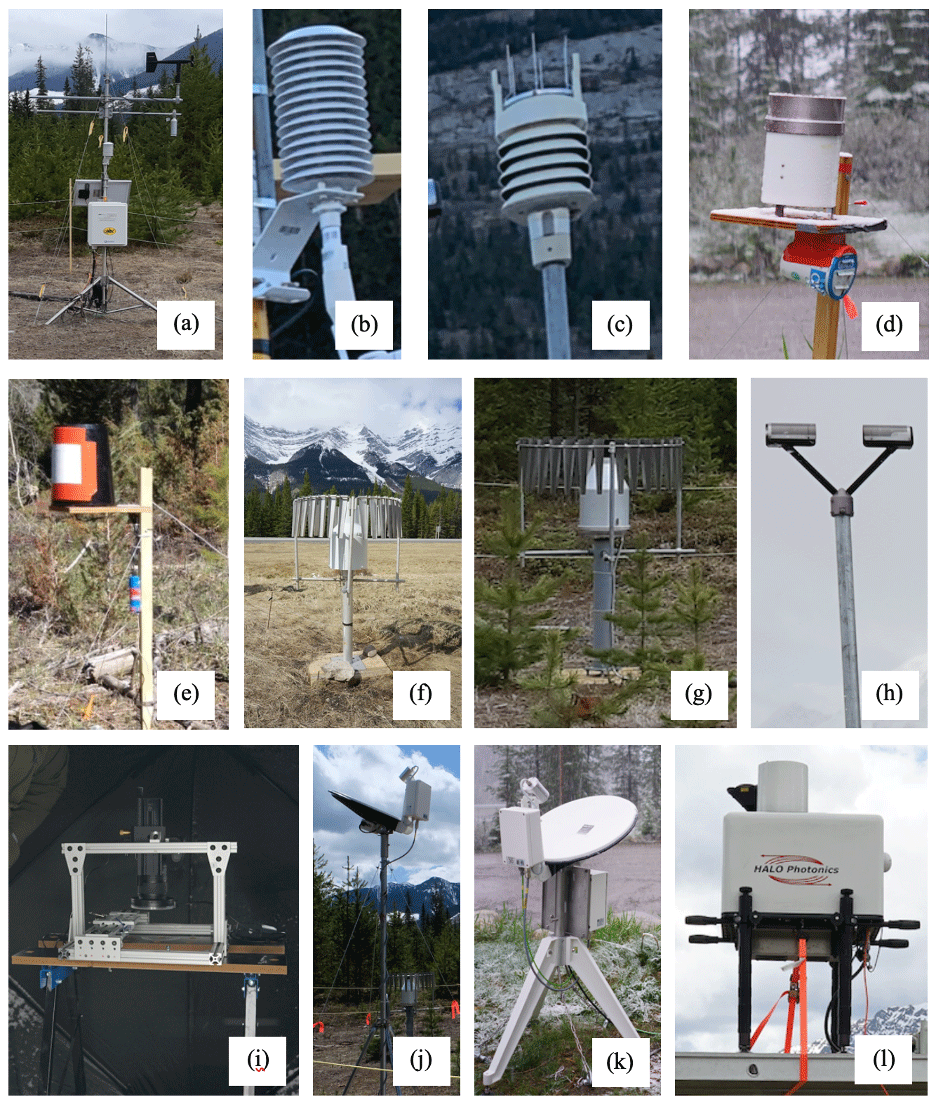
Figure 3Photos of the instruments used in the field campaign. (a) Weather station, (b) HMP155, (c) WXT520, (d) HOBO tipping bucket, (e) Davis tipping bucket, (f) Pluvio, (g) Geonor, (h) optical disdrometer, (i) microphotography, (j) MRR-2, (k) MRR-PRO, and (l) lidar.
3.3 HMP155
A Vaisala HMP155 air temperature and relative humidity sensor was deployed on the scaffolding at the FMP and FJS field sites (Fig. 3b) at a height of 195 and 168 cm above ground level (a.g.l.), respectively. Data were recorded at 1 min resolution throughout the SPADE field campaign from 24 April–26 June 2019.
3.4 WXT520
A Vaisala WXT520 was deployed on the scaffolding at the FMP and FJS field sites (Fig. 3c) at a height of 265 and 238 cm a.g.l., respectively. The WXT520 measures six weather parameters in one sensor, including wind speed and direction, precipitation, atmospheric pressure, air temperature, and relative humidity (Vaisala, 2012). Data were collected at 1 min resolution throughout the SPADE field campaign from 24 April–26 June 2019.
3.5 HOBO T–RH
The HOBO Pro V2 temperature and relative humidity (T–RH) (U23-001) is a weatherproof data logger with built-in temperature and relative humidity sensors. The HOBO T–RH was temporarily deployed at SML during the 7 June 2019 precipitation event, and data were collected at 5 min resolution throughout the storm. The instrument was housed in a temporary radiation shield attached to a wooden post at 120 cm a.g.l. in a clearing and was level to the ground. This sensor was primarily used for the SML deployment to differentiate whether air temperature was below freezing during a storm event, not to explicitly record high-accuracy temperature and humidity values.
3.6 Precipitation gauges
Several types of precipitation gauges were installed and used during the field campaign. At our three main field sites, we used shielded weighing gauges (OTT Pluvio and Geonor). These shielded gauges are well-known for their accuracy and have been used interchangeably by Environment and Climate Change Canada (Milewska et al., 2019). Tipping-bucket rain gauges were installed at our secondary field sites (HOBO and Davis tipping-bucket rain gauges) due to the remoteness of the locations and logistical and power constraints. The HOBO tipping bucket had been previously tested in the field and showed good accuracy when compared to the Geonor for rain. Additional efforts were made to reduce wind-induced undercatch by placing the gauges in sheltered areas and to reduce evaporative losses by removing the debris screens. No adjustment for wind undercatch of solid precipitation was performed on the archived data, and they should be used with caution.
3.6.1 HOBO tipping-bucket rain gauge
The HOBO tipping-bucket rain gauge (TBRG) (RG3-M) measures liquid precipitation at a resolution of 0.2 mm per tip (Onset, 2019) and was recorded using an Onset HOBO data logger. Data were only collected when a tip occurred. The TBRG was temporarily deployed at SML during the 7 June 2019 precipitation event. The instrument was attached to a wooden post at 134 cm a.g.l. in a clearing and was level to the ground (Fig. 3d).
3.6.2 Davis Instruments tipping-bucket rain gauge
Three Davis Instruments TBRGs (7852) were deployed on 12 May 2019 at 23 km (1198 m a.s.l.), 32.5 km (1220 m a.s.l.), and 47 km (1667 m a.s.l.) on the Cross River Resource Road (Fig. 3e). The highest-elevation location was selected because it was the closest point to the continental divide on the western side that was vehicle accessible from NMR. The other locations were selected to create a transect between the highest-elevation gauge and NMR where gauges were roughly equidistant. Liquid precipitation was measured at a resolution of 0.2 mm per tip and recorded using Odyssey rain gauge data loggers. Data were only collected when a tip occurred. Site visits to these remote locations were conducted every 2 weeks to download data and inspect gauges.
3.6.3 Pluvio
The OTT Pluvio family of precipitation gauges determines precipitation intensity and amount by determining the weight of the collecting bucket every 6 s with a resolution of 0.001 mm (OTT, 2010). The amount is summed every minute. Two Pluvio precipitation gauges placed in a single-Alter shield were used; one was previously installed at FMP (an OTT Pluvio1) by the University of Saskatchewan Centre for Hydrology, and the other was installed on 24 April 2019 at FJS (OTT Pluvio2) for the duration of the SPADE field campaign (Fig. 3f). No filtering or processing has been applied to these data.
3.6.4 Geonor
A three-sensor Geonor T-200B all-weather precipitation gauge in a single Alter shield was installed at NMR on 21 September 2018 on a pedestal mounted into a heavy lumber base, and the orifice was levelled with respect to the ground (Fig. 3g). The CR1000X data logger was configured to sample the period average frequency from each vibrating wire sensor; this frequency is used to compute the average amount of liquid equivalent precipitation of the three sensors and the standard deviation across them. Data collection was set at a 15 min interval from 21 September 2018 and a 5 min interval from 6 May 2019 onward for the intensive field campaign. The resultant time series obtained from the bucket weight describes cumulative precipitation, including the average and standard deviations of the three sensor depths. No filtering or processing has been applied to these data.
3.7 Manual observations and microphotography
Manual weather observations were conducted at the FMP and NMR field sites during precipitation events throughout the field campaign, and at SML during the 7 June 2019 precipitation event. Manual observers were on site during storms to report precipitation type and to take microphotographs of snow particles. Every 10 min, manual observations of precipitation type (solid, liquid, or mixed) were reported, and microphotographs of snow particles were taken when conditions allowed. Microphotography equipment was situated at NMR; however, images were not taken because insufficient solid precipitation particles were observed. Microphotographs of snow particles were taken following the methods established in Gibson and Stewart (2007) and Thériault et al. (2012, 2018). Images at FMP were made with a Nikon D3200 digital single-lens reflex (SLR) camera and at SML with a Nikon D80 digital SLR camera, both fitted with a 60 mm macro lens and flash. The photography equipment was mounted vertically (Fig. 3i), and precipitation particles were gathered on a black-velvet- or felt-covered collection pad that was placed outside for a period of time, typically 5 s to 2 min, depending on the rate of snowfall. The collection pad was then brought inside an unheated fishing tent, and a series of nine images were taken using a predefined method that ensured uniform results regardless of the observer. Due to the differing particle size and amount of light available for each photo, the camera settings varied throughout the project, but are noted in the metadata file. An image of the millimetre divisions on a ruler was captured periodically to provide a scale for each series of photographs.
3.8 Laser-optical disdrometer
Three OTT Parsivels, which are laser-optical disdrometers and present weather sensors, were deployed at FMP and FJS on 24 April 2019 and at NMR on 1 May 2019 for the duration of the field campaign (Fig. 3h). This instrument measures the size and speed of falling hydrometeors with the goal of classifying hydrometeor type and retrieving precipitation particle size distribution. These raw data can also be used to determine the precipitation type, amount, intensity, and kinetic energy, as well as the equivalent radar reflectivity. OTT Parsivel laser-optical disdrometers function with two sensor heads facing each other, in which one head is a transmitter that emits radiation (at the 650 nm wavelength in the red band) in a horizontal plane, and the other head is a receiver that senses how much of that radiation is received. The instrument measures the size of the hydrometeor by determining the amount of radiation that is blocked by the particle diameter. The velocity of the hydrometeor is estimated based on the time that a particular hydrometeor blocks the radiation between the transmitter and receiver. Each particle falling though the beam is classified into 32 fall speed and 32 diameter bins. An OTT Parsivel was installed at FMP at a 300 cm height and at FJS at 277 cm, and an OTT Parsivel2 was installed at NMR at 256 cm. The OTT Parsivel2 is similar in operation to the first Parsivel model and retrieves particle fall speed and size every 10 s, providing a cumulative sum every minute.
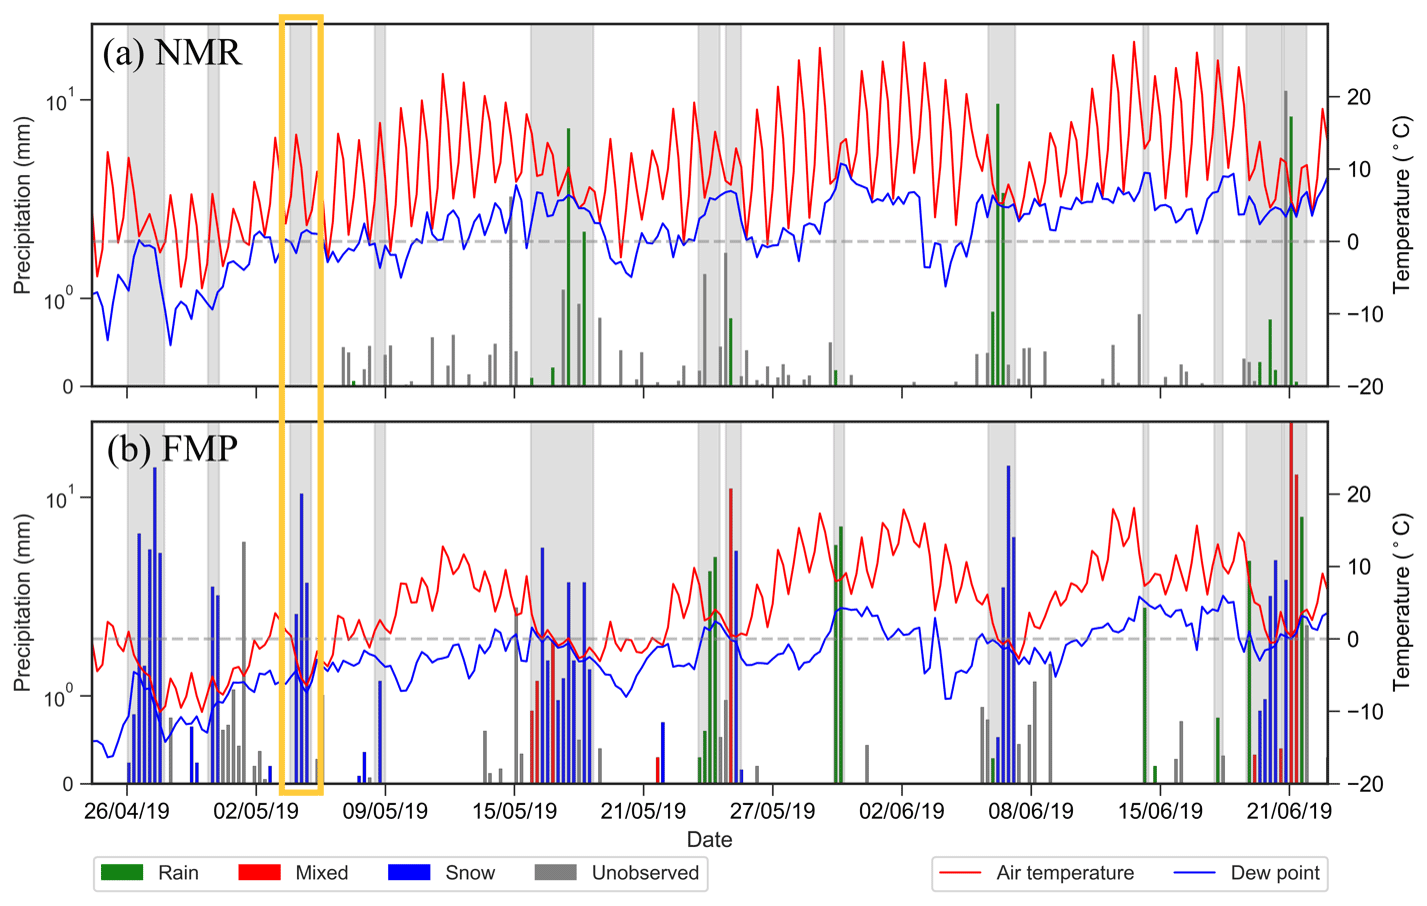
Figure 4Sub-hourly temperature (red line), dew point (blue line), and log-scale precipitation amount (bars) at (a) NMR and (b) FMP for the duration of the SPADE field campaign (24 April–26 June 2019). Precipitation is subdivided into rain (green bars), snow (blue bars), or mixed phase (red bars) based on manual observations. Grey bars indicate that there were no manual observations during that time. The grey shading indicates times when there were precipitation events. The yellow box indicates the time period of the data example in Sect. 4.2.
3.9 Micro rain radar
The micro rain radar (MRR) is a vertically pointing, frequency-modulated continuous wave radar that is used to measure hydrometeor reflectivity and Doppler velocity in a vertical profile. Three MRR-2 instruments were used in this study and were deployed at the three main sites: (1) at FMP installed at a height of 533 cm above bare ground with a vertical resolution of 200 m, (2) at FJS installed at 235 cm above bare ground with a vertical resolution of 35 m, and (3) at NMR installed at 273 cm above bare ground with a vertical resolution of 200 m (Fig. 3j). In addition, one MRR-PRO was primarily located at BGI for the field campaign but was deployed at SML on 7 June 2019 with a vertical resolution of 30 m (Fig. 3k). The MRR-2 version profiles the atmosphere in 32 range gates, operating at a 24.23 GHz frequency (K-band) (METEK, 2010). The newer MRR-PRO operates at the same frequency and profiles the atmosphere with a maximum of 254 range gates and the data are available in NetCDF format (METEK, 2017). The MRR-PRO used in SPADE was operated with 128 range gates, 30 m vertical resolution, 64 lines per spectrum, and 0.19 m s−1 speed resolution. The MRR-2 retrievals were processed with a different noise removal algorithm (Maahn and Kollias, 2012) to increase the instrument sensitivity to −14 dBZ and, therefore, enhancing the detection of light solid precipitation. The MRR also identifies the height of the melting layer through the detection of an abrupt change in reflectivity (i.e., bright band) when the hydrometeor phase changes from solid to liquid state (METEK, 2009).
3.10 Doppler lidar
Identical Halo Photonics StreamLine XR scanning Doppler lidars were installed at FMP and FJS on 24 April 2019 for the duration of the field campaign (Fig. 3l). Doppler lidars have demonstrated their usefulness in complex, mountainous terrain such as those in the SPADE domain (Banta et al., 1997, 1999; Darby et al., 1999; Fast and Darby, 2003; Mariani et al., 2018a, b). The Doppler lidar emits a pulsed laser and measures the Doppler shift and the intensity of the signal backscattered by small-sized targets (i.e., aerosols). The lidars operate at 1.5 µm using an 80 µJ pulsed laser at 10 kHz with a range resolution of 3 m (60 m overlapping range gates). This range gate length was chosen so that there would be a small vertical overlap between the lidar located at FJS and the lidar located at FMP. The lidars have full scanning capability, allowing them to conduct measurements at any elevation and azimuth, similar to most weather radars. The first measurement is 60 m from the lidar due to the lidar's blind spot. Both lidars were subjected to identical quality control procedures based on their signal-to-noise ratio (SNR) within each range gate and filtering outliers and returns from clouds and rain droplets (Mariani et al., 2018a). The maximum range of the lidar is limited by the sensitivity (SNR) and a minimal value of 1.003. This was used as a lower threshold based on the minimal value of 1.0008 from Päschke et al. (2015) and adjusted according to lower SNR values observed at FMP, due to a lower amount of aerosols. The lidars used identical repeating 10 min scan sequences, performing vertical stare, constant 4∘ elevation 360∘ azimuth plan position indicator, two perpendicular (36 and 167∘) constant-azimuth over-the-top range height indicators, Doppler beam swinging, and eight beam velocity–azimuth display (VAD) scans, the latter two of which were used to obtain high-resolution vertical wind profile data.
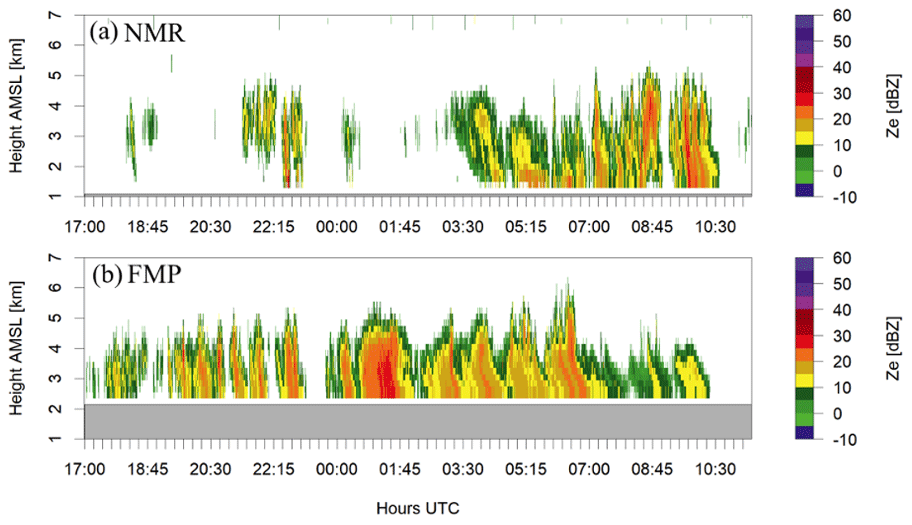
Figure 5MRR-2 vertical profile of reflectivity (Ze) from 17:00 UTC 4 May–11:30 UTC 5 May for (a) NMR and (b) FMP. The grey shading is below ground level. Data from the MRR-2 have been processed using Maahn and Kollias (2012).
4.1 Overview
Over the course of the field campaign, 13 precipitation events were observed, of which four were categorized as major (> 20 mm of precipitation at FMP) (Fig. 4). The storms were caused by a variety of conditions and resulted in varying air temperatures, durations, amounts, and types of precipitation. The eastern side of the continental divide received more precipitation and was cooler than the western side. An example of some of the data collected during a storm is discussed in Sect. 4.2.
4.2 Storm 4–5 May 2019
Data from 17:00 UTC 4 May to 11:20 UTC 5 May 2019 highlight the disparity in meteorological conditions observed on either side of the divide throughout precipitation events. During this time, a total of 15.3 mm of precipitation was collected at FMP by the Pluvio1, with an average air temperature of −4.7 ∘C; this is in contrast to the 1.4 mm of precipitation collected at NMR by the Geonor with an average air temperature of 9.4 ∘C (Fig. 4). Using data from the MRRs, vertical bands of precipitation appear at both FMP and NMR (Fig. 5); however precipitation starts at FMP ∼ 10 h before it begins at NMR. Observers were on site at both FMP and NMR throughout the storm to conduct field observations of weather conditions. These manual observations, combined with data from the laser-optical disdrometer, indicate that precipitation at NMR was mainly liquid, whereas at FMP, precipitation was mainly snow, snow pellets, or mixed phase (Fig. 6). At FMP, observers took microphotographs of snow particles and their evolution throughout the course of the storm (Fig. 7). This approach allows for an analysis of the solid particle size distribution, in addition to providing another method for documenting the evolution of atmospheric conditions aloft. Observers at NMR were unable to take microphotographs due to the warm temperatures but observed that there was some mixed precipitation.
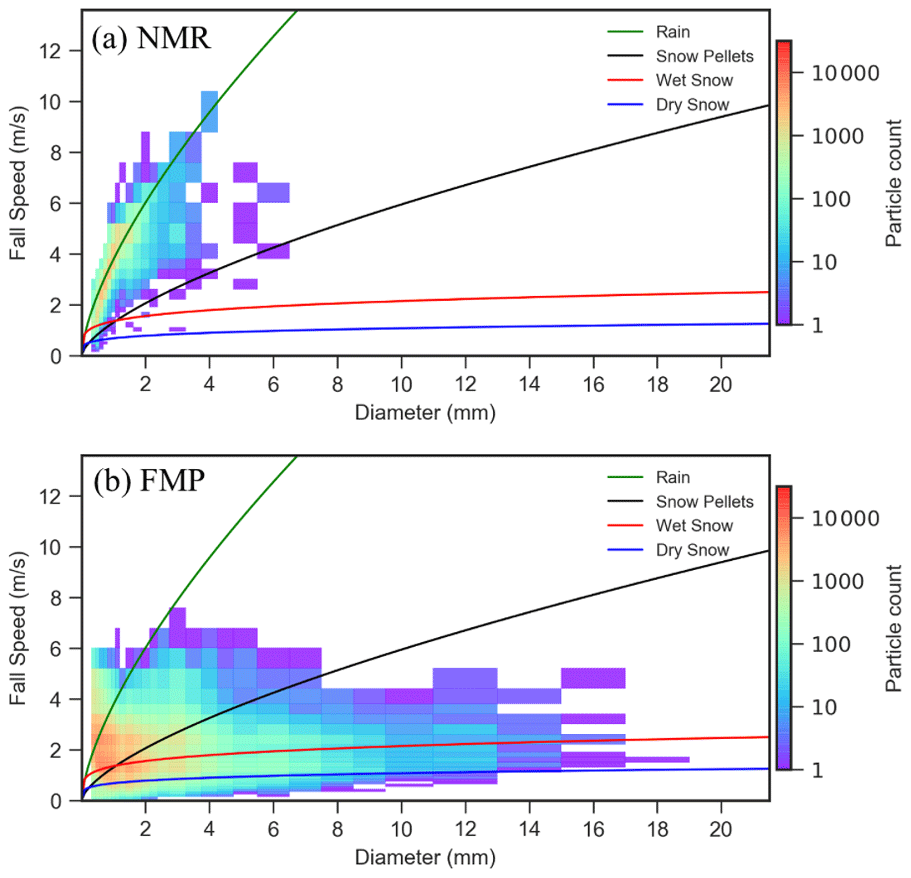
Figure 6The particle diameter and fall speed distribution of hydrometeors measured with a laser-optical disdrometer from 17:00 UTC 4 May–11:30 UTC 5 May at (a) NMR and (b) FMP. Rain (green line), wet snow (red line), dry snow (blue line), and snow pellet (black line) particles. The rain fall speed–diameter relationship is from Atlas and Ulbrich (1977), and the solid precipitation is from Rasmussen et al. (1999). The number of particles that fall in each fall speed–diameter bin is indicated by the colour.
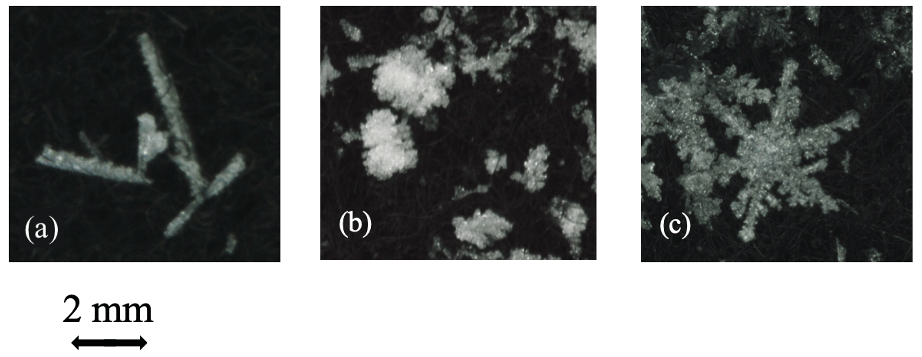
Figure 7Microphotography from FMP showing the changes in snow crystal type during the 4–5 May 2019 storm. (a) Needles observed at 23:55 UTC 4 May 2019, (b) graupel and rimed irregular particles observed at 01:21 UTC 5 May 2019, and (c) rimed dendrites and branches observed at 09:56 UTC 5 May 2019. Double arrow length indicates 2 mm for scale.
The SPADE dataset is available from the Federated Research and Data Repository (FRDR) and can be accessed at https://doi.org/10.20383/101.0221 (Thériault et al., 2020).
A valuable dataset was collected during the Storms and Precipitation Across the continental Divide Experiment that was held in April–June 2019 in the Canadian Rockies. SPADE was initiated to enhance our knowledge of the atmospheric processes leading to storms and precipitation across a large orographic feature by gathering meteorological data. This leads to a unique dataset to specifically address this critical issue of water redistribution and availability over North America. Furthermore, it augmented the large effort in monitoring hydrometeorological conditions in the Canadian Rockies.
A combination of manual and automatic measurements of precipitation and meteorological conditions at the surface and aloft were collected. These include information on the amount, type, and characteristics of precipitation particles, including particle size and fall speed, as well as 3D wind fields at lower and higher elevations of Fortress Mountain. Overall, data from the SPADE field campaign will contribute significantly to our understanding of precipitation processes across the continental divide from the synoptic-scale conditions leading to precipitation to the fine-scale processes associated with precipitation trajectories near the surface.
Table A1Detailed information about the instruments used during the field campaign including model number, measurements, units, and the location and dates that they were operational. n/a – not applicable
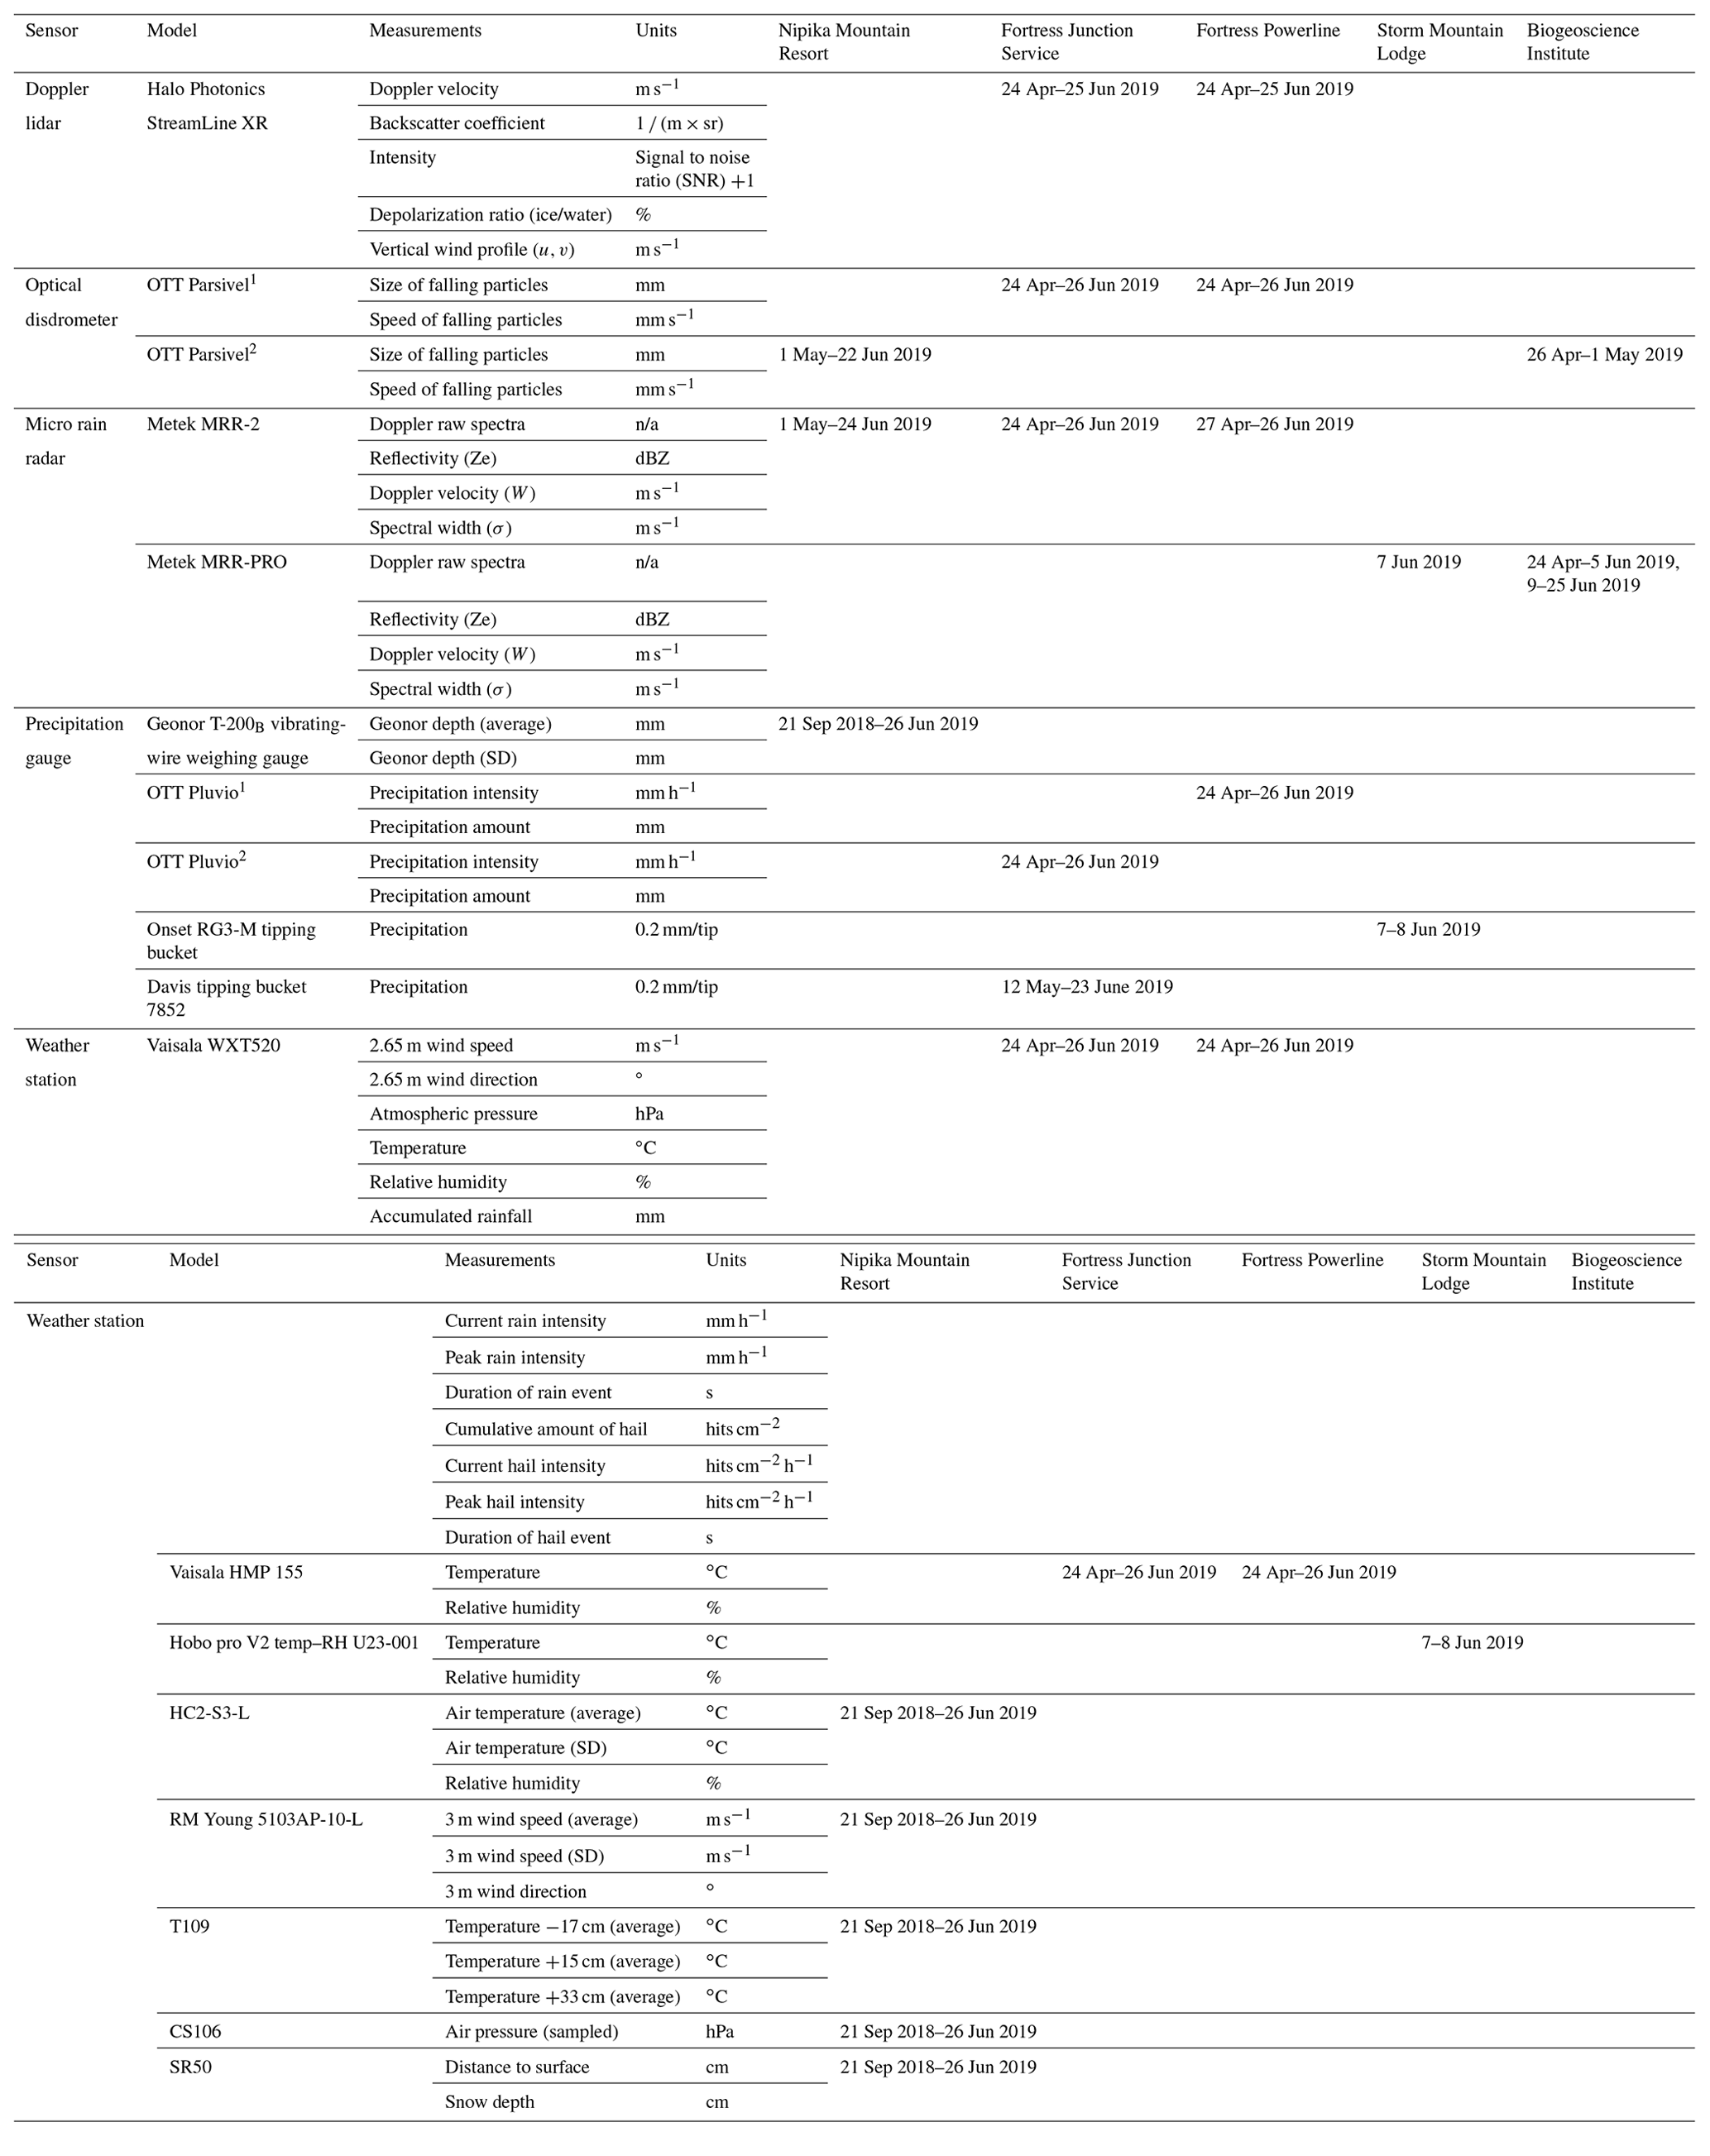
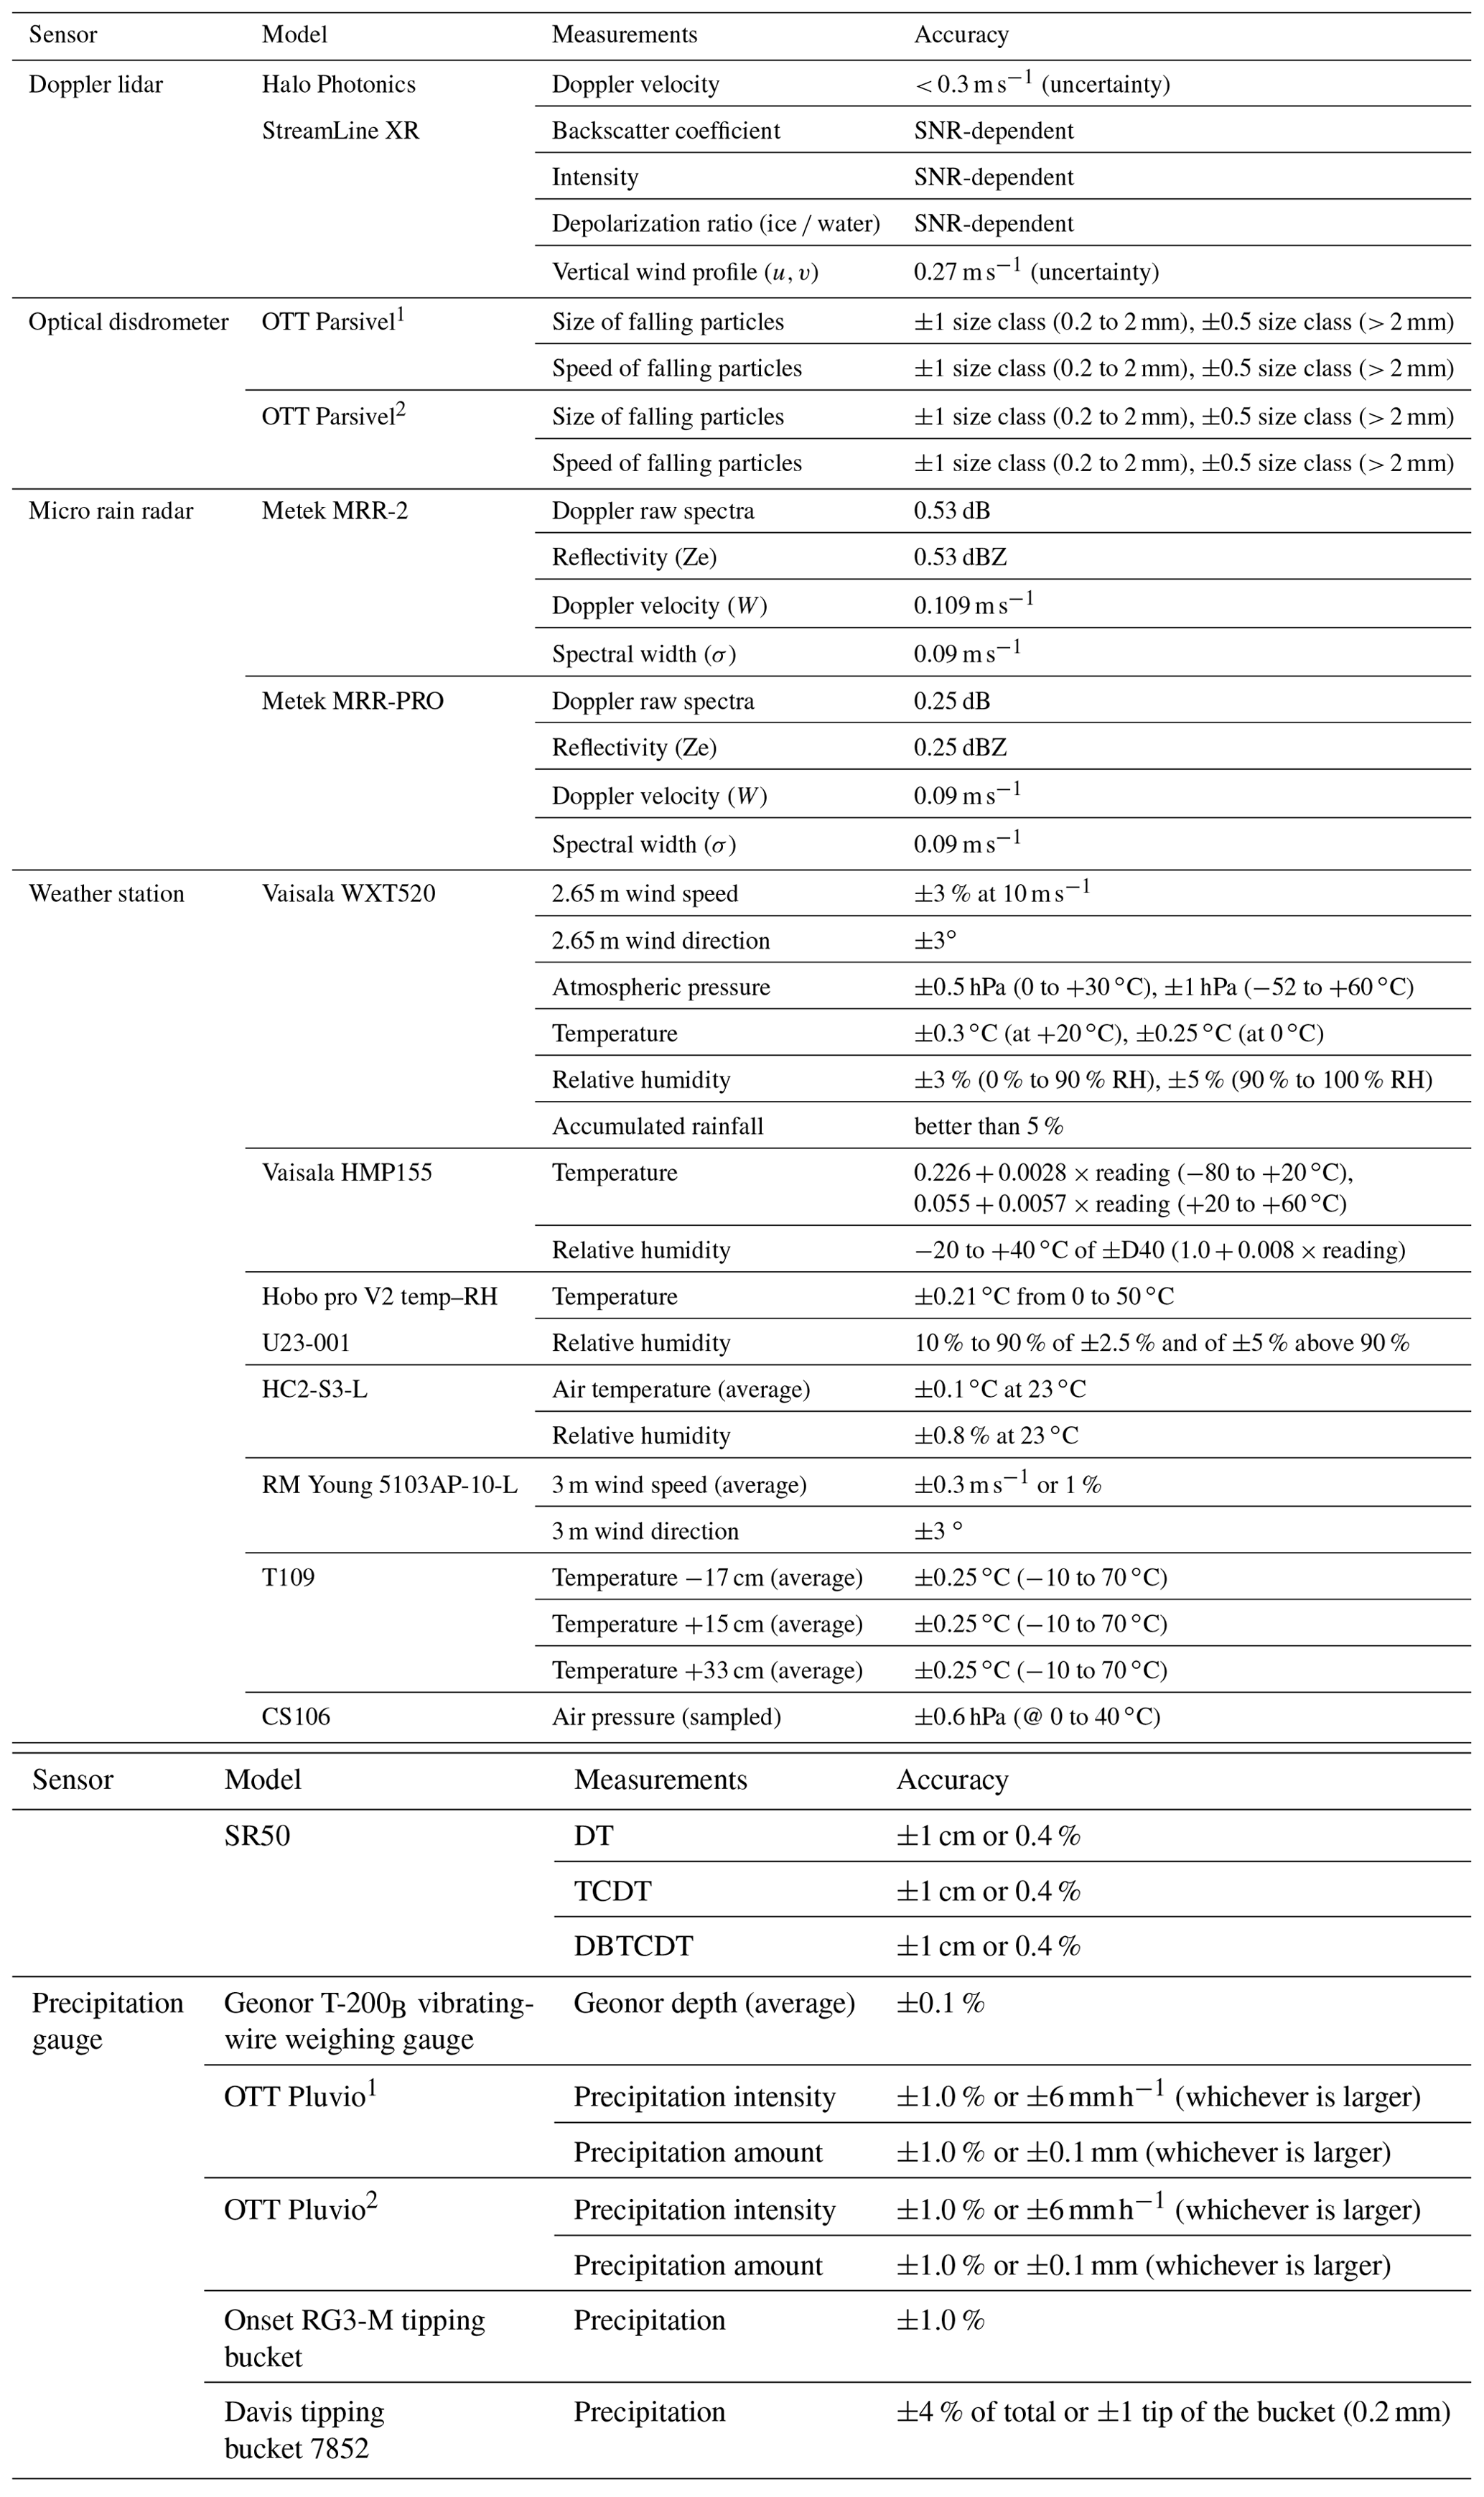
Table A2Summary of the instruments' accuracy found in the user's manual of each instrument. For all instruments except the lidar, only the variables found in the user's manual are listed. For the lidar the information is from the user's manual as well as from Mariani et al. (2020).
HMS wrote the first draft of the manuscript, as well as conducted some analyses. HDT, AB, and JMT conducted some scientific analyses and created plots. JMT, SJD, JA, and JWP designed and led the field project. JEM managed the deployment of the NMR weather station. HMS, JA, AB, ADL, SM, CHP, ML, HDT, JEM, SJD, JMT, RWC, ZM, and PR contributed to the writing and the editing of the manuscript. HMS, JA, AB, ADL, SM, CHP, ML, HDT, JEM, SJD, and JMT participated in the field campaign.
The authors declare that they have no conflict of interest.
Use of specific instrument manufacturers/models and suppliers mentioned in the manuscript and/or used in the field campaign is not a commercial endorsement of their products.
This article is part of the special issue “Hydrometeorological data from mountain and alpine research catchments”. It is not associated with a conference.
Funding was provided by the Global Water Futures programme, NSERC Discovery Grants (Julie M. Thériault, Stephen J. Déry, John W. Pomeroy, and Ronald E. Stewart), the Canada Research Chair programme (Julie M. Thériault, John W. Pomeroy), BC Real Estate Foundation, UNBC (Selina Mitchell), and NSERC undergraduate fellowship (Charlie Hébert-Pinard), NSERC CGS-M, and a FRQNT fellowship (Aurélie Desroches-Lapointe) to conduct scientific analysis. Thanks are due to CFI for providing funding for some instruments, particularly those at Fortress Mountain as well as Nipika Mountain Resort. Thanks are due to Cécile Carton (UQAM), Robin Heavens, Greg Galloway, Lindsey Langs, and the other researchers from the U. Saskatchewan Centre for Hydrology in Canmore who contributed during the field campaign; Adrienne Cunnings, Michelle Ives, and the staff at BGI; Lyle and Dianne Wilson and the staff at Nipika Mountain Resort, Fortress Mountain Resort, Fortress Junction Service, and Storm Mountain Lodge; John Rex at the BC Ministry of Forests, Lands, Natural Resource Operations and Rural Development for the use of the Davis tipping buckets; and Ronald E. Stewart (U. Manitoba) and Shawn Marshall (U. Calgary and ECCC) for their help with the project initiation. The authors would like to acknowledge the contribution of Environment and Climate Change Canada (ECCC) Observation-based Research Section to this work as well as Robert Reed and Michael Hardwood for assisting with the deployment of the ECCC instruments. Thanks are due to Craig Smith and the one anonymous referee for their constructive comments that led to an improved paper.
The field experiment during which the data were collected was funded by the Global Water Futures Storms and Precipitation Across the continental Divide Experiment (grant no. 418474-1234).
This paper was edited by J. Ignacio López-Moreno and reviewed by Craig Smith and one anonymous referee.
Atlas, D. and Ulbrich, C. W.: Path-and area-integrated rainfall measurement by microwave attenuation in the 1–3 cm band, J. Appl. Meteor., 16, 1322–1331, https://doi.org/10.1175/1520-0450(1977)016<1322:PAAIRM>2.0.CO;2, 1977.
Banta, R. M., Shepson, P. B., Bottenheim, J. W., Anlauf, K. G.,Wiebe, H. A., Gallant, A., Biesenthal, T., Olivier, L. D., Zhu, C.-J., McKendry, I. G., and Steyn, D. G.: Nocturnal cleansing flows in a tributary valley, Atmos. Environ., 31, 2147–2162, https://doi.org/10.1016/S1352-2310(96)00359-7, 1997.
Banta, R. M., Darby L. S., Kaufman, P., Levinson, D. H., and Zhu, C.-J.: Wind flow patterns in the Grand Canyon as revealed by Doppler lidar, J. Appl. Meteorol., 38, 1069–1083, 1999.
Conway, J. P., Pomeroy, J. W., Helgason, W. D., and Kinar, N. J.: Challenges in modelling turbulent heat fluxes to snowpacks in forest clearings, J. Hydrometeorol, 19, 1599–1616, https://doi.org/10.1175/JHM-D-18-0050.1, 2018.
Darby, L. S., Neff, W. D., and Banta, R. M.: Multiscale analysis of a meso-β frontal passage in the complex terrain of the Colorado Front Range, Mon. Weather Rev., 127, 2062–2081, https://doi.org/10.1175/1520-0493(1999)127<2062:MAOAMF>2.0.CO;2, 1999.
DeBeer, C. M. and Pomeroy, J. W.: Simulation of the snowmelt runoff contributing area in a small alpine basin, Hydrol. Earth Syst. Sci., 14, 1205–1219, https://doi.org/10.5194/hess-14-1205-2010, 2010.
Fast, J. D. and Darby, L. S.: An evaluation of mesoscale model predictions of down-valley and canyon flows and their consequences using Doppler lidar measurements during VTMX 2000, J. Appl. Meteorol., 43, 420–436, 2003.
Gibson, S. R. and Stewart, R. E.: Observations of ice pellets during a winter storm, Atmos. Res., 85, 64–76, https://doi.org/10.1016/j.atmosres.2006.11.004, 2007.
Hernández-Henríquez, M. A., Sharma, A. R., Taylor, M., Thompson, H. D., and Déry, S. J.: The Cariboo Alpine Mesonet: sub-hourly hydrometeorological observations of British Columbia's Cariboo Mountains and surrounding area since 2006, Earth Syst. Sci. Data, 10, 1655–1672, https://doi.org/10.5194/essd-10-1655-2018, 2018.
Houze Jr., R. A., McMurdie, L., Peterson, W., Schwaller, M., Baccus, W., Lundquist, J., Mass, C., Nijssen, B., Rutledge, S., Hudak, D., Tanelli, S., Mace, J., Poellot, M., Lettenmaier, D., Zagrodnik, J., Rowe, A., DeHart, J., Maddaus, L., and Barnes, H.: Olympic Mountains Experiment (OLYMPEX), B. Am. Meteorol. Soc., 98, 2167–2188, https://doi.org/10.1175/BAMS-D-16-0182.1, 2017.
Kochtubajda, B., Stewart, R. E., Boodoo, S., Thériault, J. M., Li, Y., Liu, A., Mooney, C., Goodson, R., and Szeto, K.: The June 2013 Alberta catastrophic flooding event – Part 2: Fine-scale precipitation and associated features, Hydrol. Process., 30, 4917–4933, https://doi.org/10.1002/hyp.10855, 2016.
Liu, A. Q., Mooney, C., Szeto, K., Thériault, J. M., Kochtubajda, B., Stewart, R. E., Boodoo, S., Goodson, R., Li, Y., and Pomeroy, J.: The June 2013 Alberta catastrophic flooding event: Part 1 – Climatological aspects and hydrometeorological features, Hydrol. Process., 30, 4899–4916, https://doi.org/10.1002/hyp.10906, 2016.
Ma, X., Bi, K., Chen, Y., Chen, Y., and Cheng, Z.: Characterisctics of winter clouds and precipitation over the mountains of northern Beijing, Adv. Meteorol., 2017, 1–13, https://doi.org/10.1155/2017/3536107, 2017.
Maahn, M. and Kollias, P.: Improved Micro Rain Radar snow measurements using Doppler spectra post-processing, Atmos. Meas. Tech., 5, 2661–2673, https://doi.org/10.5194/amt-5-2661-2012, 2012.
Mariani, Z., Dehghan, A., Sills, D. M., and Joe, P.: Observations of Lake-Breeze Events during the Toronto 2015 Pan-American Games, Bound.-Lay. Meteorol., 166, 113–135, https://doi.org/10.1007/s10546-017-0289-3, 2018a.
Mariani, Z., Dehghan, A., Gascon, G., Joe, P., Hudak, D., Strawbridge, K., and Corriveau, J.: Multi-instrument observations of prolonged stratified wind layers at Iqaluit, Nunavut, Geophys. Res. Lett., 45, 1654–1660, https://doi.org/10.1002/2017GL076907, 2018b.
Mariani, Z., Crawford, R., Casati, B., and Lemay, F.: A multi-Year evaluation of Doppler lidar wind-profile observations in the Arctic, Remote Sens., 12, 323, https://doi.org/10.3390/rs12020323, 2020.
Marwitz J.:A comparison of winter orographic storms over the San Juan Mountains and the Suerra Nevada, Meteor. Mon., 21, 109–114, https://doi.org/10.1175/0065-9401-21.43.109, 1986.
METEK: MRR Physical Basics, 5.2.0.1, available at: http://www.mpimet.mpg.de/fileadmin/atmosphaere/barbados/Instrumentation/MRR-physical-basics_20090707.pdf (last access: 12 August 2019), 2009.
METEK: Micro Rain Radar MRR-2, available at: https://metek.de/wp-content/uploads/2014/05/Datasheet_MRR-2.pdf (last access: 12 August 2019), 2010.
METEK: Micro Rain Radar MRR-PRO, available at: http://metek.de/wp-content/uploads/2016/12/20180206_Datenblatt_MRR-PRO.pdf (last access: 12 August 2019), 2017.
Milewska, E. J., Vincent, L. A., Hartwell, M. M., Charlesworth, K., and Mekis, É.: Adjusting precipitation amounts from Geonor and Pluvio automated weighing gauges to preserve continuity of observations in Canada, Can. Water Res. J., 44, 127–145, https://doi.org/10.1080/07011784.2018.1530611, 2019.
Moran, T. A., Marshall, S. J., Evans, E. C., and Sinclair, K. E.: Altitudinal gradients of stable isotopes in lee-slope precipitation in the Canadian Rocky Mountains, Arct. Antarct. Alp. Res., 39, 455–467, https://doi.org/10.1657/1523-0430(06-022)[MORAN]2.0.CO;2, 2007.
Onset: HOBO® RG3-M Data Logger, available at: https://www.onsetcomp.com/datasheet/RG3-M, last access: 1 October 2019.
OTT: Operating Instructions OTT Pluvio2 precipitation gauge, available at: https://www.ott.com/download/operating-instructions-precipitation-gauge-ott-pluvio2-1/ (last access: 9 October 2019), 2010.
Ou, A. A.: Meteorological analysis of four rainstorms that caused severe flooding in Alberta during June 2005, MS thesis, University of Alberta, Edmonton, Canada, 136 pp., 2008.
Päschke, E., Leinweber, R., and Lehmann, V.: An assessment of the performance of a 1.5 µm Doppler lidar for operational vertical wind profiling based on a 1-year trial, Atmos. Meas. Tech., 8, 2251–2266, https://doi.org/10.5194/amt-8-2251-2015, 2015.
Pepin, N., Bradley, R. S., Diaz, H. F., Baraer, M., Caceres, E. B., Forsythe, N., Fowler, H., Greenwood, G., Hashmi, M. Z., Liu, X. D., Miller, J. R., Ning, L., Ohmura, A., Palazzi, E., Rangwala, I., Schöner, W., Severskiy, I., Shahgedanova, M., Wang, M. B., Williamson, S. N., and Yang, D. Q.: Elevation-dependent warming in mountain regions of the world, Nat. Clim. Change, 5, 425–430, https://doi.org/10.1038/NCLIMATE2563, 2015.
Pomeroy, J. W., Stewart, R. E., and Whitfield, P. H.: The 2013 flood event in the South Saskatchewan and Elk River basins: Causes, assessment and damages, Can. Water Res. J., 41, 105–117, https://doi.org/10.1080/07011784.2015.1089190, 2016.
Rasmussen, R. M., Vivekanandan, J., Cole, J., Myers, B., and Masters, C.: The estimation of snowfall rate using visibility, J. Appl. Meteor., 38, 1542–1563, https://doi.org/10.1175/1520-0450(1999)038<1542:TEOSRU>2.0.CO;2, 1999.
Schirmer, M. and Pomeroy, J. W.: Processes governing snow ablation in alpine terrain – detailed measurements from the Canadian Rockies, Hydrol. Earth Syst. Sci., 24, 143–157, https://doi.org/10.5194/hess-24-143-2020, 2020.
Shook, K.: The 2005 flood events in the Saskatchewan River Basin: Causes, assessment and damages, Can. Water Resour. J., 41, 94–104, https://doi.org/10.1080/07011784.2014.1001439, 2016.
Sinclair, K. E. and Marshall, S. J.: Temperature and vapour-trajectory controls on the stable-isotope signal in Canadian Rocky Mountain snowpacks, J. Glaciol., 55, 485–498, https://doi.org/10.3189/002214309788816687, 2009.
Smith, C. D.: The relationship between monthly precipitation and elevation in the Alberta foothills during the foothills orographic experiment, in: Cold region atmospheric and hydrologic studies, The Mackenzie GEWEX Experience, edited by: Woo, M. Springer, Berlin, Heidelberg, 167–185, https://doi.org/10.1007/978-3-540-73936-4_10, 2008.
Smith, C. D., Kontu, A., Laffin, R., and Pomeroy, J. W.: An assessment of two automated snow water equivalent instruments during the WMO Solid Precipitation Intercomparison Experiment, The Cryosphere, 11, 101–116, https://doi.org/10.5194/tc-11-101-2017, 2017.
Steiner, M., Bousquet, O., Houze Jr., R. A., Smull, B. F., and Mancini, M.: Airflow within major Alpine river valleys under heavy rainfall, Q. J. Roy. Meteor. Soc., 129, 411–431, https://doi.org/10.1256/qj.02.08, 2003.
Stoelinga, M. T., Hobbs, P. V., Mass, C. F., Locatelli, J. D., Colle, B. A., Houze, R. A., Jr., Rangno, A., L., Bond, N. A, Smull, B. F., Rasmussen, R. M., Thompson, G., and Colman, B. R.: Improvement of microphysical parameterization through observational verification experiment, B. Am. Meteorol. Soc., 84, 1807–1826, https://doi.org/10.1175/BAMS-84-12-1807, 2003.
Stoelinga, M. T., Stewart, R. E., Thompson, G., and Thériault, J. M.: Chapter 7: Microphysical processes within winter orographic cloud and precipitation systems, Mountain Weather Research and Forecasting: Recent progress and current challenges, edited by: Chow, F. K., De Wekker, S. F. J., and Snyder, B. J., Springer Netherlands, 345–408, 2013.
Szeto, K., Henson, W., Stewart, R., and Gascon, G.L.: The catastrophic June 2002 Prairie rainstorm, Atmos.-Ocean, 49, 380–395, https://doi.org/10.1080/07055900.2011.623079, 2011.
Tessenforf, S. A., French, J. R., Friedrich, K., Geerts, B., Rauber, R. M., Rasmussen, R.M, Xue, L., Ikeda, K., Blestrud, D. R., Kunkel, M. L., Parkinson, S., Snider, J. R., Aikins, J., Faber, S., Majewski, A., Frasmick, C., Bergmaier, P. T., Janiszewski, A., Springer, A., Weeks, C., Serke, D. J., and Bruintjes, R.: A transformational approach to winter orographic weather modification research: The SNOWIE Project, B. Am. Meteorol. Soc., 100, 71–92, https://doi.org/10.1175/BAMS-D-17-0152.1, 2019.
Thériault, J. M., Rasmussen, K. L., Fisico, T., Stewart, R. E., Joe, P., Gultepe, I., Clément, M., and Isaac, G. A.: Weather observations on Whistler Mountain during five storms, Pure Appl. Geophys., 171, 129–155, https://doi.org/10.1007/s00024-012-0590-5, 2012.
Thériault, J. M., Hung, I., Vaquer, P., Stewart, R. E., and Pomeroy, J. W.: Precipitation characteristics and associated weather conditions on the eastern slopes of the Canadian Rockies during March–April 2015, Hydrol. Earth Syst. Sci., 22, 4491–4512, https://doi.org/10.5194/hess-22-4491-2018, 2018.
Thériault, J. M., Déry, S. J., Pomeroy, J. W., Stewart, R. E., Smith, H., Thompson, H., Bertoncini, A., Hébert-Pinard, C., Mitchell, S., Morris, J., Almonte, J., Lachapelle, M., Mariani, Z., and Carton, C.: Meteorological observations and measurements collected during the Storms and Precipitation Across the continental Divide Experiment (SPADE), April–June 2019, FRDR, https://doi.org/10.20383/101.0221, 2020.
Vaisala: User's Guide: Vaisala Weather Transmitter WXT520, available at: https://www.vaisala.com/sites/default/files/documents/M210906EN-C.pdf (last access: 22 October 2019), 2012.
Vionnet, V., Fortin, V., Gaborit, E., Roy, G., Abrahamowicz, M., Gasset, N., and Pomeroy, J. W.: Assessing the factors governing the ability to predict late-spring flooding in cold-region mountain basins, Hydrol. Earth Syst. Sci., 24, 2141–2165, https://doi.org/10.5194/hess-24-2141-2020, 2020.
Whitfield, P. H. and Pomeroy, J. P.: Changes to flood peaks of a mountain river: implications for analysis of the 2013 flood in the Upper Bow River, Canada, Hydrol. Process., 30, 4657–4673, https://doi.org/10.1002/hyp.10957, 2016.