the Creative Commons Attribution 4.0 License.
the Creative Commons Attribution 4.0 License.
 | 23 Dec 2020
Meteorological observations in tall masts for the mapping of atmospheric flow in Norwegian fjords
Birgitte Rugaard Furevik
Hálfdán Ágústsson
Anette Lauen Borg
Zakari Midjiyawa
Finn Nyhammer
Magne Gausen
Since 2014, 11 tall meteorological masts have been erected in coastal areas of mid-Norway in order to provide observational data for a detailed description of the wind conditions at several potential fjord crossing sites. The planned fjord crossings are part of the Norwegian Public Roads Administration (NPRA) Coastal Highway E39 project. The meteorological masts are 50–100 m high and located in complex terrain near the shoreline in Halsafjorden, Julsundet and Storfjorden in the Møre og Romsdal county of Norway. Observations of the three-dimensional wind vector are made at 2–4 levels of each mast with a temporal frequency of 10 Hz. The dataset is corroborated with observed profiles of temperature at two masts, as well as observations of precipitation, atmospheric pressure, relative humidity and dew point at one site. The first masts were erected in 2014, and the measurement campaign will continue until at least 2024. The current paper describes the observational setup, and observations of key atmospheric parameters are presented and put in context with observations and climatological data from a nearby reference weather station. The 10 min and 10 Hz wind data, as well as other meteorological parameters, are publicly available through the Arctic Data Centre (https://doi.org/10.21343/z9n1-qw63; Furevik et al., 2019).
- Article
(10406 KB) - Full-text XML
- BibTeX
- EndNote


In 2014, the Norwegian Public Roads Administration (NPRA) started an evaluation of the environmental conditions, i.e., wind, atmospheric turbulence, waves and currents, relevant for making the E39 road “ferry-free” between Kristiansand and Trondheim on the western coast of Norway. If realized, the project will include new crossings of eight of the largest fjords in Norway. The fjords are typically surrounded by steep mountains rising up to 500 m. Fjord widths are 2–7.5 km and water depths 200–1300 m. This requires a detailed understanding of the wind, wave and ocean current climate at the proposed crossings which is achieved partly through a large atmospheric and oceanographic measurement program.
In mid-Norway, new fjord crossings are planned in Vartdalsfjorden, Sulafjorden and Halsafjorden, as well as near Julsundet. The observational campaign started here in 2014 with a considerable increase in measurement effort in October 2016. The observational program will continue for at least 8 years but may be extended to 12 years or more. The program includes tall meteorological masts erected and operated by Kjeller Vindteknikk (KVT), equipped with sonic anemometers at several elevations, and observing at a temporal resolution of 10 Hz. The most recent masts are 70–100 m high, while the masts erected first have an elevation of ∼50 m. A number of wave buoys with meteorological and oceanographic measurements have also been installed. Similar measurement campaigns are carried out by the NPRA in other fjords, such as Bjørnafjorden, but these data are not publicly available. The fjord measurement program of the NPRA is unique in Norway in terms of measurement density, parameters measured and the time frame. To the authors' knowledge, there has been no other dedicated measurement campaign providing simultaneous and detailed measurements of both the ocean and the lower atmospheric boundary layer in the complex coastal terrain of western Norway. Oceanographic and atmospheric measurements have typically been carried out independently and during shorter periods, related to, for example, research programs or industry projects. Ongoing large observation programs include the Lofoten–Vesterålen Ocean Observatory (LoVE Ocean) of the shelf marine ecosystem (Godø et al., 2014), ICOS-Norway (Integrated Carbon Observation System) and Ocean Thematic Centre (OTC) which is an international observation program of greenhouse gasses (Steinhoff et al., 2019), and the Nansen Legacy, a national research program which includes extensive observations in the northern Barents Sea and Arctic Ocean (Reigstad et al., 2019). The Norwegian Meteorological Institute (MET Norway) operates a national network of meteorological stations (observational data are typically freely available) in the region of the E39 campaign. The NPRA and the National Coastal Administration (NCA) operate meteorological stations in connection with infrastructure and road safety and operations, but wind measurements from these stations may be strongly affected by obstacles and local terrain features. The Frøya meteorological mast recorded ocean wind conditions to form the basis for the NORSOK standard (Andersen and Løvseth, 1995, 2006; Standard Norge, 2017).
From a scientific standpoint, the measurement campaign provides an excellent platform to study the multi-scale variability in boundary layer flow in complex terrain and the variation of local flow with regard to the synoptic flow aloft, as previously studied by Jonassen et al. (2012) for southern Norway. The current campaign has already provided unique observations of extreme winds and storms in complex terrain, but here the relevant topographic forcing is typically at a smaller scale than has been studied in many large field campaigns in and near the North Atlantic (e.g., the Norwegian IPY-Thorpex, Kristjánsson et al., 2011, and the Greenland Flow Distortion Experiment, Renfrew et al., 2008). The boundary layer flow in this part of Norway is governed to the first order by a large-scale orographic forcing on the mesoscale and synoptic flow, i.e., due to the high mountains of southern and western Norway. The boundary layer flow may decouple from the flow aloft, while the local variability near the surface occurs on scales on the order of a few kilometers as the flow is, for example, accelerated along steep mountain slopes and narrow fjords or stagnates in blocked flow in deep valleys, i.e., in terrain typical for the locations of the masts in the campaign. From a more pragmatic and engineering point of view, the data collection is important for describing the atmospheric forces, both climatic and short-term, pertaining to the technical design of large structures in complex terrain. The data collection is unique in both the length and in the detail of the observed time series at the available sites. The series are long enough so that they can be of use in constructing a description of the climatic conditions at the sites, but they are also detailed enough to describe well single weather events of interest and capture some of the complexity in the flow structure on either side of the planned crossings. The wind and turbulence data have already highlighted that for such large structures as are planned, the spatial variability in the flow must be properly accounted for and described.
The objective of the present paper is to provide documentation of the atmospheric part of the E39 dataset and the data handling process for the mast data. The measurement program is ongoing, and the description given here is valid at the time of publication. The paper is structured as follows. Section 2 describes the setup of the observation system, including mast details, the data quality control and an overview of data availability. Access to the data is open and handled through a new procedure at MET Norway, which is described in Sect. 3. Section 4 presents observations of selected variables to illustrate available parameters and the data quality and puts the data in context with the long-term regional conditions. A summary is given in Sect. 5.
As of December 2019, the observational dataset includes observations from 12 tall masts in three main regions of interest in Møre og Romsdal county in western Norway (Fig. 1). All the masts are operational except two: one has been dismantled, and other was discontinued and extended to twice the original height, becoming the 12th mast. Most masts are expected to be operational for at least 8 years with more details on their setup given below. The masts are located in a region characterized by a relatively complex orography, e.g., narrow and deep fjords surrounded by steep and high mountains. The conditions are more challenging in the Storfjorden region (region S in Fig. 1), where the brunt of the campaign is focused, than in the Julsundet and Halsafjorden regions (J and H in Fig. 1). Further details on the setup and conditions at individual masts is given below. Long-term reference surface weather stations, operated by MET Norway, are found within approx. 20 km of each of the main regions of interest. Two of these are located on flat terrain at airports, while the third is located on the small island of Ona. The nearest upper air observations are made ∼ 180 km to the northeast from Ona at Ørlandet airport.
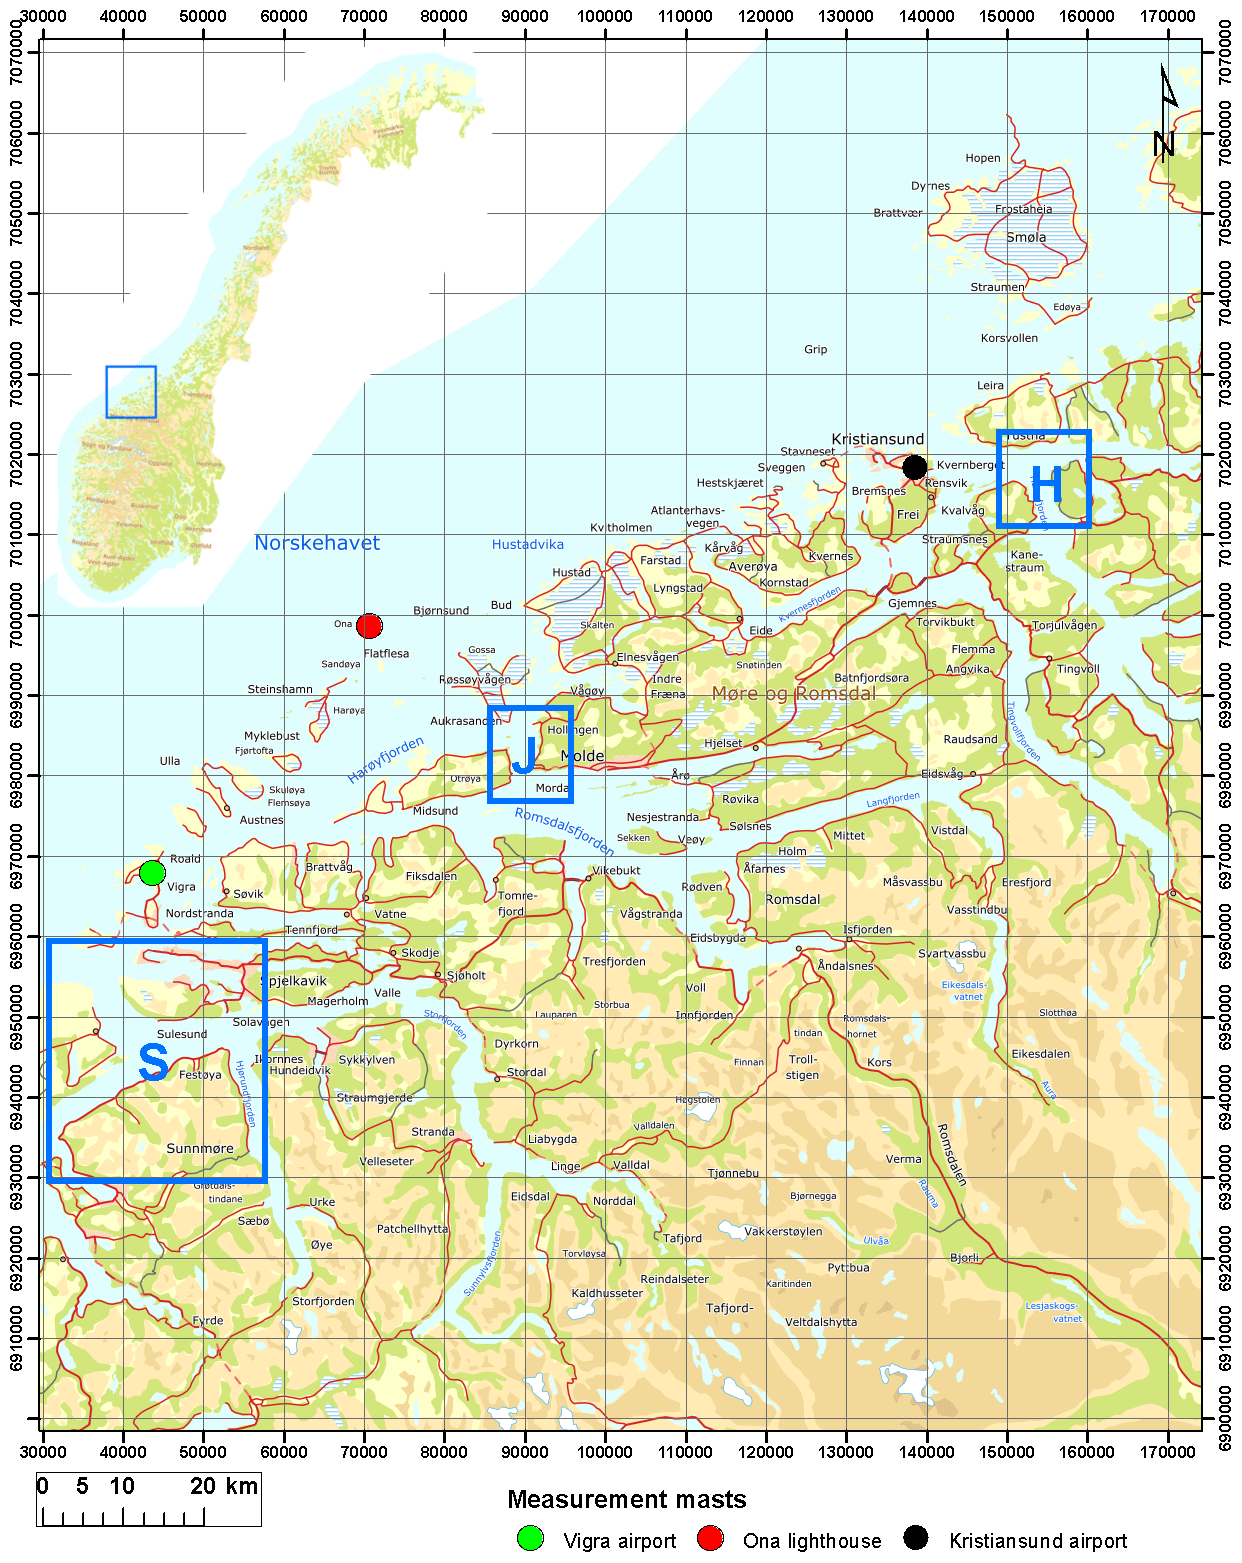
Figure 1Overview of a part of the Møre and Romsdal region (approximate location shown in the inset) and the location of the three areas where the meteorological masts are located (S, J and H). The locations of three national weather stations with long-term data available are indicated with colored circles. Map layers are from © Kartverket and licensed under Creative Commons Attribution 4.0.
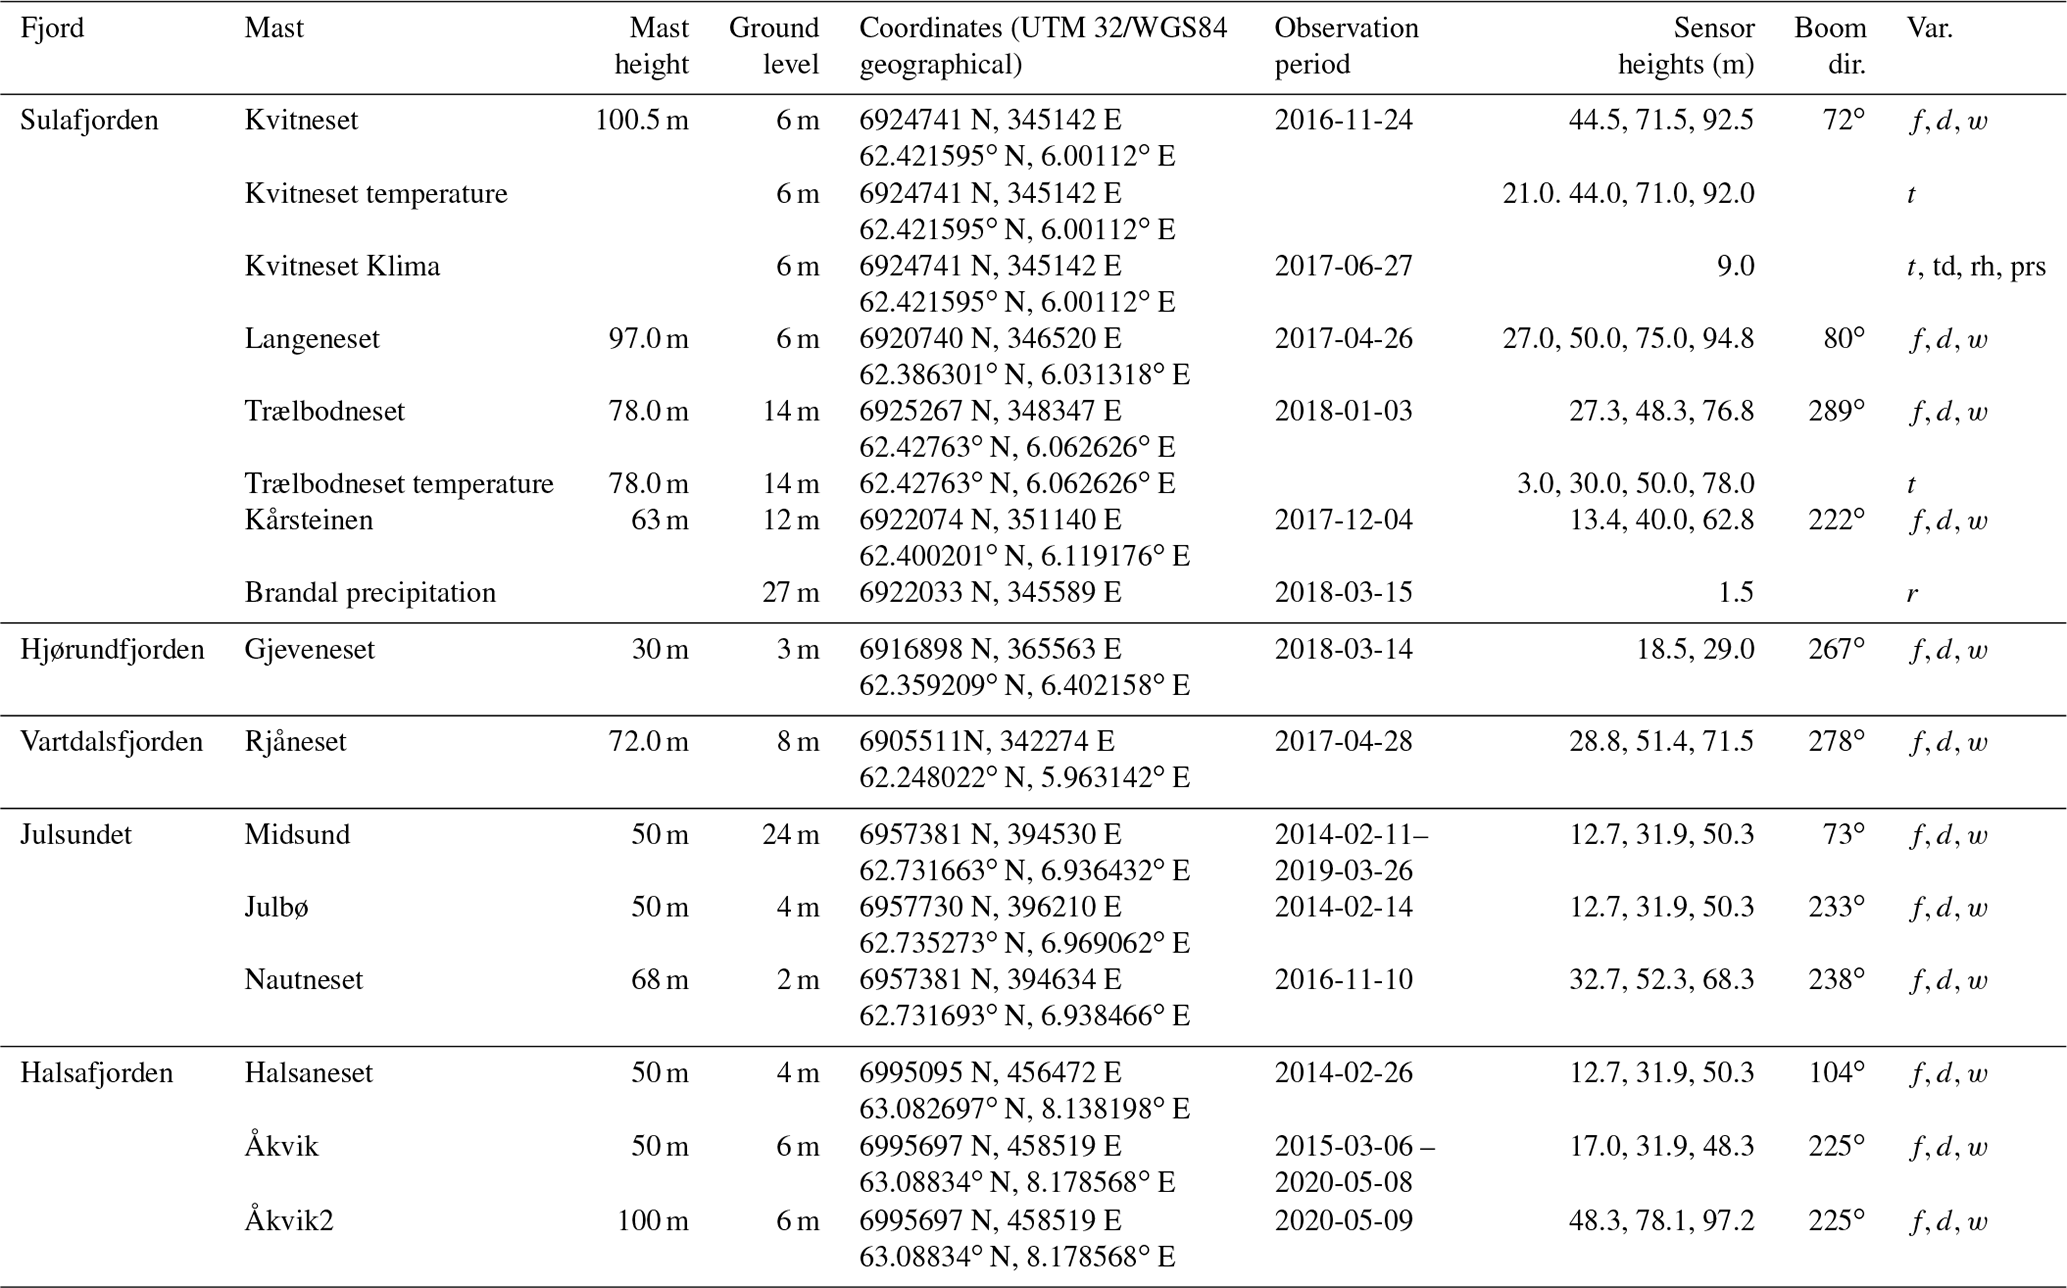
Table 1Overview of key parameters regarding the meteorological measurement sites grouped by location. Boom direction is given as the true direction as seen from the mast and can be used for all levels. A starting date without an end date for the observation period implies that the observations are ongoing. Observed variables are wind speed (f) and direction (d), vertical wind speed (w), temperature (t), dew point (td), relative humidity (rh), and atmospheric pressure (prs).
The main focus of the measurement campaign is to collect data describing the atmospheric and oceanic conditions at possible fjord crossings pertaining to the dimensioning and design of long structures (suspension bridges and floating bridges have been considered, as well as submerged tunnels). In this aspect, wind is the most important atmospheric variable. The main parameters of relevance can be split into two sets: (a) mean quantities which can be described by, for example, the 10 min mean wind, which is to say the wind speed and direction distribution, return levels of extreme winds and the vertical wind profile and (b) turbulence quantities which must be described using observations with a high temporal frequency, e.g., turbulence intensities, the spectral energy density and coherent variations of the turbulence at two locations separated by a short distance. Furthermore, the measurement campaign is corroborated by observations from buoys and lidars (not presented here), as well as long datasets with high-resolution simulations of weather with mesoscale numerical weather prediction and computational fluid dynamics (CFD) models (not presented here).
2.1 Masts and instrumentation
A summary of the key parameters for the masts are presented in Table 1, including geographical position, measurement period, base level height and measurement heights. The masts are built and operated by KVT for the NPRA. Observations of wind are made at 2–4 levels in each of the masts, while additional atmospheric variables are observed at three sites. Observations are ongoing at all masts except at Midsund, which was dismantled in March 2019, and at Åkvik, which became a new station (Åkvik2) in May 2020 with a lengthened mast. The masts are guyed lattice towers (Storfjorden) and tubular masts (Julsundet and Halsafjorden) except at Kårsteinen, Langeneset and Nautneset, which are self-supporting lattice masts. Nautneset was previously instrumented with an accelerometer to verify that the swinging motion of the self-supporting masts has a negligible impact on the intended use of the wind measurements (Tallhaug, 2017).
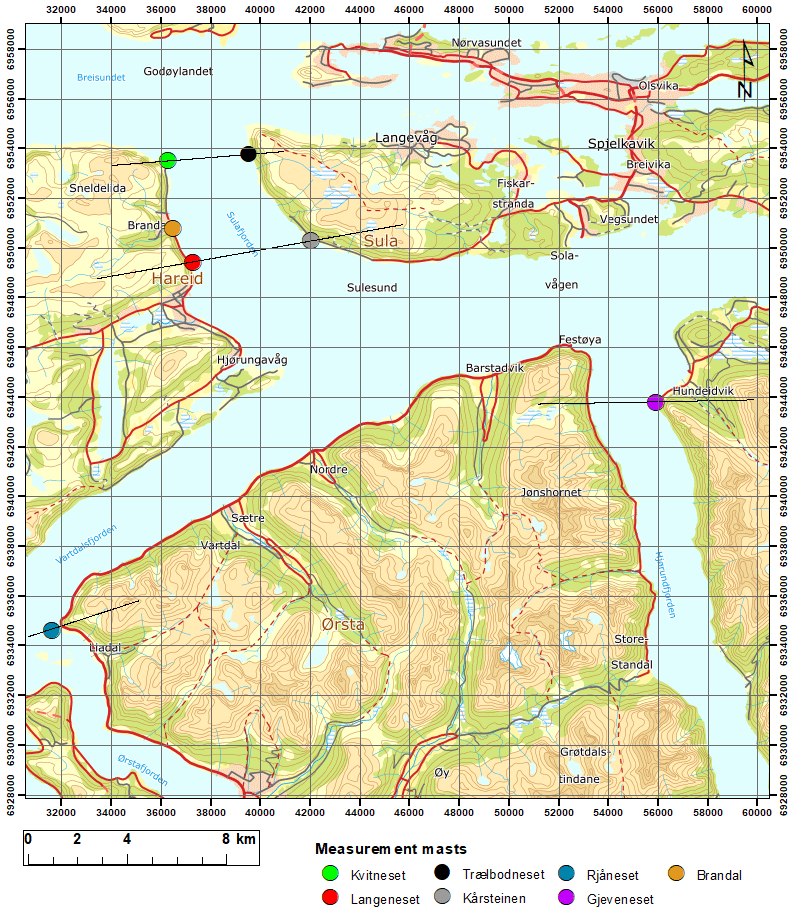
Figure 2Map of Storfjorden fjord system with location of the seven observational sites and height profiles shown in Fig. 3. Map layers are from © Kartverket and licensed under Creative Commons Attribution 4.0.
The three wind components are recorded using three-axial ultrasonic anemometers (Gill WindMaster Pro) which logs at 20 Hz. The data are subsequently averaged to a temporal resolution of 10 Hz to reduce aliasing. The anemometers are located on 2–6 m long horizontal booms with the boom directions approximately perpendicular to the prevailing and most relevant wind directions (derived a priori from mesoscale simulations of wind). The true boom direction, as seen from the mast, is presented in Table 1 (average for all levels). The lowermost sensors on the masts at Julbø, Halsaneset and Midsund are located ∼ 13 m above ground level (a.g.l.) and have been found to be too strongly affected by their vicinity to the tree top level. This is to some degree also the case for the lowermost sensor at Åkvik (17 m a.g.l.). In July 2018, a software bug was documented which affected the vertical wind component of the instrument produced before October 2015 (Gill Instruments, 2016). This error has been accounted for, and only corrected data are made available as part of the current dataset. The 10 Hz temperature measurements were stored from some of the sonic anemometers but are not part of the available dataset.
The 10 min mean wind data are produced from the 10 Hz wind recordings, and more than 99.95 % of the 10 min samples are based on a 50 % or better 10 Hz availability. A 90 % availability of 10 Hz data is found in 99 %–100 % of the 10 min samples, depending on the station. If a 99 % 10 Hz availability is required, then the numbers are 96 %–99 % for the 10 min means. The total uptime for 10 min mean wind for all sensors and all masts is 98.9 %. Instrument failures are fixed at the earliest convenience with the highest priority given to having sensors at the top of the masts operational. An intermittent reduction in 10 Hz data availability is typically associated with errors due to precipitation and other intermittent external or technical disturbances. A malfunctioning instrument or logger will either lead to complete data loss or have sustained periods with a availability far below 100 % for the 10 Hz observations.
The stations Kvitneset_Temp and KvitnesetKlima are located in the same masts as Kvitneset. Kvitneset_Temp has intercalibrated temperature sensors (PT100 from Campbell Scientific) at the same levels as the wind sensors with a sampling rate of 0.2 Hz. KvitnesetKlima has measurements (1 Hz sampling rate) of temperature, dew point temperature, relative humidity and air pressure at 9 m above ground level (not corrected to mean sea level). Intercalibrated temperature measurements at 0.2 Hz (similar as at Kvitneset_Temp) are also done at four levels in the Trælbodneset mast, i.e., at the three levels with wind sensors, as well as at 3 m above ground level (here named Trælbodneset_temp). A Geonor T-200B precipitation gauge is installed at Brandal (cf. Fig. 2).
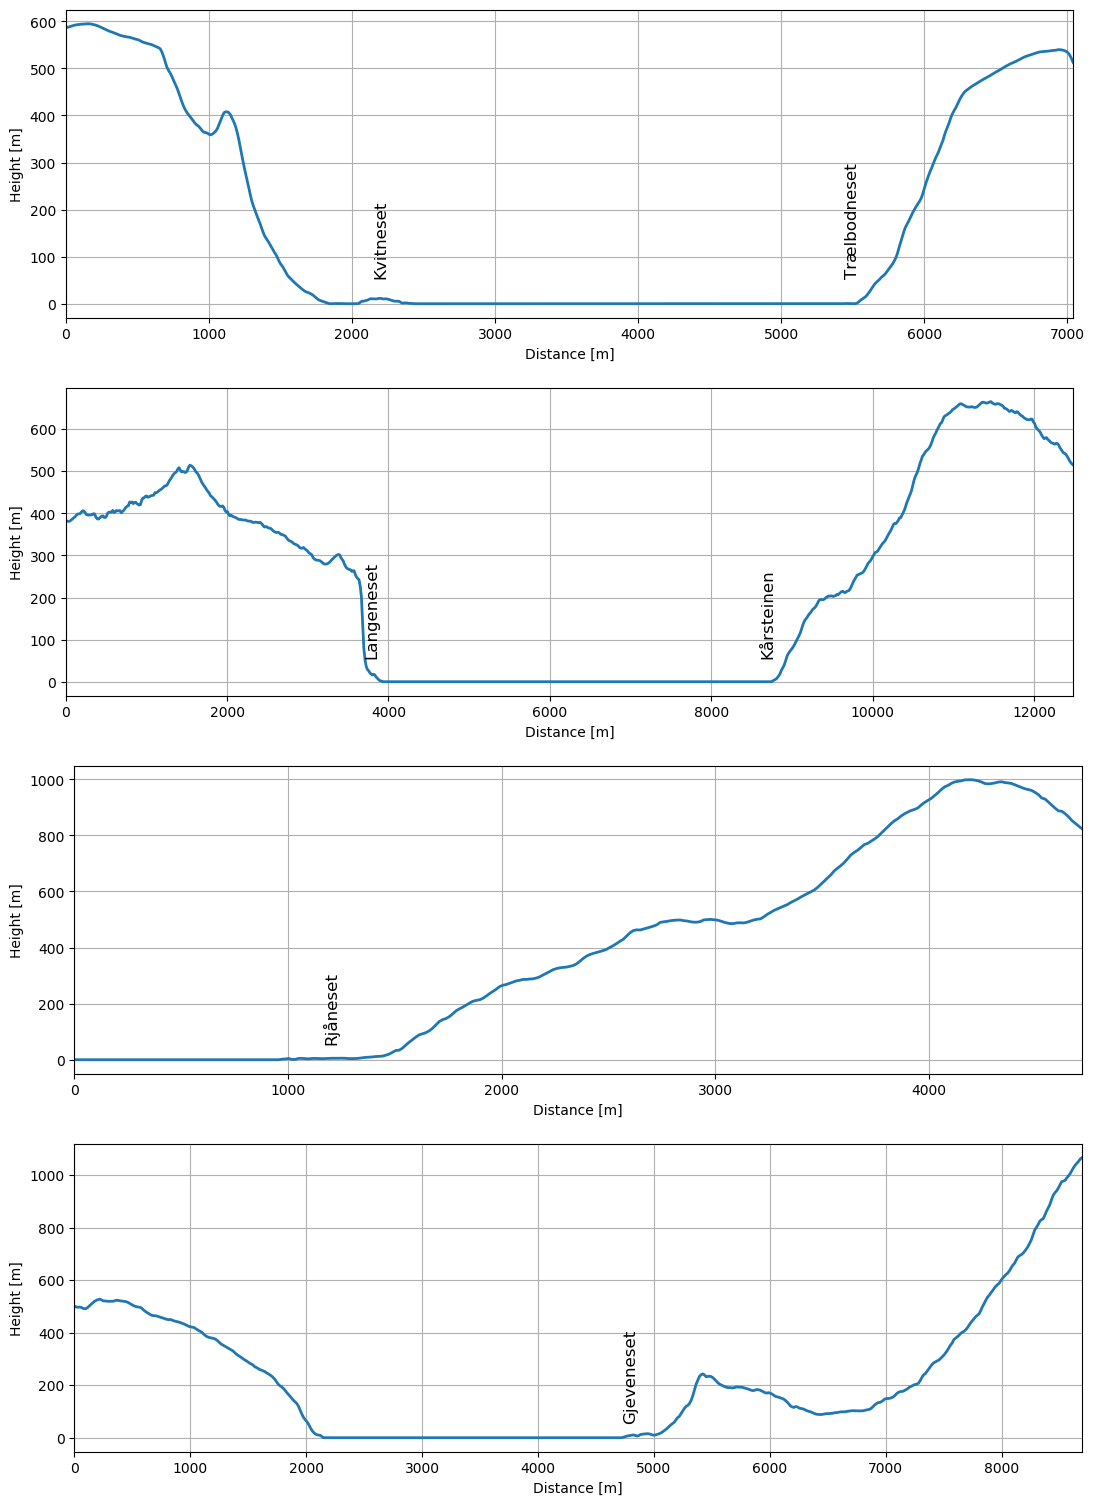
Figure 3Terrain profiles along the sections indicated in Fig. 2 with the locations of the masts indicated. Terrain data are from © Kartverket and licensed under Creative Commons Attribution 4.0.
2.1.1 Storfjorden
Storfjorden is the name of the fjord system which is divided into Sulafjorden, Hjørundfjorden and Vartdalsfjorden in addition to several other extensions further inland (Fig. 2). Sulafjorden is located approximately 10 km southwest from Ålesund between the islands of Hareidlandet in the west and Sula in the east. The fjord is aligned along a south-southeast–north-northwest axis, and it is ∼ 12 km long from the mainland to the island of Godøy and 3–6 km wide. Hareidlandet and Sula have steep mountains, and their upper levels have an elevation of 500–700 m a.s.l. (above sea level). In the south, Sulafjorden connects to Vartdalsfjorden, a long narrow fjord which runs perpendicular to Sulafjorden from the southwest to northeast. South of Vartdalsfjorden is Ørsta municipality with Sunnmørsalpene, a high and steep mountain region reaching more than 1200 m a.s.l. In the northeast, the narrow Hjørundfjorden connects to Storfjorden, running in a southeast–northwest direction. Figure 3 provides terrain profiles at all of the masts, while Fig. 4 shows a photograph of Sulafjorden at the location of Kvitneset and Trælbodneset. The largest effort in the measurement campaign of the Coastal Highway E39 project in mid-Norway can be found here. An overview of the specific conditions at each mast is given below, while details are presented in Haslerud (2019) and references therein.
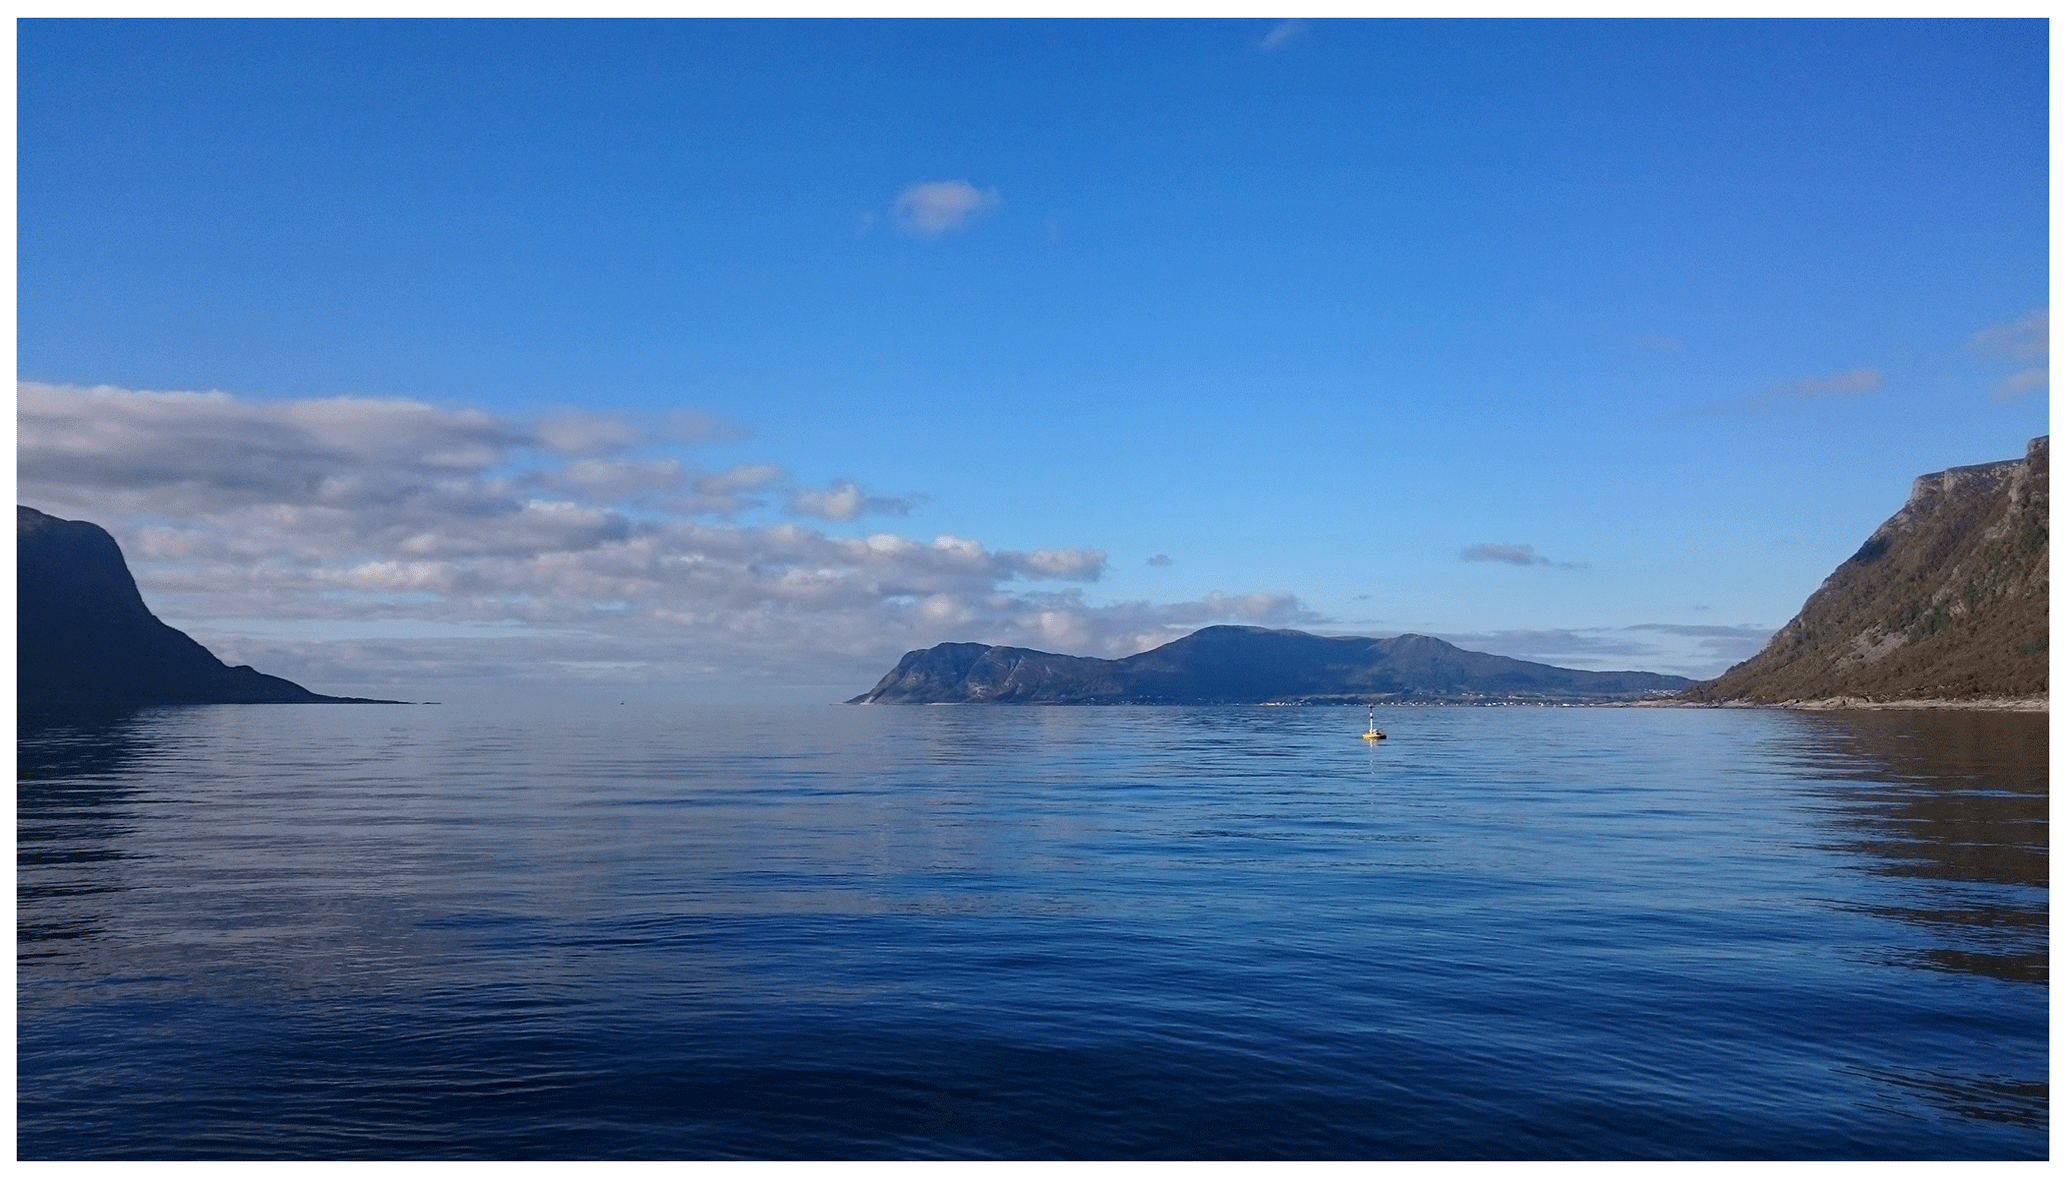
Figure 4Sulafjorden with the islands Hareidlandet, Godøy and Sula from left to right. Between Hareidlandet and Godøy is Breisundet, which is the main opening of the fjord system to the Norwegian Sea. Photograph taken on 13 October 2016.
2.1.2 Sulafjorden
A precipitation station and four tall meteorological masts are located in Sulafjorden. The masts are located near both ends of two possible fjord crossing locations: Kvitneset and Langeneset on the western side and Trælbodneset and Kårsteinen on the eastern side.
The mast at Kvitneset is located on the headland of Kvitneset on the northeast corner of Hareidlandet. The headland is a 300 m wide and 200 m long relatively flat area just below steep mountains reaching up more than 500 m over a distance of 1 km in the southwest. Figure 3 shows the terrain profile along a section through the locations at Kvitneset and Trælbodneset and serves to highlight the steepness and height of the surrounding mountains. The masts are located at 6 m a.s.l. in a location open to the Norwegian Sea in the west-northwest to north-northwest sector. The 10 min wind data availability is near 100 % for all sensors. There was sporadic loss of 10 Hz data before July 2017 and in March 2019 due to technical issues. The data availability for the other atmospheric variables is near 100 % until December 2018 when it is 0.1–0.9 % lower.
A precipitation station was put into operation in March 2018 in the village of Brandal between Kvitneset and Langeneset. Due to a fault, precipitation was not registered during the last 10 d of August 2018.
The Langeneset mast is located to the south in Sulafjorden (i.e., inward) from the mast at Kvitneset. It is mounted in a 100 m wide industrial area below a steep mountain side (cf. Fig. 3). The slope is partly covered with an open forest, and there are low buildings in the industrial area. Due to sporadic losses and mast downtime in the summer of 2017, data acquisition during the first year was 94.6 %. For 2018 and onwards, the data availability is close to 100 %.
The mast at Trælbodneset is located at 12 m a.s.l. on a small headland on the western side of the island of Sula with a view to the open sea towards the west-northwest. Towards the east, a mountain rises 450 m over a distance of 1 km (Fig. 3). The vegetation is relatively sparse at the mast and along the coast, while the mountainside has open forest. The 10 min availability is 99 %–100 % but the top sensor had a slightly later start than the other sensors (16 January 2018). The overall availability of 10 Hz data is good with a somewhat reduced availability during some winter months. The 10 min availability of the temperature sensors on the masts is near 100 % the first 2 years, then 92.1 % and 97.2 % in 2019 and 2020.
The mast at Kårsteinen is also located on a small headland with a steep mountain rising to 660 m in the northeastern quadrant (Fig. 2). The mast is located near the opening of Sulafjorden into Vartdalsfjorden. Due to defective hardware, the availability was poor during the first few months of operation, but it is nearly 100 % after February 2018. The availability of 10 Hz data is generally good but relatively low in September 2018.
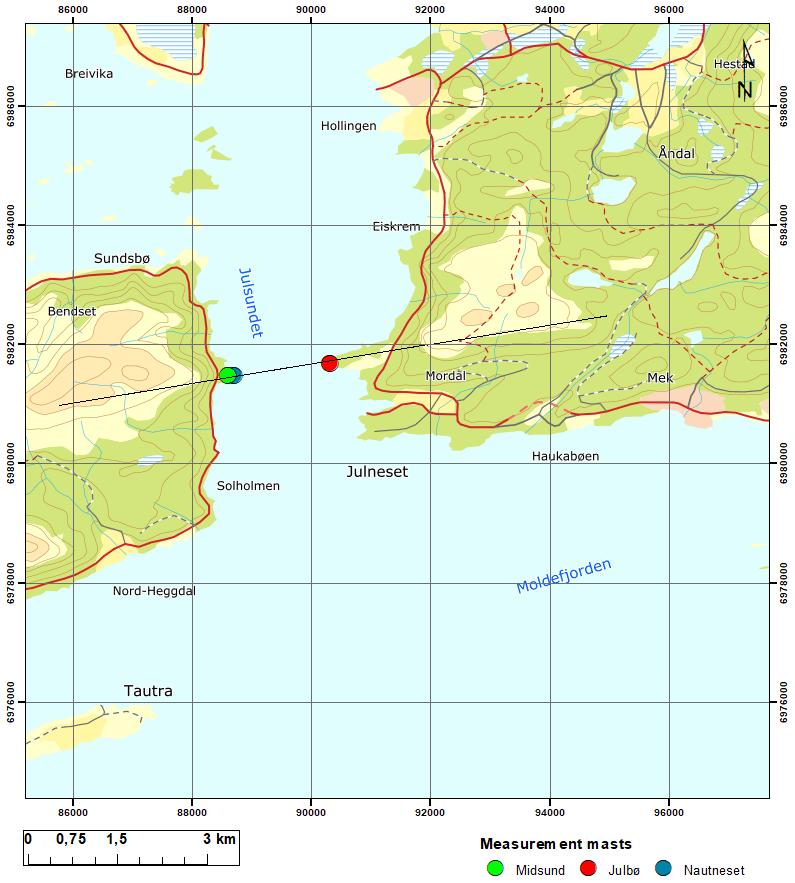
Figure 5Map of Julsundet with locations of meteorological masts and the height profile shown in Fig. 6. Map layers are from © Kartverket and licensed under Creative Commons Attribution 4.0.
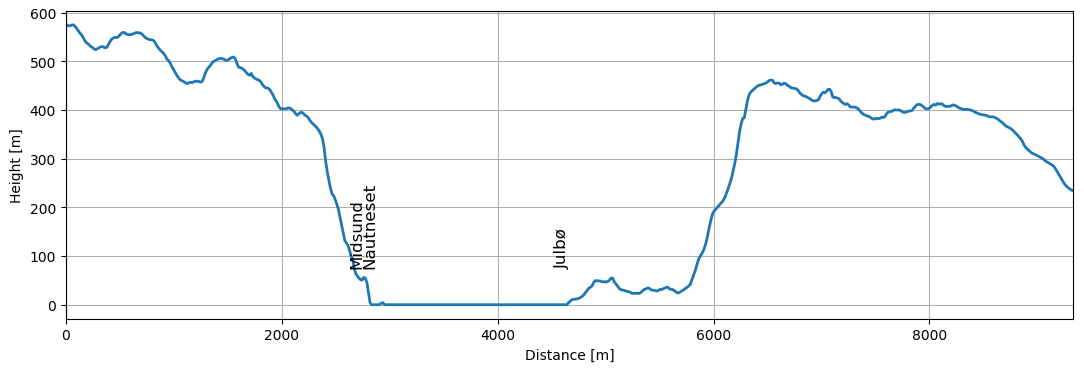
Figure 6Terrain profiles along the sections indicated in Fig. 5 with the locations of the masts indicated. Terrain data are from © Kartverket and licensed under Creative Commons Attribution 4.0.
2.1.3 Vartdalsfjorden
The mast at Rjåneset is located at the tip of a small peninsula just west of the settlement at Grøvika on the southeastern shore of Vartdalsfjorden. There is a mountain rising to 1035 m a few kilometers to the east (Fig. 3) with steep mountainsides in the sector from the north–northeast to east and some of them across the fjord. The headland has some trees, and the mountainside is forested. There are some low islands a couple of kilometers to the south and southeast. There are steep mountains across the fjord to the north and west, while the fjord is more open to the southwest where it meets Rovdefjorden and Voldsfjorden. The availability of 10 min data from the topmost sensor is close to 100 % for the whole measurement period, while due to hardware issues, some data were lost for all sensors during September–November 2018 and after April 2019. The availability of the 10 Hz raw data is generally good with sporadic losses during summer and a slight increase in the losses during late autumn for both years (2018 and 2019).
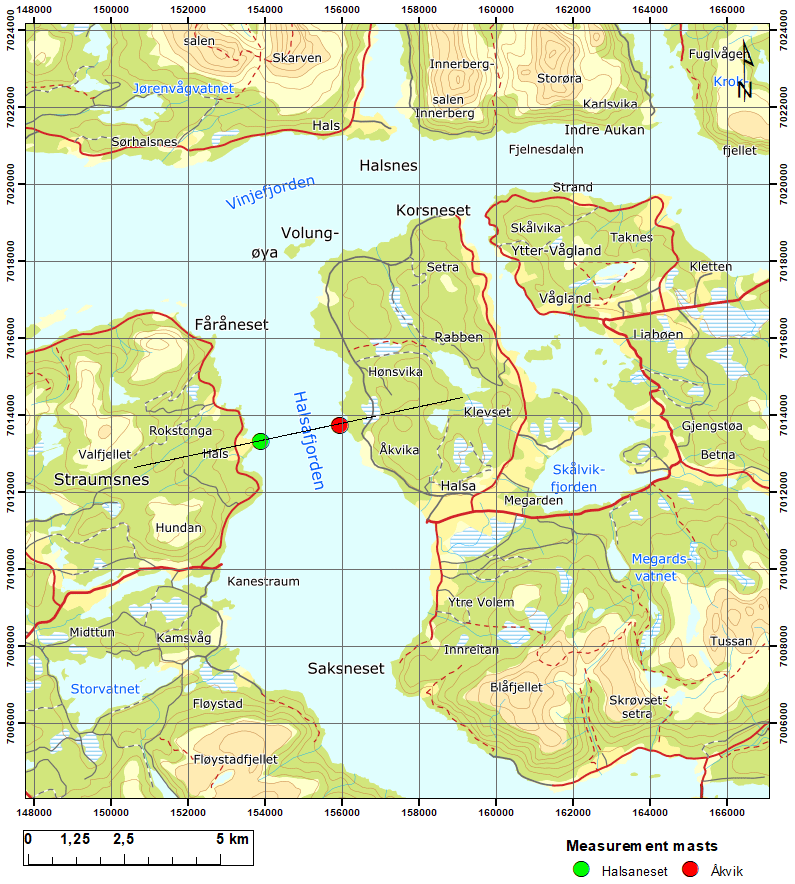
Figure 7Map of Halsafjorden with locations of the meteorological masts and the height profile shown in Fig. 8. The mast Åkvik2 is a continuation of Åkvik and is located at the exact same location. Map layers are from © Kartverket and licensed under Creative Commons Attribution 4.0.
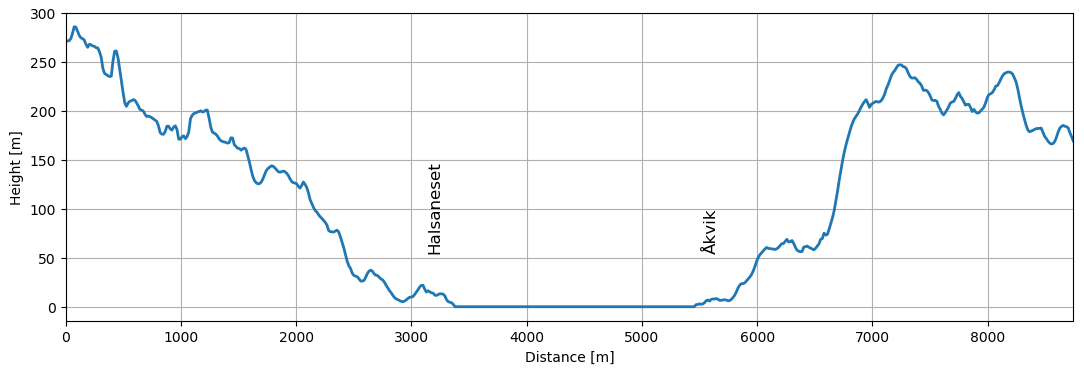
Figure 8Terrain profiles along the sections indicated in Fig. 7 with the locations of the masts indicated. Terrain data are from © Kartverket and licensed under Creative Commons Attribution 4.0.
Table 2Main statistics of wind dataset at the top sensor, including mean, median and maximum wind speeds, the 99th percentile of wind speed, and the maximum gust (3 s), as well as the 99th percentile of the up/down vertical wind gust (all units in m s−1).
2.1.4 Hjørundfjorden
The mast at Gjeveneset is relatively low compared to the other masts and is located at a potential building site for the components of a floating structure. The mast is situated at the inlet of Hjørundfjorden at 3 m a.s.l. just by the sea and southwest of Hundeidvik, where the fjord opens up towards the north before meeting Storfjorden (Fig. 2). The mast is facing the fjord in the south-southeast sector over the west to north, and the land is fairly open towards the northeast with spread buildings within a few hundred meters. In the east, open terrain slopes gently up to 20 m over a distance of 200 m and then more steeply up to above 600 m over a distance of 600 m. On both sides of the fjord, steep mountains rise up to more than 1000 m a.s.l. The headland has areas of trees, and the mountain side is covered by forest. Data availability from the mast was just over 90 % in 2019 due to a hardware failure in the spring. In 2018 and 2020, the availability was good (100 %).
2.1.5 Julsundet
Julsundet is the sound that connects the Molde and Fræna municipalities on the southeastern side and the island municipalities Midsund and Aukra on the northwestern side. Julsundet is approximately 17 km long and runs in a north–south direction. On the south side, the sound opens into Moldefjorden and on the northern side into Harøyfjorden. A bridge in the narrowest part of the sound has been considered, where the width is 2.5 km and mountains reach up to 500–600 m on both sides, as seen in Figs. 5 and 6. Two masts, Midsund (dismantled in spring 2019) and Nautneset, are placed on the western side and another, Julbø, on the eastern side of Julsundet (Fig. 5). The masts at Midsund and Nautneset are only separated by a horizontal distance of ∼ 100 m and have sensors at the same height above mean sea level, as well as the same height above ground level. More details are given in Eriksen (2019) and references therein.
Julbø mast is placed on a low headland reaching fairly far into the sound. The topography on the headland goes up to 8 m, while the mast is located at 4 m a.s.l. There are a few trees and a small cliff down to the sea on the southwest side. The monthly 10 min data availability is near 100 % except during periods associated with technical failures in May, July, November and December 2014 and March and July 2017. The 10 hz data availability is generally good with greater loss during the previously mentioned months.
The Midsund mast was mounted on the west side of the sound on the Nautneset headland. The headland is forested and reaches roughly 300 m into the sound. The topography at the headland reaches up to 50 m with steep cliffs up from the sea. To the west of the headland, the terrain rises steeply to 600 m. The mast was mounted 100 m from the outer headland at 24 m a.s.l. The monthly 10 min data availability is 99 %–100 %, and the 10 Hz availability is typically high except during periods associated with technical failures in March and August 2014, May and July 2017, and June 2018. The Nautneset mast is placed on the harbor about 100 m east of the location of the Midsund mast. The mast has a free line of sight from the north (360∘) to the east to south (180∘). In the west, the topography rises steeply to Midsund mast and further towards the mountains. In November 2016–January 2017, the two topmost sensors were out due to a lightning strike, but the lowermost sensor operated normally, and in March 2019 a technical failure caused a loss of data. Apart from this, the data availability has been close to 100 %.
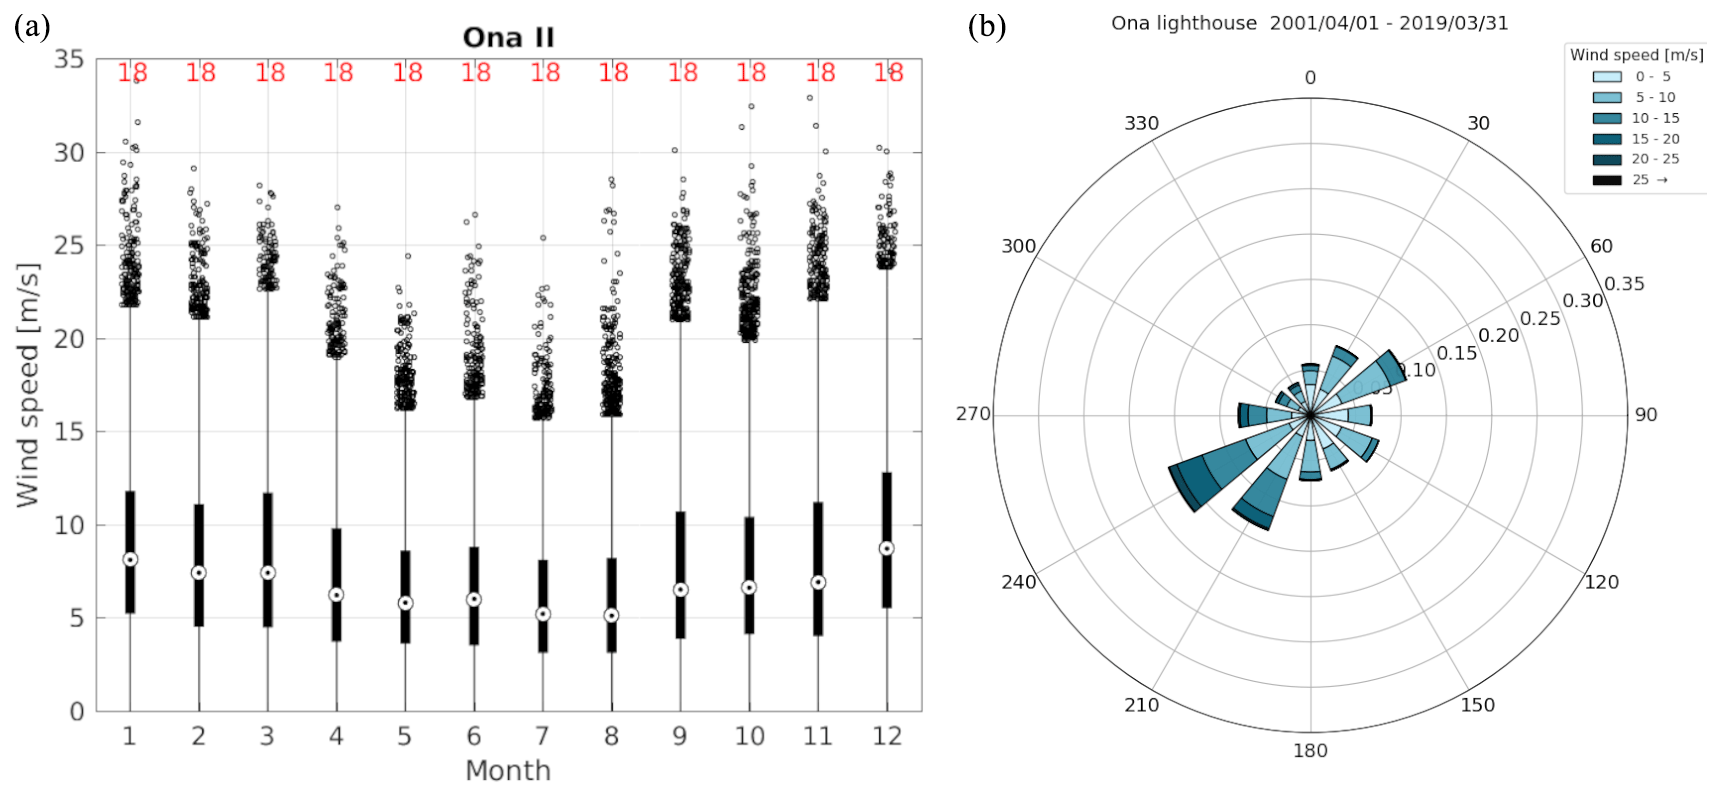
Figure 9Wind statistics for the 18 year period at Ona II. (a) Box plot of wind speed per month of the year. The boxes in the plots show the 25th and 75th percentiles with the median value as a circle inside. The lines above and below (the whiskers) represent the 1.5 interquartile range from the box. Values beyond this are plotted as dots above each line. The red numbers above each month show the number of full months used to produce each box. (b) Wind rose showing the wind speed and direction distribution. The length and direction of the bar shows the directional distribution of the wind speed, while the color scale shows the wind speed distribution.

Figure 10Box plots of wind speed per month of the year over 3 years from Ona II (reference station) and all available data from the uppermost sensor at the sites. The time periods for each panel are found in the corresponding panel in Fig. 11.
2.1.6 Halsafjorden
The Halsafjorden fjord runs in a southeast–northwest direction from Todalen in the south towards the island of Tustna (Fig. 7). The fjord is roughly 2.5 km wide at the planned bridge location. The terrain reaches up to 200–500 m a.s.l. on both sides, and the sides are covered by forest (Figs. 7 and 8). A mast is placed at Halsaneset on the western side, and another, Åkvik, is placed on the eastern side of the fjord. More details are given in Eriksen (2019) and references therein.
Halsaneset mast is mounted 10 m a.s.l. at the tip of the headland of Halsaneset which reaches 500 m out into Halsafjorden. There are two small, forested hills (15 and 40 m) on the headland, while the tip of the headland is more sparsely vegetated.
The Åkvik mast is mounted at 6 m a.s.l. on the tip of a 200 m wide and 500 m long forest-covered headland, Orneset, on the eastern side of Halsafjorden. The headland is about 80 m high at the farm of Haugen and slopes gradually towards the tip, while the southern side of the headland is steep. The height of the mast at Åkvik was increased to 100 m in May 2020, and at the same time, the station got a new name, Åkvik2, and observations stopped at the original station. Due to the short observation series at Åkvik2, no observations from the station are presented here. Both the Halsaneset and Åkvik masts have a high annual data availability of 99.8 %–100 % for 2016–2020.
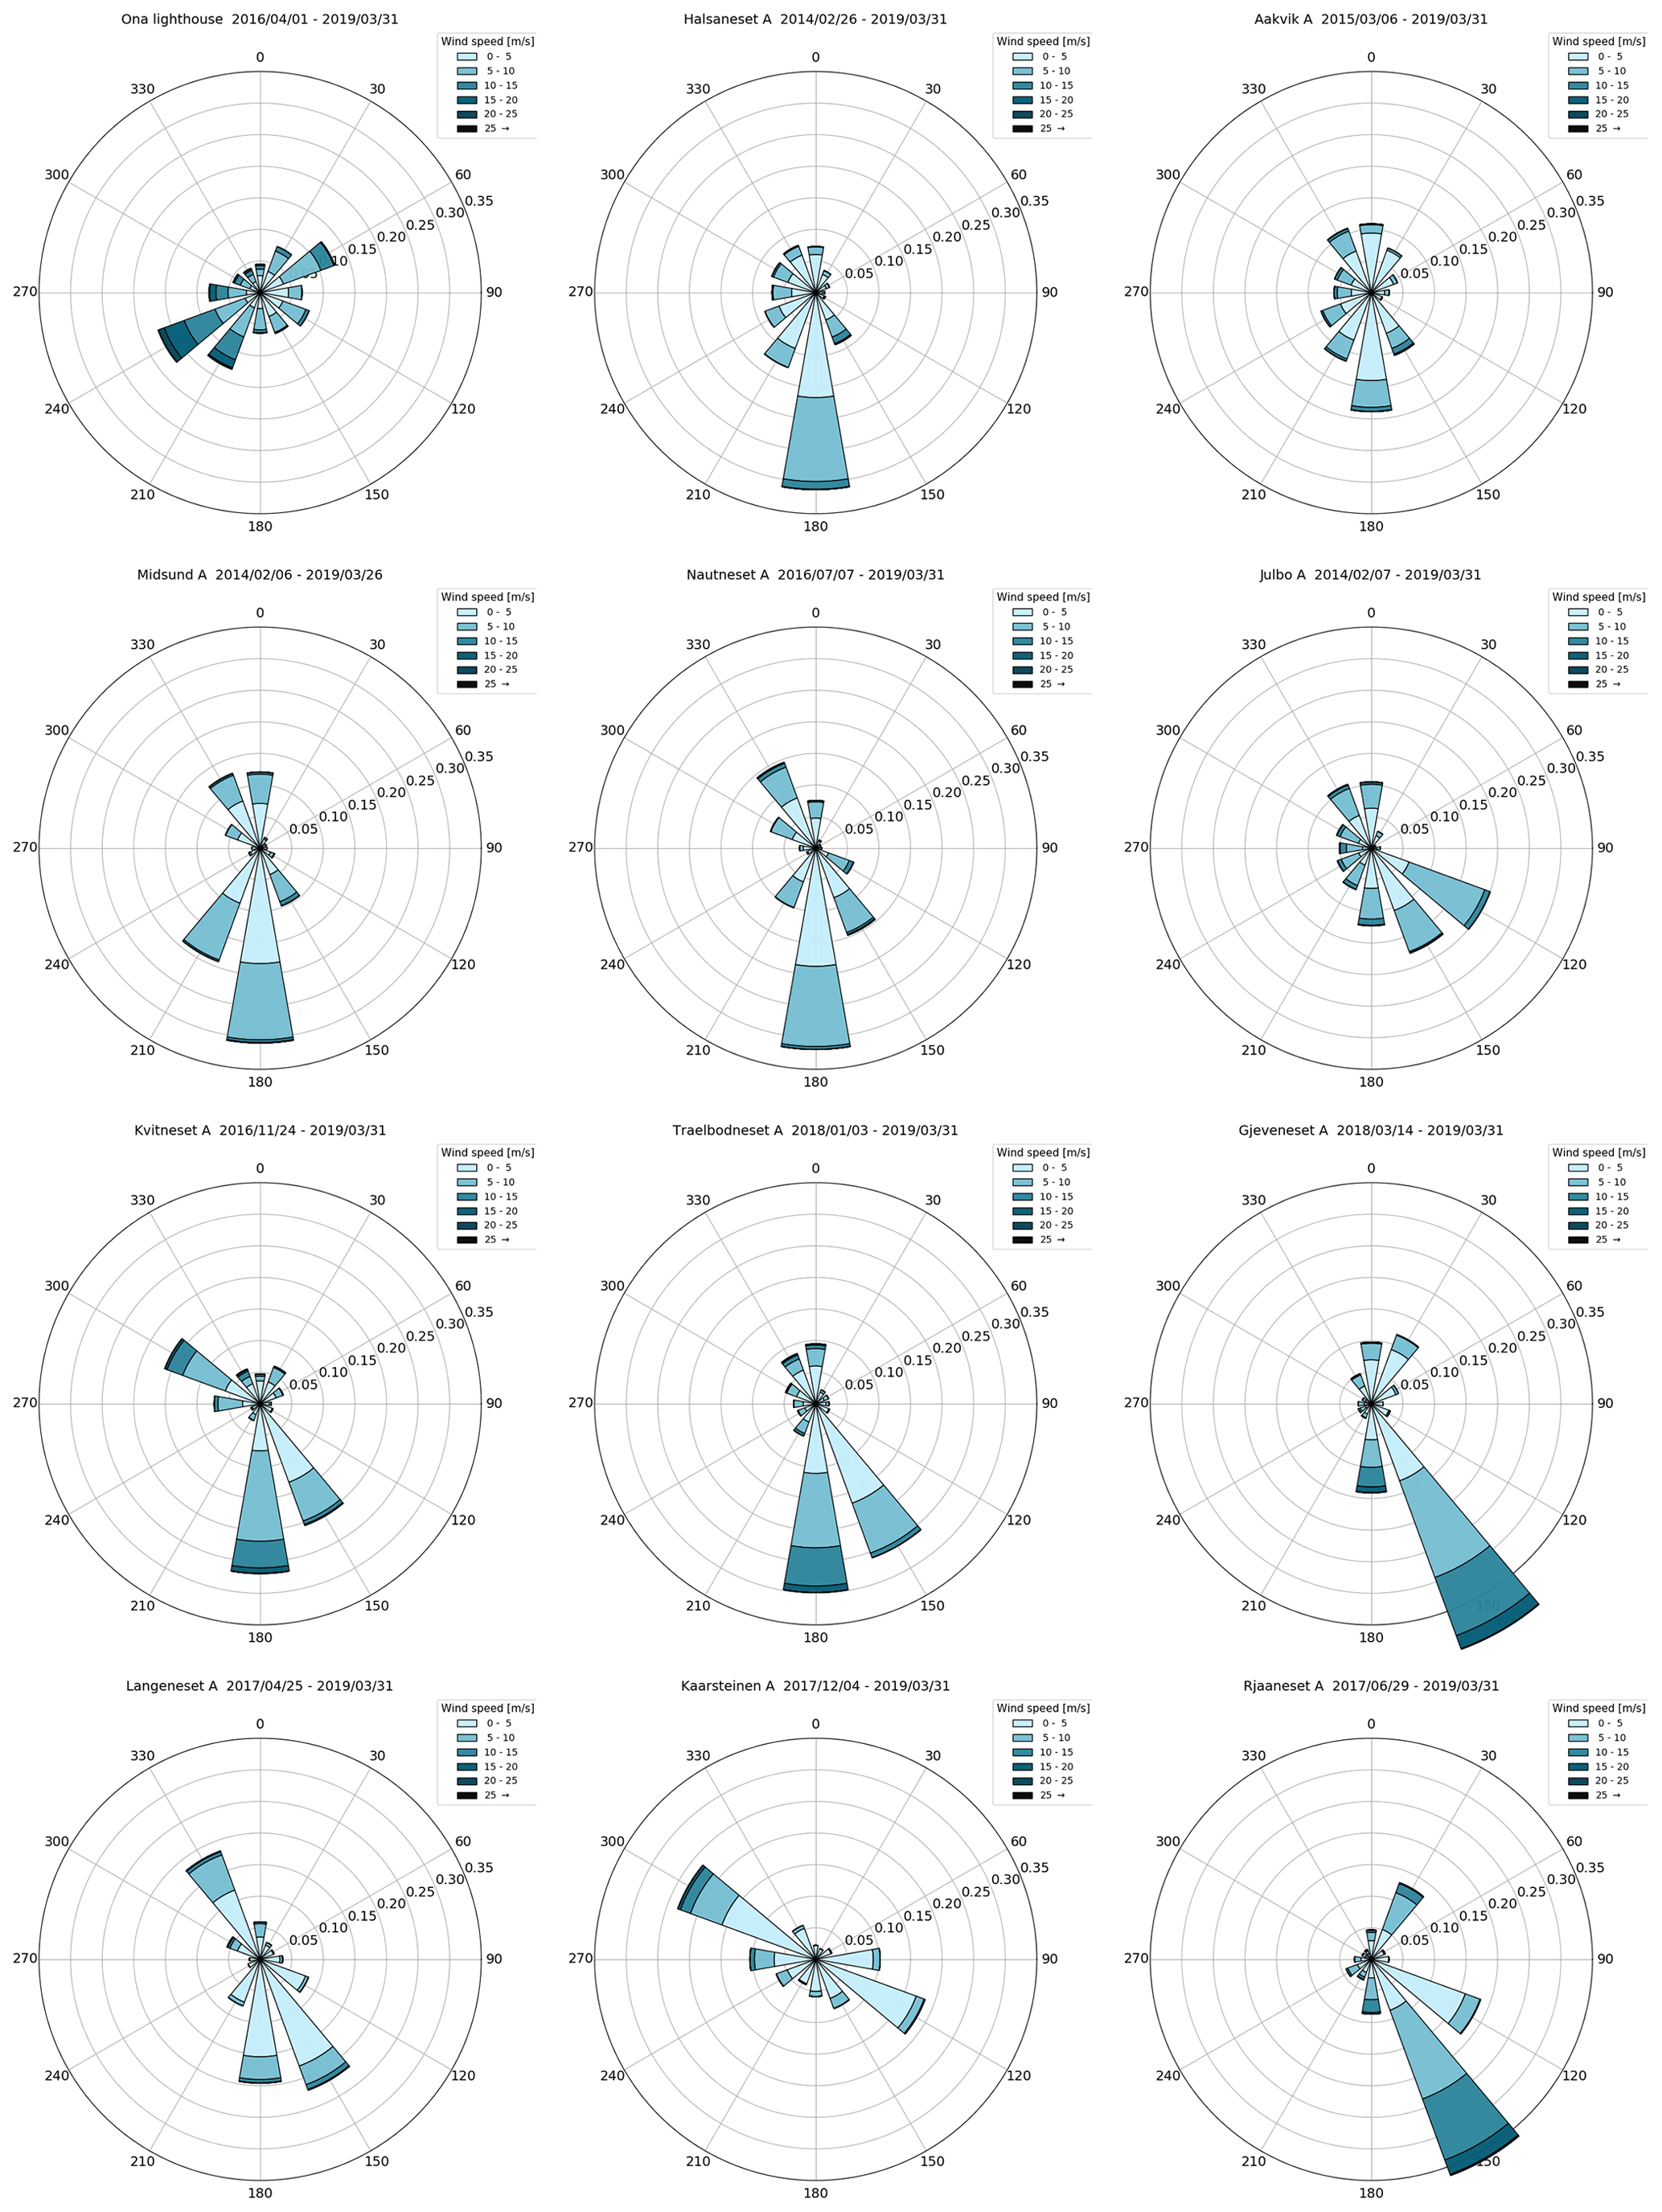
Figure 11Wind roses showing the wind speed and direction distribution over 3 years from Ona II (reference station) and all available data from the uppermost sensor at the sites.
Data from the sites are handled as follows. Observational data are transmitted in near real time to KVT with a temporary backup locally stored in the mast loggers. Data are processed and quality checked on an hourly basis at KVT. As the mast measurements are ongoing and instruments may need replacing, the filtering process is monitored and improved when the need arises. Furthermore, the operations of the mast observations are monitored in real time by an automated system which warns about delays in observations, malfunctioning instruments, missing data or unphysical observed values.
The operational filtering of the 10 Hz wind data made publicly available is threefold. Unphysical values exceeding the specifications of anemometers are flagged. Noise and data spikes associated with unphysical jumps in the measurement values are identified and removed from the dataset using a method similar to median filtering. Locked values, i.e., repeated and identical measurement values for the three wind components, are removed. Further filtering of the available 10 Hz dataset is not done, and it is left to the user of the data to employ more stringent filtering routines as they see fit and as needed for the intended use of the data. Suggestions on applicable filtering methodologies and additional quality assurance are, for example, given in Hubbard et al. (2012), with more specific details given in Capozzi et al. (2020) and Steinacker et al. (2011). After filtering, the observed wind direction in the 10 Hz data is rotated towards true north, and 10 min means are produced from the 10 Hz wind data. There is no minimum on the amount of 10 Hz samples used in producing the 10 min averages, but the amount can be deduced by inspecting the available 10 Hz data. For data other than observations of wind, the raw data are made available as is, and only a first screening of the data is done with no additional filtering performed.
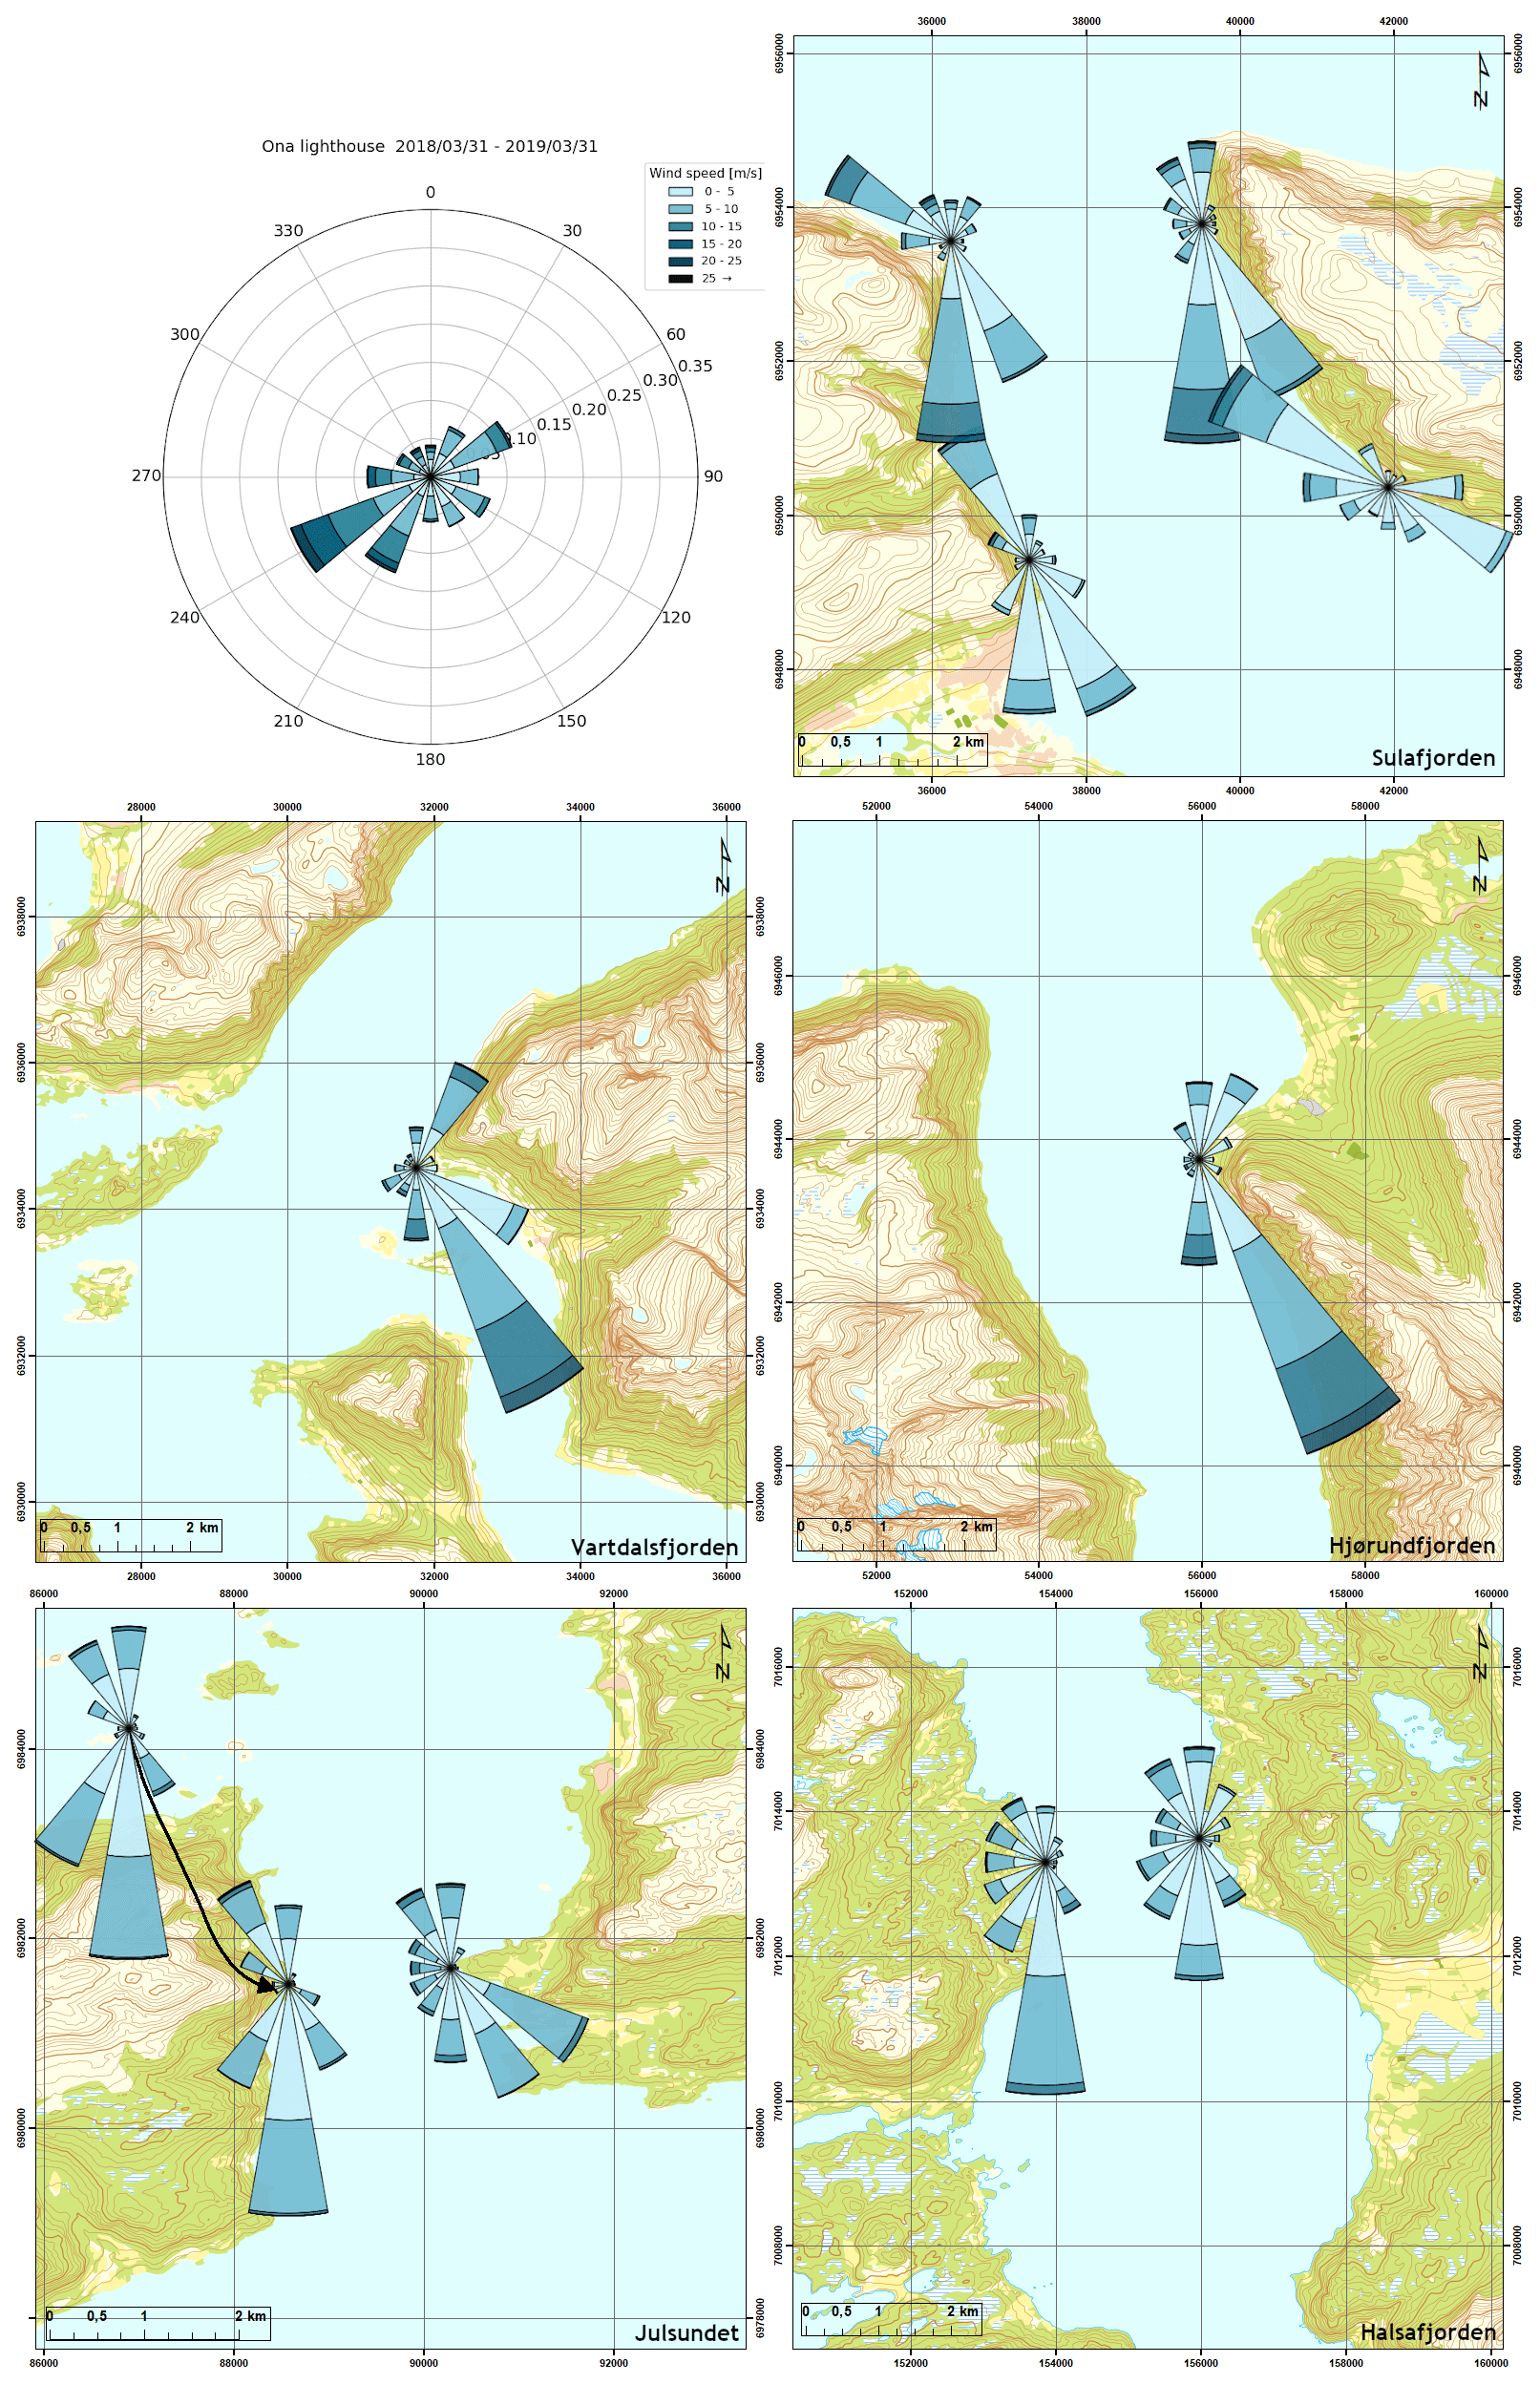
Figure 12Wind roses from Ona and the top sensor at each site overlaid on topographic maps. Only data from 1 March 2018 to 28 February 2019 at all the sites are used to produce the wind roses. All the roses are on the same scale as the Ona wind rose (top left). Map layers are from © Kartverket and licensed under Creative Commons Attribution 4.0.
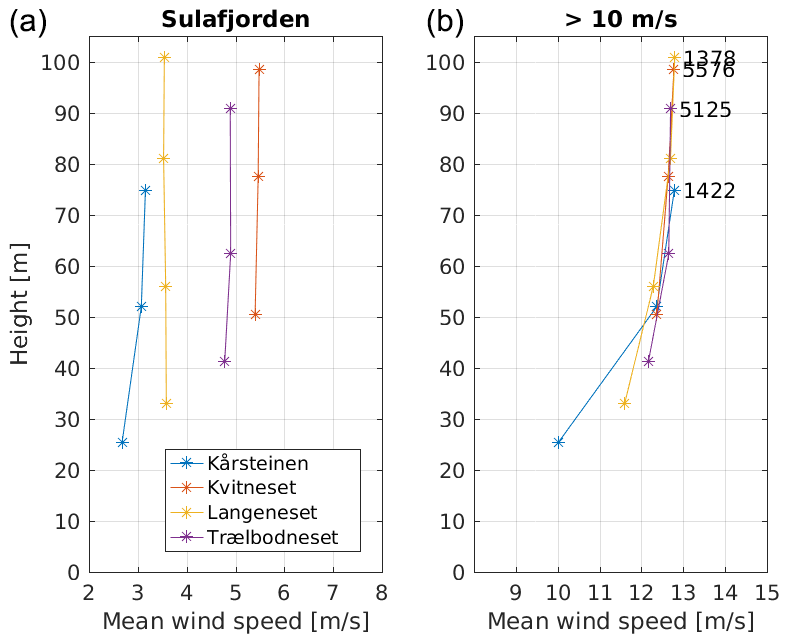
Figure 13Mean vertical wind shear from the four masts in Sulafjorden (a). Only data from 1 March 2018–28 February 2019 are used to produce the profiles. Height is the altitude of the sensor relative to the sea surface. (b) Mean vertical wind shear for situations with wind speeds higher than 10 m s−1 at the top sensors. The number of profiles are indicated.
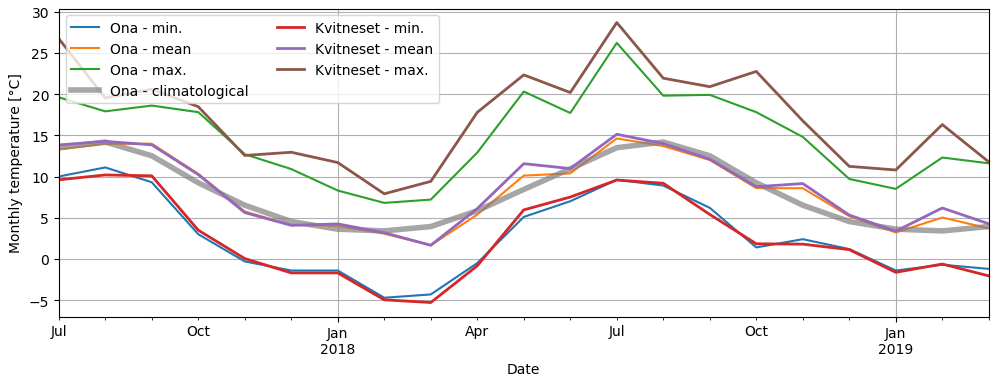
Figure 14Monthly mean, maximum and minimum temperature at the top of Kvitneset mast and at the Ona reference meteorological station. Also shown is the mean temperature (thick gray line) at Ona for an 18-year period.
Hourly data at the native sampling rate and with 10 min sampling are written to files (netCDF4 format) and are sent to a virtual server belonging to MET Norway via secure file transfer protocol typically on a hourly or daily basis. MET Norway performs an additional quality check on the data to track any inconsistencies and delays in the data stream. Data from the masts are published as open access on http://thredds.met.no (last access: November 2020). THREDDS (Thematic Real-time Environmental Distributed Data Services) is a software solution run on web servers that provides metadata and data access for scientific datasets using a variety of remote data access protocols such as OPeNDAP (Open-source Project for a Network Data Access Protocol). Due to the high data amount of the 10 Hz wind data, the 10 min data are stored separately. Both type of files include wind speed, wind direction and vertical wind speed. The 10 min averages of the wind observations are based on 10 Hz data from the interval preceding the time stamp (i.e., labeled right), while the interval is open on the left side and closed on the right side (i.e., the end points only include the observation concurrent with the time stamp).
The long-term automatic weather station Ona II (MET station number 62480) on the island Ona just off the coast (Fig. 1) is used as a reference station for the wind and temperature measurements. Ona II is operated by MET Norway, and data are available from the open data application programming interface (API): http://frost.met.no (last access: February 2020). Hourly observations of wind speed and direction have been available since 2001 (approximately 18 years of data), and they are used to provide a description of the current state of the long-term regional wind conditions. For this reference period, the median wind speed at Ona is 6.6 m s−1 which varies from 5.1 m s−1 in August up to 8.7 m s−1 in January (Fig. 9). Winds above 30 m s−1 have been observed in the autumn and early winter, i.e., from September to December. Since the fjord crossings are separate projects with different timelines and since permits for mounting the masts are granted separately, all the masts were erected at different times from 11 February 2014 in Julsundet to 14 March 2018 in Hjørundfjord. A 3-year period from Ona II is chosen to represent the period with fjord measurements (Fig. 10 top left). When compared to the wind speed distribution for the reference period of 18 years (Fig. 9), we see that the wind has been somewhat weaker during the chosen 3 years than during the reference period. The median and 75th percentiles of wind speed during February, July and November are lower than for the whole complete series, and there have been no recordings of wind speeds above 30 m s−1.
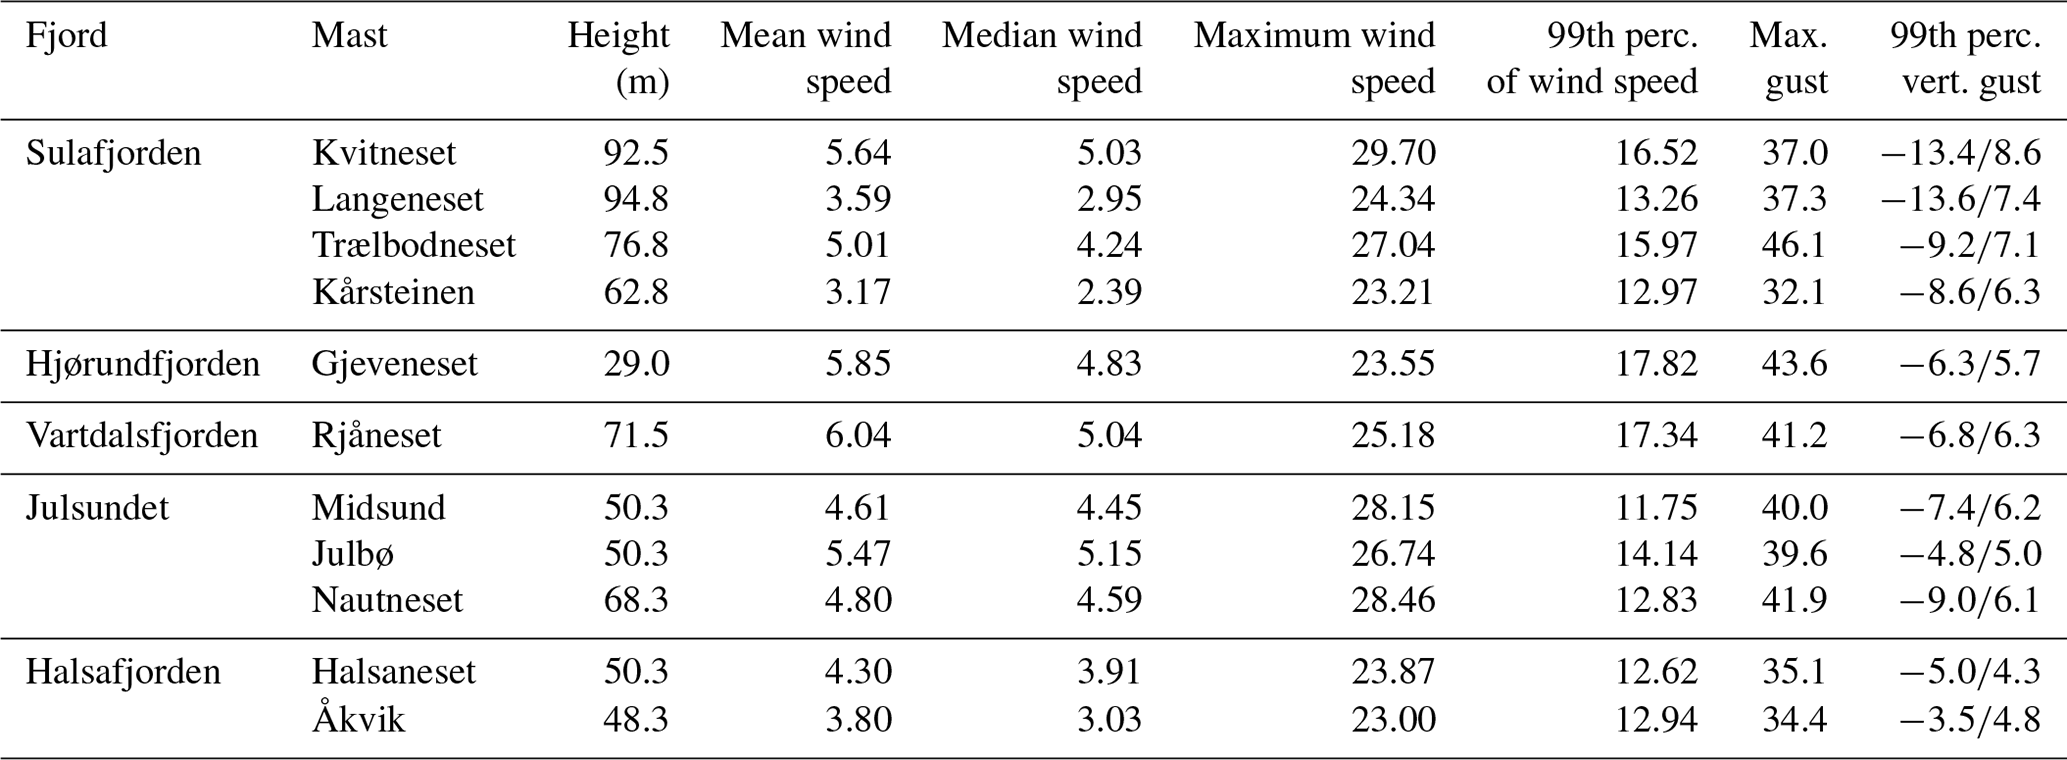
At the 11 stations discussed here (Table 2), the lowest annual median wind speeds are found in the inner part of Sulafjorden at Langeneset (2.95 m s−1) and Kårsteinen (2.39 m s−1), while median wind speeds above 5 m s−1 are recorded in Julbø (5.15 m s−1), Kvitneset (5.03 m s−1) and Rjåneset (5.04 m s−1). Strong winds are most frequent in Julsundet and at Kvitneset in Sulafjorden, while the highest 99th percentiles are found in the inner part of the fjords (Gjeveneset and Rjåneset) in spite of their lower measurement heights. This is presumably related to the local topography and how well the sites are exposed to a direction associated with strong winds. The 99th percentile for the upwards- and downwards-oriented vertical winds indicates that the strong vertical gusts are often found at the stations in Sulafjorden, as well as at Nautneset, compared to at the other stations, especially those in Halsafjorden.
The wind speed shows a clear seasonal variation at the Ona reference station and most of the masts, except Trælbodneset, Kårsteinen, Gjeveneset and Rjåneset (Figs. 9 and 10). Here, the time series are short, and the statistics are less reliable.
The wind roses for the Ona reference station (Fig. 9 and top left in Fig. 11) show that the directional distribution during the 3-year period is quite typical for the conditions during the last 18 years, as would be expected at a site where the low-level flow is strongly affected by both the local terrain and the large-scale orography of western Norway. They also show that along the coast, the most frequent, as well as the strongest, winds are from the southwest and the northeast, following the general orientation of the coast. The synoptic scale flow aloft has a large contribution from the south and the east, as well as a component from the northwest, but the orographic forcing typically deflects such flows along the large-scale orography (see Barstad and Grønås, 2005, and references therein). The wind roses covering the full observation period until April 2019 (Fig. 11) for the 11 stations indicate flow which is strongly affected by the local terrain. Southerly winds (winds blowing towards the sea) are frequent at all stations and dominant at Julsundet, Halsafjorden, Trælbodneset, Gjeveneset and Rjåneset. The strongest winds are also typically associated with southerly flow. While northeasterly winds are frequent at Ona, the local terrain forcing at many of the observation sites typically stagnates such larger-scale flows or rotates them along the main fjord axes. Furthermore, northeasterly flow at Ona is presumably a result of large-scale synoptic flow from a wide sector covering flow from the northwest to the northeast and will hence be associated with different wind directions at each site. The sites most exposed to northeasterly flow are Åkvik, Gjeveneset and Rjåneset, while frequent and strong northerly flow is in fact found at most of the sites, e.g., in Julsundet. In order to facilitate a more direct comparison of the wind conditions at the sites and the variation within the region, wind roses from Ona and the sites, based on data for 1 year, are shown in Fig. 12. Only concurrent data is used for the roses in individual panels, i.e., short periods of downtime are removed for all sites in the same fjord. The wind roses are overlaid on the topography and highlight in a qualitative manner the strong topographic forcing at low levels in the fjords, as well as the large regional variations in the wind conditions for the given year. The similarity of the wind roses for Ona in Figs. 9, 11 and 12 implies that the same spatial variations exist in the regional long-term wind conditions, as for the 1-year period used in Fig. 12.
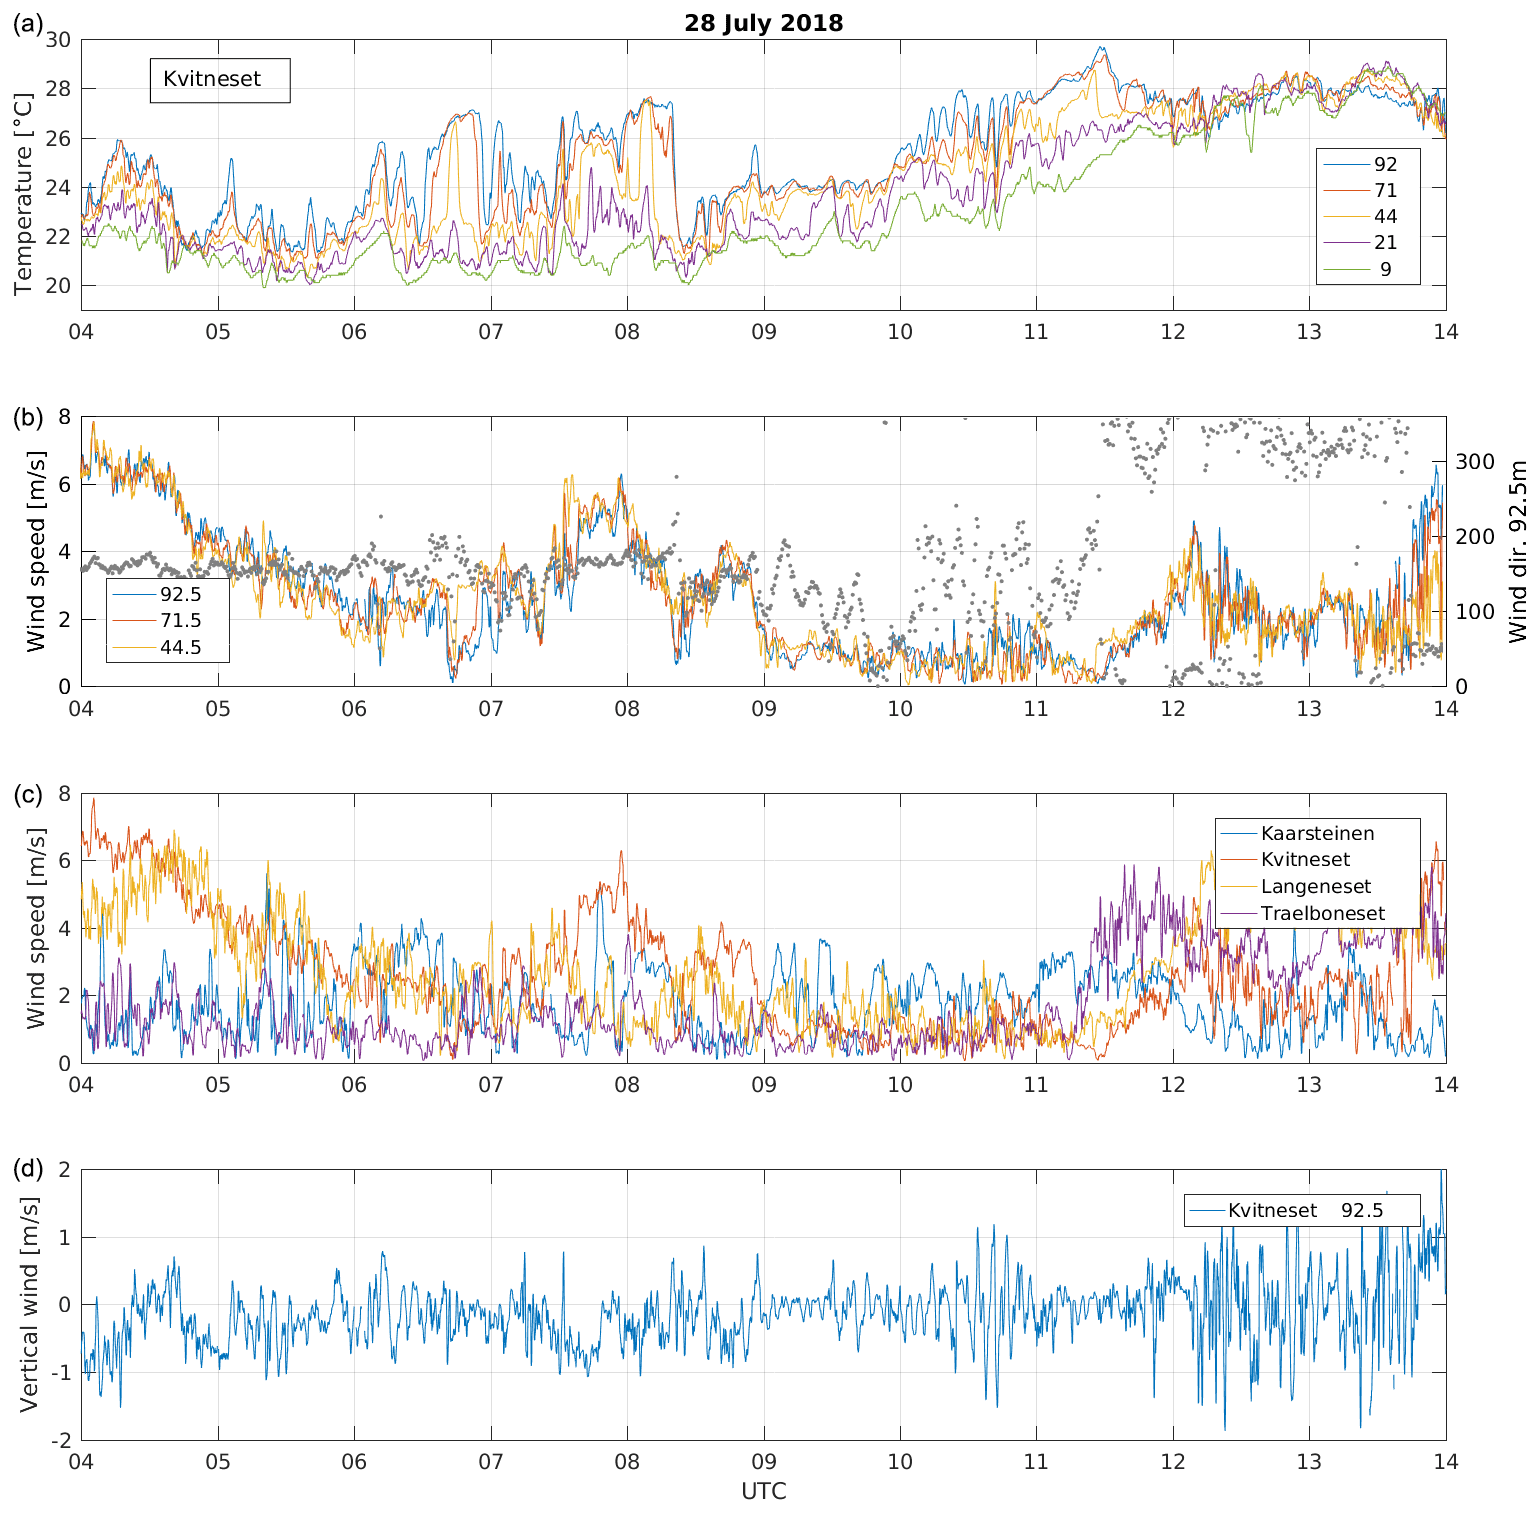
Figure 15Time series of temperature, wind direction, and horizontal and vertical wind speed at Kvitneset (a, b, d) and horizontal wind speed from the top sensor of all four masts in Sulafjorden (c). Sensor heights at Kvitneset are given in the legends. The 10 Hz wind speed data are smoothed using a 30 s median filter.
Vertical wind shear may be extracted from concurrent measurements at several heights. An example from the four masts in Sulafjorden over the 1-year period (1 March 2018–28 February 2019) is shown in Fig. 13a. Fig. 13b shows the mean profiles for wind speed above 10 m s−1 on the top sensors showing increased vertical shear. A meaningful interpretation of mean flow quantities, such as the vertical wind shear in relation to the logarithmic wind profile, requires a more careful analysis of the observational data to be used than typically required away from complex topography. That is to say that the structure of the mean flow will be fundamentally different depending upon, for example, the general flow direction and speed, weather type, and synoptic situation.
The monthly temperature observed at the topmost sensor in the Kvitneset mast is shown in Fig. 14 in addition to temperature observations from the Ona II reference station. There are on average small differences between the monthly temperatures at both sites, with the most notable difference being that the maximum temperature is typically 1–3 ∘C higher at Kvitneset than at Ona. The observed mean monthly temperatures are also quite similar to the mean from the 18-year period. The most notable differences are that April, July and November 2018 and 2019 were 1–2 ∘C warmer than average, while March 2019 was ∼ 2 ∘C colder. To illustrate some of the details in the data, the temperature and wind at Kvitneset during the early part of a warm day on 28 July 2018 are shown in Fig. 15. At this time, there was a high-pressure system over the Kola peninsula and a low-pressure system over the British Isles giving rise to the advection of warm air from the east which was ∼ 20 ∘C at 850 hPa (not shown). Skies were clear, and there was presumably a large-scale subsidence in the lee of the mountains of western and central Norway. The wind was southerly and weakening during the early hours of 28 July 2018, and the lowest temperature was measured at 9 m a.g.l. and the highest temperature at the top of the mast. This is indicative of a very stable boundary layer which is cooled from below by radiative cooling, as well as the sensible heat flux between the ocean surface and the surface layer. There are large oscillations in the temperature at upper levels, especially between 06:00 and 08:20 UTC. These are presumably associated with the advection of warm air which is detached from the colder air below. The top sensors are within this warm layer for long periods, while the depth of the layer varies such that the sensors at 44 and 71 m are only located inside this layer for short periods of time. The wind speed starts to increase, and the vertical mixing increases between 07:00 and 08:00 UTC. At 08:30, the colder surface air appears to be mixed up to at least 100 m, but the layer is, however, still stably stratified. Weak winds and a varying wind direction are associated with the period of strongest solar heating from 09:00 until the early afternoon. There is a gradual warming of the whole layer until 12:00 (noon) at which time the whole layer is well mixed or only weakly stably stratified, and the wind speed has increased at many of the masts. Large variations in the vertical velocity at the top sensor appear to be associated with periods of increased mechanical and convective mixing, in particular between 10:00 and 11:00 UTC. This weak-wind case illustrates the complex interactions of air masses and topography on different scales with strong temporal and spatial variations both in the vertical and the horizontal. Situations of strong wind are likewise characterized by a complex structure of the flow field related to the proximity to the complex terrain (not shown).
Masts on both sides of the fjords allow for the investigation of the simultaneous differences in the wind field on each side of the fjord. An example is given for Halsafjorden (Fig. 16). The mean wind speed is stronger at Åkvik than at Halsaneset for all wind directions except for winds from the south. The strongest winds observed at the masts are observed at Halsaneset during southerly winds, while winds are strongest at Åkvik during the northwesterly flow. This is a result of the orographic forcing and the orientation of the fjord's main axis. The mountain south of the Åkvik mast presumably introduces some sheltering, while the northwesterly flow may be accelerated somewhat along the terrain on the eastern side of the fjord.
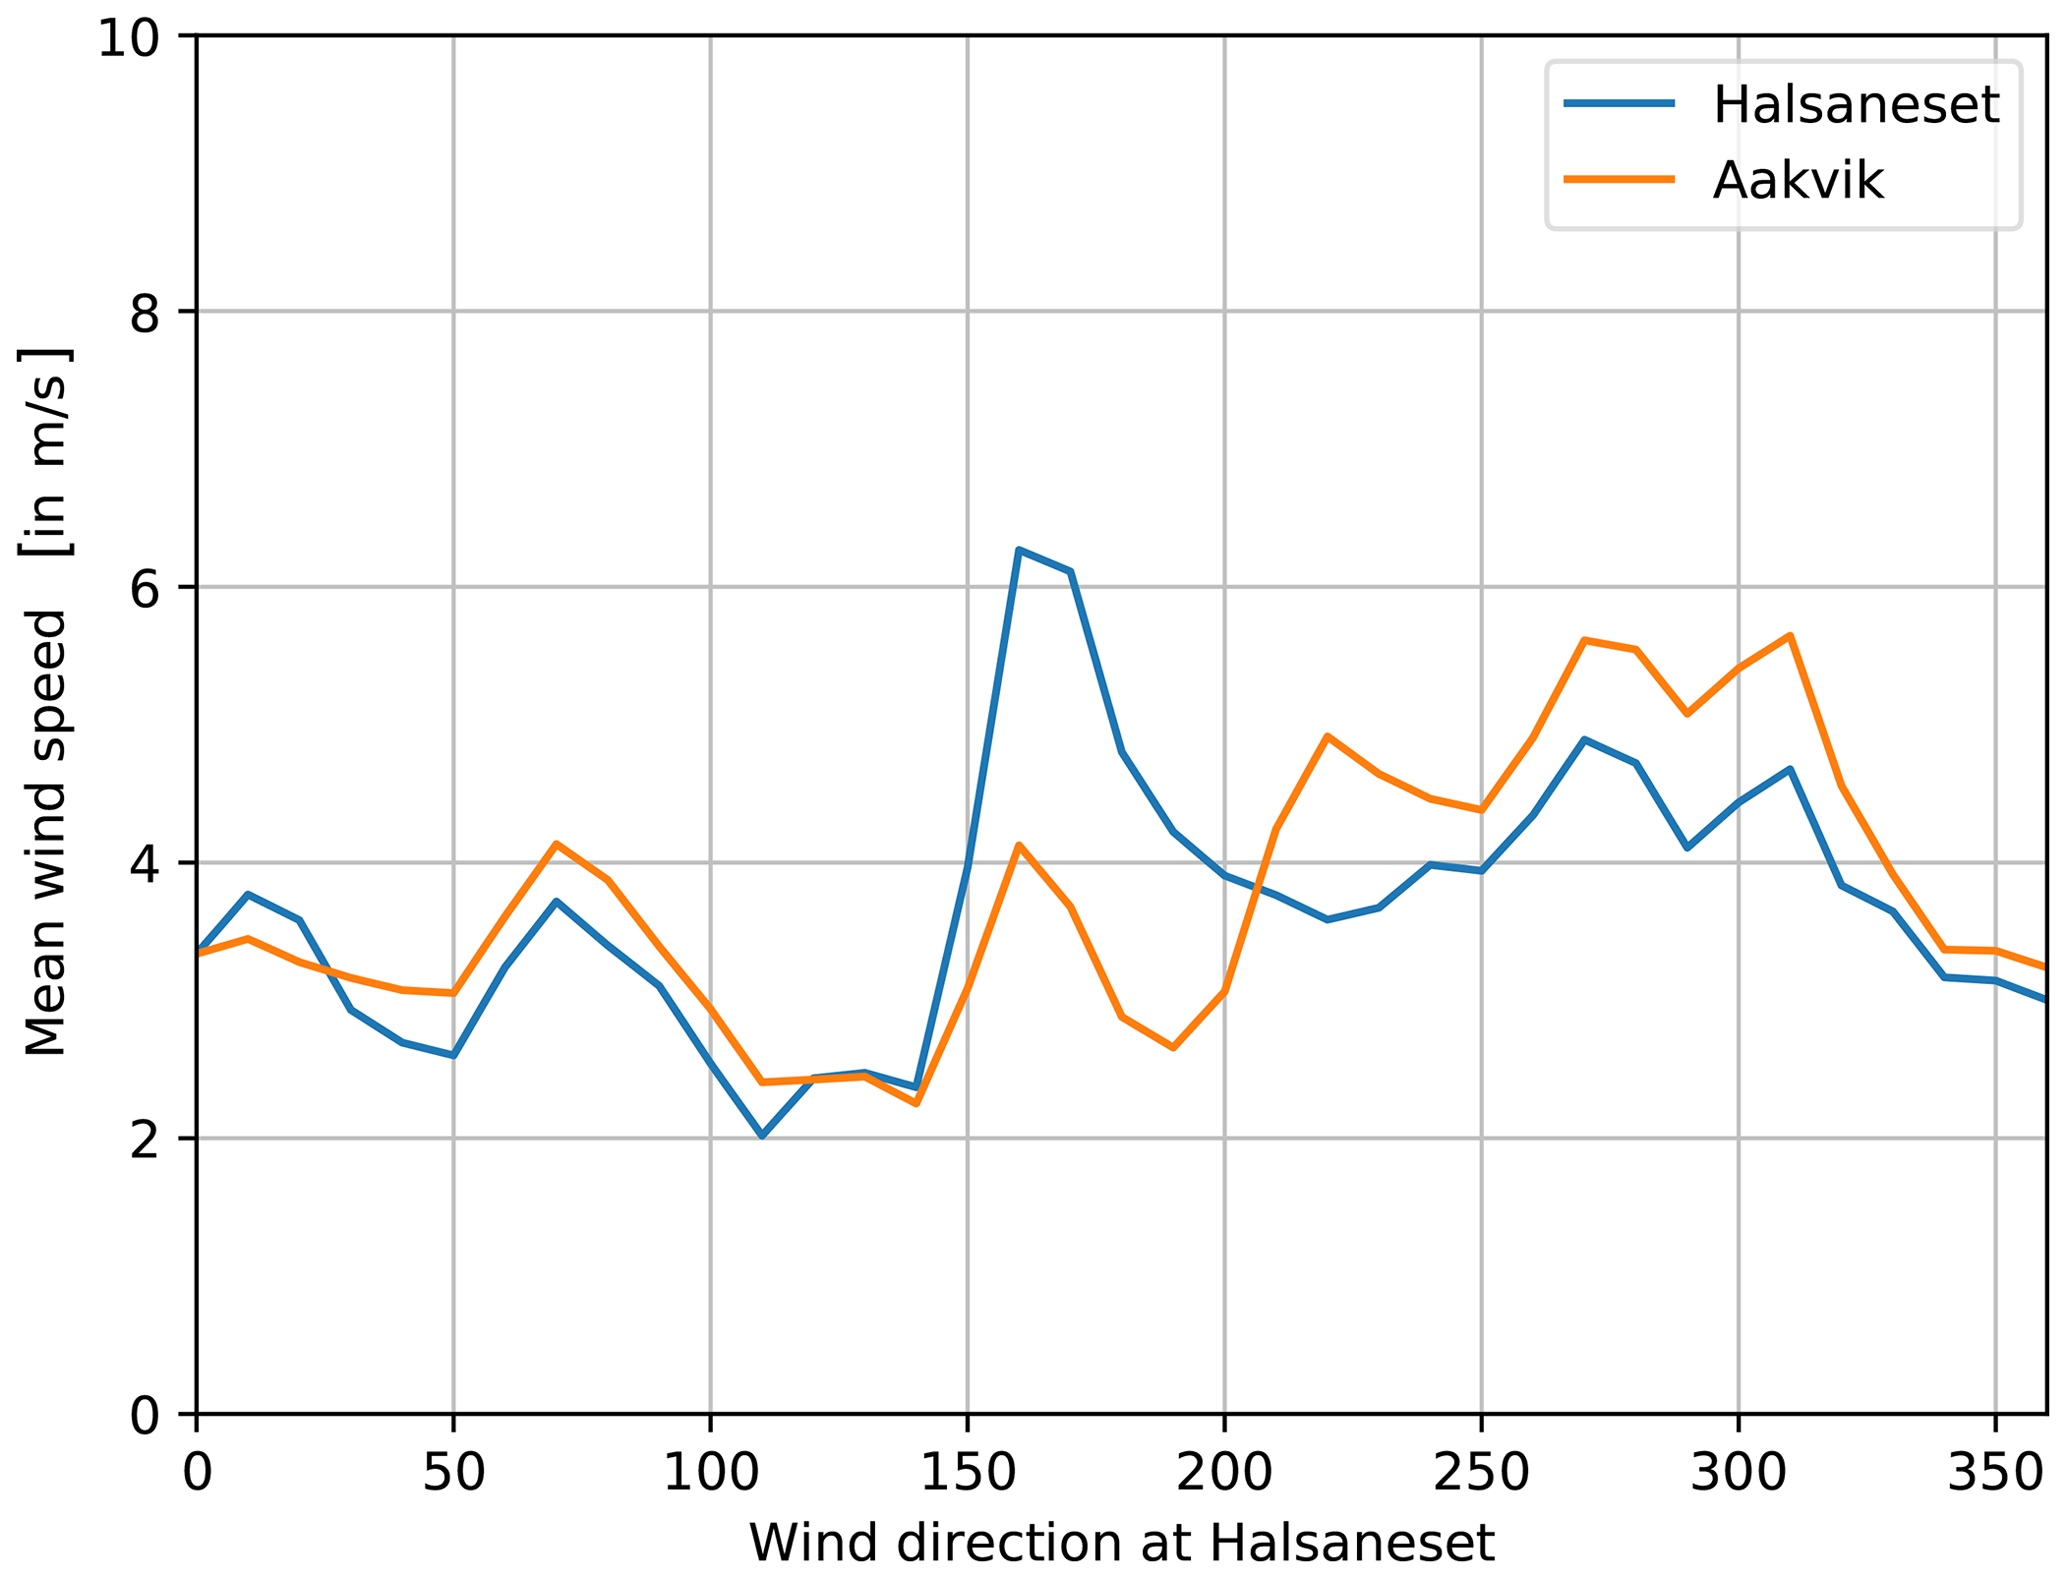
Figure 16Wind speed variation at Halsaneset and Åkvik in Halsafjorden as a function of wind direction at Halsaneset on the western side of the fjord and based on 4 years of data (2016–2019).
As the full three-dimensional wind vector is observed with a temporal frequency of 10 Hz, the turbulence spectral density can be estimated. An arbitrary example of such an estimate is given in Fig. 17, which is based on observations of a northerly storm at 50 m on the Julbø mast. The analysis is based on observations from a 20 min period starting at 13:40 UTC on 1 January 2019. The horizontal wind vector is decomposed into components oriented along the mean wind direction, as well as perpendicular to it. The wind speed data are linearly detrended to ensure the stationarity of the wind data and smoothed to reduce effects from the sharp interval boundary. The spectral density is calculated using a fast Fourier transformation, implemented in a periodogram method in a standard signal processing package (scipy, 2020) in the python programming language. The blue dots are the spectral energy density at individual frequencies, while a 100 point running mean provides a smoother representation of the results. The reduction in energy density with a higher frequency has a similar slope as the power law for turbulence spectra, i.e., as indicated by the theoretical prediction of Kolmogorov (1941). This is as expected and typical for turbulent flow at the site.
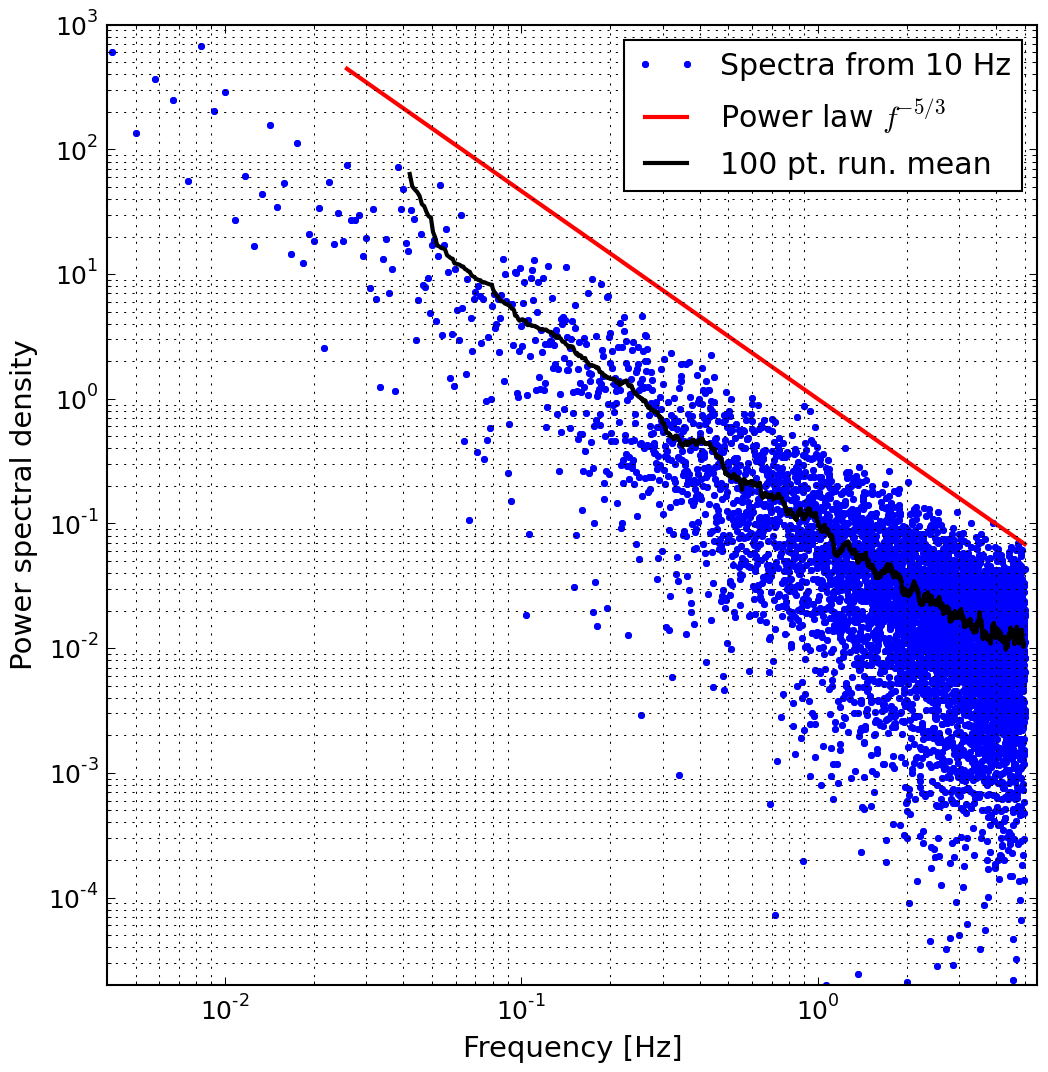
Figure 17Example of turbulence spectra for the along-wind component during a northerly storm with ∼ 25 m s−1 mean wind at the top sensor of the Julbø mast. The spectra are analyzed from the 20 min period before 14:00 UTC on 1 January 2019.
The meteorological station of Ålesund (Nørve, station number 60945) has been operational since 2009 and is used as a reference for precipitation. Brandal station located in Sulafjorden reveals much higher precipitation than what is recorded at Nørve, when comparing to the average conditions both during the last 10 years and also within the same year (Fig. 18). This may be related to the proximity to the steep and high mountains at Brandal, stronger forced uplift during northerly flow and more spillover during southerly flow.

Figure 18Monthly measured precipitation at Brandal (green) compared to the same period (blue) and a mean for 2009–2019 (orange) at the reference station Nørve in Ålesund.
The data are available on the MET Norway API http://frost.met.no (last access: February 2020) (precipitation measurements at Brandal II with station number 59570) and from the Arctic Data Centre (ADC): https://doi.org/10.21343/z9n1-qw63 (Furevik et al., 2019). They are registered as a data collection as it is a dynamic dataset which is growing in time. The data are typically updated on a daily basis, but data missing in the first dissemination to the server are typically available with a lag of 1–3 months.
The data on ADC are posted as a file for the raw data (10 Hz) and a file for the 10 min mean wind speed separately for each mast and each month. Each file contains data from the different heights at the specific mast, including self-describing metadata such as geographical location and sensor heights. Temperature at different heights is also posted for each month for two masts (Kvitneset and Trælbodneset, files of type temp_0p2hz). Additional meteorological data from the weather mast at Kvitneset, i.e., tMetpack_1hz (temperature), prsMetpack_1hz (air pressure), dewpointMetpack_1hz (dew point temperature) and RHMetpack_1hz (relative humidity), are posted in files with KvitnesetKlima in the file name.
We have presented the atmospheric part of a unique and large atmospheric and oceanic dataset which is presently being built in connection with several planned fjord crossings for the Coastal Highway E39 project of the NPRA. The atmospheric part of this measurement program includes wind observations from 12 tall masts in the three different fjord systems of mid-Norway. It started in 2014 and is presently ongoing. The overall data return is 98.9 %. The data collection is described, including a short summary of the geography at the sites. Examples of observed parameters are presented and put in context with observations and long-term conditions at reference weather stations. The examples illustrate the quality of the data but also the strong influence of the steep terrain on the wind measurements from these land-based masts. In addition to local design and planning of infrastructure, the data collection may be useful for investigating boundary flow in complex terrain and for verification of numerical modeling. In combination with remote sensing and oceanographic data from buoys deployed for the project, it offers a solid basis for the study of a fjord system over at least a decade. The data collection may furthermore be useful for the industry or in other fields of research, for which wind climate is of importance.
BRF is responsible for publication of the dataset and writing of the paper together with HÁ. HÁ is responsible for the first line of quality control and a systematic analysis of the dataset, as well as processing of files into netCDF format and transfer to MET Norway. ALB is responsible for further quality control of files, aggregation into monthly files and posting to the repository. BRF, HÁ and ZM made the analyses presented in this paper. FN is responsible for the design, deployment and maintenance of the masts and instrumentation. MG is in charge of the measurement campaign for the Coastal Highway E39 project in mid-Norway.
The authors declare that they have no conflict of interest.
We acknowledge the contribution of Jørn Arve Hasselø at NPRA, who leads the fjord crossing project, together with Magne Gausen. Knut Harstveit is acknowledged for his part in the design of the measurement campaign as is Nina Elisabeth Larsgård for her part in the planning of the precipitation site at Brandal. Map layers (used in Figs. 1–3, 5–8 and 12) are obtained from the Norwegian Mapping Authority (https://kartverket.no/, last access: September 2020). The Norwegian Mapping Authority's free products are licensed under Creative Commons Attribution 4.0 International (CC BY 4.0).
This work and the measurement campaign are financed by the Norwegian Public Roads Administration as part of the Coastal Highway E39 project in mid-Norway.
This paper was edited by Ge Peng and reviewed by three anonymous referees.
Andersen, O. J. and Løvseth, J.: Gale force maritime wind. The Frøya data base. Part 1: Sites and instrumentation. Review of the data base, J. Wind Eng. Ind. Aerod., 57, 97–109, https://doi.org/10.1016/0167-6105(94)00101-I, 1995.
Andersen, O. J. and Løvseth, J.: The Frøya database and maritime boundary layer wind description, Mar. Struct., 19, 173–192, https://doi.org/10.1016/j.marstruc.2006.07.003, 2006.
Barstad, I. and Grønås, S.: Southwesterly flows over southern Norway-Mesoscale sensitivity to large-scale wind direction and speed, Tellus A, 57, 136–152, https://doi.org/10.3402/tellusa.v57i2.14627, 2005.
Capozzi, V., Cotroneo, Y., Castagno, P., De Vivo, C., and Budillon, G.: Rescue and quality control of sub-daily meteorological data collected at Montevergine Observatory (Southern Apennines), 1884–1963, Earth Syst. Sci. Data, 12, 1467–1487, https://doi.org/10.5194/essd-12-1467-2020, 2020.
Eriksen, O. K.: E39, brukrysninger Julsundet og Halsafjorden, Møre og Romsdal, statusrapport for vindmålinger pr juni 2019, Kjeller Vindteknikk, Lillestrøm, Norway, Technical report KVT/OKE/2019/R080, 38, 2019.
Furevik, B. R., Ágústsson, H., Lauen Borg, A., and Nyhammer, F.: The E39 coastal highway observational dataset – atmospheric flow in complex coastal terrain in Mid-Norway, Norwegian Meteorological Institute, https://doi.org/10.21343/z9n1-qw63, 2019.
Gill Instruments: Software bug affecting “w” wind component of the WindMaster family, Technical key note, Open File Key note series number KN1509v6, 6 pp., available at: http://gillinstruments.com/data/manuals/KN1509-WM-WMPro-W-Bug-Info-Sheet.pdf (last access: February 2020), 2016.
Godø, O. R., Johnsen, S., and Torkelsen, T.: The LoVe Ocean Observatory is in Operation, Mar. Technol. Soc. J., 48, 24–30, https://doi.org/10.4031/MTSJ.48.2.2, 2014.
Haslerud, A. S.: Analysis of wind measurements from 6 masts at Sulafjorden 24.11.2016–31.03.2019, Kjeller Vindteknikk, Technical report KVT/ASH/2019/R033, 292 pp., 2019.
Hubbard, K., You, J., and Shulski, M.: Toward a Better Quality Control of Weather Data,Practical Concepts of Quality Control, edited by: Saber, M. and Nezhad, F., ISBN: 978-953-51-0887-0, InTech, https://doi.org/10.5772/51632, 2012.
Jonassen, M. O., Ólafsson, H., Reuder, J., and Olseth, J. A.: Multi-scale variability of winds in the complex topography of southwestern Norway, Tellus A, 64, 11962, https://doi.org/10.3402/tellusa.v64i0.11962, 2012.
Kolmogorov, A.: The local structure of turbulence in incompressible viscous fluid for very large Reynolds' numbers, C. R. Acad. Sci. USSR, 30, 301–335, 1941.
Kristjánsson, J. E., Barstad, I. , Aspelien, T., Føre, I. , Godøy, Ø., Hov, Ø., Irvine, E., Iversen, T., Kolstad, E., Nordeng, T. E., McInnes, H., Randriamampianina, R., Reuder, J., Sætra, Ø., Shapiro, M., Spengler, T., and Ólafsson, H.: The Norwegian IPY–THORPEX: Polar Lows and Arctic Fronts during the 2008 Andøya Campaign, B. Am. Meteorol. Soc., 92, 1443–1466, https://doi.org/10.1175/2011BAMS2901.1, 2011.
Reigstad, M., Eldevik, T., and Gerland, S.: The Nansen legacy, Fram Forum 2019, Framsenteret AS, 100–105, available at: https://framsenteret.no/wp-content/uploads/2019/03/Framforum-2019-digital.pdf (last access: 11 December 2020), 2019.
Renfrew, I. A., Moore, G. W., Kristjánsson, J. E., Ólafsson, H., Gray, S. L., Petersen, G. N., Bovis, K., Brown, P. R., Føre, I., Haine, T., Hay, C., Irvine, E. A., Lawrence, A., Ohigashi, T., Outten, S., Pickart, R. S., Shapiro, M., Sproson, D., Swinbank, R., Woolley, A., and Zhang, S.: The Greenland flow distorsion experiment, B. Am. Meteorol. Soc., 89, 1307–1324, https://doi.org/10.1175/2008BAMS2508.1, 2008.
SciPy, Signal Processing (scipy.signal): Documentation of software, available at: https://docs.scipy.org/doc/scipy/reference/tutorial/signal.html, last access: February 2020.
Standard Norge: Actions and action effects, 148 pp., NORSOK N- 003:2017, 2017, available at https://www.standard.no/no/Nettbutikk/produktkatalogen/Produktpresentasjon/?ProductID=873200, last access: December 2020.
Steinacker, R., Mayer, D., and Steiner, A.: Data Quality Control Based on Self-Consistency, Mon. Weather Rev., 139, 3974–3991, https://doi.org/10.1175/MWR-D-10-05024.1, 2011.
Steinhoff, T., Gkritzalis, T., Lauvset, S. K., Jones, S., Schuster, U., Olsen, A., Becker, M., Bozzano, R., Brunetti, F., Cantoni, C., Cardin, V., Diverrès, D., Fiedler, B., Fransson, A., Giani, M., Hartman, S., Hoppema, M., Jeansson, E., Johannessen, T., Kitidis, V., Körtzinger, A., Landa, C., Lefèvre, N., Luchetta, A., Naudts, L., Nightingale, P. D., Omar, A. M., Pensieri, S., Pfeil, B., Castaño-Primo, R., Rehder, G., Rutgersson, A., Sanders, R., Schewe, I., Siena, G., Skjelvan, I., Soltwedel, T., van Heuven, S., and Watson, A.: Constraining the Oceanic Uptake and Fluxes of Greenhouse Gases by Building an Ocean Network of Certified Stations: The Ocean Component of the Integrated Carbon Observation System, ICOS-Oceans, Front. Mar. Sci., 6, 544 pp., https://doi.org/10.3389/fmars.2019.00544, 2019.
Tallhaug, L.: E39, Julsundet, Midsund kommune – vibrasjonsmåling Nautneset. Kjeller Vindteknikk, Lillestrøm, Norway, Technical report KVT/LT/2017/R046, 5 pp., 2017.