the Creative Commons Attribution 4.0 License.
the Creative Commons Attribution 4.0 License.
 | 17 Dec 2020
Dielectric database of organic Arctic soils (DDOAS)
Valery Mironov
Konstantin Muzalevskiy
Sergey Fomin
Andrey Karavayskiy
Zdenek Ruzicka
Yuriy Lukin
This article presents a dielectric database of organic Arctic soils (DDOAS). The DDOAS was created based on the dielectric measurements of seven samples of organic-rich soils collected in various parts of the Arctic tundra: Yamal Peninsula, Taimyr Peninsula, Samoylov Island (all in the Russian Federation) and the northern slope of Alaska (US). The organic matter content (by weight) of the presented soil samples varied from 35 % to 90 %. The refractive index (RI) and normalised attenuation coefficient (NAC) were measured under laboratory conditions by the coaxial-waveguide method in the frequency range from ∼ 10 MHz to ∼ 16 GHz, while the moisture content changed from air-dry to field capacity, and the temperature changed from −40 to +25 ∘C. The total number of measured values of the RI and NAC contained in the database is more than 1.5 million. The created database can serve not only as a source of experimental data for the development of new soil dielectric models for the Arctic tundra but also as a source of training data for artificial intelligence satellite algorithms of soil moisture retrievals based on neural networks. The DDOAS is presented as Excel files. The files of the DDOAS are available on https://doi.org/10.5281/zenodo.3819912 (Savin and Mironov, 2020).
- Article
(2590 KB) - Full-text XML
- BibTeX
- EndNote


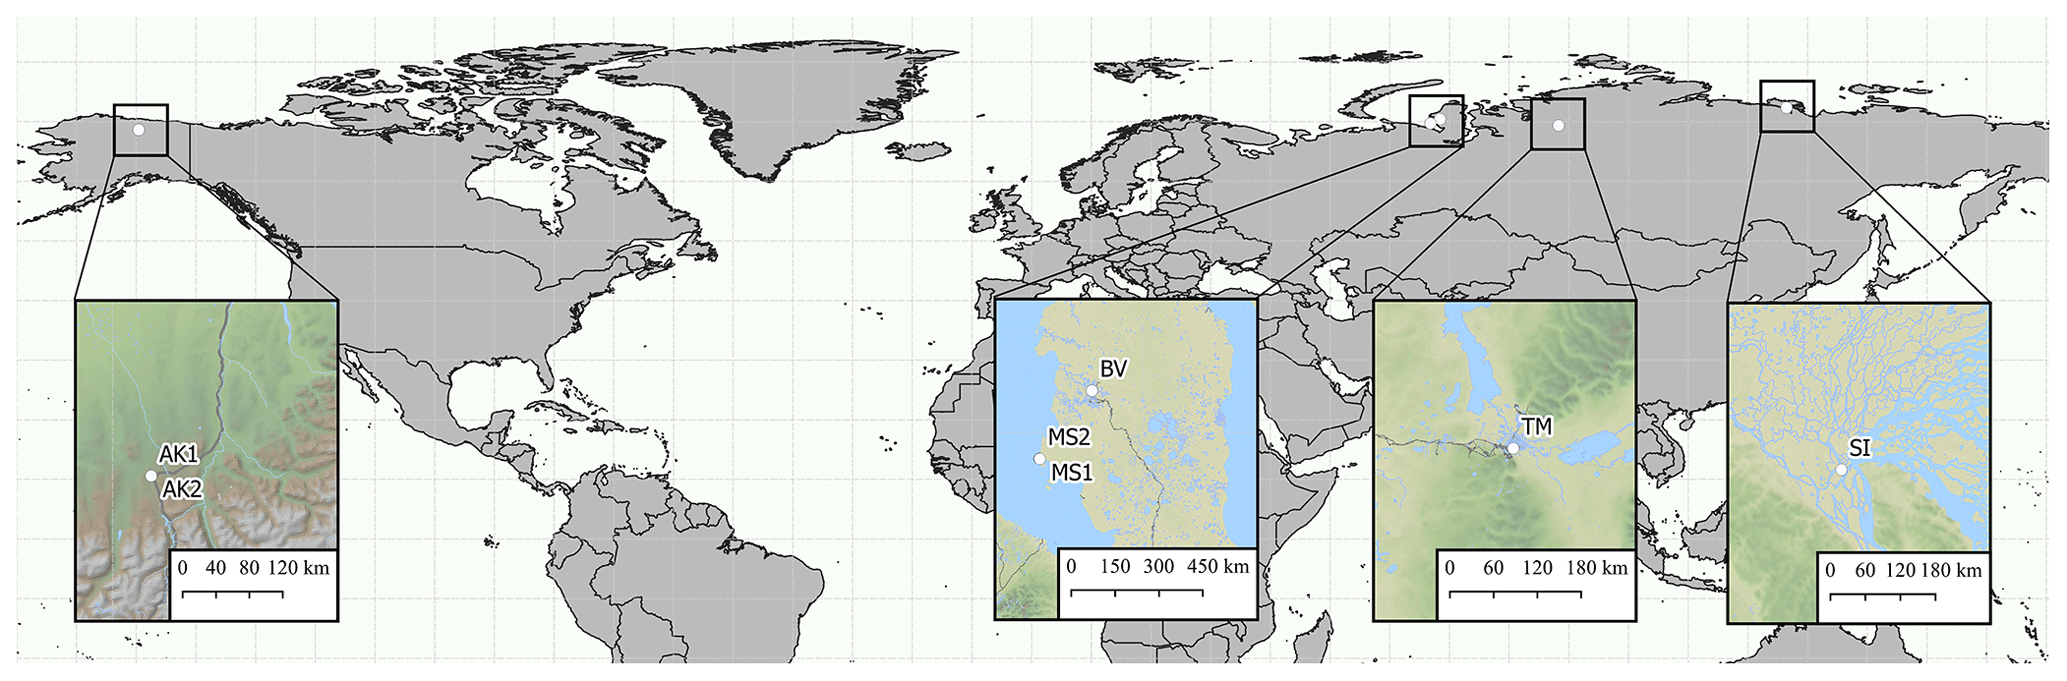
Figure 1Location map of soil sampling test sites.
The last 5-year (2015–2019) and 10-year (2010–2019) average surface air temperatures are the warmest in instrumental records. The global mean surface air temperature (2 m above ground level) for 2019 was around 1.1 ± 0.1 ∘C above the 1850–1900 baselines, used as an approximation of pre-industrial levels (WMO, 2020). Moreover, significant temperature anomalies from +2 to +4 ∘C were observed in the Arctic region. The continuing long-term tendency to increase the average surface air temperature in the Arctic region contributes to the formation of anomalous heat flows deep in the soil, their heating and their thawing. If carbon stored below ground is transferred to the atmosphere by a warming-induced acceleration of its decomposition, positive feedback to climate change will occur (Schuur and Abbott, 2011). The field studies that do exist confirm that permafrost thaw is tightly linked to temperature as well as soil moisture (Davidson and Janssens, 2006). Therefore, remote sensing of the soil moisture plays a key role in determining the rate of soil carbon cycling and carbon emission in northern environments. Nowadays SMAP (Soil Moisture Active Passive) and SMOS–MIRAS (Soil Moisture and Ocean Salinity–Microwave Imaging Radiometer with Aperture Synthesis) satellites radiometers operating at a frequency of 1.4 GHz (L band) (Wigneron et al., 2017), GCOM-W1–AMSR2 (Global Change Observation Mission–Advanced Microwave Scanning Radiometer) satellite radiometer operating at frequencies above 6.9 GHz (Gao et al., 2018), and MetOp–ASCAT (Meteorological Operational–Advanced Scatterometer) satellite radar operating at a frequency of 5.3 GHz (C band) (Brocca et al., 2017) are used to monitoring soil moisture in the layer thickness of 2.5–5.0 cm (Choudhury et al., 1979; Escorihuela et al., 2010). The permittivity model of soils is an essential element in the physical-based algorithms of soil moisture retrieval with using remote sensing data of the current radiometric and radar satellites. Mironov's model (Mironov et al., 2009, 2012) of mineral soils used in current SMAP (Walker et al., 2019) and SMOS (Wigneron et al., 2017) has physical-based retrievals algorithms. For the reason that surface horizons of Arctic land cover represents organic-rich soils, the structural characteristics of which are differing from the ones of mineral soils, the error of soil moisture retrievals in northern regions is substantially higher than for moderate latitudes (Al-Yaari et al., 2017; Wrona et al., 2017). To date, none of the known dielectric models of organic soils (Bircher et al., 2016; Jin et al., 2017; Liu et al., 2013; Mironov et al., 2015a, 2015b, 2018, 2020; Mironov and Savin, 2015, 2016, 2019; Park et al., 2019) are used in operational algorithms of existing satellites to retrieve soil moisture in the Arctic regions. This work presents the unique database of the laboratory dielectric measurements of organic-soil samples. These soil samples were taken in various places in the Arctic region. Earlier, based on these soil samples, the dielectric models of organic-rich soils were developed for use in the algorithms of soil moisture retrieval in the Arctic region in different frequency ranges (Mironov et al., 2015a, b, 2018, 2020; Mironov and Savin, 2015, 2016, 2019). Taking into account the success of the previously developed and acknowledged Mironov's dielectric model (Mironov et al., 2009, 2012), which was created including the datasets of dielectric measurements published in the open press (Curtis et al., 1995; Dobson et al., 1985; Hallikainen et al., 1985), we decided to publish our original high-quality laboratory dielectric measurement data for the samples of organic Arctic soils. The created database can serve not only as a source of experimental data for the development of new soil dielectric models for the Arctic tundra but also as the source of training data for the artificial intelligence satellite algorithms of soil moisture retrievals based on neural networks (Rodriguez-Fernandez et al., 2015). Moreover as was noted in Bircher et al. (2016), Mironov's temperature-dependent dielectric models for organic soils could be exploited in satellite data applications where negative temperatures are one of the major drivers (e.g. freeze–thaw, permafrost or snow-related products).
The available soil samples were taken from the organic horizon of soils at four geographically different areas, placed in typical Arctic tundra regions (see Fig. 1). Soil sample no. 1 (BV) was collected on the Yamal Peninsula not far from the Bovanenkovo oil and gas field. The landscape of the site was moistened non-drainable tundra. The surface is flat, finely hummocky. Vegetation cover presents sedges, moss with dwarf willow shrubs and a projective cover of 100 %, up to 2–5 cm thick. Soil sample no. 2 (MS1) and no. 3 (MS2) were also collected on the Yamal Peninsula in the area of the Marresale weather station on the western coast of the Kara Sea. The landscape of the test site no. 2 was moistened tundra with a relatively flat surface. The canopy was presented by a moss–lichen cover with cowberry shrubs, a projective cover of 90 %–100 % and a thickness of up to 4–10 cm. The topsoil horizon (up to a depth of 5–10 cm) is represented by brown peaty loamy sands. Peat formation decreases rapidly with depth, and deeper soil is represented by grey sandy loam soils.
Table 1Sampling points and geophysical characteristics of the studied soil samples.
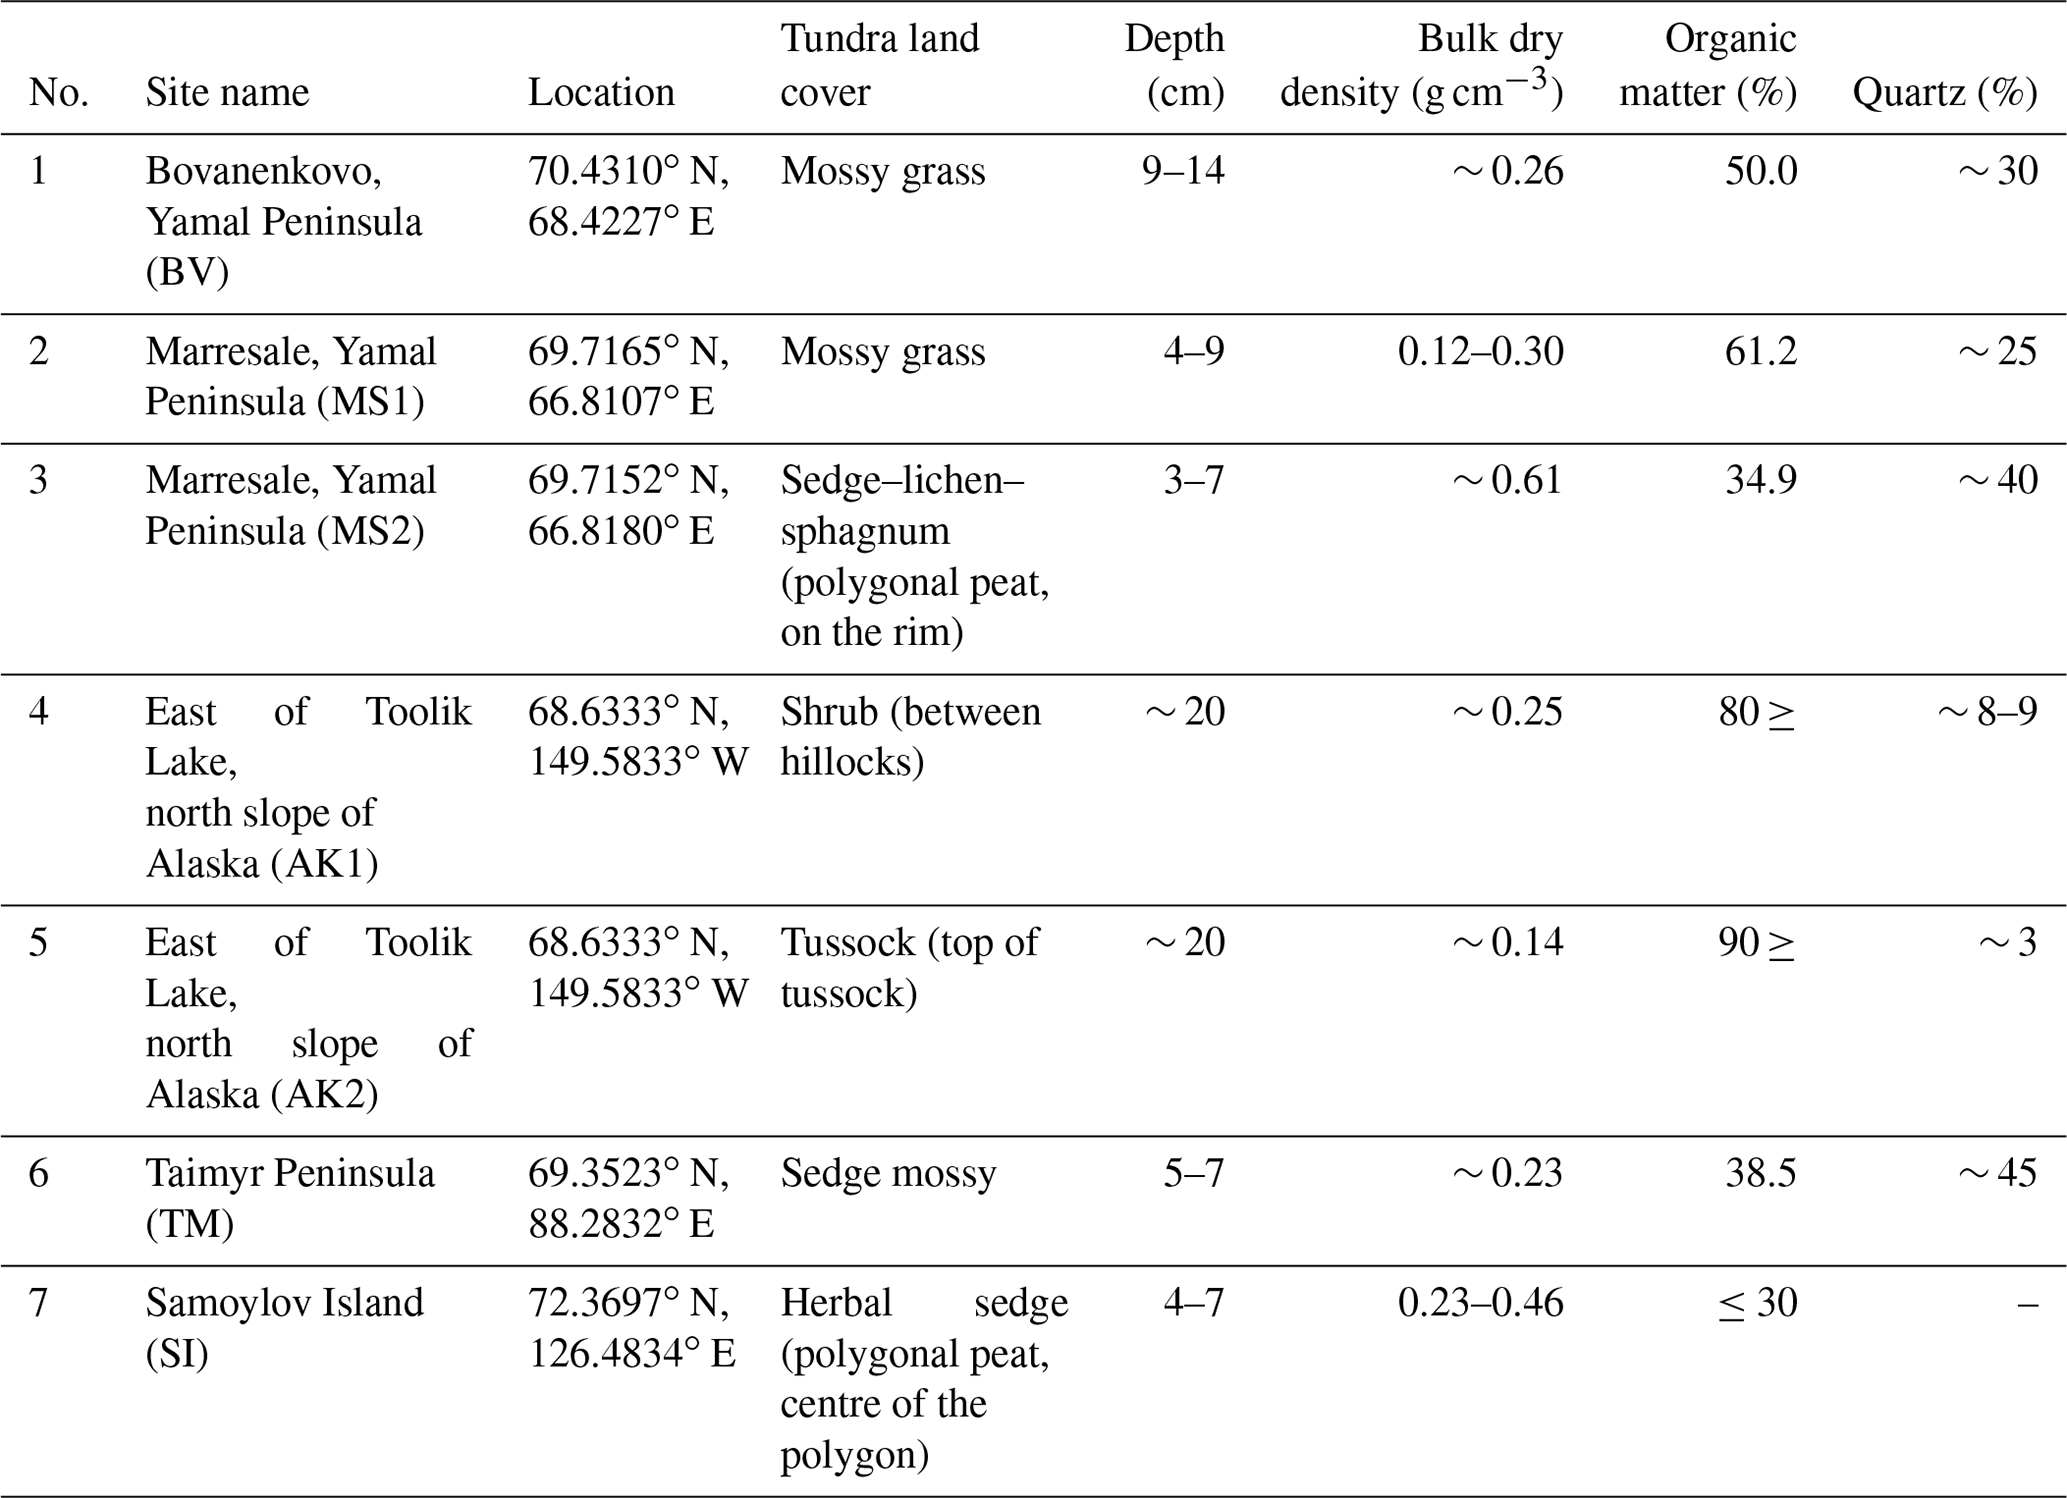
The border between peaty and sandy loam soils is sub-horizontal, gradual and blurred. The location of sampling no. 3 is a peat bog (hillock) with a bumpy-cavity surface. The vegetation canopy was represented by moss–lichen; cloudberry shrubs, with a projective cover of 100 %; and a thickness up to 3–8 cm, gradually transforming into peat. Peat is brown and slightly decomposed at the surface of the soil. The degree of the decomposition of peat increases to medium with increasing depth. Soil samples no. 4 (AK1) and no. 5 (AK2) were collected from two sites that were on opposite sides of a little-used roadway east of Toolik Lake, north slope of Alaska. The terrain is moist acidic tussock tundra. The landscape has reverted to a dryer condition and is now supporting considerable shrub growth. The location of sampling no. 6 (TM) is dry tundra with a relatively flat surface. The vegetation canopy was represented by herbs and mosses, with a projective cover of 90 %–100 % thickness up to 5 cm. Soil sample no. 7 (SI) was collected on Samoylov Island in the polygon centre of polygonal tundra. The diameter of the polygon was about 12–18 m. The dominant plant was herbal-sedge dwarf willows. The thickness of the organic layer is 15–25 cm; the content of organic matter decreased with soil depths. All soil samples were retrieved from the thawed ground in the form of cylindrical cores of 25 cm height and 15 cm diameter. The coordinates of the core sampling sites, the depth of soil sampling for dielectric measurements, their dry bulk density and brief mineralogical composition are given in Table 1.
The procedure for measuring and preparing samples is described in detail in (Mironov et al., 2015a). At first, the soil was crushed to a homogeneous state by a pounder. Next, it was dried in an oven at 60 ∘C for 24 h. Then, a certain amount of distilled water was added to dry soil samples of equal volume, after which each sample was thoroughly mixed and sealed for 24 h to distribute the water inside the sample evenly. The sample, thus obtained, was placed in a measuring cell, which is the segment of coaxial-waveguide line with a cross section of 7/3 mm. The cells lengths of 17 mm or 37 mm were selected depending on the dielectric loss (moisture content) in the sample. The cells volumes were 0.529 and 1.152 cm3, respectively. For uniform compaction of the soil inside the cell, a cylindrical pestle was used.
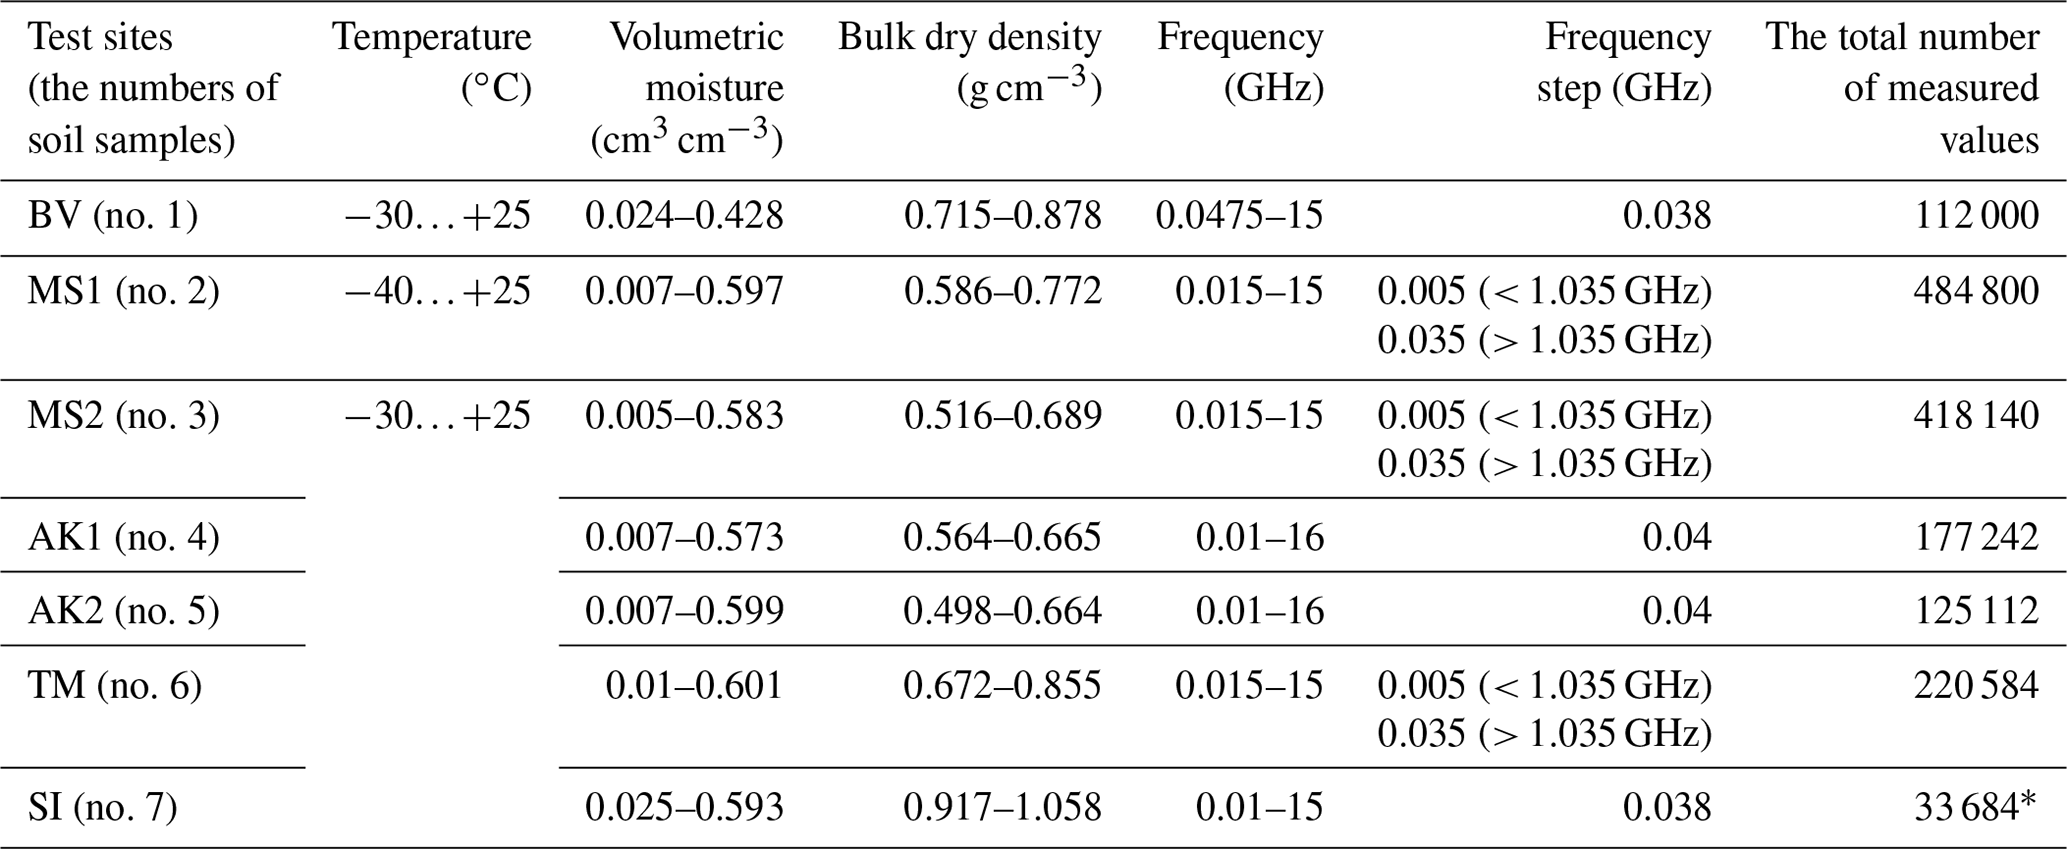
Table 2Range of variations in temperature, moisture, the density of soil samples and wave frequency when measuring RI and NAC of soil samples.
* This is due to the fact that the datasets were obtained at different times, from 2007 to 2017 for various purposes and projects, such as for creating models or their testing.
To conduct dielectric measurements, the cell with its specimen was placed into the Espec SU-241 temperature chamber and was connected to a Rohde & Schwarz ZVK (Keysight PNA-L) vector network analyser for the measuring of scattering matrix elements S11, S22, S12 and S21. The measurement process was automatised. The temperature chamber and network analyser were connected to the computer and controlled by specially developed software. This hardware and software complex made it possible to set the chamber temperature (Espec SU-241 accuracy is 0.5 ∘C) with a specific step and measure the spectra of scattering matrix elements. During the measurement, the temperature in the chamber was set by software. After the thermodynamic equilibrium is established in the chamber (monitors by the chamber), the S12 value starts to be read every second (to monitor of thermodynamic equilibrium, which establishes in the specimen). If a standard deviation between two successive measurements of S12 becomes less than 0.01 dB, then all S parameters are measured, and then the next temperature in the chamber is set, and the process is repeated. These measurements for one specimen take about 8–15 h in the temperature range from −30 to 25 ∘C. As dielectric measurements were finished, the soil specimen was removed from the coaxial cell, its moisture (by weight) and dry bulk density were determined by the thermogravimetric method. To obtain the dielectric spectra of soil specimens using the measured values of S11, S12, S22 and S21, the algorithm developed in Mironov et al. (2010, 2013) was used assuming that only the TEM (transverse electromagnetic mode) wave mode propagates in the coaxial cell in the frequency range 0.01–16 GHz. For further detail, the sources of hardware and measurement method errors are described in articles of Mironov et al. (2010, 2013). This algorithm provides the retrieval of the real and imaginary parts of the relative complex permittivity with errors of less than 9 %. Dielectric measurements were carried out using the equipment of the Krasnoyarsk Science Center of the Siberian Branch of the Russian Academy of Sciences federal research centre. The range of variations in the volumetric moisture, the dry bulk density, the soil specimen temperature and the wave frequency during the measurements of refractive index (RI) and normalised attenuation coefficient (NAC) are presented in Table 2.
Table 3Presentation of measurement data of the refractive index and normalised attenuation coefficient in a worksheet of the Excel file.
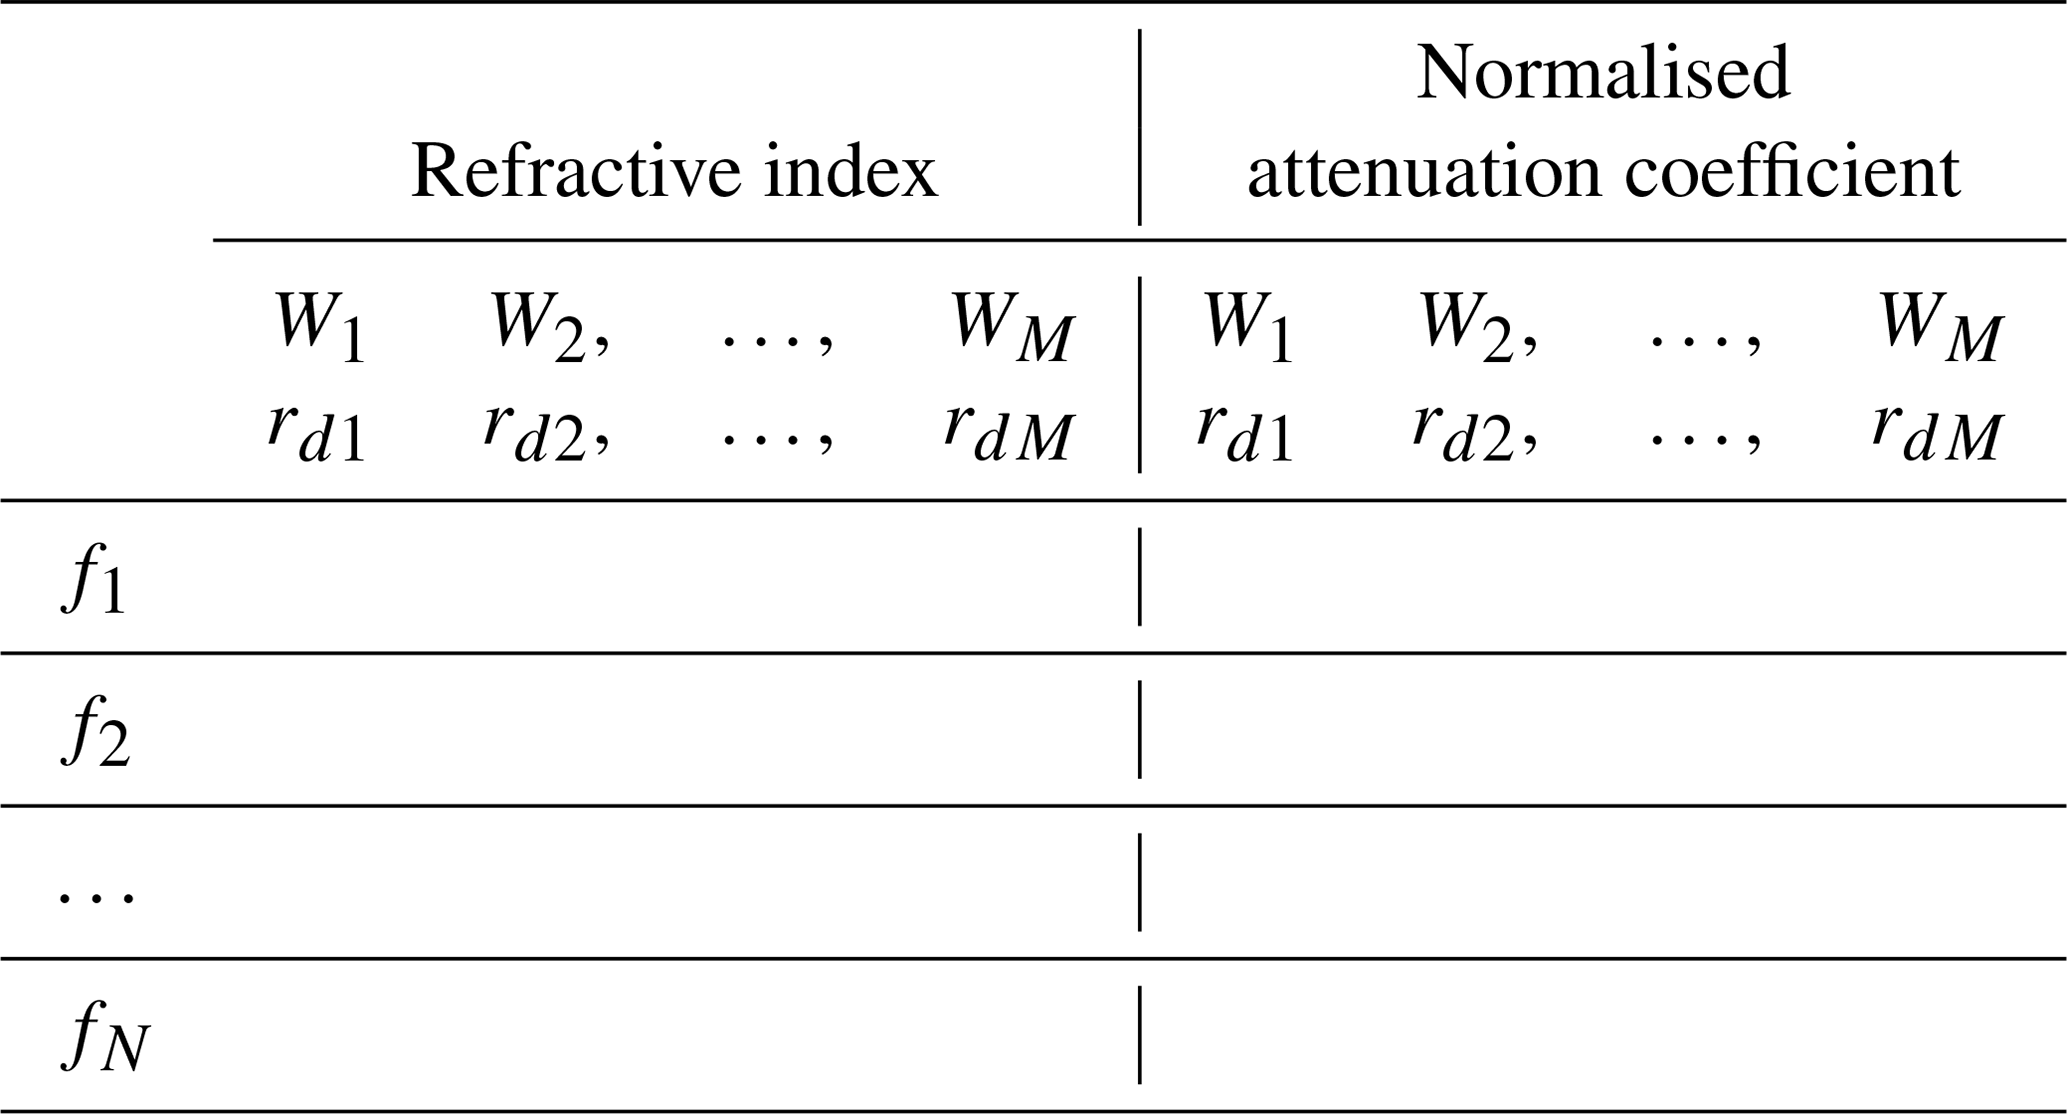
Wj is the jth value of volumetric soil moisture (cm3 cm−3); rdj is the jth value of soil bulk dry density (g cm−3); fk is the kth value of wave frequency (Hz). N and M are the numbers of individual measurements of soil samples in the range of frequencies from f1 to fN and moisture from W1 to WM with correspondent values of soil bulk dry density from rd1 to rdM, respectively.
All dielectric and auxiliary measurements were collected in the dielectric database of organic Arctic soils (DDOAS). The DDOAS is presented in the Excel files (*.xls), and it contains more than 1.5 million measured values of the refractive index (RI) and normalised attenuation coefficient (NAC) (see Table 2). Values of RI, n, and NAC, κ, are related to the value of complex permittivity , where ε′ and ε′′ are the real and imaginary parts of complex permittivity, respectively, and i is the imaginary unit, following the formulas
The name of the file corresponds to the name of test sites on which the soil was collected (for example, for test site no. 2: MS1.xls). Each file contains the complete set of measured data for the corresponding soil sample: the value of RI and NAC, the wave frequency, the volumetric moisture content, the dry bulk density, and the temperature of the soil sample. The variation ranges of these physical values during the measurement for each soil sample are shown in Table 2. The data in each file are organised in the form of tables on separate worksheets (see Table 3). The name of each worksheet (tabs) corresponds to the temperature of the sample at which dielectric measurements were made. The DDOAS allows for representing the measured values of RI and NAC in three axes: frequency, moisture and temperature dependences.

Figure 2The spectra of the refractive index (RI) for sample no. 6 (TM) depending on the volumetric moisture content (W) of the soil sample at a temperature of T=25 ∘C. Volumetric moisture has dimension W (cm3 cm−3) here and in other figures.
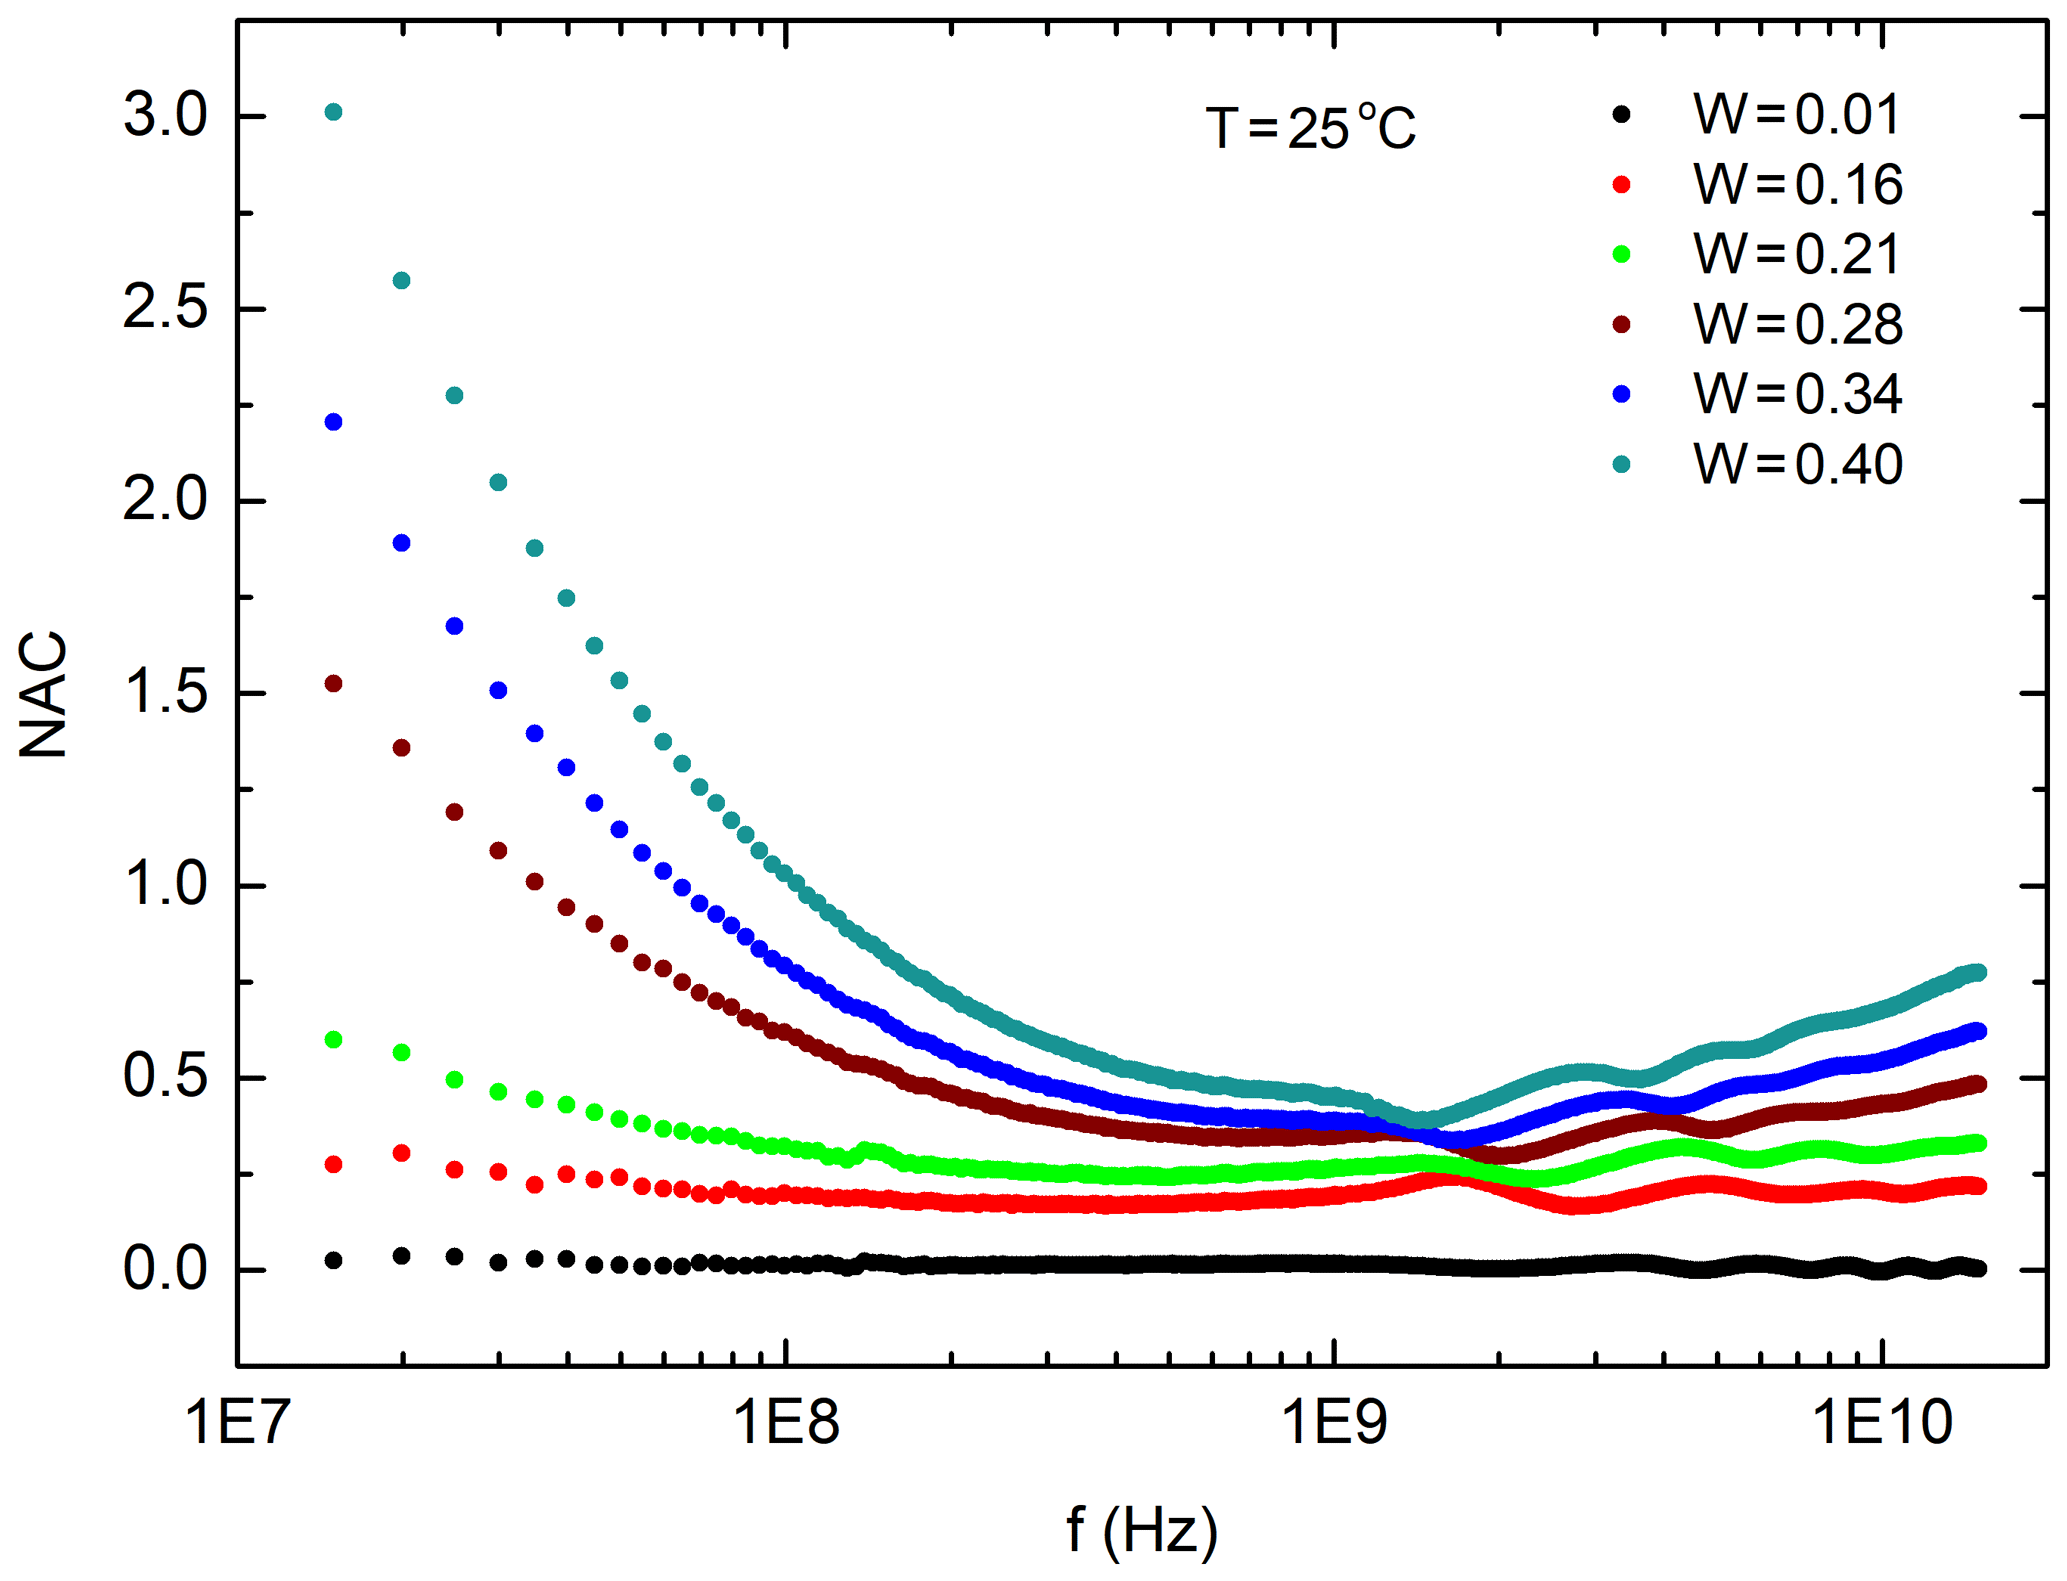
Figure 3The spectra of the normalised attenuation coefficient (NAC) for sample no. 6 (TM) depending on the volumetric moisture content of the soil sample (W) at a temperature of T=25 ∘C.
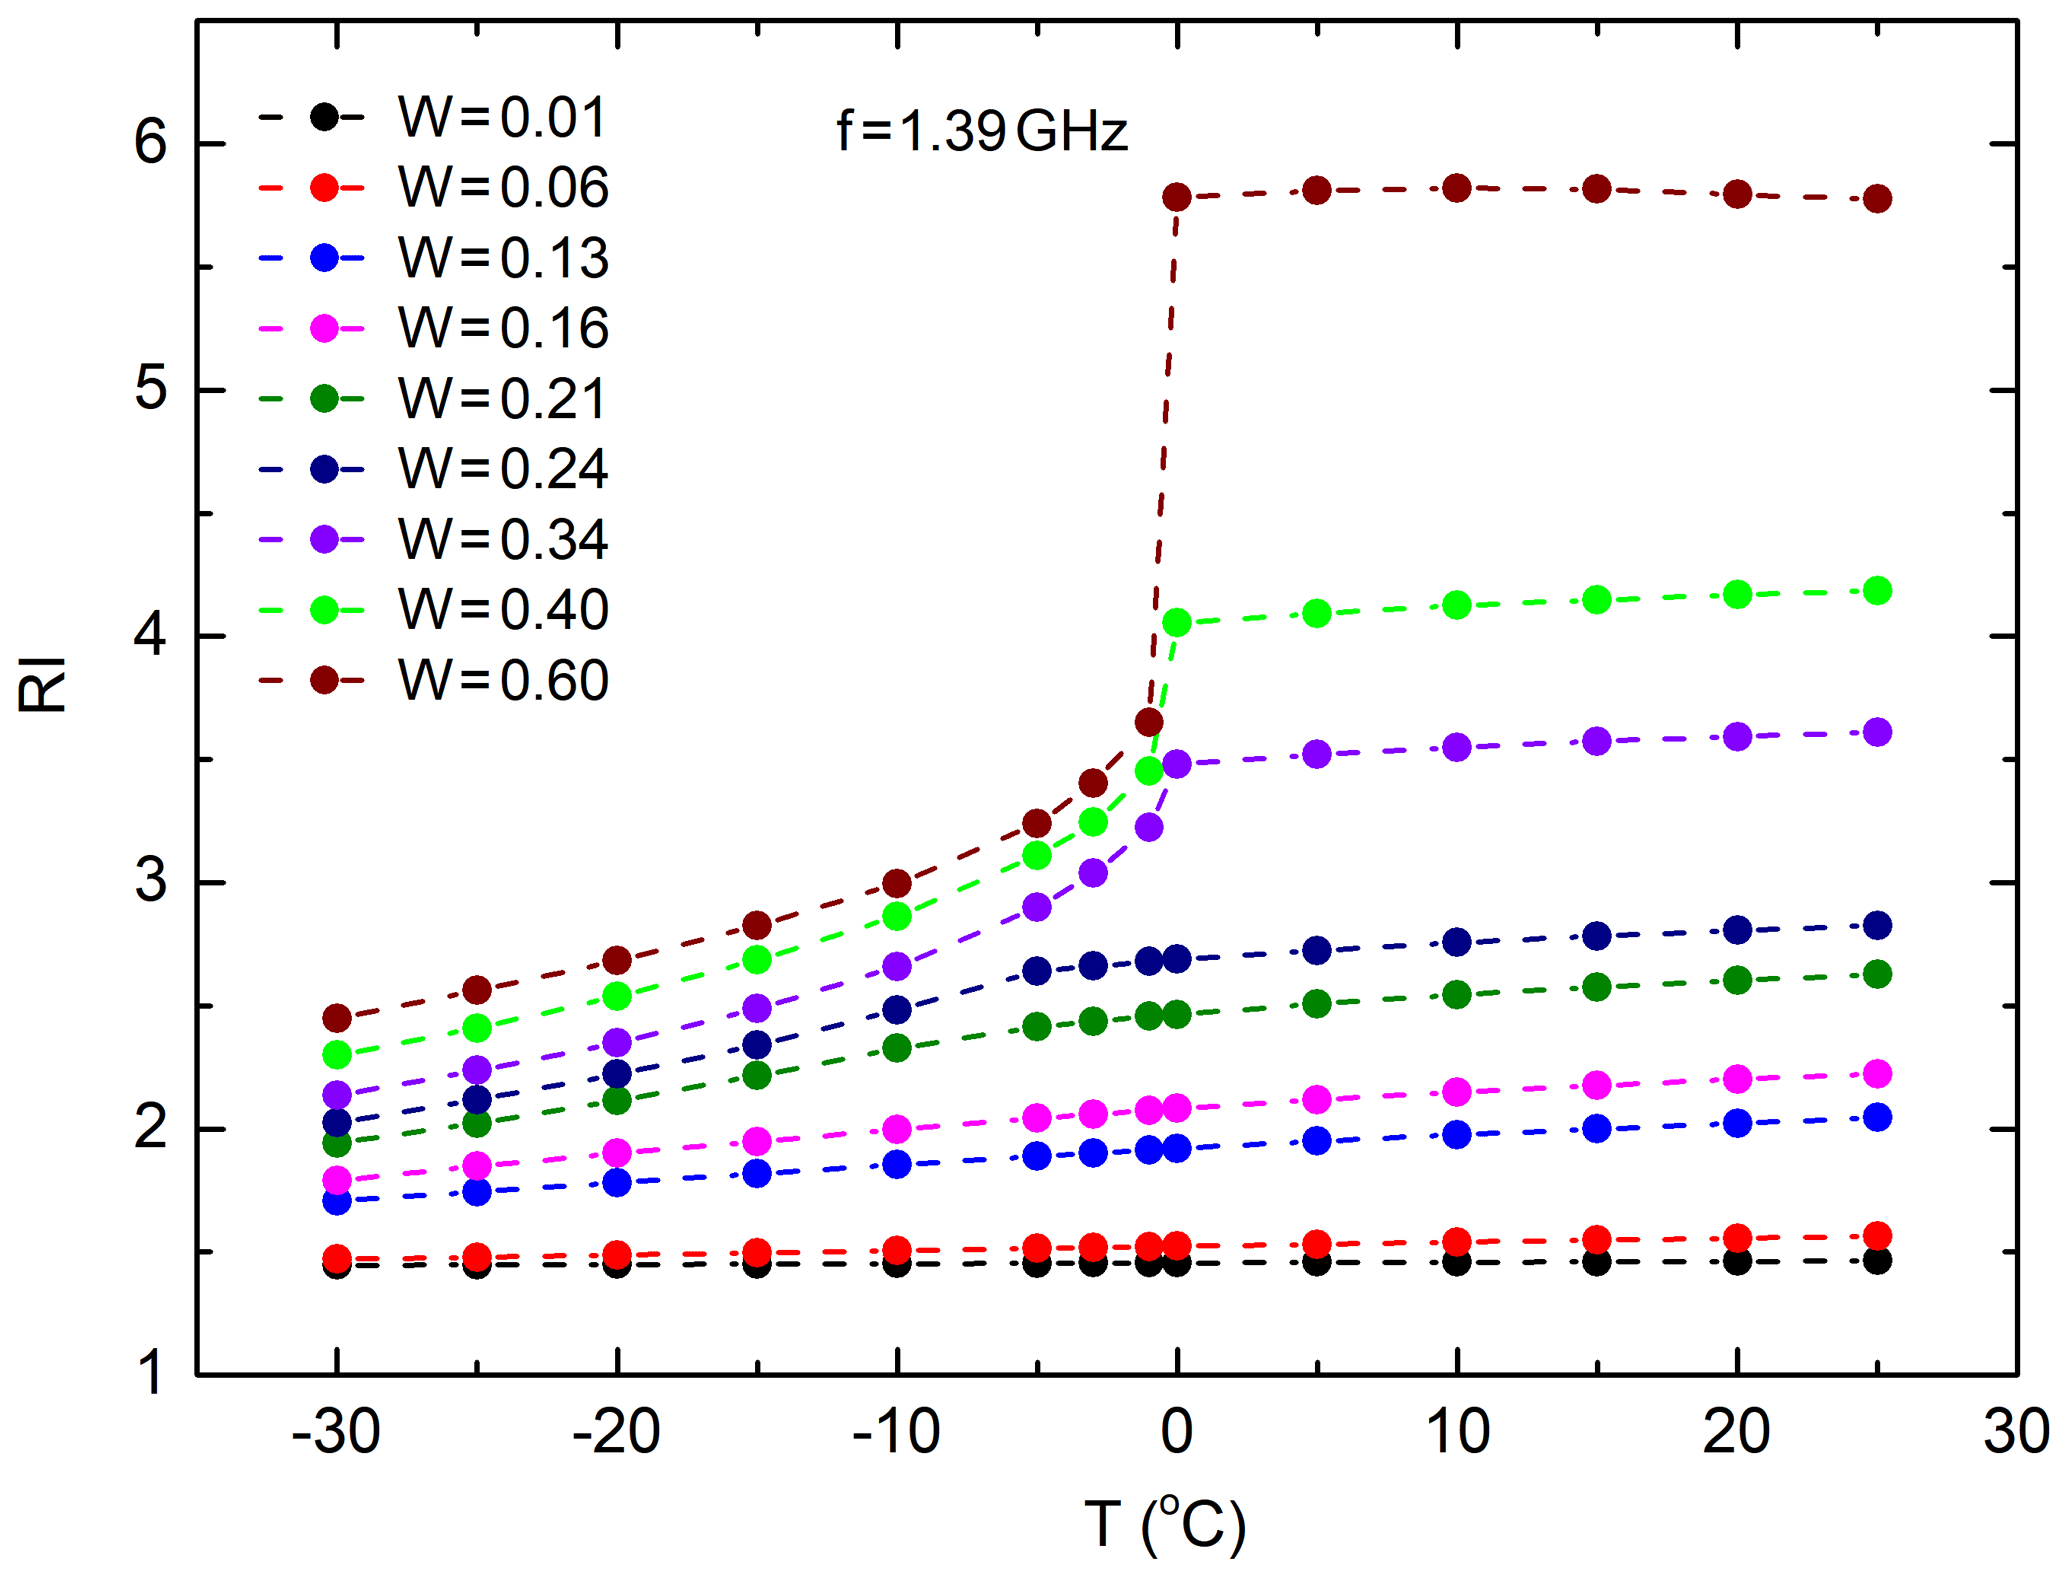
Figure 4The refractive index (RI) for sample no. 6 (TM) depending on the temperature of the soil sample (T) for various moisture levels at a frequency of f= 1.39 GHz.
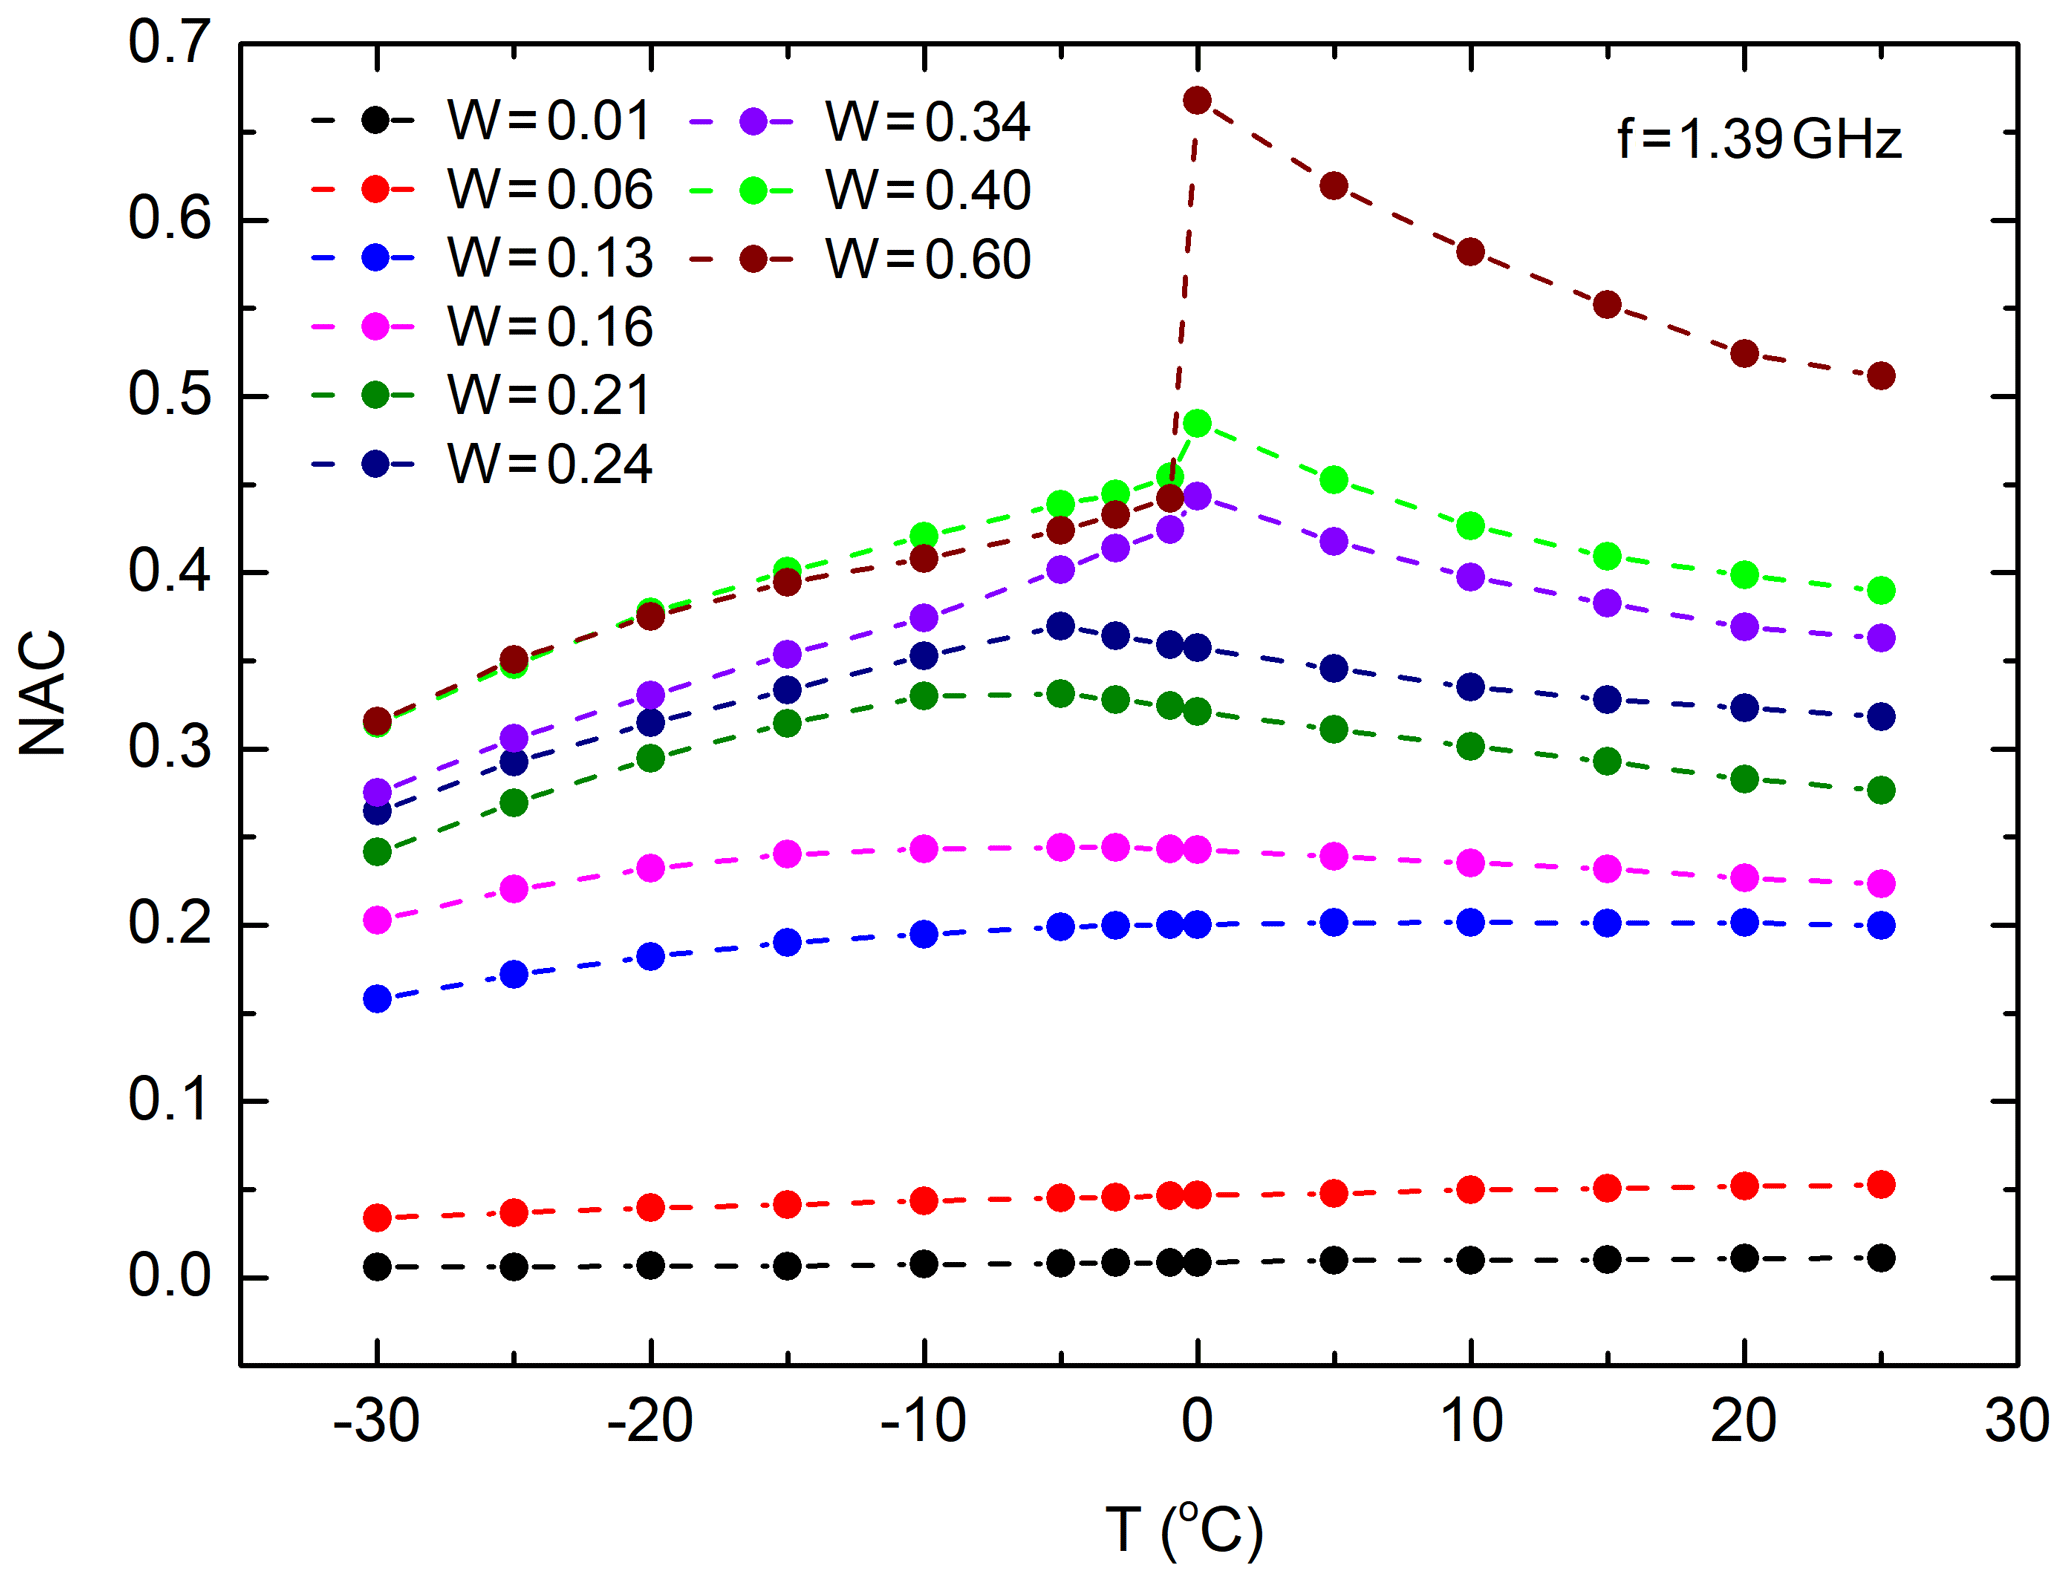
Figure 5Normalised attenuation coefficient (NAC) for sample no. 6 (TM) depending on the temperature of the soil sample (T) for various moisture levels at a frequency of f= 1.39 GHz.
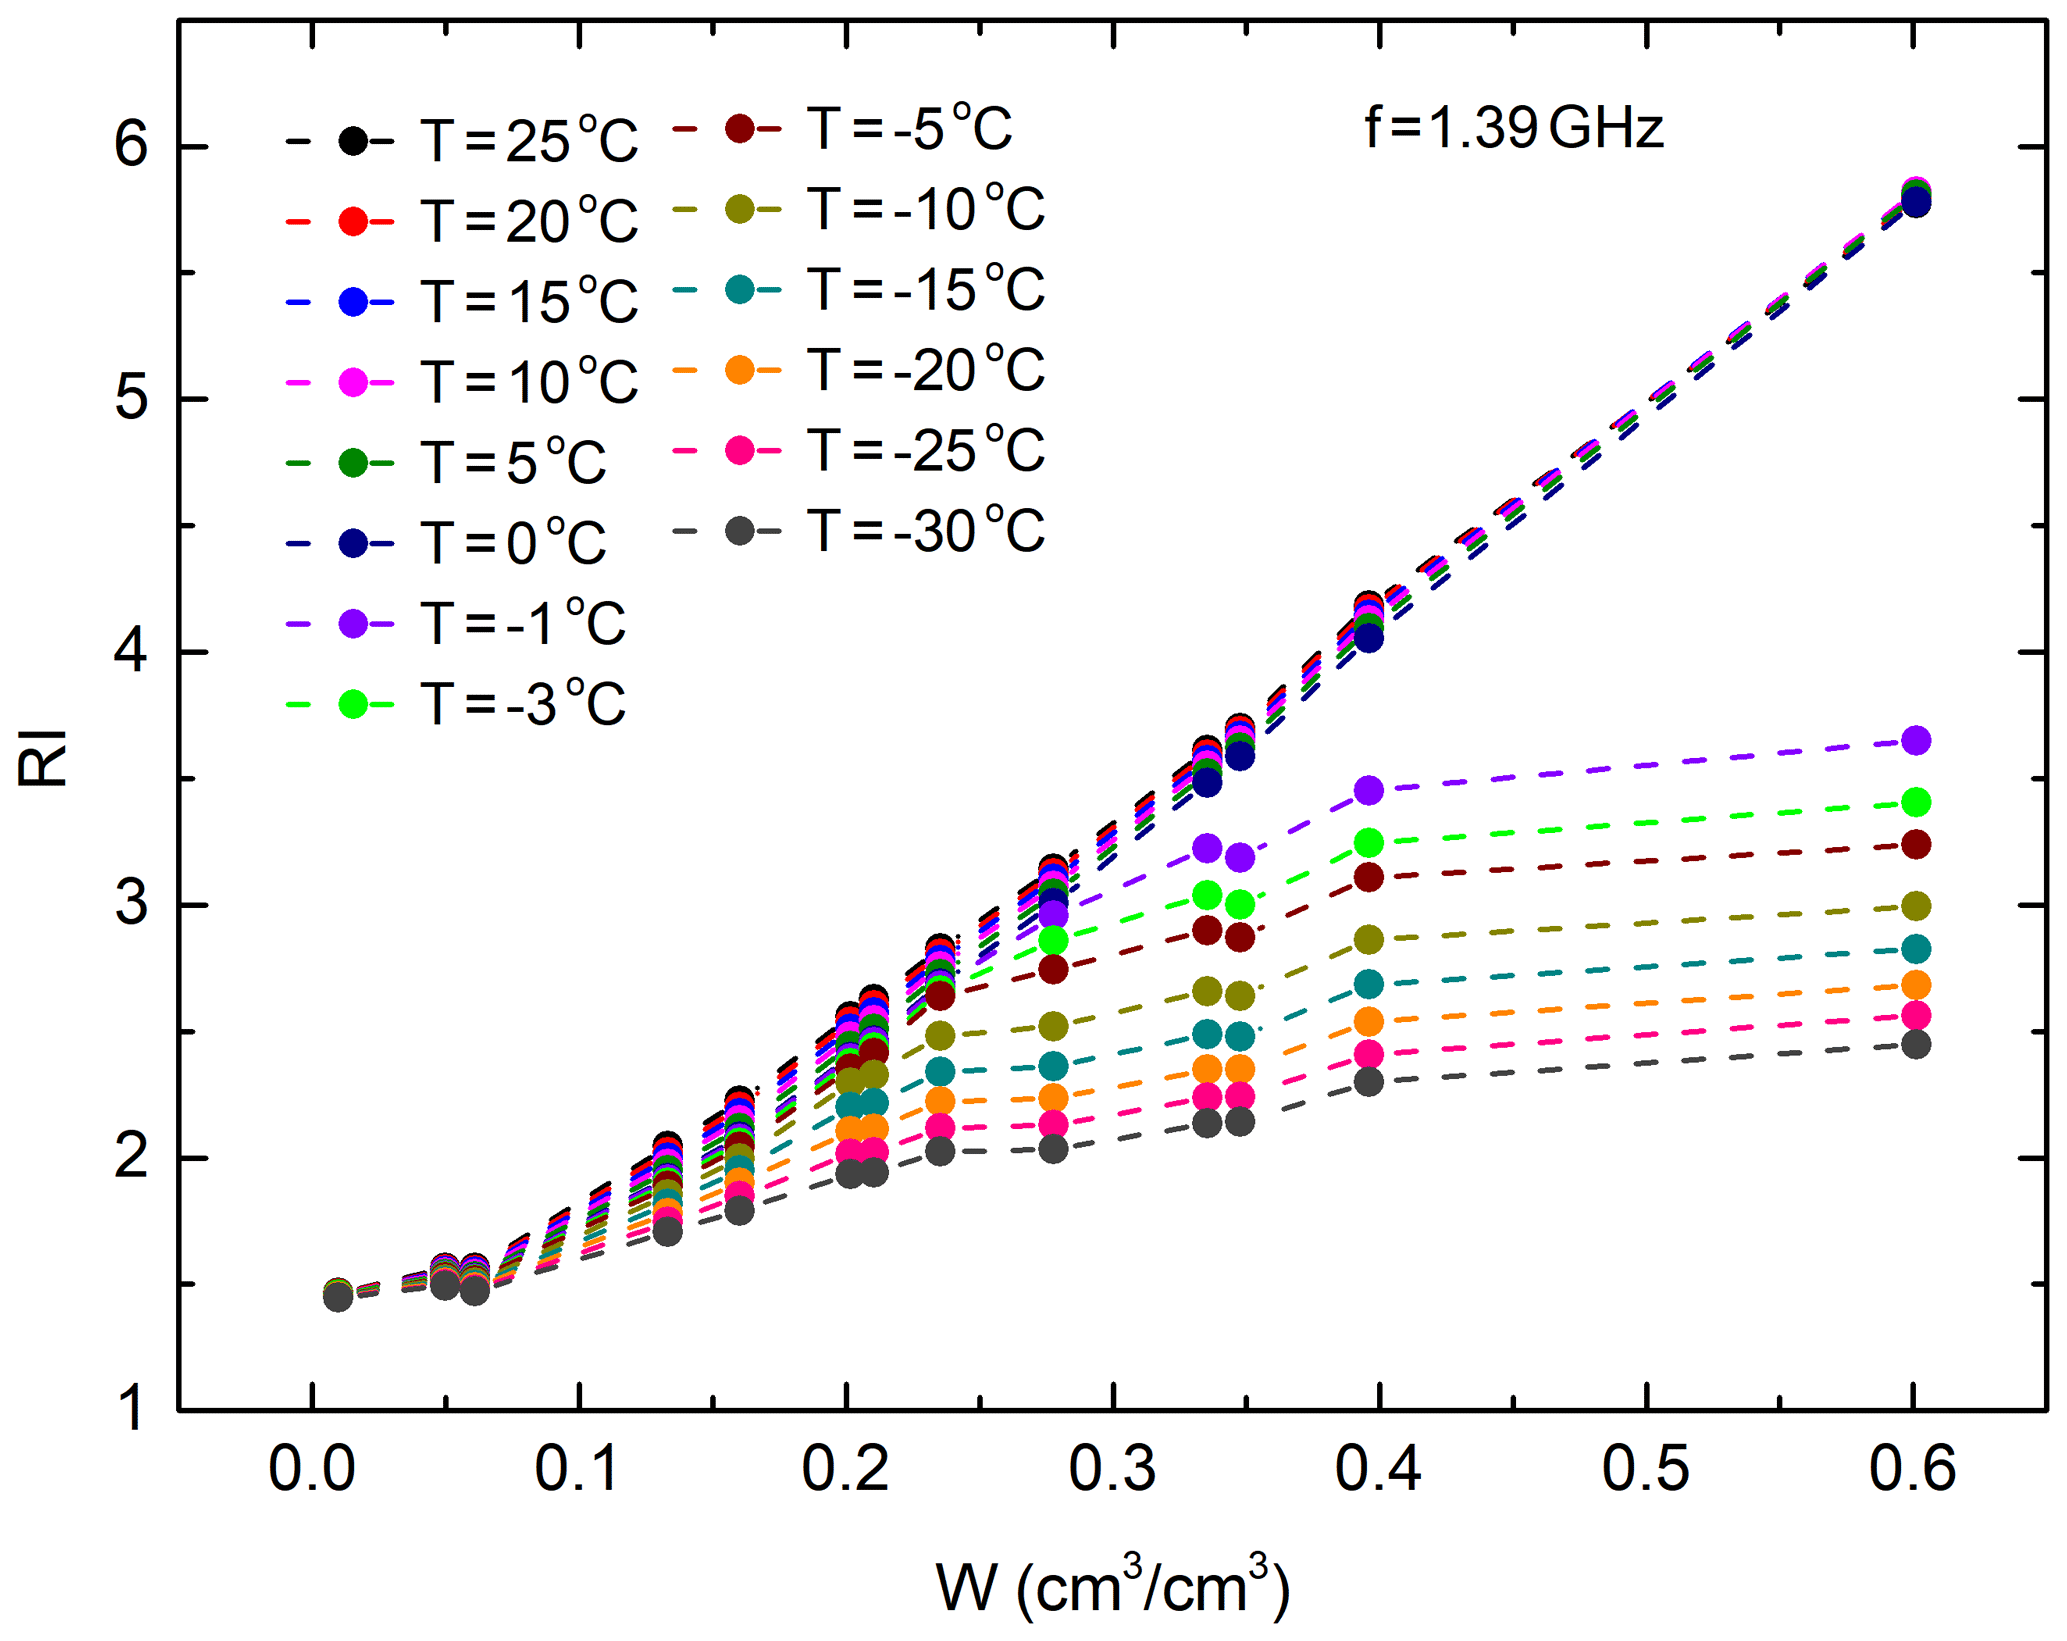
Figure 6Refractive index (RI) for sample no. 6 (TM) as a function of soil sample moisture (W) for various temperatures at a frequency of f= 1.39 GHz.
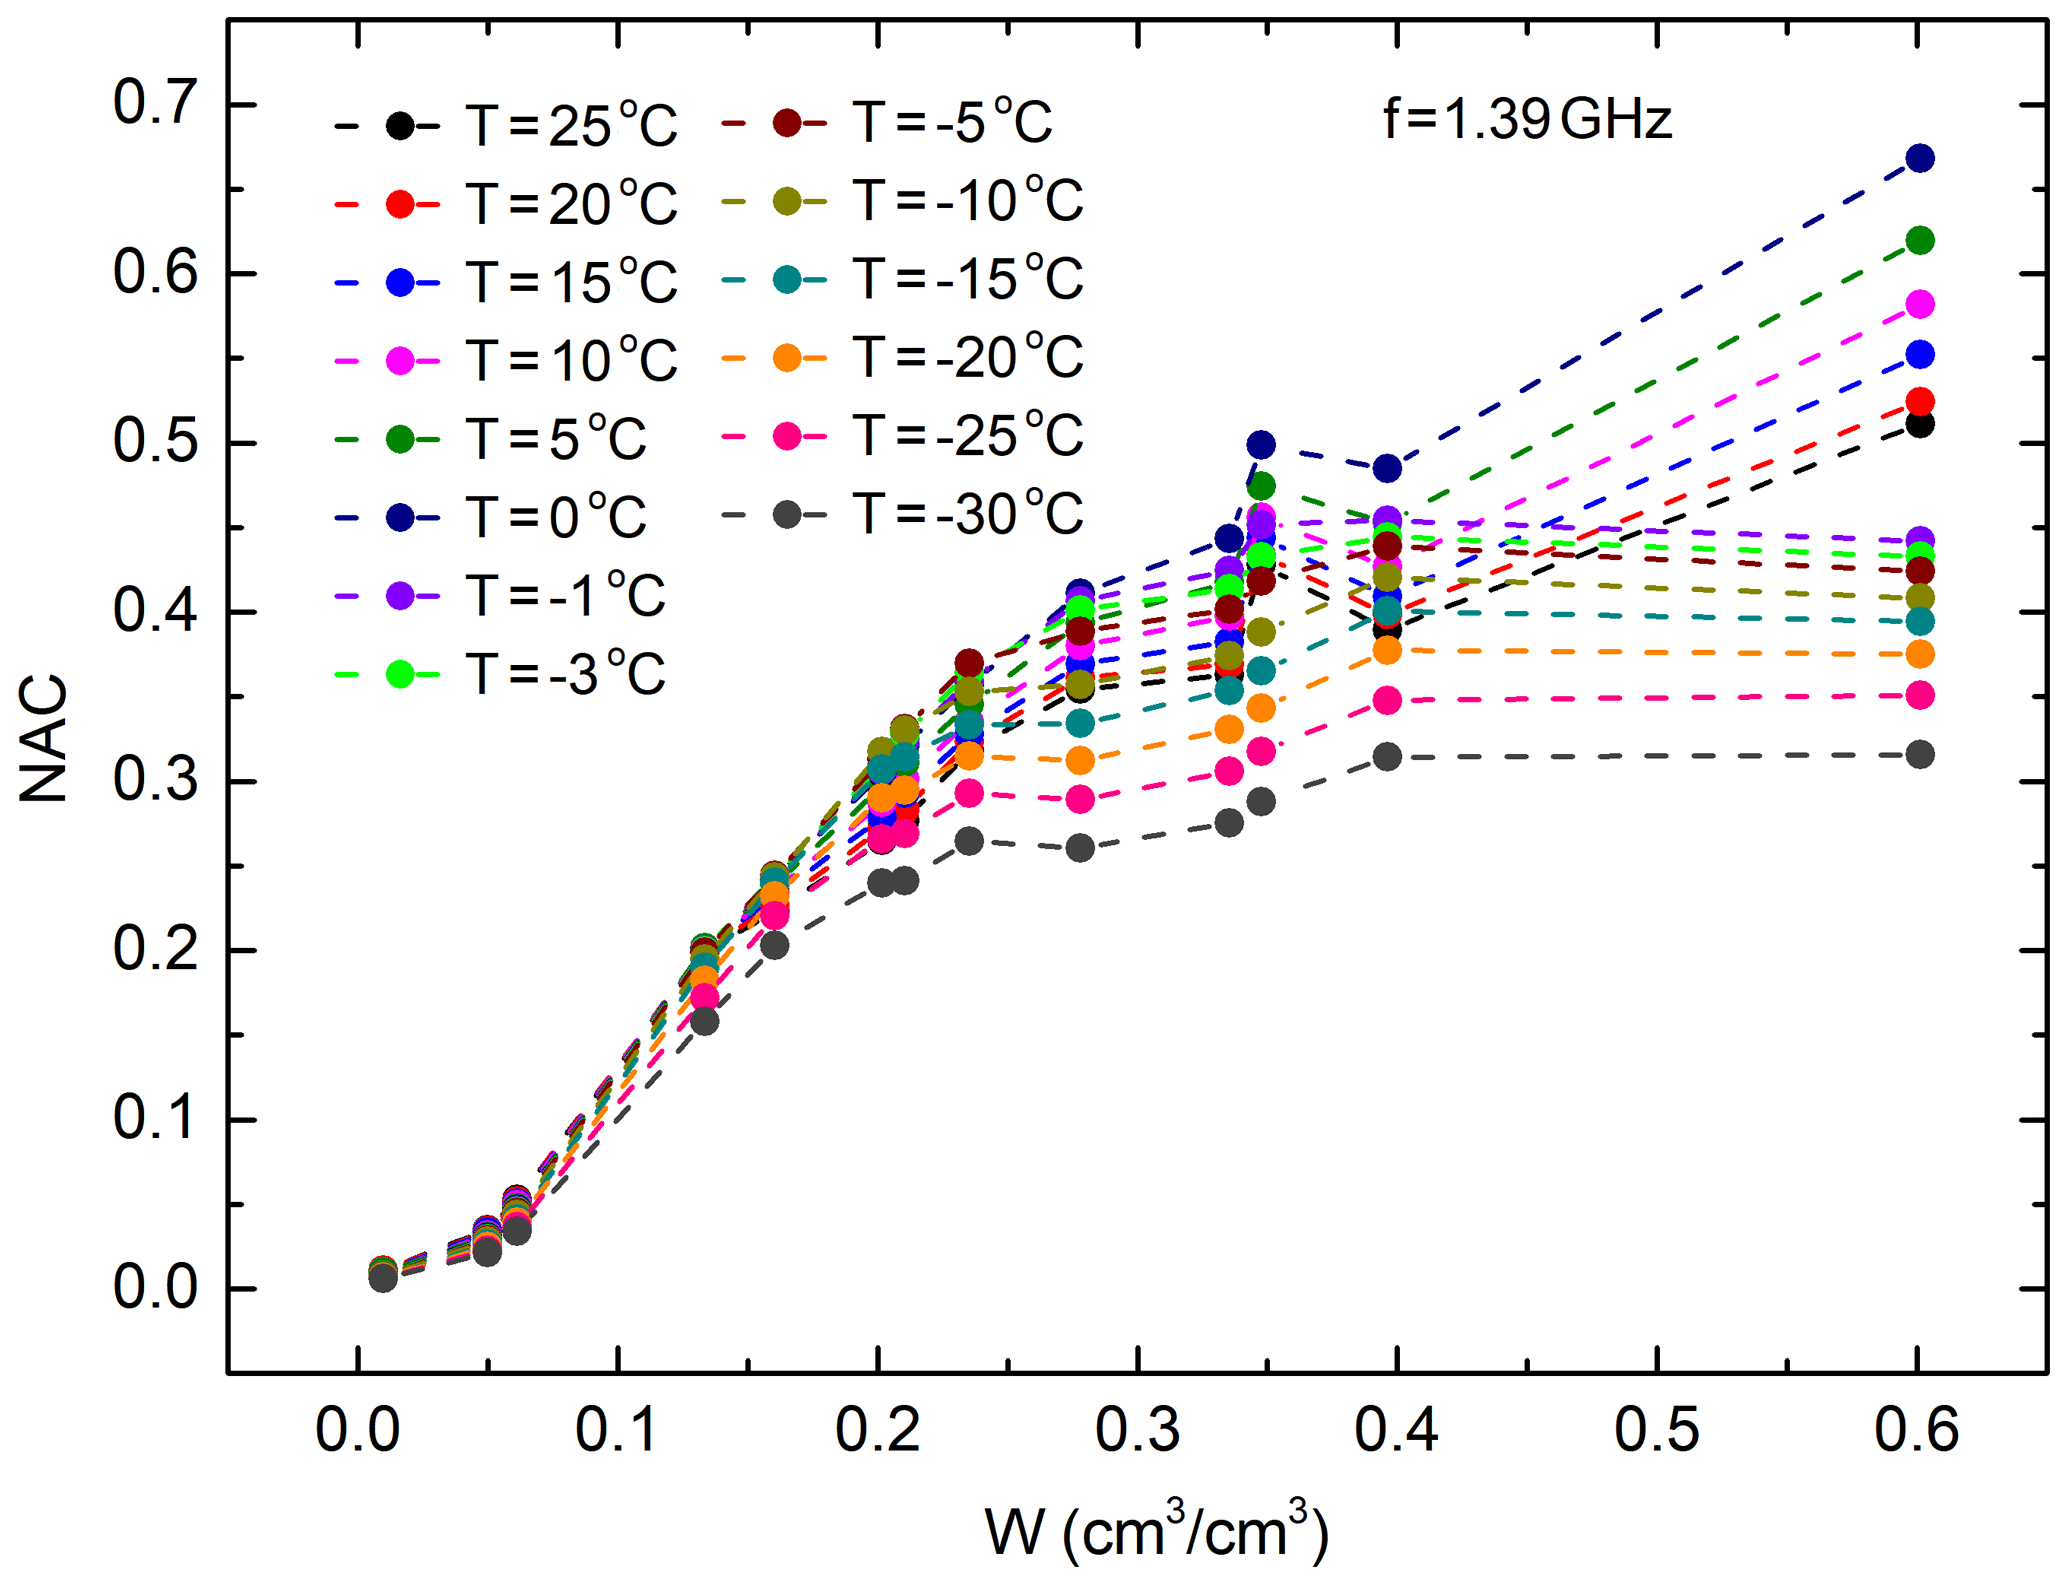
Figure 7Normalised attenuation coefficient (NAC) for sample no. 6 (TM) as a function of soil sample moisture (W) for various temperatures at a frequency of f= 1.39 GHz.
As an example, Figs. 2 and 3 show the frequency spectra of the RI and NAC for sample no. 6 (TM) depending on the volumetric moisture of the soil sample at a temperature of 25 ∘C. Figures 4 and 5 show the refractive index and normalised attenuation coefficient depending on the temperature of sample no. 6 (TM), at a frequency of 1.39 GHz and different values of volumetric soil moisture. Figures 6 and 7 show RI and NAC, depending on the volumetric moisture of soil sample no. 6 (TM) in the temperature range from −30 to +25∘ N at a frequency of 1.39 GHz.
The DDOAS database is available on Zenodo at https://doi.org/10.5281/zenodo.3819912 (Savin and Mironov, 2020). DDOS data can be reproduced using theoretical permittivity models of Arctic tundra soils, which were early developed based on DDOAS data: spectroscopic (Mironov et al., 2020; Mironov and Savin, 2015, 2016, 2019) and single-frequency (Mironov et al., 2015b, 2018; Savin and Muzalevskiy, 2020) dielectric models.
This article provides a detailed description of the DDOAS database, which contains more than 1.5 million measured values of the refractive index and the normalised attenuation coefficient of samples of organic tundra soils taken in various parts of the Arctic region. The DDOAS database can serve as a source of high-quality experimental data on the tundra soils permittivity to develop new dielectric models of the Arctic soils and can also be used as a training dataset for artificial intelligence satellite algorithms of soil moisture retrieval based on neural networks. In the future, the authors plan to continuously supplement the DDOAS database with new dielectric measurements of new soil samples taken from the territories of the Arctic tundra.
IS carried out the measurements, processed the results, wrote the paper and prepared the data for publication. KM took part in organising work regarding the measurements, participated in the discussion of the results and wrote the paper. VM took part in organising the measurements and participated in the discussion of the results. YL, AK, ZR and SF took part in carrying out the measurements and processing and discussing the results.
The authors declare that they have no conflict of interest.
The work was carried out within the framework of the Russian Federation state assignment (project no. 0356-2019-0004).
This paper was edited by Prasad Gogineni and reviewed by Christopher Simpson and one anonymous referee.
Al-Yaari, A., Wigneron, J.-P., Kerr, Y., Rodriguez-Fernandez, N., O'Neill, P. E., Jackson, T. J., De Lannoy, G. J. M., Al Bitar, A., Mialon, A., and Richaume, P.: Evaluating soil moisture retrievals from ESA's SMOS and NASA's SMAP brightness temperature datasets, Remote Sens. Environ., 193, 257–273, https://doi.org/10.1016/j.rse.2017.03.010, 2017.
Bircher, S., Demontoux, F., Razafindratsima, S., Zakharova, E., Drusch, M., Wigneron, J.-P., and Kerr, Y.: L-band relative permittivity of organic soil surface layers – A new dataset of resonant cavity measurements and model evaluation, Remote Sens., 8, 1024, https://doi.org/10.3390/rs8121024, 2016.
Brocca, L., Crow, W. T., Ciabatta, L., Massari, C., De Rosnay, P., Enenkel, M., Hahn, S., Amarnath, G., Camici, S., and Tarpanelli, A.: A review of the applications of ASCAT soil moisture products, IEEE J. Sel. Top. Appl. Earth Obs. Remote Sens., 10, 2285–2306, https://doi.org/10.1109/JSTARS.2017.2651140, 2017.
Choudhury, B. J., Schmugge, T. J., Chang, A., and Newton, R. W.: Effect of surface roughness on the microwave emission from soils, J. Geophys. Res.-Ocean., 84, 5699–5706, https://doi.org/10.1029/JC084iC09p05699, 1979.
Curtis, J. O., Weiss, C. A., and Everett, J. B.: Effect of soil composition on dielectric properties, US Army Corps Eng. Waterw. Exp. Station, Vicksburg, MS, Tech. Rep. EL-95-34, 1995.
Davidson, E. A. and Janssens, I. A.: Temperature sensitivity of soil carbon decomposition and feedbacks to climate change, Nature, 440, 165–173, https://doi.org/10.1038/nature04514, 2006.
Dobson, M. C., Ulaby, F. T., Hallikainen, M. T., and El-rayes, M. A.: Microwave Dielectric Behavior of Wet Soil-Part II: Dielectric Mixing Models, IEEE Trans. Geosci. Remote Sens., GE-23, 35–46, https://doi.org/10.1109/TGRS.1985.289498, 1985.
Escorihuela, M.-J., Chanzy, A., Wigneron, J.-P., and Kerr, Y. H.: Effective soil moisture sampling depth of L-band radiometry: A case study, Remote Sens. Environ., 114, 995–1001, https://doi.org/10.1016/j.rse.2009.12.011, 2010.
Gao, H., Zhang, W., and Chen, H.: An Improved Algorithm for Discriminating Soil Freezing and Thawing Using AMSR-E and AMSR2 Soil Moisture Products, Remote Sens., 10, 1697, https://doi.org/10.3390/rs10111697, 2018, 2018.
Hallikainen, M. T., Ulaby, F. T., Dobson, M. C., El-Rayes, M. A., and Wu, L.-K.: Microwave dielectric behavior of wet soil-part 1: Empirical models and experimental observations, IEEE Trans. Geosci. Remote Sens., 1, 25–34, https://doi.org/10.1109/TGRS.1985.289497, 1985.
Jin, M., Zheng, X., Jiang, T., Li, X., Li, X.-J., and Zhao, K.: Evaluation and improvement of SMOS and SMAP soil moisture products for soils with high organic matter over a forested area in Northeast China, Remote Sens., 9, 387, https://doi.org/10.3390/rs9040387, 2017.
Liu, J., Zhao, S., Jiang, L., Chai, L., and Wu, F.: The influence of organic matter on soil dielectric constant at microwave frequencies (0.5–40 GHZ), in: 2013 IEEE International Geoscience and Remote Sensing Symposium-IGARSS, IEEE, 13–16, 2013.
Mironov, V. L. and Savin, I. V.: A temperature-dependent multi-relaxation spectroscopic dielectric model for thawed and frozen organic soil at 0.05–15 GHz, Phys. Chem. Earth, 83–84, https://doi.org/10.1016/j.pce.2015.02.011, 2015.
Mironov, V. L. and Savin, I. V.: Temperature-Dependent Spectroscopic Dielectric Model at 0.05–16 GHz for a Thawed and Frozen Alaskan Organic Soil, Satellite Soil Moisture Retrieval, Elsevier, 169–186, 2016.
Mironov, V. L. and Savin, I. V.: Spectroscopic multi-relaxation dielectric model of thawed and frozen arctic soils considering dependence on temperature and organic matter content, Izv. Atmos. Ocean. Phys., 55, 986–995, https://doi.org/10.31857/S0205-96142019162-73, 2019.
Mironov, V. L., Kosolapova, L. G., and Fomin, S. V: Physically and Mineralogically Based Spectroscopic Dielectric Model for Moist Soils, IEEE Trans. Geosci. Remote Sens., 47, 2059–2070, https://doi.org/10.1109/TGRS.2008.2011631, 2009.
Mironov, V. L., Komarov, S. A., Lukin, Y. I., and Shatov, D. S.: A technique for measuring the frequency spectrum of the complex permittivity of soil, J. Commun. Technol. Electron., 55, 1368–1373, 2010.
Mironov, V. L., Bobrov, P. P., and Fomin, S. V: Multirelaxation Generalized Refractive Mixing Dielectric Model of Moist Soils, IEEE Geosci. Remote Sens. Lett., 10, 603–606, https://doi.org/10.1109/LGRS.2012.2215574, 2012.
Mironov, V. L., Molostov, I. P., Lukin, Y. I., and Karavaisky, A. Y.: Method of retrieving permittivity from S12 element of the waveguide scattering matrix, in: 2013 International Siberian Conference on Control and Communications (SIBCON), IEEE, 12–13 September 2013, Krasnoyarsk, Russia, 1–3, 2013.
Mironov, V. L., Kerr, Y. H., Kosolapova, L. G., Savin, I. V., and Muzalevskiy, K. V.: A Temperature-Dependent Dielectric Model for Thawed and Frozen Organic Soil at 1.4 GHz, IEEE J. Sel. Top. Appl. Earth Obs. Remote Sens., 8, 4470–4477, https://doi.org/10.1109/JSTARS.2015.2442295, 2015a.
Mironov, V. L., Kosolapova, L. G., Savin, I. V., and Muzalevskiy, K. V.: Temperature dependent dielectric model at 1.4 GHz for a tundra organic-rich soil thawed and frozen, in: International Geoscience and Remote Sensing Symposium (IGARSS), 26–31 July 2015, Milan, Italy, vol. 2015, 2015b.
Mironov, V. L., Kosolapova, L. G., Fomin, S. V, Savin, I. V., and Muzalevskiy, K. V.: Dielectric model for thawed and frozen organic soils at 1.4 GHz, in: International Geoscience and Remote Sensing Symposium (IGARSS), Institute of Electrical and Electronics Engineers Inc., 7180–7183, 2018.
Mironov, V. L., Karavayskiy, A. Y., Lukin, Y. I., and Molostov, I. P.: A dielectric model of thawed and frozen Arctic soils considering frequency, temperature, texture and dry density, Int. J. Remote Sens., 41, 3845–3865, https://doi.org/10.1080/01431161.2019.1708506, 2020.
Park, C.-H., Montzka, C., Jagdhuber, T., Jonard, F., De Lannoy, G., Hong, J., Jackson, T. J., and Wulfmeyer, V.: A Dielectric Mixing Model Accounting for Soil Organic Matter, Vadose Zone J., 18, 190036, https://doi.org/10.2136/vzj2019.04.0 03, 2019.
Rodriguez-Fernandez, N. J., Aires, F., Richaume, P., Kerr, Y. H., Prigent, C., Kolassa, J., Cabot, F., Jimenez, C., Mahmoodi, A., and Drusch, M.: Soil moisture retrieval using neural networks: Application to SMOS, IEEE Trans. Geosci. Remote Sens., 53, 5991–6007, https://doi.org/10.1109/TGRS.2015.2430845, 2015.
Savin, I. V and Mironov, V. L.: Dielectric spectra of thawed and frozen wet organic Arctic soils, Zenodo, https://doi.org/10.5281/zenodo.3819912, 2020.
Savin, I. V and Muzalevskiy, K. V: Dielectric Model for Thawed Organic Soils at Frequency of 435 MHz, IEEE Geosci. Remote Sens. Lett., 1–4, https://doi.org/10.1109/LGRS.2020.2975027, 2020.
Schuur, E. A. G. and Abbott, B.: High risk of permafrost thaw, Nature, 480, 32–33, 2011.
Walker, V. A., Hornbuckle, B. K., Cosh, M. H., and Prueger, J. H.: Seasonal Evaluation of SMAP Soil Moisture in the US Corn Belt, Remote Sens., 11, 2488, https://doi.org/10.3390/rs11212488, 2019.
Wigneron, J.-P., Jackson, T. J., O'Neill, P., De Lannoy, G., Rosnay, P., Walker, J., Ferrazzoli, P., Mironov, V. L., Bircher, S., Grant, J. P., Kurum, M., Schwank, M., Muñoz Sabater, J., Das, N., Royer, A., Al-Yaari, A., Al Bitar, A., Fernandez-Moran, R., Lawrence, H., and Kerr, Y.: Modelling the passive microwave signature from land surfaces: A review of recent results and application to the L-band SMOS & SMAP soil moisture retrieval algorithms, Remote Sens. Environ., 192, 238–262, https://doi.org/10.1016/j.rse.2017.01.024, 2017.
WMO: WMO Statement on the State of the Global Climate in 2019, No. 1248, World Meteorological Organisation (WMO), 2020.
Wrona, E., Rowlandson, T. L., Nambiar, M., Berg, A. A., Colliander, A., and Marsh, P.: Validation of the Soil Moisture Active Passive (SMAP) satellite soil moisture retrieval in an Arctic tundra environment, Geophys. Res. Lett., 44, 4152–4158, https://doi.org/10.1002/2017GL072946, 2017.