the Creative Commons Attribution 4.0 License.
the Creative Commons Attribution 4.0 License.
 | 13 Feb 2020
An improved Terra–Aqua MODIS snow cover and Randolph Glacier Inventory 6.0 combined product (MOYDGL06*) for high-mountain Asia between 2002 and 2018
Sher Muhammad
Amrit Thapa
Snow is a significant component of the ecosystem and water resources in high-mountain Asia (HMA). Therefore, accurate, continuous, and long-term snow monitoring is indispensable for the water resources management and economic development. The present study improves the Moderate Resolution Imaging Spectroradiometer (MODIS) onboard Terra and Aqua satellites 8 d (“d” denotes “day”) composite snow cover Collection 6 (C6) products, named MOD10A2.006 (Terra) and MYD10A2.006 (Aqua), for HMA with a multistep approach. The primary purpose of this study was to reduce uncertainty in the Terra–Aqua MODIS snow cover products and generate a combined snow cover product. For reducing underestimation mainly caused by cloud cover, we used seasonal, temporal, and spatial filters. For reducing overestimation caused by MODIS sensors, we combined Terra and Aqua MODIS snow cover products, considering snow only if a pixel represents snow in both the products; otherwise it is classified as no snow, unlike some previous studies which consider snow if any of the Terra or Aqua product identifies snow. Our methodology generates a new product which removes a significant amount of uncertainty in Terra and Aqua MODIS 8 d composite C6 products comprising 46 % overestimation and 3.66 % underestimation, mainly caused by sensor limitations and cloud cover, respectively. The results were validated using Landsat 8 data, both for winter and summer at 20 well-distributed sites in the study area. Our validated adopted methodology improved accuracy by 10 % on average, compared to Landsat data. The final product covers the period from 2002 to 2018, comprising a combination of snow and glaciers created by merging Randolph Glacier Inventory version 6.0 (RGI 6.0) separated as debris-covered and debris-free with the final snow product MOYDGL06*. We have processed approximately 746 images of both Terra and Aqua MODIS snow containing approximately 100 000 satellite individual images. Furthermore, this product can serve as a valuable input dataset for hydrological and glaciological modelling to assess the melt contribution of snow-covered areas. The data, which can be used in various climatological and water-related studies, are available for end users at https://doi.org/10.1594/PANGAEA.901821 (Muhammad and Thapa, 2019).
- Article
(14459 KB) - Full-text XML
- BibTeX
- EndNote


Snow is a crucial component of the hydrological cycle because it acts as water storage with a short delay during the seasonal runoff (Colbeck, 1977). On average, more than 60 % of the annual discharge in the major rivers of high-mountain Asia (HMA) depends on meltwater, with variable rates across the region (Armstrong et al., 2019). Both the mountain communities and downstream population rely on water stored as snow for their daily use mainly in the early melt season (Lutz et al., 2016). On the contrary, rapid snowmelt may cause natural hazards such as floods, consequently damaging agriculture, infrastructure, and human life (Haq et al., 2012; Memon et al., 2015). These factors make it essential to monitor snow for downstream water resources management and hazards and disasters preparedness (Clifton et al., 2018; Tian et al., 2017; Zhang et al., 2010).
Snow cover mapping is generally crucial for areas densely populated downstream and where snowmelt dominates the discharge (Smith et al., 2017). In the topographically complex high mountains of Asia, snow covers a vast spatial extent which is difficult to measure in the field (Immerzeel et al., 2009). Hence, cryospheric field observations are limited to the lower-elevation zones with less spatial coverage (Muhammad et al., 2019a, b; Muhammad and Tian, 2016). Field or observed datasets are available with limited regional coverage for a limited number of stations. These direct observations are also unable to provide a comprehensive picture of the snow conditions globally and in the HMA region (Latif et al., 2019; Möller and Möller, 2019; Wunderle et al., 2016). Therefore, remote-sensing data are widely used to assess the snow extent and variability at regional or global scales (Hall et al., 2010).
Satellite data provide broad coverage and have been capable of continuous long-term monitoring of snow for half a century (Hüsler et al., 2014). The primary constraint in passive optical satellite remote sensing is the cloud persistence for regular spatio-temporal monitoring of various earth resources including snow (McCabe et al., 2017). Due to this fact, 8 d composite snow cover products derived from the Moderate Resolution Imaging Spectroradiometer (MODIS) were developed to minimize the persistent cloud cover over the snow (Hall et al., 2002). Although the 8 d composite product reduced the cloud cover, still a significant number of clouds remained, particularly in the monsoon and winter precipitation seasons (Liang et al., 2008). The presence of clouds may cause the underestimation of the snow cover extent and must be removed (Wang et al., 2008). Also, obscuration of old snow and glacier ice due to their low albedo is challenging for MODIS to capture and is the contributing factor in underestimation of snow and ice cover extent. In contrast, the larger sensor zenith angle (SZA; Li et al., 2016) and low spatial resolution (Hou et al., 2019; Huang et al., 2017) mainly cause overestimation of snow. The overestimation is also significantly influenced by the broad swath of MODIS that amplifies the edge pixels by more than 4 times compared to the pixels at the image centre (Zeng et al., 2011; Zhang et al., 2017). Further, the accuracy of MODIS snow cover is consistently poor in the evergreen forests and the early melt season (Hall and Riggs, 2007).
Several studies have been carried out to improve snow cover data and to reduce uncertainty. Gurung et al. (2011) estimated seasonal snow cover in the HMA region combining Aqua and Terra satellites followed by temporal and spatial filters and an altitude mask mainly to minimize the cloud cover. Hammond et al. (2018) generated global snow zone maps and calculated trends in snow persistence using Terra products and reduced the overestimation by excluding snow persistence (SP) below a threshold of 7 %. Basang et al. (2017) analysed the snow cover in Tibet using the Terra satellite and ground observation, concluding that combining remote-sensing data with ground observations reduces the uncertainty. Although these studies improved the quality of snow cover data, the data require further improvement to reduce the remaining errors of commission and omission (Riggs et al., 2016). The aim of this study is to reduce uncertainty in MODIS snow data caused either by cloud cover (underestimation) or by limitations due to a large SZA (overestimation), using a multistep approach. The temporal and spatial filters can be efficient for the daily products, but the uncertainty due to a larger SZA cannot be reduced. The daily binary and fractional products are useful for simulation and modelling of the cryosphere and hydrology, but the use of existing products may lead to significant uncertainty in the results due to the above limitations. Therefore, we improved the 8 d composite products in which not only the cloud cover is minimized but also the combination of Terra and Aqua data reduces the overestimation of snow due to a large SZA. A long-term (2002–2018) meticulous estimate of the combined Terra and Aqua 8 d composite snow cover for HMA (Fig. 1) will facilitate climate (Latif et al., 2020) and glacio-hydrological modelling and understanding of the present dynamics of the cryosphere in the region (Brun et al., 2017; Muhammad et al., 2019a). The product will also lead to improving and developing associated products, e.g. daily snow water equivalent, fractional snow cover, and daily binary snow data (Alonso-González et al., 2018; Painter et al., 2016).
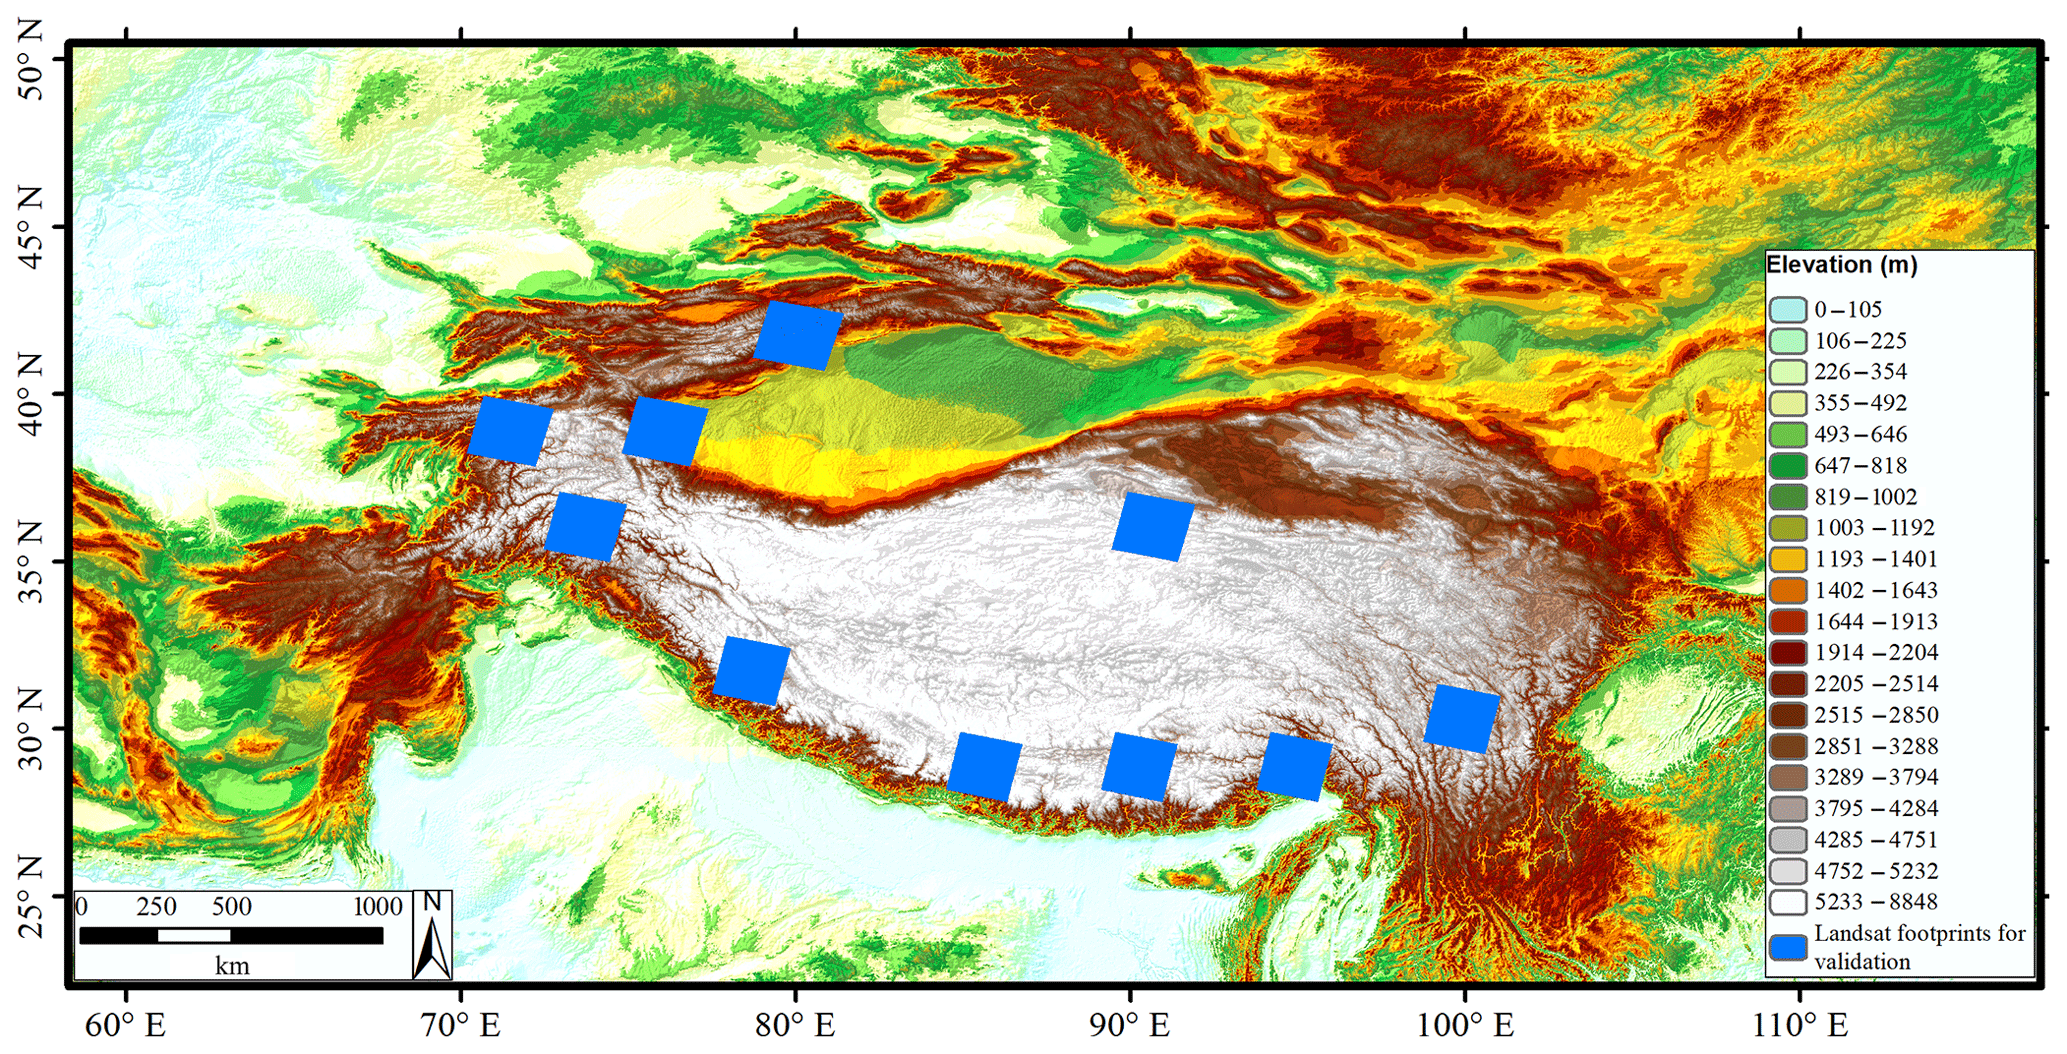
Figure 1Study area map showing elevation throughout the region and Landsat 8 satellite scenes used for MODIS snow validation. Two images of each Landsat footprint shown in this figure were used for validation.
The MODIS sensor is on board the Terra and Aqua satellites of NASA launched in 1999 and 2002, respectively. It provides land surface and cloud data in 36 spectral bands within 0.4 to 14.4 mm of the electromagnetic spectrum. The local equatorial pass time is 10:30 for Terra in descending node and 13:30 local time for Aqua in ascending node. Snow cover is one of the widely used products of MODIS, available through the websites https://nsidc.org/ (last access: 22 January 2019) of the National Snow and Ice Data Center (NSIDC) and https://earthdata.nasa.gov/ (last access: 22 January 2019) of NASA's Earth Science Data Systems (ESDS) program. The snow product is available at 500 m and 5 km spatial resolution with daily, 8 d, and monthly temporal resolution. This study uses the 8 d maximum-snow-extent product of the MODIS on board Terra (MOD10A2.006*) and Aqua (MYD10A2.006*) Collection 6 (referred to as original products throughout the paper) available from February 2000 and July 2002, respectively, with 500 m spatial resolution for the HMA region and surroundings. This version minimizes the errors of omission and commission compared to version 5 primarily in clear-sky conditions as described by Riggs et al. (2016). In Collection 6, band 6 of Aqua is restored instead of the previously used band 7 in calculating the Normalized Difference Snow Index (NDSI), making the algorithm similar to that used for Terra (Riggs et al., 2016), which helps to reduce an additional uncertainty in Aqua snow cover. The 8 d composite product depicts snow if it is observed in any of the 8 d either once or multiple times. The data are classified as 0 (missing data), 1 (no decision), 11 (night), 25 (no snow), 37 (lake), 39 (ocean), 50 (cloud), 100 (lake ice), 200 (snow), 254 (detector saturated), and 255 (fill; Riggs et al., 2016). One MODIS tile is an approximately 1200 km×1200 km (10∘ ×10∘) swath. We used Landsat 8 data with 30 m spatial resolution as ground truth to validate the MODIS snow cover products. We used a total of 20 Landsat scenes (10 for peak snow cover and 10 for the minimum snow cover period) for the year 2018.
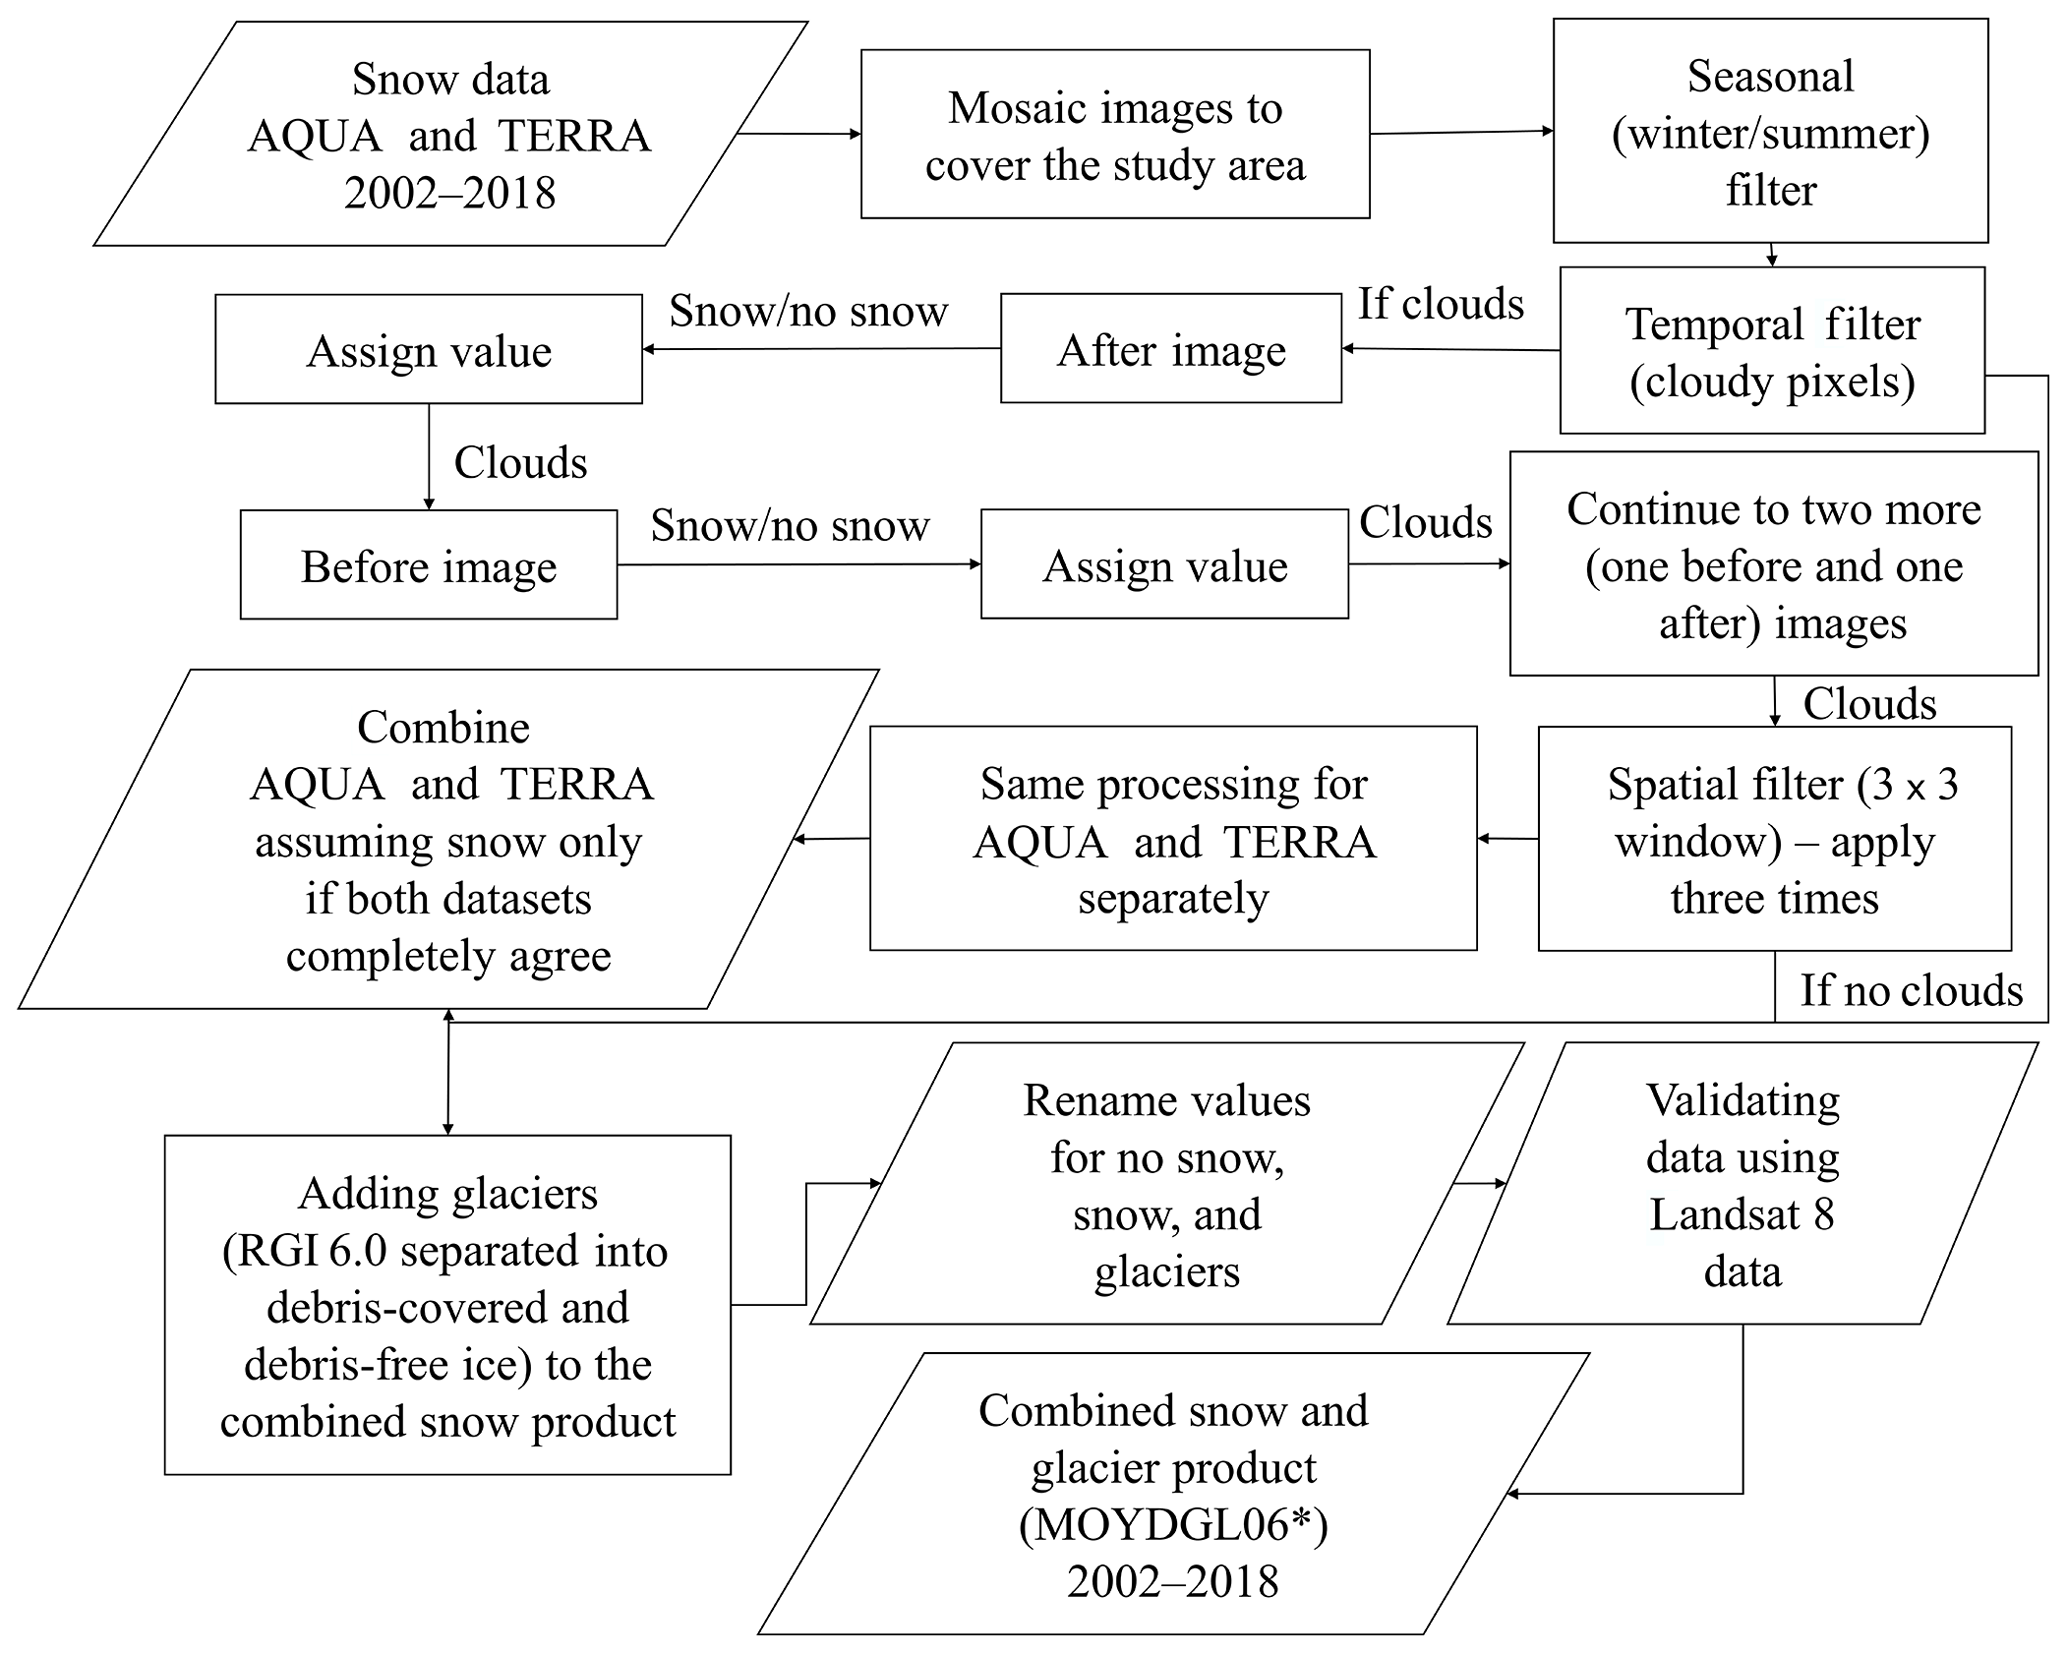
One of the major issues in the passive optical remote-sensing data is the cloud cover which becomes more prominent in the mountainous regions. The existence of cloud cover was the primary reason for developing the 8 d composite snow cover product, produced by merging 8 consecutive days of MODIS images (Hall et al., 2002). A significant number of clouds remain in the 8 d composite product, causing underestimation in the snow cover extent, and need to be removed for making the product useful for various climatological and glacio-hydrological applications (Yu et al., 2016). In addition, the overestimation was removed by combining Aqua and Terra to estimate snow with more confidence. We used a multistep approach to remove all the clouds and make a combined Terra–Aqua snow cover cloud-free product for HMA from 2002 to 2018. The detailed methodology proceeds with the following filtering steps (Sect. 3.1–3.3) applied separately to both Terra (MOD10A2.006*) and Aqua (MYD10A2.006*), followed by combining them. The methodology is also described as a flow chart in Fig. 2.
3.1 Seasonal filtering
We converted the available data into snow and no snow, followed by classifying all the images into two seasons by selecting data from 15 April to 15 October (summer) and 16 October to 14 April (winter) of a hydrological year. Moreover, for each hydrological year, each season's data were merged, and the maximum seasonal accumulated snow extent was used to extract the MOD10A2.006 and MYD10A2.006 data, removing the cloud beyond the maximum snow extent. The data (cloudy pixels) beyond the maximum snow extent were converted to no snow for further processing. This step was performed to reduce the time consumption for the next steps and possible uncertainty in removing cloud cover by temporal and spatial filters.
3.2 Temporal filtering
The remaining clouds after the seasonal filter were removed by applying a temporal filter. This filter replaces the cloudy pixels with non-cloudy pixels from the chronologically preceding and subsequent images (Gao et al., 2010; Hüsler et al., 2014; Li et al., 2019b; Paudel and Andersen, 2011; Zhang et al., 2017). The length of the temporal filter window should be carefully considered. A 7 d temporal filter applied to the daily MODIS data reduced more than 95 % of the cloud cover over Austria (Parajka and Blöschl, 2008). Tran et al. (2019) used a 30 d period for the temporal filter to remove long-lasting clouds. In this study, after testing several images, we selected four images (two preceding and two subsequent 8 d composite images) at most for removing cloudy pixels. For each cloudy pixel, the same pixel in the following image was checked. If the pixel was snow or no snow then the cloudy pixel was replaced accordingly; otherwise, the previous image was tested with similar criteria. The process was continued for up to two preceding and following images in cases of cloud persistence. If the clouds remain continuously in all four images, we move from the temporal filter to the spatial filter for removing the remaining cloudy pixels. For the temporal filter, we assumed that the snow cover remained constant under continuous cloudy conditions (Gafurov and Bárdossy, 2009). However, this assumption may not work successfully in cases of possible melting, which are expected to be negligible. The following Eqs. (1)–(3) explain the temporal filter. These equations are stepwise; if the condition is satisfied in the first step, then the other steps are not followed, and the filter goes to the next pixel to check the conditions. The equations convert cloud to no snow if the pixel is no snow in the following equations. The condition of snow to no snow is satisfied in Eq. (1) by only replacing the OR with AND. Conversely, if all the conditions in Eq. (3) are cloud, then the pixels remain cloudy in the temporal filter and are considered for conversion to snow or no snow by the spatial filter.
In the above, S represents the matrix, c denotes cloud, x and y are the row and column index of S, and t is the time index.
3.3 Spatial filtering
The majority neighbourhood spatial filter was applied to the remaining cloudy pixels in the images after the temporal filter. We used the spatial filter after the temporal filter because it is useful for the removal of small or patchy clouds (Li et al., 2019a). It reclassifies the cloudy pixel to snow or no snow based on the majority classification of the non-cloudy surrounding (eight neighbouring) pixels in a 3×3 window (Parajka and Blöschl, 2008). When there is a tie between no snow and snow pixels in the surroundings, the particular pixel is assigned as snow. Also, running this filter does not remove all the remaining cloudy pixels when applied only once; therefore, the filter was applied three times. The pixels remain cloudy only when all the eight neighbourhood pixels are cloudy. The criteria of the spatial filter are also described in Fig. 3. In addition, Fig. 4 shows the original Terra MODIS image compared with cloudy pixels converted to snow and no snow by temporal and spatial filters.
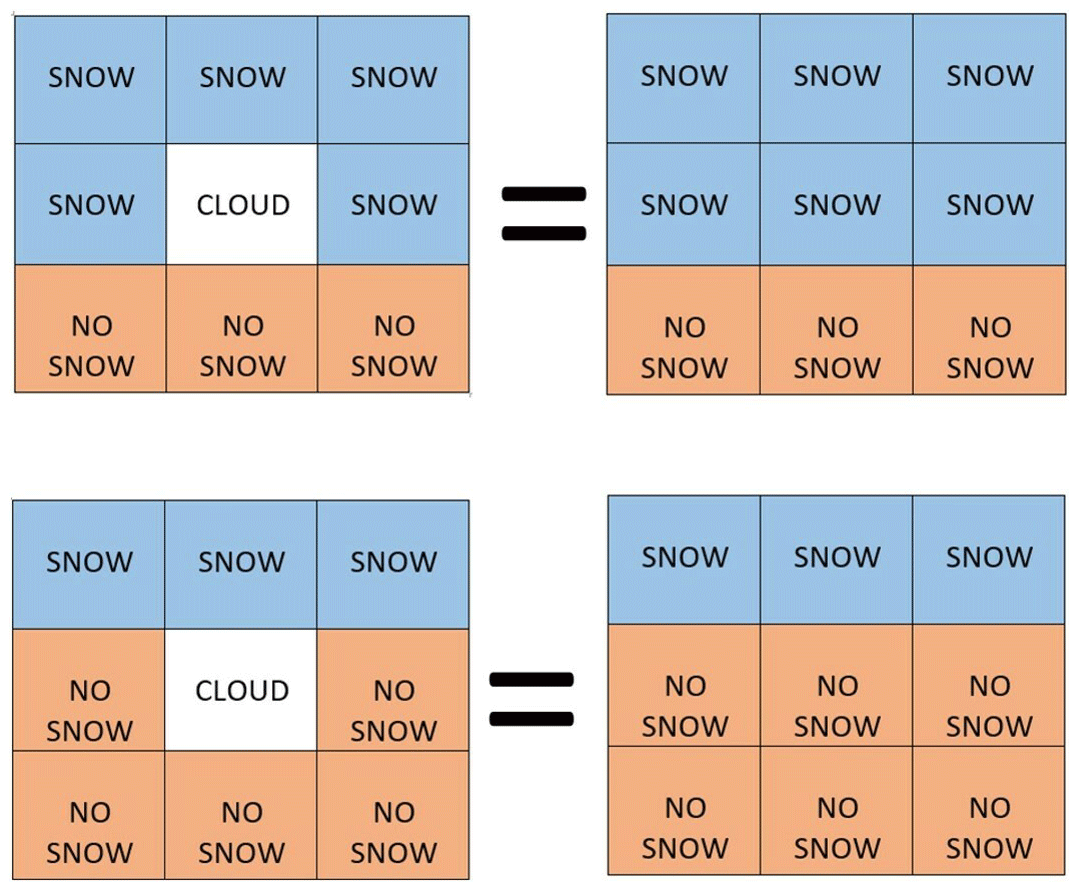
Figure 3Spatial filter of the methodology describing cloudy pixels conversion to snow and no snow. If a majority of the surrounding pixels are snow or no snow, the cloudy pixels are assigned the same respective value.
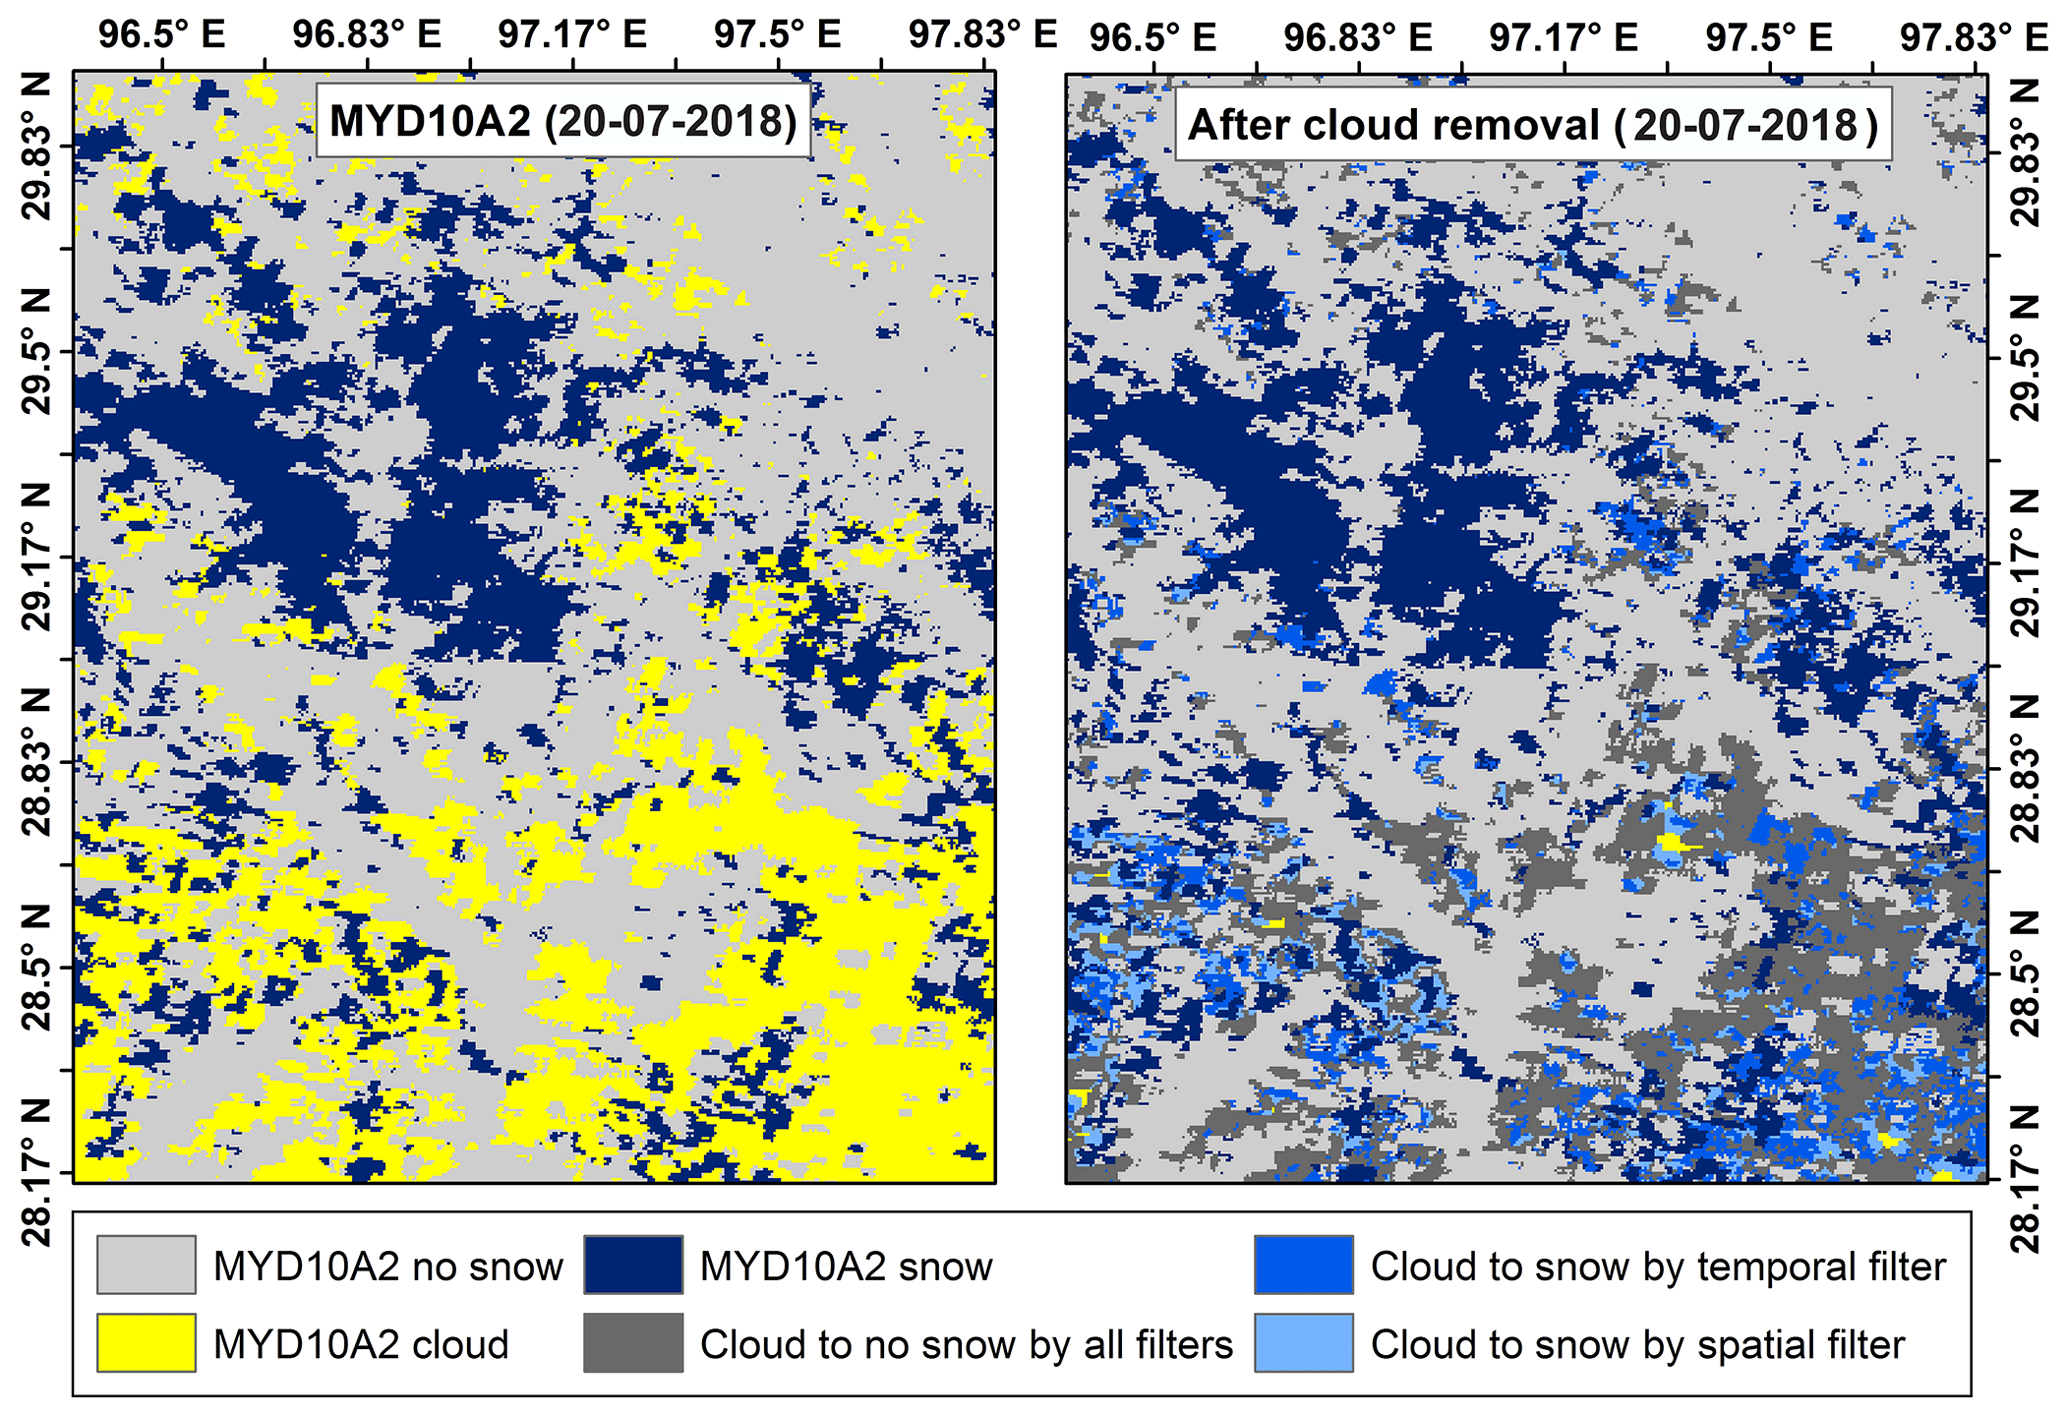
Figure 4Map showing cloud conversion to snow and no snow by temporal and spatial filters in MYD10A2 image.
3.4 Merging Terra- and Aqua-filtered snow products
After filtering, we found that both the datasets overestimate snow, particularly at lower-elevation areas. We assumed that the approximate 3 h time difference in acquisition times of Terra and Aqua do not affect the snow conditions (snowfall and snowmelt). Previous studies combined Terra and Aqua, assuming snow if the pixel is snow in any of the images (Parajka and Blöschl, 2008; She et al., 2015; Xie et al., 2009; Yu et al., 2016). We merged Terra and Aqua in a way that considered snow only where pixels in both the products are classified as snow. The criterion is also an inter-verification of snow mapped by Terra and Aqua. It also helps us to avoid uncertainty produced using the cloud removal methodology as described in Sect. 3.3 in any of the Terra or Aqua data. This step significantly improved the snow product, mainly reducing the overestimation in the images captured from off-nadir view (Li et al., 2016) and edge-pixels replication due to the broad swath of MODIS (Zeng et al., 2011; Zhang et al., 2017). The cloud cover removed in all the images during the study period by the methodology described from Sect. 3.1 to 3.4 for both Terra and Aqua is shown in Figs. 5 and 6. The data of both Aqua and Terra overlap from late 2002; therefore, the 8 d composite product was generated from 2002 to 2018 in this study. The method of combining snow from Terra and Aqua is described in Eqs. (4)–(5). We do not recommend this merging criteria (to consider a pixel to be snow when it is snow in both Terra and Aqua) for daily snow products in mountainous areas due to the error of omission which may be further increased because of the off-nadir-view acquisition and edge pixels.
In the above, Tfinal and Afinal are Terra and Aqua final products, respectively.
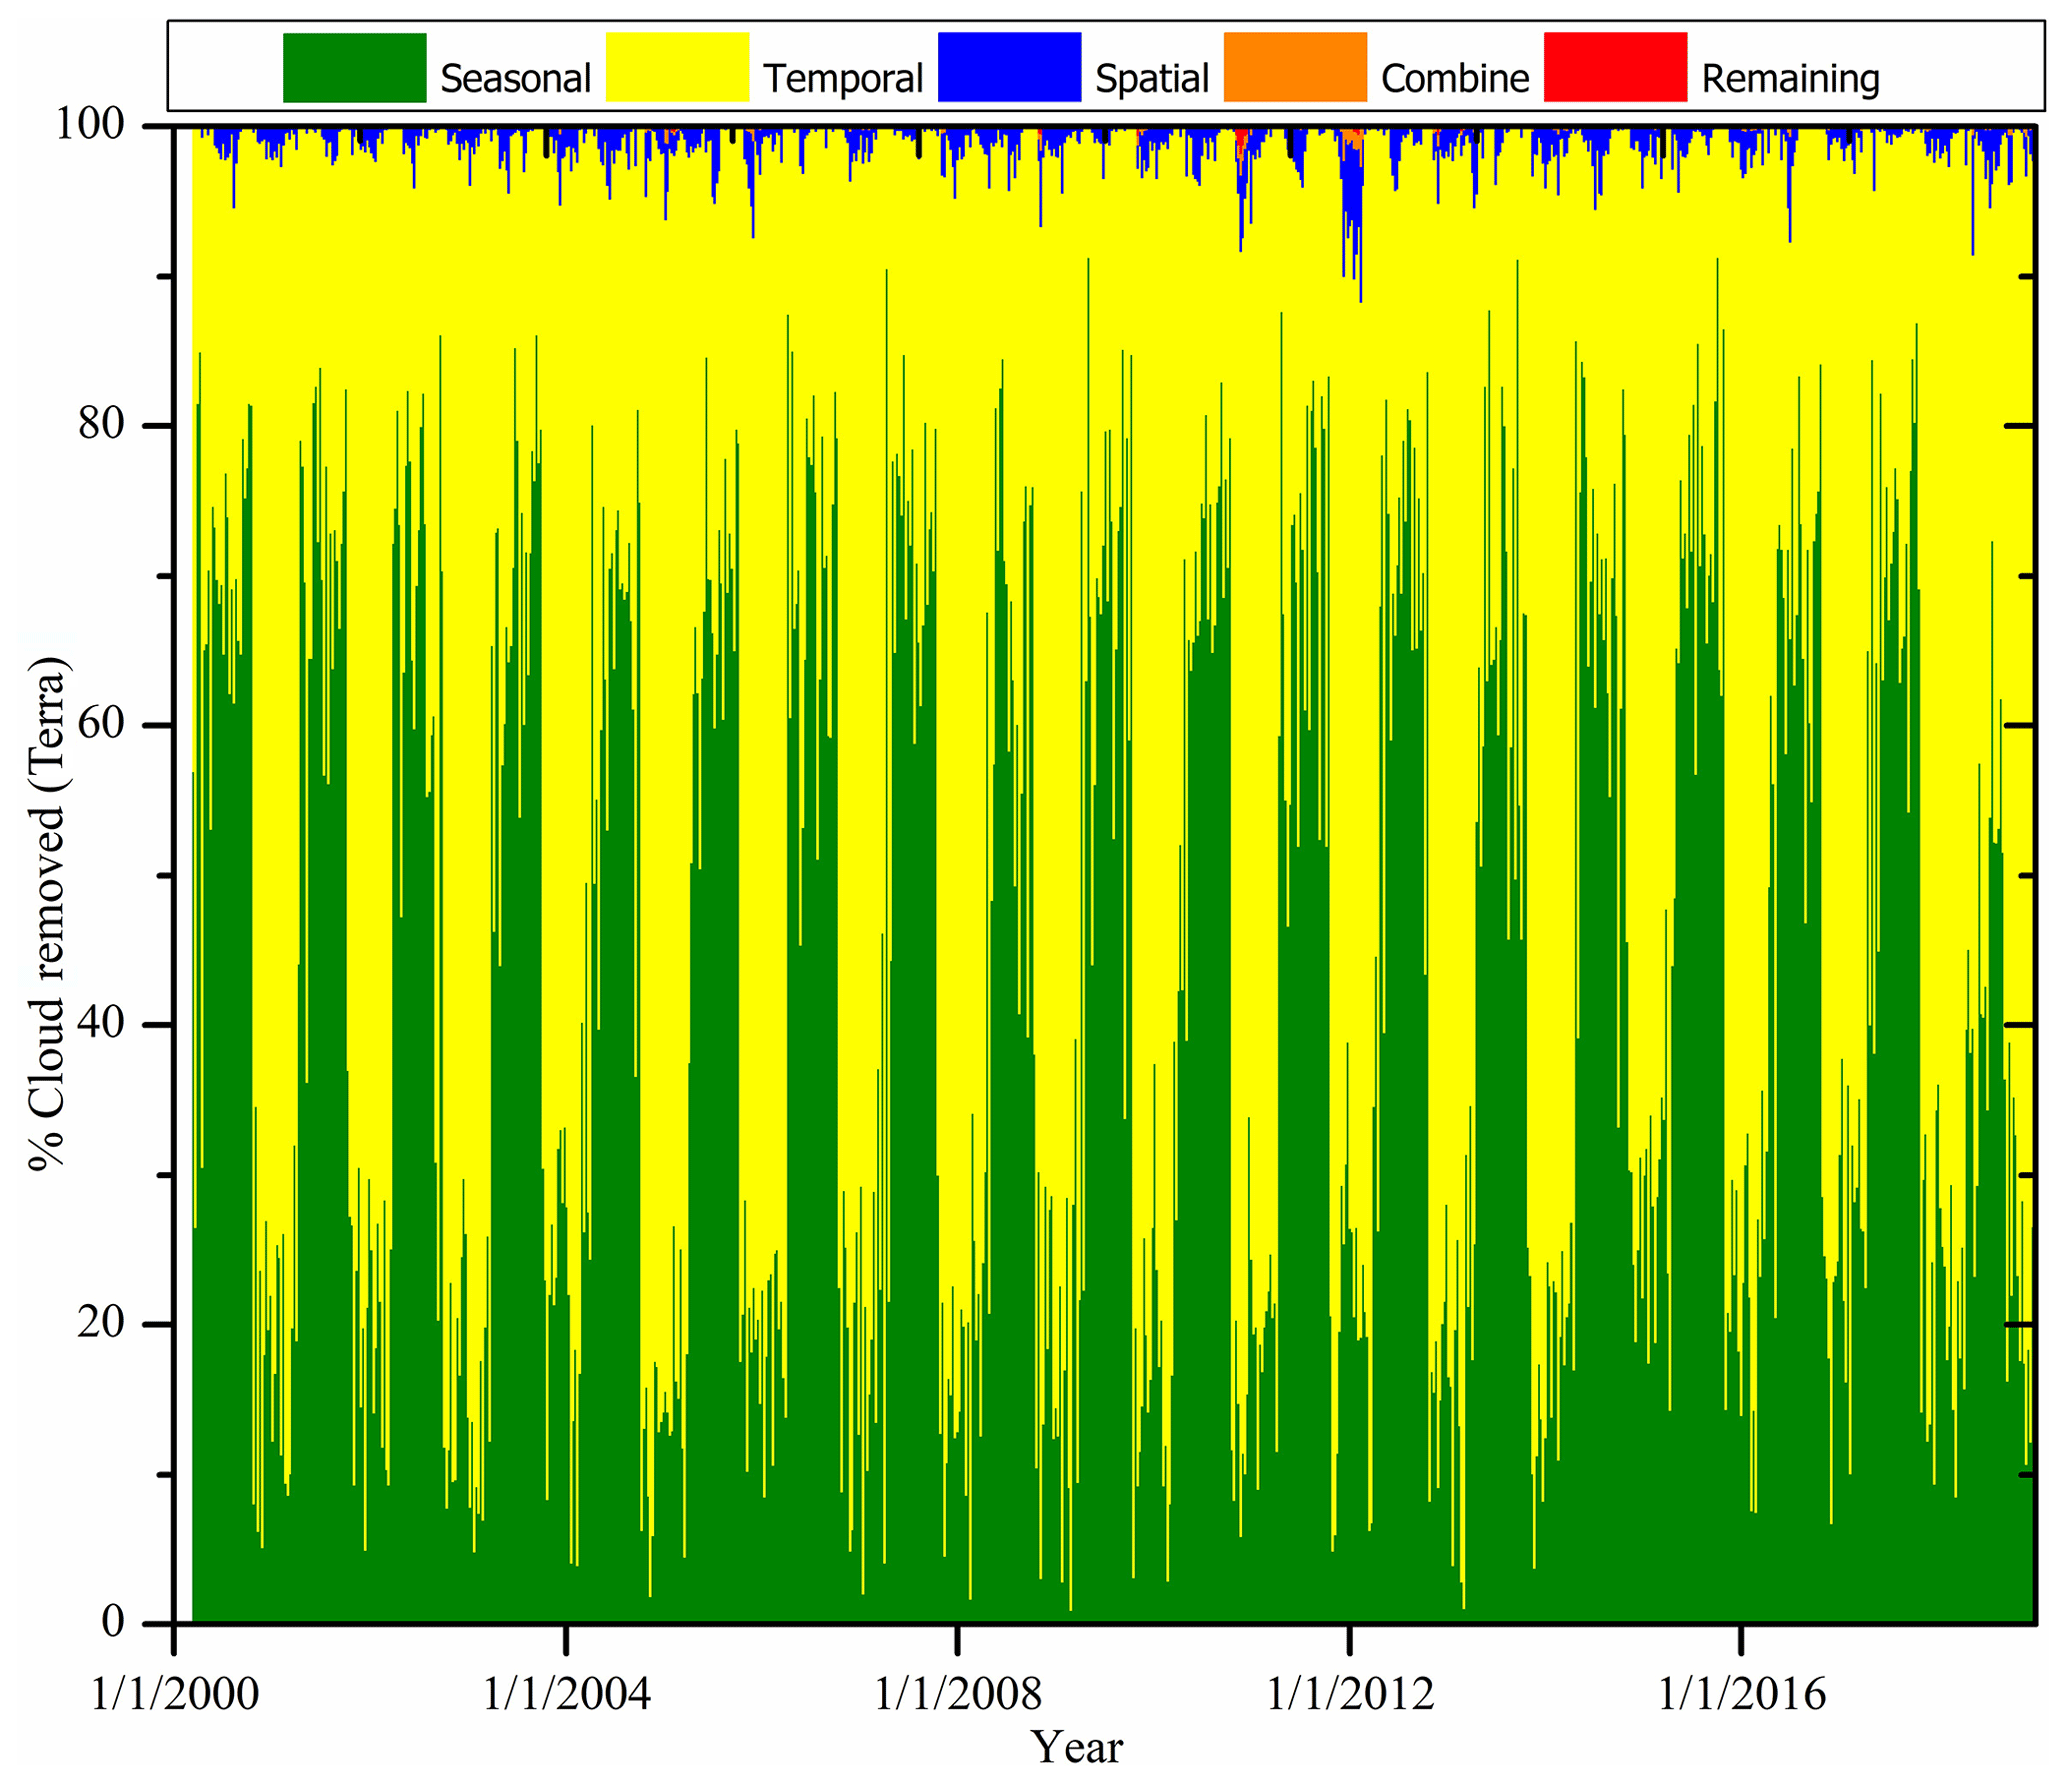
Figure 5Cloud cover removed from the Terra product by seasonal filter, temporal filter, spatial filter, combining improved MOD10A2 and MYD10A2, and remaining cloud cover. The seasonal, temporal, and spatial labels in the legend indicate the filters.
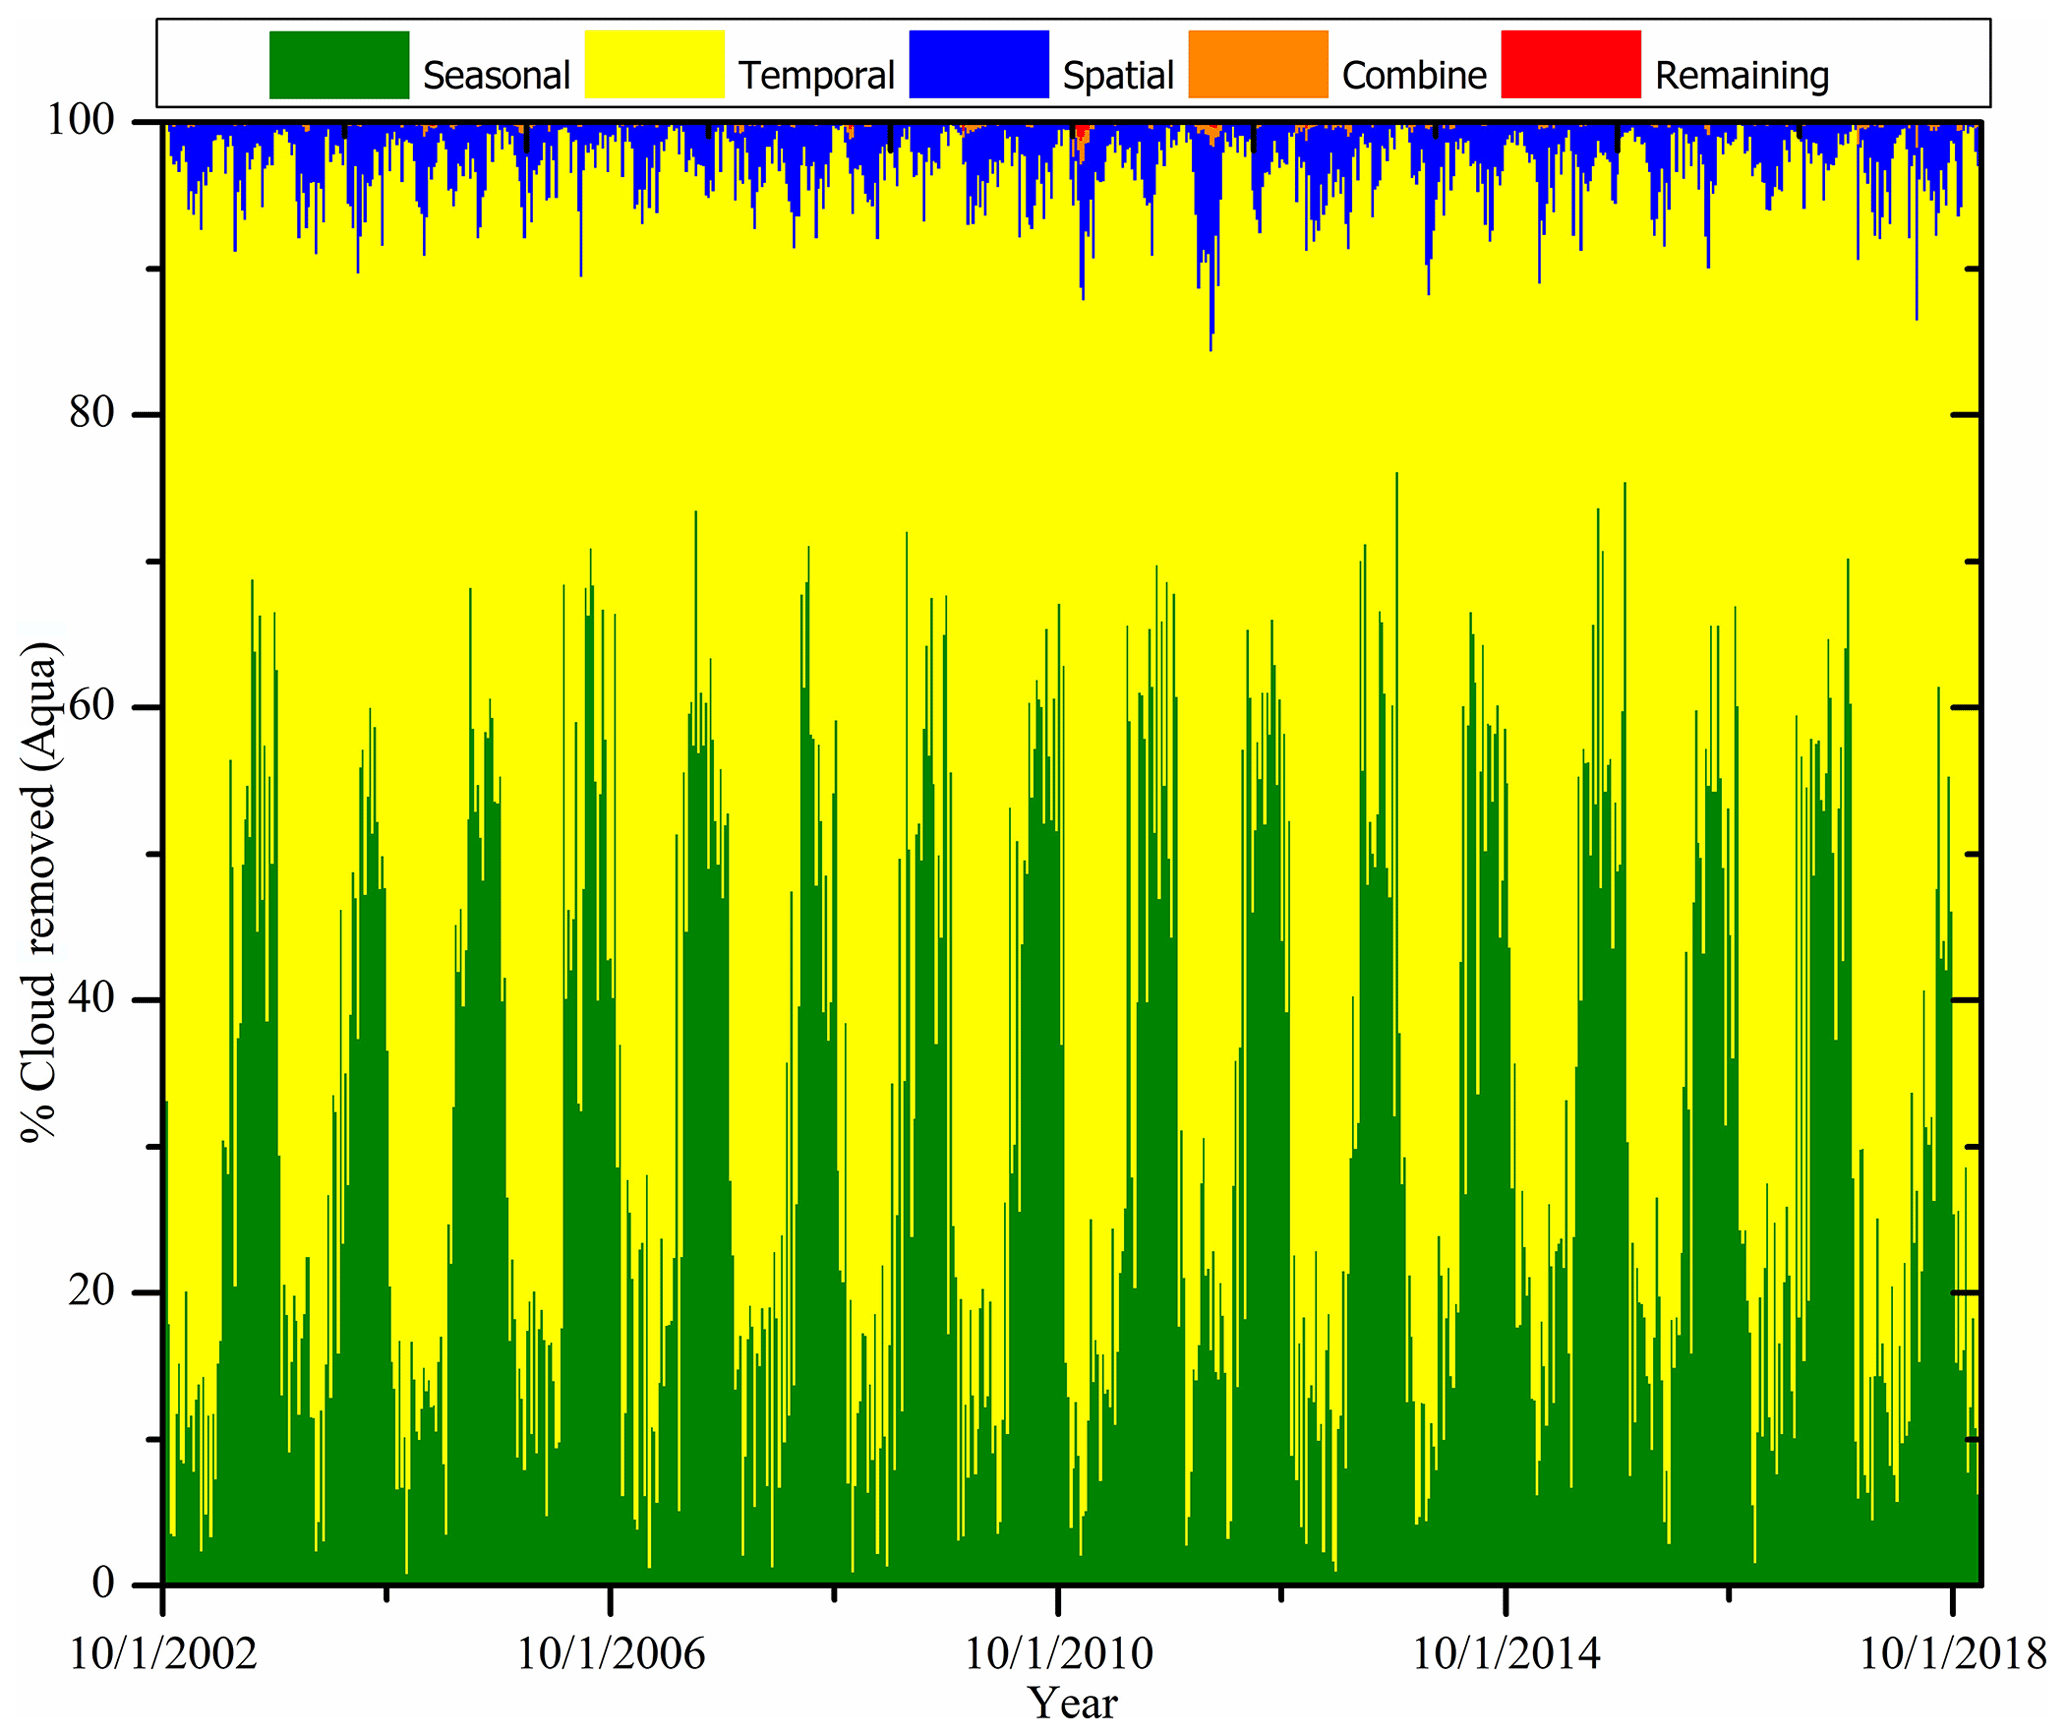
Figure 6Cloud cover removed from the Aqua product by seasonal filter, temporal filter, spatial filter, combining improved MOD10A2 and MYD10A2, and remaining cloud cover. The seasonal, temporal, and spatial labels in the legend indicate the respective filters.
3.5 Combined glaciers (RGI 6.0) in the improved snow product
In the regions where snow and glaciers both exist, it is challenging to differentiate between them, particularly in the accumulation period. Also, the glacier ice mainly in the late ablation season is difficult to detect using the MODIS algorithm for snow when the albedo of the glacier surface is comparatively low. MODIS is incapable of mapping ice under the debris. Therefore, we used the latest Randolph Glacier Inventory version 6.0 (RGI 6.0; RGI Consortium, 2017), partly developed by Mölg et al. (2018), and supraglacial debris cover for RGI 6.0 by Scherler et al. (2018), resampled into the MODIS pixel size, and merged it into the combined MODIS data. A combined snow and glacier cover (debris-covered and debris-free) product was developed which will be useful mainly for glacio-hydrological applications.
3.6 Validation of the product using Landsat data
The final product was validated to assess the accuracy of the improved snow product using snow derived from Landsat 8 (United States Geological Survey, USGS) images for the year 2018 during summer and winter. The snow was classified in Landsat using the similar criterion which was applied for MODIS snow products, using NDSI based on Landsat 8 bands 3 (0.53–0.59 µm) and 6 (1.57–1.65 µm). Only those pixels with NDSI values greater than or equal to 0.4 are regarded as snow, having reflectance of >11 % in the near-infrared band. The reflectance threshold is to prevent water from being incorrectly classified as snow. MODIS datasets were resampled to the Landsat pixel resolution before comparison. A total of 20 well-distributed Landsat scenes throughout HMA were compared to the combined Terra and Aqua snow products to validate our results as shown in Fig. 1. We selected cloud-free (<5 %) Landsat images except for one site (Nepal) where the clouds were approximately 7 % due to persistent cloud cover throughout the year. The overall accuracy of the original MOD10A2.006* and MYD10A2.006* products, processed, and the combined (Terra–Aqua MODIS) final product is shown in Tables 1 and 2. The overall accuracy was not necessarily improved for all cases mainly due to the cloud cover and the overestimation of snow by MODIS in the original product. The combined product exhibited significant improvement over the Terra and Aqua original snow products when compared to Landsat as shown in Fig. 8.
Table 1Validation of snow cover (peak snow cover period) for 10 selected well-distributed areas to represent the study area derived by the original Terra MODIS (MOD10A2.006*), Aqua MODIS (MYD10A2.006*), and their individual and merged improved data.
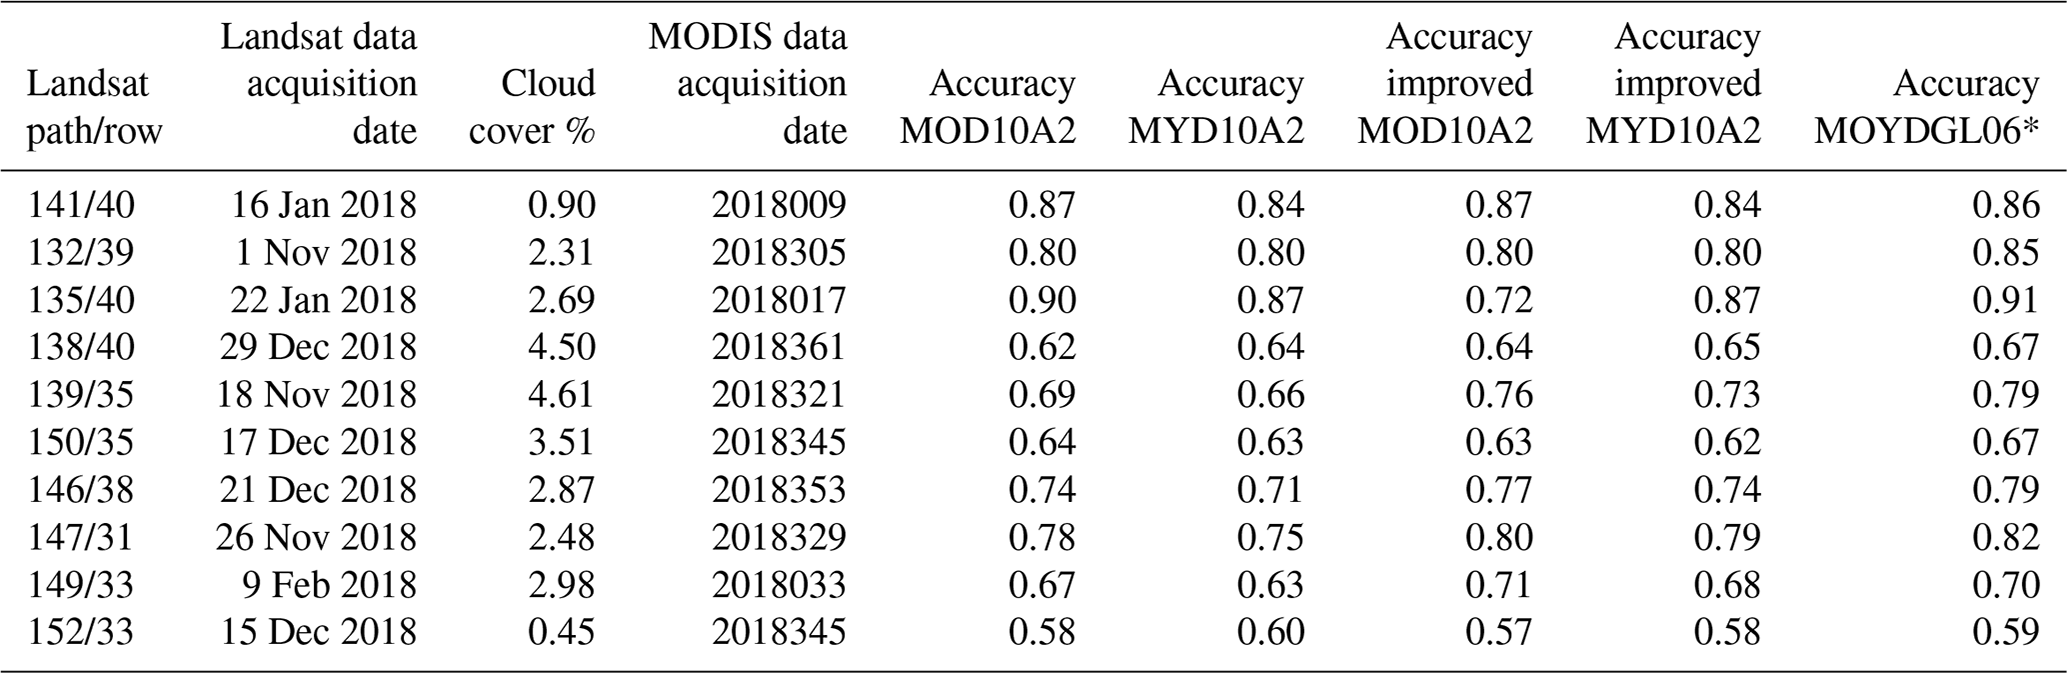
Table 2Validation of snow cover (minimum snow cover period) for 10 selected well-distributed areas to represent the study area derived by the original Terra MODIS (MOD10A2.006*), Aqua MODIS (MYD10A2.006*), and their individual and merged improved data.
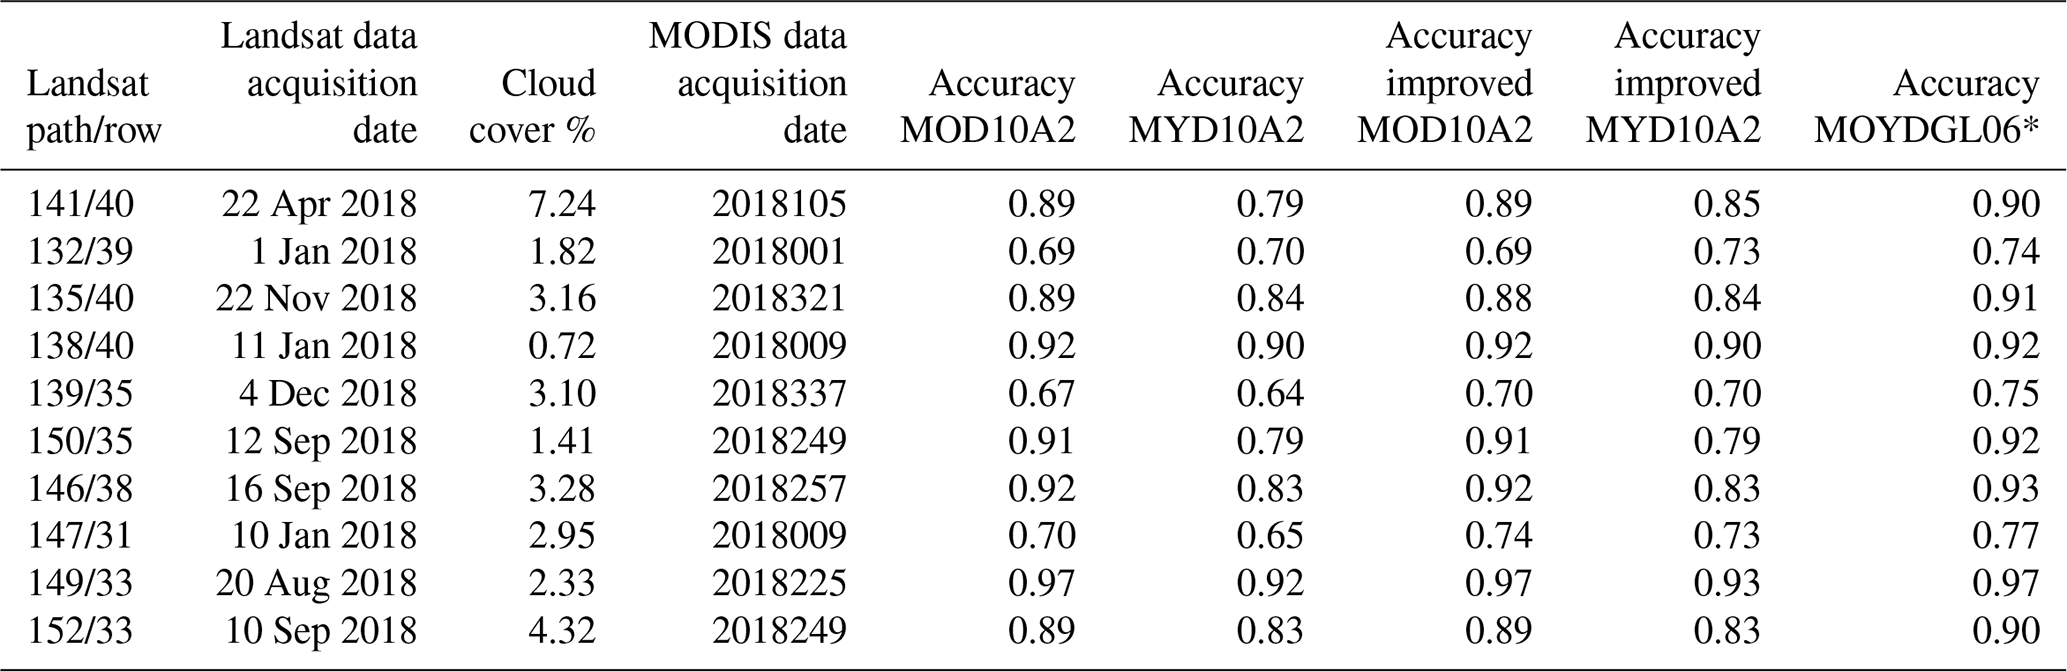
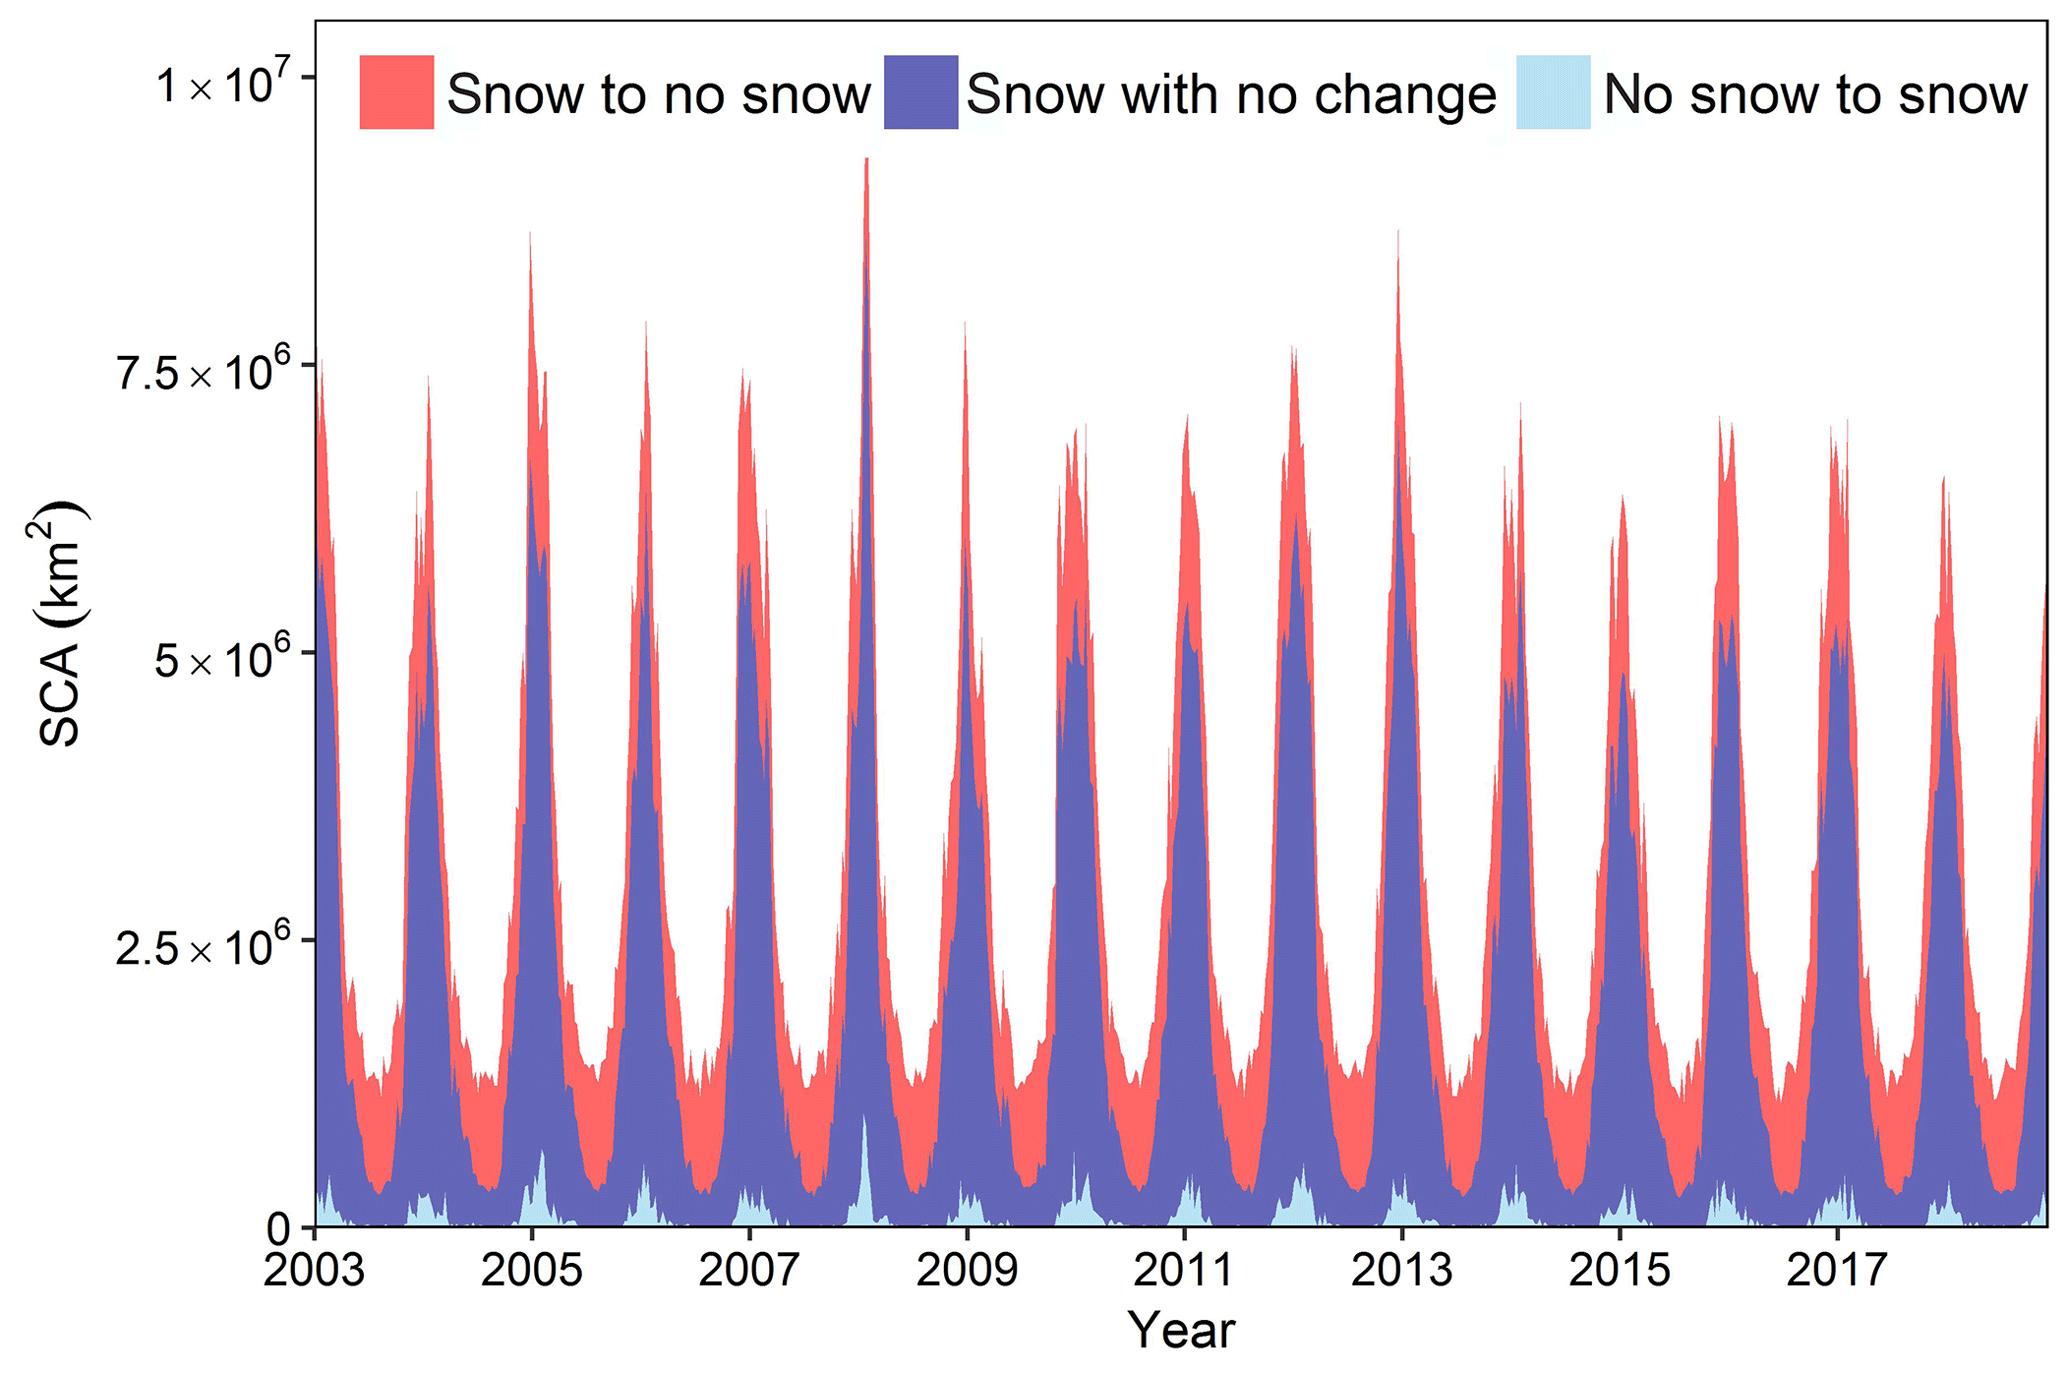
Figure 7Improved Terra and Aqua merged snow for the period between 2002 and 2018. The value −200 is the snow converted to no snow in the final product, 0 is no snow either in the C6 data or converted from cloudy pixels, 200 is snow without any change in the MOD10A2 and MYD10A2 C6 products and MOYDGL06* product, and 210 is the no snow converted to snow mainly due to cloud cover.
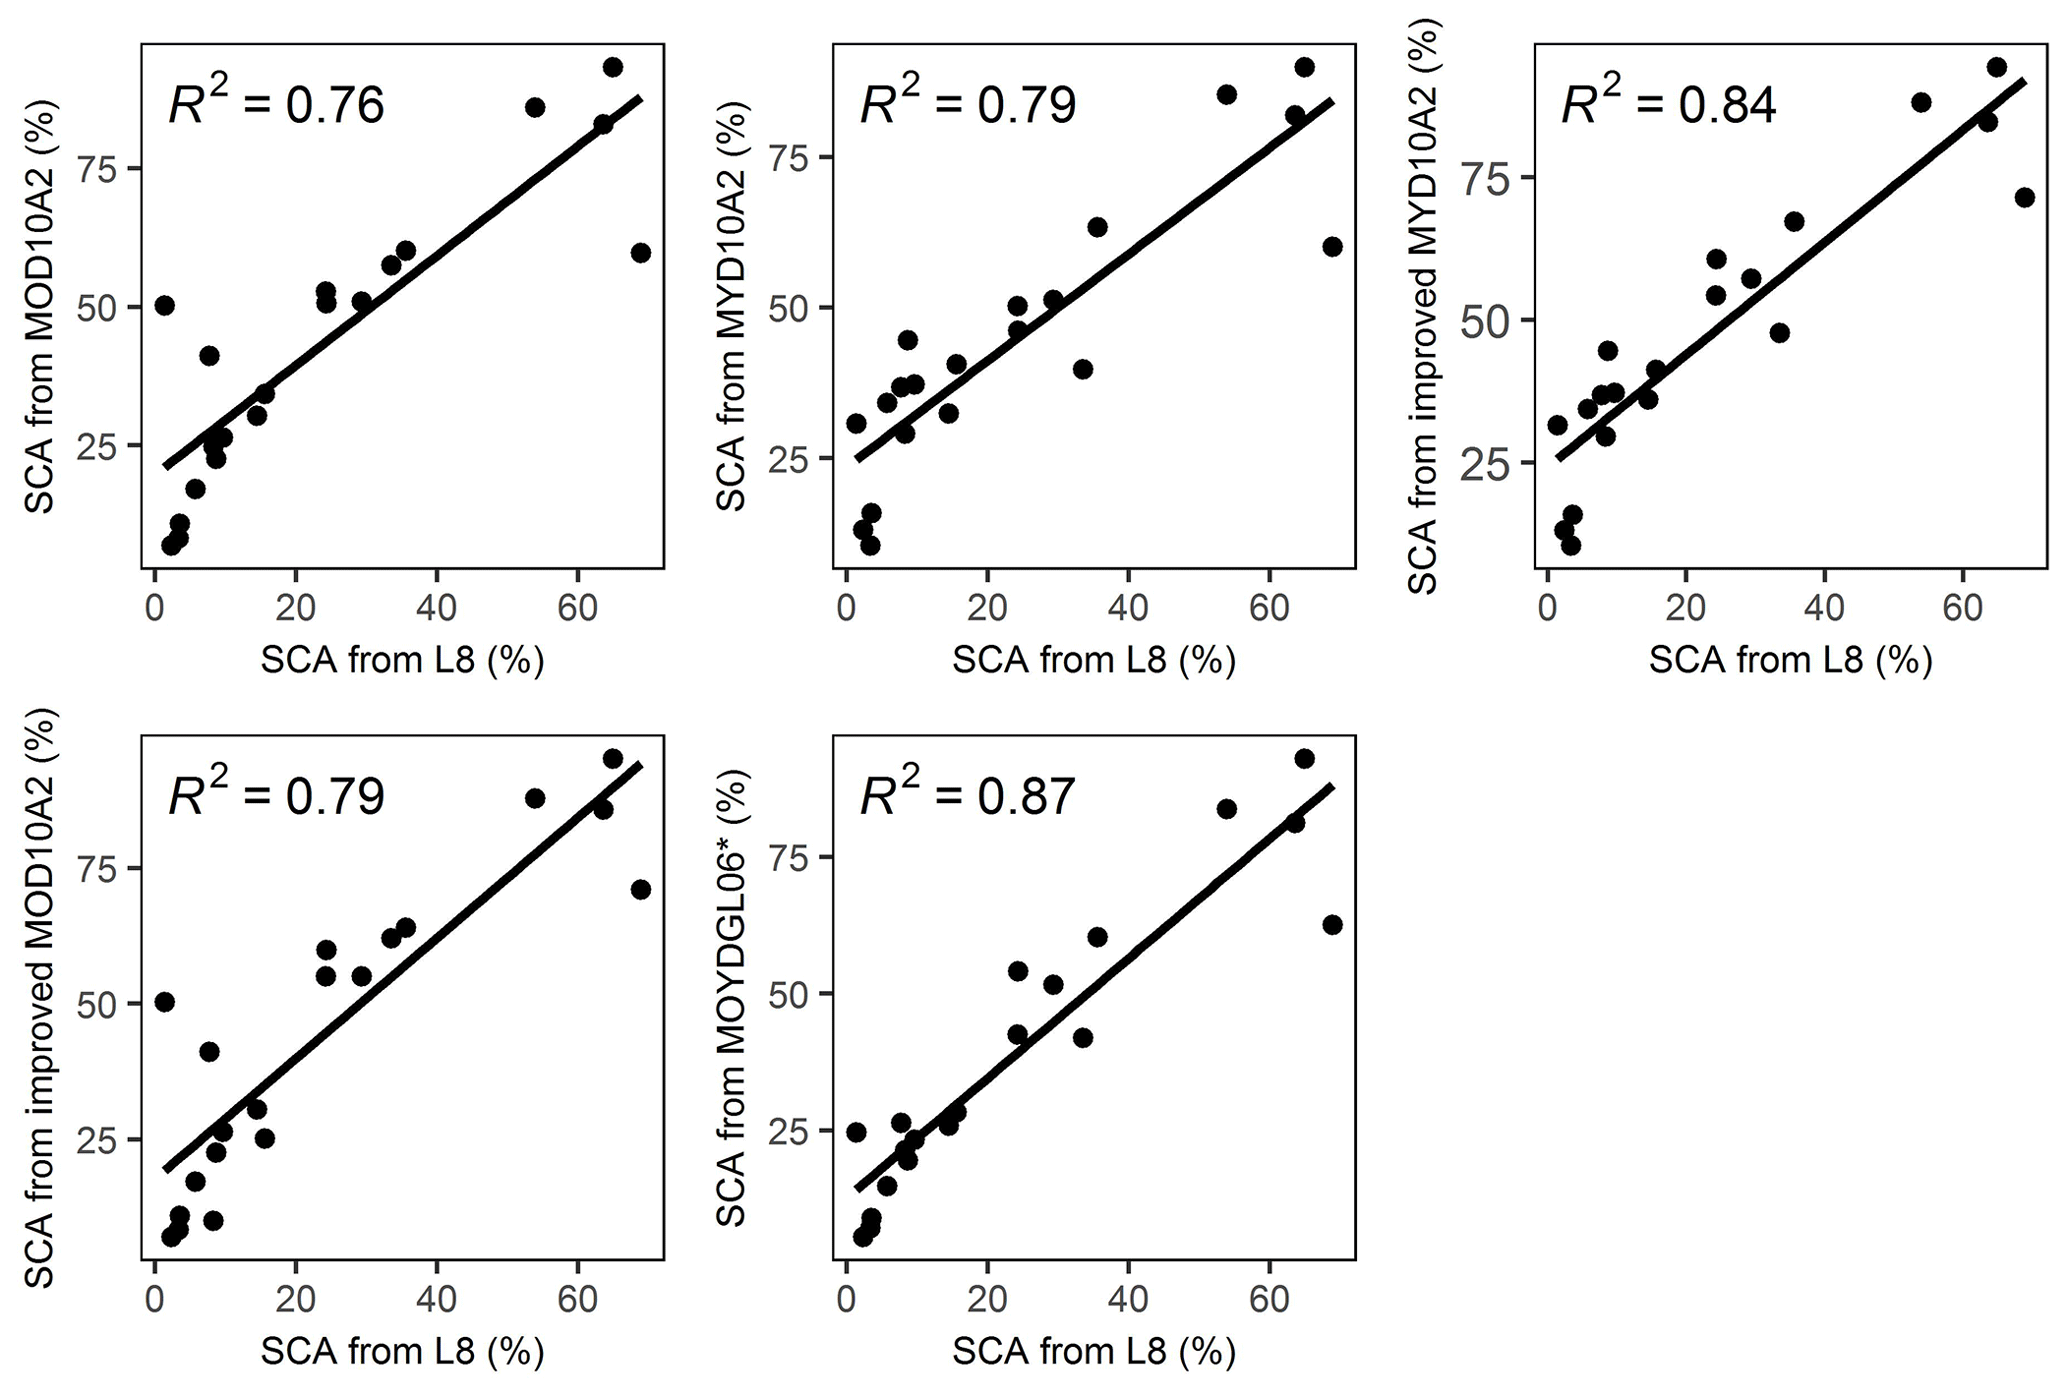
Figure 8Correlation of the snow cover area (SCA) from original products, improved individual MOD10A2* and MYD10A2* C6 products, and MOYDGL06* data with the Landsat 8 (L8) data.
The present study generated a combined Terra and Aqua 8 d composite snow in combination with glacier (debris-covered, debris-free) product named MOYDGL06* from 2002 to 2018. The study period started from the year 2002 as Aqua satellite data are available from 2002. We have not used MODIS snow data for the year 2000 in our final product, but it is worth mentioning that the snow data till 10 December 2000 contain data voids and strips and are not recommended for any applications or analysis. We have used existing techniques for cloud removal in addition to uniquely combining Terra and Aqua snow to reduce the dominant overestimation of snow cover. The first step (seasonal filter) removed approximately 44.66 % and 31.29 % of the total cloud cover existing mainly outside the snow cover extent in Terra and Aqua products, respectively. This step does not affect snow data if there is snow on any day of the half-year period; the data in the original products are extracted based on the mask in this step. The second step (temporal filter) removed around 54.08 % and 65.48 % of the total clouds, which is equal to 98.74 % and 96.77 % of the total removed clouds in combination with the seasonal filter, applied to Terra and Aqua snow products, respectively. The temporal filter was the most effective step in cloud removal. The third step (majority neighbourhood spatial filter) led to the removal of 99.91 % and 99.84 % of the total clouds, in which 1.17 % and 3.07 % were removed by the spatial filter itself in Terra and Aqua snow products, respectively. The spatial filter removes a significant number of cloudy pixels, with minor errors (Paudel and Andersen, 2011). The fourth step of combining Terra and Aqua products also helped to remove 0.06 % and 0.14 % of the clouds, respectively, making the product 99.98 % cloud-free on average. As a whole, on average, approximately 0.02 % of the total clouds remained in our final product, whereas the original MODIS Terra and Aqua products were affected by clouds at 5.31 % and 6.52 % on average. Our data are available at https://doi.org/10.1594/PANGAEA.901821 (Muhammad and Thapa, 2019).
The method of combining Terra and Aqua is also an inter-verification of the snow derived by both the satellites. Our results indicated that on average approximately 46 % of the total snow is overestimated by MODIS. This significant difference in the snow data is mainly due to the large swath and low spatial resolution of MODIS, which makes it challenging to map snow cover accurately, particularly at the edges of each image. Similarly, the off-nadir view makes the sensor zenith angle larger, causing it to replicate the edge pixels, whereas the underestimation is mainly caused by the cloud cover but is insignificant, i.e. 3.66 % of the snow on average for the whole study area. These results suggest that the uncertainty of underestimation in the snow cover due to cloud is quite low (approximately 7 % of the overall uncertainty), in contrast to the overestimation uncertainty contribution of about 93 %. It is to be noted that this cloud cover is significantly reduced in the 8 d composite as the cloud cover is the least possible in the consequent 8 d. We strongly recommend the MODIS snow cover product derived from our methods; particularly combining snow with the glacier cover (debris-covered and debris-free) makes it more comprehensive and usable for various hydro-glaciological applications. The glacier ice captured by MODIS as snow is represented as 200 (snow). We combined glaciers uncaptured as snow by MODIS in the combined product, representing debris-covered and debris-free ice as 240 and 250, respectively. These values (240 and 250) may be ignored or converted to no snow if the user is only interested in the MODIS snow product. In such cases, the values 200 and 210 can be regarded as final snow.

Figure 9Snow underestimation by a 7 % persistency threshold (7P) in the MOYDGL06* product. The red colour is the snow with no changes, whereas blue is the underestimated snow by the persistence threshold.
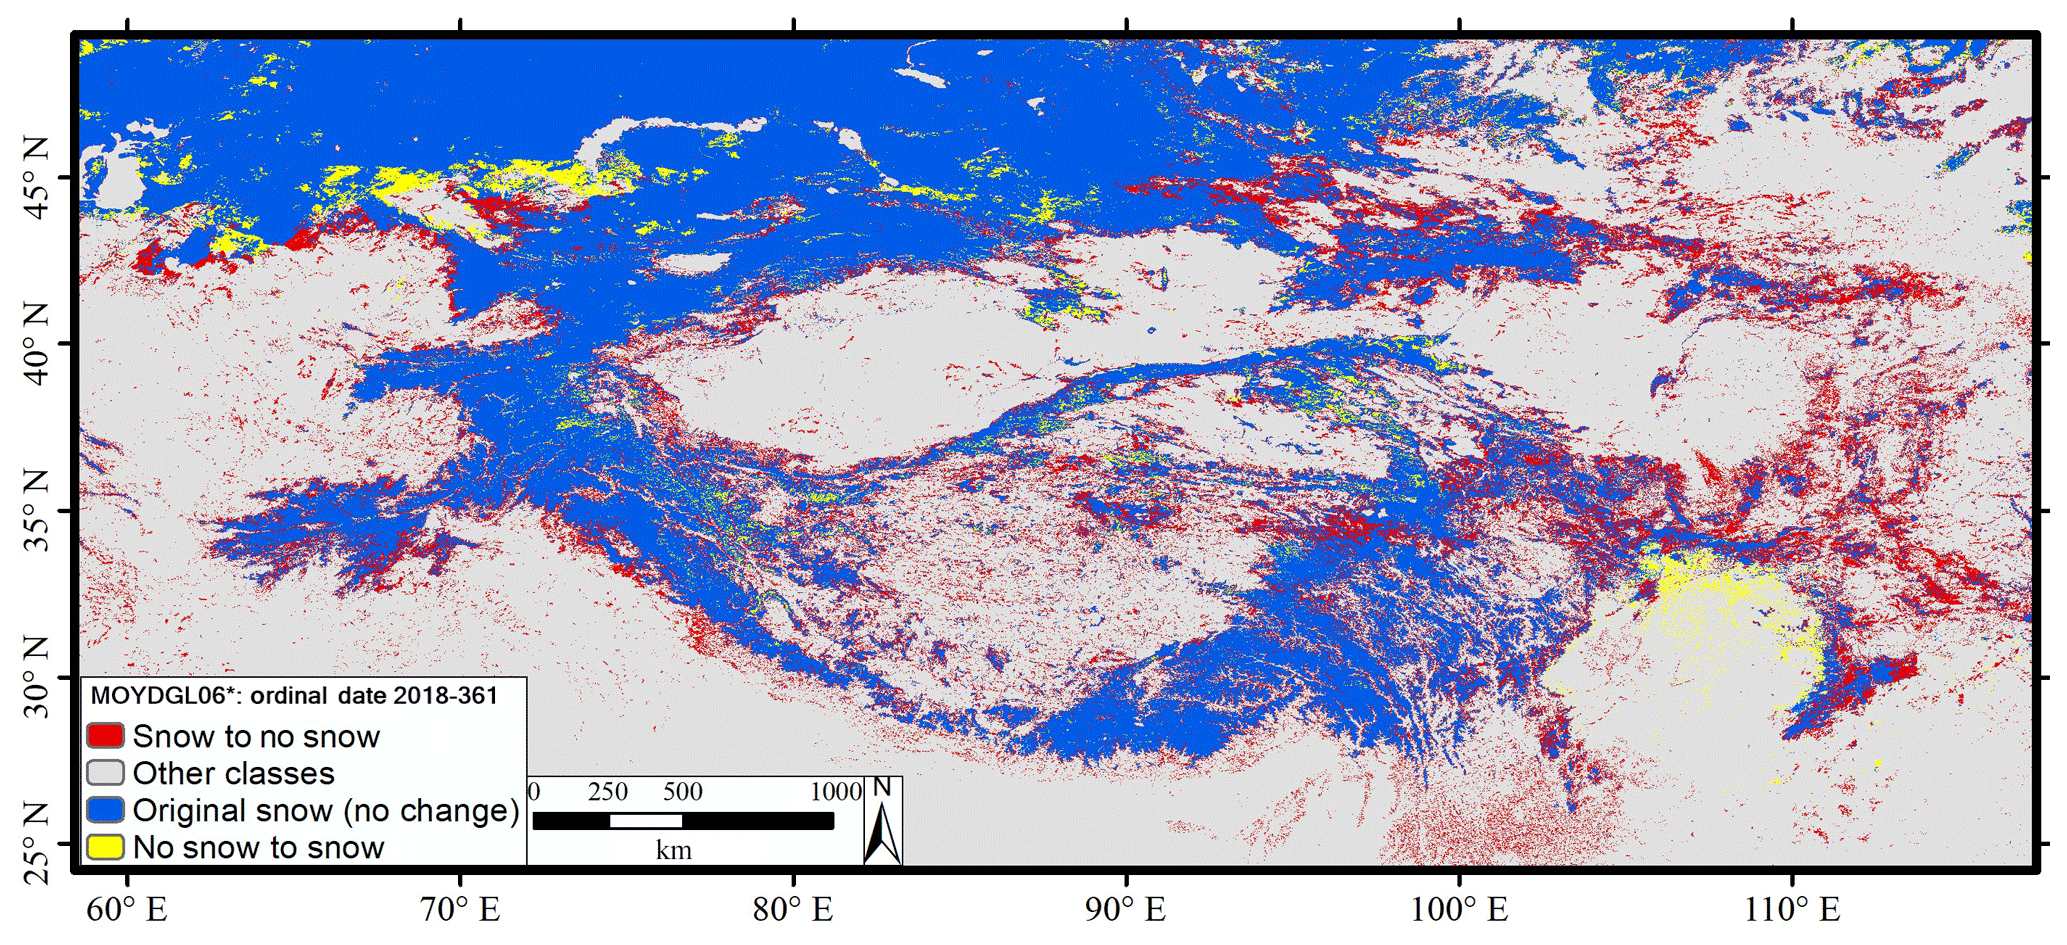
Figure 10An example of the improved snow MOYDGL06* product showing the snow with no change, snow converted to no snow, and no snow converted to snow by our methodology in the combined Terra and Aqua product. The blue and yellow classifications are used in the MOYDGL06* product.

Figure 11MOD10A2* and MYD10A2* and MOYDGL06* snow cover area (SCA) time series between 2002 and 2018 for the whole study area.
Comparison of the snow cover area estimated by Landsat and MODIS original MOD10A2.006 and MYD10A2.006 products and individual and combined final products showed that our methodology improved the accuracy by 10 % from 77 % to 87 % on average, reducing the inevitable overestimation for 20 well-distributed (in space and time) Landsat scenes. The remaining overestimation is constrained by low spatial resolution and a large swath. Therefore, for very small-scale studies, low-spatial-resolution data, including our improved snow product, are not recommended. The overall accuracy assessment based on Landsat data is incapable of capturing approximately 46 % of the overestimated snow (Fig. 8), facilitated by our methodology of combining Terra and Aqua. The overestimation in Terra and Aqua MODIS 8 d products (MOD10A2* and MYD10A2*) is enormous and may not be suitable for statistical analysis and other hydrological applications without improvement. Whereas, due to cloud cover, MODIS was not able to catch on average 3.66 % of the snow, our filtering techniques facilitated the conversion of it into snow.
It is essential to highlight that the snow persistence threshold as suggested by Hammond et al. (2018) is useful to remove overestimated snow at low altitudes. At the same time, it can also underestimate snow in some areas, particularly in the Tibetan Plateau and in the eastern Himalayas. Although it worked well in the Karakoram and surrounding areas, the inconsistency throughout the region makes this algorithm ineffective for large-scale studies. An example of snow underestimation by a 7 % persistence threshold is shown in Fig. 9. Similarly, some studies used a snow line approach to remove overestimated snow at low altitudes and convert cloudy pixels to snow or no snow (Dietz et al., 2013; Krajčí et al., 2014, 2016; Parajka et al., 2010). However, the use of snow line approach is questionable in complex terrain due to higher elevation variability. As an alternative to both these methods, we recommend using a combination of Terra and Aqua, considering snow only if both the satellites map the pixels as snow, otherwise the no snow classification is applied. This criterion removed approximately 46 % of the overestimated snow, including most of the low-altitude snow, but the overall accuracy is incapable of representing such an enormous enhancement; it may somewhat negatively affect the overall accuracy. An example of the improved snow product based on the criteria is shown in Fig. 10. Our accuracy assessment based on Landsat data shows that the snow cover in our final combined snow product is improved by approximately 10 % on average as compared to MOD10A2.006 and MYD10A2.006 snow products. The slight improvement in overall accuracy in the final product is expected mainly because of the MODIS data resolution (Gao et al., 2010; Parajka and Blöschl, 2008). This improvement is mainly due to the cloud removal and conversion of masked snow by clouds to snow. The considerable uncertainty of underestimation is mainly due to cloud cover and overestimation by MODIS data, making the original MODIS 8 d composite C6 products approximately 50 % uncertain, which limits the data quality to quantify the snow dynamics from the original Terra and Aqua snow products. The original products and final snow time series of 2002–2018 for the whole study area are shown in Fig. 11. The original and improved data products show a significant difference throughout the observation period. The improved data also include the snow below the cloud cover. Bias in both the datasets is slightly reduced by the snow converted from no snow mainly due to cloud cover.
We found that two images were missing in the original MODIS 8-day composite C6 products, namely 2008145 and 2016049 during the 2002–2018 time series. To fill this gap, we used the previous images, which were 2008137 and 2016041, as a replacement for the missing images. This replacement is based on the assumption that the snow cover remained the same as in the previous 8-day composite image. The replacement of only two missing images with an appropriate logic in a long time series will not compromise the statistical analysis and its further use for various hydro-glaciological applications. The overall snow cover showed a significantly negative trend from 2013 to 2018. We observed a positive snow cover trend during the first decade of the twenty-first century; a similar and short observation period was covered by many glacier mass balance studies (Brun et al., 2017; Gardelle et al., 2013; Gardner et al., 2013; Kääb et al., 2012, 2015; Muhammad et al., 2019a, 2019b; Muhammad and Tian, 2016). It might be interesting to estimate and understand the contemporary glacier mass balance and its hydrological impact across the region.
The enhanced 8-day composite MODIS Terra and Aqua combined snow product derived from MODIS Terra (MOD10A2) and Aqua (MYD10A2) version 6 merged with Randolph Glacier Inventory version 6 (RGI 6.0) was named MOYDGL06*. In the improved snow product, we flagged the pixels which were changed from the original product, either from no snow to snow or the other way around. The values in the final product were classified as 0 if no snow, 200 if the pixel is snow in the original and final product, and −200 if snow is converted to no snow in the final product. If no snow is converted to snow mainly under cloud cover, the value is flagged as 210; exposed debris-covered and debris-free ice are numbered as 240 and 250, respectively. The glacier ice (debris-covered and debris-free) shielded by snow is classified as snow. All the improved snow data of the combined product throughout the study period are shown in Fig. 7. The combined product will especially be useful for many hydro-glaciological applications. If only snow data are required, then the values −200, 240, and 250 should be regarded as no snow, while 200 and 210 represent the improved snow. The data are available at: https://doi.org/10.1594/PANGAEA.901821 (Muhammad and Thapa, 2019). A source code for this product is available at: https://doi.org/10.5281/zenodo.3610735 (Thapa, 2020). The code comprises a temporal filter, spatial filter, and combined MODIS Terra and Aqua products. The accompanying dataset README file gives the necessary information about the code prerequisites and execution.
A combined snow product derived from Terra and Aqua MODIS version 6 and a glacier inventory (RGI 6.0), named MOYDGL06*, was developed from 2002 to 2018 covering the high mountains of Asia. The product consists of the original snow data and pixels, changed from snow to no snow and vice versa based on our methodology. The value −200 is the overestimated snow which was originally mapped as snow by either Terra or Aqua and was converted to no snow by combining Terra and Aqua; 200 is snow in both Terra and Aqua without any change in the final product; 210 is the no snow to snow converted mainly from clouds to snow; 240 and 250 values represent debris-covered and debris-free ice, respectively. On average the value −200 was approximately 46 % of the original snow (both Terra and Aqua) for the whole region during the study period, whereas 210 is 3.66 % on average mainly due to cloud cover, suggesting that the original MODIS data are 50 % uncertain in comparison to our final combined snow product. We concluded that clouds are not the main obstacle in the MOD10A2 and MYD10A2 C6 products as they reduce only 3.66 % of the snow for the entire HMA. Our correlation of accuracy assessment shows that our final MODIS product in comparison to 20 well-distributed Landsat scenes improved the accuracy by 10 % from 77 % to 87 % on average. The hindrance in MODIS data quality is due to the broad swath and low spatial resolution, which mainly affect snow conditions in the topographically complex mountainous regions. The availability of this improved product can serve as a valuable dataset for hydrological and glaciological modelling, cryosphere monitoring, and associated changes.
SM designed the study and developed the methodology. SM and AT applied the methodology. Both the authors contributed to the writing of the paper and data quality control.
The authors declare that they have no conflict of interest.
This work was supported by the Cryosphere Initiative of the International Centre for Integrated Mountain Development (ICIMOD), funded by Norway and by core funds of the ICIMOD contributed by the governments of Afghanistan, Australia, Austria, Bangladesh, Bhutan, China, India, Myanmar, Nepal, Norway, Pakistan, Sweden, and Switzerland. The views and interpretations in this publication are those of the authors and are not necessarily attributable to the ICIMOD. Thank you to the anonymous reviewers, Rajesh Bahadur Thapa, Karma Tsering, and Yasir Latif for the constructive comments and suggestions.
This research has been supported by the International Centre for Integrated Mountain Development (ICIMOD; grant no. 3-939-242-0-P).
This paper was edited by Birgit Heim and reviewed by two anonymous referees.
Alonso-González, E., López-Moreno, J. I., Gascoin, S., García-Valdecasas Ojeda, M., Sanmiguel-Vallelado, A., Navarro-Serrano, F., Revuelto, J., Ceballos, A., Esteban-Parra, M. J., and Essery, R.: Daily gridded datasets of snow depth and snow water equivalent for the Iberian Peninsula from 1980 to 2014, Earth Syst. Sci. Data, 10, 303–315, https://doi.org/10.5194/essd-10-303-2018, 2018.
Armstrong, R. L., Rittger, K., Brodzik, M. J., Racoviteanu, A., Barrett, A. P., Khalsa, S. J. S., Raup, B., Hill, A. F., Khan, A. L., Wilson, A. M., Kayastha, R. B., Fetterer, F., and Armstrong, B.: Runoff from glacier ice and seasonal snow in High Asia: separating melt water sources in river flow, Reg. Environ. Chang., (November), 19, 1249–1261, https://doi.org/10.1007/s10113-018-1429-0, 2019.
Basang, D., Barthel, K., Olseth, J. A., Basang, D., Barthel, K., and Olseth, J. A.: Satellite and Ground Observations of Snow Cover in Tibet during 2001–2015, Remote Sens., 9, 1201, https://doi.org/10.3390/rs9111201, 2017.
Brun, F., Berthier, E., Wagnon, P., Kääb, A., and Treichler, D.: A spatially resolved estimate of High Mountain Asia glacier mass balances from 2000 to 2016, Nat. Geosci., 10, 668–673, https://doi.org/10.1038/ngeo2999, 2017.
Clifton, C. F., Day, K. T., Luce, C. H., Grant, G. E., Safeeq, M., Halofsky, J. E., and Staab, B. P.: Effects of climate change on hydrology and water resources in the Blue Mountains, Oregon, USA, Clim. Serv., 10, 9–19, https://doi.org/10.1016/j.cliser.2018.03.001, 2018.
Colbeck, S. C.: Short-term forecasting of water run-off from snow and ice, J. Glaciol., 19, 571–588, 1977.
Dietz, A. J., Kuenzer, C., and Conrad, C.: Snow-cover variability in central Asia between 2000 and 2011 derived from improved MODIS daily snow-cover products, Int. J. Remote Sens., 34, 3879–3902, https://doi.org/10.1080/01431161.2013.767480, 2013.
Gafurov, A. and Bárdossy, A.: Cloud removal methodology from MODIS snow cover product, Hydrol. Earth Syst. Sci., 13, 1361–1373, https://doi.org/10.5194/hess-13-1361-2009, 2009.
Gao, Y., Xie, H., Yao, T., and Xue, C.: Integrated assessment on multi-temporal and multi-sensor combinations for reducing cloud obscuration of MODIS snow cover products of the Pacific Northwest USA, Remote Sens. Environ., 114, 1662–1675, https://doi.org/10.1016/j.rse.2010.02.017, 2010.
Gardelle, J., Berthier, E., Arnaud, Y., and Kääb, A.: Region-wide glacier mass balances over the Pamir-Karakoram-Himalaya during 1999–2011, The Cryosphere, 7, 1263–1286, https://doi.org/10.5194/tc-7-1263-2013, 2013.
Gardner, A. S., Moholdt, G., Cogley, J. G., Wouters, B., Arendt, A. A., Wahr, J., Berthier, E., Hock, R., Pfeffer, W. T., Kaser, G., Ligtenberg, S. R. M. M., Bolch, T., Sharp, M. J., Hagen, J. O., Van Den Broeke, M. R., and Paul, F.: A reconciled estimate of glacier contributions to sea level rise: 2003 to 2009, Science, 80, 852–857, https://doi.org/10.1126/science.1234532, 2013.
Gurung, D. R., Kulkarni, A. V, Giriraj, A., Aung, K. S., and Shrestha, B.: Monitoring of seasonal snow cover in Bhutan using remote sensing technique, available at: http://re.indiaenvironmentportal.org.in/files/file/seasonal snow cover.pdf (last access: 22 January 2019), 2011.
Hall, D. K. and Riggs, G. A.: Accuracy assessment of the MODIS snow products, Hydrol. Process., 21, 1534–1547, https://doi.org/10.1002/hyp.6715, 2007.
Hall, D. K., Riggs, G. A., Salomonson, V. V., Digirolamo, N. E., and Bayr, K. J.: MODIS snow-cover products, Remote Sens. Environ., 83, 181–194, https://doi.org/10.1016/S0034-4257(02)00095-0, 2002.
Hall, D. K., Riggs, G. A., Foster, J. L., and Kumar, S. V.: Development and evaluation of a cloud-gap-filled MODIS daily snow-cover product, Remote Sens. Environ., 114, 496–503, https://doi.org/10.1016/j.rse.2009.10.007, 2010.
Hammond, J. C., Saavedra, F. A., and Kampf, S. K.: Global snow zone maps and trends in snow persistence 2001–2016, Int. J. Climatol., 38, 4369–4383, https://doi.org/10.1002/joc.5674, 2018.
Haq, M., Akhtar, M., Muhammad, S., Paras, S., and Rahmatullah, J.: Techniques of Remote Sensing and GIS for flood monitoring and damage assessment: A case study of Sindh province, Pakistan, Egypt. J. Remote Sens. Sp. Sci., 15, 135–141, https://doi.org/10.1016/j.ejrs.2012.07.002, 2012.
Hou, J., Huang, C., Zhang, Y., Guo, J., and Gu, J.: Gap-Filling of MODIS Fractional Snow Cover Products via Non-Local Spatio-Temporal Filtering Based on Machine Learning Techniques, Remote Sens., 11, 90, https://doi.org/10.3390/rs11010090, 2019.
Huang, X., Deng, J., Wang, W., Feng, Q., and Liang, T.: Impact of climate and elevation on snow cover using integrated remote sensing snow products in Tibetan Plateau, Remote Sens. Environ., 190, 274–288, https://doi.org/10.1016/j.rse.2016.12.028, 2017.
Hüsler, F., Jonas, T., Riffler, M., Musial, J. P., and Wunderle, S.: A satellite-based snow cover climatology (1985–2011) for the European Alps derived from AVHRR data, The Cryosphere, 8, 73–90, https://doi.org/10.5194/tc-8-73-2014, 2014.
Immerzeel, W. W., Droogers, P., de Jong, S. M., and Bierkens, M. F. P.: Large-scale monitoring of snow cover and runoff simulation in Himalayan river basins using remote sensing, Remote Sens. Environ., 113, 40–49, https://doi.org/10.1016/J.RSE.2008.08.010, 2009.
Kääb, A., Berthier, E., Nuth, C., Gardelle, J., and Arnaud, Y.: Contrasting patterns of early twenty-first-century glacier mass change in the Himalayas, Nature, 488, 495–498, https://doi.org/10.1038/nature11324, 2012.
Kääb, A., Treichler, D., Nuth, C., and Berthier, E.: Brief Communication: Contending estimates of 2003–2008 glacier mass balance over the Pamir–Karakoram–Himalaya, The Cryosphere, 9, 557–564, https://doi.org/10.5194/tc-9-557-2015, 2015.
Krajčí, P., Holko, L., Perdigão, R. A. P., and Parajka, J.: Estimation of regional snowline elevation (RSLE) from MODIS images for seasonally snow covered mountain basins, J. Hydrol., 519, 1769–1778, https://doi.org/10.1016/j.jhydrol.2014.08.064, 2014.
Krajčí, P., Holko, L., and Parajka, J.: Variability of snow line elevation, snow cover area and depletion in the main Slovak basins in winters 2001–2014, J. Hydrol. Hydromechan., 64, 12–22, https://doi.org/10.1515/johh-2016-0011, 2016.
Latif, Y., Ma, Y., Ma, W., Sher, M., and Muhammad, Y.: Snowmelt Runoff Simulation During Early 21st Century Using Hydrological Modelling in the Snow-Fed Terrain of Gilgit River Basin (Pakistan), Springer International Publishing, 2019.
Latif, Y., Ma, Y., Muhammad, Y., Sher, M., and Wazir, M. A.: Spatial analysis of temperature time series over the Upper Indus Basin (UIB) Pakistan, Theor. Appl. Climatol., 139, 741–758, https://doi.org/10.1007/s00704-019-02993-8, 2020.
Li, H., Li, X., Xiao, P., Li, H., Li, X., and Xiao, P.: Impact of sensor zenith angle on MOD10A1 data reliability and modification of snow cover data for the Tarim River Basin, Remote Sens., 8, 1–18, https://doi.org/10.3390/rs8090750, 2016.
Li, X., Jing, Y., Shen, H., and Zhang, L.: The recent developments in cloud removal approaches of MODIS snow cover product, Hydrol. Earth Syst. Sci., 23, 2401–2416, https://doi.org/10.5194/hess-23-2401-2019, 2019.
Li, Y., Chen, Y., and Li, Z.: Developing Daily Cloud-Free Snow Composite Products From MODIS and IMS for the Tienshan Mountains, Earth Sp. Sci., 6, 266–275, https://doi.org/10.1029/2018EA000460, 2019b.
Liang, T. G., Huang, X. D., Wu, C. X., Liu, X. Y., Li, W. L., Guo, Z. G., and Ren, J. Z.: An application of MODIS data to snow cover monitoring in a pastoral area: A case study in Northern Xinjiang, China, Remote Sens. Environ., 112, 1514–1526, https://doi.org/10.1016/j.rse.2007.06.001, 2008.
Lutz, A. F., Immerzeel, W. W., Kraaijenbrink, P. D. A., Shrestha, A. B., and Bierkens, M. F. P.: Climate change impacts on the upper indus hydrology: Sources, shifts and extremes, PLoS One, 11, 1–33, https://doi.org/10.1371/journal.pone.0165630, 2016.
McCabe, M. F., Rodell, M., Alsdorf, D. E., Miralles, D. G., Uijlenhoet, R., Wagner, W., Lucieer, A., Houborg, R., Verhoest, N. E. C., Franz, T. E., Shi, J., Gao, H., and Wood, E. F.: The future of Earth observation in hydrology, Hydrol. Earth Syst. Sci., 21, 3879–3914, https://doi.org/10.5194/hess-21-3879-2017, 2017.
Memon, A. A. A. A., Muhammad, S., Rahman, S., and Haq, M.: Flood monitoring and damage assessment using water indices: A case study of Pakistan flood-2012, Egypt. J. Remote Sens. Sp. Sci., 18, 99–106, https://doi.org/10.1016/j.ejrs.2015.03.003, 2015.
Mölg, N., Bolch, T., Rastner, P., Strozzi, T., and Paul, F.: A consistent glacier inventory for Karakoram and Pamir derived from Landsat data: distribution of debris cover and mapping challenges, Earth Syst. Sci. Data, 10, 1807–1827, https://doi.org/10.5194/essd-10-1807-2018, 2018.
Möller, M. and Möller, R.: Snow cover variability across glaciers in Nordenskiöldland (Svalbard) from point measurements in 2014–2016, Earth Syst. Sci. Data Discuss., https://doi.org/10.5194/essd-2018-158, 2019.
Muhammad, S. and Thapa, A.: Improved MODIS TERRA/AQUA composite Snow and glacier (RGI6.0) data for High Mountain Asia (2002–2018), PANGAEA, https://doi.org/10.1594/PANGAEA.901821, 2019.
Muhammad, S. and Tian, L.: Changes in the ablation zones of glaciers in the western Himalaya and the Karakoram between 1972 and 2015, Remote Sens. Environ., 187, 505–512, https://doi.org/10.1016/j.rse.2016.10.034, 2016.
Muhammad, S., Tian, L., and Khan, A.: Early twenty-first century glacier mass losses in the Indus Basin constrained by density assumptions, J. Hydrol., 574, 467–475, https://doi.org/10.1016/j.jhydrol.2019.04.057, 2019a.
Muhammad, S., Tian, L., and Nüsser, M.: No significant mass loss in the glaciers of Astore Basin (North-Western Himalaya), between 1999 and 2016, J. Glaciol., 65, 173–181, https://doi.org/10.1017/jog.2019.5, 2019b.
Painter, T. H., Berisford, D. F., Boardman, J. W., Bormann, K. J., Deems, J. S., Gehrke, F., Hedrick, A., Joyce, M., Laidlaw, R., Marks, D., Mattmann, C., McGurk, B., Ramirez, P., Richardson, M., Skiles, S. M. K., Seidel, F. C., and Winstral, A.: The Airborne Snow Observatory: Fusion of scanning lidar, imaging spectrometer, and physically-based modeling for mapping snow water equivalent and snow albedo, Remote Sens. Environ., 184, 139–152, https://doi.org/10.1016/j.rse.2016.06.018, 2016.
Parajka, J. and Blöschl, G.: Spatio-temporal combination of MODIS images – Potential for snow cover mapping, Water Resour. Res., 44, 1–13, https://doi.org/10.1029/2007WR006204, 2008.
Parajka, J., Pepe, M., Rampini, A., Rossi, S., and Blöschl, G.: A regional snow-line method for estimating snow cover from MODIS during cloud cover, J. Hydrol., 381, 203–212, https://doi.org/10.1016/j.jhydrol.2009.11.042, 2010.
Paudel, K. P. and Andersen, P.: Monitoring snow cover variability in an agropastoral area in the Trans Himalayan region of Nepal using MODIS data with improved cloud removal methodology, Remote Sens. Environ., 115, 1234–1246, https://doi.org/10.1016/j.rse.2011.01.006, 2011.
RGI Consortium: Randolph Glacier Inventory – A Dataset of Global Glacier Outlines: Version 6.0: Technical Report, Global Land Ice Measurements from Space, Colorado, USA. Digital Media., 2017.
Riggs, G. A., Hall, D. K., and Salomonson, V.: MODIS Snow Products Collection 6, available at: https://modis-snow-ice.gsfc.nasa.gov/uploads/C6_MODIS_Snow_User_Guide.pdf (last access: 10 May 2018), 2016.
Scherler, D., Wulf, H., and Gorelick, N.: Global Assessment of Supraglacial Debris-Cover Extents, Geophys. Res. Lett., 45, 11798–11805, https://doi.org/10.1029/2018GL080158, 2018.
She, J., Zhang, Y., Li, X., Feng, X., She, J., Zhang, Y., Li, X., and Feng, X.: Spatial and Temporal Characteristics of Snow Cover in the Tizinafu Watershed of the Western Kunlun Mountains, Remote Sens., 7, 3426–3445, https://doi.org/10.3390/rs70403426, 2015.
Smith, T., Bookhagen, B., and Rheinwalt, A.: Spatiotemporal patterns of High Mountain Asia's snowmelt season identified with an automated snowmelt detection algorithm, 1987–2016, The Cryosphere, 11, 2329–2343, https://doi.org/10.5194/tc-11-2329-2017, 2017.
Thapa, A: Filtering MOD10A2 and MYD10A2 collection 6 products to generate MOYDGL06* product [Muhammad and Thapa, 2019, https://doi.org/10.1594/PANGAEA.901821], https://doi.org/10.5281/zenodo.3610735, 2020.
Tian, L., Yao, T., Gao, Y., Thompson, L., Mosley-Thompson, E., Muhammad, S., Zong, J., Wang, C., Jin, S., and Li, Z.: Two glaciers collapse in western Tibet, J. Glaciol., 63, 194–197, https://doi.org/10.1017/jog.2016.122, 2017.
Tran, H., Nguyen, P., Ombadi, M., Hsu, K., Sorooshian, S., and Qing, X.: A cloud-free MODIS snow cover dataset for the contiguous United States from 2000 to 2017, Sci. Data, 6, 180300, https://doi.org/10.1038/sdata.2018.300, 2019.
Wang, X., Xie, H., and Liang, T.: Evaluation of MODIS snow cover and cloud mask and its application in Northern Xinjiang, China, Remote Sens. Environ., 112, 1497–1513, https://doi.org/10.1016/j.rse.2007.05.016, 2008.
Wunderle, S., Gross, T., and Hüsler, F.: Snow extent variability in Lesotho derived from MODIS data (2000–2014), Remote Sens., 8, 1–22, https://doi.org/10.3390/rs8060448, 2016.
Xie, H., Wang, X., and Liang, T.: Development and assessment of combined Terra and Aqua snow cover products in Colorado Plateau, USA and northern Xinjiang, China, J. Appl. Remote Sens., 3, 033559, https://doi.org/10.1117/1.3265996, 2009.
Yu, J., Zhang, G., Yao, T., Xie, H., Zhang, H., Ke, C., and Yao, R.: Developing daily cloud-free snow composite products from MODIS terra-aqua and IMS for the tibetan plateau, IEEE Trans. Geosci. Remote Sens., 54, 2171–2180, https://doi.org/10.1109/TGRS.2015.2496950, 2016.
Zeng, S., Parol, F., Riedi, J., Cornet, C., Thieuleux, F., Zeng, S., Parol, F., Riedi, J., Cornet, C., and Thieuleux, F.: Examination of POLDER/PARASOL and MODIS/Aqua Cloud Fractions and Properties Representativeness, J. Climate, 24, 4435–4450, https://doi.org/10.1175/2011JCLI3857.1, 2011.
Zhang, T., Wooster, M. J., and Xu, W.: Approaches for synergistically exploiting VIIRS I- and M-Band data in regional active fire detection and FRP assessment: A demonstration with respect to agricultural residue burning in Eastern China, Remote Sens. Environ., 198, 407–424, https://doi.org/10.1016/J.RSE.2017.06.028, 2017.
Zhang, Y., Yan, S., and Lu, Y.: Snow cover monitoring using MODIS data in liaoning province, Northeastern China, Remote Sens., 2, 777–793, https://doi.org/10.3390/rs2030777, 2010.