the Creative Commons Attribution 4.0 License.
the Creative Commons Attribution 4.0 License.
 | 03 Dec 2020
More dynamic than expected: an updated survey of surging glaciers in the Pamir
Tobias Bolch
Frank Paul
The investigation of surging glaciers using remote sensing has recently seen a strong increase as freely available satellite data and digital elevation models (DEMs) can provide detailed information about surges that often take place in remote and inaccessible regions. Apart from analysing individual surges, satellite information is increasingly used to collect valuable data on surging glaciers. Related inventories have recently been published for several regions in High Mountain Asia including the Karakoram or parts of the Pamir and western Kunlun Shan, but information for the entire Pamir is solely available from a historic database listing about 80 glaciers with confirmed surges. Here we present an updated inventory of confirmed glacier surges for the Pamir that considers results from earlier studies and is largely based on a systematic analysis of Landsat image time series (1988 to 2018), very high-resolution imagery (Corona, Hexagon, Bing Maps, Google Earth) and DEM differences. Actively surging glaciers (e.g. with advancing termini) were identified from animations and flicker images and the typical elevation change patterns (lowering in an upper reservoir zone and thickening further down in a receiving zone). In total, we identified 206 spatially distinct surges within 186 glacier bodies mostly clustered in the northern and western part of the Pamir. Where possible, minimum and maximum glacier extents were digitised, but often interacting tributaries made a clear separation challenging. Most surging glaciers (n=70) are found in the larger size classes (>10 km2), but two of them are very small (<0.5 km2). We also found several surges where the length of the glacier increased by more than 100 %. The created datasets are available at: https://doi.org/10.1594/PANGAEA.914150 (Goerlich et al., 2020).
- Article
(16447 KB) - Full-text XML
-
Supplement
(238 KB) - BibTeX
- EndNote


The investigation of surging glaciers using satellite data has recently received increased attention among scientists, in particular for the Karakoram mountain range but also other regions of the world (e.g. Berthier and Brun, 2019; Bhambri et al., 2017; Bolch et al., 2017; Falaschi et al., 2018; Minora et al., 2016; Paul, 2015, 2020; Quincey et al., 2015; Rankl and Braun, 2016; Round et al., 2017; Steiner et al., 2018). This has several reasons, for example (a) the free access to long (Landsat) and dense (TerraSAR-X/TanDEM-X, Sentinel-1/2) time series of high-resolution satellite data, (b) the limited understanding of why some glaciers in this region are surging while others are not, (c) a large number of ongoing surges at any point in time, (d) the large variations in surge behaviour in a small region, (e) the long history of still occurring surge-related hazards (mostly due to damming of a river and related outburst of lakes), and (f) the very difficult field access. Thereby, most studies document the variations in glacier extent/length changes, flow velocities and elevation/mass changes in the course of a surge or surge-related hazards. These studies have revealed unprecedented details about surge dynamics and variations that have already helped in improving our understanding of related surge mechanisms.
In contrast, the surging glaciers in the Pamir mountain ranges to the north of the Karakoram received less attention, but some studies have recently been published (e.g. Lv et al., 2019; Osipova, 2015; Wendt et al., 2017; Holzer et al., 2016). This might be due to the fact that several surges during the Soviet era have already been described in detail (e.g. the surges of Medvezhiy and Geographical Society glaciers are well documented; see Dolgushin and Osipova, 1971, 1975; Kotlyakov et al., 2003; Osipova, 2015), and a detailed inventory describing a high number (>800) of surge-type glaciers based on satellite data and aerial images was published (Osipova et al., 1998). However, this and many of the publications are in Russian and are therefore little known internationally.
When speaking about surging glaciers, we first have to differentiate between surge-type glaciers and other glaciers. This is important when interpreting glacier changes in the context of climate change, e.g. their length or mass changes over a time period when surges have occurred (Bolch et al., 2017; Brun et al., 2017; Gardelle et al., 2013). Secondly, it is also important to distinguish surge-type from surging glaciers. The former have surged at some point in the past and show indirect evidence like looped or distorted moraines or the post-surge down-wasting features of a former surge, whereas the latter surged actively within the observation period. Looped or otherwise distorted moraines occur due to former surges that pushed the lobate-shaped boundaries of tributaries down glacier, indicating different flow speeds among major, moraine-separated glacier branches (Herreid and Truffer, 2016; Meier and Post, 1969). The typical post-surge down-wasting features consist of separated lower glacier parts and/or the jagged boundary of a stagnant and rapidly lowering glacier tongue, among others (Paul, 2020). We here only investigate glaciers that have actively surged during the observation period. The globally most complete compilation of surge-type glaciers by Sevestre and Benn (2015) is a valuable starting point, but it is based on literature sources up to the year 2013 only. In the meantime, numerous other surge-type glaciers have been identified across High Mountain Asia (HMA) from the analysis of multi-temporal satellite imagery, e.g. in the Karakoram (Bhambri et al., 2017), Kunlun Shan (Yasuda and Furuya, 2015), central Tibet (Zhang et al., 2018), eastern Pamir (Lv et al., 2019) and Tian Shan (Mukherjee et al., 2017), but an update of confirmed surges for the entire Pamir Mountains is yet missing. With this study, we aim to identify them and provide detailed information (e.g. timing and typology) about confirmed glacier surges in the Pamir Mountains.
Surge-type glaciers in the Pamir are included in the inventory by Osipova et al. (1998) and Sevestre and Benn (2015). There are thus important differences in our approach compared to the methodology used for the “catalogue” by Osipova et al. (1998), implying that both are not directly comparable: (i) our satellite image time series (Landsat) has a lower spatial resolution (30 m) than the KFA1000 data (3–5 m) used by Osipova et al. (1998) (cf. Dowdeswell et al., 1993, 1995), (ii) we cover a different period (1988–2018) than Osipova (1998), (iii) we have used different indicators for surge identification (e.g. animations, digital elevation model, DEM, difference patterns), (iv) we have assigned only one surge class instead of six, and (v) our glacier entities have different boundaries as we used the most recent Pamir glacier inventory by Mölg et al. (2018) as a base for the analysis (here named GI-1).
The information from Osipova et al. (1998) is also available in the Randolph Glacier Inventory (RGI) version 6 (RGI Consortium, 2017) using the simplified classification scheme developed by Sevestre and Benn (2015). We have used the RGI dataset and revisited existing literature, e.g. the study by Lv et al. (2019), as a starting point for our inventory of glacier surges. Our analysis is primarily based on animated multi-temporal (1988–2018) time series of Landsat data but also on elevation difference maps showing the typical mass transfer pattern of glacier surges. For some less clear cases, we also analysed very high-resolution images from the Corona and Hexagon missions and the images in Google Earth and Bing Maps for confirmation.
For this study, we revisited the GI-1 inventory by adding ice divides for glacier units that surged but were so far still connected with other glaciers in GI-1, resulting in a new inventory GI-2. In a second step, three inventory subsets are created from GI-2 that provide (a) the selection of surging glaciers only (GI-3) and (b) minimum (GI-3min) and (c) maximum (GI-3max) extents of all surging glaciers. In the following, the number in brackets after a glacier's name refers to its ID in the GI-3min inventory. We also present a rough classification of the different surge types, the timing of surges during the observation period (1988–2018), a comparison of geomorphometric characteristics (other glaciers in GI-2 vs. GI-3) and a description of geometric changes due to a surge.
The Pamir is one of highest mountain ranges within HMA and in the world extending from about 36∘35′ to 39∘35′ N to 70∘35′ to 75∘35′ E (Fig. 1). The northern part belongs to the Osh region of Kyrgyzstan, the eastern parts to the Xinjiang Uighur Autonomous Region of China, the most southern regions to Badakhshan in north-eastern Afghanistan and the main part to Gorno-Badakhshan in Tajikistan. The highest peak (Mt. Kongur) reaches up to 7649 m a.s.l. (above sea level) and is enthroned over the Kongur Shan in the eastern part of the Pamir. Here and in the following, we use names from transliterated Russian topographic maps at a 1:500 000 scale (see Table S1 in the Supplement).
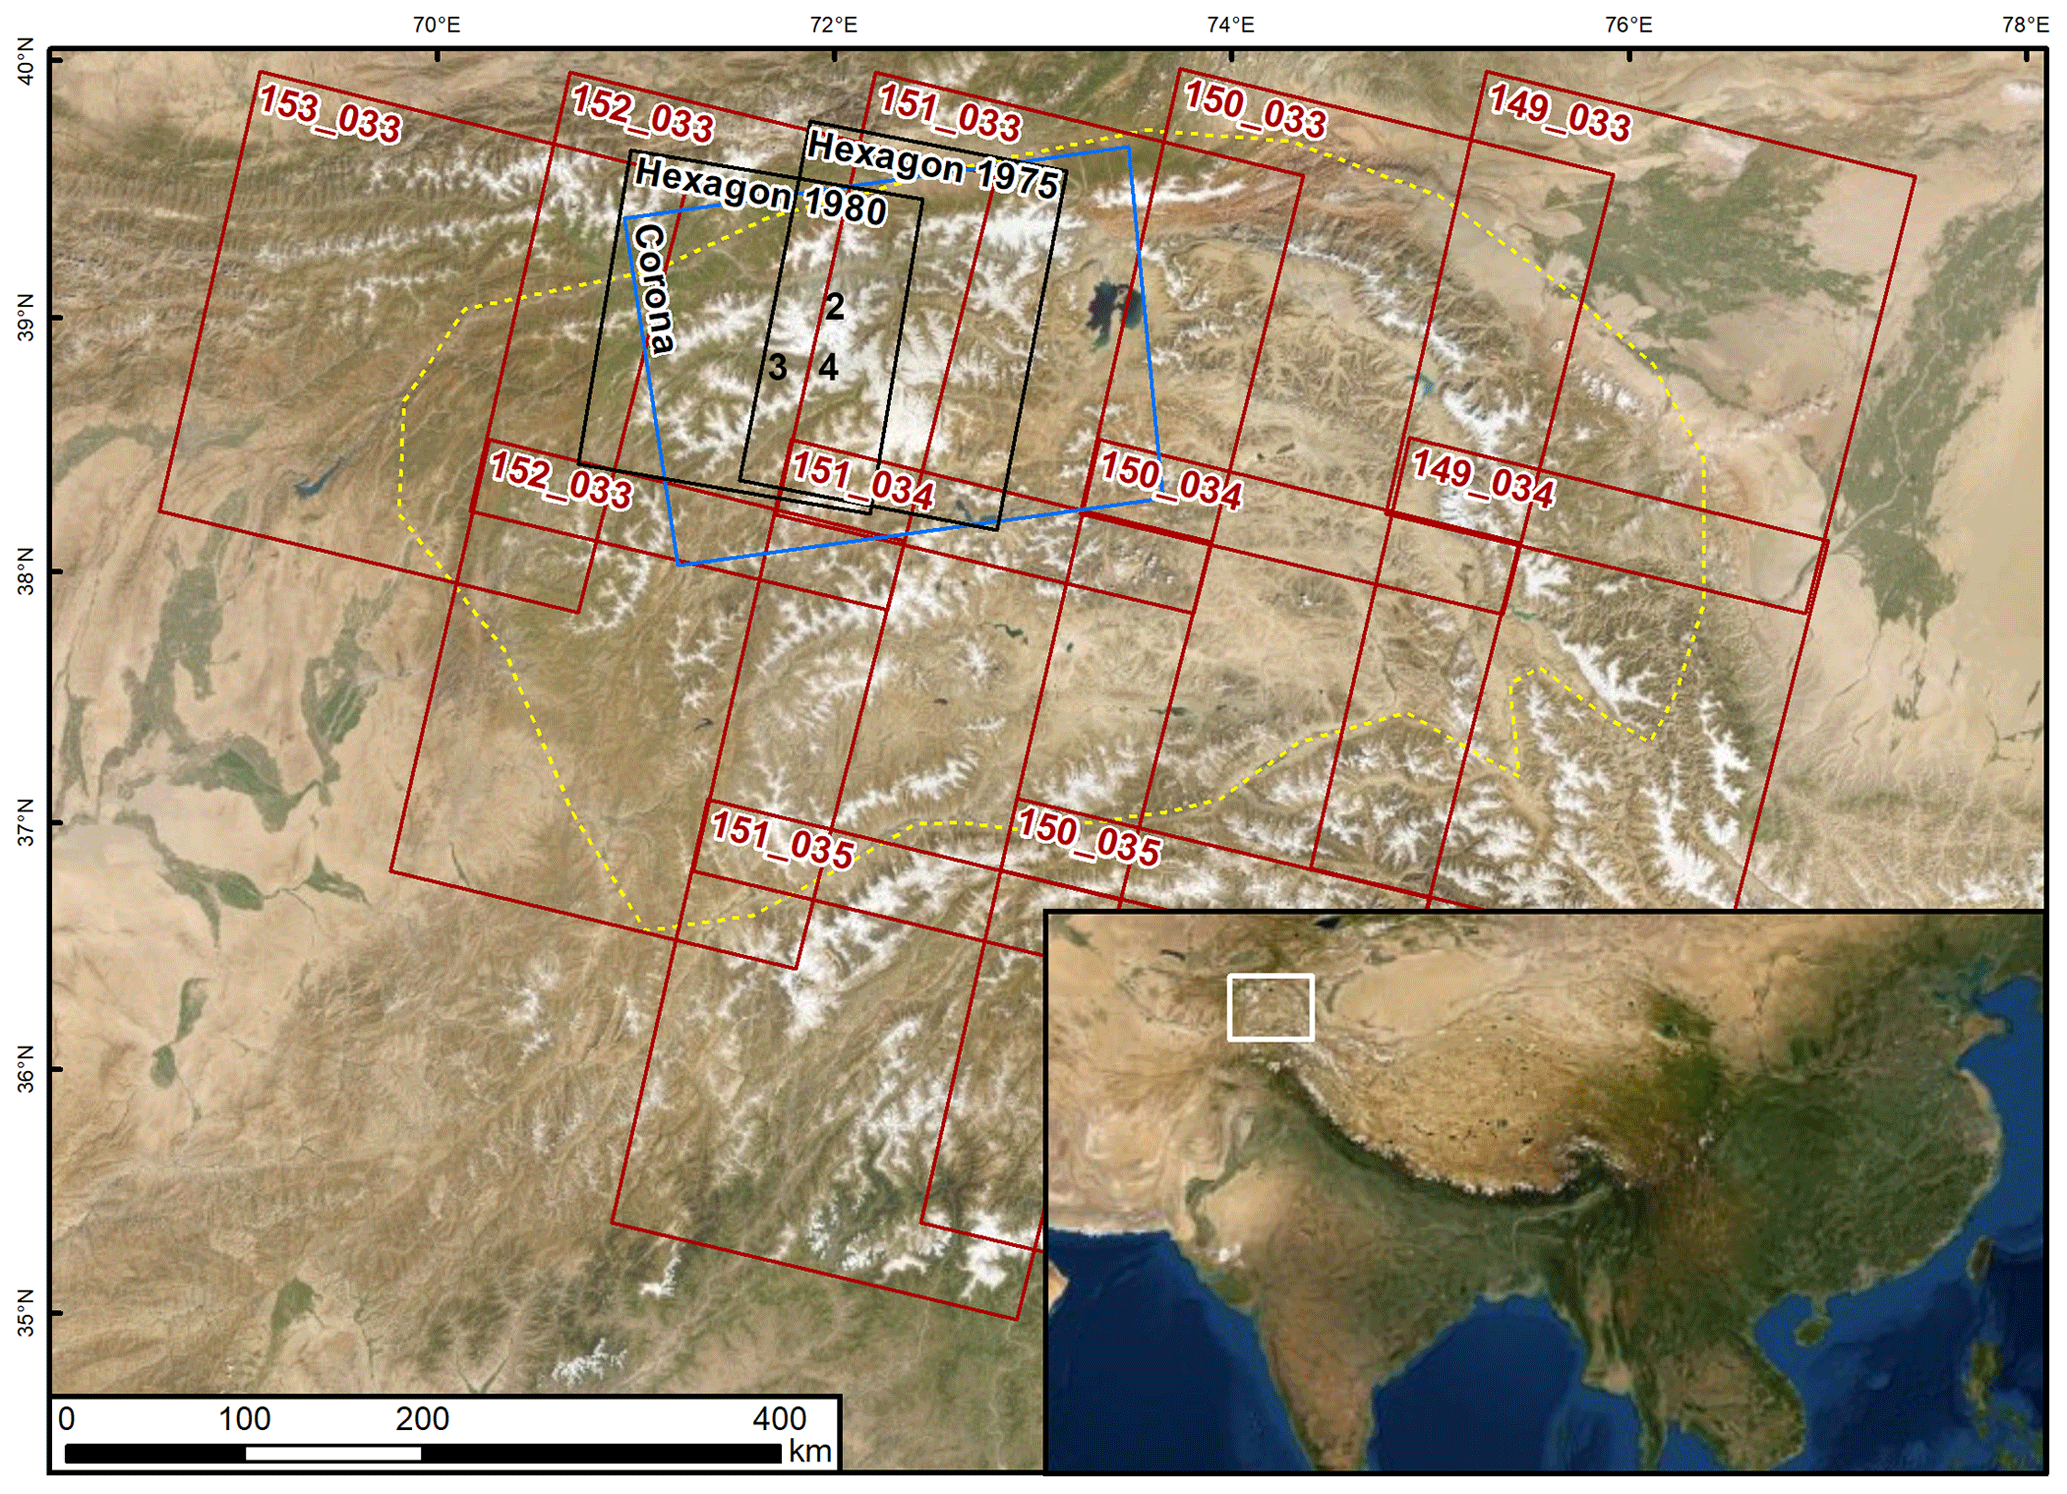
Figure 1Location of the study region (white square in the inset) and footprints of the Corona (blue), Hexagon (black) and Landsat (red) scenes used in this study. The dashed yellow line marks the perimeter of the study region. The location of the subregions displayed in Figs. 2, 3 and 4 are marked with their respective numbers. Image sources: screenshots from © Google Earth.
Typical glaciers in the Pamir are long and dendritic or multi-basin valley glaciers, but other types such as mountain glaciers and cirques exist as well. Due to the steep and ice-free surrounding rock walls, most glaciers are at least partly debris-covered, which often simplifies the identification of typical surge marks (e.g. looped moraines) from space (e.g. Kotlyakov et al., 2008). Most glaciers are concentrated in the central part around Ismoil Somoni Peak (7495 m a.s.l.), including Fedchenko Glacier, which is, with a length of >70 km, the longest valley glacier in the world outside the polar regions (Machguth and Huss, 2014). Additionally, the region is home to abundant rock glaciers that are not always clearly separable from debris-covered glaciers and other ice-debris landforms (Mölg et al., 2018).
The glaciers in the western and central part of the Pamir (Tadjik, Kyrgyz and Afghan regions) are of the winter accumulation type where most precipitation (∼90 %) falls between December and May (Maussion et al., 2014) with annual amounts of up to 1285 mm a−1 at Fedchenko weather station at 4169 m a.s.l. (Finaev et al., 2016). Conversely, the glaciers in the eastern part are mainly (50 to 60 %) fed by precipitation in the summer months between June and August, which can be seen as an effect of the monsoon (Maussion et al., 2014). The total annual precipitation is very low in some regions, reaching only ∼70 mm a−1 at Murgab (3576 m a.s.l.) and Taxkurgan (3090 m a.s.l.) weather stations, both located in valleys (Finaev et al., 2016). Hence, the glaciers in the western and central part are situated in a somewhat warmer and more humid climate, whereas the eastern ranges are dry and cold. Accordingly, glacier mean elevations of the former can be found at lower altitudes (∼4740 m a.s.l.) than in the eastern regions (∼5050 m a.s.l.) according to the dataset presented by Mölg et al. (2018).
The likely best-investigated glacier in the region is Fedchenko (Lambrecht et al., 2014, 2018), which is so far not considered as surge-type. Of the glaciers with confirmed surges, Medvezhiy Glacier (29, ObjectID in the GI3-min inventory) is likely the best investigated (see Kotlyakov et al., 2008). This latter study also reported details about surges of several other glaciers in the region partly back to 1959.
3.1 Satellite data
3.1.1 Landsat
For the detection of glacier surges and determination of surge start, end and possibly their full surge cycle (e.g. from the starting year of an active phase to the start of the next active phase), we used freely available Landsat imagery (Level 1T) from earthexplorer.usgs.gov, including Landsat 5 TM (Thematic Mapper), Landsat 7 ETM+ (Enhanced Thematic Mapper plus) and Landsat 8 OLI (Operational Land Imager) sensors. Additionally, we used some very good scenes (no snow outside glaciers) from Landsat MSS (Multispectral Scanner) from the 1970s and 1980s. The three sensors, TM, ETM+ and OLI, acquire data with a horizontal resolution of 30 m for the visible, near-infrared (NIR) and short-wave infrared (SWIR) bands at a repeat rate of 16 d. Key characteristics of the datasets are shown in Table 1; the full list of scenes used for this study is presented in Table S2 in the Supplement.
Table 1Main characteristics of the satellite scenes used (see Table S1 for scene list).

In general, cloud-free scenes from the end of the summer (July to October) are used from all sensors, but for some regions, also earlier acquisitions are considered to have images available for as many years as possible. With a focus on the changes near the glacier terminus, the remaining seasonal snow at higher elevations in these images was unproblematic. Unfortunately, it was not possible to find suitable scenes for each year in most regions so that the determination of the onset or end of a surge has at least a ±1 year uncertainty. Priority was given to Landsat 5 TM scenes to limit using Landsat 7 ETM+ scenes after 2002 which is when the Scan Line Corrector (SLC) stopped working (resulting in so-called SLC-off scenes). For the animations, we downloaded the standard colour-balanced and orthorectified image quicklooks from earthexplorer.usgs.gov that are provided in false-colours (glacier ice and snow is depicted in cyan) and at the original resolution. The jpg compression of these images results locally in blurred details, but they had only a small impact on surge identification.
3.1.2 Corona and Hexagon
The Corona Keyhole (KH) 4B scenes from August 1968 (Table S1) cover the central and northern Pamir (see Fig. 1) and were also downloaded from earthexplorer.usgs.gov. The Corona images are panchromatic, recorded in stereo mode and have a ground resolution of up to 1.8 m (Galiatsatos, 2009). We processed 11 scene pairs to generate a DEM and corresponding orthophotos at 5 m resolution following Goerlich et al. (2017). Due to the great effort of processing the scenes, the orthoimages only cover the region with the most surging glaciers. The orthoimages revealed details in surface morphology that are typical for surging glaciers but barely visible for the largest glaciers at the 30 or 15 m resolution of Landsat images. We also used Hexagon KH-9 scenes from July 1975 and June 1980 to generate orthoimages following Pieczonka et al. (2013). The scenes depict the regions west of lake Karakul at a resolution of up to 6 m.
3.1.3 Google Earth and Bing Maps
The very high-resolution (a few metres or better) satellite images available in Google Earth (GE) have been widely used for numerous geoscientific applications (Liang et al., 2018). We used them here, together with the satellite images available on Bing Maps, to confirm identified surging glaciers in the Landsat period, i.e. for visual checks only. Sometimes the available time series in GE also allowed a proper identification of glacier surges when the quiescent and/or active phases are captured (see examples in Lv et al., 2019). Interestingly, the images used in Bing Maps were often complementary to GE, i.e. providing excellent coverage when nothing useful was available in GE and vice versa.
In Fig. 2, we provide a visual comparison of image sources displaying three surging glaciers in the central Pamir to illustrate the visibility of details. We include examples from Corona, Hexagon, Landsat OLI and GeoEye (from Bing Maps). The high-resolution images from Corona and Bing Maps clearly show the highly crevassed surfaces (mainly for the two larger glaciers) that are not visible in the Landsat image. In the Landsat image, the glacier boundary and debris-covered parts can be identified, but it is almost impossible to reveal the terminus of Walter 731 (19) and Soldatov (20) glaciers in the static image. This is different when using animations that reveal glacier termini clearly when they change position (Paul, 2015).

Figure 2Comparison of satellite images for the same subregion (see Fig. 1 for location) showing the following glaciers: F – Fortambek (18), W – Walter 731 (19) and S – Soldatov (20). The images are acquired by (a) Corona in 1968, (b) Hexagon in 1975, (c) Landsat in 2017, and (d) Bing Maps (date unknown). Image sources: (a–c) earthexplorer.usgs.gov and (d) screenshot from http://bing.com (last access: 20 March 2020) © 2020 DigitalGlobe.
3.2 Digital elevation models (DEMs)
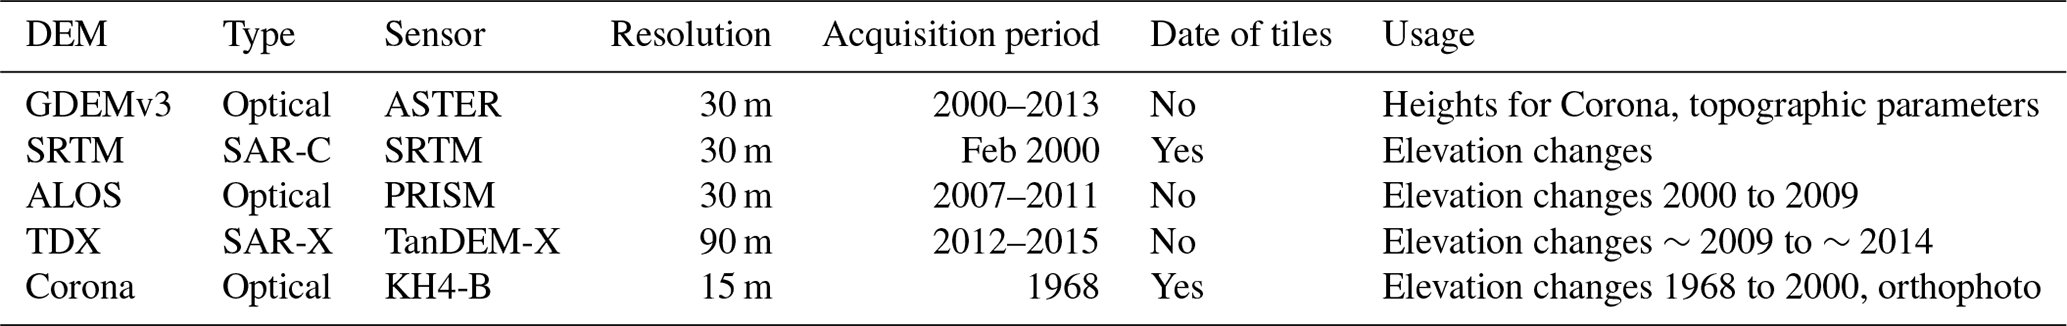
Several DEMs are freely available for the study region. This includes the Shuttle Radar Topography Mission (SRTM) DEM (Rabus et al., 2003), the Advanced Spaceborne Thermal Emission and Reflection Radiometer (ASTER) GDEMv3 (NASA, 2018), the ALOS PRISM AW3D30 DEM (Takaku et al., 2014), the High Mountain Asia (HMA) DEM (Shean, 2017) and the DEM from the TanDEM-X mission (TDX) provided by DLR (German Aerospace Centre) (Wessel, 2016). They have different characteristics (sensor types, spatial resolution, artefacts, data voids, acquisition dates) and – apart from the HMA DEM – are used here for several purposes such as the calculation of topographic characteristics and surface elevation changes (Table 2). A direct comparison of the DEMs using hillshades and DEM differences revealed that only the GDEMv3 and the AW3D30 DEM are free of data voids but that the AW3D30 has some artefacts over glacier surfaces and elevations that are too high. We thus used the GDEMv3 to determine topographic characteristics for all glaciers.
Table 2Selected characteristics of available DEMs and their usage in this study.
Besides the orthoimages, we created DEMs from the 1968 Corona stereo pairs (cf. Goerlich et al., 2017) and used DEMs from 1975 Hexagon data (cf. Pieczonka et al., 2013). The AW3D30 DEM served as a height reference (ground control points, disparity predictions) for the Corona DEM processing and the SRTM DEM for Hexagon. The main difference of the final DEMs is the coverage of which Corona covers only a small area () per stereo image pair compared to Hexagon (). This results in a far larger effort to generate DEMs and orthophotos from Corona for a larger region.
We have used the temporally better constrained DEMs from Corona (1968), SRTM (2000), AW3D30 (2006–2011) and TDX (2011–2014) to determine elevation changes over the periods of 1968 to 2000, 2000 to ∼2009 and ∼2009 to ∼2012/14. Elevation differences were interpreted in a qualitative sense only as the typical pattern of elevation changes for surging glaciers (strong elevation gain in the lower region and loss in the upper region during the active phase of a surge, and vice versa for the quiescent phase) can be clearly identified in most cases; i.e. changes are often much higher (more than 100 m) than the combined uncertainties of the two DEMs (e.g. Gardelle et al., 2013).
3.3 Glacier outline datasets
We used the Karakoram and Pamir glacier inventory (GI-1) created by Mölg et al. (2018) as a basis for glacier identification and extent modification. This inventory provides a consistent dataset of manually corrected glacier outlines based on Landsat scenes acquired between 1998 and 2002 for the entire Pamir, including the ranges of King Tau, Ulugarttag and Muztagh in the Chinese part (see Fig. 1). As the inventory is a temporal snap shot and surge-type glaciers are in various stages of their surge cycle, they can be connected to a larger main glacier and thus not be analysed separately. To overcome this restriction, we have separated all part-time tributaries exhibiting their own dynamics from the glaciers they connect with and added the required new ice divides in the accumulation regions. This revised inventory (GI-2) is used as the base for all subsequent geomorphometric calculations. The separation follows the natural flow and extent of the larger glacier and required several iterations of adjustments as the surge characteristics were often not clear from the beginning. After all surges had been identified, a sub-sample of GI-2 was created that only includes the glaciers that surged (inventory GI-3). The GI-3 sub-sample served as a base to digitise minimum and maximum glacier extents for all glaciers exhibiting a visible change in terminus position. These datasets are saved in two additional inventories (GI-3min and GI-3max, respectively).
4.1 Surge identification
Glacier surges can occur in very different forms with a likely continuous transition between unstable flow and regular glacier advances. Hence, a clear identification of surge-type glaciers is not trivial even in their active phase, and a wide range of identification criteria have been suggested to distinguish them from all other glaciers (e.g. Sevestre et al., 2015; Bhambri et al., 2017; Mukherjee et al., 2017). In this study, we focus on glaciers that had an active surge phase during the investigated period 1988–2018; i.e. indirect evidence alone such as distorted or looped moraines is not considered. Consequently, our sample is smaller than the one presented in the catalogue of Osipova et al. (1998), who listed 845 surge-type glaciers for the Pamir (i.e. 35 % of the global sample of Sevestre and Benn, 2015) in six distinct classes. Their inventory is also digitally available in the RGI using the simplified classification scheme of Sevestre and Benn (2015) with the following classes (their Table 4): confirmed (category 3), probable (2) and possible (1). With our focus on observed surges (with a few exceptions), our sample would be in the confirmed type class for which Osipova et al. (1998) list 61 and Sevestre and Benn (2015) 90 glaciers.
To identify surging glaciers, we started with the confirmed samples listed by Osipova et al. (1998, 2010), Kotlyakov et al. (2008), and Lv et al. (2019). These studies included all mountain ranges where we searched for surging glaciers except the Rushanskiy and Muztagh ranges. Our identification consists of four steps.
- i.
At first, we analysed animations from the Landsat quicklooks to validate the findings of the four studies. Each frame set was animated with slightly different samples (varying selection of animated scenes within one frame set) to facilitate visibility of glacier dynamics in each region similar to Paul (2015). The qualitative analysis tracked surface feature displacements and was applied to the entire study region. Collectively, this step revealed 139 surging glaciers during the period 1988–2018 (including glaciers that have just started surging).
- ii.
In the next step, we analysed the elevation change patterns of the various DEM difference maps in a qualitative way (Mukherjee et al., 2017). Glaciers showing the typical opposing pattern of surface elevation change along the glacier flow line (lowering and thickening) were digitally marked and added to the sample, yielding 35 further glaciers from the 1968 to 2000 and 2000 to c. 2009 elevation difference maps. For this analysis, it does not matter in which region of a glacier the pattern occurs (e.g. internal surges may appear higher up and do not reach the terminus). Two examples of the related DEM difference maps are displayed in Fig. 3, revealing for some glaciers the typical surge pattern. This method helped in detecting internal surges with limited or no changes in the terminus position and/or where crevasses or shear margins are difficult to detect.
- iii.
In this step, we analysed individual image pairs in detail using flicker images, i.e. going back and forth between two images only (Kääb et al., 2003). For a clear before/after distinction, this analysis was restricted to the best scenes available for a specific region (e.g. without clouds, seasonal snow or deep shadows). Here we also used the contrast-enhanced false colour infrared images from the MSS scenes, several 15 m panchromatic images of ETM+ and OLI, and the declassified orthoimages. An additional 27 surging glaciers could be identified in this way.
- iv.
In the final step, we checked the identified glaciers with the partially very high-resolution images available in GE and Bing Maps to also analyse morphological characteristics of the glacier surfaces in detail, their shape and also possible changes in extent (Lv et al., 2019). Despite the variability in acquisition years, this allowed us to remove a few glaciers (7) from the sample (in most cases the “surges” were likely just advances) and also to add 12 new ones. We classified a glacier as advancing when the glacier does not show any of the typical surface features, such as a heavily crevassed surface, shear margins or collapsing/down-wasting patterns at the tongue, and when there is a comparably small and/or slow advance. At this stage, we started introducing indirect evidence (surface features) to the classification and thus checked back if the (mostly small) glaciers had really surged using animations. In some cases it was necessary to interpret results from steps (i) to (iii) collectively for a reasonable result.
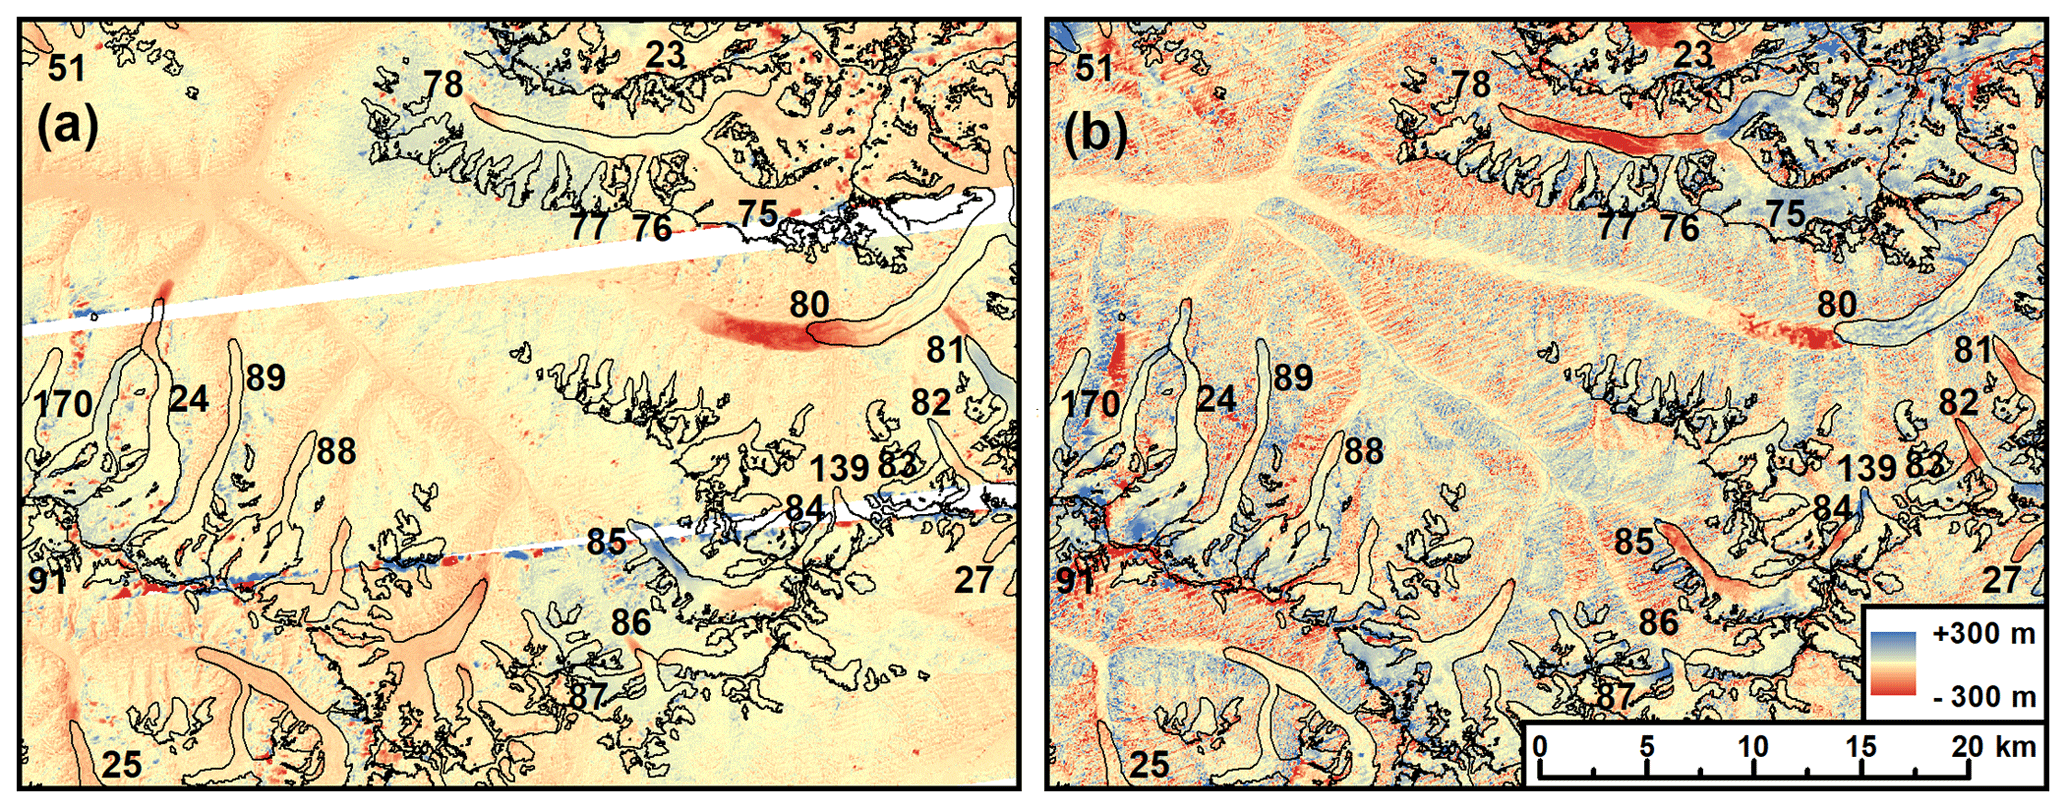
Figure 3Two examples of colour-coded DEM difference images used to identify surging glaciers (marked with their ObjectID). The glacier outlines depict the glacier state in ∼2000 (GI-2). (a) SRTM-Corona (2000–1968) and (b) AW3D30-SRTM (∼2010–2000).
Based on the created inventory subset with surging glaciers only (GI-3), we digitised the minimum (GI-3min) and maximum (GI-3max) extents of all glaciers based on the satellite images described in Sect. 3.1. For glaciers with more than one surge, the respectively largest and smallest extents were digitised (Fig. 4). Whereas maximum extents are in most cases well identifiable, outlines for GI-3min can have larger uncertainties due to the difficulties in clearly identifying the new terminus among the often debris-covered and down-wasted ice from the previous surge. Ideally, the minimum extent is identified once the next surge has started, but for many glaciers, this did not happen during the observation period.
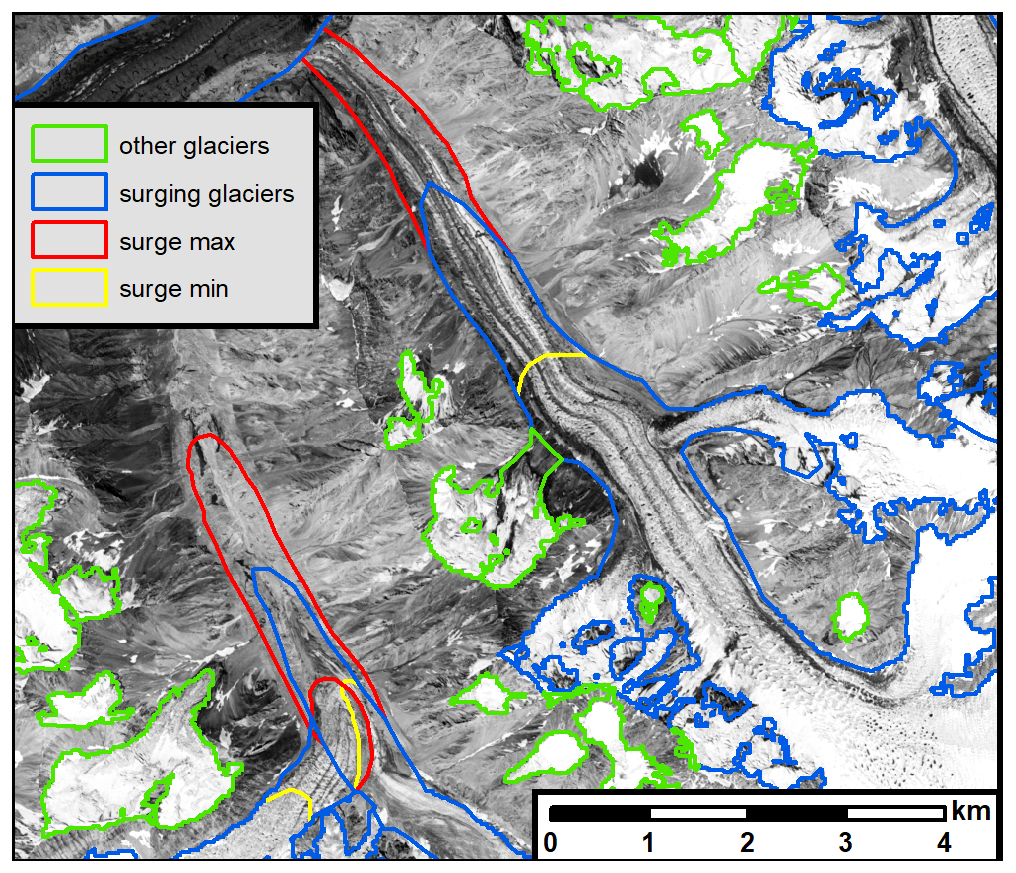
Figure 4Comparison of glacier outlines from the original inventory GI-2 (blue/green) and the additional GI-3min/GI-3max (yellow/red) showing the minimum and maximum extents of two surging glaciers. Image acquisition date and source: 1968, https://earthexplorer.usgs.gov (last access: 17 October 2019).
4.2 Surge characteristics and classification
There are a wide range of possibilities to characterise surges as they have a high variability of appearance and dynamics (e.g. Bhambri et al., 2017). For the GI-3min inventory, we have determined a series of key surge characteristics in the attribute table (e.g. surge start/end/duration and distance) and a simplified classification according to a pre-defined set of criteria for statistical analysis and comparison with other regions. It has to be noted that a precise start/end year was often difficult to determine either due to missing satellite data or also when surge initiation is related to a mass wave coming down from higher elevations (taking a few years) or when remaining dead ice from a previous surge was reactivated. We here defined the start of a surge as the year when an advance of the terminus or a mass wave higher up the glacier (as not all surges show a terminus advance) is detectable. The end of the active phase (maximum extent) is reached when all surge dynamics settle and the quiescent phase begins. The surge duration is calculated by subtracting the start year from the end year of the surge. The latter was easier to determine than minimum extents in most cases.
To illustrate a few of the possible surge types and interactions, Fig. 5 displays a sketch map of three glaciers that are all surging at some stage. Starting with a surge of the permanently connected tributary (2) in Fig. 5a, this surge is at its maximum extent in Fig. 5b, and the ice from the surge is already slightly moved downstream by the flow of the main glacier (1). In addition, glacier (3) started surging in the meantime, connects to the main glacier in Fig. 5b and enters glacier (1) in Fig. 5c where it also reaches its maximum extent. Some time later (Fig. 5d), the main glacier (1) is also in full surge mode and transports the surge marks of both tributary surges downstream, stretching and possibly deforming them. This illustrates the variety of surge interactions (by far not all) and the difficulty to define the maximum extents of tributary glaciers. Their surge marks are moved downstream by the main glacier during or near the end of their own surge due to their normal flow or a surge of the main glacier. Accordingly, there is also some uncertainty in the timing of the surge end for glaciers (2) and (3). In this case, the main glacier body (1) would have listed two surges in the attribute table of GI-3min and would have been selected to receive the surging classification code.
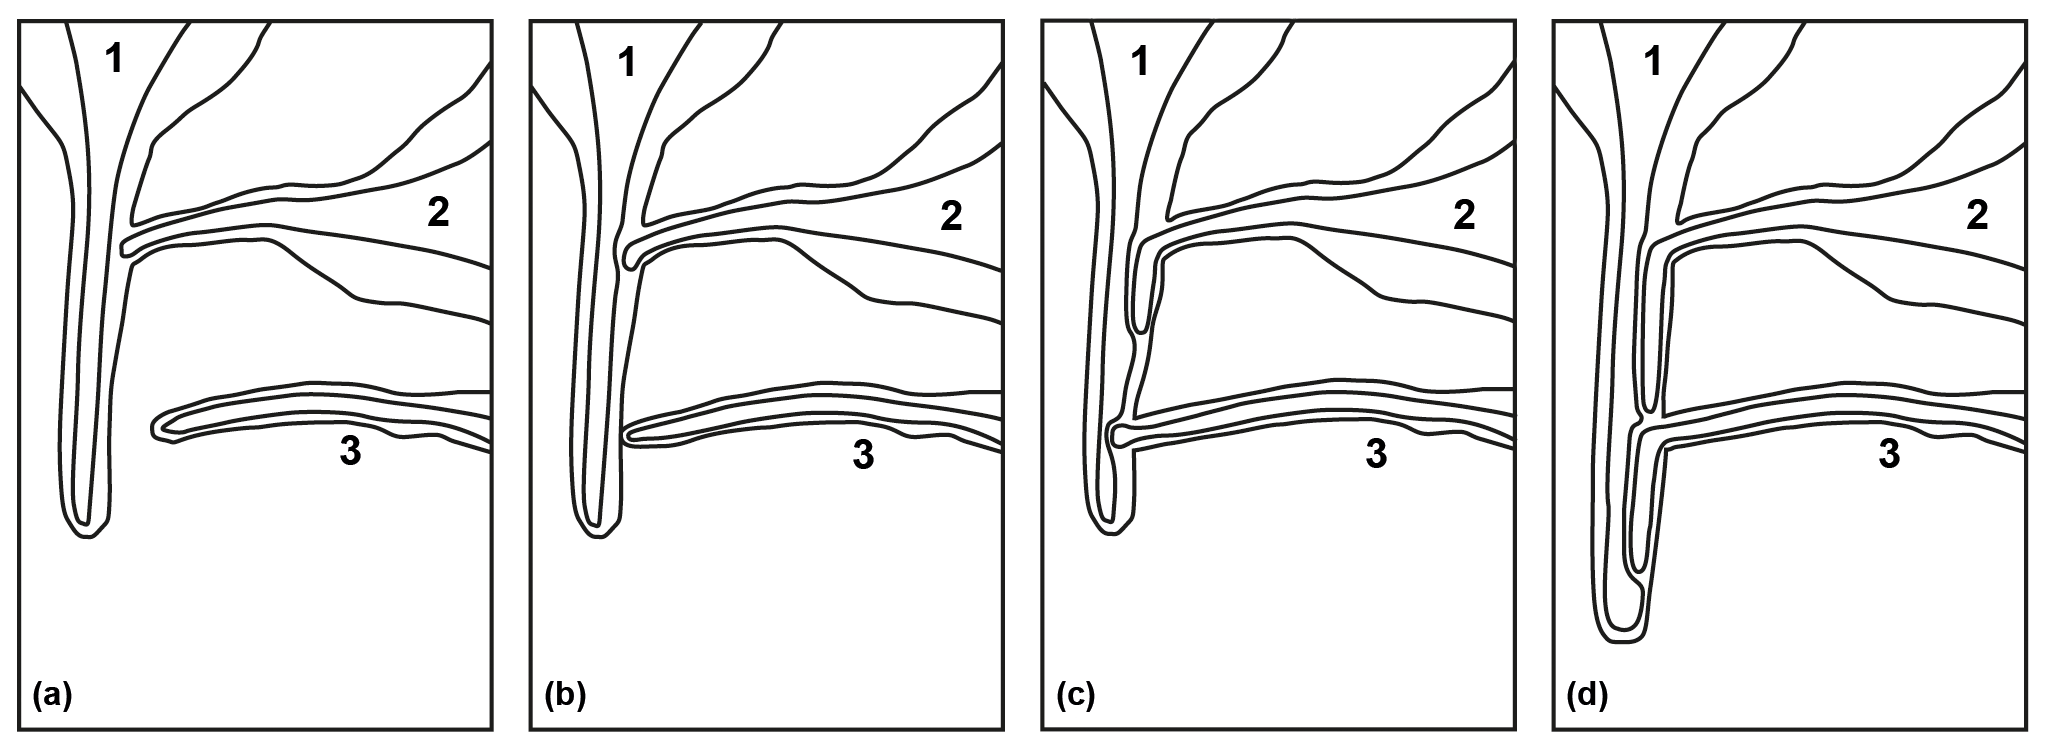
Figure 5Sketch map of selected possible interactions among surging glaciers of different types. (a) At the beginning, glacier 2 in full surge mode, (b) surge maximum of glacier 2 and surge start of glacier 3, (c) surge maximum of glacier 3, and (d) surge of glacier 1. See text for description.
For the classification scheme, we used the following criteria and values for each glacier:
- A.
surging: no = 0, yes = 1; if yes, then proceed as follows:
- B.
glacier tongue: free end = 1, connects to another glacier = 2, tributary = 3;
- C.
type of surge: advancing = 1, internal = 2, combined = 3;
- D.
active phase duration: 1–3 years = 1, 4–10 years = 2, > 10 years = 3;
- E.
terminus advance: none = 0, short (<1 km) = 1, medium (1–2.5 km) = 2, long (>2.5 km) = 3.
In (C), the “advancing” type defines a glacier that has a visible terminus change, and “internal” has no advance but a visible mass wave either in the Landsat images or in the DEM difference images. The “combined” type describes glaciers that show a mass wave within the glacier reaching the terminus and pushing it further down valley.
Hence, the entry in the attribute table of GI-2 is either 0 or 1 and stored in a separate “surge” column. The resulting code from our classification in GI-3min is then, for example, 2123. This means that the glacier is connected to another glacier during its surge, that it has an advancing tongue, and that it surged over a period of 4–10 years over a long distance. In the case the glacier already surged in 1988 or was still surging in 2018, these two years were used as the start or end date. Such dates indicate that the real surge duration is likely longer than the one given in the table.
4.3 Topographic and other information
For all glaciers in GI-2, we calculated the following attributes according to Paul et al. (2002, 2009): centre point latitude and longitude, area (in km2), minimum, maximum, mean, and median elevation, mean slope and aspect, and aspect sector. Mean values are calculated as the arithmetic average of all DEM cells covered by the respective glacier. All attributes are also transferred to GI-3 and additionally calculated for GI-3min and GI-3max. The attributes of GI-2 and GI-3 depict the glacier state around the year 2000. For GI-3min and GI-3max, the attribute date varies between 1988 and 2018 due to the minimum and maximum extents of the glaciers. All elevation-dependent attributes are based on ASTER GDEMv3 elevations.
5.1 Distribution and topographic characteristics of surge and other glaciers
From the ∼13 500 glaciers in the study region, 186 have been identified as surging glaciers of which 206 spatially distinct surges have been identified between 1988 and 2018. Their occurrence is clustered in the northern (central and western Pamir Alai), western (Fedchenko and Petr Alervogo East) and eastern ranges (Muztagh and Ulugarttag) (Fig. 6). This pattern shows a large gap of glacier surges around Lake Karakul and to the south of the study region with few exceptions. Overall, these latter regions are dominated by comparably smaller glaciers and drier climate, indicating that there might be a size and climatic threshold for surge activity, as suggested by Sevestre and Benn (2015).
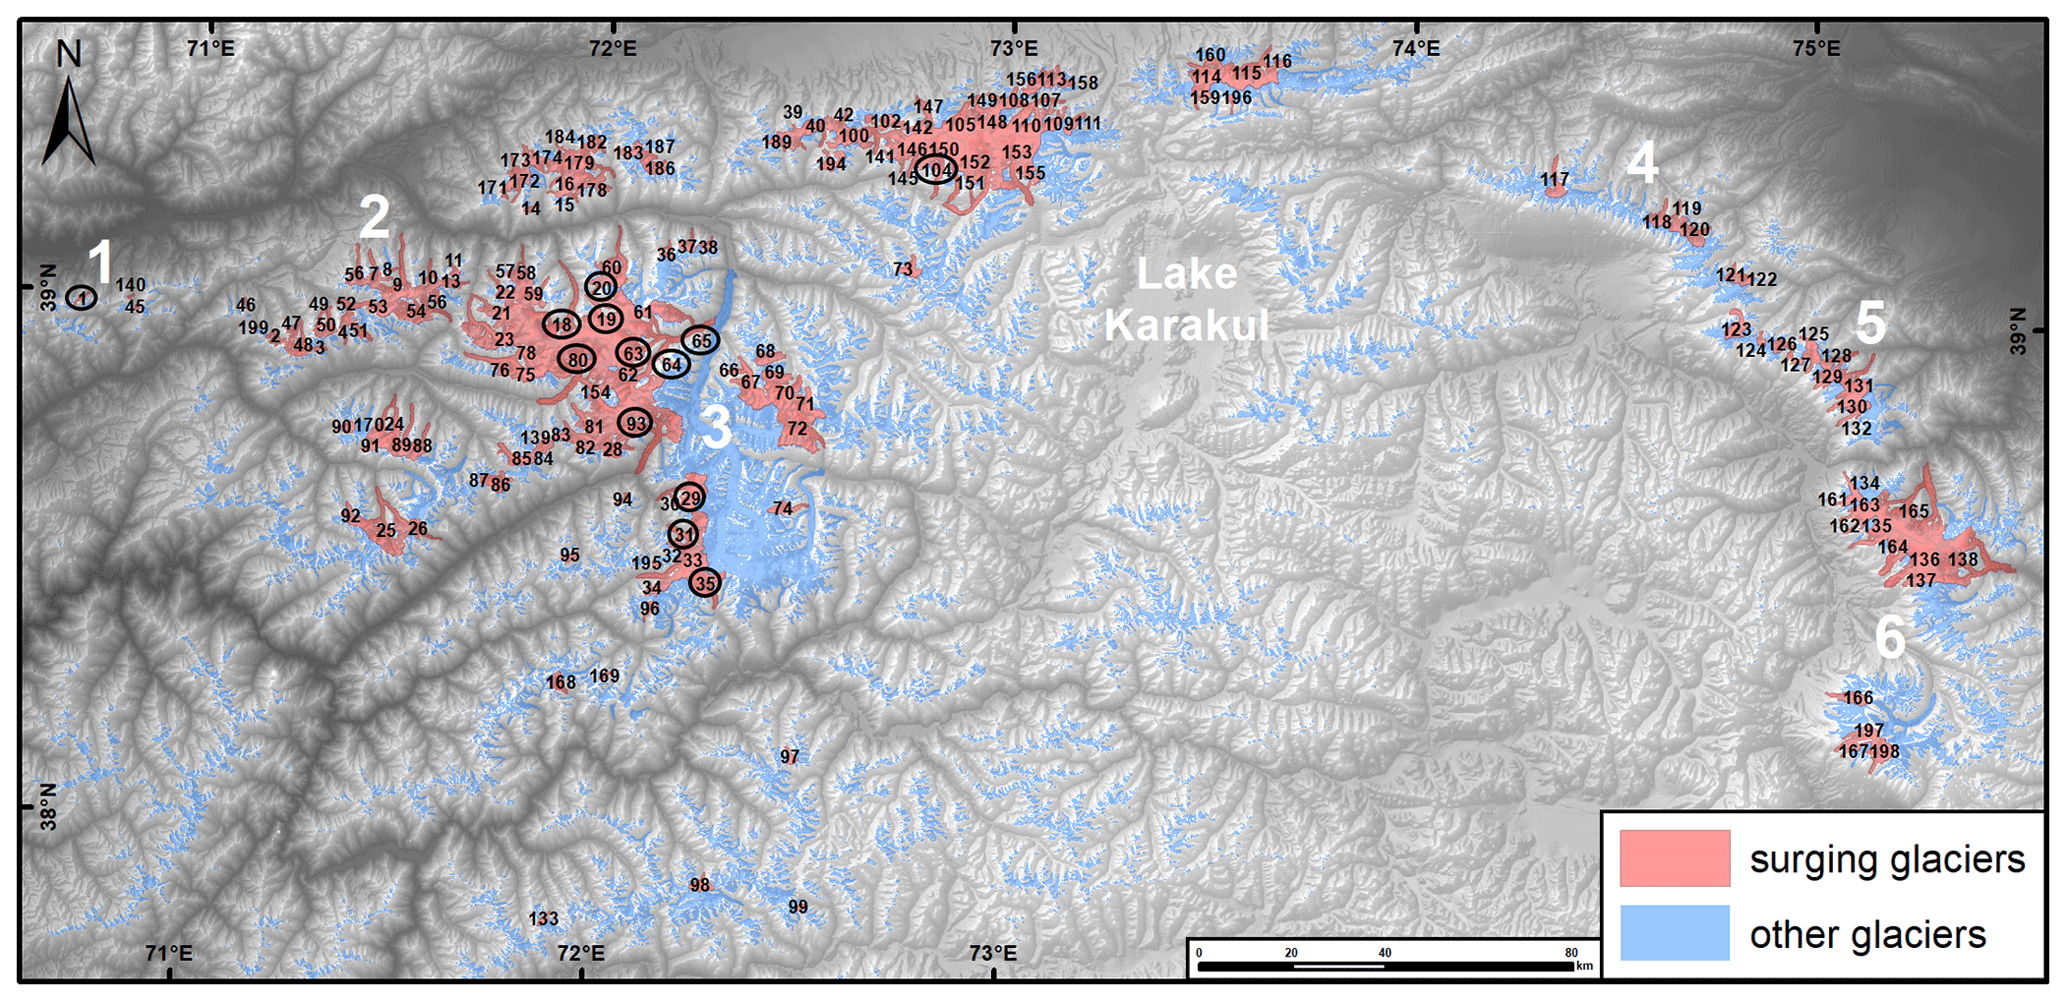
Figure 6Overview of the identified surging glaciers (red) in the Pamir Mountains. Small black numbers refer to their ObjectID in the GI-3min dataset, numbers in circles indicate glaciers mentioned in the text, and bold white numbers indicate regions mentioned in the text (1 Petr Alervogo West, 2 Petr Alervogo East, 3 Fedchenko, 4 King Tau, 5 Ulugarttag, 6 Mustagh). DEM source: AW3D30.
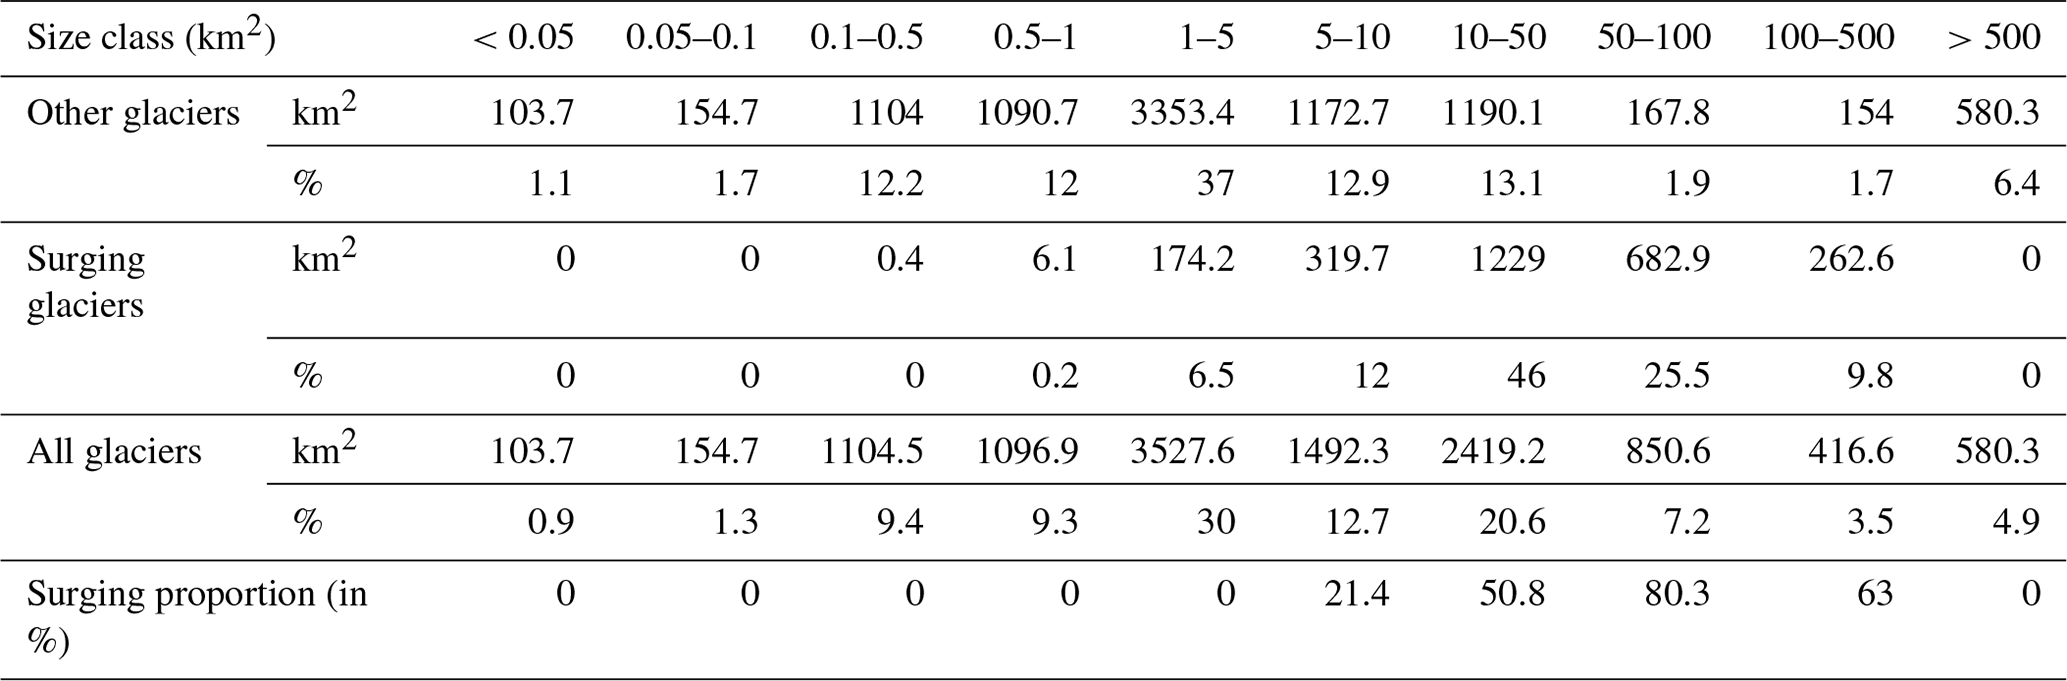
The 186 surging glaciers cover a total area of ∼2670 km2 (with a ∼110 km2 variability due to the surges). Eight of them (∼5 %) are smaller than 1 km2 covering an area of ∼7 km2, whereas 38 % are larger than 10 km2 covering an area of 2170 km2 (or 81 %) (Table 3). Garmo Glacier's main trunk (80) is the largest surging glacier (83 km2), and the largest non-surging glacier is Fedchenko. It is a huge dendritic valley glacier with a size of ∼580 km2 (without the surging Bivachny tributary) and covers 6 % of the total glacier area. The region is thus dominated by the vast size of Fedchenko Glacier with impacts on size-related distributions.
Table 3Size class distribution of surging glaciers and other glaciers of GI-2 and GI-3.
The created inventories have a different count of entries due to different glacier states and topological relations. The generalised statistics for the sample with observed surges refer to the GI-3 inventory with 186 entries, whilst statistics for GI-3min and GI-3max have different numbers. Compared to the full sample of glaciers in GI-2 (13 495), surging glaciers constitute 77 % by number and 80 % by area in the area class 50–100 km2 (Fig. 7). They also dominate the size classes 10–50 and 100–500 km2 (51 % and 63 % by area, respectively). When considering all three size classes from 10 to 500 km2, two-thirds of the glaciers have surged in the observation period, i.e. they are the rule rather than the exception. The 22 largest surging glaciers cover about the same area (1338 km2) as the 163 smaller ones (1332 km2).
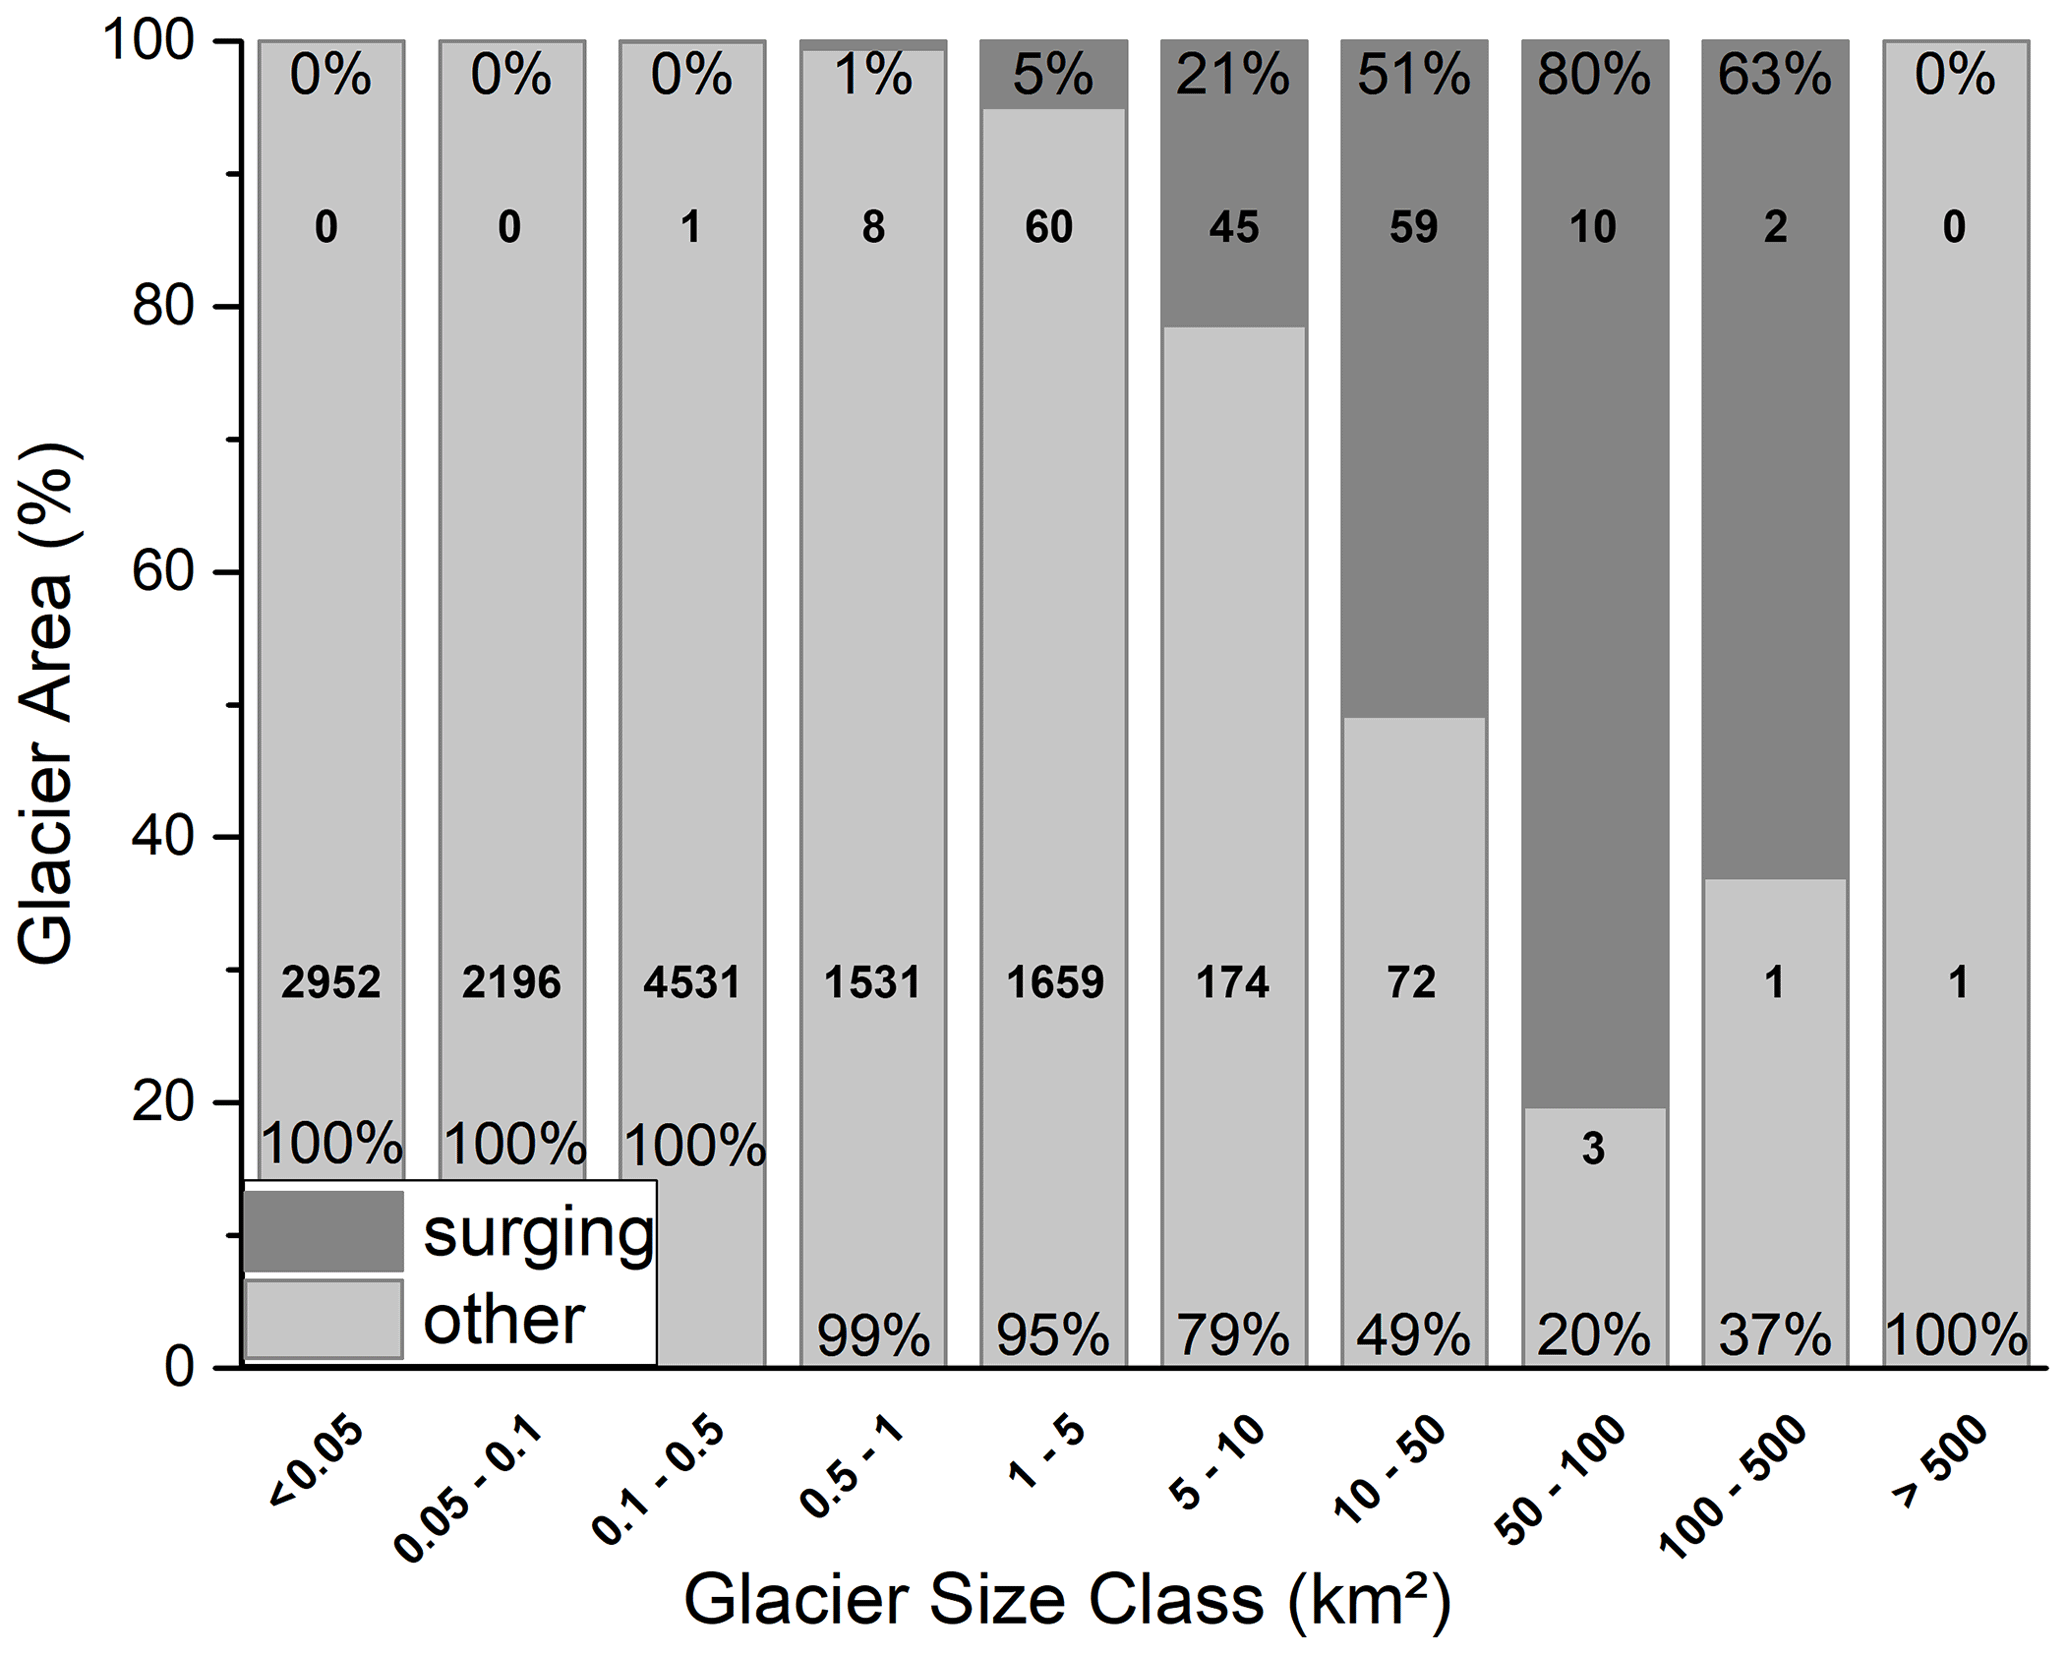
Figure 7Size class distribution (in relative terms) of surging and other glaciers in GI-2. The upper bold numbers provide the count for surge glaciers and the lower one for all other glaciers.
The frequency distribution of aspect sectors of surging glaciers is only slightly different from all other glaciers (Fig. 8a). Surging glaciers exposed to the south-west contribute almost 10 % of the sample, whereas only 3 % of the other glaciers are facing in this direction. The same applies to the area covered (Fig. 8b), for which surging glaciers cumulate ∼370 km2 and thus one-quarter more area than the other glaciers (∼300 km2 ) in this sector. On the other hand, the latter have higher percentages facing north and north-east. The strong difference towards the north is mainly driven by Fedchenko Glacier.
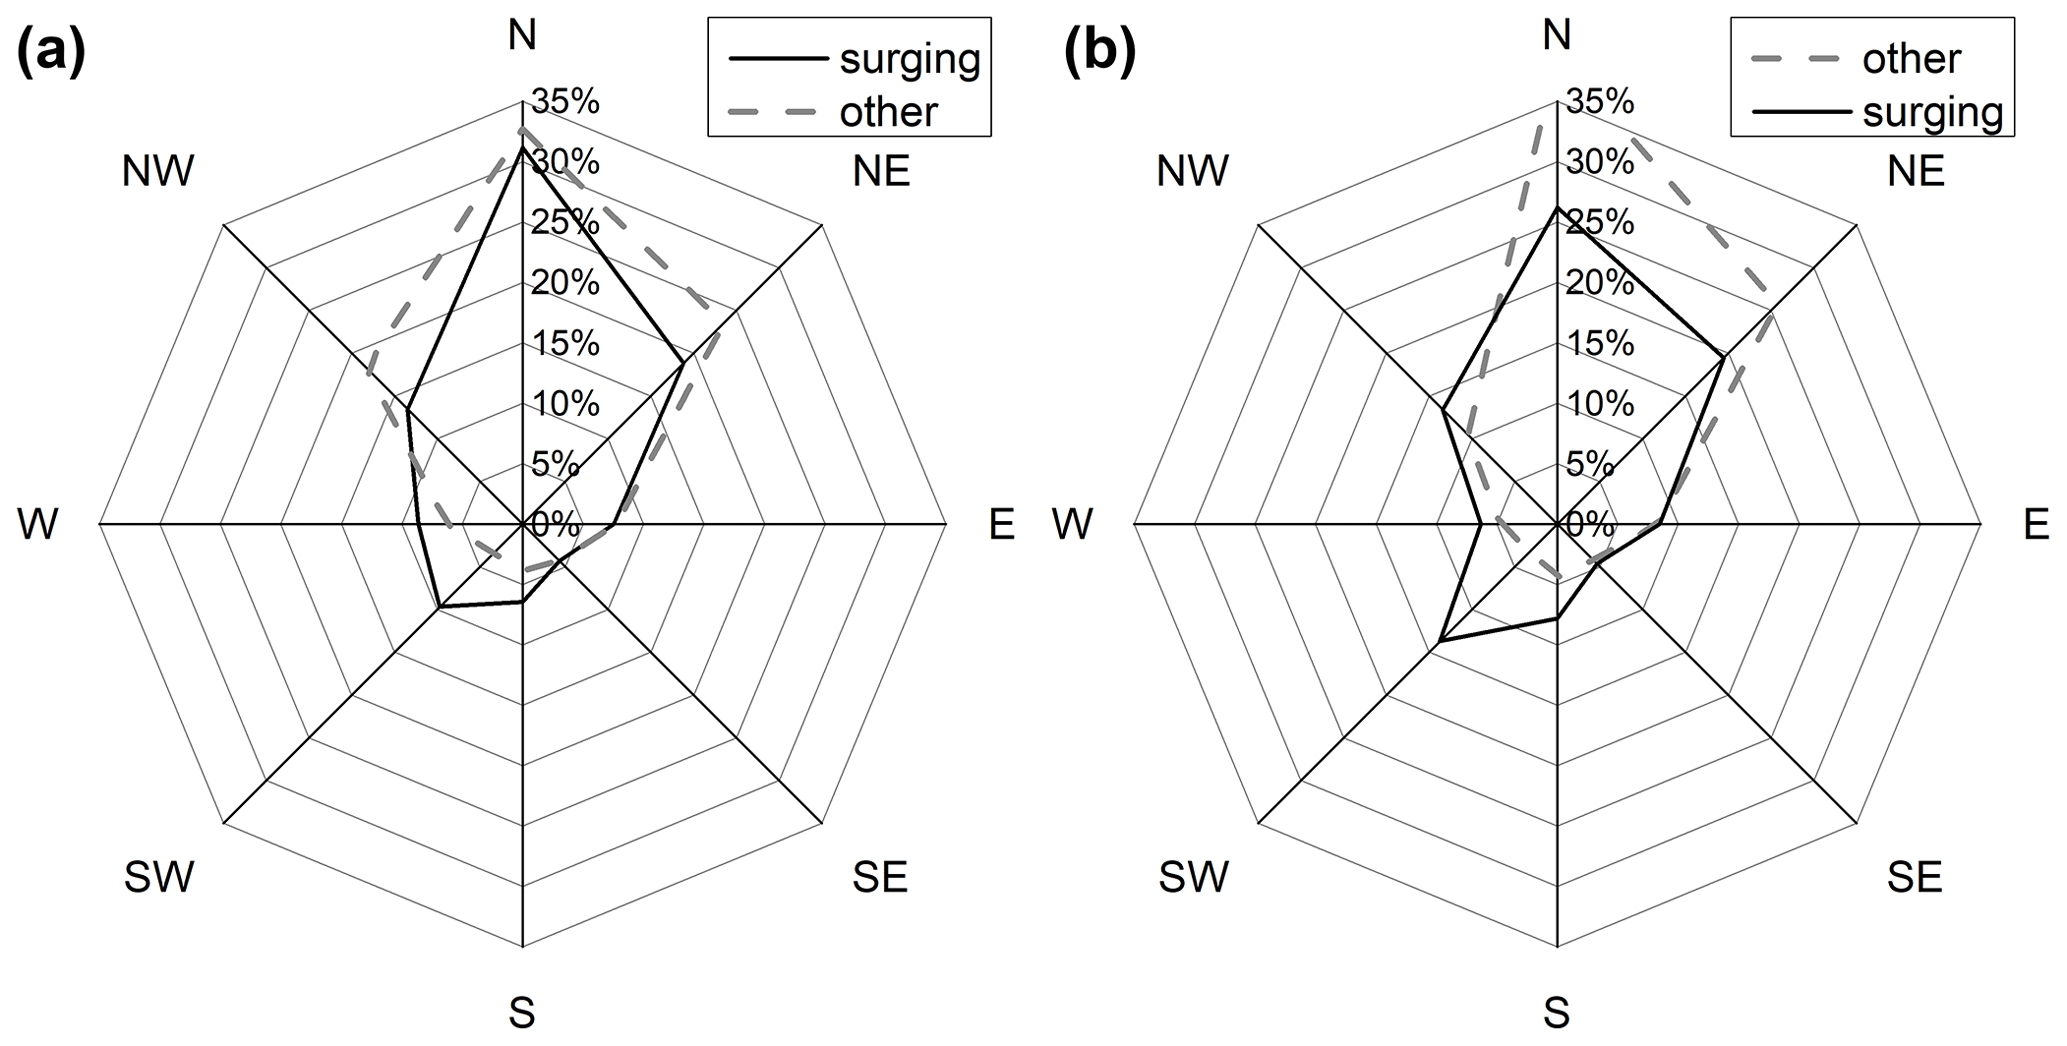
Figure 8Aspect sector distribution for surging and other glaciers (in relative terms) per (a) count and (b) area covered.
The scatterplot showing median elevation vs. mean aspect (Fig. 9) reveals that median elevations cover a wide range of values (from about 3500 to 6000 m) and that there is some dependence on aspect; i.e. glaciers facing south have a few hundred metres higher median elevations. The surging glaciers largely follow this distribution but have somewhat higher elevations in the southern and lower values in the northern aspect ranges compared to the other glaciers when considering median values per sector. On average, the median elevation of surging glaciers is 4800 m a.s.l.

Figure 9Mean aspect vs. median glacier elevation for surging and other glaciers. The connected lines are averages per aspect sector.
Median glacier elevations increase from west to east and show a small decrease in the most eastern and northern ranges (Pamir Alai) towards the outer glaciers (Fig. 10). The marked surging glaciers are mostly found along the outer boundary of the study region with generally lower median elevations. The near absence of surging glaciers in the inner Pamir with its generally higher median elevations is noteworthy. However, in the Mustagh region, glaciers with observed surges have the highest values (5646 m) and surging glaciers in the Petr Alervogo West region the lowest values (3429 m).
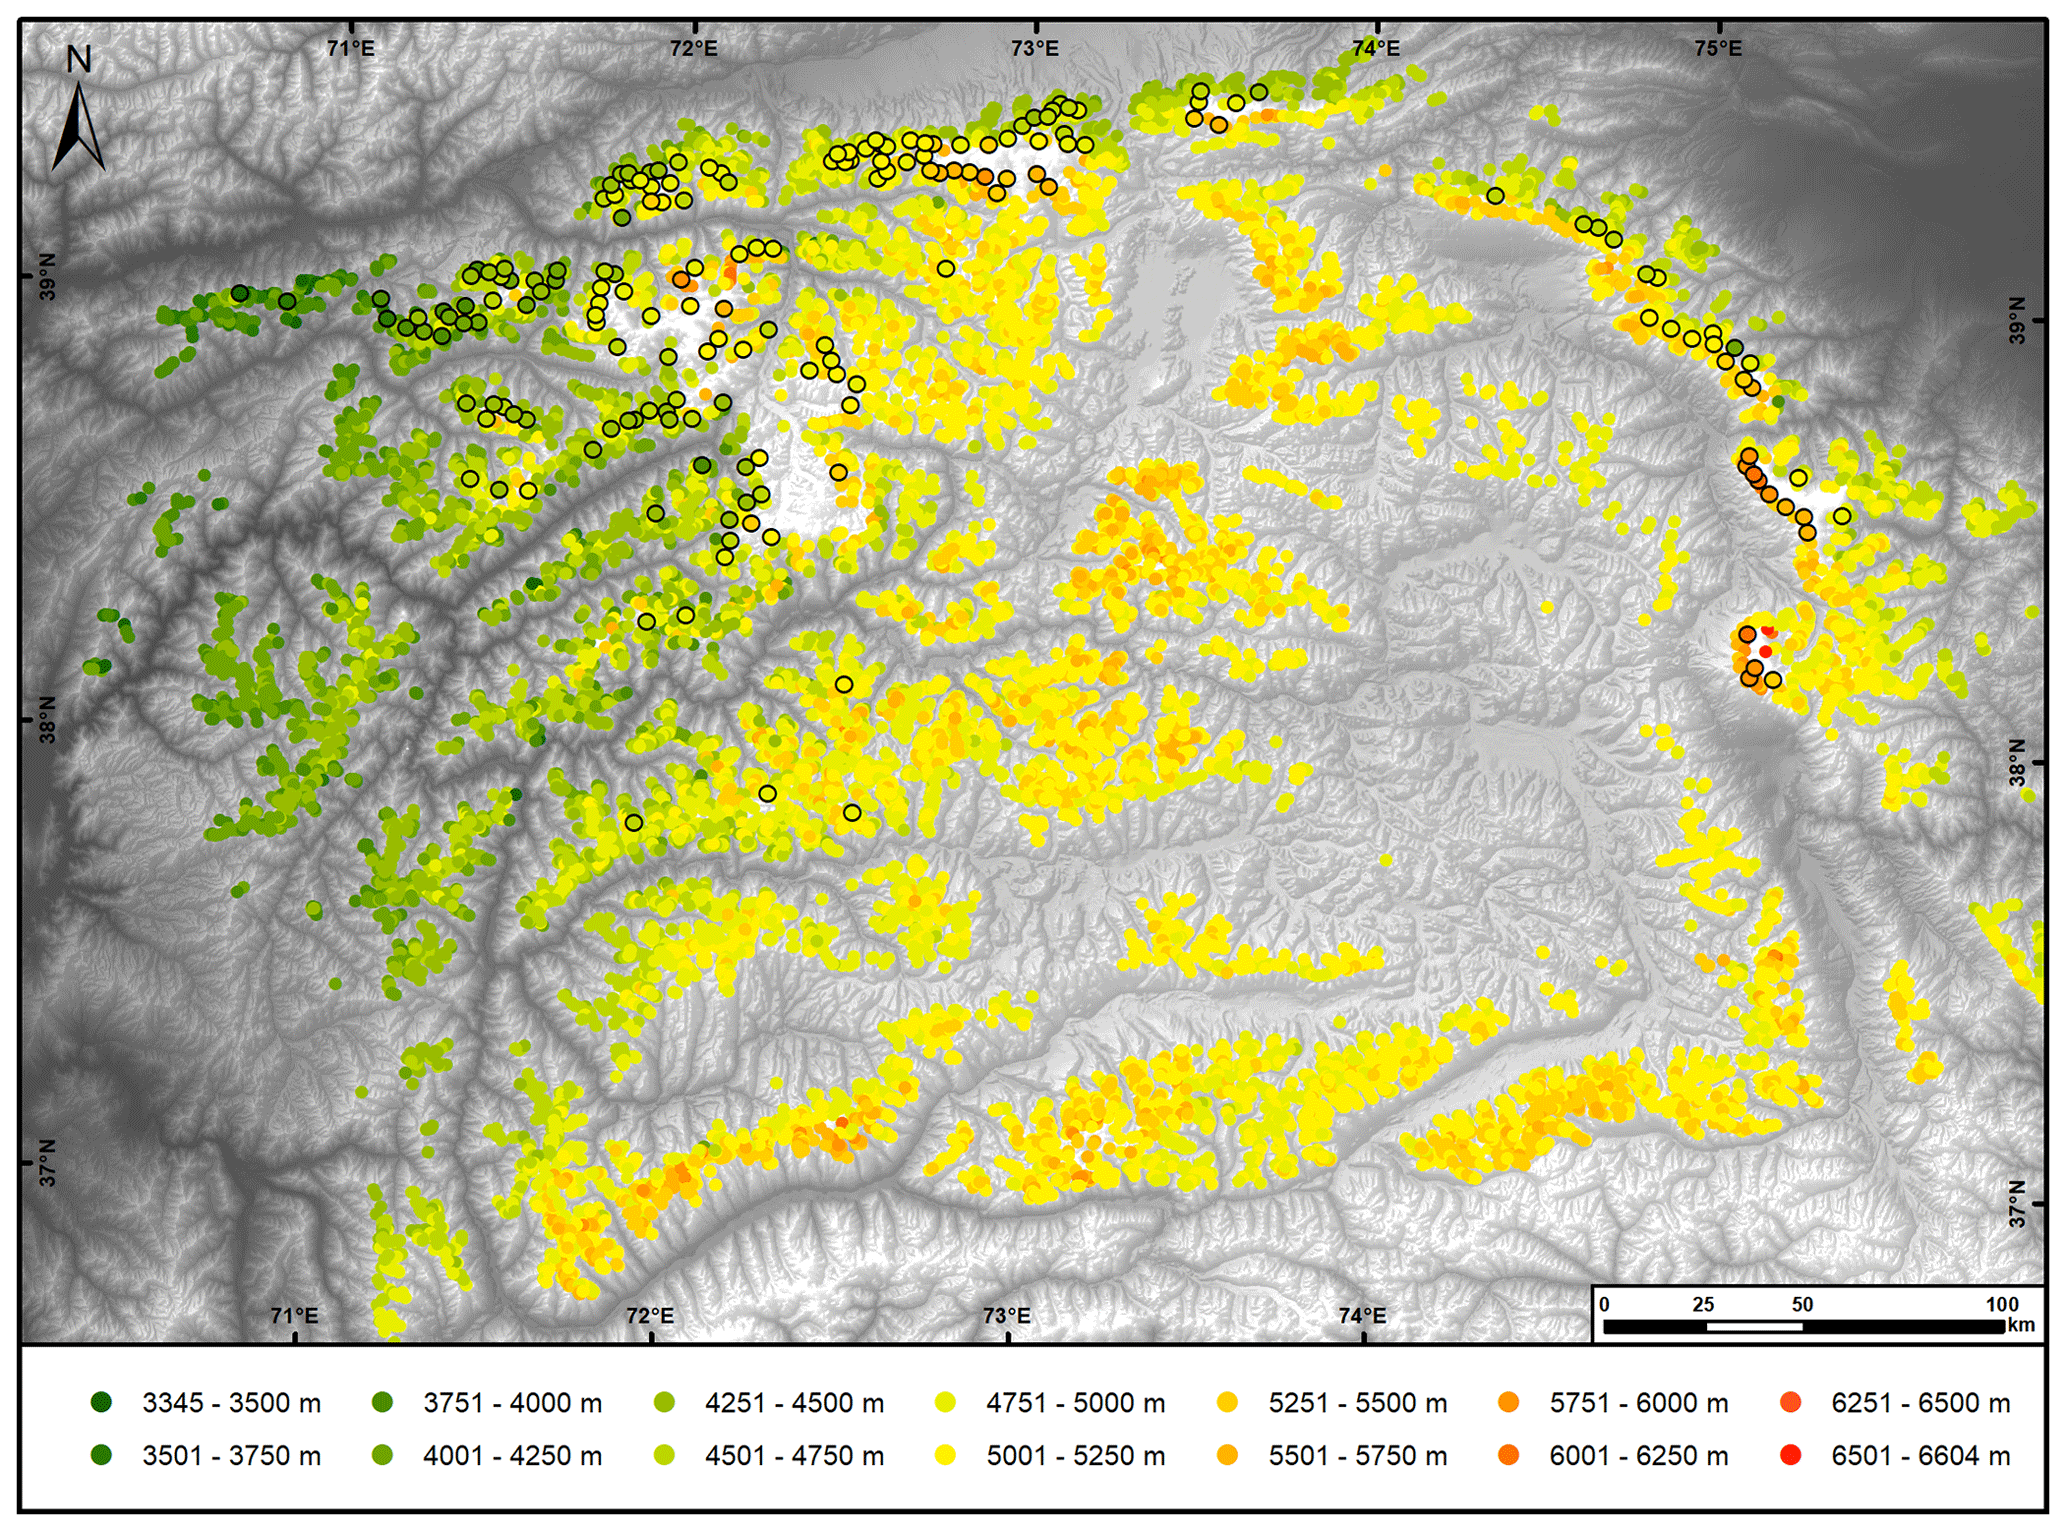
Figure 10Colour-coded median elevation map with surging glaciers marked (discs with outlines). DEM source: AW3D30.
As surging glaciers have a bias towards larger sizes compared to all other glaciers (see Fig. 7), they also have slightly higher elevation ranges (Fig. 11a) and form the upper end of the sample. However, the spread of values for glaciers with a size of about 50 km2 is very large, ranging from about 2000 to nearly 5000 m. The area–elevation distribution in Fig. 11b displays a smaller amount of area around the mean elevation compared to all other glaciers, which is likely due to the many small glaciers at these altitudes (see black circles in Fig. 10).

Figure 11Comparing topographic characteristics of surging glaciers to all others. (a) Scatterplot of the elevation range vs. glacier size. (b) Glacier hypsometry for surging and other glaciers.
5.2 Observed changes
For a sample of 169 and 160 glaciers, we could map their minimum and maximum extents, respectively, and for 148 surges, we determined the surge duration which is completely within the observation period. For 15 glaciers, we observed a full surge cycle with the onset of the next surge, and for six glaciers (Bivachny 63, Dzerzhinsky 104, Medvezhiy 29, Right Dustiroz 31, Yazgulemdara 35, ObjectID 1), two or more surges were observed over the study period. Both the timing of the surges and their durations are highly variable (Fig. 12). Moreover, one has to consider that several glaciers (>30) were already surging on the first available Landsat TM images (in 1988) and several (>20) were still surging in 2017/18. For both cases, the surge duration could not be fully determined and is thus longer than the values presented here.

Figure 12Surge periods for all glaciers with observed surges (GI-3min). Those starting (ending) in 1988 (2018) might have started earlier/lasted longer than indicated by the line.
The two histograms in Fig. 13 display a counting of the surges that started in a particular period (Fig. 13a) and of the surge durations in 4 year bins (Fig. 13b). For Fig. 13a, it has to be considered that the first period (1988/89) includes only glaciers that started surging in 1989 because it is unclear in which year the glaciers with a 1988 starting year actually started surging. For the surge duration counting in Fig. 13b, this means that shorter surge periods are over-represented and are indeed longer. Furthermore, the last period is not complete (i.e. surges are ongoing), which has the same effect on the counting. This results in values that are likely too high and too low in the first and last period, respectively. To circumvent this bias, we have also counted all surges that took place fully within the period, i.e. started after 1989 and ended before 2017 (grey bars in Fig. 13b). This sample is now smaller but still has a reasonable number of glaciers in all classes. Figure 13a reveals that the number of surges that started in the second and third period is the same and was slowly declining afterwards. The surge duration counting displayed in Fig. 13b has a peak at 1–5 years and very similar numbers for the next four intervals. Only a few glaciers (9) have surge durations exceeding 21 years. The combination of start year and duration gives the number of glaciers that are surging in a particular year. We found a steady increase in this number from 1990 (54) to 2000 (114) with a plateau lasting until 2008 (112) and a steady decrease afterwards (to 72 in 2018). In other words, in any year during the observation period, at least 54 glaciers were actively surging in the study region up to a maximum of 120 glaciers in 2006. This is far more than we expected.
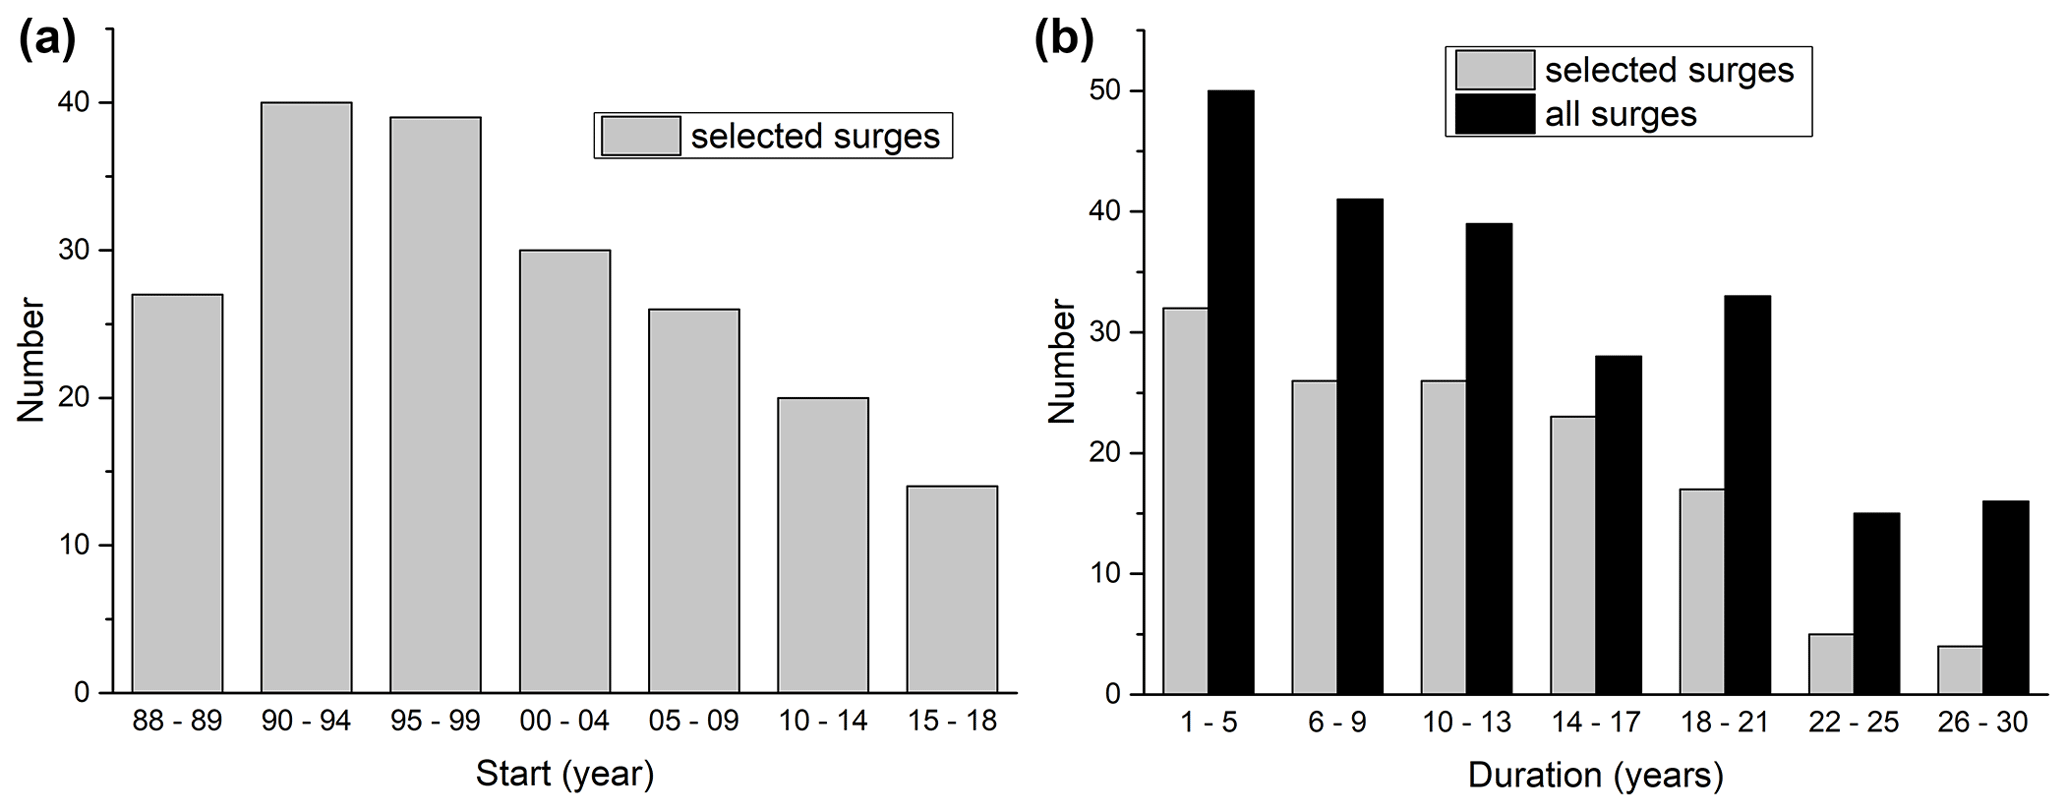
Figure 13Histograms of surge characteristics. (a) Periods in which the surges started and (b) surge durations. The charts provide greater detail than the classification code to allow for a better analysis and keep the glacier code in the inventory simple. The “88–89” label in (a) includes only glaciers that started surging in 1989 as we cannot be sure about a surge start in 1988 (it might also have been earlier). The grey bars in (b) refer to the surges that occurred completely within the study period, i.e. starting after 1988 and ending before 2018.
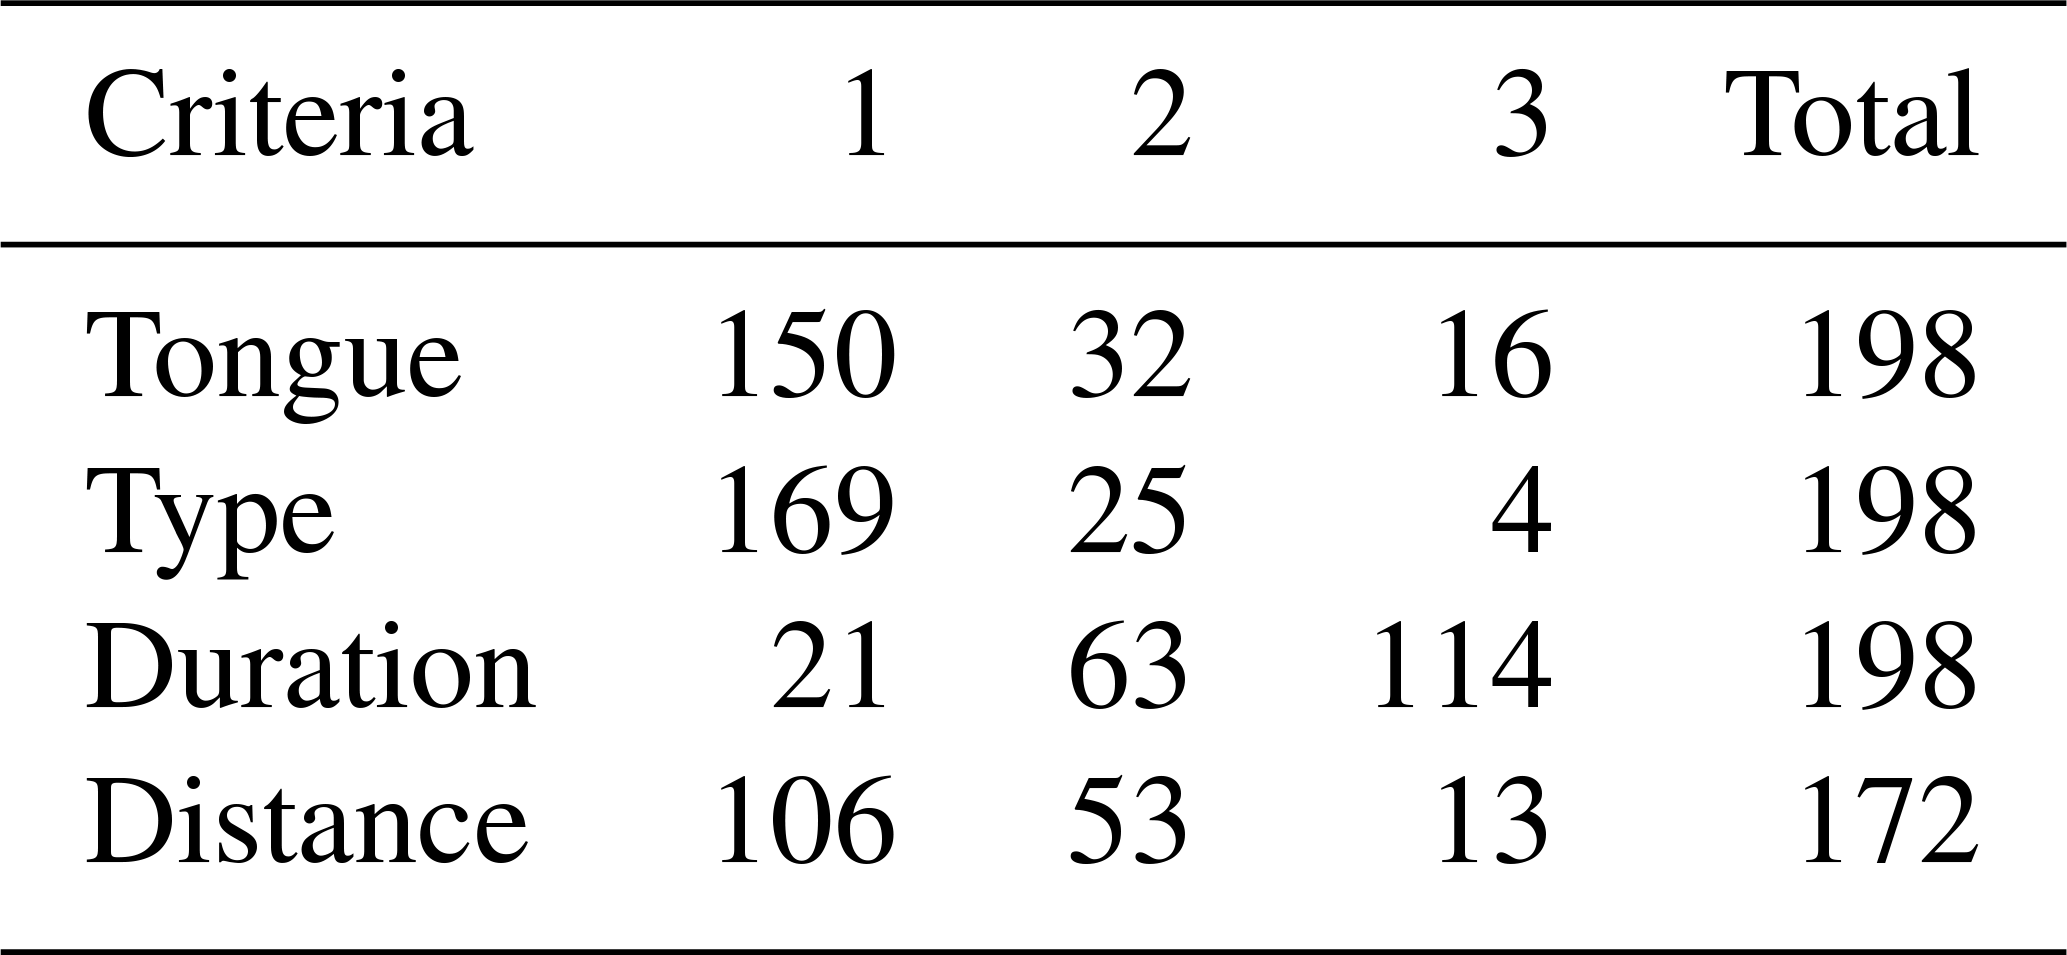
The simplified typology (see Sect. 4.2) counting presented in Table 4 reveals that 75 % of all glaciers have freely advancing tongues, whereas 18 % only connect to another glacier at least at their maximum extent. The rest are tributaries. From the total sample of identified surging glaciers, 85 % (169 glaciers) are advancing considerably, whereas the remaining 15 % (26 glaciers) are surging internally with no or only a minor terminus advance. The latter were sometimes hard to detect and required the application of additional measures (see Sect. 3). From the glaciers with a substantial terminus advance, most (62 %) advance up to 1 km. Larger advances of up to 2.5 km are found for 31 % of the glaciers, and 7.6 % advanced more than 2.5 km (up to 4.1 km). Most of the surges with a change in terminus position are situated in the central mountain ranges around Fedchenko Glacier, whereas the eastern ranges are dominated by stable glaciers and internal surges (but with a high variability). The strongest advance has been Oshanina Glacier (9) in the Petr Alervogo East mountain range with 4078 m. For this analysis, we excluded all glacier surges that were not fully covered by the observation period (start before 1988, end after 2018).
Table 4Results of the surging classification (counting per class). Glaciers with incomplete active surge phases (starting before 1988 or ending after 2018 and marked with a “0” for the distance criterion) are not listed here. See Sect. 4.2 for the meaning of classes 1, 2 and 3.
One of the most active glaciers is Medvezhiy Glacier (29) with a surge cycle of only ∼10 years and an active period of just 2 years (Kotlyakov et al., 2018). Further glaciers with relatively short (≤5 years) active phases are spread all over the study region. During the active surge phase, 128 glaciers increased their area by a total of ∼119 km2, which is 6 % of their total area (GI-3min) and 4 % of the total area in the GI-2 inventory. On average, the minimum elevation decreased from 3954 to 3793 m a.s.l., but individual glaciers reached elevations more than 800 m lower at their maximum extent. The change in minimum elevation due to a surge does not depend on the elevation range (or size) of the glacier. This is also related to the fact that several large glaciers show mostly internal surges with maybe only a small advance of the tongue. Similarly, also length changes due to a surge do not depend on glacier size or length. However, it is noteworthy that some glaciers change their length by about a factor of almost 2 (ObjectID 41).
6.1 Characteristics of the surging glaciers and their surges
Surging glaciers dominate the area classes above 10 km2, which would confirm earlier observations that surging glaciers are comparably large (Barrand and Murray, 2006; Clarke et al., 1986; Mukherjee et al., 2017). However, we found that they can also be smaller than 1 km2, down to 0.3 km2. Why such small glaciers surge, often increasing their length considerably, needs to be further investigated. We also have to mention that there might be even smaller glaciers with undetected surges due to the coarse resolution of the satellite data; i.e. our sample is somewhat biased towards larger glaciers. Whereas the aspect distribution of surging glaciers is very similar to all other glaciers (Fig. 8), they seem to have lower median elevations than other glaciers when facing north and higher ones when facing south (Fig. 9). We do not have a physical explanation for this and assume it might only be an artefact of the sampling. Their spatial distribution, on the other hand, is more peculiar as they are mostly found in the outer regions of the study site (Figs. 5 and 10). Their higher share of large elevation ranges (Fig. 11a) is related to their generally larger size, and their hypsometry is very similar to other glaciers.
Within the period considered here, the starting dates of surges are comparably random (Fig. 12), indicating a limited impact of climatic trends on the timing. The high number of surging glaciers (about 55 to max 120) in any year is remarkable and can only be found in the Karakoram (Bhambri et al., 2017). Whether the constant increase before the year 2000 and decline after 2008 is an artefact of the sampling or has other reasons needs to be investigated in a further study. A comparable increase in glacier surge activity after 1990 was also found in the Karakoram by Copland et al. (2011). Surge durations (11 years in the mean) are as diverse as in the Karakoram (Bhambri et al., 2017; Paul, 2020). However, complete surge cycles (from the start of an active phase to the next) are only observed for a few glaciers, so this impression is biased by the observation window. Due to gaps in satellite data availability, we might have missed a few glaciers displaying only (short) internal surges, so the real number of surging glaciers might be even higher and the number of glaciers with a short duration of active phases higher than in our sample.
6.2 Criteria to identify surges
The criteria we applied to identify surges were handled flexibly to consider the wide range of surge types found in the region. However, the differentiation between surging and “only” advancing glaciers is sometimes challenging and other interpretations are possible. The very high-resolution images available for our study site from Corona/Hexagon and Google Earth/Bing Maps did not help much in determining the timing of a surge (due to the large temporal gaps) but were most helpful in confirming the surge nature of a glacier in previous and recent times, respectively (Lv et al., 2019, Paul, 2020). The historic images clearly reveal that many glaciers in the Pamir Mountains had also surged in the 1970s; however, we have not used them here to derive the timing of these earlier surges as this would be a large additional exercise and the temporal density of available images might not be sufficient. However, we used them to confirm additional minimum and maximum extents.
6.3 Uncertainties
Regarding the uncertainties of the derived topographic characteristics, one has to consider that we used the GI-1 basis inventory from around 2000 with a DEM (GDEMv3) from around 2008 (NASA, 2018). The DEM has local artefacts, and the timing of both datasets does not match. The latter is in particular the case for glaciers that surged between 2000 and 2009 and had strong changes in geometry. The strongest impact is likely on minimum elevation, but median elevation, aspect and mean slope might also be impacted. There is little we can do about this uncertainty as otherwise we would need a DEM from nearly every year which is synchronous with the timing of the minimum glacier extent. However, for the overall statistical analysis of the datasets presented here, the impact of the temporal mismatch on the graphs is likely small. Of course, when individual glaciers are analysed, this mismatch has to be considered (Frey and Paul, 2012).
Regarding the timing of the observed surges, we face the following uncertainties.
- a.
We have only analysed the time window 1988 to 2018; the assigned duration of surges starting before 1988 or ending after 2018 is thus too short.
- b.
We only include glaciers with an active surge phase between 1988 and 2018; the real number of glaciers in the study region that surged in the past might thus be higher.
- c.
For most regions, we do not have usable satellite images in every year (e.g. due to snow and clouds); this adds to the uncertainty of the start/end assignment and could even result in completely missed short-lived internal surges.
- d.
The spatial resolution of Landsat sometimes impacts a proper identification of the terminus, in particular when debris-covered; this leads to uncertainties in the timing.
- e.
Due to residual dead ice in the glacier forefield and debris cover, the timing of the minimum extent is more difficult to define than the maximum; in uncertain cases, we used the extent from GI-3.
- f.
When surges start with a mass wave and/or stay internal (no terminus advance), the timing derived from visual analysis will likely be different from studies analysing flow velocities.
Collectively, it is likely that other analysts derive different start/end dates of individual surges, but in most cases, the difference will not exceed a few years. This will thus not affect the overall conclusions about the highly variable timing of surges and surge durations.
The assignment of surge classes presented here should be robust as we used qualitative and categorised criteria that will not change much for a different interpretation. However, not all surges of the same glacier end up in the same class. For example, if a recent surge is more dynamic than a previous one, it might reach another glacier and become a part-time tributary. Also, internal surges might have shown advancing termini before and are thus not strictly internal. Hence, the assigned classes can vary for other surges. In general, we only assigned the characteristics of the surge of the main glacier trunk to the attribute table.
6.4 Comparison to other inventories
Compared to previous studies, we identified several new surging glaciers. Some of the probable or possible (category 2 and 3) surges listed in Osipova et al. (1998) have indeed surged and are now included in our inventory. Most others found in these categories could not be confirmed as the morphological details used to identify surge activities are only visible in very high-resolution imagery (at least 2 m) rather than with the 30 or 15 m Landsat data we used here. It is, however, well possible that they surged outside our observation window.
Sevestre and Benn (2015) presented 820 possible surge-type glaciers in the Pamir mainly based on the inventory by Osipova et al. (1998). Our findings are in good agreement with the 51 most reliably classified (category 3) surge-type glaciers marked in the RGI (we include 45 of them). Our 132 additional surging glaciers belong mostly (55 of 188) to category 2 (probably surging) in the RGI, and a few (18 of 322) belong to category 1 (possibly surging). The remaining 52 surging glaciers were not indicated as surge-type in the RGI. When considering the 14 further glaciers which were mentioned by Lv et al. (2019), 38 (20.5 % of the total sample) so far unknown surging glaciers have been identified here for the Pamir. Outlines from two of our surging glaciers (ObjectIDs 65 and 64) are missing in the RGI 6.0. Compared to Lv et al. (2019), we identified three further surging glaciers (16 in total) in the King Tau and Ulugarttag subregions. Apart from surge-type glaciers, their study also classified 4 glaciers as advancing, 11 as stable and 1 retreating. We classified one of their advancing and three of their stable glaciers as surging. This new interpretation results from our longer observation period and the DEM difference images revealing the typical mass redistribution patterns. The surging glaciers described by Kotlyakov et al. (2008) are in full agreement with our findings. The above-mentioned numbers have to be interpreted with some care as we compared two different inventories with individual glacier divides. Thus, a direct and one-to-one comparison is challenging.
The dataset can be downloaded from: https://doi.org/10.1594/PANGAEA.914150 (Goerlich et al., 2020).
In this study, we presented a new inventory of surging glaciers for the Pamir Mountains. The analysis is based on results from earlier studies, Landsat imagery acquired over the period 1988 to 2018, the SRTM, ASTER GDEMv3 and ALOS DEMs, and declassified very-high resolution images from Corona and Hexagon, as well as more recent very high-resolution satellite data (Bing Maps and Google Earth). Using animations and flicker images for the Landsat time series in combination with the elevation change patterns from DEM differencing, we detected 206 spatially distinct glacier surges within 186 glacier bodies. The new dataset is in good agreement with previous compilations of surging glaciers and confirmed surges for 133 new glaciers that were so far only marked as surge-type probable or possible. We further digitised the minimum and maximum extents of 169 and 160 glaciers, respectively, and determined the timing for about three-quarters of all surges. The temporal distribution is random concerning timing and surge duration (mean value 11 years), but the high number of active surges in any year (between 54 and 120) was unexpected and is only comparable to the Karakoram. The distribution of surging glaciers is biased towards the northern, western and eastern mountain ranges. Their sizes range from 0.3 to 143 km2, and they dominate the size class distribution above 10 km2. Three glaciers descend by more than 800 m, and five increased their length by a factor of more than 2 during a surge. However, advance distances are not related to original glacier length as several large glaciers only show internal surges or very small advances. The three inventories created in this study (GI-3, GI-3min, GI-3max) are available in the Supplemental Material to serve as a base for further investigations.
The supplement related to this article is available online at: https://doi.org/10.5194/essd-12-3161-2020-supplement.
FG and FP designed the study, analysed the datasets and wrote the paper. FG processed the data and prepared all figures and datasets. TB provided additional literature and datasets. All authors contributed to the writing and editing of the paper.
The authors declare that they have no conflict of interest.
The work of Franz Goerlich and Frank Paul was supported by the ESA projects Glaciers_cci (4000109873/14/I-NB) and Glaciers_cci+ (4000127593/19/I-NB), and the work of Tobias Bolch was partially supported by the Strategic Priority Research Program of Chinese Academy of Sciences (XDA20100300). The AW3D30 DEM is provided by the Japan Aerospace Exploration Agency (http://www.eorc.jaxa.jp/ALOS/en/aw3d30/index.htm, last access: 20 March 2020) © JAXA. All Corona, Hexagon and Landsat images used in this study were provided by USGS and downloaded from https://earthexplorer.usgs.gov. We thank Philipp Rastner for supporting us in calculating the topographic parameters for several states of the inventory, Kriti Mukherjee for providing the Hexagon DEMs from 1975 and Horst Machguth for providing the centre lines for the determination of glacier length and length changes. We thank Luke Copland and the second anonymous reviewer for their conscientious work to improve this study.
This research has been supported by ESA (grant nos. 4000109873/14/I-NB and 4000127593/19/I-NB) and the Chinese Academy of Sciences (grant no. XDA20100300).
This paper was edited by Kirsten Elger and reviewed by Luke Copland and one anonymous referee.
Barrand, N. E. and Murray, T.: Multivariate controls on the incidence of glacier surging in the Karakoram Himalaya, Arct. Antarct. Alp. Res., 38, 489–498, https://doi.org/10.1657/1523-0430(2006)38[489:MCOTIO]2.0.CO;2, 2006.
Berthier, E. and Brun, F.: Karakoram geodetic glacier mass balances between 2008 and 2016: Persistence of the anomaly and influence of a large rock avalanche on Siachen Glacier, J. Glaciol., 65, 494–507, https://doi.org/10.1017/jog.2019.32, 2019.
Bhambri, R., Hewitt, K., Kawishwar, P., and Pratap, B.: Surge-type and surge-modified glaciers in the Karakoram, Sci. Rep.-UK, 7, 1–14, https://doi.org/10.1038/s41598-017-15473-8, 2017.
Bolch, T., Pieczonka, T., Mukherjee, K., and Shea, J.: Brief communication: Glaciers in the Hunza catchment (Karakoram) have been nearly in balance since the 1970s, The Cryosphere, 11, 531–539, https://doi.org/10.5194/tc-11-531-2017, 2017.
Brun, F., Berthier, E., Wagnon, P., Kääb, A. and Treichler, D.: A spatially resolved estimate of High Mountain Asia glacier mass balances from 2000 to 2016, Nat. Geosci., 10, 668–673, https://doi.org/10.1038/ngeo2999, 2017.
Clarke, K. C., Sciimoi, P., Simon, C., and Ommanney, L.: Characteristics of surge-type glaciers, J. Geophys. Res., 91, 7165–7180, https://doi.org/10.1029/JB091iB07p07165, 1986.
Copland, L., Sylvestre, T., Bishop, M. P., Shroder, J. F., Seong, Y. B., Owen, L. A., Bush, A., and Kamp, U.: Expanded and recently increased glacier surging in the Karakoram, Arct. Antarct. Alp. Res., 43, 503–516, https://doi.org/10.1657/1938-4246-43.4.503, 2011.
Dolgushin, L. D. and Osipova, G. B.: New Data on the recent glacier surges, Mater. Glyatsiol., 18, 191–217, 1971.
Dolgushin, L. D. and Osipova, G. B.: Glacier surges and the problem of their forecasting, IAHS-AISH P., 104, 292–304, 1975.
Dowdeswell, J. A., Gorman, M. R., Macheret, Y. Y., Moskalevsky, M. Y., and Hagen, J. O.: Digital comparison of high resolution Sojuzkarta KFA-1000 imagery of ice masses with Landsat and SPOT data, Ann. Glaciol., 17, 105–112, https://doi.org/10.3189/S0260305500012684, 1993.
Dowdeswell, J. A., Glazovsky, A. F., and Macheret, Y. Y.: Ice divides and drainage basins on the ice caps of Franz Josef Land, Russian High Arctic, defined from Landsat, KFA-1000, and ERS-1 SAR satellite imagery, Artic Alpine Res., 27, 264–270, https://doi.org/10.2307/1551957, 1995.
Falaschi, D., Bolch, T., Lenzano, M. G., Tadono, T., Lo Vecchio, A., and Lenzano, L.: New evidence of glacier surges in the Central Andes of Argentina and Chile, Prog. Phys. Geog., 42, 792–825, https://doi.org/10.1177/0309133318803014, 2018.
Finaev, A. F., Shiyin, L., Weijia, B., and Li, J.: Climate change and water potential of the Pamir Mountains, Geogr. Environ. Sustain., 9, 88–105, https://doi.org/10.15356/2071-9388_03v09_2016_06, 2016.
Frey, H. and Paul, F.: On the suitability of the SRTM DEM and ASTER GDEM for the compilation of: Topographic parameters in glacier inventories, Int. J. Appl. Earth Obs., 18, 480–490, https://doi.org/10.1016/j.jag.2011.09.020, 2012.
Galiatsatos, N.: The shift from film to digital product: focus on CORONA imagery, Photogramm. Fernerkun., 2009, 251–260, https://doi.org/10.1127/0935-1221/2009/0020, 2009.
Gardelle, J., Berthier, E., Arnaud, Y., and Kääb, A.: Region-wide glacier mass balances over the Pamir-Karakoram-Himalaya during 1999–2011, The Cryosphere, 7, 1263-–1286, https://doi.org/10.5194/tc-7-1263-2013, 2013.
Goerlich, F., Bolch, T., Mukherjee, K., and Pieczonka, T.: Glacier Mass Loss during the 1960s and 1970s in the Ak-Shirak Range (Kyrgyzstan) from Multiple Stereoscopic Corona and Hexagon Imagery, Remote Sens.-Basel, 9, 275, https://doi.org/10.3390/rs9030275, 2017.
Goerlich, F., Bolch, T., and Paul, F.: Inventory of surging glaciers in the Pamir, PANGAEA, https://doi.org/10.1594/PANGAEA.914150, 2020.
Herreid, S. and Truffer, M.: Automated detection of unstable glacier flow and a spectrum of speedup behavior in the Alaska Range, J. Geophys. Res.-Earth, 121, 64–81, https://doi.org/10.1002/2015JF003502, 2016.
Holzer, N., Golletz, T., Buchroithner, M. F., and Bolch, T.: Glacier variations in the Trans Alai Massif and the Lake Karakul Catchment (Northeastern Pamir) measured from space, in: Climate Change, Glacier Response, and Vegetation Dynamics in the Himalaya, edited by: Singh, R. P., Schikhoff, U., and Mal, S., Springer, Cham., pp. 139–153, 2016.
Kääb, A., Isakowski, Y., Paul, F., Neumann, A. and Winter, R.: Glaziale und periglaziale Prozesse: Von der statischen zur dynamischen Visualisierung, Kartographische Nachrichten 53, 206–212, 2003.
Kotlyakov, V. M., Desinov, L. V., Osipova, G. B., Hauser, M., Tsvetkov, D. G., and Schneider, J. F.: Events in 2002 on Russian Geographical Society (RGO) Glacier, Pamirs, Mater. Glyatsiol., 95, 221–230, 2003.
Kotlyakov, V. M., Osipova, G. B., and Tsvetkov, D. G.: Monitoring of the Pamirs surging glaciers from space, Ann. Glaciol., 48, 125–134, https://doi.org/10.3189/172756408784700608, 2008.
Kotlyakov, V. M., Chernova, L. P., Khromova, T. E., Muraviev, A. Y., Kachalin, A. B., and Tiuflin, A. S.: Unique Surges of Medvezhy Glacier, Dokl. Earth Sci., 483, 1547–1552, https://doi.org/10.1134/s1028334x18120152, 2018.
Lambrecht, A., Mayer, C., Aizen, V., Floricioiu, D., and Surazakov, A.: The evolution of Fedchenko glacier in the Pamir, Tajikistan, during the past eight decades, J. Glaciol., 60, 233–244, https://doi.org/10.3189/2014JoG13J110, 2014.
Lambrecht, A., Mayer, C., Wendt, A., Floricioiu, D., and Völksen, C.: Elevation change of Fedchenko Glacier, Pamir Mountains, from GNSS field measurements and TanDEM-X elevation models, with a focus on the upper glacier, J. Glaciol., 64, 637–648, https://doi.org/10.1017/jog.2018.52, 2018.
Liang, L., Cuo, L., and Liu, Q.: The energy and mass balance of a continental glacier: Dongkemadi Glacier in central Tibetan Plateau, Sci. Rep.-UK, 8, 1–8, https://doi.org/10.1038/s41598-018-31228-5, 2018.
Lv, M., Guo, H., Lu, X., Liu, G., Yan, S., Ruan, Z., Ding, Y., and Quincey, D. J.: Characterizing the behaviour of surge- and non-surge-type glaciers in the Kingata Mountains, eastern Pamir, from 1999 to 2016, The Cryosphere, 13, 219–236,https://doi.org/10.5194/tc-13-219-2019, 2019.
Machguth, H. and Huss, M.: The length of the world's glaciers – a new approach for the global calculation of center lines, The Cryosphere, 8, 1741–1755, https://doi.org/10.5194/tc-8-1741-2014, 2014.
Maussion, F., Scherer, D., Mölg, T., Collier, E., Curio, J., and Finkelnburg, R.: Precipitation seasonality and variability over the Tibetan Plateau as resolved by the high Asia reanalysis, J. Climate, 27, 1910–1927, https://doi.org/10.1175/JCLI-D-13-00282.1, 2014.
Meier, M. F. and Post, A.: What are glacier surges?, Can. J. Earth Sci., 6, 807–817, 1969.
Minora, U., Bocchiola, D., D'Agata, C., Maragno, D., Mayer, C., Lambrecht, A., Vuillermoz, E., Senese, A., Compostella, C., Smiraglia, C., and Diolaiuti, G. A.: Glacier area stability in the Central Karakoram National Park (Pakistan) in 2001–2010: The “Karakoram Anomaly” in the spotlight, Prog. Phys. Geog., 40, 629–660, 2016.
Mölg, N., Bolch, T., Rastner, P., Strozzi, T., and Paul, F.: A consistent glacier inventory for Karakoram and Pamir derived from Landsat data: distribution of debris cover and mapping challenges, Earth Syst. Sci. Data, 10, 1807–1827, https://doi.org/10.5194/essd-10-1807-2018, 2018.
Mukherjee, K., Bolch, T., Goerlich, F., Kutuzov, S., Osmonov, A., Pieczonka, T., and Shesterova, I.: Surge-type glaciers in the Tien Shan (Central Asia), Arct. Antarct. Alp. Res., 49, 147–171, https://doi.org/10.1657/AAAR0016-021, 2017.
NASA/METI/AIST/Japan Spacesystems and U.S./Japan ASTER Science Team: ASTER Global Digital Elevation Model V003 [Data Set]., 2018.
Osipova, G. B.: Fifty years of studying the Medvezhiy Glacier (West Pamirs) by the Institute of Geography, RAS, Ice Snow, 1, 129–140, https://doi.org/10.15356/2076-6734-2015-1-129-140, 2015.
Osipova, G. B. and Khromova, T. E.: Electonic data base “Surging glaciers of Pamir”, Ice Snow, 50, 15–24, 2010.
Osipova, G. B., Tsvetkov, D. G., Schetinnikov, A. S., and Rudak, M. S.: Inventory of surging glaciers of the Pamirs, Mater. Glyatsiol., 85, 3–136, 1998.
Paul, F.: Revealing glacier flow and surge dynamics from animated satellite image sequences: examples from the Karakoram, The Cryosphere, 9, 2201–2214, https://doi.org/10.5194/tc-9-2201-2015, 2015.
Paul, F.: A 60 year chronology of glacier surges in the central Karakoram from the analysis of satellite image time-series, Geomorphology, 352, 106993, https://doi.org/10.1016/j.geomorph.2019.106993, 2020.
Paul, F., Kääb, A., Maisch, M., Kellenberger, T., and Haeberli, W.: The new remote-sensing-derived Swiss glacier inventory: I. Methods, Ann. Glaciol., 34, 355–361, https://doi.org/10.3189/172756402781817473, 2002.
Paul, F., Barry, R. G., Cogley, J. G., Frey, H., Haeberli, W., Ohmura, A., Ommanney, C. S. L., Raup, B., Rivera, A., and Zemp, M.: Recommendations for the compilation of glacier inventory data from digital sources, Ann. Glaciol., 50, 119–126, https://doi.org/10.3189/172756410790595778, 2009.
Pieczonka, T., Bolch, T., Junfeng, W., and Shiyin, L.: Heterogeneous mass loss of glaciers in the Aksu-Tarim Catchment (Central Tien Shan) revealed by 1976 KH-9 Hexagon and 2009 SPOT-5 stereo imagery, Remote Sens. Environ., 130, 233–244, https://doi.org/10.1016/j.rse.2012.11.020, 2013.
Quincey, D. J., Glasser, N. F., Cook, S. J., and Luckman, A.: Heterogeneity in Karakoram glacier surges, J. Geophys. Res.-Earth, 120, 1288–1300, https://doi.org/10.1002/2015JF003515, 2015.
Rabus, B., Eineder, M., Roth, A., and Bamler, R.: The shuttle radar topography mission—a new class of digital elevation models acquired by spaceborne radar, ISPRS J. Photogramm., 57, 241–262, https://doi.org/10.1016/S0924-2716(02)00124-7, 2003.
Rankl, M. and Braun, M.: Glacier elevation and mass changes over the central Karakoram region estimated from TanDEM-X and SRTM/X-SAR digital elevation models, Ann. Glaciol., 57, 273–281, https://doi.org/10.3189/2016AoG71A024, 2016.
RGI consortium: Randolph Glacier Inventory – A Dataset of Global Glacier Outlines: Version 6.0, GLIMS Technical Report, 71 pp., available at: http://glims.org/RGI/00_rgi60_TechnicalNote.pdf (last access: 20 March 2020), 2017.
Round, V., Leinss, S., Huss, M., Haemmig, C., and Hajnsek, I.: Surge dynamics and lake outbursts of Kyagar Glacier, Karakoram, The Cryosphere, 11, 723–739, https://doi.org/10.5194/tc-11-723-2017, 2017.
Sevestre, H. and Benn, D. I.: Climatic and geometric controls on the global distribution of surge-type glaciers: Implications for a unifying model of surging, J. Glaciol., 61, 646–662, https://doi.org/10.3189/2015JoG14J136, 2015.
Shean, D.: High Mountain Asia 8-meter DEM Mosaics Derived from Optical Imagery, Version, Boulder, Colorado, 2017.
Steiner, J. F., Kraaijenbrink, P. D. A., Jiduc, S. G., and Immerzeel, W. W.: Brief communication: The Khurdopin glacier surge revisited – extreme flow velocities and formation of a dammed lake in 2017, The Cryosphere, 12, 95–101, https://doi.org/10.5194/tc-12-95-2018, 2018.
Takaku, J., Tadono, T., and Tsutsui, K.: Generation of High Resolution Global DSM from ALOS PRISM, Int. Arch. Photogramm. Remote Sens. Spatial Inf. Sci., XL-4, 243–248, https://doi.org/10.5194/isprsarchives-XL-4-243-2014, 2014.
Wendt, A., Mayer, C., Lambrecht, A., and Floricioiu, D.: A glacier surge of Bivachny Glacier, Pamir Mountains, observed by a time series of high-resolution digital elevation models and glacier velocities, Remote Sens.-Basel, 9, 388, https://doi.org/10.3390/rs9040388, 2017.
Wessel, B.: TanDEM-X Ground Segment – DEM Products Specification Document, Oberpfaffenhofen, available at: https://tandemx-science.dlr.de/ (last access: 20 March 2020), 2016.
Yasuda, T. and Furuya, M.: Dynamics of surge-type glaciers in West Kunlun Shan, Northwestern Tibet, J. Geophys. Res.-Earth, 120, 2393–2405, https://doi.org/10.1002/2015JF003511, 2015.
Zhang, H., Zhang, F., Zhang, G., Ma, Y., Yang, K., and Ye, M.: Daily air temperature estimation on glacier surfaces in the Tibetan Plateau using MODIS LST data, J. Glaciol., 64, 132–147, https://doi.org/10.1017/jog.2018.6, 2018.