the Creative Commons Attribution 4.0 License.
the Creative Commons Attribution 4.0 License.
 | 03 Dec 2020
Drainage of organic soils and GHG emissions: validation with country data
Giulia Conchedda
Francesco N. Tubiello
Drainage of large areas with organic soils was conducted over the past century to free up land for agriculture. A significant acceleration of such trends was observed in recent decades in Southeast Asia, largely driven by drainage of tropical peatlands, an important category of organic soils, for cultivation of oil palm. This work presents the methods and main results of a new methodology developed for FAOSTAT, whereby the overlay of dynamic maps of land cover and the use of information about histosols allows the production of a global annual dataset of drained area and emissions over a time series, covering the period 1990–2019. This is an improvement over the existing FAO approach, which had produced only a static map of drained organic soils for the year 2000. Results indicate that drained area and emissions increased by 13 % globally since 1990, reaching 24 million hectares in 2019 of drained organic soils, with world total emissions of 830 Mt of carbon dioxide (CO2) equivalent. Of these totals, the largest contribution was from the drainage of tropical peatlands in Southeast Asia, generating nearly half of global emissions. Results were validated against national data reported by countries to the UN Climate Convention and against the well-established literature. Overall, the validation yielded a good agreement with these sources. FAOSTAT estimates explained about 60 % of the variability in official country-reported data. The predicted emissions were virtually identical – with over 90 % of explained variability – to official data from Indonesia, currently the top emitting country by drained organic soils. Also, calculated emissions factors for oil palm plantations in Indonesia and Malaysia were in the same range and very close to emissions factors derived from detailed field measurements. This validation suggests that the FAO estimates may be a useful and sound reference in support of countries reporting needs. Data are made available through open access via the Zenodo portal (Tubiello and Conchedda, 2020) with the following DOI: https://doi.org/10.5281/zenodo.3942370.
- Article
(9916 KB) - Full-text XML
- BibTeX
- EndNote


Organic soils are, generally speaking, wet soil ecosystems, characterized by high levels of organic matter, which accumulates in large quantities under the anoxic conditions that exist in the presence of water. They include tropical peatlands, high-latitude bogs and mires. Indeed, while organic soils cover a mere 3 % of the terrestrial land area globally, they represent up to 30 % of the total soil carbon, playing an important role in maintaining the earth's carbon balance (FAO, 2020a). Drainage of organic soils releases large quantities of carbon dioxide (CO2) and nitrous dioxide (N2O) into the atmosphere, as a result of the increased oxidation and decomposition rates of the underlying organic matter once water is removed. These emissions typically last for several decades after the drainage event, due to the large quantities of available organic substrate. Agriculture is a major cause of drainage of organic soils around the world, especially after the 1990s, due to the cultivation of permanent crops such as oil palm in Southeast Asia. Restoration of degraded organic soils is currently a priority in several countries as part of their greenhouse gas mitigation and ecosystem restoration commitments under the UN Climate Convention (Leifeld and Menichetti, 2018; Tiemeyer et al., 2020). Measuring current trends, both globally and with country-level detail, is therefore important to identify and quantify existing and fast-developing new hotspots of degradation and to help reduce emissions from drained organic soils in future decades. Estimates of drainage area and greenhouse gas (GHG) emissions from organic soils for the year 2000 were developed by FAO and used by the Intergovernmental Panel on Climate Change (IPCC) for global analysis (Tubiello et al., 2016; Smith et al., 2014). That preliminary work was based on the geospatial overlay of two static maps, one for land cover, indicating presence of agriculture, and one for soil characteristics, indicating presence of organic soils, through the use of histosols as proxy. This paper describes additional methodological developments made possible by the availability of time-dependent land cover maps, resulting in the production, for the first time, of estimates over a complete time series (1990–2019).
Organic soils are characterized by high concentrations of organic matter. They mostly develop under poorly drained, wet conditions and are found at all altitudes, with the vast majority occurring in lowlands (Gorham, 1991; Rieley and Page, 2016). Peatlands are an important type of organic soils (Page et al., 2011; IPCC, 2014a). According to the IPCC (2006), organic soils can be largely identified with the histosols group of the FAO–UNESCO classification. FAO and Wetlands International (2012) described histosols as soils that develop in (predominantly) “moss peat in boreal, arctic and subarctic regions, via moss peat, reeds or sedge peat, and forest peat in temperate regions to mangrove peat and swamp forest peat in the humid tropics”. Common names for histosols are “peat soils”, “muck soils”, “bog soils” and “organic soils” (FAO et al., 1998). In this work, we follow IPCC guidelines and identify organic soils with histosols. It should be noted that these might include areas that are not strictly defined as peat soils. Cropland and grassland organic soils are drained permanently or semi-permanently, as well as regularly limed and fertilized, to permit annual or permanent crop cultivation, including tree plantations, or to support livestock grazing. Peat emissions are unique as they continue emitting for long periods after the initial drainage (FAO, 2020a).
The area of drained organic soils and associated greenhouse gas (GHG) emissions were estimated following default Tier 1 methods of the IPCC (2006) over IPCC land use classes “Cropland” and “Grassland” (corresponding to FAO land use classes “Cropland” and “Land under permanent meadows and pastures”). This methodology was already applied within FAOSTAT (Tubiello et al., 2016) and was extended herein by introducing a time-dependent component, as follows in Eq. (1):
where emissions stands for emissions for year y of greenhouse gas i (N2O or CO2) over land use type j (cropland or grassland); Σy,jA stands for total area for year y of drained organic soils under land use type j (cropland or grassland); EFijk stands for emissions factor, i.e., emissions per unit area of drained organic soils of greenhouse gas i, land use type j, and climatic zone k; y stands for years in the period 1992–2018 as yearly time-steps representing time-dependent land cover maps; and k stands for boreal, temperate, or tropical climatic zones, following IPCC (2006).
At pixel level, the work we carried out included the use of a geospatially detailed map of organic soils (FAO and IIASA, 2012) annual maps of land cover (ESA CCI, 2020); a combined livestock density map (Robinson et al., 2014); and a map of climatic zones (JRC, 2010). Details on these inputs are given in following sections. The area drained for cropland and grassland organic soils represent the time-dependent components of Eq. (1). They were calculated as follows:
where Acropland,y and Agrassland,y are the area of drained organic soils on cropland and grassland, respectively, for the year y obtained as the overlay of LUcropland,y and LUgrassland,y, which represent the area for the year y under IPCC and FAO land use classes cropland and grassland, respectively, derived from land cover classes (cropland or grassland) in global land cover maps (C3S, 2019) of the year y. WMShistosols is the area with soil type histosols from the Harmonized Soil Map of the World (FAO and IIASA, 2012). Following IPCC (2006), histosols are used as a proxy for organic soils. LDR>0.1 is used for grassland organic soils only, with an area with livestock density of ruminants (in livestock units) above a defined threshold, derived from global maps of the FAO Gridded Livestock of the World (Robinson et al., 2014), to identify grazed grassland.
Table 1Proportion of area of relevant CCI-LC pixels corresponding to land use cropland.
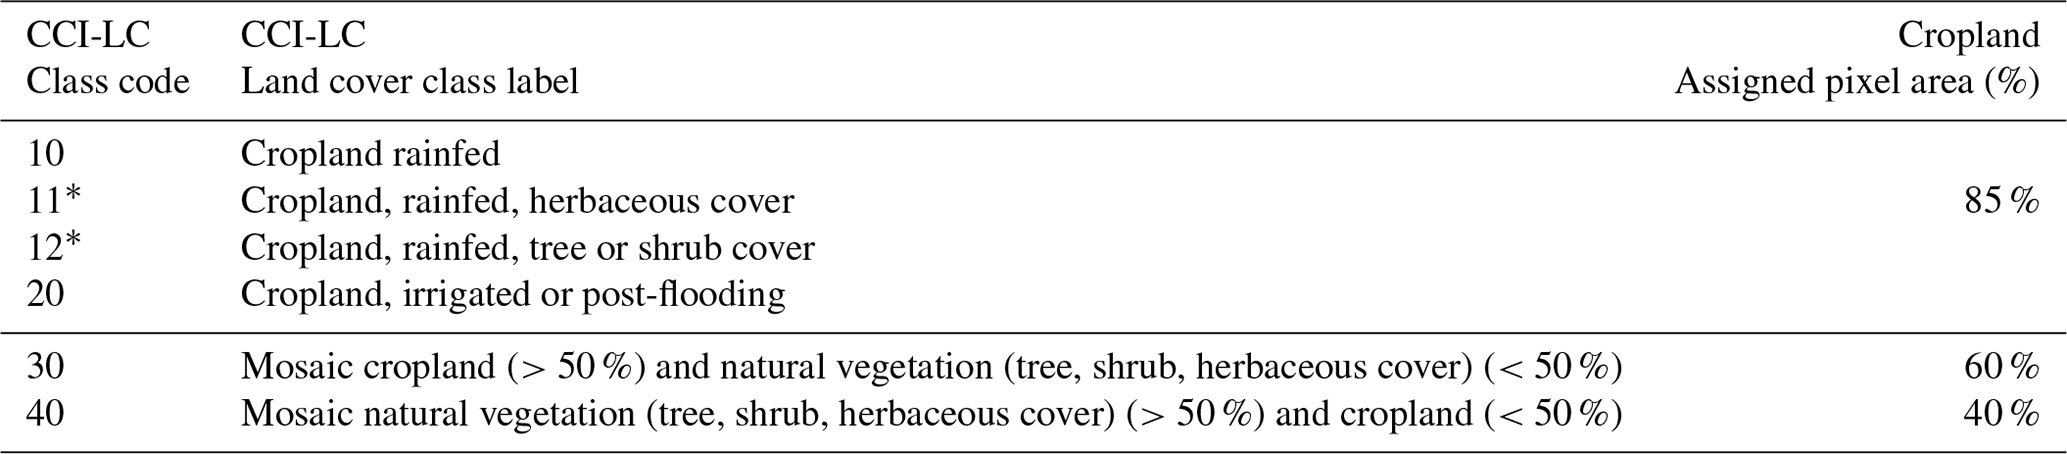
∗ Corresponding to more detailed classification (Level 2) in CCI-LC maps but with limited geographical availability.
The IPCC basic methodology for carbon (C) and nitrous oxide (N2O) emissions estimates from organic soils assigns an annual EF (i.e., quantity of gas emitted per hectare and per year per unit of activity data) associated with the loss of these gases following the drainage for agriculture. Drainage stimulates the oxidation of organic matter previously built up under a largely anoxic environment. The rates of emissions are influenced by climate, with warmer climates accelerating the processes of oxidation of soil organic matter and thus causing higher emissions than in temperate and cooler climates. The emission factors by gas are therefore climate dependent. In this methodology, we spatialized the relevant IPCC emission factors following a global map of climatic zones (JRC, 2010) to produce global maps of EF for the two gases. The computations by pixel then multiply the area of drained and managed organic soils from Eqs. (2) and (3) above by global maps of emission factors to derive estimates of annual N2O and CO2 emissions by pixel, as summarized in Eq. (1).
As described in Tubiello et al. (2016), the approach is based on reclassification tables to extract the proportions of cultivated and grassland area from the yearly land cover maps. When all input layers overlap, the underlying assumption is that of an equal likelihood within each pixel to find cultivated (or grassland) area and organic soils. Operationally, the methodology multiplies the area of organic soils in the pixel by the area of the pixel that is cropped or has grassland cover. In this way, we derived the area of organic soils that is drained for agricultural activities by pixel. In order to support cultivation, organic soils need to be drained. Heavy grazing on grassland organic soils might result in N and C losses and overall degradation (Worrall and Clay, 2012; Martin et al., 2013; Noble et al., 2018). The following sections provide more details about the information necessary to implement the computations above.
2.1 Soils
Information on the geographical distribution of histosols, for use in the term WMS of Eqs. (2) and (3) above, was derived from the Harmonized World Soil Database (HWSD v1.2), a raster dataset with a nominal resolution of 30 arcsec on the ground (approximately corresponding to 1×1 km at the Equator) published in 2012 by FAO and the International Institute for Applied Systems Analysis (IIASA) (FAO and IIASA, 2012). The HWSD compiles more than 40 years of soil information from several sources worldwide, reclassified and harmonized according to the FAO–UNESCO classification. The standardized structure of the HWSD v 1.2 allows for displaying and querying the composition in terms of soil units and of soil parameters such as the organic carbon content, the pH, or the water storage capacity. The HWSD dataset was queried to extract values representing the percentage of the pixel area that contains histosols, as either dominant or secondary soil type (Fig. 1). Soil units in the HWSD dataset dominated by histosols are characterized by soils with a thick layer of strongly decomposed acidic organic material (70 cm thick), with continuous rock at 80 cm that develop in environments with a large excess of precipitation.
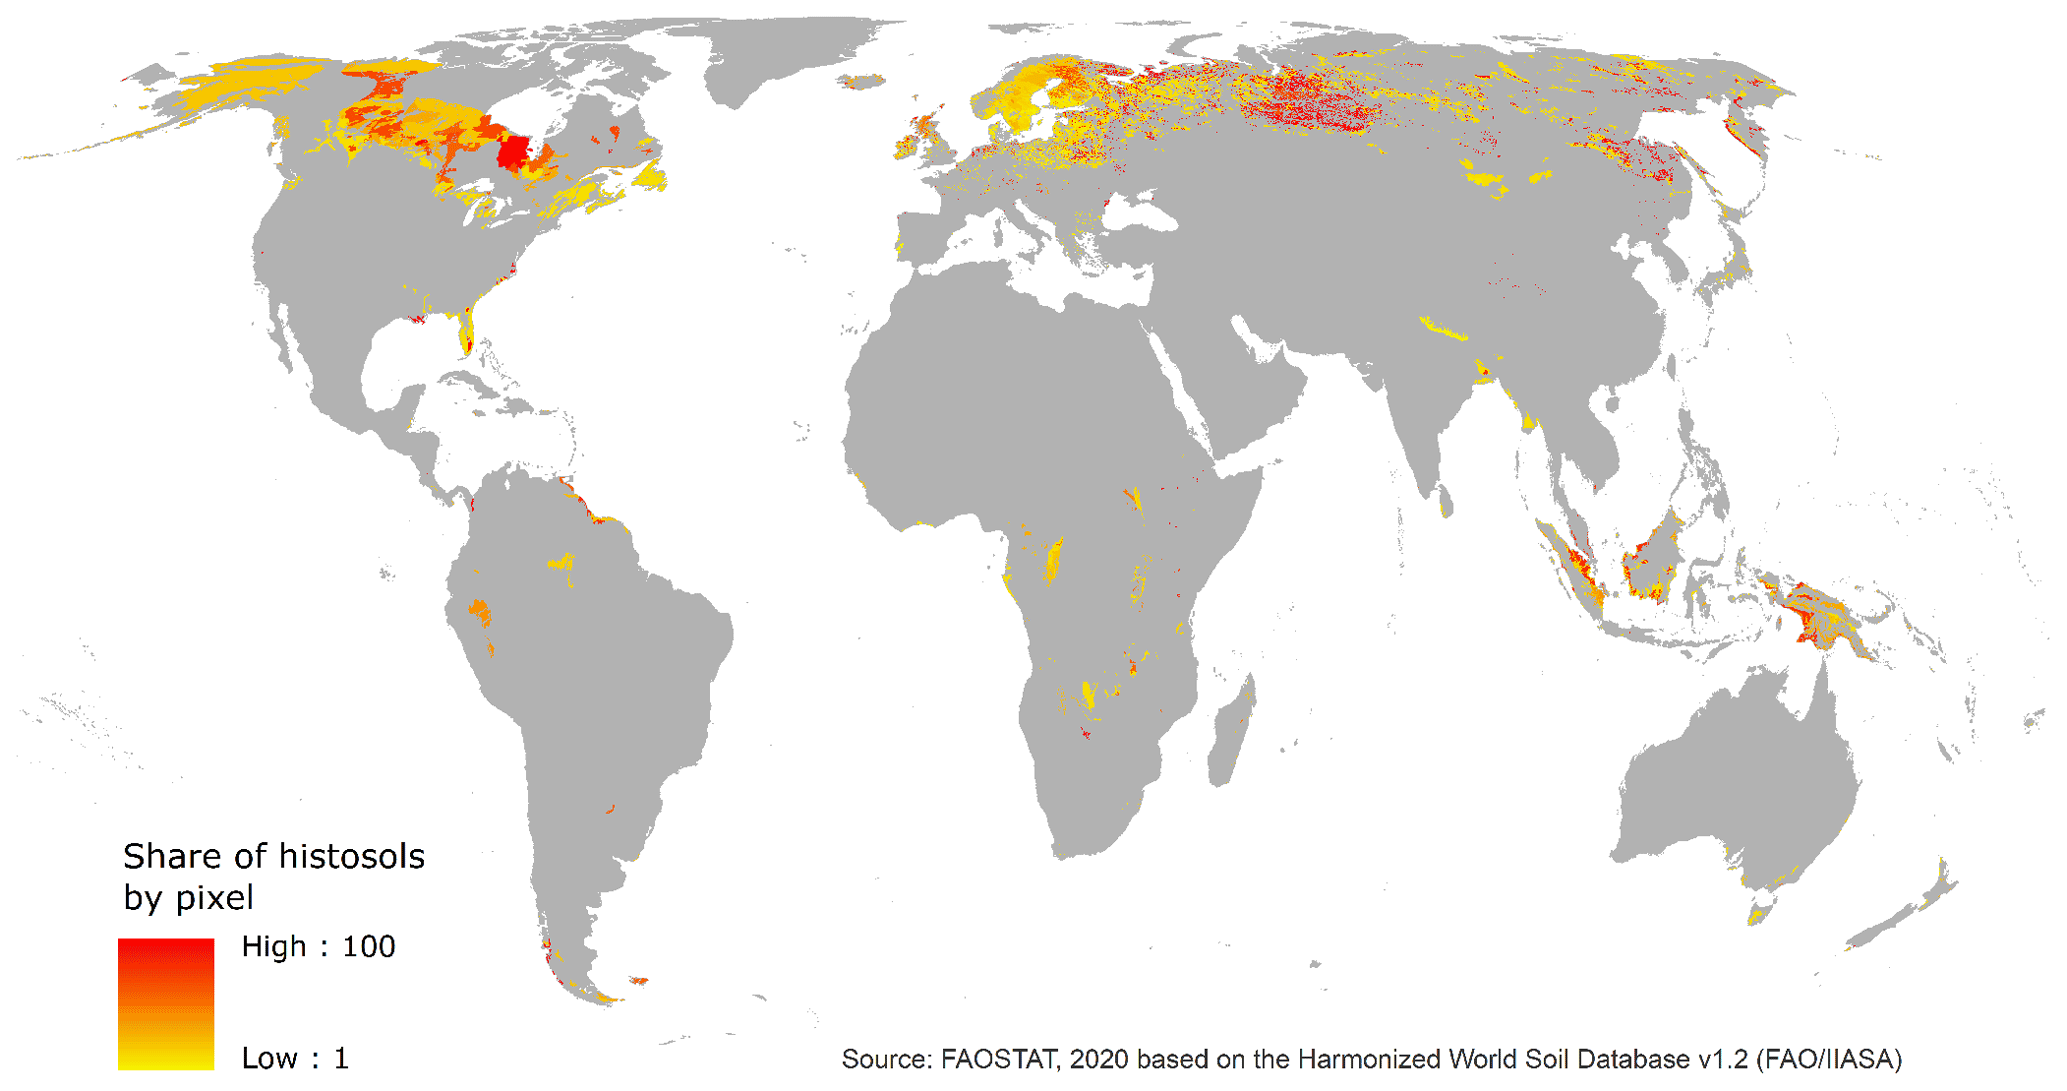
Figure 1Global distribution of histosols shown by percentage of pixel area.
2.2 Land cover and land use
Information on the area extent of IPCC categories cropland and grassland for use in the terms LUcropland and LUgrassland in Eqs. (2)–(3) was taken from the land cover maps produced by the Catholic University of Louvain (UCL) Geomatics (UCLouvain Geomatic, 2017), produced under the Climate Change Initiative of the European Space Agency (ESA CCI, 2020) and hereinafter referred to as CCI LC maps. The CCI LC maps were first released in April 2017 as 24 global annual and consistent land cover maps covering the period 1992 to 2015 (UCLouvain Geomatic, 2017). Since 2016, CCI LC maps became part of the European Copernicus Climate Change Service, which released at the end of 2019 (C3S, 2019); three additional global land cover (LC) products for the years 2016, 2017 and 2018 that are consistent with earlier maps and that were also used (Fig. 2).
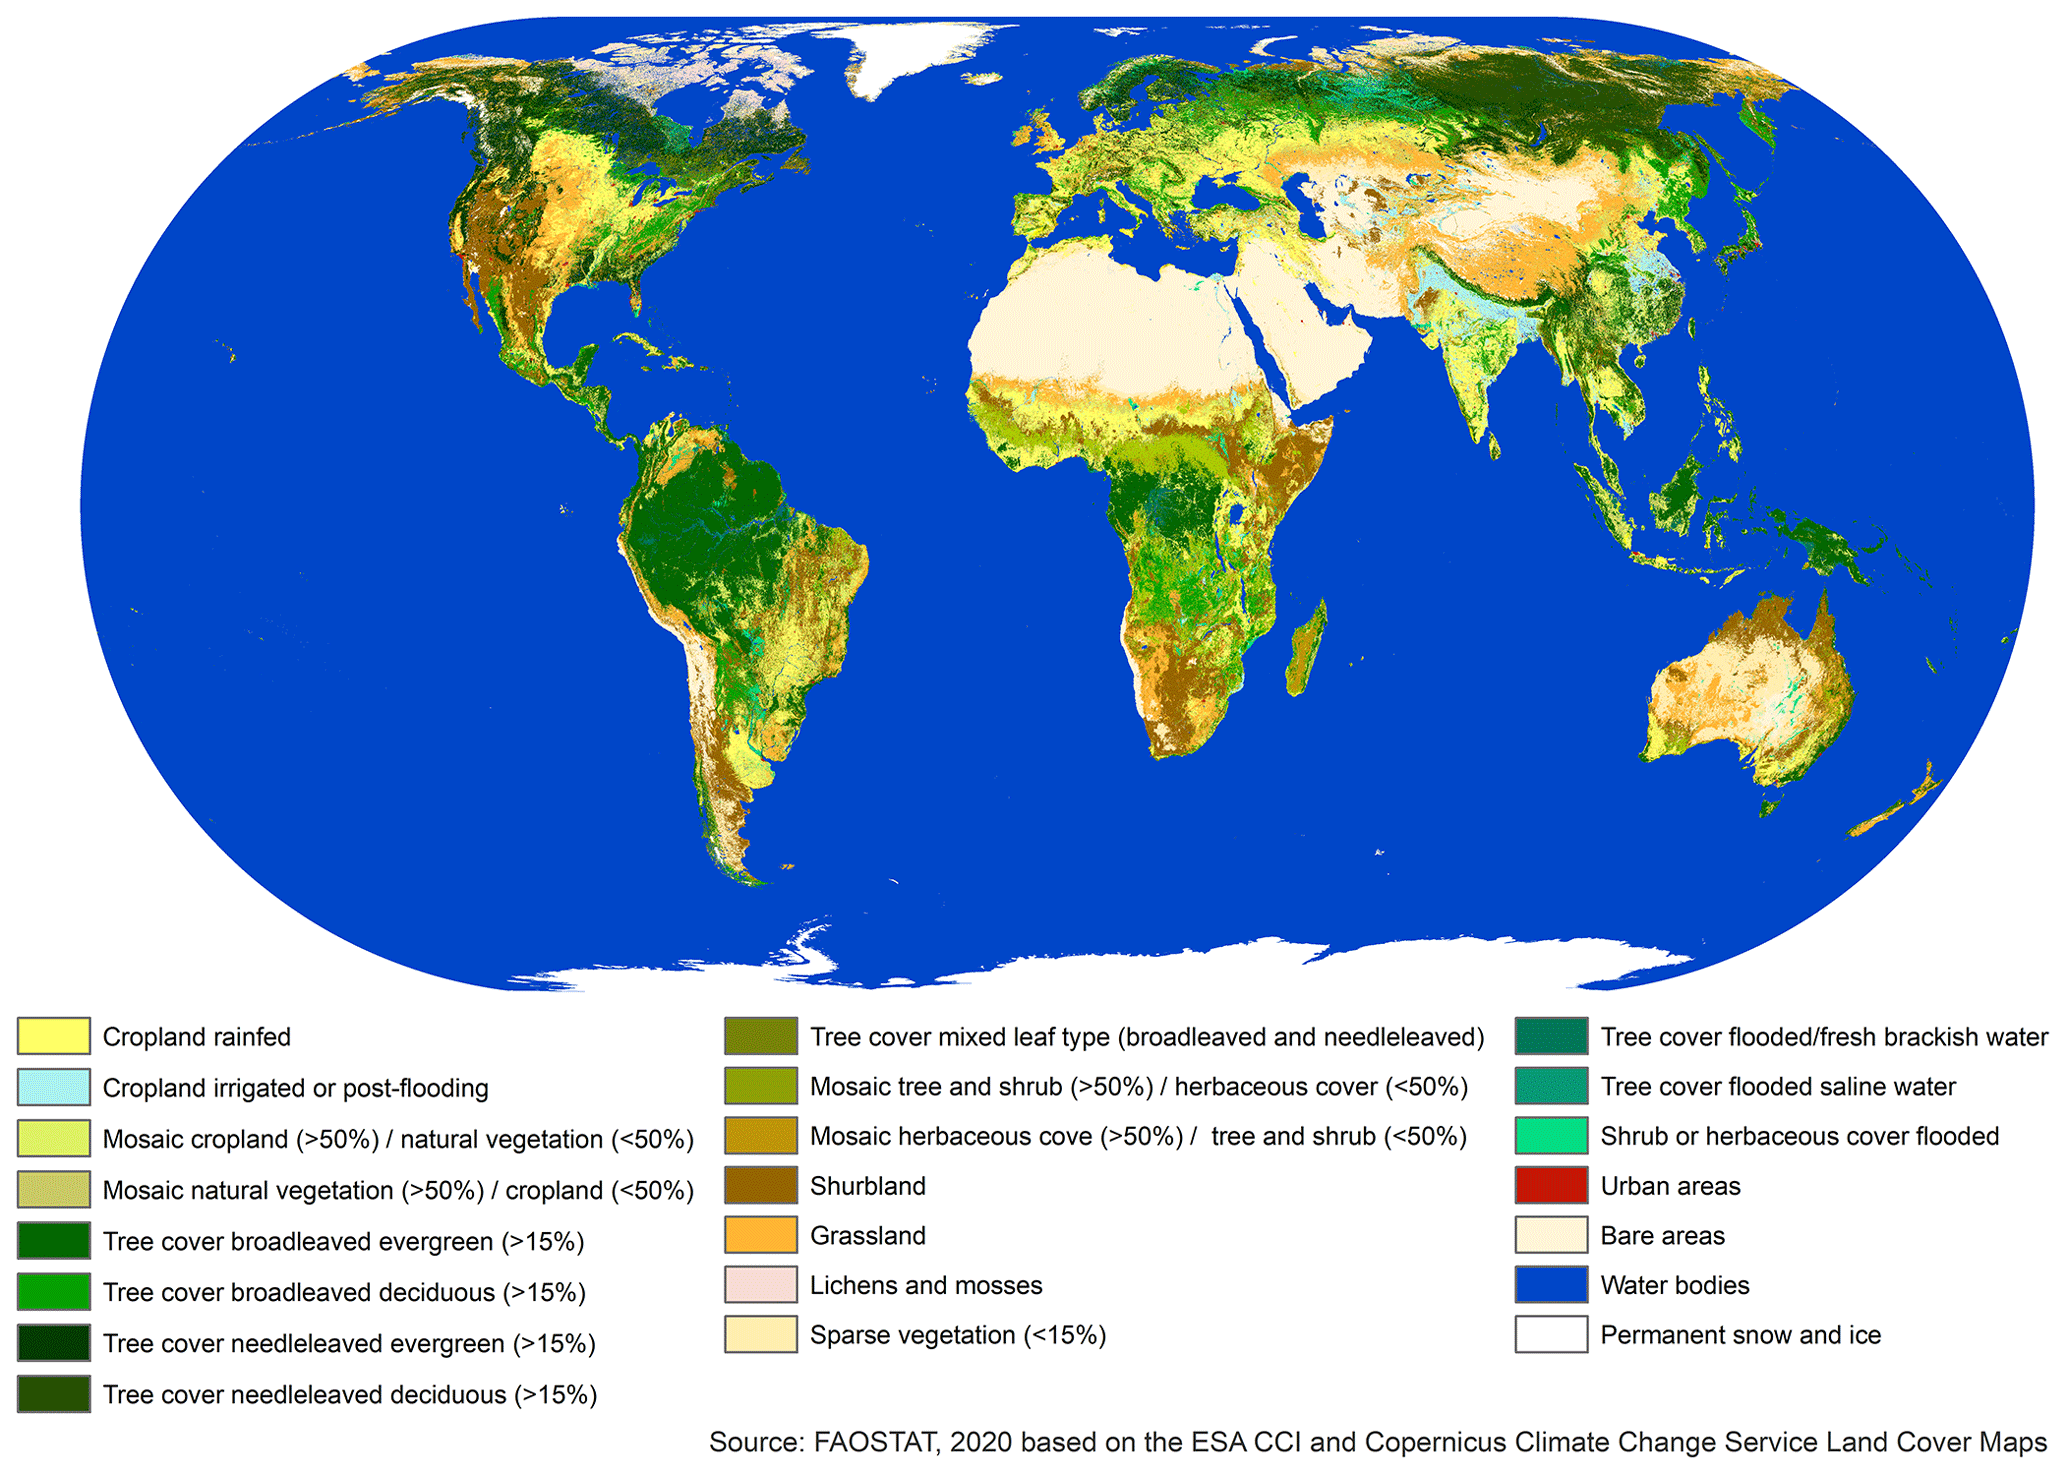
Figure 2Global land cover shown with 1992–2018 composite information from CCI-LC maps (ESA CCI, 2020).
The long-term consistency of this dataset, yearly updates and high thematic detail on a global scale make it uniquely suitable to observe and assess changes in area drained and GHG emissions from organic soils. The CCI LC maps contain information for 22 global land cover classes, based on the FAO Land Cover Classification Systems (Di Gregorio, 2005), with a spatial resolution of approximately 300 m.
The land cover maps (1992–2018) were used to assign to each pixel the proportion of its area under relevant land cover categories. This information was combined to provide proxy information on the proportion of pixel area under land cover and land use classes of cropland and grassland (Tables 1 and 2). To cover the 1990–2019 period of the final FAOSTAT dataset, the 1992 land cover values are carried backwards to 1990. Land cover data for 2019 are carried forward to the latest available year (2018).
Table 2Proportion of area of relevant CCI-LC pixels corresponding to land cover grassland.
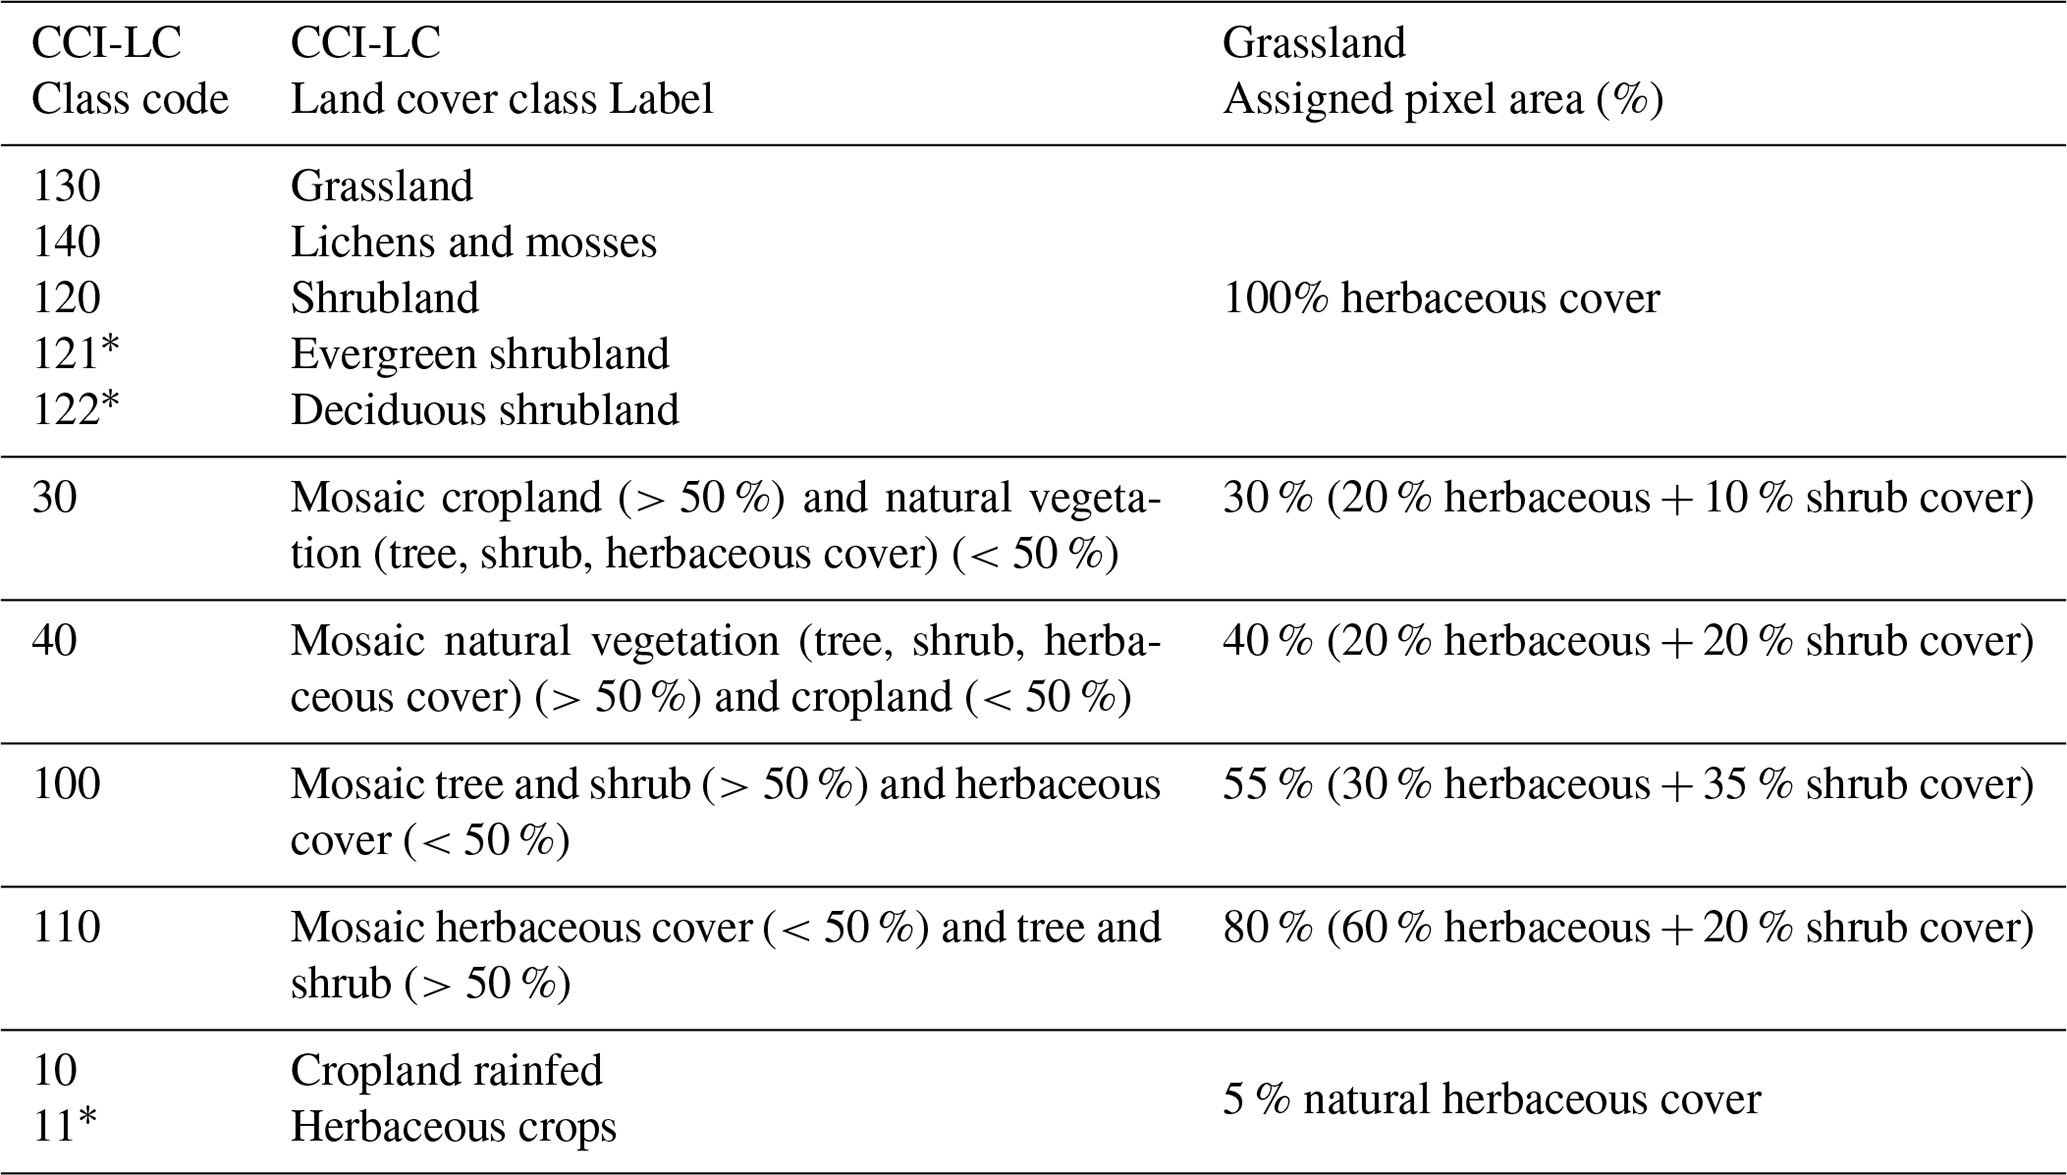
∗ Corresponding to a more detailed classification (Level 2) in CCI-LC maps but with limited geographical availability.
2.3 Livestock
Information on the spatial distribution of livestock for use in estimating the term LDR in Eq. (3) above was taken from the Gridded Livestock of the World (GLW) database (Robinson et al., 2014), providing geospatial data on the density of three ruminant species: cattle, sheep and goats (Fig. 3). Namely, we used version 2.1 of the GLW maps, with 1 km resolution and 2010 as the reference year. Animal numbers by pixel were first converted in livestock units (LSU) (FAO, 2011), and pixels with values higher than 0.1 (Critchley et al., 2008; Worrall and Clay, 2012) were selected for use in Eq. (3). As this methodology focuses on agricultural land uses, it does not investigate the impacts of wildlife on the organic soils.
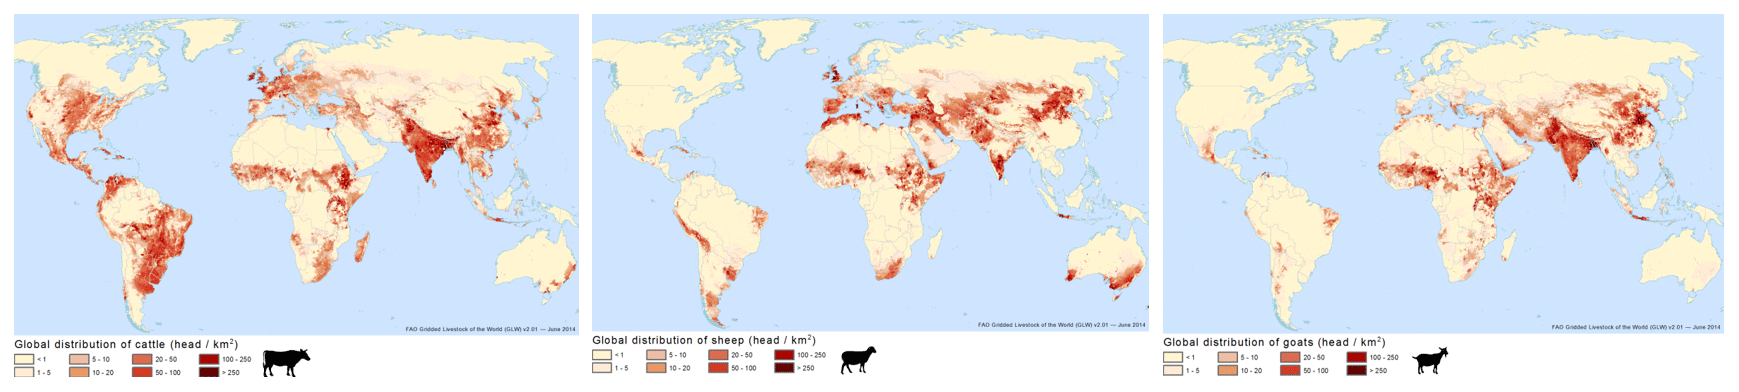
Figure 3Global distributions of cattle, sheep and goats from the Gridded Livestock of the World database (Robinson et al., 2014).
2.4 Climatic zones and emission factors
As discussed above, pixel-level climatic information for use in the term EFijk in Eq. (1) was derived from a map of climatic zones (JRC, 2010). The Joint Research Centre (JRC) of the European Commission developed this spatial layer in line with IPCC specifications based on latitude and elevation of each pixel (Fig. 4).
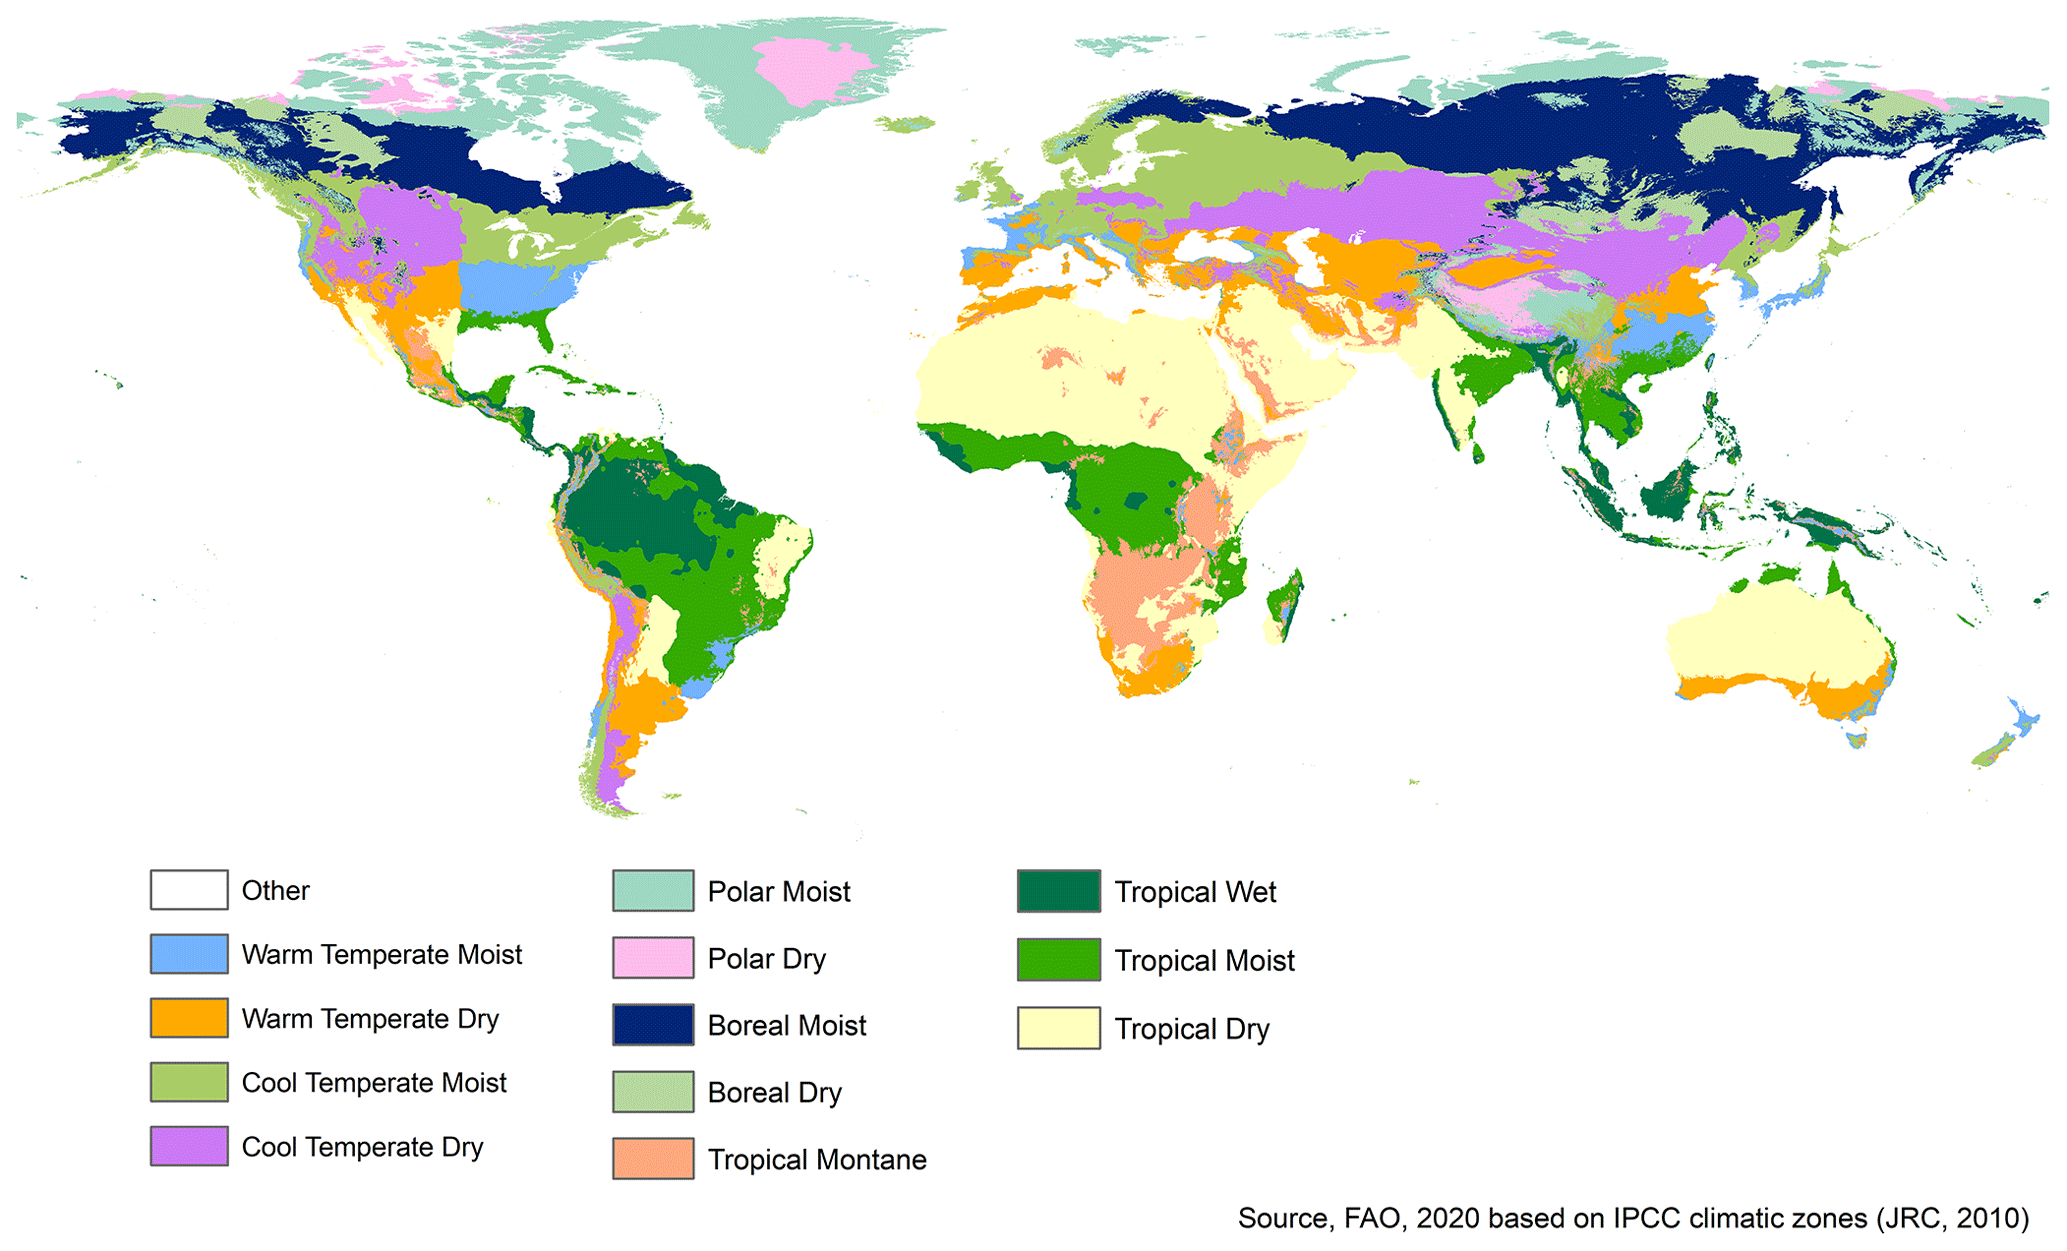
Figure 4Climatic zones based on IPCC classification (JRC, 2010).
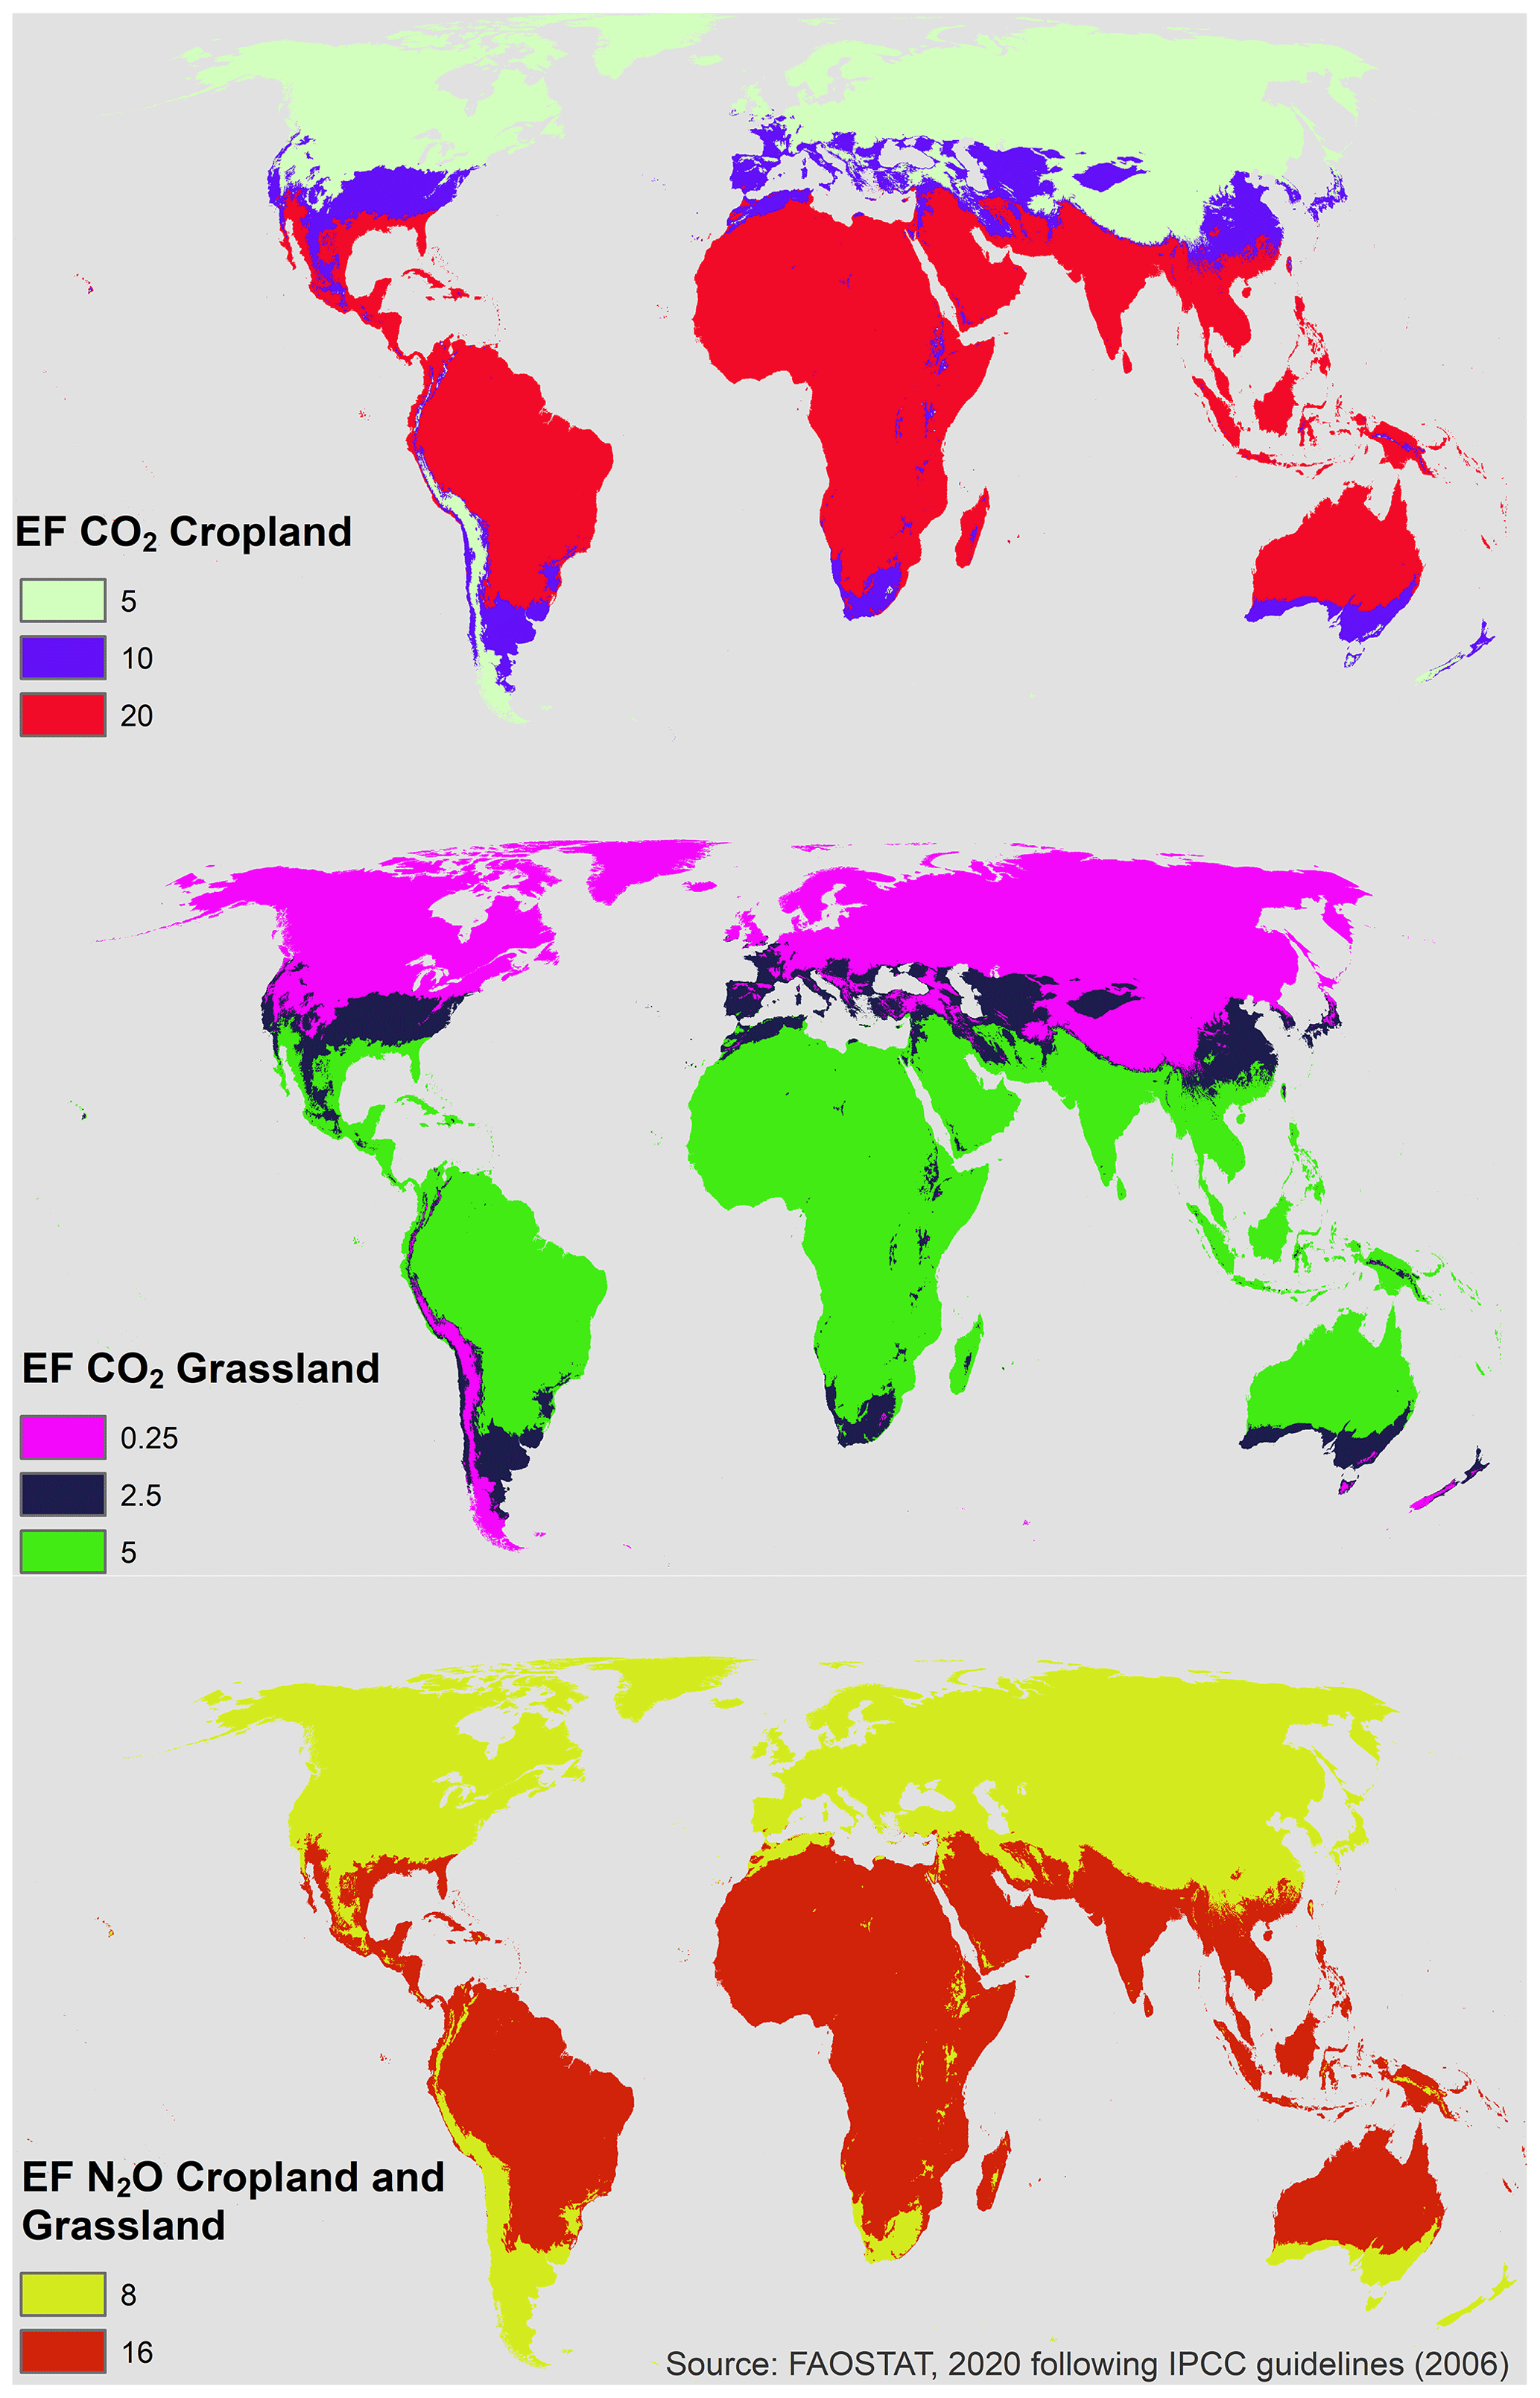
Figure 5Spatial layers of emission factors from the IPCC (2006) by gas, land use and climatic zone.
Default IPCC emissions factors by land use and gas (Table 3) were then assigned by pixel to each climatic zone, and three additional geospatial layers were produced to cover possible combinations of EFs (Fig. 5). As one country may encompass more than one climatic zone, when emissions are aggregated at national level in FAOSTAT, the resulting emissions factors represent weighted averages of the various EFs assigned at pixel level. In computations, CO2-C losses are converted to CO2 values multiplying by 44∕12 while N2O emissions are calculated multiplying N2O-N values by 44∕28.
Table 3IPCC default emission factors assigned by gas and climatic zonea.
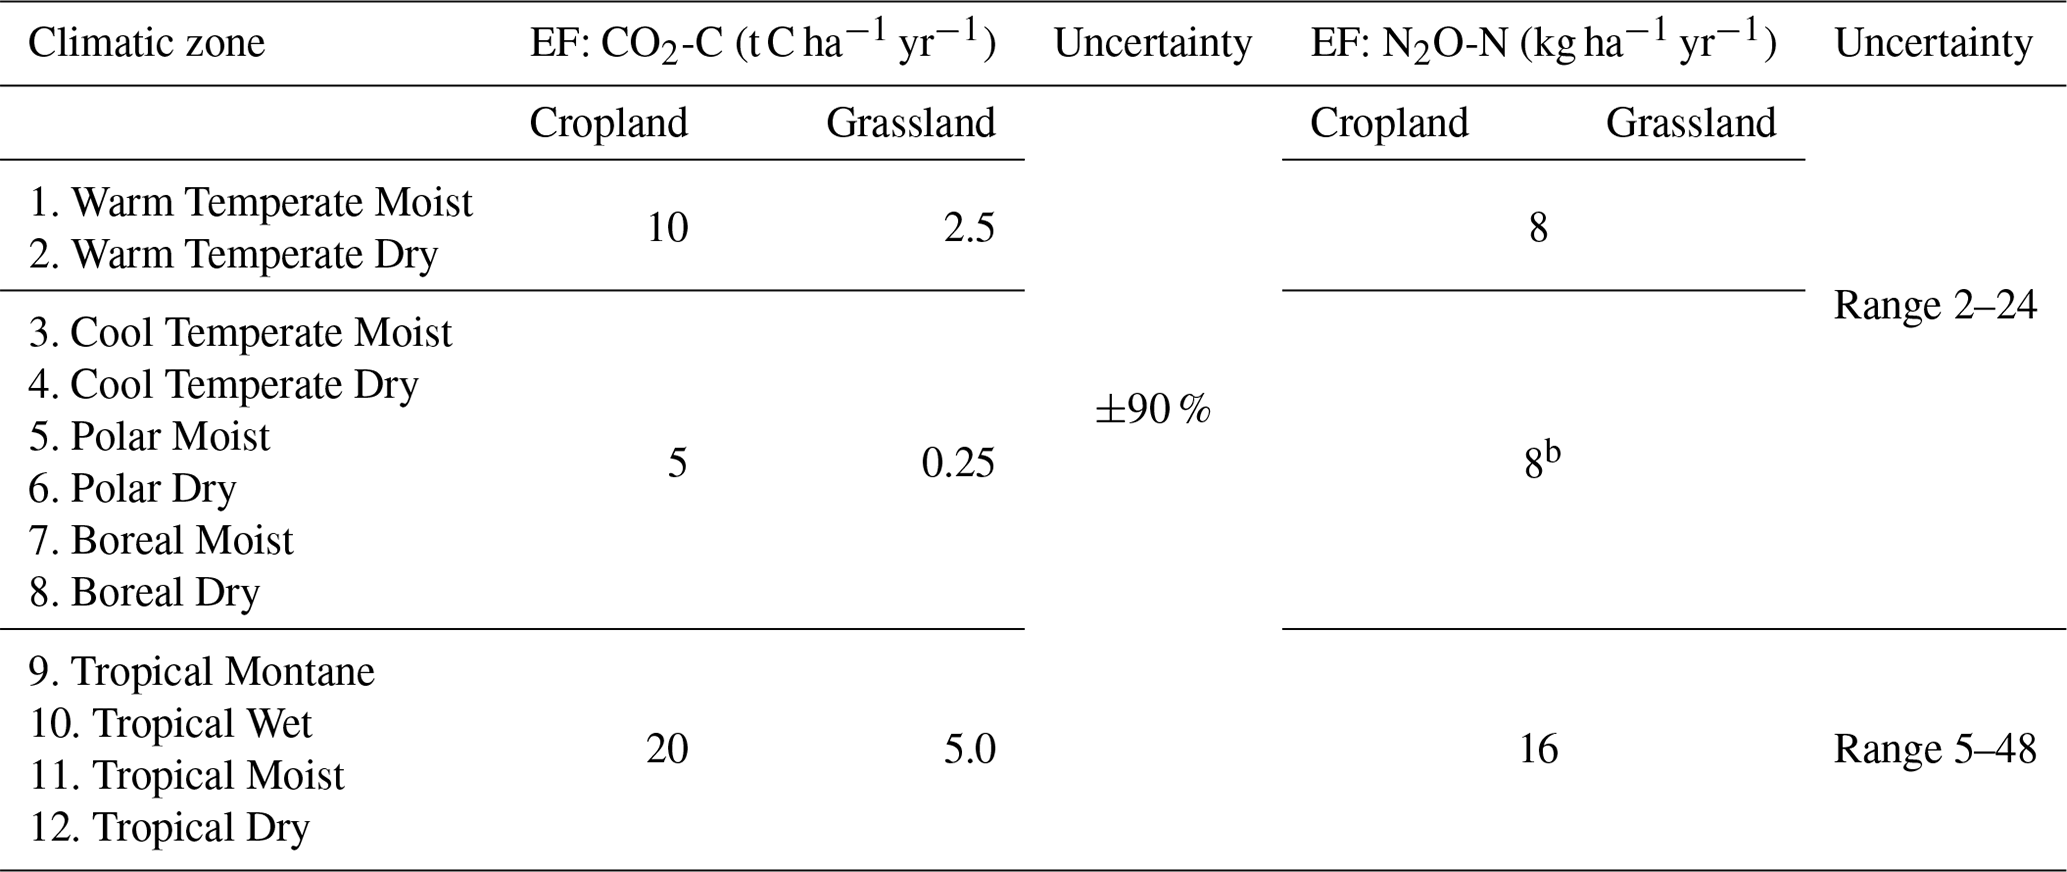
a Adapted from Table 5.6, Table 6.3 (for CO2) and Table 11.1 (for N2O) of IPCC (2006). b Default value not included in IPCC (2006) and is assumed to be equal to EF values for Cool Temperate zones.
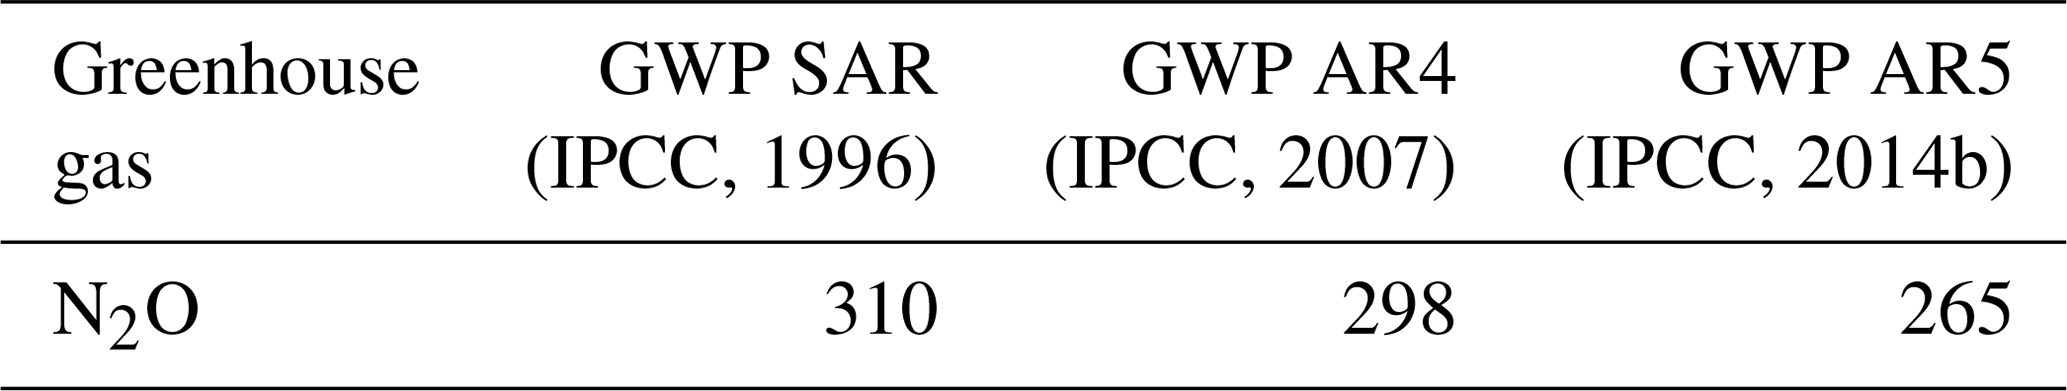
Table 4Global warming potential (GWP) relative to CO2 (dimensionless).
2.5 Structure of the FAOSTAT datasets on organic soils
Results from the spatial computation are aggregated at national level for 101 countries and 4 territories, representing the subset of FAOSTAT countries and territories where organic soils are present. Statistics are disseminated in three separate FAOSTAT domains (FAO, 2020b, c, d), over the period 1990–2019, in line with country-level reporting requirements to the United Nations Framework Convention on Climate Change (UNFCCC) and following the IPCC (2006). Namely, statistics are disseminated by gas and land use class: emissions of N2O on cropland and grassland are disseminated under the domain of Cultivation of Organic soils (FAO, 2020b) of FAOSTAT Emissions – Agriculture domain; whereas emissions of CO2 on cropland (FAO, 2020c) and grassland (FAO, 2020d) are disseminated within the FAOSTAT Emissions – land use domain. As part of ongoing efforts to provide users with reliable and transparent data, the complete spatial dataset that underlies FAOSTAT statistics is available through the new FAO Map Catalog and Geospatial Platform (FAO, 2020e). Under the dataset, Cultivation of Organic soils, N2O emissions are also disseminated in CO2eq by applying three different sets of global warming potential (GWP) coefficients (100-year time horizon) from the IPCC assessment reports: (a) IPCC Second Assessment Report (IPCC, 1996), (b) IPCC Fourth Assessment Report (IPCC, 2007) and (c) IPCC Fifth Assessment Report (IPCC, 2014b) (Table 4).
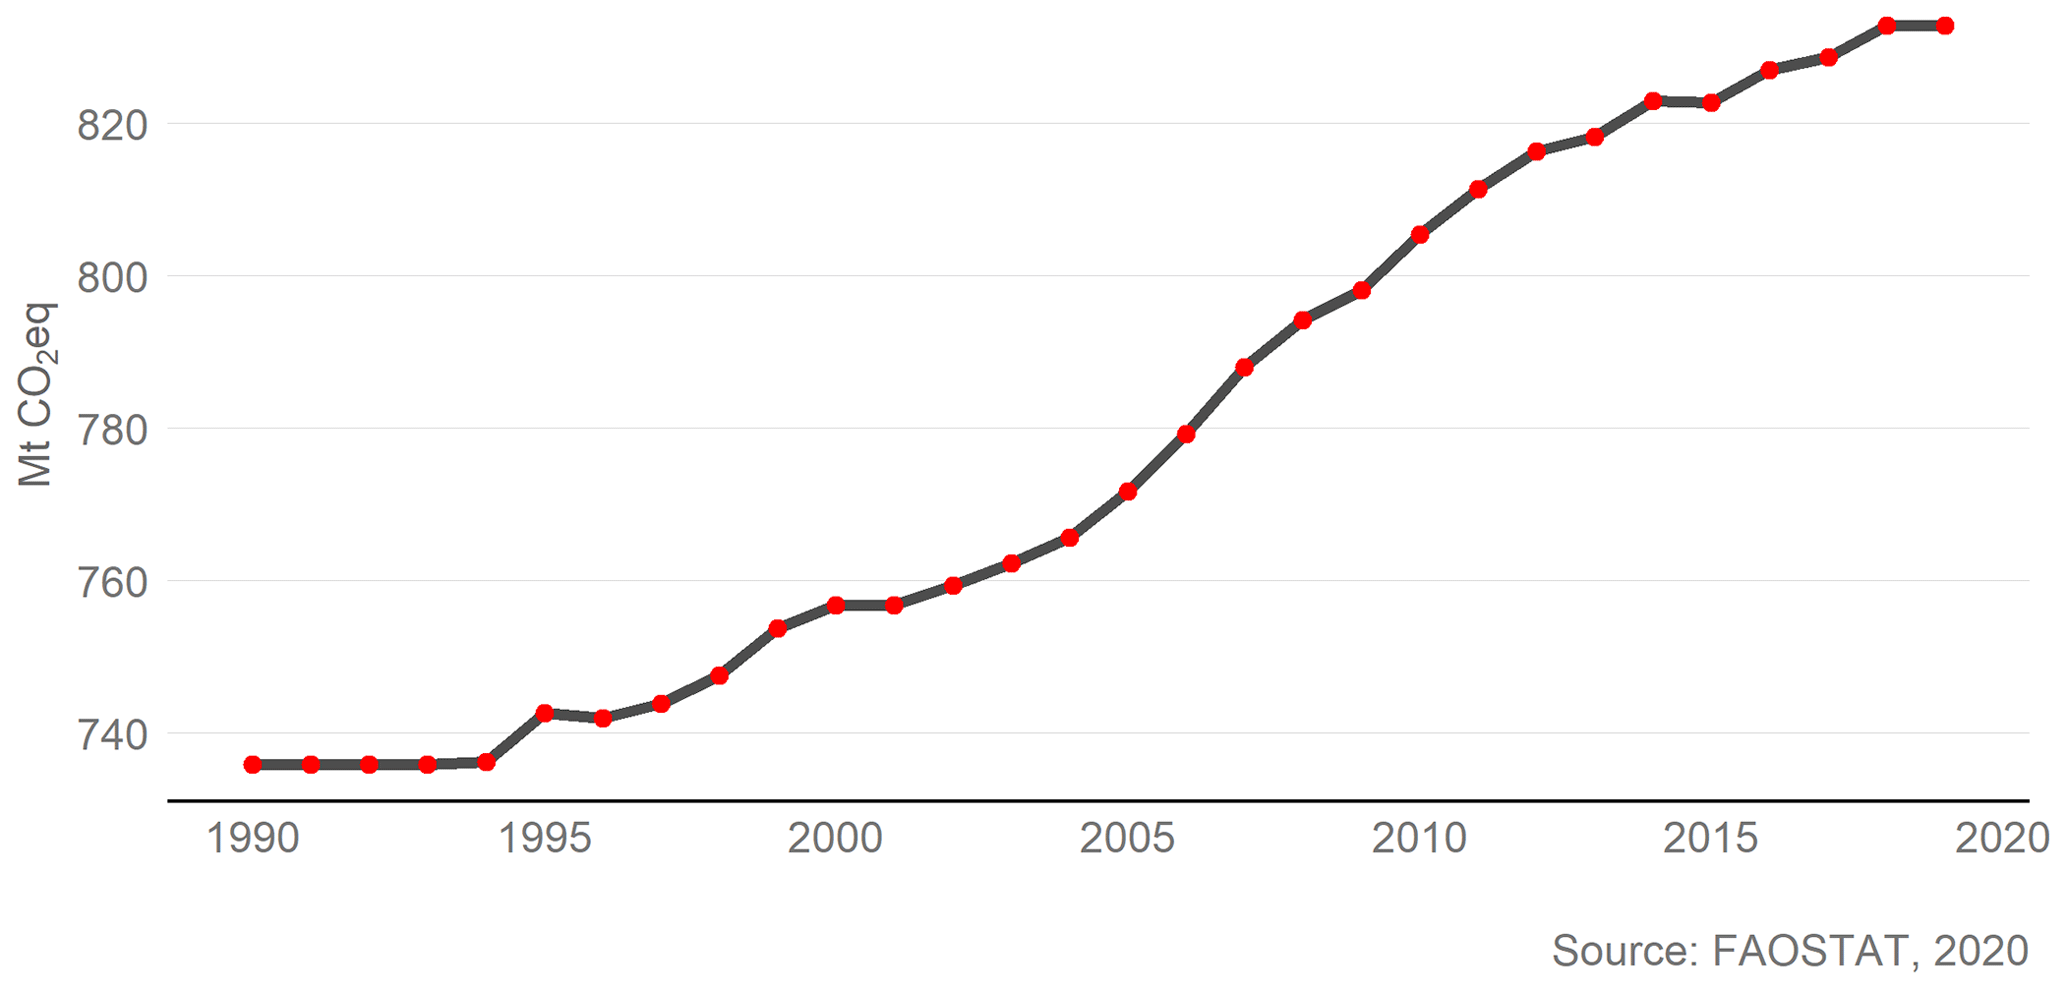
Figure 6Global emissions from drained organic soils from 1990–2019.
In 2019, nearly 25 Mha or about 7.5 % of the 328 Mha of worldwide histosols had been drained for agriculture with a limited increase since 1990. Data suggest that the largest extent of organic soils in North America and eastern Europe have undergone little change during the past decades, likely because these peats have been drained for agriculture for many centuries already (Joosten and Clarke, 2002). The drainage of organic soils is instead a more recent phenomenon in Southeast Asia. In this region, the drained area has grown by 5 % since 1990, and in 2019 more than 26 % of the original organic soils were already drained. Asia is on average the region with the highest share of drained histosols (30 %), while at a sub-regional level western Europe had over two-thirds of its organic soils already drained in 1990.
In 2019, global GHG emissions from drained cropland and grassland organic soils were 833 Mt CO2eq, calculated applying AR5 GWP for the N2O emissions (IPCC, 2014b). They were 13 % and 10 % higher when compared to 1990 and 2000, respectively, representing 8 % of total agriculture and related land use emissions (Fig. 6). In 2019, CO2 and N2O contributed 87 % and 13 % of global emissions. Grassland organic soils were responsible for about 10 % of these emissions, while the vast majority was due to the drainage for cropping. These relative contributions have changed little since 1990 (Appendix A, Table A1).
In 2019, among countries where the area of histosols is above 1 Mha (see Appendix A, Table A2), the largest proportions of drained organic soils were in Mongolia (over 80 %), Germany (75 %), Poland (60 %), United Kingdom and Belarus (about 50 %). Nearly one-fourth of the original extent was drained in Indonesia and Zambia, and 30 % was drained in Malaysia. In 2019, Indonesia had the largest area of drained organic soils (newly 5 Mha), followed by the Russian Federation (about 1.9 Mha) and the United States of America (nearly 1.6 Mha). Among these top 10 countries, Indonesia and Malaysia also registered the largest relative increases in area drained since 1990 (+5 and +10 % for Indonesia and Malaysia, respectively). In 2019, three-fourths of the global emissions from organic soils were from only 11 countries (Fig. 7), Malaysia and Indonesia together were responsible for nearly half (47 %) of total emissions.

Figure 7Top 10 countries by emissions from drained organic soils (75 % of global emissions).
Previous work had estimated the uncertainty of our estimates at ±40 % for the area information and an uncertainty range (−14 %, +166 %) for the emission estimates. These uncertainties, valid at pixel level, were assumed to also characterize the nationally aggregated values (Tubiello et al., 2016) and may be extended to this revision. Importantly, while this methodology focuses on the impact of drainage on agricultural organic soils, it should be acknowledged that peat degradation may occur under other land uses, such as in forest soils. In earlier papers we presented our work on peat fires and their role on global GHG emissions (Rossi et al., 2016; Prosperi et al., 2020) and disseminated the associated statistics in FAOSTAT (FAO, 2020f). This component is, however, not part of the present discussion.
The methodology developed herein may result in some cases in reduction in the drained area of organic soils during the 30 years of the analysis (see Appendix A, Table A2). In such cases, the pixel-level proportions that are applied to identify the cropland and grassland cover have thus detected corresponding changes in land cover. However, the lack of information on rewetting and the scale of this analysis prevent an understanding of whether these changes actually happened in the area of organic soils as a result of rewetting of the drained peats or are instead an artifact of the spatial methods.
The IPCC introduced with the 2013 Wetlands Supplement additional methodological guidance on inland drained organic soils (IPCC, 2014a), with a specific focus on the rewetting and restoration of peatland that was not included in the 2006 guidelines. However, limited country-specific activity data on rewetting prevented us from implementing the Supplement-refined methods in this methodology.
Table 5Emission factors (EFs) for inland drained organic soils by land use and gas, in the 2013 Wetlands Supplement (IPCC, 2014a) and percentage variations from the corresponding EFs in the IPCC (2006) Guidelines.
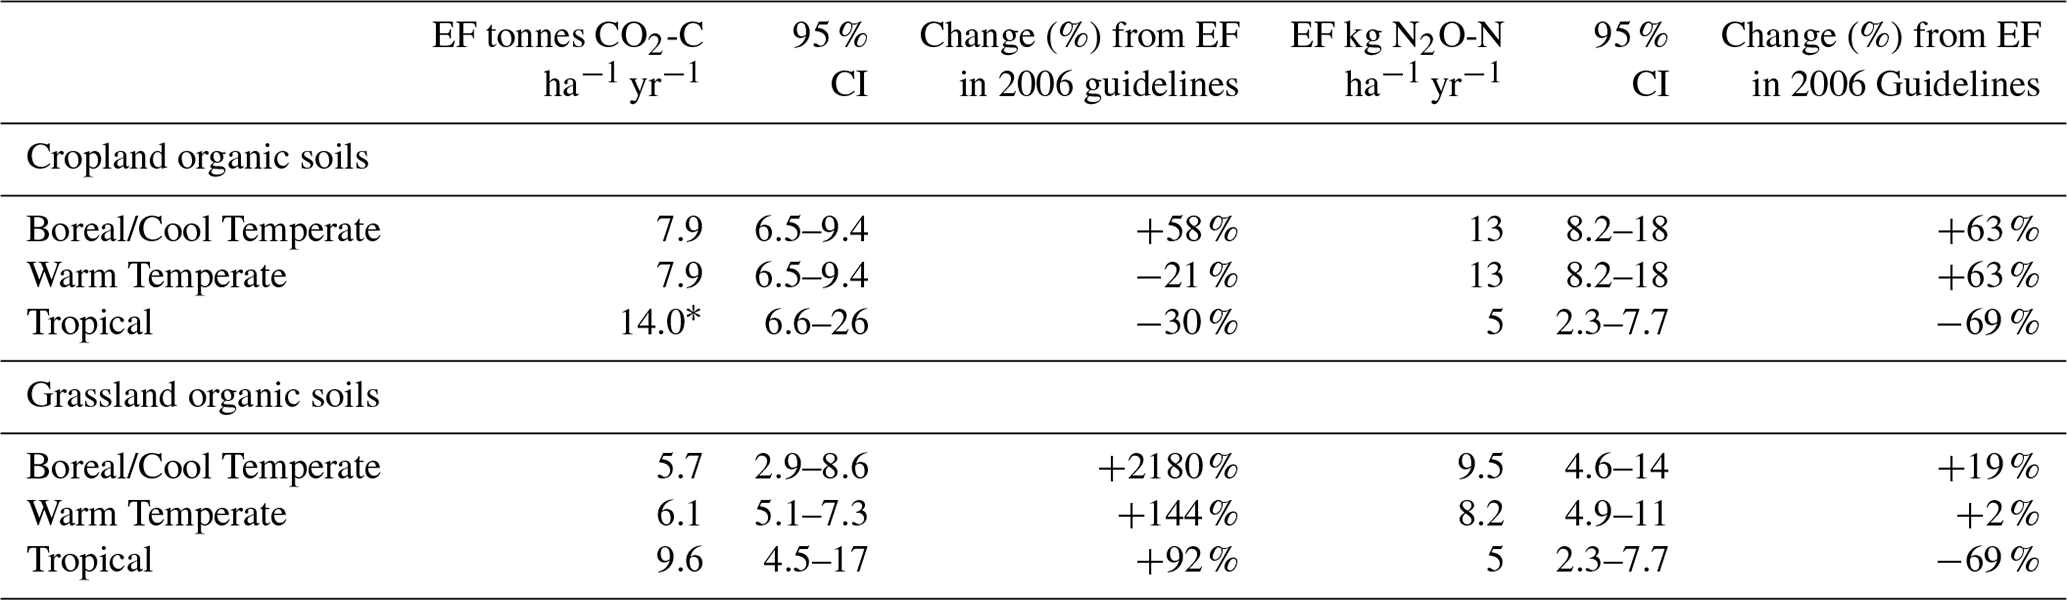
∗ Corresponding to category Cropland and fallow or drained. This was reported as a general EF in the absence of additional information on cropland type.
We estimated that by applying the revised EFs for C and N2O (Table 5) from the Supplement on Wetlands (IPCC, 2014a) to our methodology, the global emissions from agricultural drained organic soils in 2019 would be 883 Mt CO2eq, thus about 6 % more than estimated using the EFs from the 2006 guidelines (see Appendix A, Table A3). This figure would be the result ceteris paribus of the downward revision of both C and N2O EFs for cropland organic soils in the tropics, combined with the large upward revision of grasslands C and N2O EFs in the boreal and temperate zones. In addition, C emissions from grassland organic soils in the tropics would increase about twofold with the revised EFs, whereas N2O emissions would decrease threefold. Thanks to the new scientific evidence, the uncertainty of the EFs in the Supplement on Wetlands are overall smaller than in the 2006 guidelines (Table 5) but remain very large (47 %–186 %) for the main component of emissions – the C emissions from cropland organic soils in the tropics. With the only exception of the estimates for grassland organic soils in boreal and temperate zones, our estimates are well within the range of the uncertainties if the revised EFs from the Supplement on Wetlands were applied to our methodology. It should be noted that the Supplement on Wetlands (IPCC, 2014a) also includes new guidance to estimate the amount of dissolved organic carbon (DOC) that is carried out on ditches in drained peatlands, which was not part of the 2006 guidelines (IPCC, 2006). This was, however, not part of this comparison.
The Tier 1 methods applied in this study do not differentiate between long-term drained organic soils and soils after initial drainage when carbon losses are the highest (Hooijer et al., 2012; IPCC, 2014a). It should also be noted that the progressive soil mineralization associated with prolonged drainage may eventually lead to peat depletion, particularly in shallow soils (Humpenöder et al., 2020). This in turn might affect the scale of emissions, thus adding uncertainty to our current estimates. Country-specific information on the thickness of the organic layer and the depth and length of drainage required to assess the extent of peat depletion worldwide is, however, currently missing.
The FAOSTAT estimates of the extent of organic soils, which are used as input to Eqs. (2)–(3), were compared to published data at country, regional and global levels. Resulting emissions and emissions factors for oil palm plantations are also included to validate FAOSTAT results.
Table 6Comparisons of published global and regional estimates for area of peat and organic soils (km2)a.
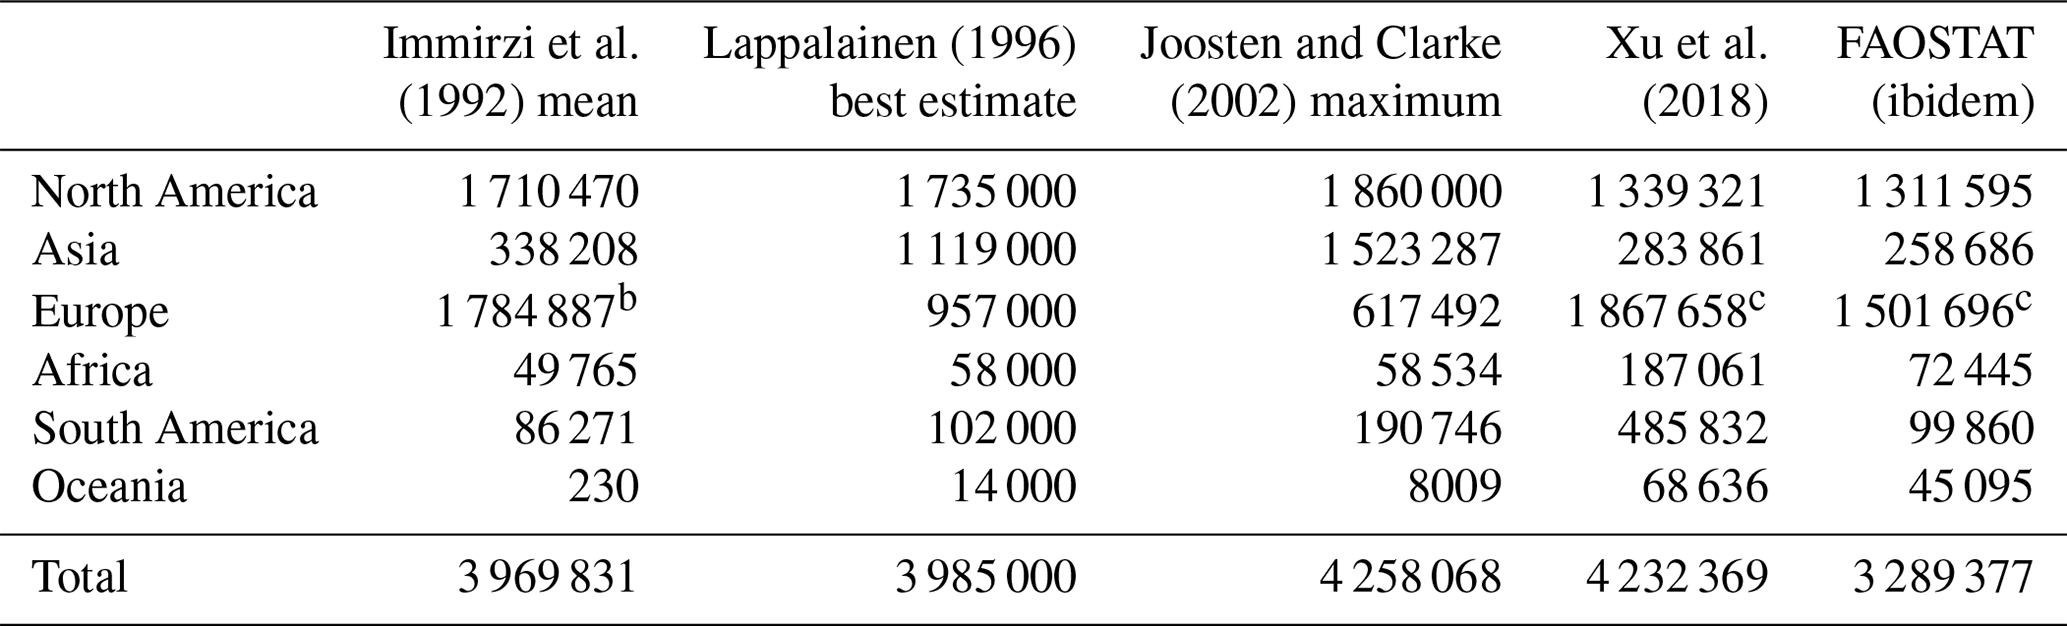
a Adapted and extended from Rieley and Page (2016). b Immirzi et al. (1992) estimates for Europe include the Soviet Union. c Xu et al. (2018) and FAO estimates for Europe include the Russian Federation.
5.1 Area of organic soils and peatlands
Comparison of the extent of drained organic soils is hindered by a number of factors, including the fact that the FAOSTAT data refers to area of organic soils, while a majority of published studies has focused on area of peatlands. The FAOSTAT global estimates of 3.3 million square kilometers (Mkm2) of organic soils (histosols) were 25 % smaller than the published range of 4.0–4.3 Mkm2 of peat soils. This is consistent with statements by Xu et al. (2018), who highlighted that histosols tend to underestimate areas in tropical swamp-forested peatlands. At a regional level, FAOSTAT data agreed well with the most recent estimates of Xu et al. (2018) and mean estimates from Immirzi et al. (1992) (Table 6). In addition, while acknowledging the large differences existing between published estimates by regions, FAOSTAT estimates remained consistently within the observed ranges. More specifically, the FAOSTAT estimate of the area of organic soils for North America was 1.3 Mkm2 vs. a published range of 1.3–1.9 Mkm2; for Asia, FAOSTAT estimated 0.3 Mkm2 vs. a range of 0.3–1.5 Mkm2; for Europe, FAOSTAT estimated 1.5 Mkm2 vs. a range of 0.6–1.9 Mkm2; for Africa, FAOSTAT estimated 0.07 Mkm2 vs. a range of 0.05–0.2 Mkm2; for South America, FAOSTAT estimated 0.1 Mkm2 vs. a range of 0.09–0.5 Mkm2; and for Oceania, FAOSTAT estimated 0.05 Mkm2 vs. a range of 0.00–0.07 Mkm2.
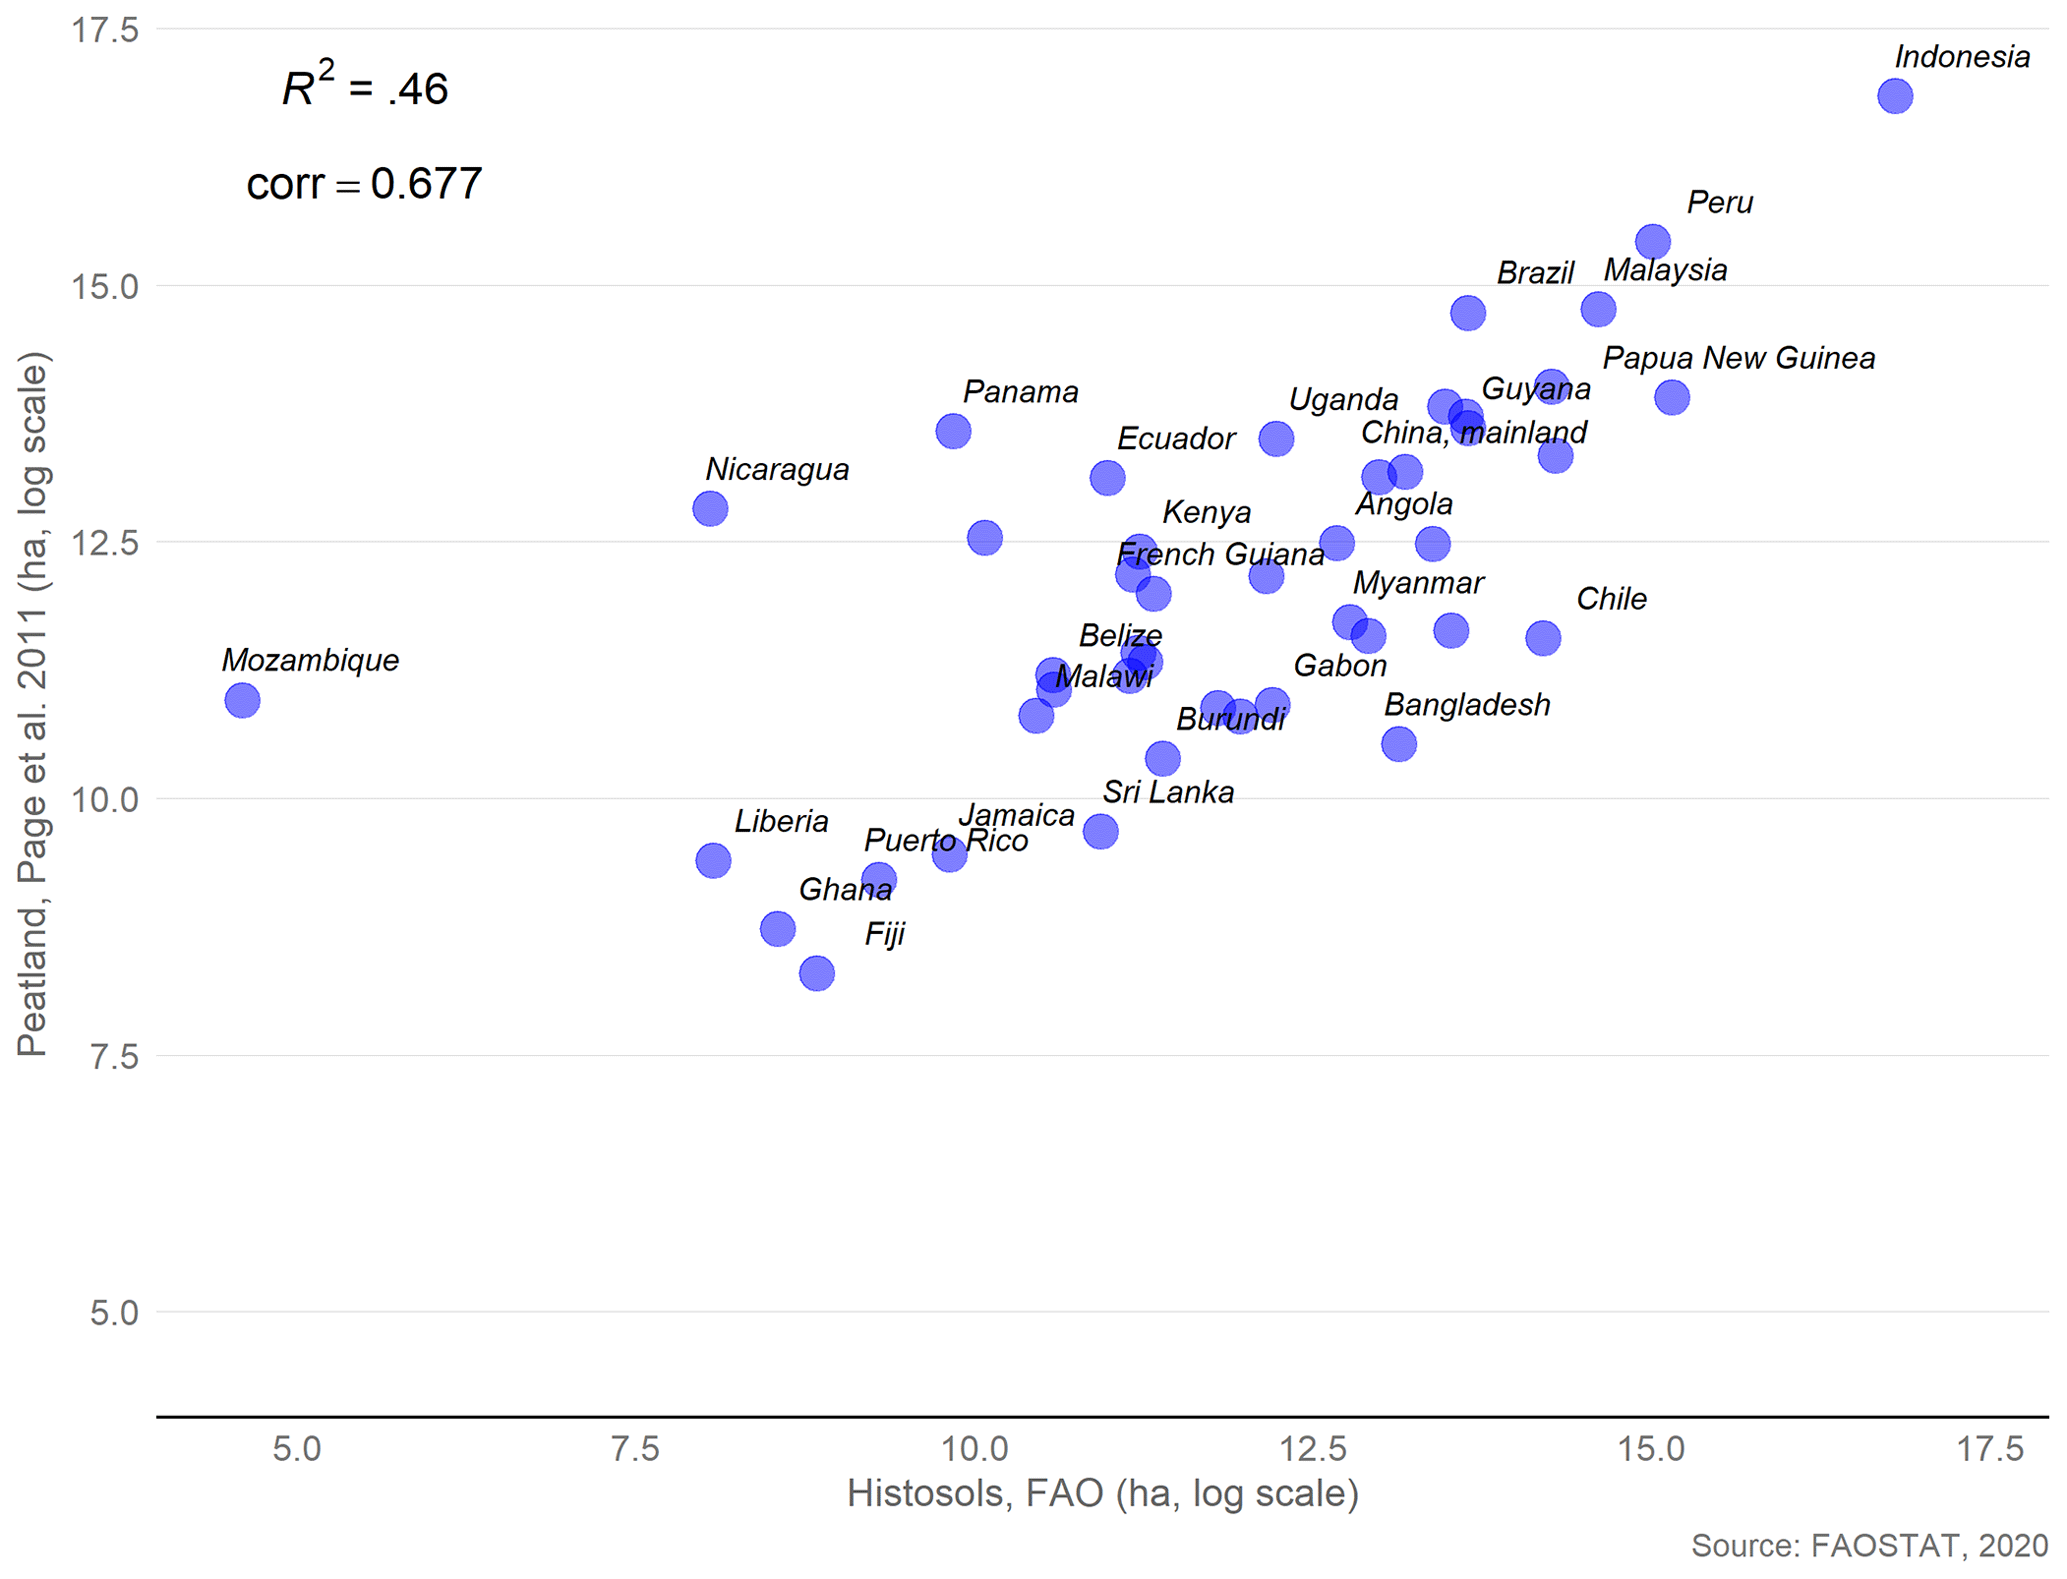
Figure 8Scatterplot of log-transformed area estimates for organic soils (Page et al., 2011) and FAOSTAT.
We continued the validation analysis by comparing FAOSTAT estimates to published data for about 60 tropical countries, compiled from the widely recognized meta-analysis of Page et al. (2011), and for the same set of countries to values computed using a recent map of tropical peat distribution (Gumbricht et al., 2017) (Appendix B, Table B1). In 2017, Gumbricht and associates published new estimates of wetland and peatland areas, depths, and volumes. The expert system approach is based on three biophysical indices related to wetland and peat formation: (1) long-term water supply exceeding atmospheric water demand, (2) annually or seasonally water-logged soils, and (3) a geomorphological position where water is supplied and retained. These authors define peat as any soil having at least 30 cm of decomposed or semi-decomposed organic material with at least 50 % organic matter. At the aggregate level – the sum of area of organic soils in countries covered by Page et al. (2011) – the extent of tropical organic soils estimated by FAOSTAT was 0.43 Mkm2, which compared well with the value of 0.44 Mkm2 of Page, but both estimates are about a third of the total reported in Gumbricht et al. (2017) (1.37 Mkm2). The following factors may contribute to explain the discrepancy observed with Page et al. (2011). Firstly, the expert model of Gumbricht et al. (2017) does not account for soil lithology and composition other than through soil wetness responses and the assessment of the hydrological conditions suitable to peat storage measured primarily through elevation data, soil moisture (phenology) and climate. Secondly, while Gumbricht et al. (2017) report that mangroves are considered to meet the criteria of depth and organic matter content needed for peat definition, these authors acknowledge that mineral soils may prevail in mangroves and that additional ground-truthing is needed to validate if mangroves contain peat as defined in their expert system.
At the country level, FAOSTAT estimates agreed well with data published by Page et al. (2011) (R=0.677, p<0.001). For a 1 % increase in the area of histosols, the log-transformed model shows about a 5.5 % increase in the area of peat as mapped by Page and colleagues (R2=0.458) (Fig. 8). The largest differences were found in countries from south and central America – where special formations at high altitudes and dry conditions, known as paramos, may be poorly captured as histosols (Lähteenoja et al., 2012). FAOSTAT and Page et al. (2011) data were in very close agreement for key global contributors in Southeast Asia, Indonesia (0.20 vs. 0.21 Mkm2) and Malaysia (0.02 vs. 0.03 Mkm2).

Figure 9Scatterplot of area estimates for organic soils in published data (Gumbricht et al., 2017) and FAOSTAT. Data have been log-transformed to avoid dependence on a few large vales.
FAOSTAT country-level estimates were, albeit to a lesser degree, also in good agreement with those obtained by aggregating geospatial information from Gumbricht et al. (2017) (R=0.541, p<0.0005). FAOSTAT histosols, however, only partially explain the variability in the peat area as mapped by these authors. (R2=0.293) (Fig. 9). For a 1 % increase in the area of histosols, the log-transformed model shows a 8 % increase in the area of peat as mapped by Gumbricht et al. (2017). Significant differences between FAOSTAT and this second, independent set of observed data included Brazil, where Gumbricht et al. (2017) estimated 0.31 Mkm2 of organic soils, nearly 40 times the area estimated in FAOSTAT and more than 10 times the area published in Page et al. (2011); Peru, where Gumbricht et al. (2017) indicate some 0.08 Mkm2, twice the FAOSTAT estimates and 0.02 Mkm2 more than Page et al. (2011); and the Democratic Republic of Congo, where the new peatland map suggests a significant presence of organic soils (0.12 Mkm2), consistent with recent studies (Dargie et al., 2017), while FAOSTAT estimated only 240 km2 and Page et al. (2011) estimated less than 3000 km2.
The use of observed or estimated data is hampered by the wide uncertainties that still exist in defining, mapping and measuring the actual extent of peatland throughout the world. To date, no globally accepted definition of peatland exists. To this end, ongoing international efforts such as the Global Peatlands Initiative (2020) are expected to improve and consolidate current knowledge.
5.2 Validation with country data reported to the Climate Convention of the United Nations
The FAOSTAT data use Eqs. (2)–(3) to overlay information on organic soil extent with information on land use and other geospatial characteristics, in order to estimate the drainage area of organic soils due to agriculture (Tubiello et al., 2016). These were in turn used as input to estimate resulting GHG emissions. We used data reported by countries to the UNFCCC for validation of these FAOSTAT estimates. We looked both at data from the 2019 National Greenhouse Gas Inventories (2017 as last available year in the data) of the Annex I Parties and to the most recent (2018) national communication from Indonesia, a top emitter country.
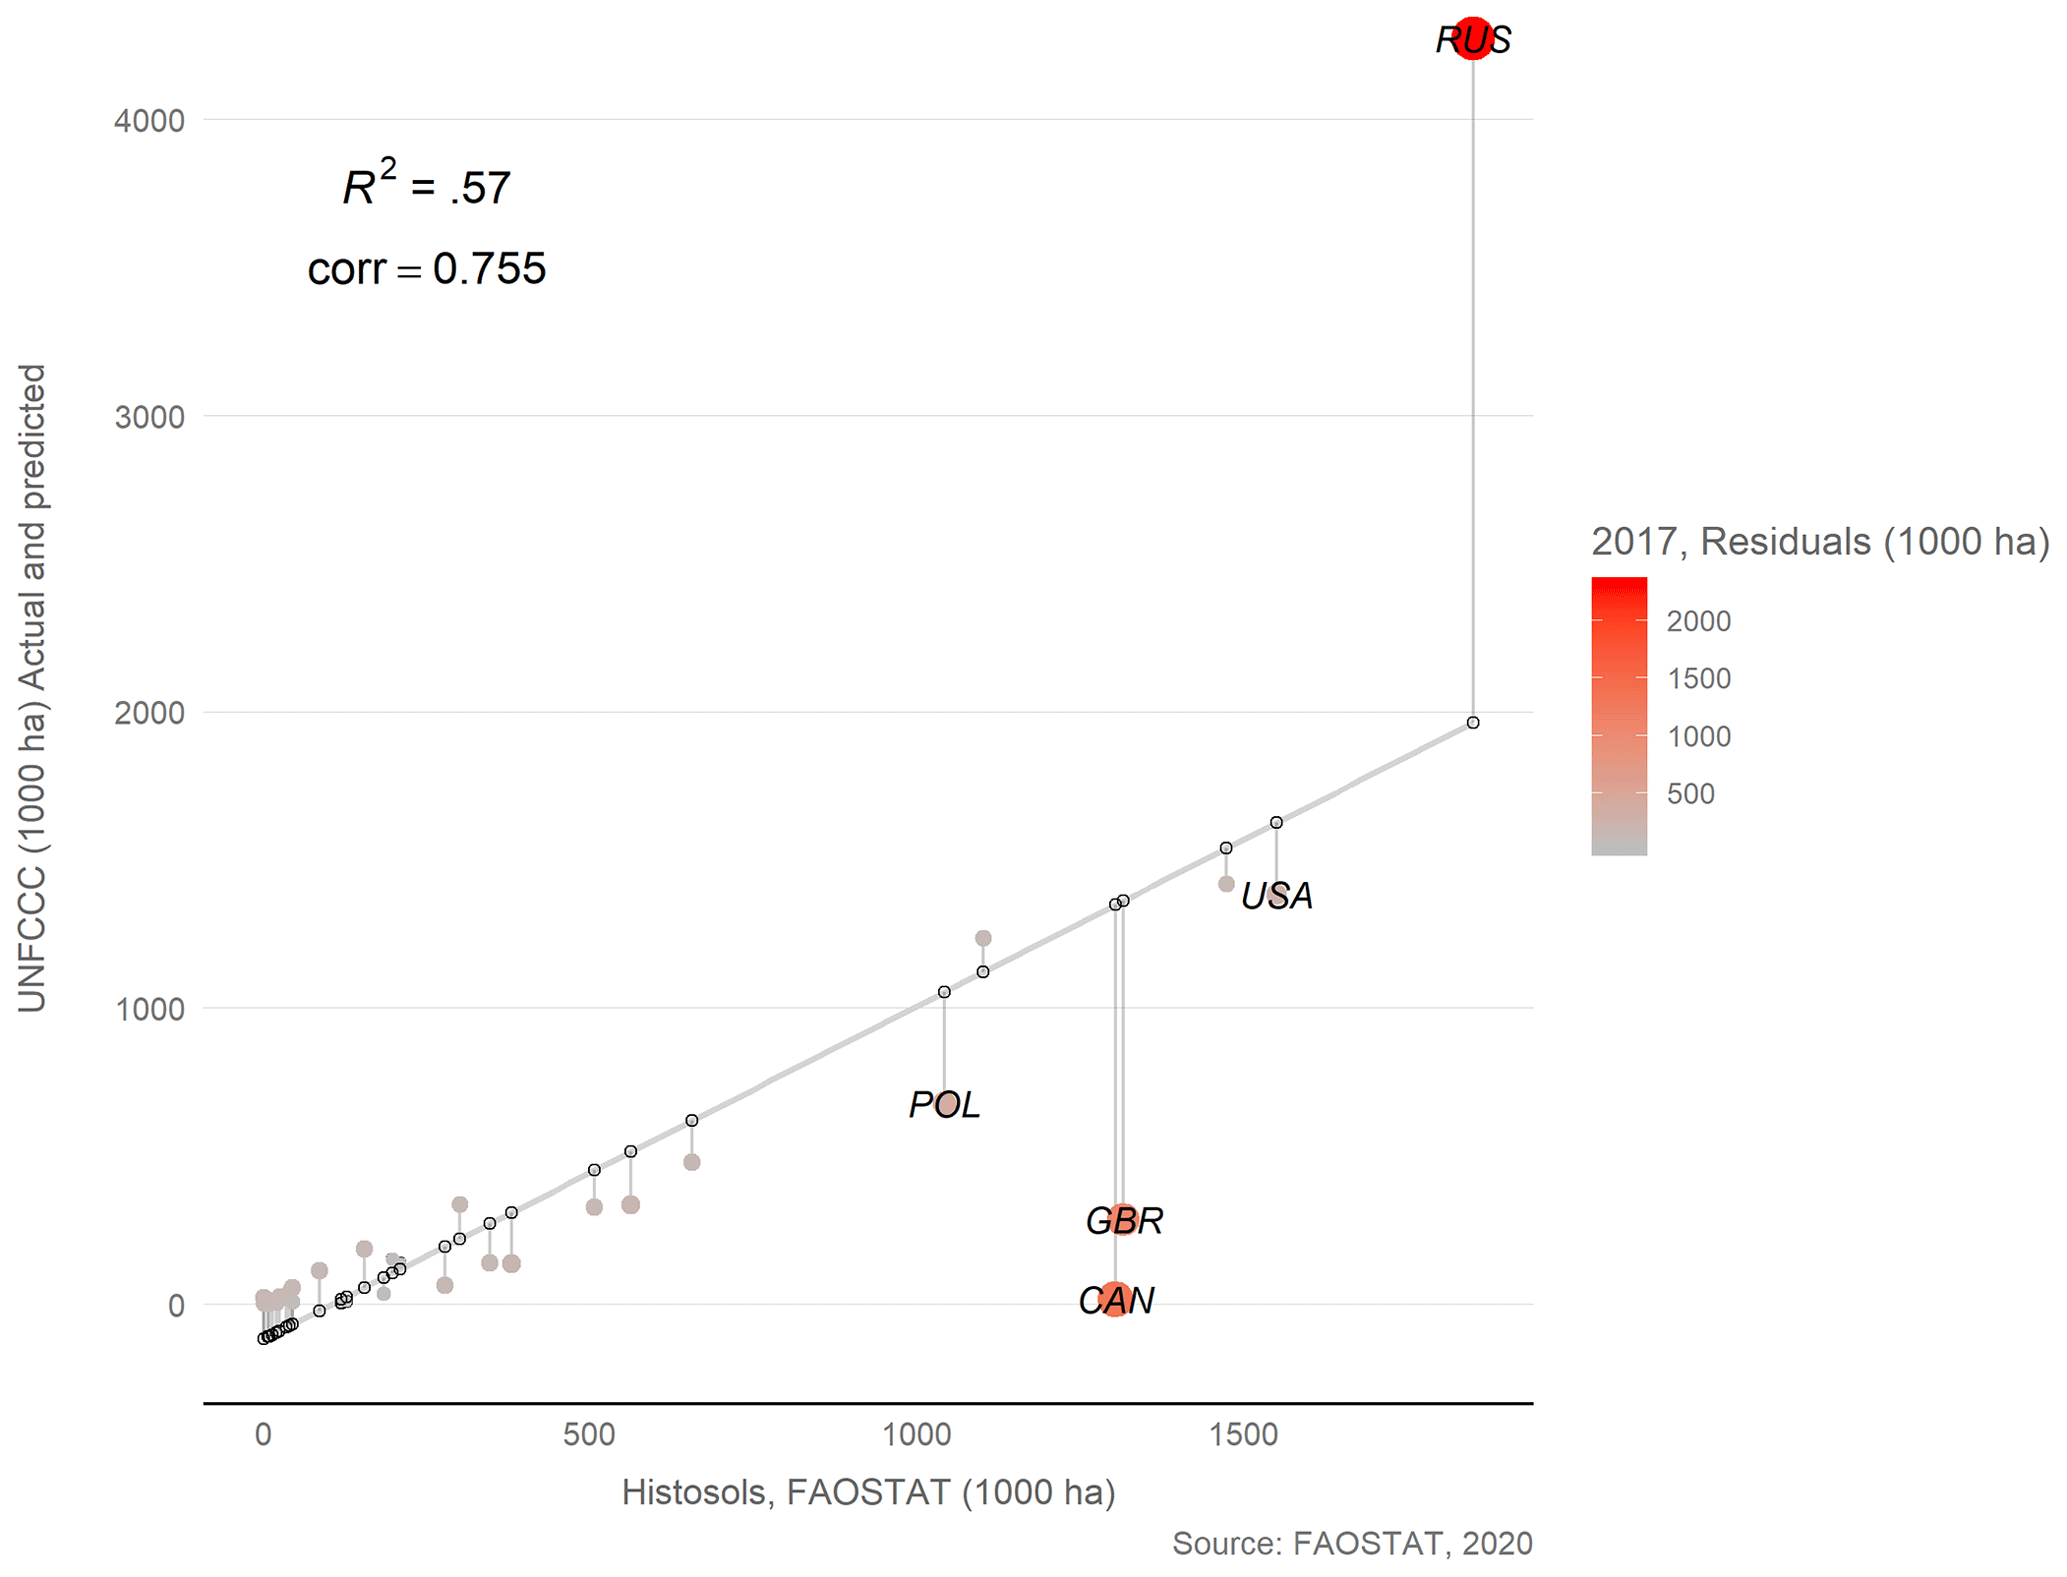
Figure 10Comparison of FAOSTAT estimates of drained organic soils area vs. official country data reported to UNFCCC (year 2017). Distance from predicted (on the fitted line) and actual data.
5.2.1 Annex I parties
UNFCCC data were available for 38 countries belonging to the Annex I parties to the Climate Convention (2019 inventories, 2017 last reported year). These represent developed countries that are mostly located in temperate and boreal zones of the world. First, we compared data on the area drained (activity data), which allowed us to test assumptions underlying the use of Eqs. (2)–(3) above. FAOSTAT country-level estimates were in good agreement with those officially reported by countries to the UNFCCC (R2=0.57) of area drained of organic soils (Fig. 10). At a regional level, FAOSTAT predicted a total of about 14 Mha of drained organic soils for Annex I parties vs. country-reported figures of nearly 12 Mha for the last inventory in 2017 (Appendix B, Table B2). On the one hand, estimates in several countries with significant contributions were well in line with national reporting, including the United States of America (1.5 vs. 1.4 Mha), Belarus (close to 1.4 Mha in both cases) and Germany (1.1 vs. 1.2 Mha). On the other hand, significant differences were found in Poland (1.0 vs. 0.7 Mha) and in the United Kingdom (1.3 vs. 0.3 Mha). Wide differences also characterized two countries with major organic soil area extent, specifically the Russian Federation (1.8 vs. 4.3 Mha) and Canada (1.3 vs. 0.2 Mha). In these latter cases, differences are in opposite directions. FAOSTAT estimates were much larger than country-reported data in Canada but smaller in the Russian Federation.
For the same set of UNFCCC countries as above, we also compared N2O emissions, which are reported by countries under the IPCC agriculture sector. C fluxes from the drainage of organic soils are instead reported by Annex I countries under Land Use, Land Use Change, and Forestry (LULUCF). In the inventories, relevant reporting categories are 4.B.1 “Cropland Remaining Cropland”, 4.B.2 “Land Converted to Cropland” and 4.C.1 “Grassland Remaining Grassland”, and 4.C.2 “Land Converted to Grassland”. Data for C are much sparser than for N2O emissions possibly due also to complexity in reporting (Barthelmes et al., 2015). Beside the differences in activity data (area drained) that were observed earlier, differences may also be due to countries applying higher tiers than the default methodology we applied in FAOSTAT, as well as due to the definition of land use that causes drainage.
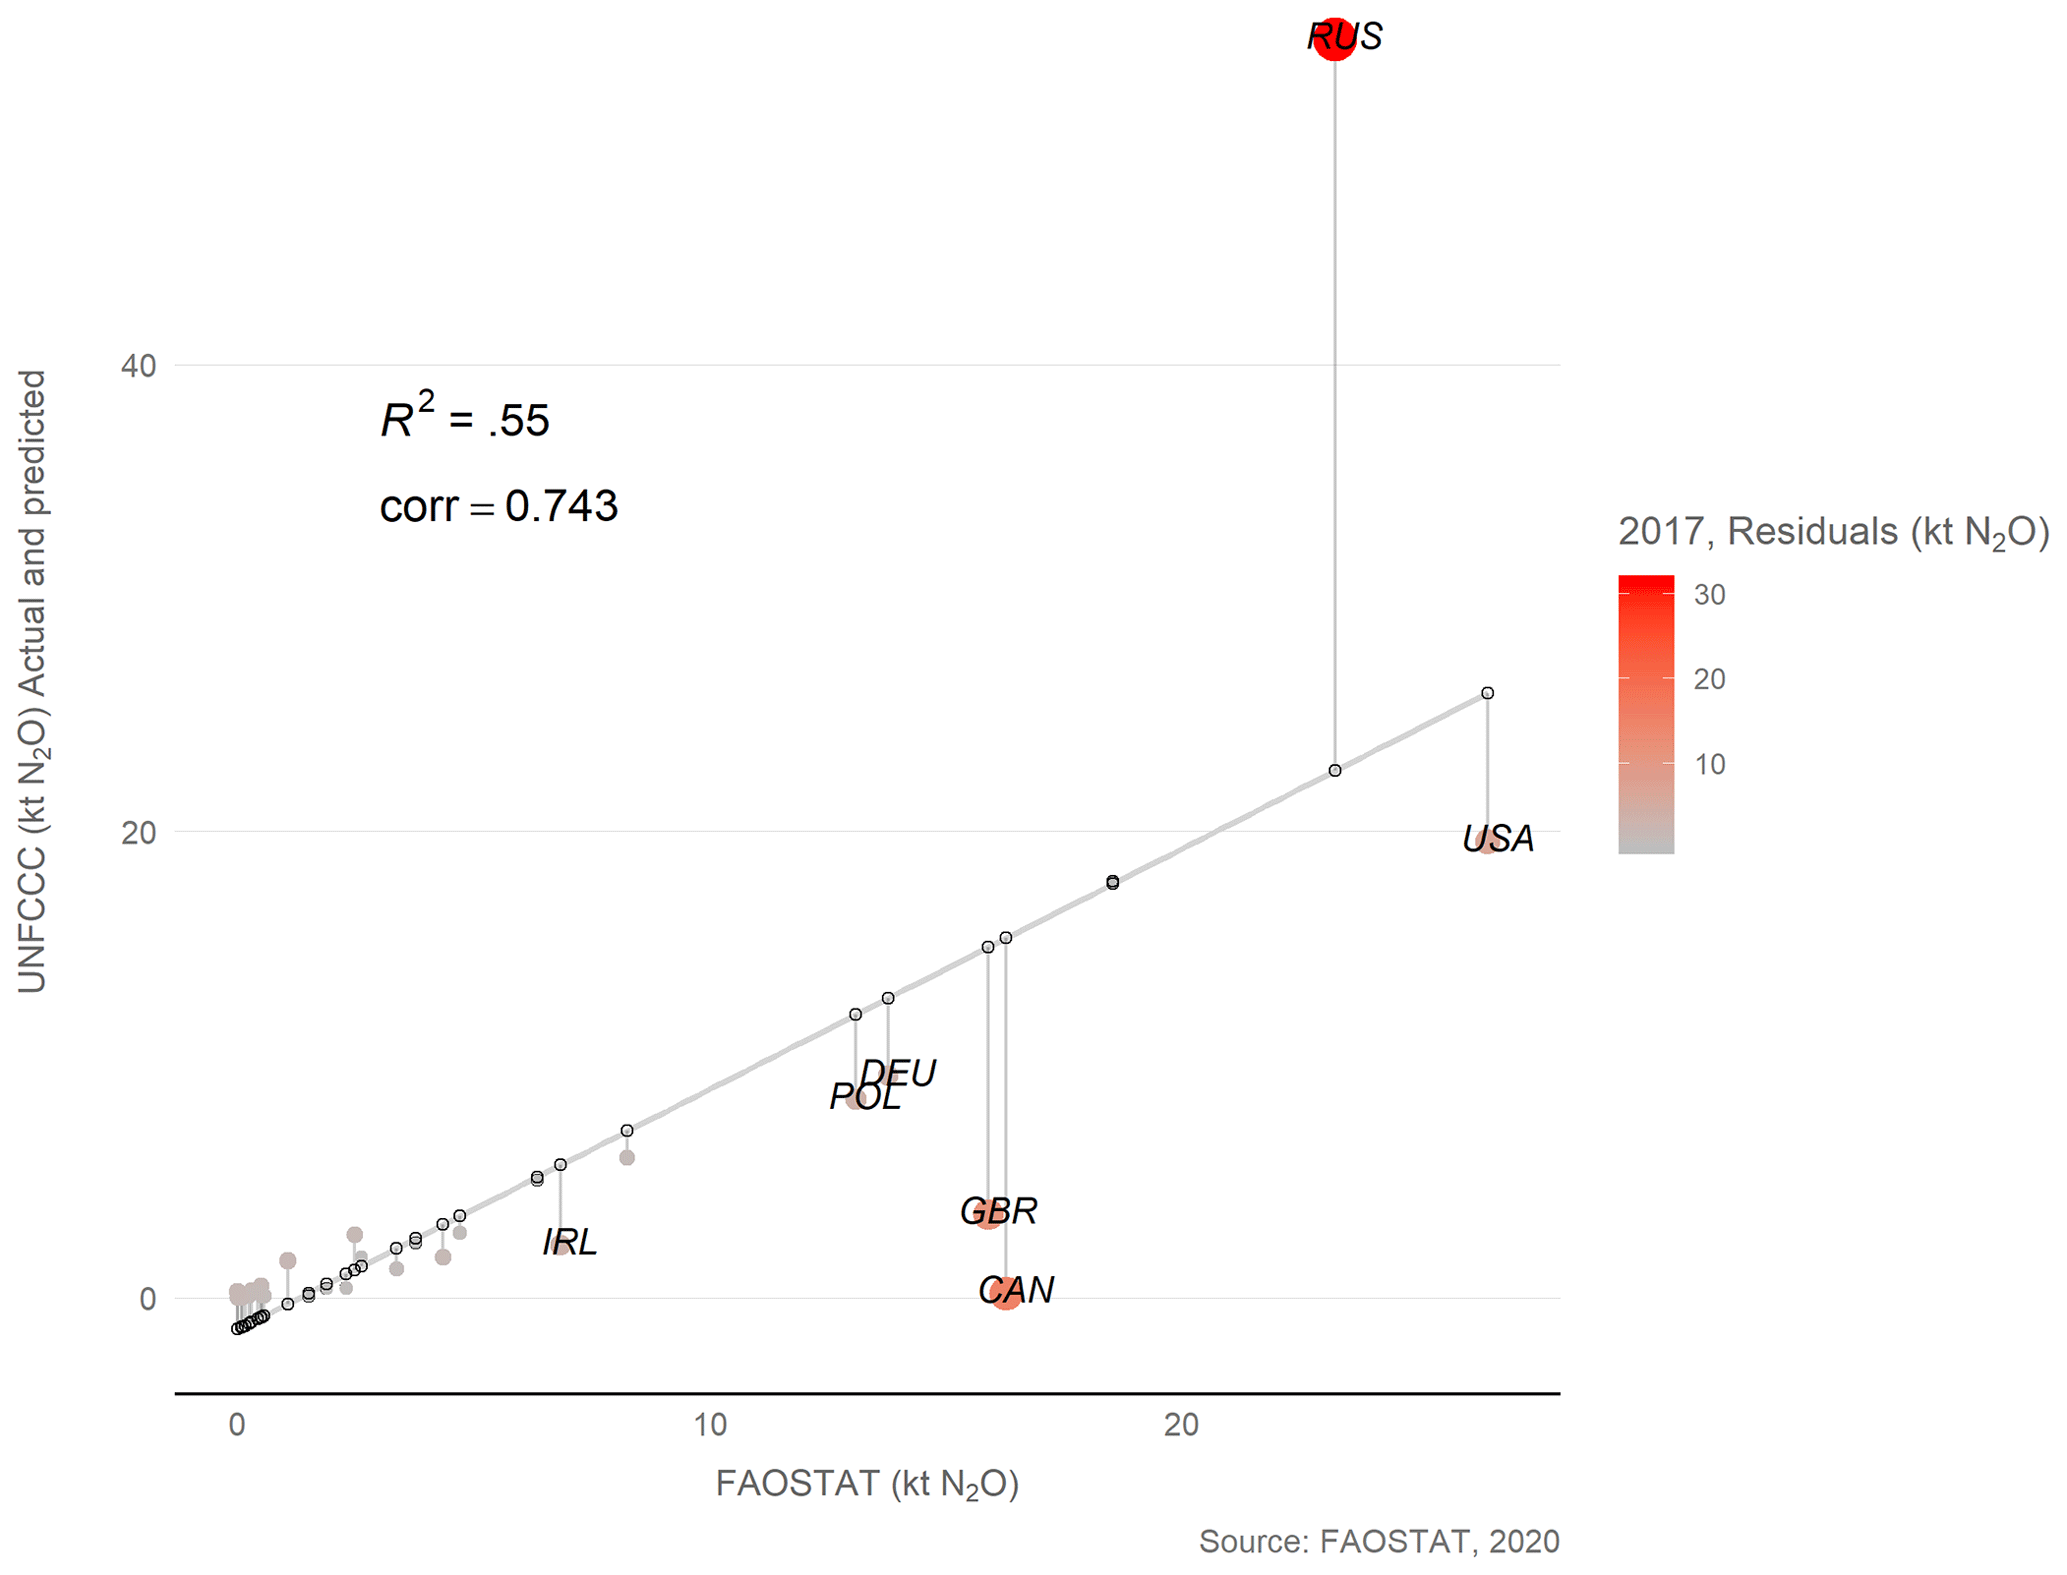
Figure 11Comparison of FAOSTAT estimates of GHG emissions (N2O) compared to UNFCCC data (year 2017).
FAOSTAT N2O emissions estimates were also in good agreement with data officially reported to the UNFCCC (R2=0.553) (Fig. 11) but with FAOSTAT consistently overestimating country data. At the regional level, FAOSTAT predicted total emissions of 184 kt N2O for Annex I parties vs. country-reported figures of 143 kt N2O (Appendix B, Table B2). Estimates of annual emissions in several countries with significant contributions were well in line with national reporting, including the United States of America (20 vs. 27 kt N2O), Belarus (19 vs. 18 kt N2O), Germany (14 vs. 10 kt N2O) and Ukraine (8 vs. 6 kt N2O). At the same time, significant differences characterized two countries with major organic area extent, specifically the Russian Federation (23 vs. 54 kt N2O) and Canada (16 vs. 0.2 kt N2O). In the latter country, the discrepancy was due to FAOSTAT estimating a 3 times larger extent of drained agricultural soils than was reported by Canada in the 2019 inventory and report to the Climate Convention (2019, Canada National Inventory Report 1990–2017, Part 2).
FAOSTAT results are in line with other independent assessments, for instance a study for countries in the Baltic region (Barthelmes et al., 2015) suggested that the area and emissions from drained organic soils are often underestimated in UNFCCC reporting. In a recent paper, Tiemeyer et al. (2020) developed a spatially representative Tier 2 approach for organic soils for Germany using detailed activity data and national EFs. For a similar extent of drained organic soils (about 12 Mha) as that in FAOSTAT, their emissions estimates from cropland and grassland drained organic soils were 45 Mt CO2eq, about a 3-fold increase of FAOSTAT results (14 Mt Mt CO2eq). This difference, which was mostly due to the different applied EFs, suggests that even FAOSTAT estimates may not fully grasp the potential for mitigation from the rewetting of drained organic soils.
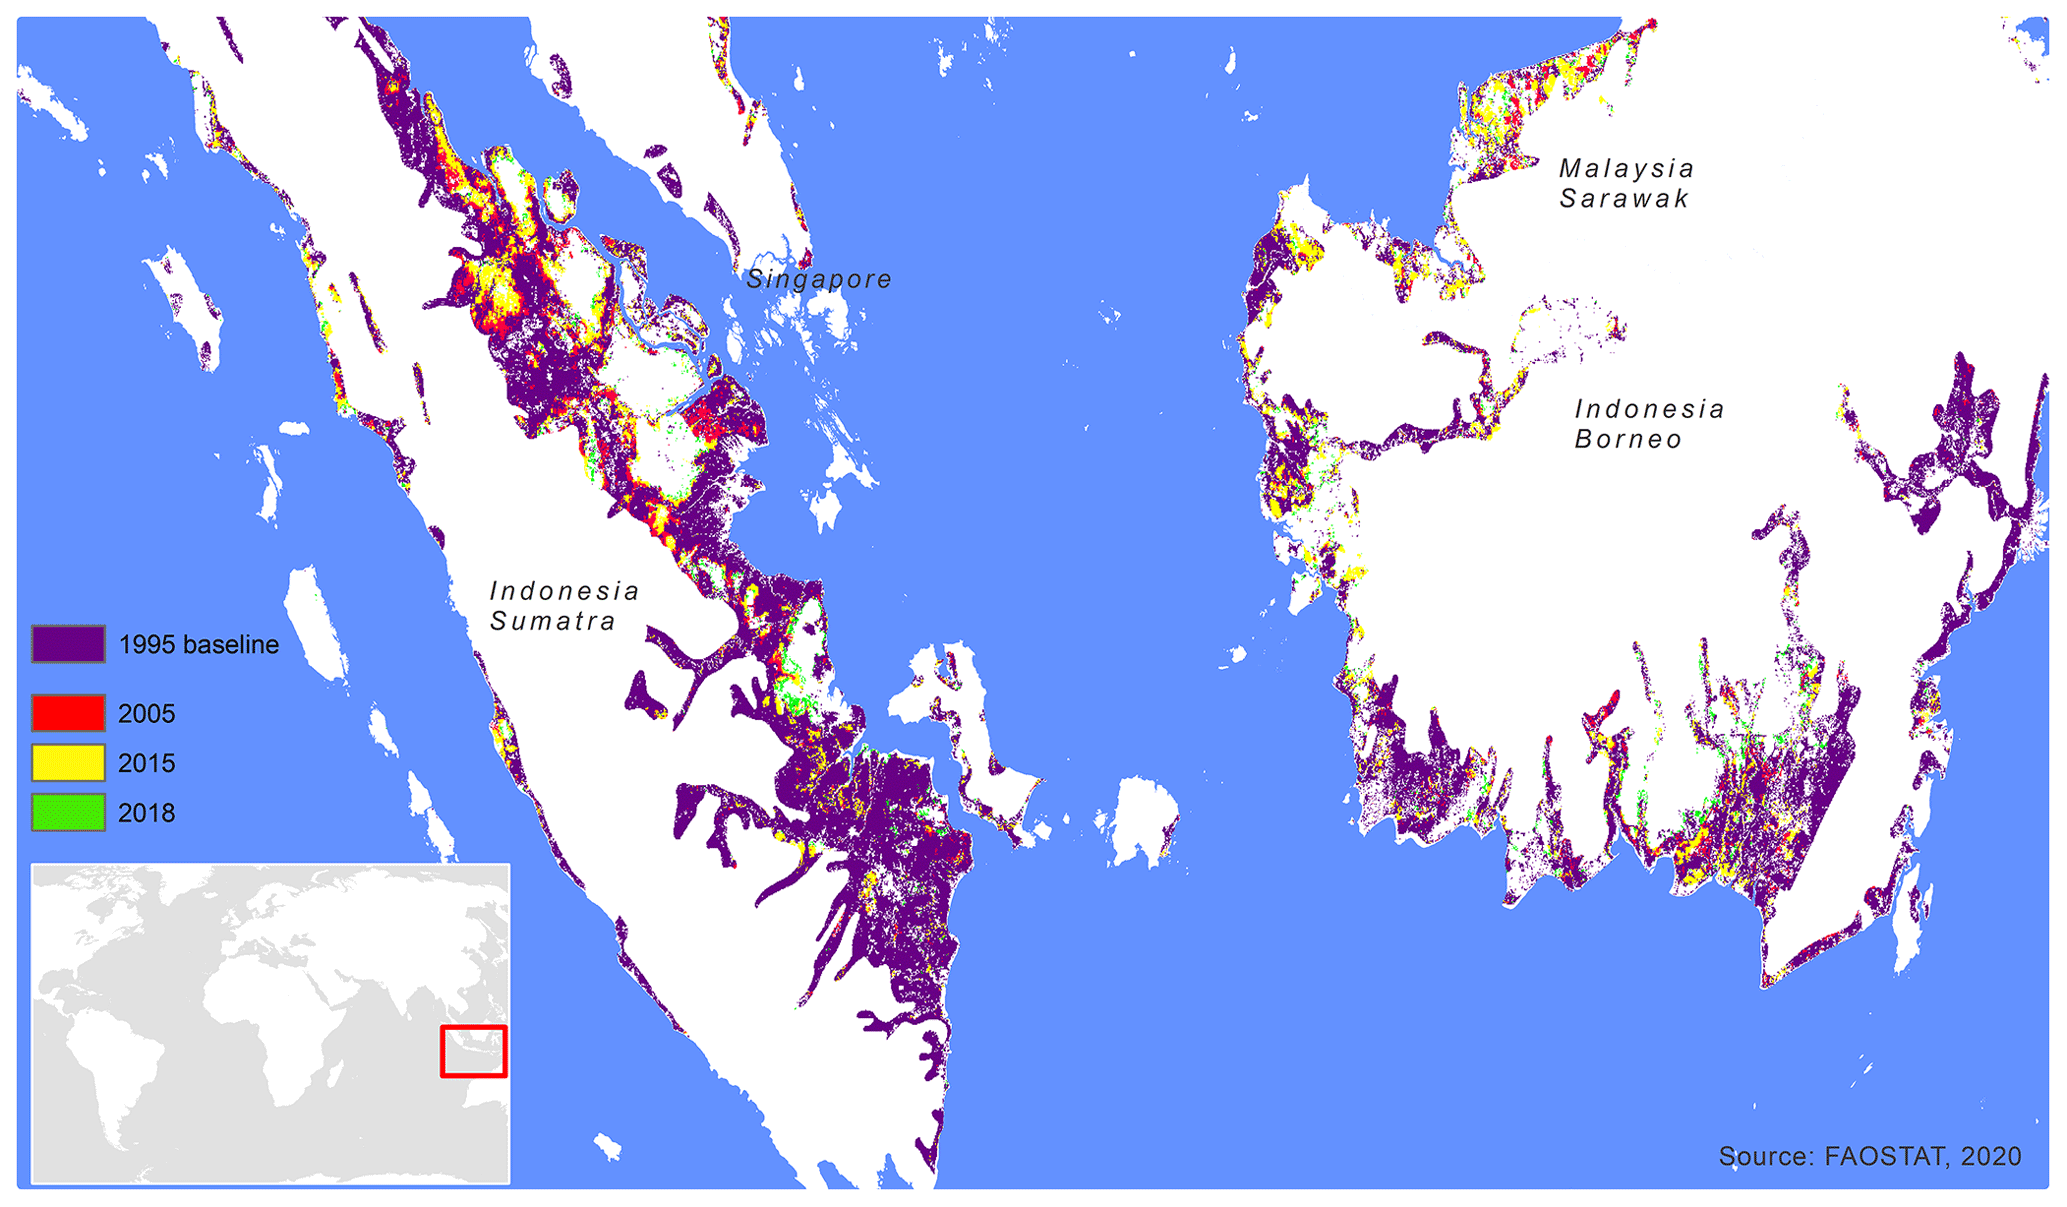
Figure 12FAOSTAT estimates of the extent of drained organic soils in Indonesia and Malaysia over time, showing total drained area in 1995 and successive additions by 2005, 2015 and 2018.
Figure 13FAOSTAT estimates vs. reported CO2 emissions from the drainage of organic soils in Indonesia, 1990–2016 (Second Biennial Update Report, 2018 submission to the Climate Convention).
5.2.2 Non-Annex I parties
Over 40 % of the global emissions from the agricultural drainage of organic soils is generated in Indonesia and Malaysia. In addition, these two countries have contributed the most to emissions increases since 1990 (FAO, 2020g) (Fig. 12).
We compared FAOSTAT estimates of GHG emissions from the drainage of organic soils in Indonesia to those reported by the country for the period 2000–2016 in the second Biennial Update Report (BUR) to the Climate Convention (submission on December 2018). Data reported from Malaysia do not allow for a similar comparison. National reported data from Indonesia were based on a national map of peatland and on refined EFs from the Wetlands Supplement (IPCC, 2014a), reported as the distinct category “peat decomposition” under Forestry and Other Land Use (FOLU) emissions. Results indicated good agreement between FAOSTAT estimates and nationally reported data. The average FAOSTAT GHG emissions over 1990–2016 were 281 vs. 304 Mt CO2eq reported by Indonesia to the UNFCCC. Both series have a similar upward trend and their agreement extended over the entire time series (R2=0.9446), albeit with increasing separation in the most recent years. A possible reason for the observed discrepancy is that the national communication applies three distinct EFs for oil palm, rubber and other annual crops. Additionally, while FAOSTAT estimates only include the drainage and emissions from agricultural uses, Indonesia also reports the emissions from peat decomposition under forest land use. The distance between national data and our results is however well within the combined uncertainty (53 %) for activity data and EFs as reported in the Indonesia BUR. This represents an additional validation of Eqs. (2) and (3) in the methodology addressing the issue of time dependence in drainage data (Fig. 13).

Figure 14Oil palm and other tree plantations (Petersen et al., 2016) and FAOSTAT cropland organic soils in 2014.
5.2.3 Emissions factors for palm oil plantations
The establishment of new oil palm plantations is recognized as a main driver for the drainage of tropical peatlands in Indonesia and Malaysia (Hooijer et al., 2010, 2012; Miettinen et al., 2012; Dohong et al., 2018; Cooper et al., 2020; FAO, 2020g). As a supplementary validation of Eqs. (1)–(2), we spatially combined our layer of cropland organic soils with an additional map of tree plantations produced by Petersen et al. (2016) (Fig. 14). These authors mapped the distribution of different types of plantations – for the years 2012–2014 – in seven countries, Brazil, Cambodia, Colombia, Indonesia, Liberia, Malaysia and Peru, using satellite imagery and extensive field validation, particularly for Indonesia and Malaysia. The types of mapped plantations are oil palm and oil palm mix, rubber and rubber mix, wood fiber and timber, and other mixed types. This additional analysis allows us to compare FAOSTAT results to those from peer-reviewed literature, with a focus on emissions factors from oil palm plantations (i.e., the emissions per unit area of oil palm on drained organic soils).
Table 7Area of oil palm and other tree plantations (mapped from Petersen et al., 2016) and their distribution in cropland organic soils and corresponding emissions in Indonesia and Malaysia in 2014. Share of total emissions by type of plantation from the country-level cropland organic soils is also shown. In 2014, total emissions from cropland organic soils were 318 Mt CO2eq in Indonesia and 45 Mt CO2eq in Malaysia.

In 2014, FAOSTAT crop statistics (FAO, 2020h) on oil palm harvested area reported a total of 8.1 Mha in Indonesia and 4.7 Mha in Malaysia. Petersen et al. (2016) generated estimates that were consistent with FAOSTAT data. They mapped the 2014 cover of oil palm plantations to be 11.7 and 5.3 Mha in Indonesia and Malaysia, respectively. Of these, based on our combined analysis of the plantations map and of the cropland organic soils, about 9 % in Indonesia and 4 % in Malaysia were organic soils drained for establishing tree plantations (Table 7). In Indonesia, the oil palm plantations mapped by Petersen and colleagues were responsible for about one-third of the 2014 emissions from all cropland organic soils in the country. In Malaysia, the relative contribution of oil palm plantations was even larger, and about half the total emissions were from cropland organic soils (Table 8).
Table 8Comparison of EFs for oil palm plantations on organic soils from peer-reviewed literature and combined FAOSTAT and Petersen et al. (2016) spatial analysis.
a Value 18 years after drainage. b Value more than 5 years after drainage. c Value for mature oil palm plantations (over a 30-year cycle).
The EFs for oil palm plantations derived from the analysis were around 78 CO2eq ha−1 yr−1 in the two countries and in close agreement with published estimates. Available literature is largely based on in situ measurements, which typically analyze the influence of the depth of drainage, soil subsidence rates, soil moisture and the period since the initial drainage and establishment of the oil palm plantations. When more than one EF was reported in the selected studies, we extracted for this comparison the EFs from mature oil palm plantations (5 or more years after initial drainage), considering these more directly comparable to our methods (Table 8). Values from the selected literature range from minimum average losses of 13 t CO2eq ha−1 yr−1 as in Hashim et al. (2018) to a maximum value of 117 t CO2eq ha−1 yr−1 as in Matysek et al. (2018) and a recent study by Cooper et al. (2020). FAOSTAT-estimated EF is therefore very close to the average value from the selected studies (73 t CO2eq ha−1 yr−1). This additional validation confirms that our methodology is compatible with most relevant and well-established estimates of a major source of emissions from drained organic soils in Southeast Asia and suggests that FAOSTAT estimates may be equally applied to other tropical countries.
All data are also available at Zenodo through open access (Tubiello and Conchedda, 2020) with the following DOI: https://doi.org/10.5281/zenodo.3942370. They can be downloaded at https://zenodo.org/record/3942370#.XxWJjygzbIU (last access: 1 December 2020).
Organic soils are a rich carbon pool and their drainage for agriculture has important impacts on the global carbon cycle. FAOSTAT statistics on greenhouse gas emissions relative to the drainage of organic soils were updated for the period 1990–2019 based on geospatial computation and pixel-level application of default Tier I method of the Intergovernmental Panel on Climate Change (IPCC). In line with country-reporting requirements to the Climate Convention and following the IPCC, statistics are disaggregated by gas (N2O and CO2) and land use class, i.e., cropland and grassland. Results are disseminated in three separate FAOSTAT domains. These FAOSTAT statistics represent the only available global dataset in the world today showing country, regional and global time series of drained organic soils. The underlying spatial data are also publicly available.
In 2019, FAOSTAT estimated that nearly 25 million hectares of organic soils were drained from agriculture and were responsible for 833 Mt CO2eq. This was about 8 % of total agriculture and related land use emissions in that year. About half of the greenhouse gas emissions was due to the drainage of organic soils in Southeast Asia, particularly Indonesia and Malaysia.
We validated methods and results by comparing data reported by countries to the United Nations Climate Convention on Climate Change, including both data from developed countries of the Annex I group and Indonesia, a top emitter country for drained organic soils in the comparison. For this latter country we also validated with additional analysis the resulting emission factor for oil palm plantations, a major driver of the emissions in Southeast Asia. FAOSTAT statistics are well aligned with country-reported data and most established literature. Overall, FAOSTAT statistics explained about 60 % of the variability in official reported data. However, in Indonesia, the top emitter country by drained organic soils, as well as in many developed countries, FAOSTAT statistics yielded an even higher agreement and proved a robust estimator of official country data. This suggests that the FAOSTAT database may provide a useful global reference in support of countries reporting requirements while national capacities are being developed.
Following the guidelines of the Intergovernmental Panel on Climate Change, FAOSTAT statistics are computed applying histosols as a proxy for organic soils. However, wide uncertainties still remain as to whether organic soils may fully capture the dynamics in peat distribution and related emissions particularly in tropical countries. FAO ongoing efforts under the Global Peatlands Initiative are expected to provide advancements for mapping and monitoring peatlands worldwide.
Table A1Global emissions in 1990 and 2019 by gas and by land use.
∗ N2O emissions converted to CO2eq applying IPCC AR5 GWP (IPCC, 2014b).
Table A2Original area of histosols and share of drained histosols in 1995∗ and 2019.
∗ The year 1995 is chosen arbitrarily to account for the reporting of countries after the split of the Soviet Union.
Table A3Comparison of our emission estimates by land use and gas generated applying the EFs from the 2006 Guidelines (IPCC, 2006) with emissions estimates if ceteris paribus the EFs from the Wetlands Supplement (IPCC, 2014a) were applied instead to the methodology.
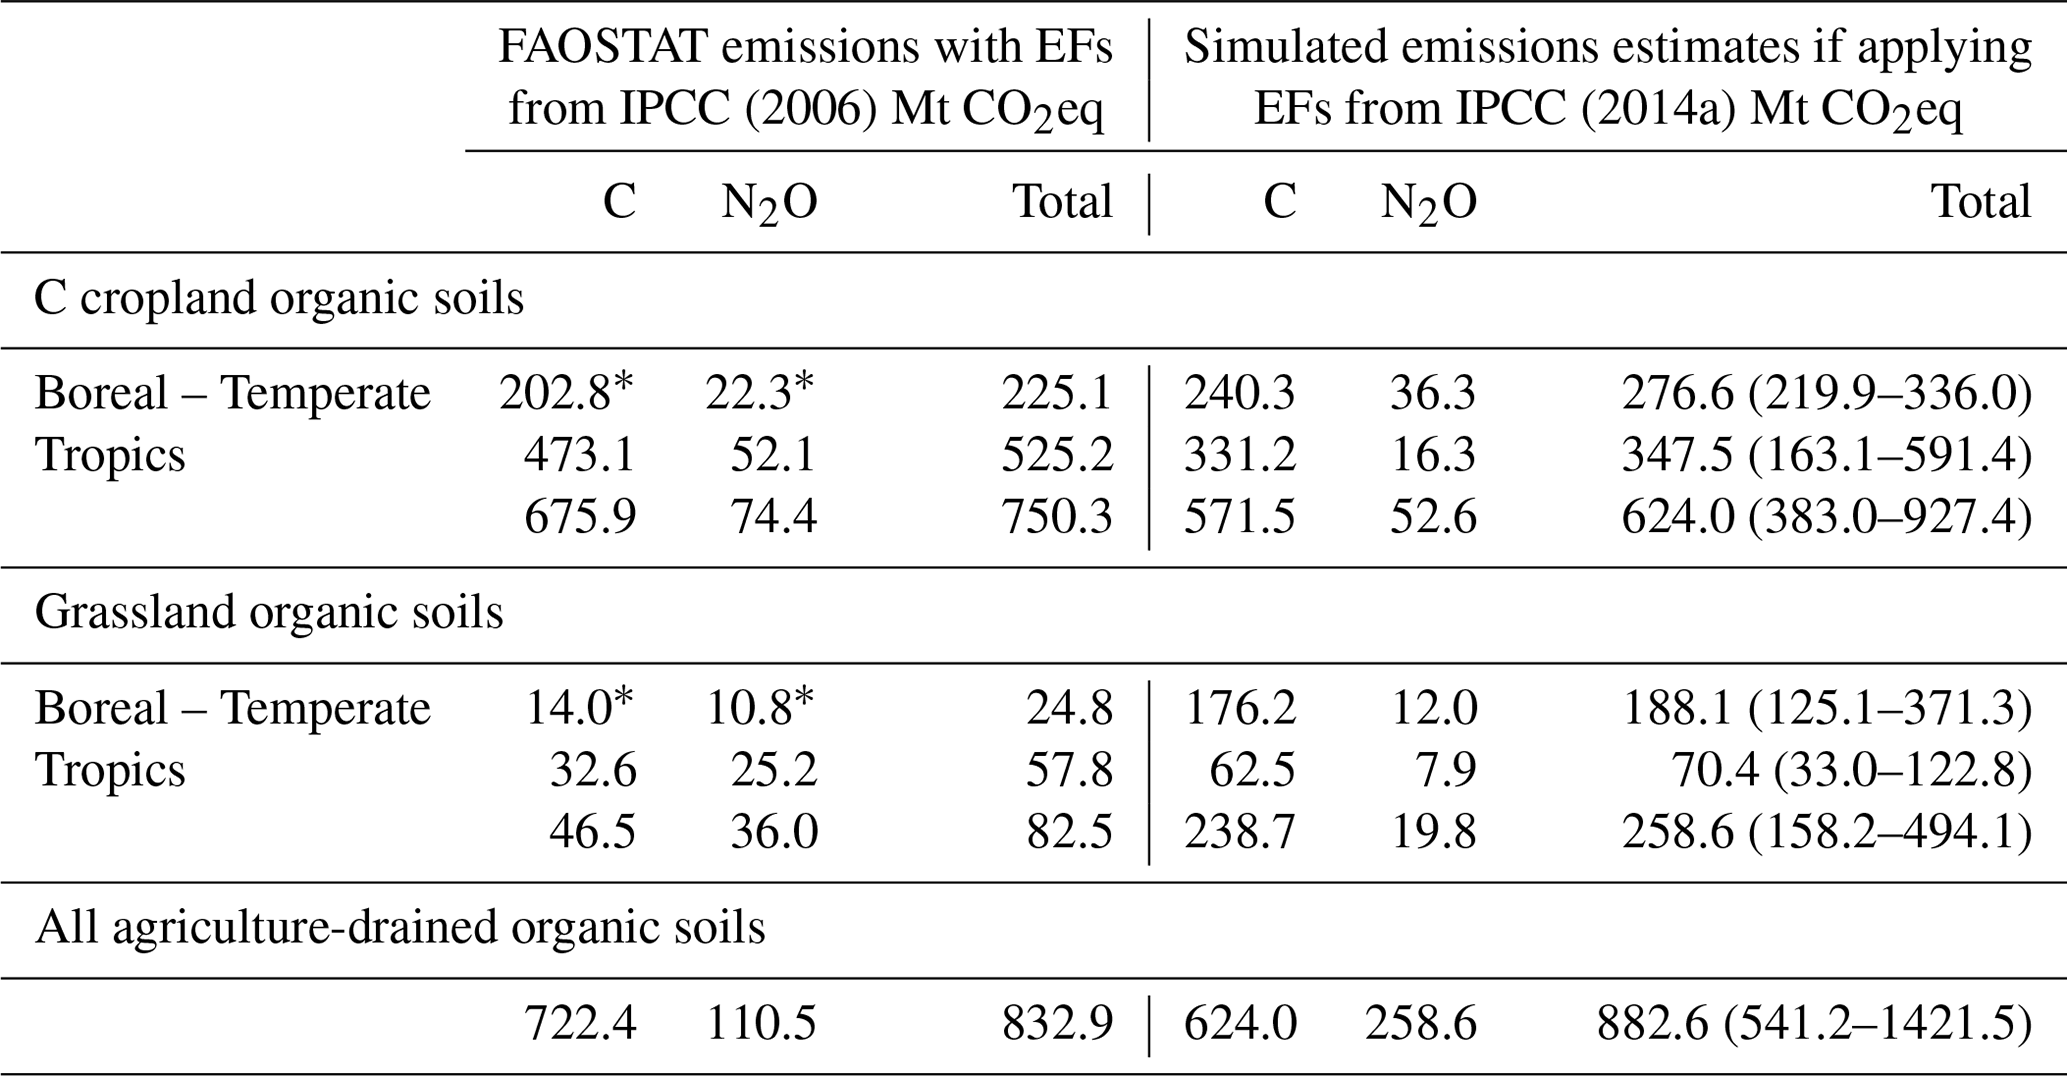
∗ Estimates are made averaging the EFs for Boreal and Cool Temperate and EFs for the Temperate zones as reported in the 2006 Guidelines (IPCC, 2006).
Table B1Peat extent from Page et al. (2011), Gumbricht et al. (2017) and FAO area of histosols, all in 1000 ha.
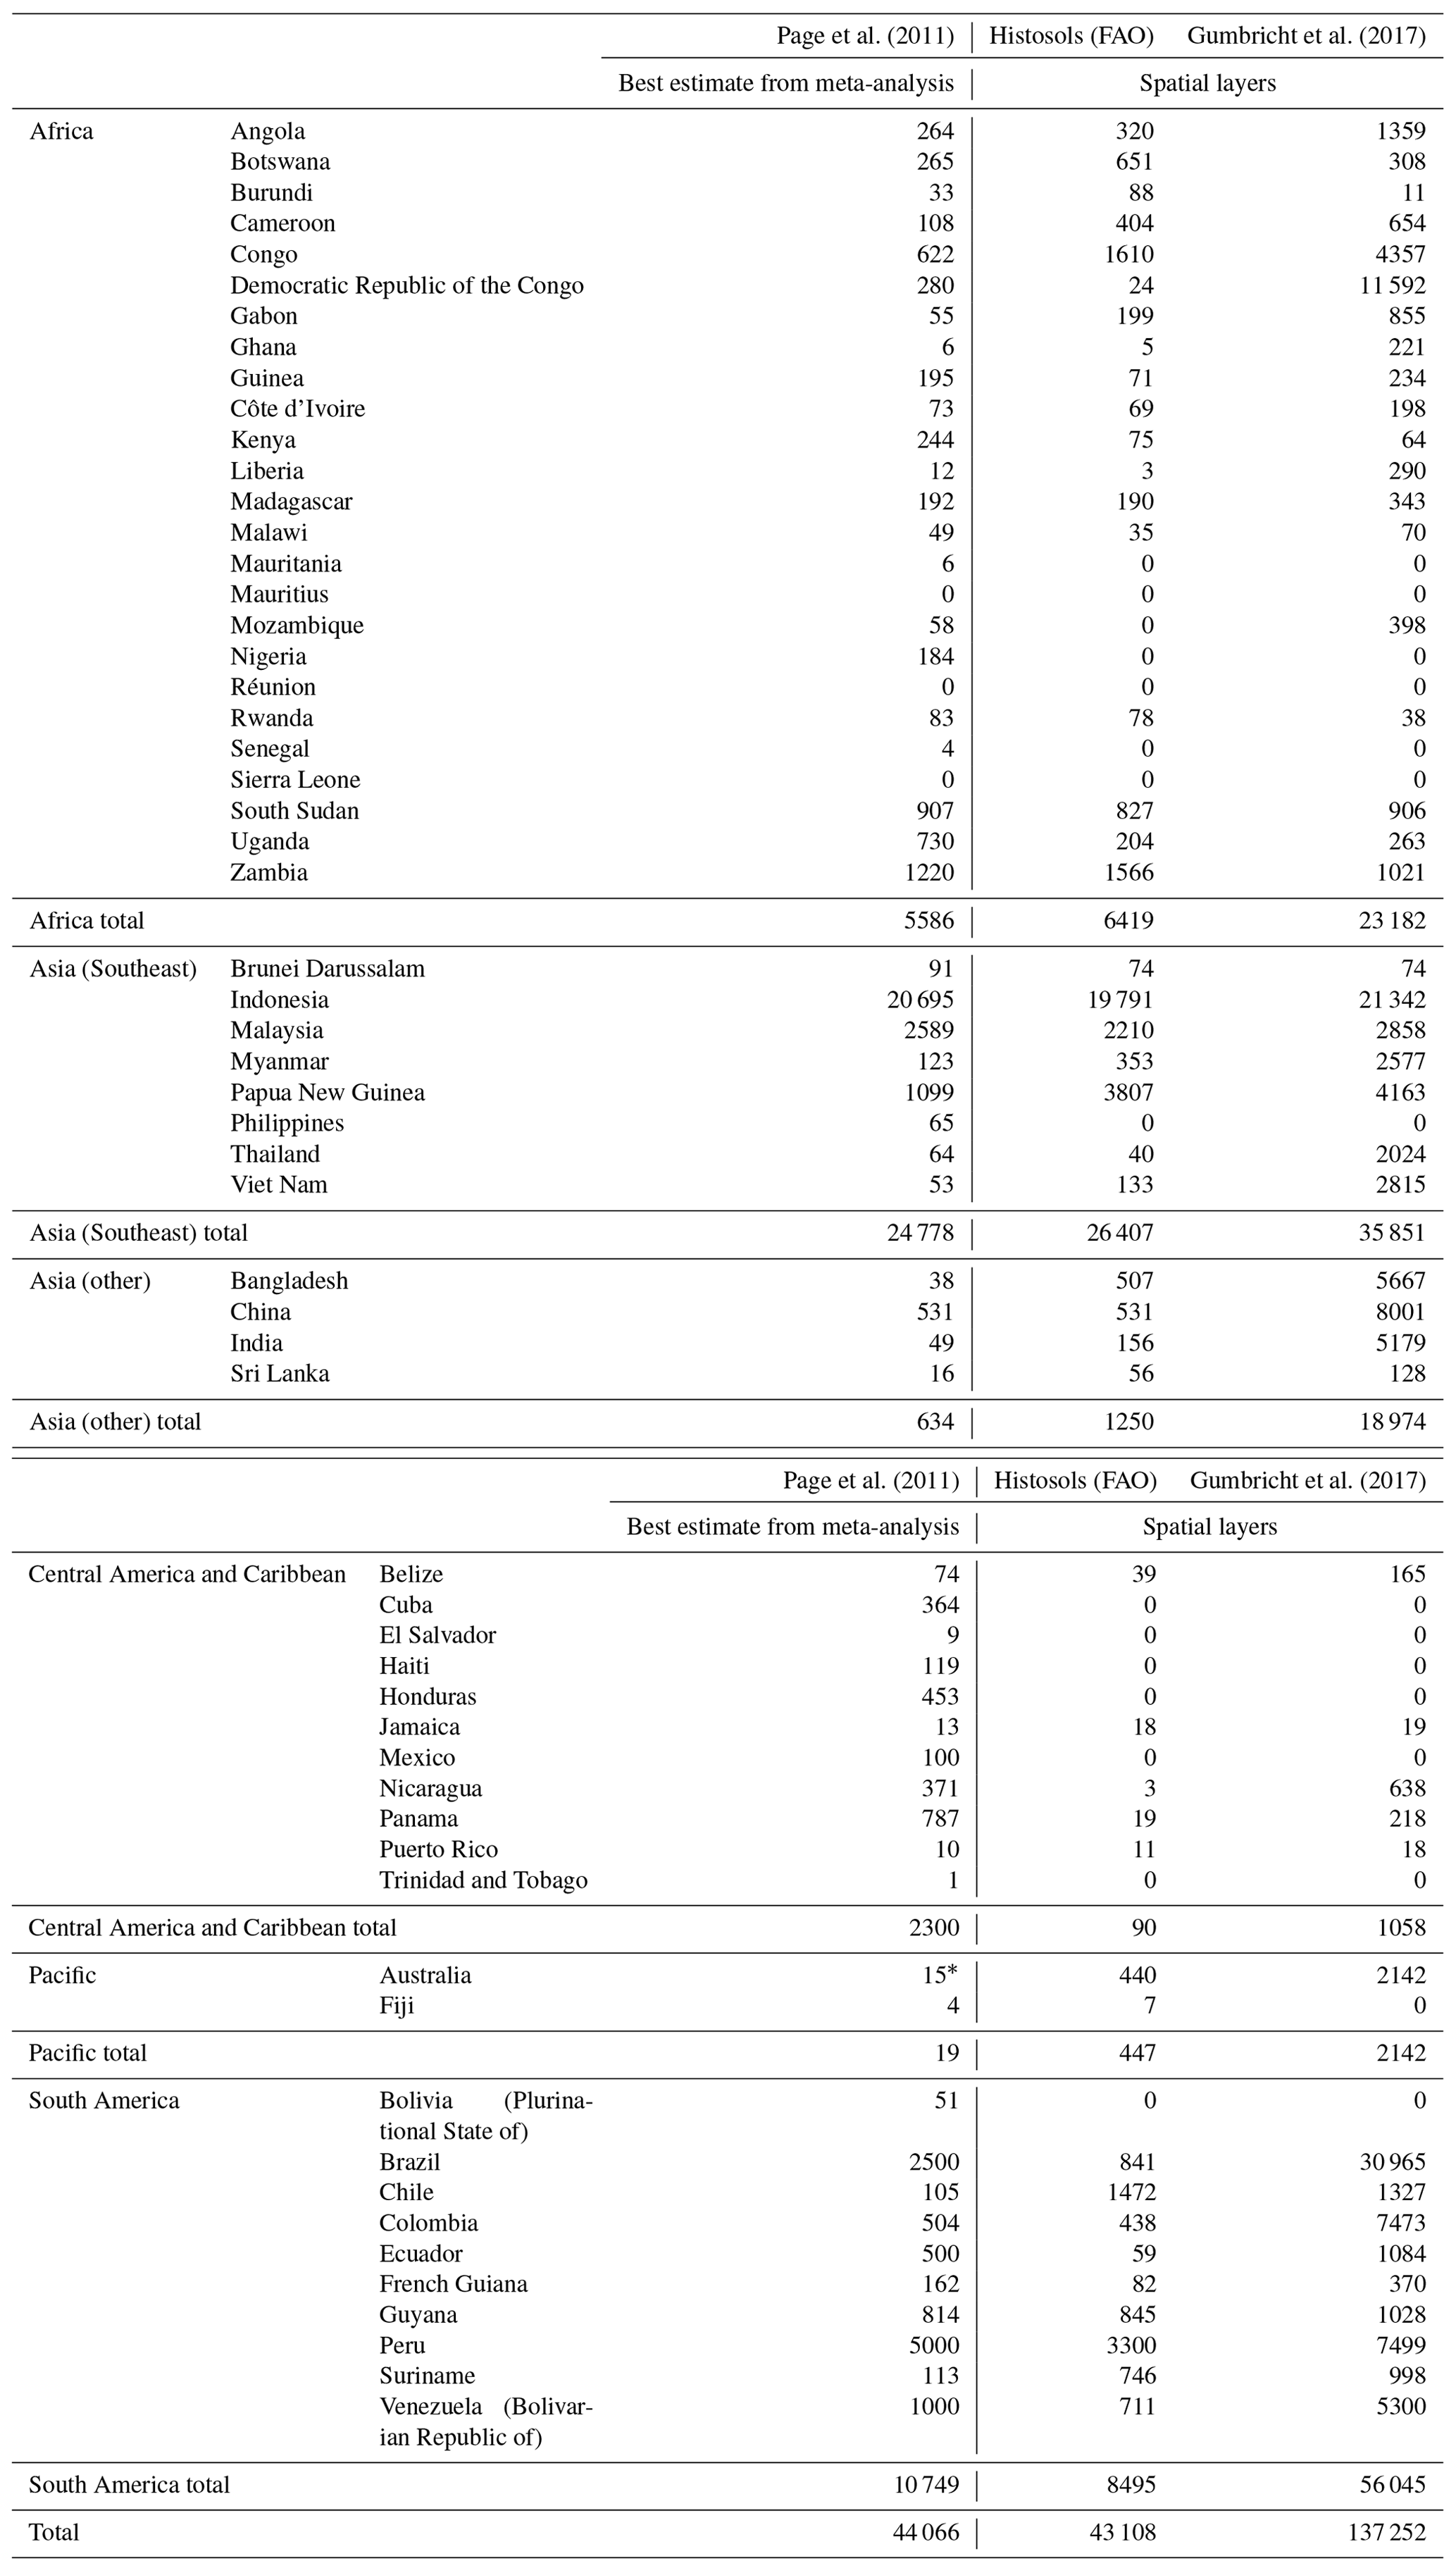
∗ In Page et al. (2011), Australian estimates limited to Queensland, Australia.
Table B2FAOSTAT estimates and UNFCCC-reported country data: area drained and N2O (kt) emissions, by country in Annex I group∗, 2017.
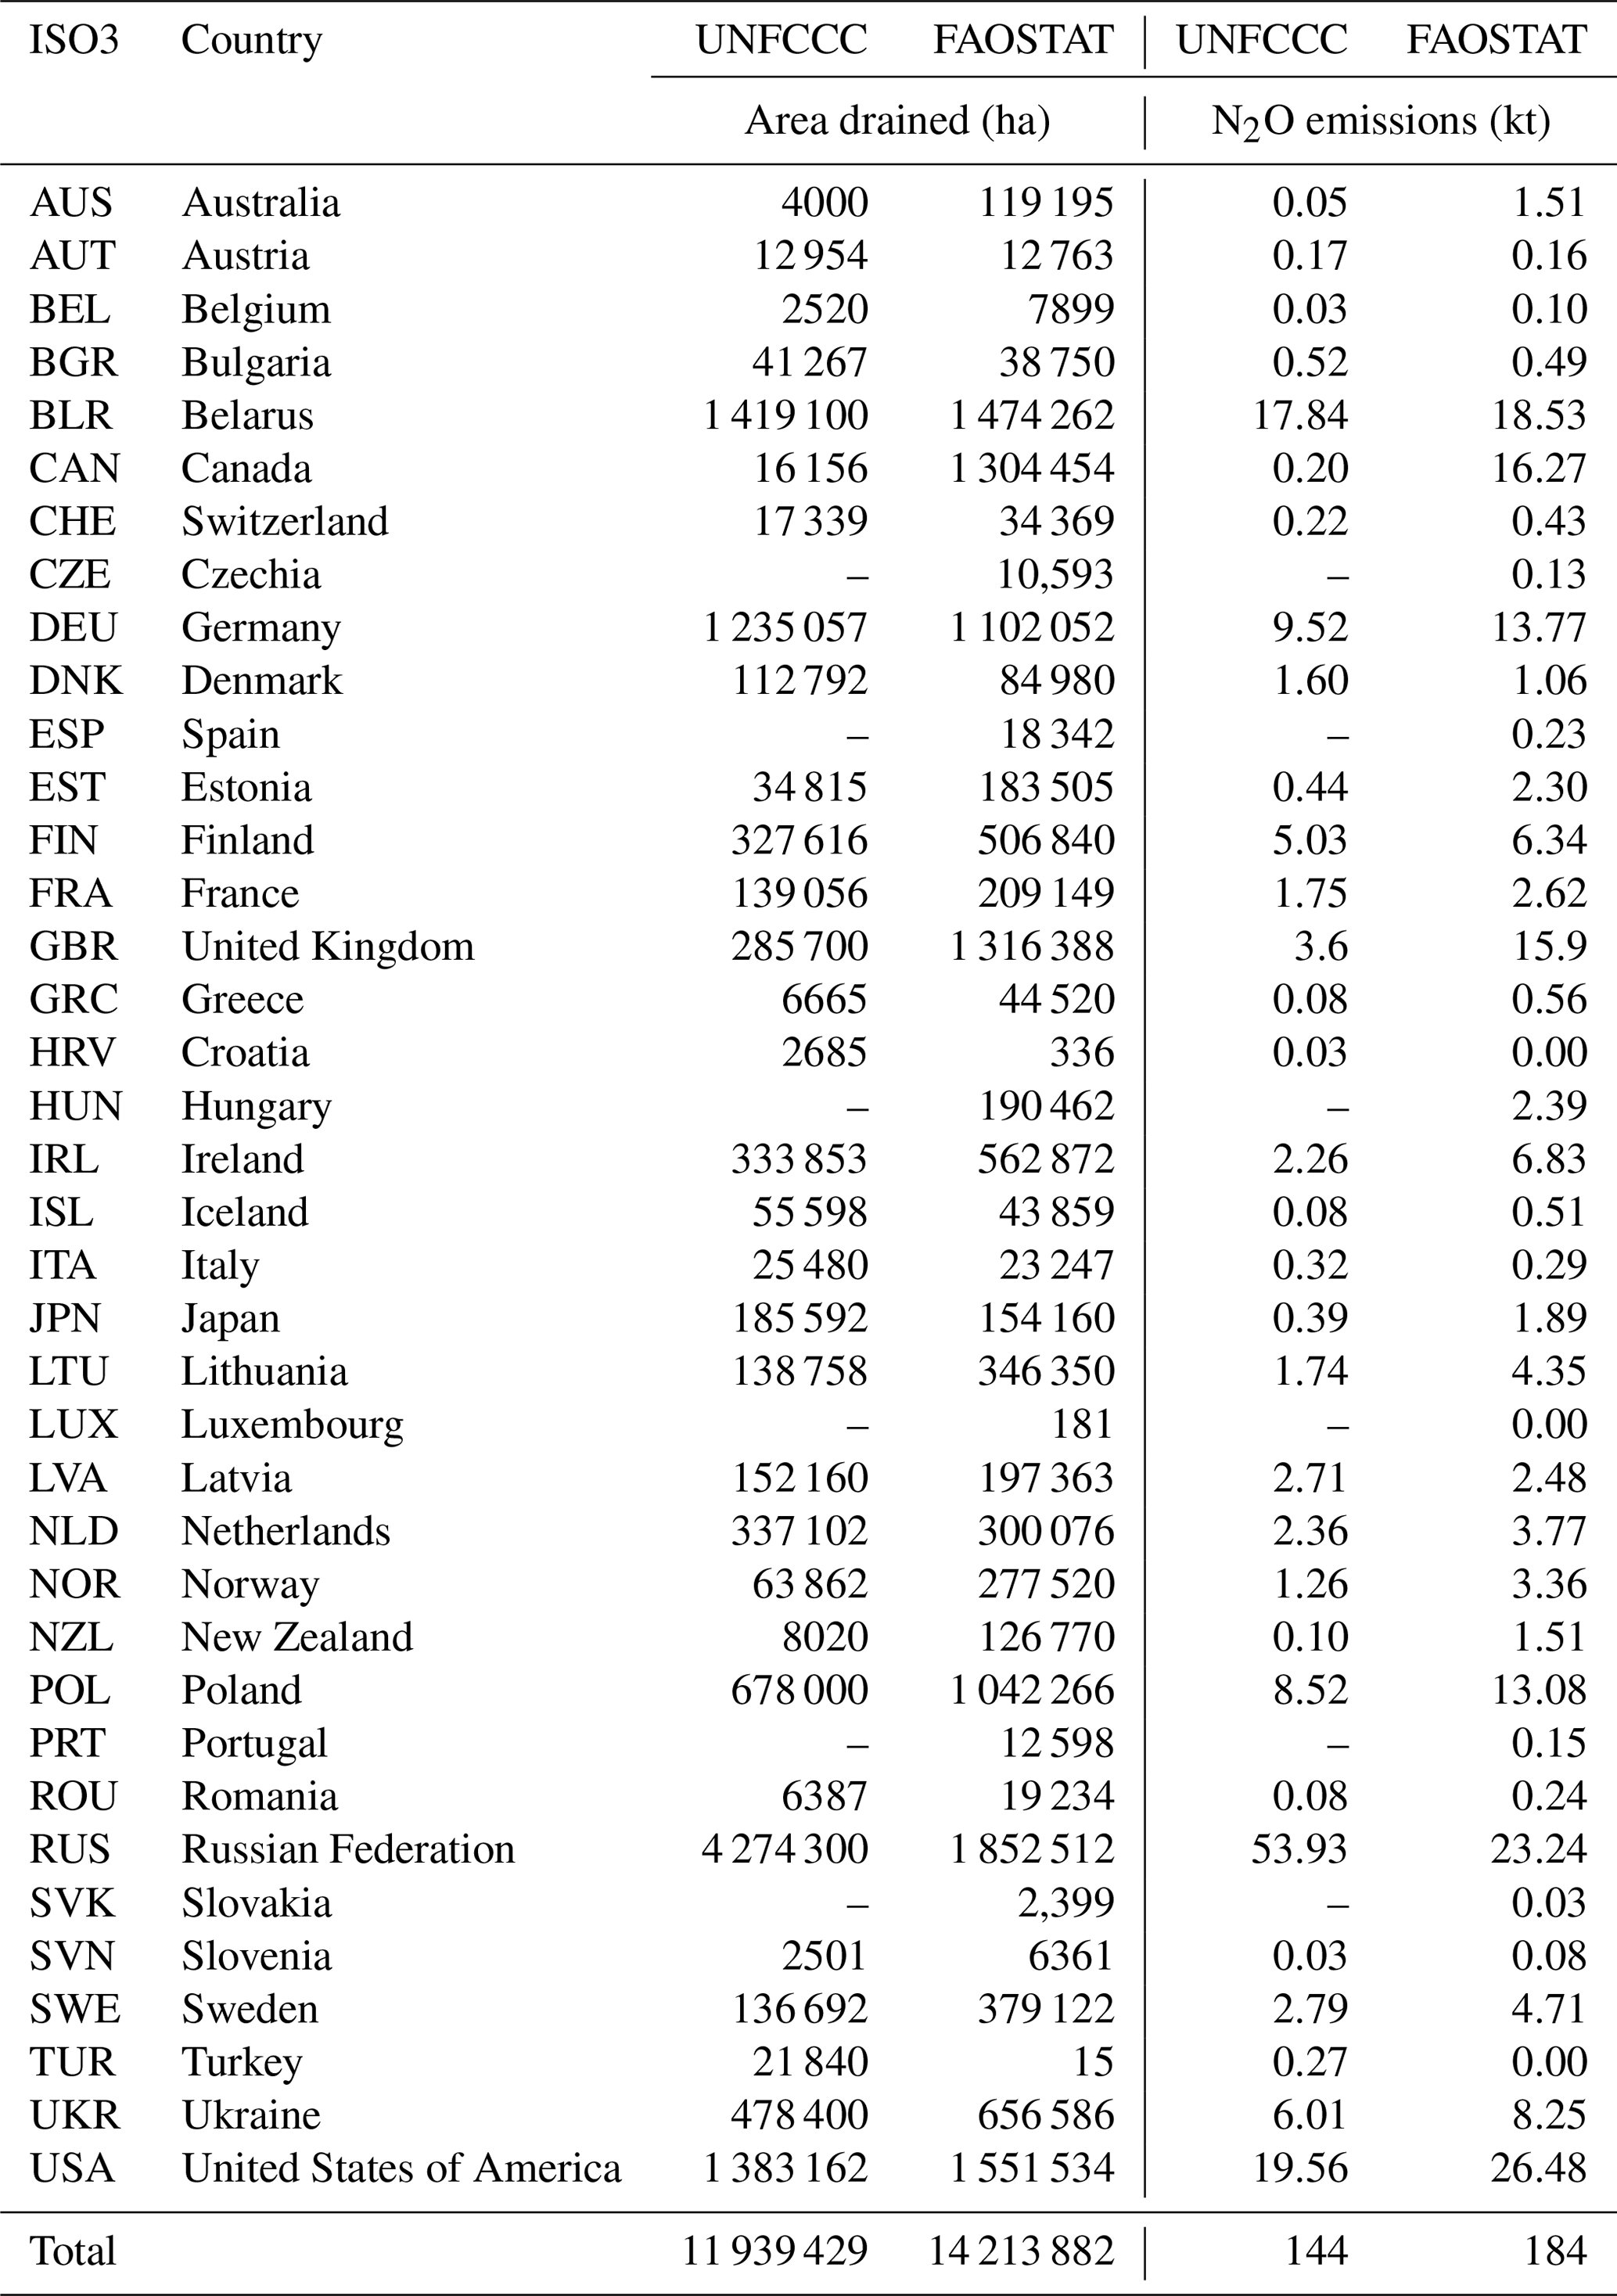
∗ Data for this reporting category are not occurring (NO) in the UNFCCC tables for Cyprus, Czechia, Hungary, Kazakhstan, Luxembourg, Malta, Monaco, Portugal and Spain. Data were not estimated in Slovakia (NE).
FNT and GC devised the methodology, and GC processed the data and produced the graphics. Both authors analyzed the data and drafted the manuscript. GC revised and edited the final document.
The authors declare that they have no conflict of interest.
The views expressed in this publication are those of the authors and do not necessarily reflect the views or policies of FAO.
This work was made possible by regular funding provided to FAO by its member countries. We are grateful to staff of the FAO Statistics Division for overall support, and in particular to Griffiths Obli-Layrea for the UNFCCC data provision and Amanda Gordon for FAOSTAT maintenance and dissemination. We thank the three anonymous reviewers, whose comments helped improve and clarify this document.
This paper was edited by David Carlson and reviewed by three anonymous referees.
Agus, F., Gunarso, P., Sahardjo, B. H., Harris, N., van Noordwijk, M., and Killeen, T. J.: Historical CO2 emissions from land use and land use change from the oil palm industry in Indonesia, Malaysia and Papua New Guinea, Roundtable on Sustainable Palm Oil, Kuala Lumpur, 2013.
Barthelmes, A., Couwenberg, J., Risager, M., Tegetmeyer, C., and Joosten, H.: Peatlands and Climate in a Ramsar Context: A Nordic-Baltic Perspective, Nordic Council of Ministers, TemaNord, Rosendahls-Schultz Grafisk, Denmark, 2015.
C3S: Copernicus Climate Change Service, Documentation for version 2.1 of the dataset, Land cover classification gridded maps from 1992 to present derived from satellite observations, available at: https://cds.climate.copernicus.eu/cdsapp#!/dataset/satellite-land-cover?tab=doc (last access: July 2020), 2019.
Cooper, H. V., Evers, S., Aplin, P., Crout, N., Dahalan, M. P. B., and Sjogersten, S.: Greenhouse gas emissions resulting from conversion of peat swamp forest to oil palm plantation, Nat. Commun., 11, 1–8, 2020.
Couwenberg, J. and Hooijer, A.: Towards robust subsidence-based soil carbon emission factors for peat soils in south-east Asia, with special reference to oil palm plantations, Mires Peat, 12, 1–13, 2013.
Critchley, C., Adamson, H., McLean, B., and Davies, O.: Vegetation dynamics and livestock performance in system-scale studies of sheep and cattle grazing on degraded upland wet heath, Agr. Ecosyst. Environ., 128, 59–67, 2008.
Dargie, G. C., Lewis, S. L., Lawson, I. T., Mitchard, E. T., Page, S. E., Bocko, Y. E., and Ifo, S. A.: Age, extent and carbon storage of the central Congo Basin peatland complex, Nature, 542, 86–90, 2017.
Di Gregorio, A.: Land Cover Classification System (LCCS), Classification concepts and user manual for software version 2.0, FAO, Food and Agriculture Organization of the United Nations: Rome, Italy, available at: http://www.fao.org/docrep/008/y7220e/y7220e00.htm (last access: July 2020), 2005.
Dohong, A., Aziz, A. A., and Dargusch, P.: Carbon Emissions from Oil Palm Development on Deep Peat Soil in Central Kalimantan Indonesia, Anthropocene, 22, 31–39, 2018.
ESA CCI: European Spatial Agency Climate Change Initiative, Land Cover, available at: https://www.esa-landcover-cci.org/, last access: July 2020.
FAO: Guidelines for the preparation of livestock sector reviews. Animal Production and Health Guidelines No. 5; Food and Agriculture Organization of the United Nations (FAO), Rome, available at: http://www.fao.org/docrep/014/i2294e/i2294e00.pdf (last access: July 2020), 2011.
FAO: Peatland mapping and monitoring, Recommendations and technical overview, Food and Agriculture Organization of the United Nations, available at: http://www.fao.org/3/CA8200EN/CA8200EN.pdf (last access: 1 December 2020), 2020a.
FAO: FAOSTAT Emissions – Agriculture, Cultivation of Organic Soils, available at: http://www.fao.org/faostat/en/#data/GV (last access: 1 December 2020), 2020b.
FAO: FAOSTAT Emissions – Land Use, Cropland, available at: http://www.fao.org/faostat/en/#data/GC (last access: 1 December 2020), 2020c.
FAO: FAOSTAT Emissions – Land Use, Grassland, available at: http://www.fao.org/faostat/en/#data/GG (last access: 1 December 2020), 2020d.
FAO: FAO GeoNetwork Map Catalog and Hand-in-Hand Initiative Geospatial Platform, available at: https://data.apps.fao.org/map/catalog/srv/eng/catalog.search#/search?any=DROSA-drained%20organic%20soils;; https://io.apps.fao.org/geoserver/wcs?service=WCS&version=1.1.1&request=DescribeCoverage&identifiers=FAOSTAT:drosa_a; https://io.apps.fao.org/geoserver/wcs?service=WCS&version=1.1.1&request=DescribeCoverage&identifiers=FAOSTAT:drose_a, (last access: September 2020), 2020e.
FAO: FAOSTAT Emissions – Land Use, Burning-Biomass, available at: http://www.fao.org/faostat/en/#data/GI (last access: 1 December 2020), 2020f.
FAO: Drained organic soils 1990–2019. Global, regional and country trends. FAOSTAT Analytical Brief Series No. 4, FAO, Rome, available at: http://www.fao.org/3/cb0489en/cb0489en.pdf (last access: 1 December 2020), 2020g.
FAO: FAOSTAT Production – Crops, available at: http://www.fao.org/faostat/en/#data/QC (last access: 1 December 2020), 2020h.
FAO and IIASA: Harmonized World Soil Database (version 1.2), Food and Agriculture Organization of the United Nations (FAO), Rome, Italy and International Institute for Applied Systems Analysis (IIASA), Laxenburg, Austria, available at: http://www.fao.org/soils-portal/soil-survey/soil-maps-and-databases/harmonized-world-soil-database-v12/it/ (last access: July 2020), 2012.
FAO and Wetlands International: Peatlands – guidance for climate change mitigation through conservation, rehabilitation and sustainable use, 2nd edn., edited by: Joosten, H., Tapio-Biström, M., and Tol, S., Food and Agriculture Organization of the United Nations and Wetlands International, available at: http://www.fao.org/3/a-an762e.pdf (last access: July 2020), 2012.
FAO, ISRIS, and ISSS: World reference base for soil resources, World Soil Resources Reports 84, Food and Agriculture Organization (FAO) of the United Nations, the International Soil Reference and Information Centre (ISRIC), and the International Society of Soil Science (ISSS), available at: http://www.fao.org/3/w8594e/w8594e00.htm (last access: July 2020), 1998.
Global Peatlands Initiative: What is the Global Peatlands Initiative?, available at: https://www.globalpeatlands.org/, last access: July 2020.
Gorham, E.: Northern peatlands: role in the carbon cycle and probable responses to climatic warming, Ecol. Appl., 1, 182–195, 1991.
Gumbricht, T., Roman-Cuesta, R. M., Verchot, L., Herold, M., Wittmann, F., Householder, E., Herold, N., and Murdiyarso, D.: An expert system model for mapping tropical wetlands and peatlands reveals South America as the largest contributor, Global Change Biol., 23, 3581–3599, 2017.
Hashim, Z., Subramaniam, V., Harun, M. H., and Kamarudin, N.: Carbon footprint of oil palm planted on peat in Malaysia, Int. J. Life Cycle Ass., 23, 1201–1217, 2018.
Hooijer, A., Page, S., Canadell, J. G., Silvius, M., Kwadijk, J., Wösten, H., and Jauhiainen, J.: Current and future CO2 emissions from drained peatlands in Southeast Asia, Biogeosciences, 7, 1505–1514, https://doi.org/10.5194/bg-7-1505-2010, 2010.
Hooijer, A., Page, S., Jauhiainen, J., Lee, W. A., Lu, X. X., Idris, A., and Anshari, G.: Subsidence and carbon loss in drained tropical peatlands, Biogeosciences, 9, 1053–1071, https://doi.org/10.5194/bg-9-1053-2012, 2012.
Humpenöder, F., Karstens, K., Lotze-Campen, H., Leifeld, J., Menichetti, L., Barthelmes, A., and Popp, A.: Peatland protection and restoration are key for climate change mitigation, Environ. Res. Lett., 15, 104093, 2020.
Immirzi, C. P., Maltby, E., and Clymo, R. S.: The Global Status of Peatlands and Their Role in Carbon Cycling, A Report for Friends of the Earth by the wetland ecosystems research group, University of Exeter, Report No. 11, Friends of the Earth, London, UK, 145 pp., 1992, 1992.
IPCC: Climate Change 1995: The Science of Climate Change, Contribution of Working Group I to the Second Assessment Report of the Intergovernmental Panel on Climate Change, edited by: Houghton, J. T., Meira Filho, L. G., Callander, B. A., Harris, N., Kattenberg, A., and Maskell, K., University Press, Cambridge, UK, 1996.
IPCC: Guidelines for National Greenhouse Gas Inventories (NGHGI), available at: https://www.ipcc-nggip.iges.or.jp/public/2006gl/ (last access: July 2020), 2006.
IPCC: Climate Change 2007: The Physical Science Basis, Contribution of Working Group I to the Fourth Assessment Report of the Intergovernmental Panel on Climate Change, edited by: Solomon, S., Qin, D., Manning, M., Chen, Z., Marquis, M., Averyt, K. B., Tignor, M., and Miller, H. L., Cambridge University Press, Cambridge, UK, 2007.
IPCC: Supplement to the 2006 IPCC Guidelines for National Greenhouse Gas Inventories: Wetlands, edited by: Hiraishi, T., Krug, T., Tanabe, K., Srivastava, N., Baasansuren, J., Fukuda, M., and Troxler, T. G., IPCC, Switzerland, 2014a.
IPCC: Climate Change 2014: Mitigation of Climate Change. Contribution of Working Group III to the Fifth Assessment Report of the Intergovernmental Panel on Climate Change, edited by: Edenhofer, O., Pichs-Madruga, R., Sokona, Y., Farahani, E., Kadner, S., Seyboth, K., Adler, A., Baum, I., Brunner, S., Eickemeier, P., Kriemann, B., Savolainen, J., Schlömer, S., von Stechow, C., Zwickel, T., and Minx J. C., Cambridge University Press, Cambridge, United Kingdom and New York, NY, USA, available at: http://www.ipcc.ch/report/ar5/wg3/ (last access: July 2020), 2014b.
Joosten, H. and Clarke, D.: Wise use of mires and peatlands, Background and Principles including a Framework for Decision-making, International Mire Conservation Group and International Peat Society 304, available at: http://www.imcg.net/media/download_gallery/books/wump_wise_use_of_mires_and_peatlands_book.pdf (last access: July 2020), 2002.
JRC: Climatic Zone. Thematic Data Layers, Joint Research Centre (JRC) of the European Commission (EC). Climatic Zone, European Soil Data Centre Portal (ESDAC), available at: https://esdac.jrc.ec.europa.eu/projects/RenewableEnergy/ (last access: July 2020), 2010.
Lähteenoja, O., Reátegui, Y. R., Räsänen, M., Torres, D. D. C., Oinonen, M., and Page, S.: The large Amazonian peatland carbon sink in the subsiding Pastaza-Marañón foreland basin, Peru, Global Change Biol., 18, 164–178, 2012.
Lappalainen, E. (Ed.): Global peat resources, International Peat Society, Jyskä, 1996.
Leifeld, J. and Menichetti, L.: The Underappreciated Potential of Peatlands in Global Climate Change Mitigation Strategies, Nat. Commun., 9, 1071, https://doi.org/10.1038/s41467-018-03406-6, 2018.
Martin, D., Fraser, M. D., Pakeman, R. J., and Moffat, A. M.: Impact of moorland grazing and stocking rates, Natural England Evidence Review NEER006, available at: http://publications.naturalengland.org.uk/publication/5976513 (last access: July 2020), 2013.
Matysek, M., Evers, S., Samuel, M. K., and Sjogersten, S.: High heterotrophic CO2 emissions from a Malaysian oil palm plantations during dry-season, Wetl. Ecol. Manag., 26, 415–424, 2018.
Miettinen, J., Shi, C., and Liew, S. C.: Two decades of destruction in Southeast Asia's peat swamp forests, Front. Ecol. Environ., 10, 124–128, 2012.
Noble, A., Palmer, S. M., Glaves, D. J., Crowle, A., Brown, L. E., and Holden, J.: Prescribed burning, atmospheric pollution and grazing effects on peatland vegetation composition, J. Appl. Ecol., 55, 559–569, 2018.
Page, S. E., Rieley, J. O., and Banks, C. J.: Global and regional importance of the tropical peatland carbon pool, Global Change Biol., 17, 798–818, 2011.
Petersen, R., Goldman, E., Harris, N., Sargent, S., Aksenov, D., Manisha, A., Esipova, E., Shevade, V., Loboda, T., Kuksina, N., and Kurakina, I.: Mapping tree plantations with multispectral imagery: preliminary results for seven tropical countries, World Resources Institute, Washington, D.C., 2016.
Prosperi, P., Bloise, M., Tubiello, F. N., Conchedda, G., Rossi, S., Boschetti, L., Salvatore, M., and Bernoux, M.: New estimates of greenhouse gas emissions from biomass burning and peat fires using MODIS Collection 6 burned areas, Clim. Change, 161, 415–432, 2020.
Rieley, J. and Page, S.: Tropical peatland of the world, in: Tropical Peatland Ecosystems, edited by: Osaki, M. and Tsuji, N., Springer, Japana, 3–32, https://doi.org/10.1007/978-4-431-55681-7, 2016.
Robinson, T. P., Wint, G. R. W., Conchedda, G., Van Boeckel, T. P., Ercoli, V., Palamara, E., Cinardi, G., D'Aietti, L., Hay, S. I., and Gilbert, M.: Mapping the Global Distribution of Livestock, PloS One, 9, e96084, https://doi.org/10.1371/journal.pone.0096084, 2014.
Rossi, S., Tubiello, F. N., Prosperi, P., Salvatore, M., Jacobs, H., Biancalani, R., House, J. I., and Boschetti, L.: FAOSTAT estimates of greenhouse gas emissions from biomass and peat fires, Clim. Change, 135, 699–711, 2016.
Smith, P., Bustamante, M., Ahammad, H., Clark, H., Dong, H., Elsiddig, E. A., Haberl, H., Harper, R., House, J., Jafari, M., Masera, O., Mbow, C., Ravindranath, N. J., Rice, C. W., Robledo Abad, C., Romanovskaya, A., Sperling, F., and Tubiello, F. N.: Agriculture, Forestry and Other Land Use (AFOLU), in: Working Group III contribution to the IPCC 5th Assessment Report, Climate Change 2014: Mitigation of Climate Change, edited by: Edenhofer, O., Pichs-Madruga, R., Sokona, Y., Farahani, E., Kadner, S., Seyboth, K., Adler, A., Baum, I., Brunner, S., Eickemeier, P., Kriemann, B., Savolainen, J., Schlömer, S., von Stechow, C., Zwickel, T., and Minx, J. C., Cambridge University Press, Cambridge, United Kingdom and New York, NY, USA, 2014.
Tiemeyer, B., Freibauer, A., Borraz, E. A., Augustin, J., Bechtold, M., Beetz, S., Beyer, C., Ebli, M., Eickenscheidt, T., Fiedler, S., and Förster, C.: A new methodology for organic soils in national greenhouse gas inventories: Data synthesis, derivation and application, Ecol. Indic., 109, 105838, https://doi.org/10.1016/j.ecolind.2019.105838, 2020.
Tubiello, F. N. and Conchedda, G.: FAOSTAT GHG emissions from organic soils, Zenodo, https://doi.org/10.5281/zenodo.3942370, 2020.
Tubiello, F. N., Biancalani, R., Salvatore, M., Rossi, S., and Conchedda, G.: A worldwide assessment of greenhouse gas emissions from drained organic soils, Sustainability 8, 371, https://doi.org/10.3390/su8040371, 2016.
UCLouvain Geomatic: Land Cover CCI Product User Guide Version 2.0, Université catholique de Louvain, Friederich-Schille-Universität Jena, Wageningen University, Max-Planck-Institut für Meteorologie, JRC European Commission, Met Office, Deliverable ref: D3.3, Belgium, available at: http://maps.elie.ucl.ac.be/CCI/viewer/download/ESACCI-LC-Ph2-PUGv2_2.0.pdf (last access: July 2020), 2017.
Worrall, F. and Clay, G. D.: The impact of sheep grazing on the carbon balance of a peatland, Sci. Total Environ., 438, 426–434, 2012.
Xu, J., Morris, P. J., Liu, J., and Holden, J.: PEATMAP: Refining Estimates of Global Peatland Distribution Based on a Meta-Analysis, Catena, 160, 134–140, 2018.
- Abstract
- Introduction
- Material and methods
- Main results: global trends
- Limitations and uncertainty
- Data validation
- Data availability
- Conclusions
- Appendix A: Additional results
- Appendix B: Tables for validation
- Author contributions
- Competing interests
- Disclaimer
- Acknowledgements
- Review statement
- References