the Creative Commons Attribution 4.0 License.
the Creative Commons Attribution 4.0 License.
 | 09 Nov 2020
Half-hourly changes in intertidal temperature at nine wave-exposed locations along the Atlantic Canadian coast: a 5.5-year study
Julius A. Ellrich
Matthew J. Freeman
Intertidal habitats are unique because they spend alternating periods of submergence (at high tide) and emergence (at low tide) every day. Thus, intertidal temperature is mainly driven by sea surface temperature (SST) during high tides and by air temperature during low tides. Because of that, the switch from high to low tides and vice versa can determine rapid changes in intertidal thermal conditions. On cold-temperate shores, which are characterized by cold winters and warm summers, intertidal thermal conditions can also change considerably with seasons. Despite this uniqueness, knowledge on intertidal temperature dynamics is more limited than for open seas. This is especially true for wave-exposed intertidal habitats, which, in addition to the unique properties described above, are also characterized by wave splash being able to moderate intertidal thermal extremes during low tides. To address this knowledge gap, we measured temperature every half hour during a period of 5.5 years (2014–2019) at nine wave-exposed rocky intertidal locations spanning 415 km of the Atlantic coast of Nova Scotia, Canada. This data set is freely available from the figshare online repository (Scrosati and Ellrich, 2020a; https://doi.org/10.6084/m9.figshare.12462065.v1). We summarize the main properties of this data set by focusing on location-wise values of daily maximum and minimum temperature and daily SST, which we make freely available as a separate data set in figshare (Scrosati et al., 2020; https://doi.org/10.6084/m9.figshare.12453374.v1). Overall, this cold-temperate coast exhibited a wide annual SST range, from a lowest overall value of −1.8 ∘C in winter to a highest overall value of 22.8 ∘C in summer. In addition, the latitudinal SST trend along this coast experienced a reversal from winter (when SST increased southwards) to summer (when SST decreased southwards), seemingly driven by alongshore differences in summer coastal upwelling. Daily temperature maxima and minima were more extreme, as expected from their occurrence during low tides, ranging from a lowest overall value of −16.3 ∘C in winter to a highest overall value of 41.2 ∘C in summer. Daily maximum temperature in summer varied little along the coast, while daily minimum temperature in winter increased southwards. This data set is the first of its kind for the Atlantic Canadian coast and exemplifies in detail how intertidal temperature varies in wave-exposed environments on a cold-temperate coast.
- Article
(4499 KB) - Full-text XML
- BibTeX
- EndNote


Rocky intertidal habitats are those occurring on marine rocky shores between the highest and lowest elevations reached by tides. These environments are unique because they spend alternating periods of submergence (during high tides) and emergence (during low tides) every day (Raffaelli and Hawkins, 1999; Menge and Branch, 2001). Thus, on the one hand, intertidal conditions are influenced by the seasonal changes in sea surface temperature (SST), which can be pronounced on temperate shores, which display warm waters in summer and cold waters in winter. On the other hand, an even greater degree of thermal variation can occur at hourly scales once intertidal habitats become exposed to the air at low tide, especially on hot days in spring and summer (Watt and Scrosati, 2013; Lathlean et al., 2014; Umanzor et al., 2017) and cold days in winter (Scrosati and Ellrich, 2018a).
Temperature is a major factor influencing the distribution and abundance of species (Pörtner, 2002; Körner et al., 2016; Lancaster and Humphreys, 2020). Thus, SST plays an important ecological role in intertidal habitats during high tides (Sanford, 2014), while high (Somero, 2007) and low (Braby, 2007) air temperatures are ecologically relevant during low tides. In addition, not only is average temperature ecologically important, but its temporal variability is as well (Bennedetti-Cecchi et al., 2006). Overall, then, having detailed temperature data across periods of low and high tide is important for intertidal ecology and for making biogeographic predictions based on climate change expectations (Wethey et al., 2011).
Temperature data are available for surface ocean waters worldwide (Fay and McKinley, 2014; Banzon et al., 2016; Freeman and Lovenduski, 2016; Aulicino et al., 2018; Yun et al., 2019). However, data on intertidal temperature are considerably less common in terms of both spatial and temporal coverage (Lathlean et al., 2014; Umanzor et al., 2017; Scrosati and Ellrich, 2018a). This is especially true for wave-exposed intertidal habitats, as remote sensing methods that are commonly used for open waters (e.g., satellites) cannot capture the quick, localized temperature changes caused by tides and waves. Waves can also damage equipment deployed in situ to measure intertidal temperature. For wave-exposed intertidal habitats, temperature data between consecutive low and high tides can also be used to infer physical aspects of the environment such as wave action itself (Harley and Helmuth, 2003).
Wave-exposed rocky intertidal habitats are common along the Canadian coast in Nova Scotia, as this coast faces the open Atlantic Ocean. Several studies have investigated the ecology of these environments (Minchinton and Scheibling, 1991; Hunt and Scheibling, 1998, 2001; Scrosati and Heaven, 2007; Arribas et al., 2014; Molis et al., 2015; Ellrich and Scrosati, 2016; Scrosati and Ellrich, 2018b, 2019; Scrosati, 2020a, b). However, because of their research goals, intertidal temperature was either not measured or analyzed for a few locations or for limited time periods. Therefore, there is a knowledge gap on broad spatiotemporal patterns in intertidal temperature for wave-exposed environments along this coast. To address this gap, this paper discusses a data set consisting of intertidal temperature values measured every half hour at nine wave-exposed locations along the Atlantic coast of Nova Scotia spanning a period of 5.5 years.
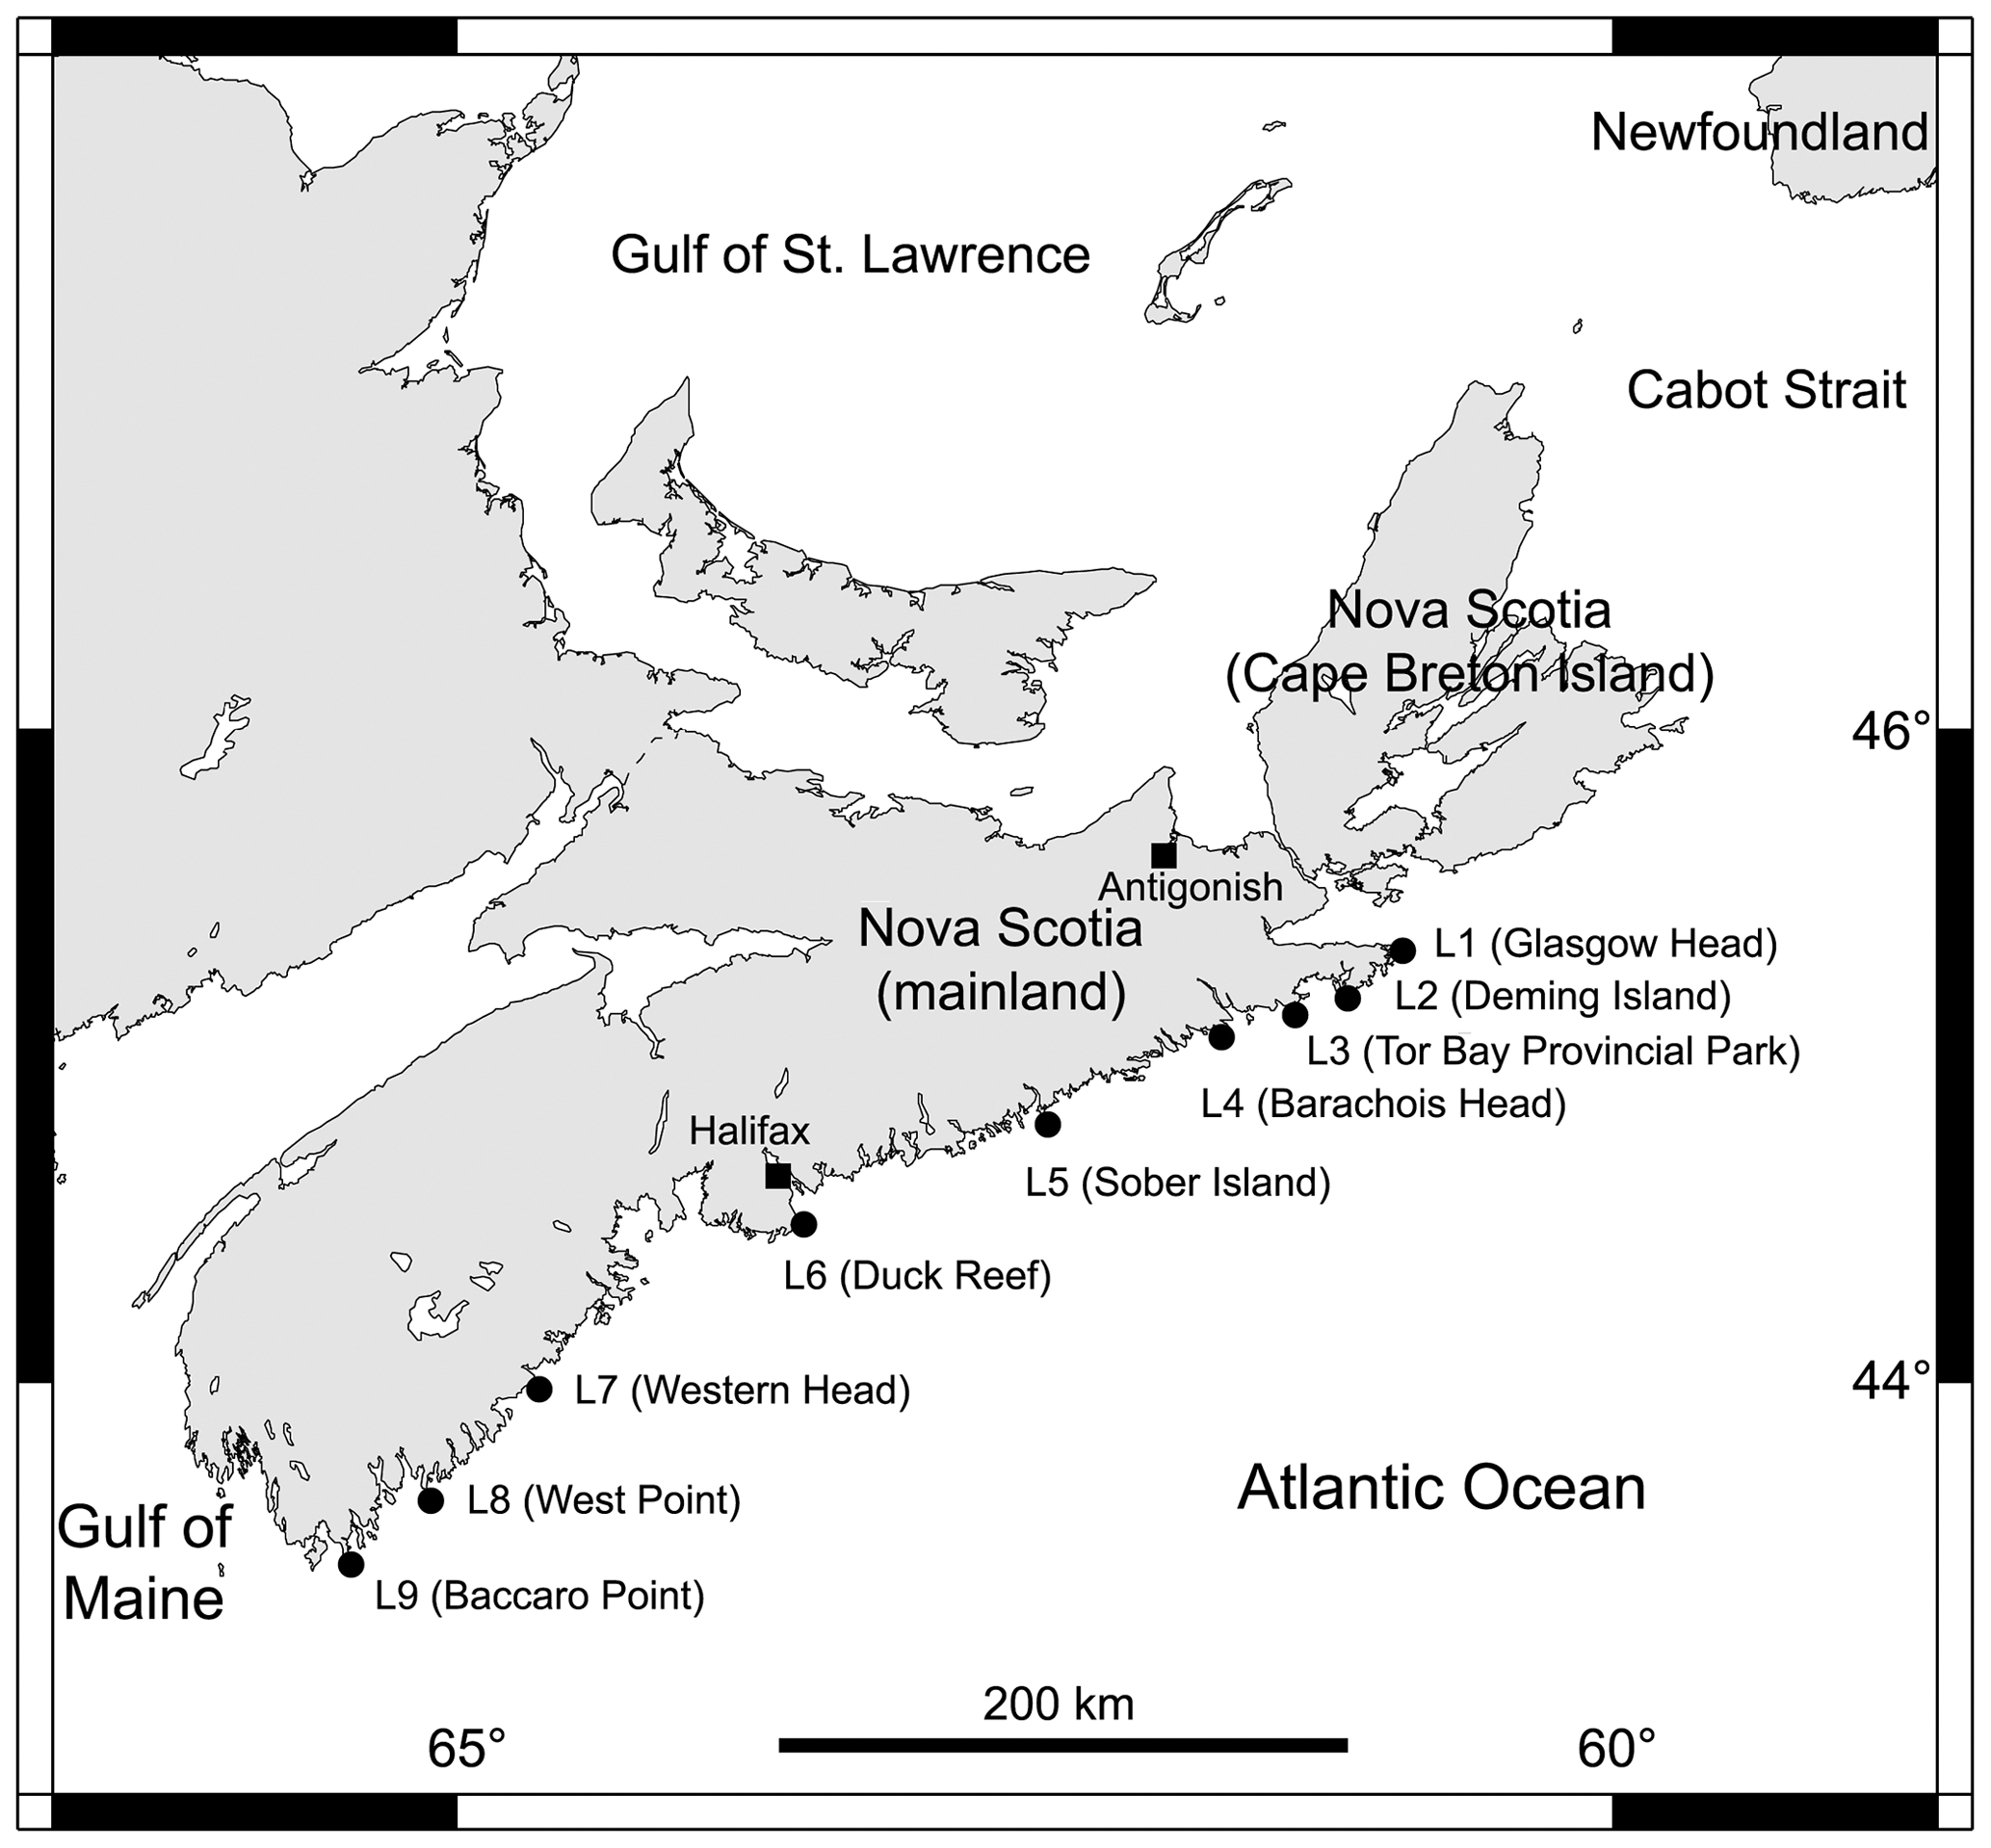
Figure 1Map indicating the position of the nine wave-exposed intertidal locations surveyed along the Atlantic coast of mainland Nova Scotia, Canada.
Table 1Basic information about the nine wave-exposed intertidal locations surveyed for this study.
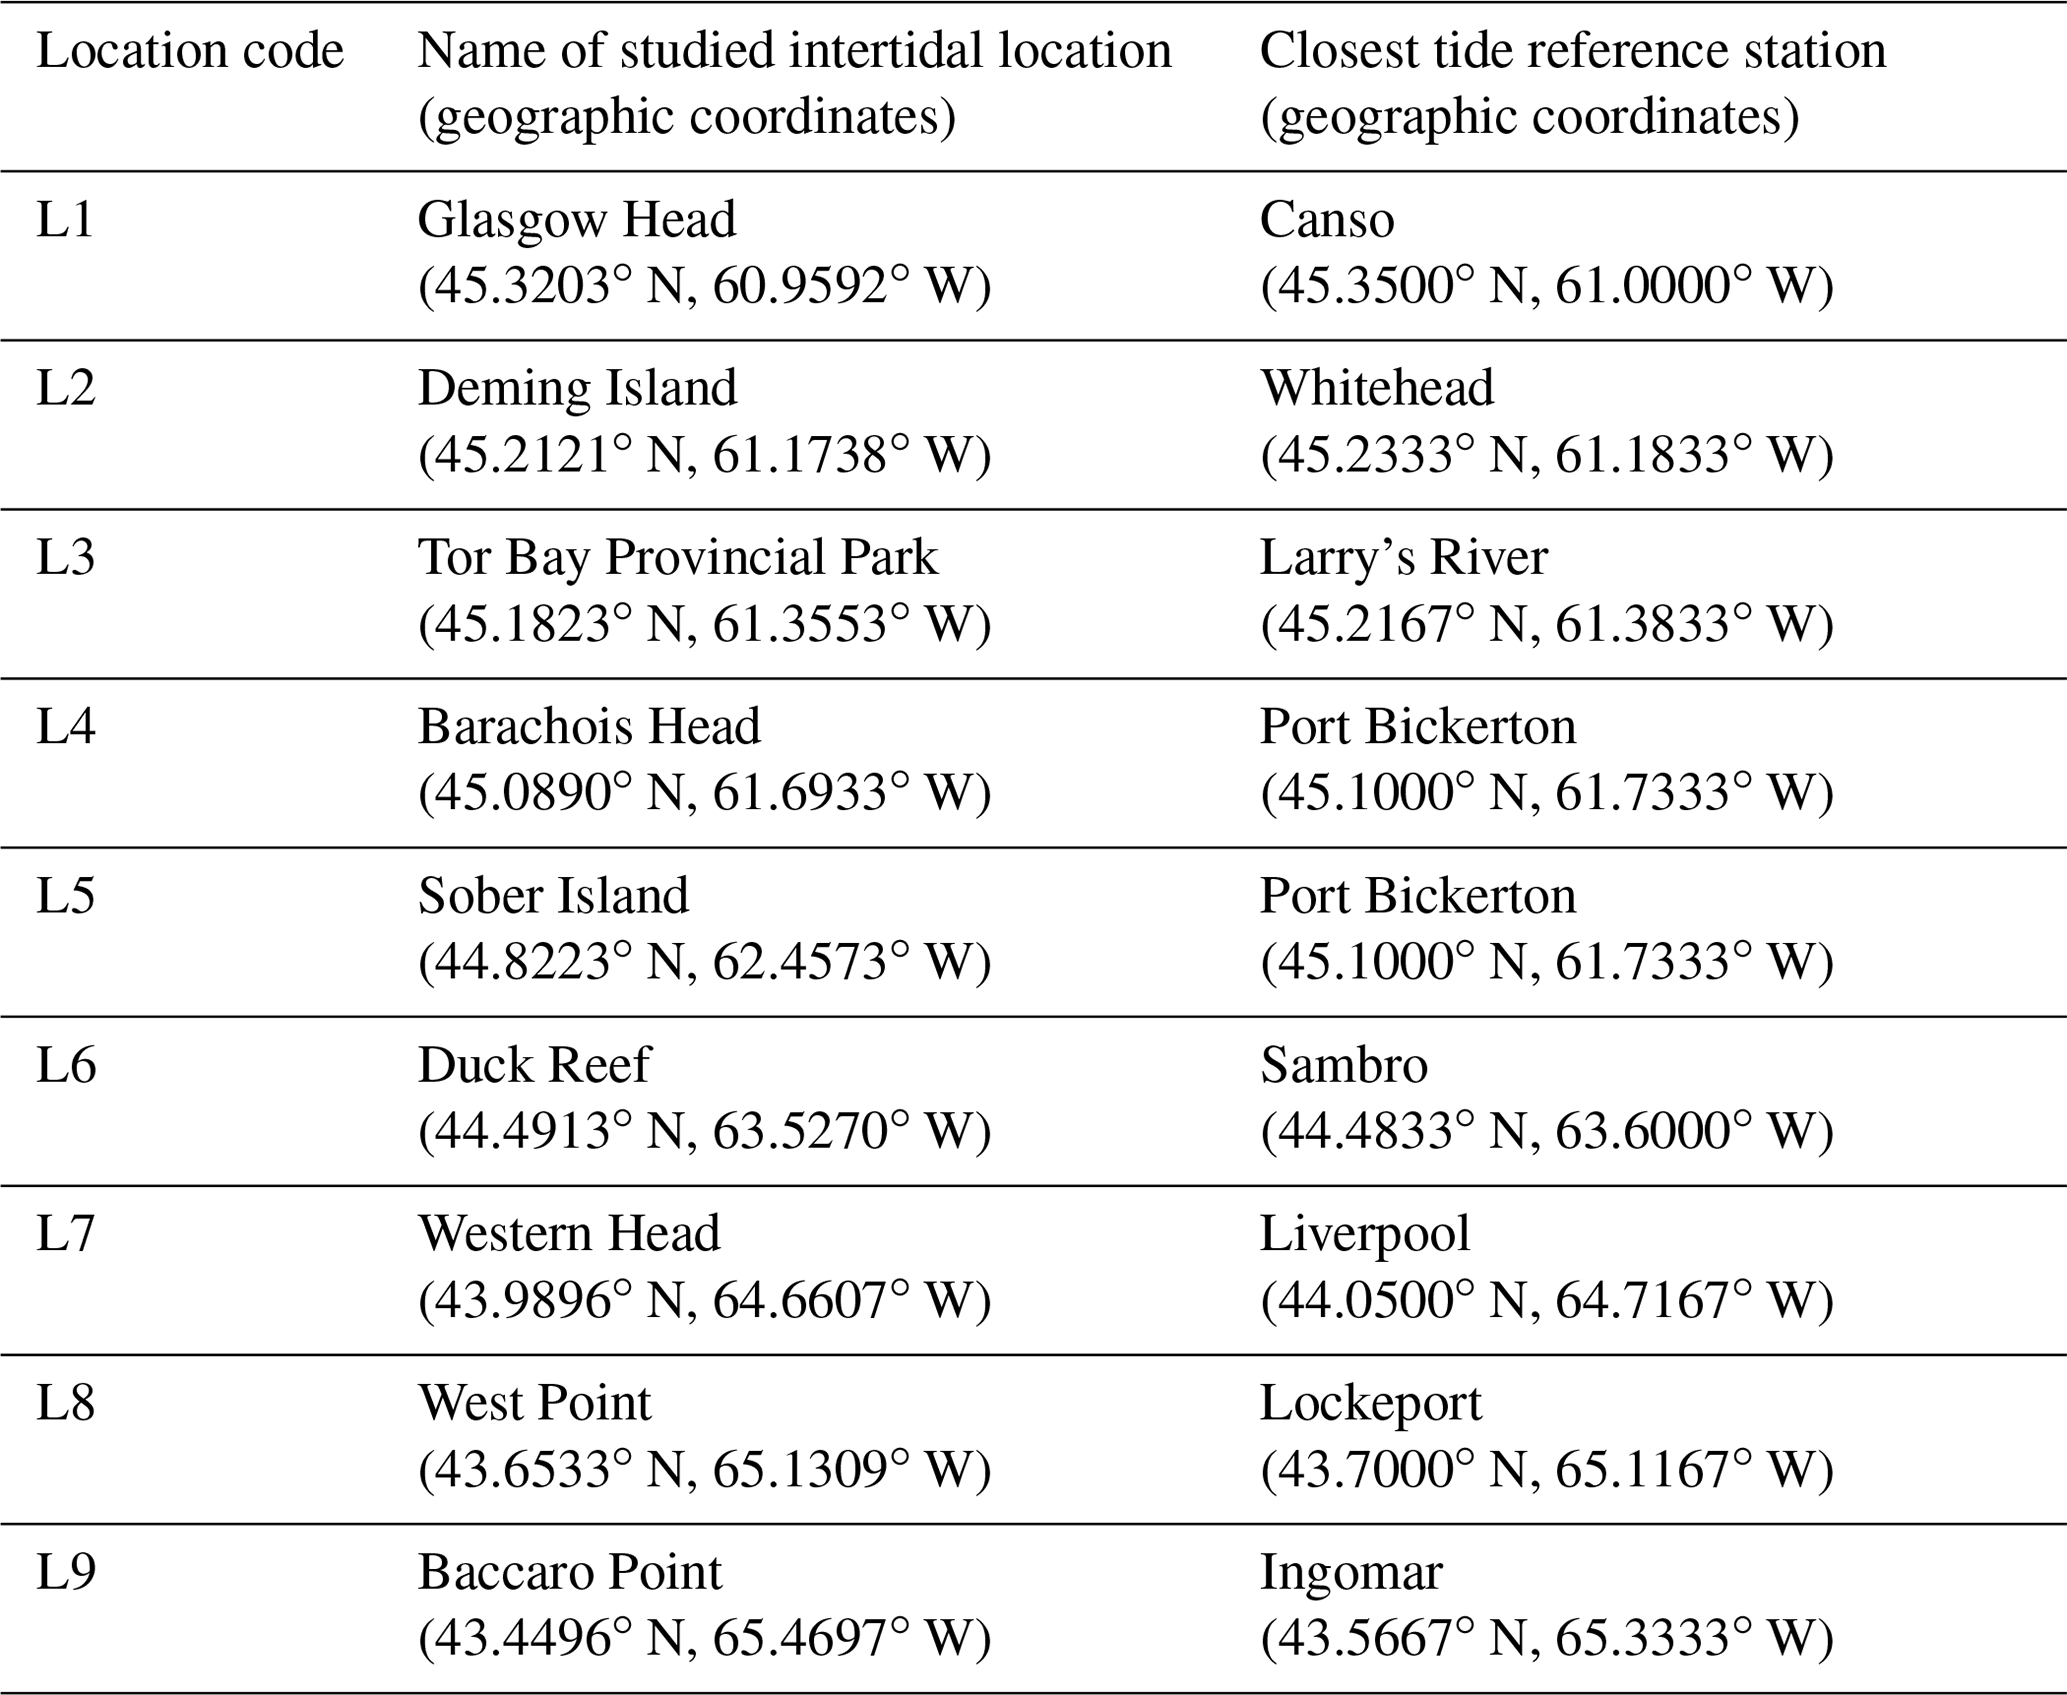
We monitored intertidal temperature at nine locations that span the full extent of the open Atlantic coast of mainland Nova Scotia, nearly 415 km (Fig. 1). For simplicity, these locations are hereafter referred to as L1 to L9 from north to south. Their names and coordinates are provided in Table 1. The substrate of these intertidal locations is stable bedrock. All of them face the open Atlantic Ocean without physical obstructions, so they are wave-exposed. Values of daily maximum water velocity (an indication of wave exposure) measured with dynamometers (see design in Bell and Denny, 1994) in wave-exposed intertidal habitats from this coast range between 6 and 12 m s−1 (Hunt and Scheibling, 2001; Scrosati and Heaven, 2007; Ellrich and Scrosati, 2017). This coast is washed by the Nova Scotia Current, which is a nearshore cool current that flows southwestward from the Cabot Strait to the Gulf of Maine (Fig. 1) and is more prevalent in winter than in summer (Han et al., 1997).
We started to monitor intertidal temperature in April–May 2014 at L2–L9 and in April 2015 at L1 (see the precise dates in Scrosati and Ellrich, 2020a). We measured temperature with submersible loggers (HOBO Pendant logger, Onset Computer, Bourne, MA, USA) that were kept attached to the intertidal substrate with plastic cable ties secured to eye screws drilled into the substrate, allowing almost no contact between the loggers and the substrate. We kept the substrate around the loggers always free of macroalgal canopies and sessile invertebrates. To have a continuous temperature record during the 5.5 years of this study, we replaced the loggers periodically. At each location, we installed replicate loggers several metres apart from one another at the same elevation (just above the mid-intertidal zone). As tidal amplitude increases by 33 % from 1.8 m at L1 to 2.4 m at L9 (Tide-Forecast, 2020) and as wave exposure could change along the coast (and thus wave splash up the shore at low tides) even though all locations face the open ocean, we had to carefully determine the elevation of installation of the loggers at each location to have all loggers installed at the same relative elevation along the coast in terms of exposure to aerial conditions during low tides. To achieve this, for each location we considered the intertidal range to be the vertical distance between chart datum (0 m in elevation or the lowest normal tide in Canada) and the highest elevation where sessile perennial organisms (the barnacle Semibalanus balanoides) occurred on the substrate outside of crevices, since such a high boundary summarizes differences in tidal amplitude and wave exposure along the coast (Scrosati and Heaven, 2007). Then, we divided the resulting intertidal range for each location by 3 and installed the loggers just above the bottom boundary of the upper third of the intertidal range. Following this method, loggers were installed at an elevation (in metres above chart datum with the high barnacle boundary stated in parenthesis) of 1.17 m at L1 (1.75 m), 1.13 m at L2 (1.69 m), 1.30 m at L3 (1.95 m), 1.57 m at L4 (2.36 m), 1.08 m at L5 (1.62 m), 1.49 m at L6 (2.24 m), 1.49 m at L7 (2.24 m), 1.41 m at L8 (2.11 m), and 1.63 m at L9 (2.44 m). We set all loggers to record temperature every 30 min. We stopped recording temperature in November 2018 at L1 and L3 and in August–October 2019 at L2 and L4–L9 (see the precise dates in Scrosati and Ellrich, 2020a). For each location, temperature was highly correlated between the replicate loggers during the study period (mean r=0.97). Thus, we averaged the corresponding half-hourly values to generate one time series of half-hourly temperature data for each location for the studied period, which is the data set discussed in this paper and publicly available from the figshare online repository (Scrosati and Ellrich, 2020a).

Figure 2Daily MaxT (red line), MinT (blue line), and SST (black line) at the nine intertidal locations (L1 to L9, from north to south) surveyed between April 2014 and October 2019.
Due to its high temporal resolution, this data set could be used in the future for a variety of purposes. To summarize its main properties here, we extracted values that are commonly used in intertidal ecology and coastal oceanography and that therefore could be of immediate interest: daily maximum and minimum temperature (MaxT and MinT, respectively) and daily SST. As the Nova Scotian coast is cold-temperate, we expected SST to often be considerably lower than MaxT in spring and summer, as MaxT is then reached during low tides when intertidal environments are usually exposed to high air temperatures. Conversely, we expected SST and MaxT to be more similar or even the same in winter, as low tides then often expose intertidal habitats to negative air temperatures below the freezing point of seawater. For these same reasons, we also expected SST to be typically higher than MinT in winter, as MinT is then generally reached during low tides, but more similar to MinT in spring and summer. For each location, we extracted the values of daily MaxT, MinT, and SST from the corresponding set of half-hourly data on intertidal temperature (Scrosati and Ellrich, 2020a). We considered daily SST as the temperature recorded closest to the time of the highest tide of each day, as the loggers were then fully submerged in seawater. We determined the time of such tides using information (Tide and Current Predictor, 2020) for the tide reference stations that are closest to our intertidal locations (Table 1).
We obtained half-hourly temperature data during the monitoring period specified above for each location with just two exceptions: the period between 20 March and 12 April 2017 for L1 (because of logger removal by drift sea ice coming from the Gulf of St. Lawrence) and the period between 30 September 2014 and 26 April 2015 for L9 (because of logger loss caused by wave action). Continued monitoring after both periods was possible after installing new loggers. This data set is available online (Scrosati and Ellrich, 2020a).
Table 2Summary values of daily MaxT, MinT, and SST (∘C) for the nine wave-exposed intertidal locations (L1 to L9, from north to south) surveyed between 2014 and 2019 along the Atlantic Canadian coast (see Methods for details on how each row of values was determined).
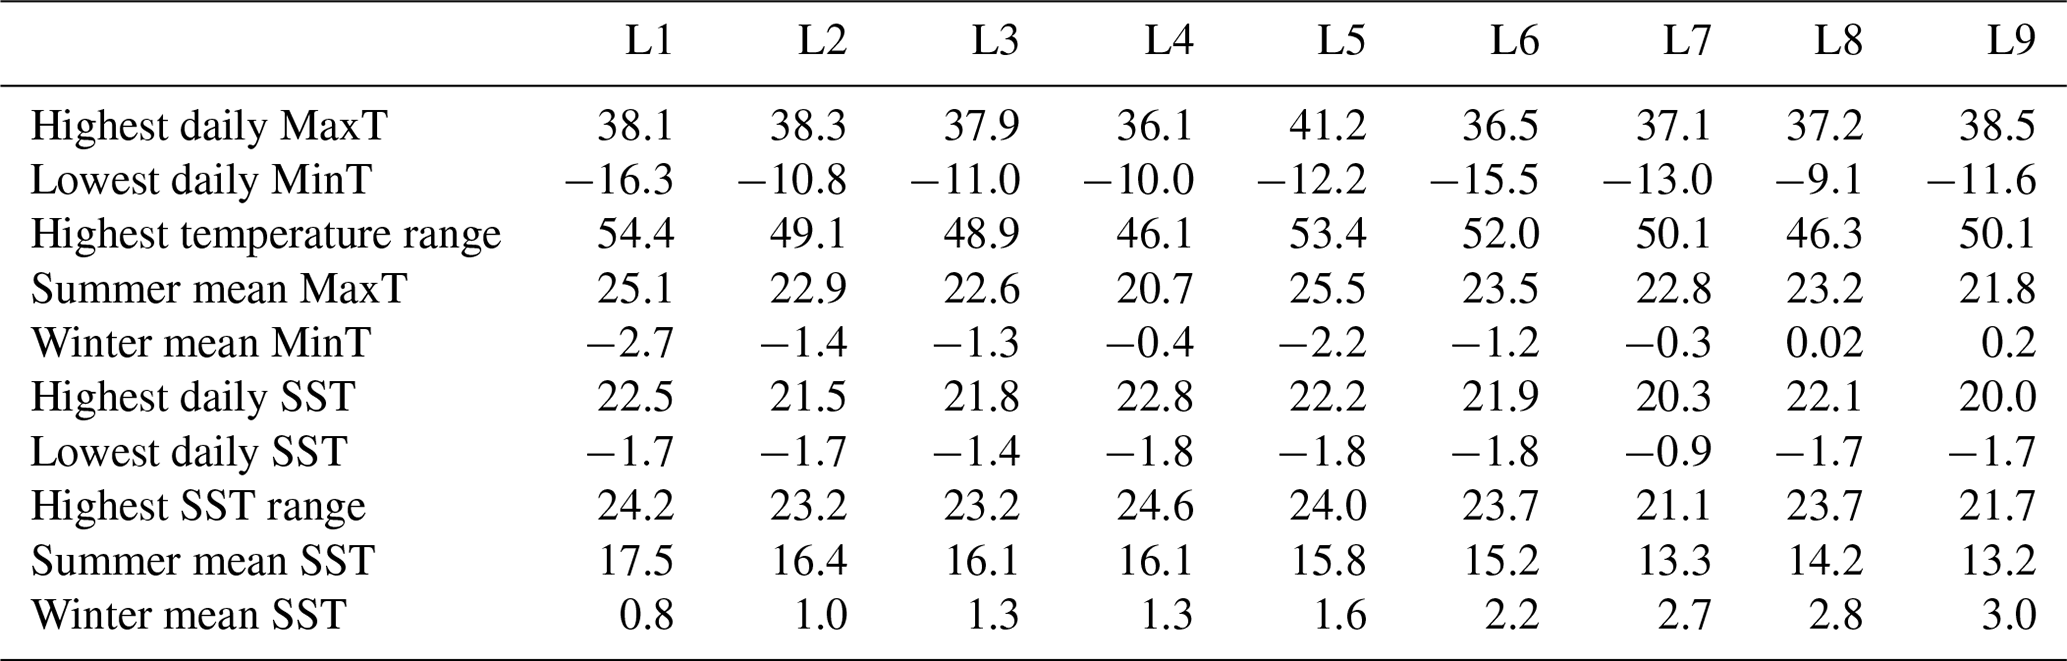
The temporal changes in daily MaxT, MinT, and SST during the studied period at each location are shown in Fig. 2. For convenience, all of these daily values are also available from the figshare online repository (Scrosati et al., 2020). The highest and lowest values of SST for each location (Table 2) reveal that this cold-temperate coast has a wide seasonal range of SSTs (see worldwide SST ranges in Fig. 6.3 in Stewart, 2008). The highest location-wise values of SST occurred in summer and ranged between 20 and 22.8 ∘C, while the lowest location-wise SST values occurred in winter and were near the freezing point of seawater, between −0.9 and −1.8 ∘C (Table 2, Fig. 2). We note that, unlike the nearby Gulf of St. Lawrence (Fig. 1; Saucier et al., 2003) or wave-sheltered coves along the Atlantic coast of Nova Scotia, open waters washing wave-exposed habitats along the Atlantic coast of Nova Scotia do not freeze in winter (Canadian Ice Service, 2020). Overall, for the studied period, the location-wise difference between the highest and lowest SST values ranged between 21.1 and 24.6 ∘C. Although there was some patchiness in this seasonal SST range along the coast, it was lowest in two southern locations (L7 and L9) driven by lower values of maximum summer SST there (Table 2).
The occurrence of the lowest location-wise values of maximum summer SST at two southern locations (L7 and L9) is related to a broader alongshore pattern. Based on the data for the summer months (for convenience, July, August, and September) for the years when SST was measured at all locations in those months (2015, 2016, 2017, and 2018), mean location-wise SST in summer decreased from north to south, from 17.5 ∘C at L1 to 13.2 ∘C at L9 (Table 2). In contrast, an equivalent analysis done for winter months (for convenience, January, February, and March) for the years when SST was measured at all locations in those months (2016, 2017, and 2018) revealed that mean location-wise SST in winter actually increased from north to south, from 0.8 ∘C at L1 to 3.0 ∘C at L9 (Table 2). In other words, a summer-to-winter reversal in the latitudinal trend in intertidal SST takes place on this coast, as waters are warmer in summer and colder in winter in northern locations than in southern locations.
The southward decrease of intertidal SST in summer is likely influenced by alongshore differences in coastal upwelling. On the Atlantic coast of Nova Scotia, upwelling-favourable winds are more common in summer than in winter (Garrett and Loucks, 1976; Dever et al., 2018). Although possible alongshore differences in upwelling have not been studied in detail, they seem to exist. For example, Petrie et al. (1987) reported that seawater temperature at 6–20 m of depth decreased from June to July 1984 near L6–L7 because of wind-driven upwelling, while temperature at those depths increased north of that coastal range during that period. More recently, Shan et al. (2016) have also referred to wind-driven upwelling on the southeastern Nova Scotian coast. A detailed analysis of daily changes in intertidal SST is beyond the objectives of this paper. However, Fig. 2 reveals basic differences in summer cooling between northern and southern locations. Summer cooling events were generally marked in southern locations, especially at L6 and L7 where SST could drop by 10 ∘C in 5–10 d, in some cases reaching values below 5 ∘C (Fig. 2). An analysis of coastal winds at L6 and L7 indicated that wind-driven upwelling explained the cooling observed at those locations in July 2014 (Scrosati and Ellrich, 2020b). Although persistent, the summer cooling signal that was often pronounced at L6 and L7 (Fig. 2) weakened progressively towards northern locations, especially at L1 and L2. In fact, at L1, SST never dropped below 10 ∘C in summer months (Fig. 2). These considerations could orient future research to unravel the drivers of the latitudinal changes in summer SST revealed by this study.
The southward increase of intertidal SST observed in winter could be a result of latitudinal changes in heat flux from the atmosphere (Stewart, 2008; Deser et al., 2010; Shan et al., 2016), although other processes are also generally at play in coastal environments (Hebert et al., 2016; Larouche and Galbraith, 2016). For example, for the studied coast, the abundant sea ice formed across the Gulf of St. Lawrence (Fig. 1) every winter (Saucier et al., 2003) may contribute to keeping intertidal SST low at our northern locations, as the waters that leave this gulf flow southwards following the coast of mainland Nova Scotia (Han et al., 1997; Hebert et al., 2016; Dever et al., 2018), reaching our northern locations first before they warm up on their way south.
As expected from the warm summers and cold winters that characterize eastern Canada (Government of Canada, 2020), MaxT was often considerably higher than SST in spring and summer and MinT was often lower than SST in fall and winter (Fig. 2), as MaxT and MinT typically take place at low tide during those respective seasons. The highest location-wise values of MaxT almost doubled those of SST, as they ranged between 36.1 and 41.2 ∘C. The lowest location-wise values of MinT ranged between −9.1 and −16.3 ∘C. Therefore, the location-wise difference between the highest and lowest daily temperatures, which ranged between 46.1 and 54.4 ∘C, generally more than doubled the location-wise difference between the highest and lowest daily SST values (Table 2).
The highest value of MaxT differed little among locations (Table 2). Based on the data for the summer months (for convenience, July, August, and September) for the years when MaxT was measured at all locations in those months (2015, 2016, 2017, and 2018), mean location-wise MaxT in summer exhibited patchiness along the coast without any clear latitudinal trend (Table 2). As MaxT in summer generally occurs during aerial exposure at low tides, both climatic and oceanographic influences may interact to determine its alongshore pattern. For instance, summer values of MaxT might simply be expected to increase southwards following warmer air temperatures on land (Government of Canada, 2020). However, the drop in SST in southern locations in summer due to coastal upwelling might actually temper air temperatures right on the coast, thus limiting MaxT. In the end, climate and oceanography might together be responsible for the patchy alongshore MaxT pattern, which seems dependent on local conditions. Researching these possibilities could thus be of interest. In contrast, the data for winter months (for convenience, January, February, and March) for the years when MinT was measured at all locations in those months (2016, 2017, and 2018) revealed that mean location-wise MinT in winter generally increased from north to south, the lowest such average (−2.7 ∘C) registered at L1 and the highest one (0.2 ∘C) at L9 (Table 2). Thus, the alongshore pattern of winter MinT may more clearly respond to typical latitudinal changes in winter air temperatures and perhaps also to influences of Gulf of St. Lawrence sea ice (see above) on northern locations.
Another salient property of our data is that the daily changes in MaxT in spring and summer and MinT in fall and winter were much larger than the corresponding daily changes in SST (Fig. 2). Such a high day-to-day variability in MaxT and MinT likely reflects daily changes in weather conditions, which affect intertidal habitats at low tides, as well as wave exposure, as wave-generated splash during low tides on wavy days keep intertidal habitats wet and, thus, often cooler than the air in summer and warmer than the air in winter. Therefore, the interaction between weather and wave action as a determinant of intertidal thermal extremes is another research area deserving attention in the future. Ultimately, given the prominent role of extreme abiotic events in ecology (Denny et al., 2009; Smith, 2011; Nowicki et al., 2019), the marked daily changes in MaxT and MinT during those seasons highlight the potentially critical role of low tides for the survival of intertidal organisms in these environmentally variable habitats.
Another interesting characteristic of our data set is that the daily average between MaxT and MinT was generally higher than SST in spring and summer but generally lower than SST in fall and winter (Fig. 2). In other words, the average intertidal temperature measured during low tides increased faster from winter to summer and decreased faster from summer to winter than SST. This difference likely reflects the difference in heat capacity between air and water, which makes SST follow air temperatures throughout seasons with a delay (Stewart, 2008).
Our data set could also be useful to investigate climatic drivers of interannual differences in intertidal temperature. For example, a marked difference in upwelling-driven coastal cooling at L6 and L7 between July 2014 (strong) and July 2015 (weak) was related to normal (2014) versus El Niño (2015) conditions (Scrosati and Ellrich, 2020b). Although El Niño–Southern Oscillation (ENSO) is predominantly a Pacific phenomenon (Timmermann et al., 2018), it is also related to interannual weather changes in North America through climatic teleconnections (George and Wolfe, 2009; Wu and Lin, 2012; Whan and Zwiers, 2017; Dai and Tan, 2019). Another large-scale climate phenomenon, the North Atlantic Oscillation (NAO), influences weather patterns mainly in the North Atlantic basin (Hanna and Cropper, 2017). It would thus be interesting to study whether NAO and ENSO might interact (Wu and Lin, 2012; Nalley et al., 2019) to affect winds, upwelling, and ultimately intertidal temperature along the Nova Scotian coast.
The full data set on half-hourly temperature measured at the nine intertidal locations between 2014 and 2019 is available from the figshare online repository (Scrosati and Ellrich, 2020a; https://doi.org/10.6084/m9.figshare.12462065.v1). The daily values of MaxT, MinT, and SST for these locations during this time period are also available from the figshare online repository (Scrosati et al., 2020; https://doi.org/10.6084/m9.figshare.12453374.v1).
This is a unique data set because it describes intertidal temperature with a high temporal resolution during a period of 5.5 years at nine wave-exposed locations spanning the full extent of the Atlantic coast of mainland Nova Scotia. The main patterns described above have revealed previously unknown latitudinal and seasonal trends in intertidal temperature on this coast. The above considerations on the possible mechanisms underlying these patterns should help orient future research on the drivers of thermal variation in these intertidal environments. Because of the temporal and spatial scales of this data set, future research using these data could lead to theoretical advances in coastal oceanography and intertidal thermal ecology. Ultimately, this data set represents a detailed baseline on which to study the influence of climatic and oceanographic change on intertidal temperature variation on this cold-temperate coast.
RAS designed the study and wrote the paper. RAS and JAE led the field work and JAE and MJF the data curation. JAE and MJF reviewed the paper before submission.
The authors declare that they have no conflict of interest.
We thank Alexis Catalán, Carmen Denfeld, Willy Petzold, and Maike Willers for field assistance and two reviewers for constructive comments on an earlier version of this paper.
This study was funded by grants awarded to Ricardo A. Scrosati by the Natural Sciences and Engineering Research Council of Canada (NSERC Discovery Grant no. 311624), the Canada Research Chairs program (CRC grant no. 210283), and the Canada Foundation for Innovation (CFI Leaders Opportunity Grant no. 202034) and by a postdoctoral fellowship awarded to Julius A. Ellrich by the German Academic Exchange Service (DAAD fellowship no. 91617093).
This paper was edited by Giuseppe M. R. Manzella and reviewed by two anonymous referees.
Arribas, L. P., Donnarumma, L., Palomo, M. G., and Scrosati, R. A.: Intertidal mussels as ecosystem engineers: their associated invertebrate biodiversity under contrasting wave exposures, Mar. Biodiv., 44, 203–211, 2014.
Aulicino, G., Cotroneo, Y., Ansorge, I., van den Berg, M., Cesarano, C., Belmonte Rivas, M., and Olmedo Casal, E.: Sea surface salinity and temperature in the southern Atlantic Ocean from South African icebreakers, 2010–2017, Earth Syst. Sci. Data, 10, 1227–1236, https://doi.org/10.5194/essd-10-1227-2018, 2018.
Banzon, V., Smith, T. M., Chin, T. M., Liu, C., and Hankins, W.: A long-term record of blended satellite and in situ sea-surface temperature for climate monitoring, modeling and environmental studies, Earth Syst. Sci. Data, 8, 165–176, https://doi.org/10.5194/essd-8-165-2016, 2016.
Bell, E. C. and Denny, M. W.: Quantifying “wave exposure”: a simple device for recording maximum velocity and results of its use at several field sites, J. Exp. Mar. Biol. Ecol., 181, 9–29, 1994.
Bennedetti-Cecchi, L., Bertocci, I., Vaselli, S., and Maggi, E.: Temporal variance reverses the impact of high mean intensity of stress in climate change experiments, Ecology, 87, 2489–2499, 2006.
Braby, C. E.: Cold stress, in: Encyclopedia of Tidepools and Rocky Shores, edited by: Denny, M. W. and Gaines, S. D., University of California Press, Berkeley, 148–150, 2007.
Canadian Ice Service: Ice forecasts and observations, available at: https://www.canada.ca/en/environment-climate-change/services/ice-forecasts-observations.html, last access: 3 November 2020.
Dai, Y. and Tan, B.: On the role of the Eastern Pacific teleconnection in ENSO impacts on wintertime weather over East Asia and North America, J. Clim., 32, 1217–1234, 2019.
Denny, M. W., Hunt, L. J. H., Miller, L. P., and Harley, C. D. G.: On the prediction of extreme ecological events, Ecol. Monogr., 79, 397–421, 2009.
Deser, C., Alexander, M. A., Xie, S. P., and Phillips, A. S.: Sea surface temperature variability: patterns and mechanisms, Annu. Rev. Mar. Sci., 2, 115–143, 2010.
Dever, M., Skagseth, Ø., Drinkwater, K., and Hebert, D.: Frontal dynamics of a buoyancy-driven coastal current: quantifying buoyancy, wind, and isopycnal tilting influence on the Nova Scotia current, J. Geophys. Res.-Oceans, 123, 4988–5003, 2018.
Ellrich, J. A. and Scrosati, R. A.: Water motion modulates predator nonconsumptive limitation of prey recruitment, Ecosphere, 7, e01402, https://doi.org/10.1002/ecs2.1402, 2016.
Ellrich, J. A. and Scrosati, R. A.: Maximum water velocities in wave-exposed rocky intertidal habitats from Deming Island, Atlantic coast of Nova Scotia, Canada, Pangaea, Data set, https://doi.pangaea.de/10.1594/pangaea.880722, 2017.
Fay, A. R. and McKinley, G. A.: Global open-ocean biomes: mean and temporal variability, Earth Syst. Sci. Data, 6, 273–284, https://doi.org/10.5194/essd-6-273-2014, 2014.
Freeman, N. M. and Lovenduski, N. S.: Mapping the Antarctic Polar Front: weekly realizations from 2002 to 2014, Earth Syst. Sci. Data, 8, 191–198, https://doi.org/10.5194/essd-8-191-2016, 2016.
Garrett, C. J. R. and Loucks, R. H.: Upwelling along the Yarmouth shore of Nova Scotia, J. Fish. Res. Board Can., 33, 116–117, 1976.
George, S. S. and Wolfe, S. A.: El Niño stills winter winds across the southern Canadian Prairies, Geophys. Res. Lett., 36, L23806, https://doi.org/10.1029/2009GL041282, 2009.
Government of Canada: Past weather and climate, Historical data, available at: http://climate.weather.gc.ca/historical_data/search_historic_data_e.html, last access: 3 November 2020.
Han, G., Hannah, C. G., Loder, J. W., and Smith, P. C.: Seasonal variation of the three-dimensional mean circulation over the Scotian Shelf, J. Geophys. Res., 102, 1011–1025, 1997.
Hanna, E. and Cropper, T. E.: North Atlantic Oscillation, Oxford Research Encyclopedia of Climate Science, Oxford University Press, https://doi.org/10.1093/acrefore/9780190228620.013.22, 2017.
Harley, C. D. G. and Helmuth, B. S. T.: Local- and regional-scale effects of wave exposure, thermal stress, and absolute versus effective shore level on patterns of intertidal zonation, Limnol. Oceanogr., 48, 1498–1508, 2003.
Hebert, D., Pettipas, R., Brickman, D., and Dever, M.: Meteorological, sea ice, and physical oceanographic conditions on the Scotian Shelf and in the Gulf of Maine during 2015, DFO Can. Sci. Advis. Sec. Res. Doc. 2016/083, 2016.
Hunt, H. L. and Scheibling, R. E.: Effects of whelk (Nucella lapillus (L.)) predation on mussel (Mytilus trossulus (Gould), M. edulis (L.)) assemblages in tidepools and on emergent rock on a wave-exposed rocky shore in Nova Scotia, Canada, J. Exp. Mar. Biol. Ecol., 226, 87–113, 1998.
Hunt, H. L. and Scheibling, R. E.: Patch dynamics of mussels on rocky shores: integrating process to understand pattern, Ecology, 82, 3213–3231, 2001.
Körner, C., Basler, D., Hoch, G., Kollas, C., Lenz, A., Randin, C. F., Vitasse, Y., and Zimmermann, N. E.: Where, why and how? Explaining the low-temperature range limits of temperate tree species, J. Ecol., 104, 1076–1088, 2016.
Lancaster, L. T. and Humphreys, A. M.: Global variation in the thermal tolerances of plants, P. Natl. Acad. Sci. USA, 117, 13580–13587, 2020.
Larouche, P. and Galbraith, P. S.: Canadian coastal seas and Great Lakes sea surface temperature climatology and recent trends, Can. J. Remote Sens., 42, 243–258, 2016.
Lathlean, J. A., Ayre, D. J., and Minchinton, T. E.: Estimating latitudinal variability in extreme heat stress on rocky intertidal shores, J. Biogeogr., 41, 1478–1491, 2014.
Menge, B. A. and Branch, G. M.: Rocky intertidal communities, in: Marine Community Ecology, edited by: Bertness, M. D., Gaines, S. D., and Hay, M. H., Sinauer, Sunderland, 221–251, 2001.
Minchinton, T. E. and Scheibling, R. E.: The influence of larval supply and settlement on the population structure of barnacles, Ecology, 72, 1867–1879, 1991.
Molis, M., Scrosati, R. A., El-Belely, E. F., Lesniowski, T., and Wahl, M.: Wave-induced changes in seaweed toughness entail plastic modifications in snail traits maintaining consumption efficacy, J. Ecol., 103, 851–859, 2015.
Nalley, D., Adamowski, J., Biswas, A., Gharabaghi, B., and Hu, W.: A multiscale and multivariate analysis of precipitation and streamflow variability in relation to ENSO, NAO, and PDO, J. Hydrol., 574, 288–307, 2019.
Nowicki, R., Heithaus, M., Thomson, J., Burkholder, D., Gastrich, K., and Wirsing, A.: Indirect legacy effects of an extreme climatic event on a marine megafaunal community, Ecol. Monogr., 89, e01365, https://doi.org/10.1002/ecm.1365, 2019.
Petrie, B., Topliss, B. J., and Wright, D. G.: Coastal upwelling and eddy development off Nova Scotia, J. Geophys. Res., 29, 12979–12991, 1987.
Pörtner, H. O.: Climate variations and the physiological basis of temperature-dependent biogeography: systemic to molecular hierarchy of thermal tolerance in animals, Comp. Biochem. Physiol. Part A: Mol. Integr. Physiol., 132, 739–761, 2002.
Raffaelli, D. and Hawkins, S.: Intertidal Ecology, Chapman & Hall, London, 1999.
Sanford, E.: The biogeography of marine communities, in: Marine Community Ecology and Conservation, edited by: Bertness, M. D., Bruno, J. F., Silliman, B. R., and Stachowicz, J. J., Sinauer, Sunderland, 131–163, 2014.
Saucier, F. J., Roy, F., Gilbert, D., Pellerin, P., and Ritchie, H.: Modeling the formation and circulation processes of water masses and sea ice in the Gulf of St. Lawrence, Canada, J. Geophys. Res., 108, 3269, https://doi.org/10.1029/2000JC000686, 2003.
Scrosati, R. A.: Upwelling spike and marked SST drop after the arrival of cyclone Dorian to the Atlantic Canadian coast, J. Sea Res., 159, 101888, https://doi.org/10.1016/j.seares.2020.101888, 2020a.
Scrosati, R. A.: Cyclone-driven coastal upwelling and cooling depend on location relative to the cyclone's path: evidence from Dorian's arrival to Atlantic Canada, Front. Mar. Sci., 7, 651, https://doi.org/10.3389/fmars.2020.00651, 2020b.
Scrosati, R. A. and Ellrich, J. A.: Thermal moderation of the intertidal zone by seaweed canopies in winter, Mar. Biol., 165, 115, https://doi.org/10.1007/s00227-018-3374-3, 2018a.
Scrosati, R. A. and Ellrich, J. A.: Benthic-pelagic coupling and bottom-up forcing in rocky intertidal communities along the Atlantic Canadian coast, Ecosphere, 9, e02229, https://doi.org/10.1002/ecs2.2229, 2018b.
Scrosati, R. A. and Ellrich, J. A.: A 5-year study (2014–2018) of the relationship between coastal phytoplankton abundance and intertidal barnacle size along the Atlantic Canadian coast, PeerJ, 7, e6892, https://doi.org/10.7717/peerj.6892, 2019.
Scrosati, R. A. and Ellrich, J. A.: Half-hourly temperature data measured at nine wave-exposed intertidal locations along the Atlantic coast of Nova Scotia, Canada (2014–2019), figshare data set, https://doi.org/10.6084/m9.figshare.12462065.v1, 2020a.
Scrosati, R. A. and Ellrich, J. A.: Marked contrast in wind-driven upwelling on the southeastern Nova Scotia coast in July of two years differing in ENSO conditions, Oceanol. Hydrobiol. Stud., 49, 81–87, 2020b.
Scrosati, R. A., Ellrich, J. A., and Freeman, M. J.: Daily SST, maximum temperature, and minimum temperature at nine wave-exposed intertidal locations along the Atlantic coast of Nova Scotia, Canada (2014–2019), figshare data set, https://doi.org/10.6084/m9.figshare.12453374.v1, 2020.
Scrosati, R. and Heaven, C.: Spatial trends in community richness, diversity, and evenness across rocky intertidal environmental stress gradients in eastern Canada, Mar. Ecol. Prog. Ser., 342, 1–14, 2007.
Shan, S., Sheng, J., Ohashi, K., and Dever, M.: Assessing the performance of a multi-nested ocean circulation model using satellite remote sensing and in-situ observations, Satell. Oceanogr. Meteorol., 1, 39–59, 2016.
Smith, M. D.: An ecological perspective on extreme climatic events: a synthetic definition and framework to guide future research, J. Ecol., 99, 656–663, 2011.
Somero, G.: Heat stress, in: Encyclopedia of Tidepools and Rocky Shores, edited by: Denny, M. W. and Gaines, S. D., University of California Press, Berkeley, 266–270, 2007.
Stewart, R. H.: Introduction to physical oceanography, Open Textbook Library, available at: https://open.umn.edu/opentextbooks/textbooks/introduction-to-physical-oceanography (last access: 3 November 2020), 2008.
Tide and Current Predictor: Tidal height and current site selection, available at: http://tbone.biol.sc.edu/tide/index.html, last access: 3 November 2020.
Tide-Forecast: Tide times and tide charts worldwide, available at: http://www.tide-forecast.com, last access: 3 November 2020.
Timmermann, A., An, S., Kug, J. S., Jin, F. F., Cai, W., Capotondi, A., Cobb, K., Lengaigne, M., McPhaden, M. J., Stuecker, M. F., Stein, K., Wittenberg, A. T., Yun, K. S., Bayr, T., Chen, H. C., Chikamoto, Y., Dewitte, B., Dommenget, D., Grothe, P., Guilyardi, E., Ham, Y. G., Hayashi, M., Ineson, S., Kang, D., Kim, S., Kim, W., Lee, J. Y., Li, T., Luo, J. J., McGregor, S., Planton, Y., Power, S., Rashid, H., Ren, H. L., Santoso, A., Takahashi, K., Todd, A., Wang, G., Wang, G., Xie, R., Yang, W. H., Yeh, S. W., Yoon, J., Zeller, E., and Zhang, X.: El Niño–Southern Oscillation complexity, Nature, 559, 535–545, 2018.
Umanzor, S., Ladah, L., Calderón-Aguilera, L. E., and Zertuche-González, J. A.: Intertidal macroalgae influence macroinvertebrate distribution across stress scenarios, Mar. Ecol. Prog. Ser., 584, 67–77, 2017.
Watt, C. A. and Scrosati, R. A.: Bioengineer effects on understory species richness, diversity, and composition change along an environmental stress gradient: experimental and mensurative evidence, Estuar. Coast. Shelf Sci., 123, 10–18, 2013.
Wethey, D. S., Woodin, S. A., Hilbish, T. J., Jones, S. J., Lima, F. P., and Brannock, P. M.: Response of intertidal populations to climate: effects of extreme events versus long term change, J. Exp. Mar. Biol. Ecol., 400, 132–144, 2011.
Whan, K. and Zwiers, F.: The impact of ENSO and the NAO on extreme winter precipitation in North America in observations and regional climate models, Clim. Dynam., 48, 1401–1411, 2017.
Wu, Z. and Lin, H.: Interdecadal variability of the ENSO–North Atlantic Oscillation connection in boreal summer, Q. J. Roy. Meteor. Soc., 138, 1668–1675, 2012.
Yun, X., Huang, B., Cheng, J., Xu, W., Qiao, S., and Li, Q.: A new merge of global surface temperature datasets since the start of the 20th century, Earth Syst. Sci. Data, 11, 1629–1643, https://doi.org/10.5194/essd-11-1629-2019, 2019.