the Creative Commons Attribution 4.0 License.
the Creative Commons Attribution 4.0 License.
 | 15 Sep 2020
DSCOVR/EPIC-derived global hourly and daily downward shortwave and photosynthetically active radiation data at 0.1° × 0.1° resolution
Dalei Hao
Ghassem R. Asrar
Yelu Zeng
Qing Zhu
Jianguang Wen
Qing Xiao
Downward shortwave radiation (SW) and photosynthetically active radiation (PAR) play crucial roles in Earth system dynamics. Spaceborne remote sensing techniques provide a unique means for mapping accurate spatiotemporally continuous SW–PAR, globally. However, any individual polar-orbiting or geostationary satellite cannot satisfy the desired high temporal resolution (sub-daily) and global coverage simultaneously, while integrating and fusing multisource data from complementary satellites/sensors is challenging because of co-registration, intercalibration, near real-time data delivery and the effects of discrepancies in orbital geometry. The Earth Polychromatic Imaging Camera (EPIC) on board the Deep Space Climate Observatory (DSCOVR), launched in February 2015, offers an unprecedented possibility to bridge the gap between high temporal resolution and global coverage and characterize the diurnal cycles of SW–PAR globally. In this study, we adopted a suite of well-validated data-driven machine-learning models to generate the first global land products of SW–PAR, from June 2015 to June 2019, based on DSCOVR/EPIC data. The derived products have high temporal resolution (hourly) and medium spatial resolution (), and they include estimates of the direct and diffuse components of SW–PAR. We used independently widely distributed ground station data from the Baseline Surface Radiation Network (BSRN), the Surface Radiation Budget Network (SURFRAD), NOAA's Global Monitoring Division and the U.S. Department of Energy's Atmospheric System Research (ASR) program to evaluate the performance of our products, and we further analyzed and compared the spatiotemporal characteristics of the derived products with the benchmarking Clouds and the Earth's Radiant Energy System Synoptic (CERES) data. We found both the hourly and daily products to be consistent with ground-based observations (e.g., hourly and daily total SWs have low biases of −3.96 and −0.71 W m−2 and root-mean-square errors (RMSEs) of 103.50 and 35.40 W m−2, respectively). The developed products capture the complex spatiotemporal patterns well and accurately track substantial diurnal, monthly, and seasonal variations in SW–PAR when compared to CERES data. They provide a reliable and valuable alternative for solar photovoltaic applications worldwide and can be used to improve our understanding of the diurnal and seasonal variabilities of the terrestrial water, carbon and energy fluxes at various spatial scales. The products are freely available at https://doi.org/10.25584/1595069 (Hao et al., 2020).
- Article
(7795 KB) - Full-text XML
-
Supplement
(1890 KB) - BibTeX
- EndNote


Downward shortwave radiation (SW) and photosynthetically active radiation (PAR) profoundly affect the terrestrial environment (Wild et al., 2005) and are fundamental for global energy balance (Liang et al., 2010), carbon budget (Farquhar and Roderick, 2003), hydrological cycle (Roderick and Farquhar, 2002), and solar energy production and utilization (Sweerts et al., 2019). Partitioning total SW–PAR into their direct and diffuse components is also important for solar resource management and photovoltaic power design (Khahro et al., 2015; Raptis et al., 2017) and terrestrial photosynthesis estimations (Mercado et al., 2009; Gu et al., 2002; Chen and Zhuang, 2014; Wang et al., 2018).
Satellite remote sensing has been widely used to map SW–PAR across various spatial and temporal scales (Pinker et al., 2005; Huang et al., 2019). Traditional ground-based observations have the required high accuracy but sparse point-specific distributions, and thus inadequate spatial representation (Korany et al., 2016), while numerical modeling with spatiotemporally continuous mapping has relatively low spatial resolution and large errors and uncertainties (Zhao et al., 2013). In contrast, remote sensing offers a more reliable and efficient tool to estimate high-quality SW–PAR globally with high spatiotemporal resolution, as it characterizes heterogeneous spatial distributions and captures the complex dynamic evolution of atmosphere, cloud and land surface processes at regional and even global scales (Huang et al., 2019; Li et al., 2020). Currently, a series of remote-sensing-based SW–PAR datasets/products are available: (1) from polar-orbiting satellites, e.g., Breathing Earth System Simulator (BESS) (Ryu et al., 2018) and MODIS MCD18 products (Wang et al., 2020); (2) from geostationary satellites, e.g., Himawari-8/Advanced Himawari Imager (AHI) (Letu et al., 2020); and (3) from fusing multisource data and observations, such as the Global LAnd Surface Satellite (GLASS) (Zhang et al., 2014) and the Clouds and the Earth's Radiant Energy System (CERES) (Rutan et al., 2015).
Global high-quality SW–PAR data at sub-daily scales are highly desired for investigating the diurnal variabilities of solar-induced fluorescence, photosynthesis (Damm et al., 2010) and evapotranspiration (Van Heerwaarden et al., 2010), and for solar energy utilization (Sweerts et al., 2019). However, accurately quantifying global SW–PAR is challenging based on current polar-orbiting and/or geostationary satellites/sensors, because (1) sun-synchronous polar-orbiting satellites generally have high spatial resolution but cannot capture the sub-daily variations in SW–PAR owing to low revisiting frequency; (2) geostationary satellites usually have high temporal resolution but limited geographical coverage (i.e., several different satellites systems for covering the entire Earth); (3) fusing multisource data acquired from complementary satellites/sensors is challenging due to the issues of co-registration, intercalibration, the effects of different orbital geometries, and the difficulty of processing and delivering the finial products in near-real time to users. In addition, most of the current remotely sensed SW–PAR estimations are conducted under the assumption of an independent pixel approximation (IPA) and simply neglect the three-dimensional (3D) radiative effects caused by inhomogeneous cloud fields (Wyser et al., 2005). The 3D effects (e.g., nonlocal cloud shadows, reflections from cloud sides and enhancement of downward radiation by photon diffusion from clouds) can significantly influence the accuracy and quality of high-temporal-resolution SW–PAR estimations and are perhaps the largest error source for SW–PAR retrievals (Wyser et al., 2005; Huang et al., 2019). Although several methods have been developed based on full 3D radiative transfer models (Liou et al., 2013), there is currently no practical and computationally feasible approach to eliminate 3D radiative effects efficiently and completely (Huang et al., 2019).
The Deep Space Climate Observatory (DSCOVR), launched in February 2015, leads a new era of monitoring the sun and Earth from deep space around the sun–Earth first Lagrange (L1) point (Burt and Smith, 2012). Its advanced Earth-facing camera, Earth Polychromatic Imaging Camera (EPIC), on board DSCOVR, views nearly the entire sunlit part of the Earth, from pole to pole, in near backscattering directions with 10 spectral bands from the ultraviolet to near-infrared wavelengths every 1–2 h, giving EPIC a unique capability of monitoring and capturing the diurnal variation in ozone, clouds, aerosols and vegetation properties (Marshak et al., 2018). DSCOVR/EPIC thus provides an unrivalled tool to capture the diurnal cycles of SW–PAR globally and overcomes some limitations of current remote-sensing-based SW–PAR estimations. Compared to any individual polar-orbiting and geostationary satellite, DSCOVR/EPIC essentially bridges the gap between high revisiting frequency and global coverage. Compared to the multisource integration, the single DSCOVR/EPIC instrument avoids the compatibility and matching issues of using different sensors/satellites, and it is more suitable for processing and delivering the final products in real time or near-real time to users. Fortunately, DSCOVR/EPIC is also characterized by a nearly constant scattering phase angle (angle formed between the incident and scattered-to-satellite sunlight vectors) from 168.5 to 175.5∘, which implies that DSCOVR/EPIC guarantees that the atmospheric column determining SW–PAR is nearly the same as that observed by the satellite. Therefore, DSCOVR/EPIC has the potential to significantly reduce the 3D radiative effects caused by the shift of the apparent position of clouds and their shadows which are related to the solar and viewing geometries.
The overarching goal of this study is to (1) develop, document and present DSCOVR/EPIC-derived SW–PAR products covering a period of about 4 years (from June 2015 to June 2019) based on a suite of well-validated machine-learning methods (Hao et al., 2019); (2) perform a systematic and comprehensive assessment of the accuracy, consistency and spatiotemporal patterns of these products against comparable but independently developed and published data/products; and (3) make the resulting dataset openly available for use by Earth system research and modeling and for solar energy productions and use. The newly generated products are the first available SW–PAR products with high temporal frequency (hourly) and global coverage at a spatial resolution of , where the aggregated daily-scale data are available, and the direct and diffuse components of SW–PAR are also provided. We evaluate them against widely distributed ground station data, analyze their spatiotemporal variations and compare them to the widely used CERES products. Finally, possible sources of uncertainties and potential improvements in the future study are discussed.
2.1 Remote sensing data
The DSCOVR/EPIC science team has routinely developed and published a suite of official Level 2 (L2) products from DSCOVR/EPIC observations (Marshak et al., 2018), including stratospheric ozone concentrations (Herman et al., 2018), sulfur dioxide (SO2) from volcanic eruptions, atmospheric aerosols in the UV and visible spectral ranges, cloud parameters (Yang et al., 2019), and atmospherically corrected land-surface reflectance and vegetation properties (Yang et al., 2017). These standard EPIC L2 products are publicly available from the NASA Langley Atmospheric Science Data Center and described in detail at https://eosweb.larc.nasa.gov/project/dscovr/dscovr_table (last access: 1 September 2020). For this study, we obtained solar zenith angle, surface pressure, aerosol optical depth, cloud fraction from the L2 aerosol product, cloud optical thickness and the most likely cloud phase from L2 cloud products, and total column ozone from the L2 ozone product, as well as the available quality flags for these products. We re-projected all datasets into global latitude–longitude grids with a spatial resolution of using the nearest-neighborhood resampling method.
As a key component of the Earth Observing System (EOS) program, the CERES project has developed and published globally long-term observed top-of-the-atmosphere (TOA) and calculated surface fluxes for study of climate and cloud feedback (Wielicki et al., 1996). CERES Synoptic 1∘ (SYN1deg) Edition 4.1 products, released on 22 August 2019, contain global gridded monthly, daily, 3-hourly and hourly averaged TOA and surface fluxes (Rutan et al., 2015). In particular, the SYN1deg Edition 4.1 products provide diurnally complete SW–PAR and their direct and diffuse components. However, the SYN1deg Edition 4.1 products are not suitable for inferring long-term trends of surface fluxes, due to limited climate quality (https://ceres.larc.nasa.gov/documents/DQ_summaries/CERES_SYN1deg_Ed4A_DQS.pdf, last access: 9 September 2020). The CERES Energy Balanced and Filled (EBAF) Edition 4.1 products, released on 28 May 2019, provide global gridded monthly averaged TOA and surface fluxes (Loeb et al., 2018; Kato et al., 2018). The CERES EBAF products are designed specifically for climate model evaluation and energy budget estimation and are more suitable for long-term analysis of variability of SW–PAR (e.g., intra-seasonal and interannual changes). Both the SYN1deg and EBAF products are freely accessible via the CERES Visualization, Ordering and Subsetting Tool (https://ceres.larc.nasa.gov/order_data.php, last access: 9 September 2020). In this study, we used both hourly and daily CERES SYN1deg Edition 4.1 products as a reference to evaluate the spatiotemporal patterns of EPIC-derived SW–PAR products at both hourly and daily scales, and we used the CERES EBAF Edition 4.1 products as a benchmark to evaluate the monthly and seasonal variations in EPIC-derived SW–PAR products.
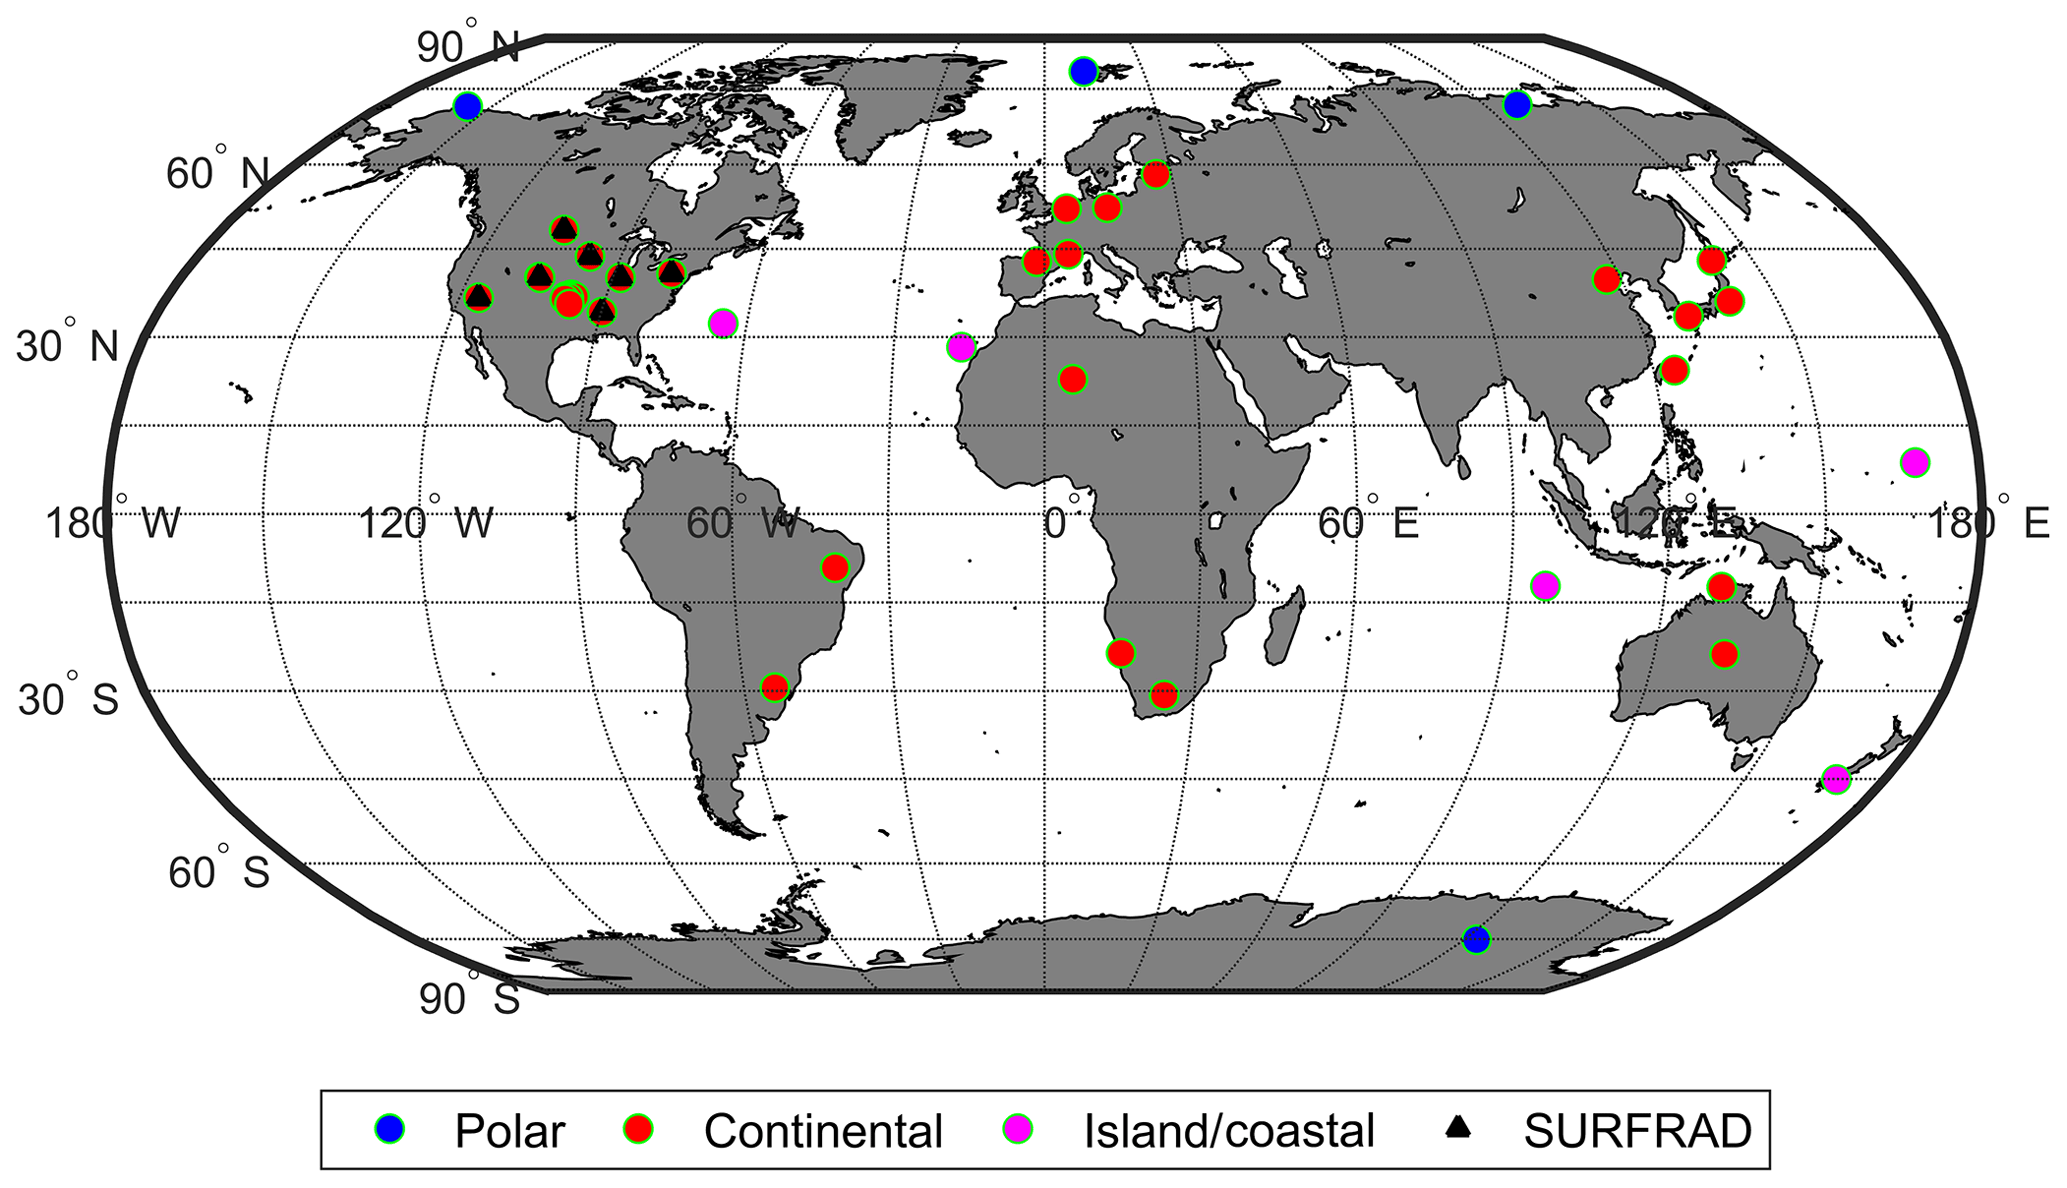
Figure 1Geographical distribution of in situ observation sites used for evaluation of space-based products. The blue, red and magenta circles (with green border) denote the polar (Arctic or Antarctic), island or coastal, and continental sites, respectively, and the black triangle represents the SURFRAD sites.
2.2 Ground-based observation data
Ground-based measurements with high-quality instrumentation and long-term maintenance provide the most reliable and accurate SW–PAR data, which are generally deemed as the ground truth for evaluating the performance of remote sensing products. Since 1992, the international Baseline Surface Radiation Network (BSRN) under the World Climate Research Programme (WCRP) has provided high-quality, high-temporal-resolution (1 min) ground-based radiation measurements of direct, diffuse and total SWs (Driemel et al., 2018; Ohmura et al., 1998). The BSRN stations are placed strategically to be representative of their relatively large surrounding area, thus suitable for the evaluation of satellite data. The Surface Radiation Budget Network (SURFRAD) supported by the NOAA Climate Program Office is operates in climatologically diverse regions and measures accurate, continuous, long-term surface radiation budget and meteorological parameters routinely to support climate and weather studies over the United States (Augustine et al., 2000). The SURFRAD sites also measure and provide PAR data. The CERES/ARM Validation Experiment (CAVE) collected 58 land surface sites from the BSRN, NOAA's Global Monitoring Division, SURFRAD and the U.S. Department of Energy's Atmospheric System Research (ASR) program and some personal communication (Rutan et al., 2001, 2015). In CAVE, all original 1 min data were averaged to different temporal scales (i.e., hourly, daily and monthly) through the strict quality control and gap-filling using the linear interpolation. The CAVE dataset provides SW and its direct and diffuse components but does not include PAR measurements. Further information on CAVE can be found at https://ceres-tool.larc.nasa.gov/cave/jsp/CAVE4Selection.jsp?ceresProducts=CAVE4 (last access: 9 September 2020).
We used the CAVE datasets to evaluate the performance of EPIC-derived SW products, and we used the SURFRAD datasets to evaluate the performance of EPIC-derived PAR products. The original SURFRAD data were first gap-filled using a linear interpolation technique and then temporally aggregated to both hourly and daily scales. Considering that some data from June 2015 to December 2016 were used to train and test the machine-learning models (Hao et al., 2019), we used only all available data from 43 CAVE and seven SURFRAD sites from January 2017 to June 2019. Figure 1 shows the geographical distribution of ground-based observation stations for evaluation in the study. These sites are further classified into three groups of polar (Arctic or Antarctic), island or coastal, and continental sites.
2.3 Estimation of SW–PAR fluxes
We adopted the trained random forest models developed by Hao et al. (2019) to estimate global SW–PAR from DSCOVR/EPIC datasets. The evaluation conducted by Hao et al. (2019) showed that the random forest models perform very well against the ground measurements from BSRN and SURFRAD sites. In the study, we acquired hourly driving data for estimating SW–PAR based on the collected DSCOVR/EPIC L2 products (introduced in Sect. 2.1). We used the nearest-neighbor interpolation approach to fill any gaps, based on the assumption that the atmospheric and cloud conditions remain unchanged and only solar zenith angle varies during a short period (1–2 h). Hourly SW–PAR estimates were then produced using the random forest models and were aggregated into daily products. However, we found that gaps existed in the derived SW–PAR products due to failed retrievals of atmospheric and cloud parameters, especially in Arctic and Antarctic polar regions. Therefore, we used the CERES SYN1deg Edition 4.1 products to fill these gaps, based on linear interpolation techniques. We assigned quality flags to the derived products to denote (0) successfully estimated from DSCOVR/EPIC, (1) gap-filled based on CERES data or (2) missing data.
3.1 Evaluation of estimated SW and PAR against ground-based observations
3.1.1 Overall performance of derived products
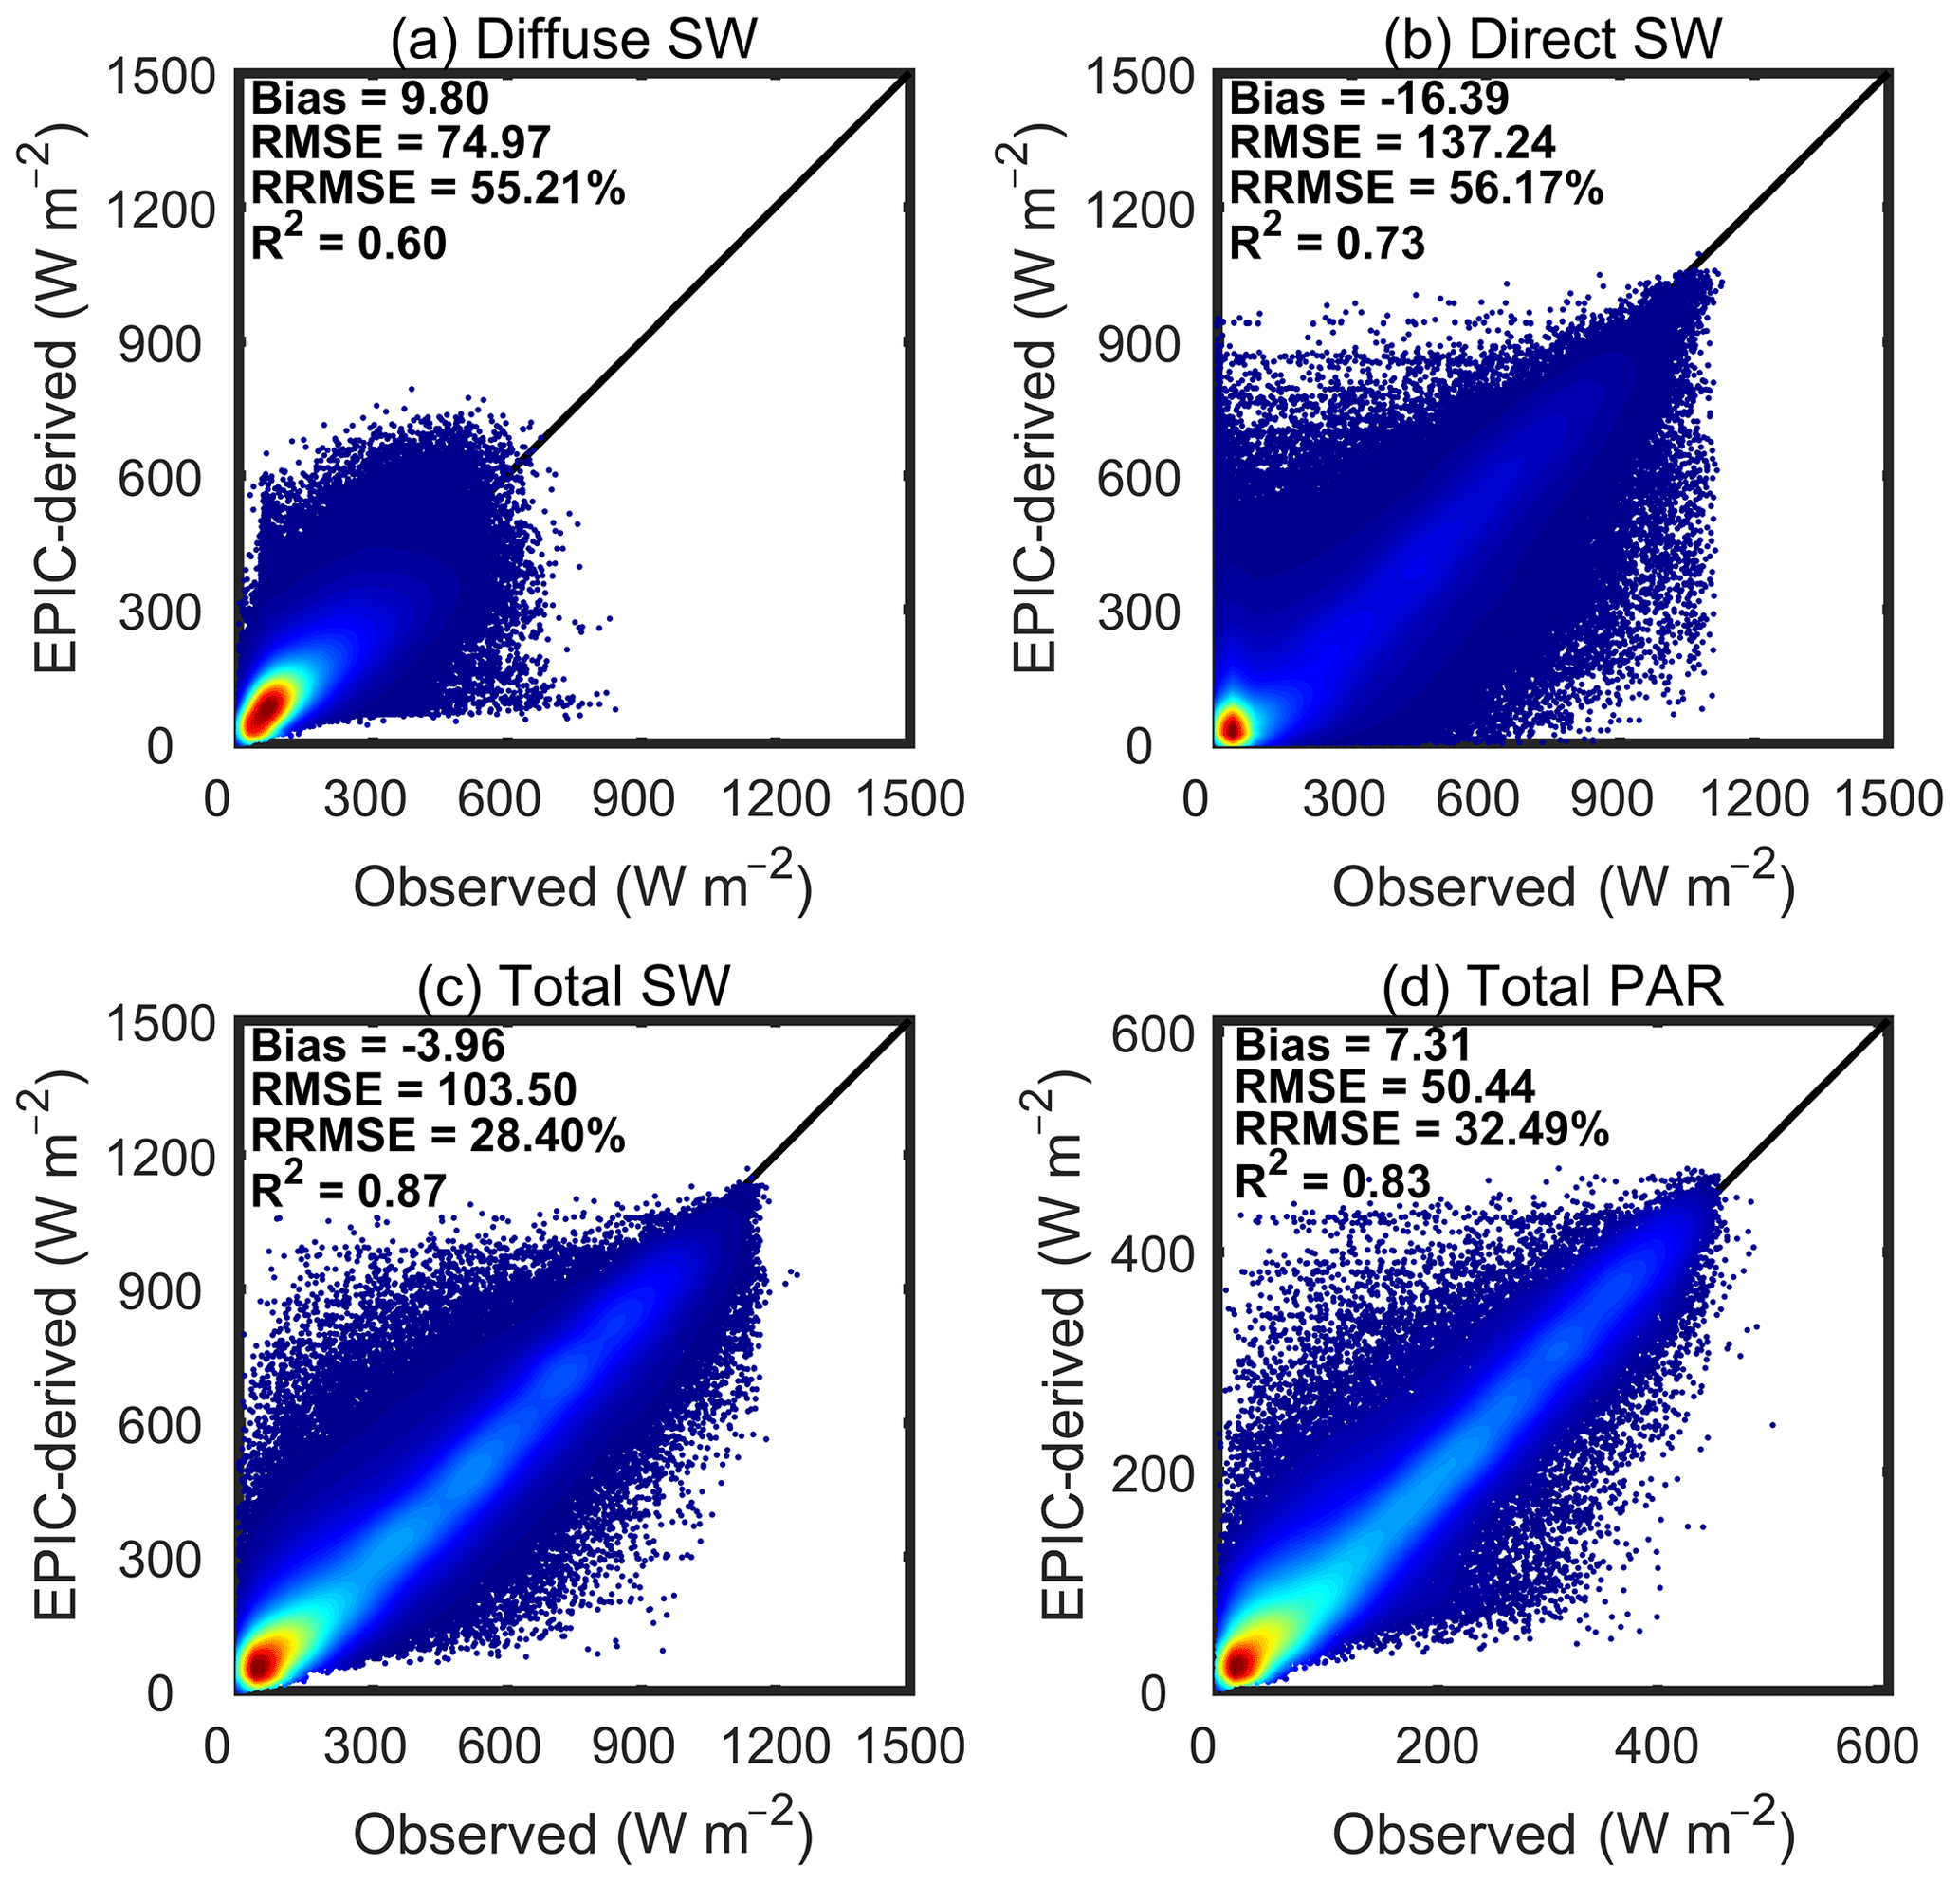
The hourly EPIC-derived diffuse, direct and total SW–PAR products match very well overall with the ground-based observations (Fig. 2). For diffuse SW, the bias, root-mean-square error (RMSE), relative RMSE (RMSE to mean value, RRMSE) and coefficient of determination (R2) are 9.8 W m−2, 74.97 W m−2, 55.21 % and 0.60 %, respectively. Direct SW has a negative bias of −16.39 W m−2, relatively large RMSE of 137.24 W m−2 and RRMSE of 56.17 %, and R2 of 0.73. By contrast, both total SW and PAR have better performance with low biases (−3.96 and 7.31 W m−2), smaller RMSEs (103.50 and 50.44 W m−2) and RRMSEs (28.40 % and 32.49 %), and high R2 values (0.87 and 0.83). These statistical metrics indicate that EPIC-based hourly SW–PAR estimates are comparable to or better than other remote-sensing-based products; e.g., Himawari-8/AHI-derived total SW has a similar RMSE of 101.86 W m−2 and R2 of 0.87 (Letu et al., 2020).
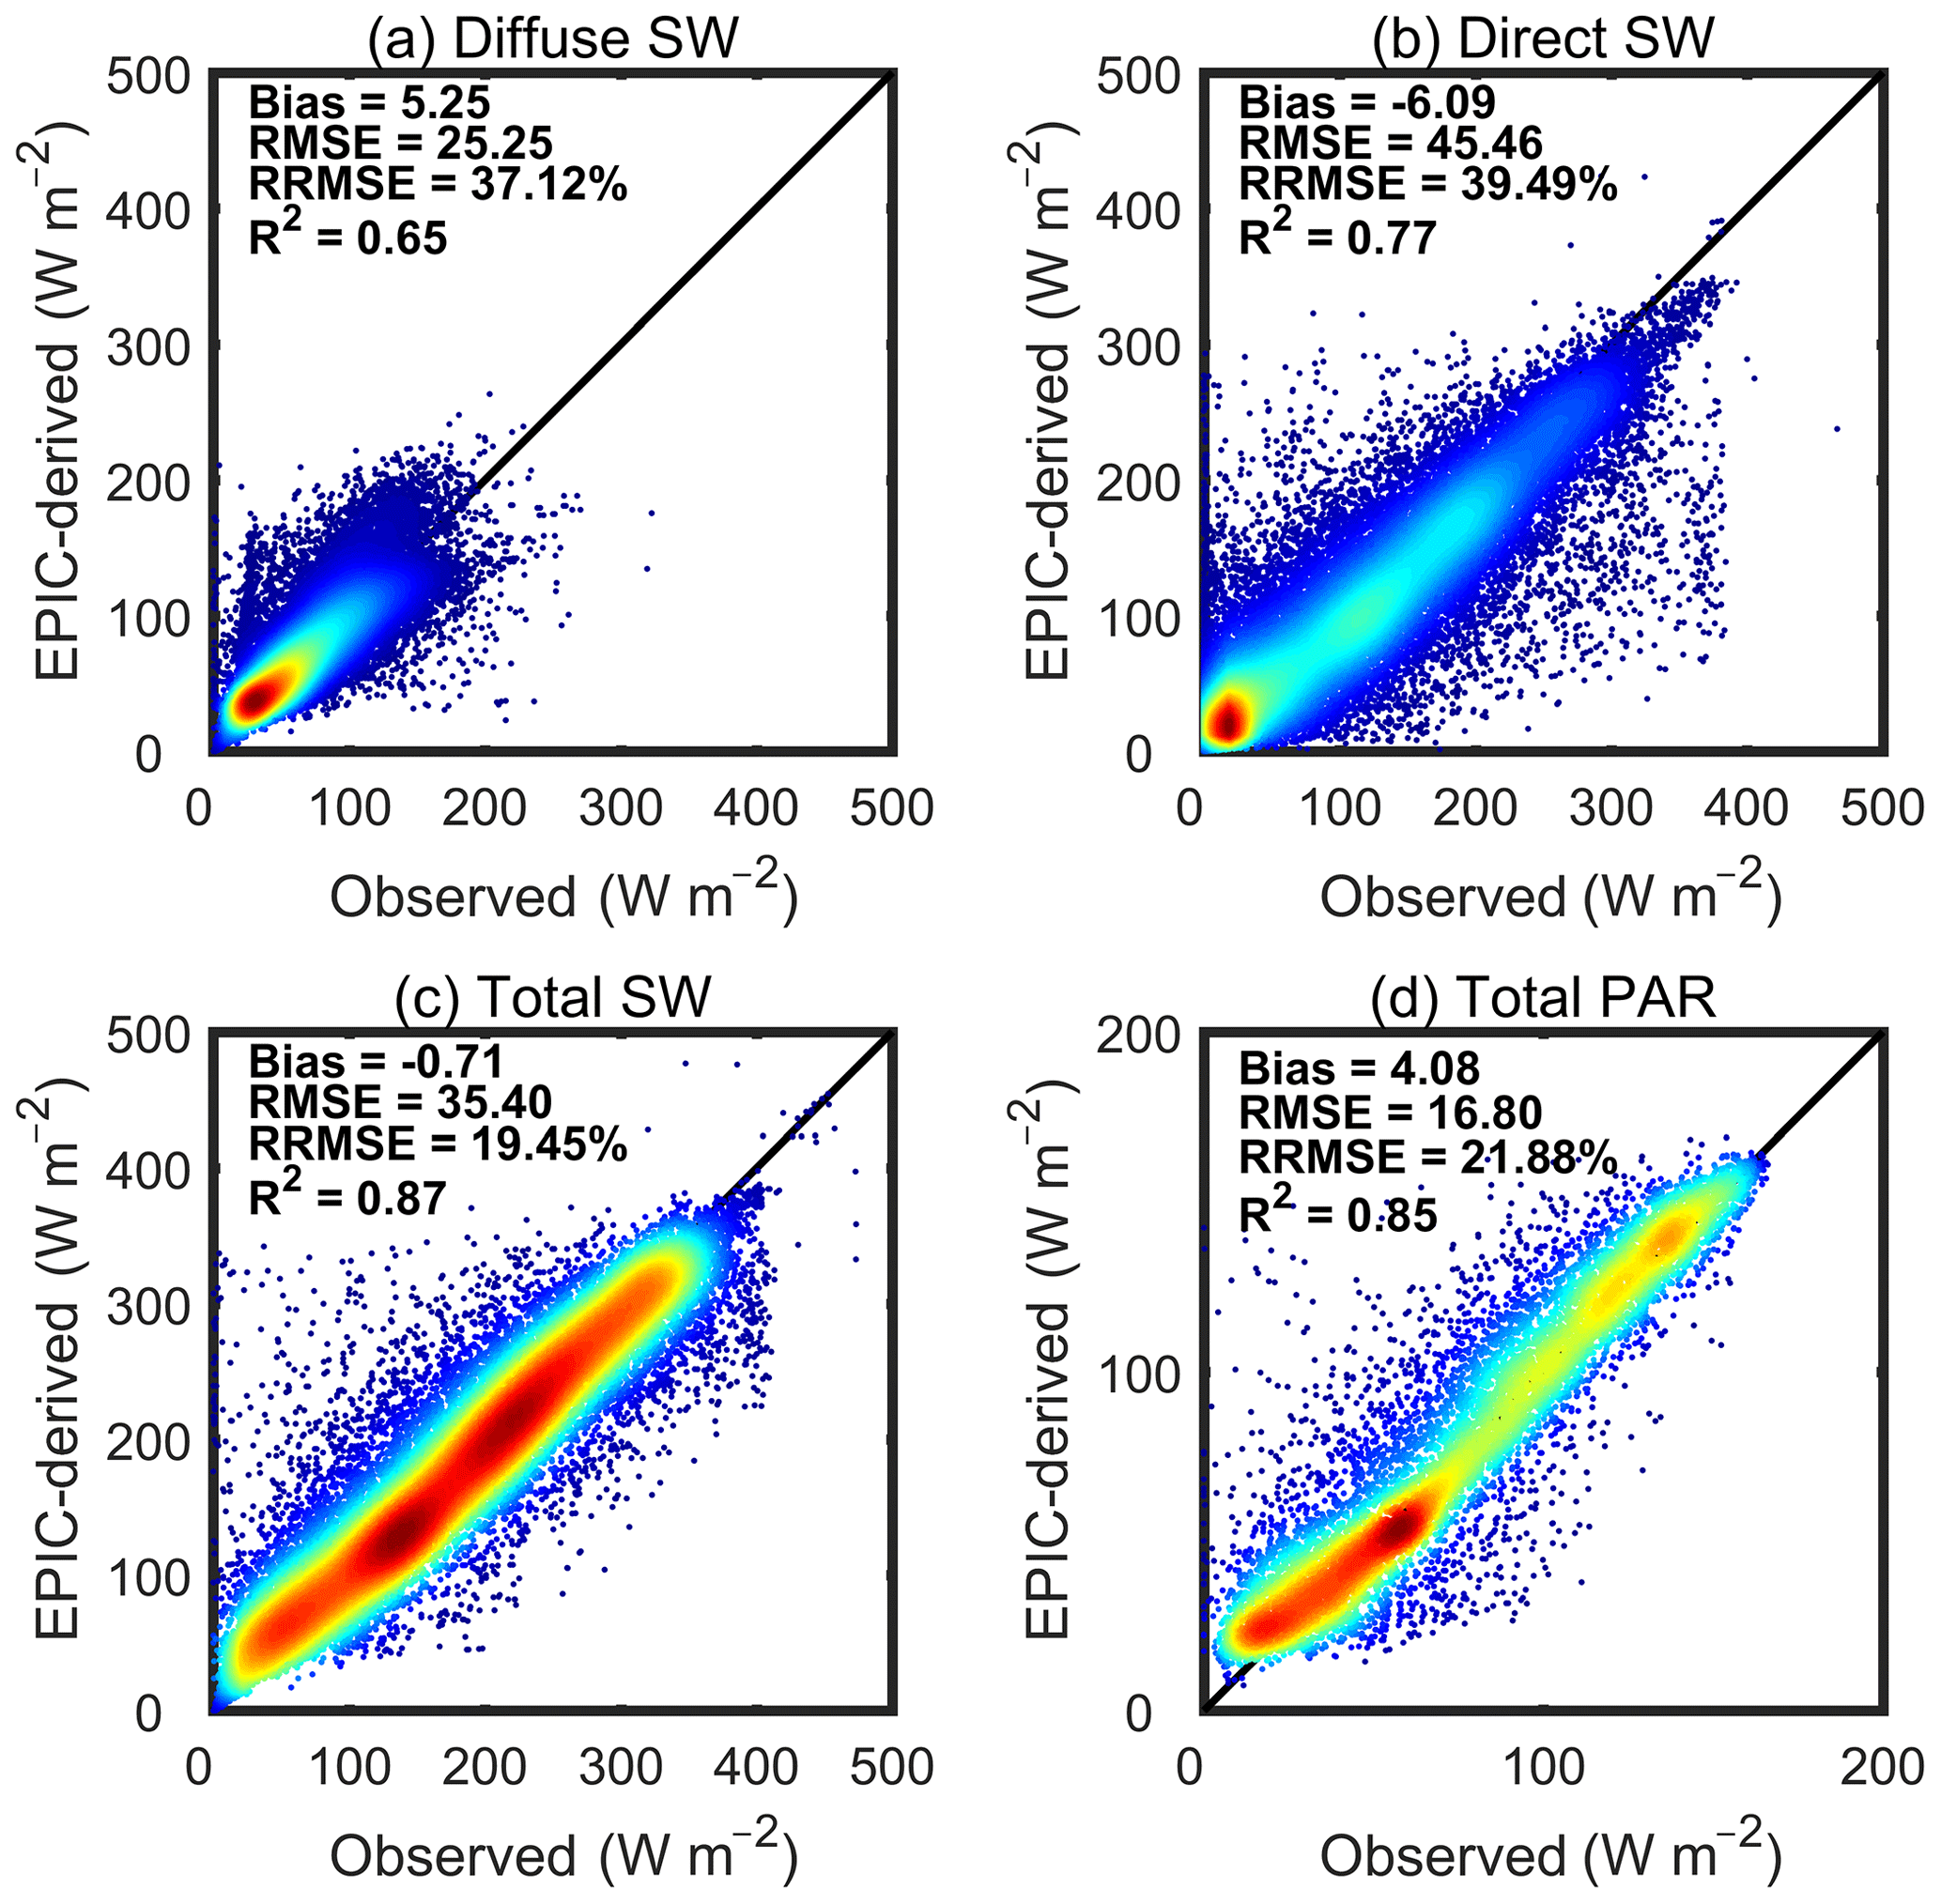
The daily SW–PAR estimates are well correlated with the ground-based observations (Fig. 3). Diffuse SW has a positive bias (5.25 W m−2), a relatively small RMSE (25.25 W m−2) but a large RRMSE (37.12 %), and an R2 of 0.65. By contrast, direct SW has a negative bias (−6.09 W m−2), a relatively large RMSE (45.46 W m−2), a large RRMSE (39.49 %) and a R2 of 0.77. Total SW shows good performance with a low bias of −0.71 W m−2, a RMSE of 35.40 W m−2, a smaller RRMSE of 19.45 % and high R2 of 0.87. Total PAR also shows a good relationship with the ground-based data (positive bias of 4.08 W m−2, small RMSE of 16.80 W m−2 and RRMSE of 21.88 %, and high R2 of 0.85). These results indicate that our daily products show comparable or better performance compared to other SW–PAR products; e.g., for total SW, MCD18 and GLASS products have similar RMSEs of 32.3 and 35.9 W m−2 and higher biases of −7.8 and −7.6 W m−2 (Wang et al., 2020).
3.1.2 Temporal distribution of estimation errors of derived products
We first distinguish different sky conditions based on the ratio of diffuse to total SW (skyl): (1) clear: skyl < 0.3 during 70 % time of 1 d; (2) overcast: skyl > 0.7 during 70 % time of 1 d; and (3) cloudy: all the other cases. Figure 4 shows the comparisons of diurnal variations in both EPIC- and ground-based observed total SWs, averaged, for June 2015–June 2019 at seven SURFRAD sites under different sky conditions. For clear-sky conditions, EPIC-based total SWs capture the diurnal variation well with small RRMSEs ranging from 10.10 % to 16.24 %. For cloudy sky, EPIC-based total SWs have better performance with RRMSEs smaller than 10.02 %. For overcast-sky conditions, EPIC-based products overestimate the total SWs with RRMSEs larger than 29.20 %. It is noteworthy that EPIC-derived products show the worst performance for SURFRAD-BOS sites, likely caused by the rugged terrain around this site. For diffuse SWs shown in Fig. S1 (in the Supplement), clear-sky EPIC-derived estimates have the largest RRMSEs. For direct SWs, Fig. S2 shows that overcast-sky EPIC-based estimates have large uncertainties due to their relatively small magnitude. Figure S3 shows that EPIC-based total PARs perform better than total SWs, especially for clear- and cloudy-sky conditions.
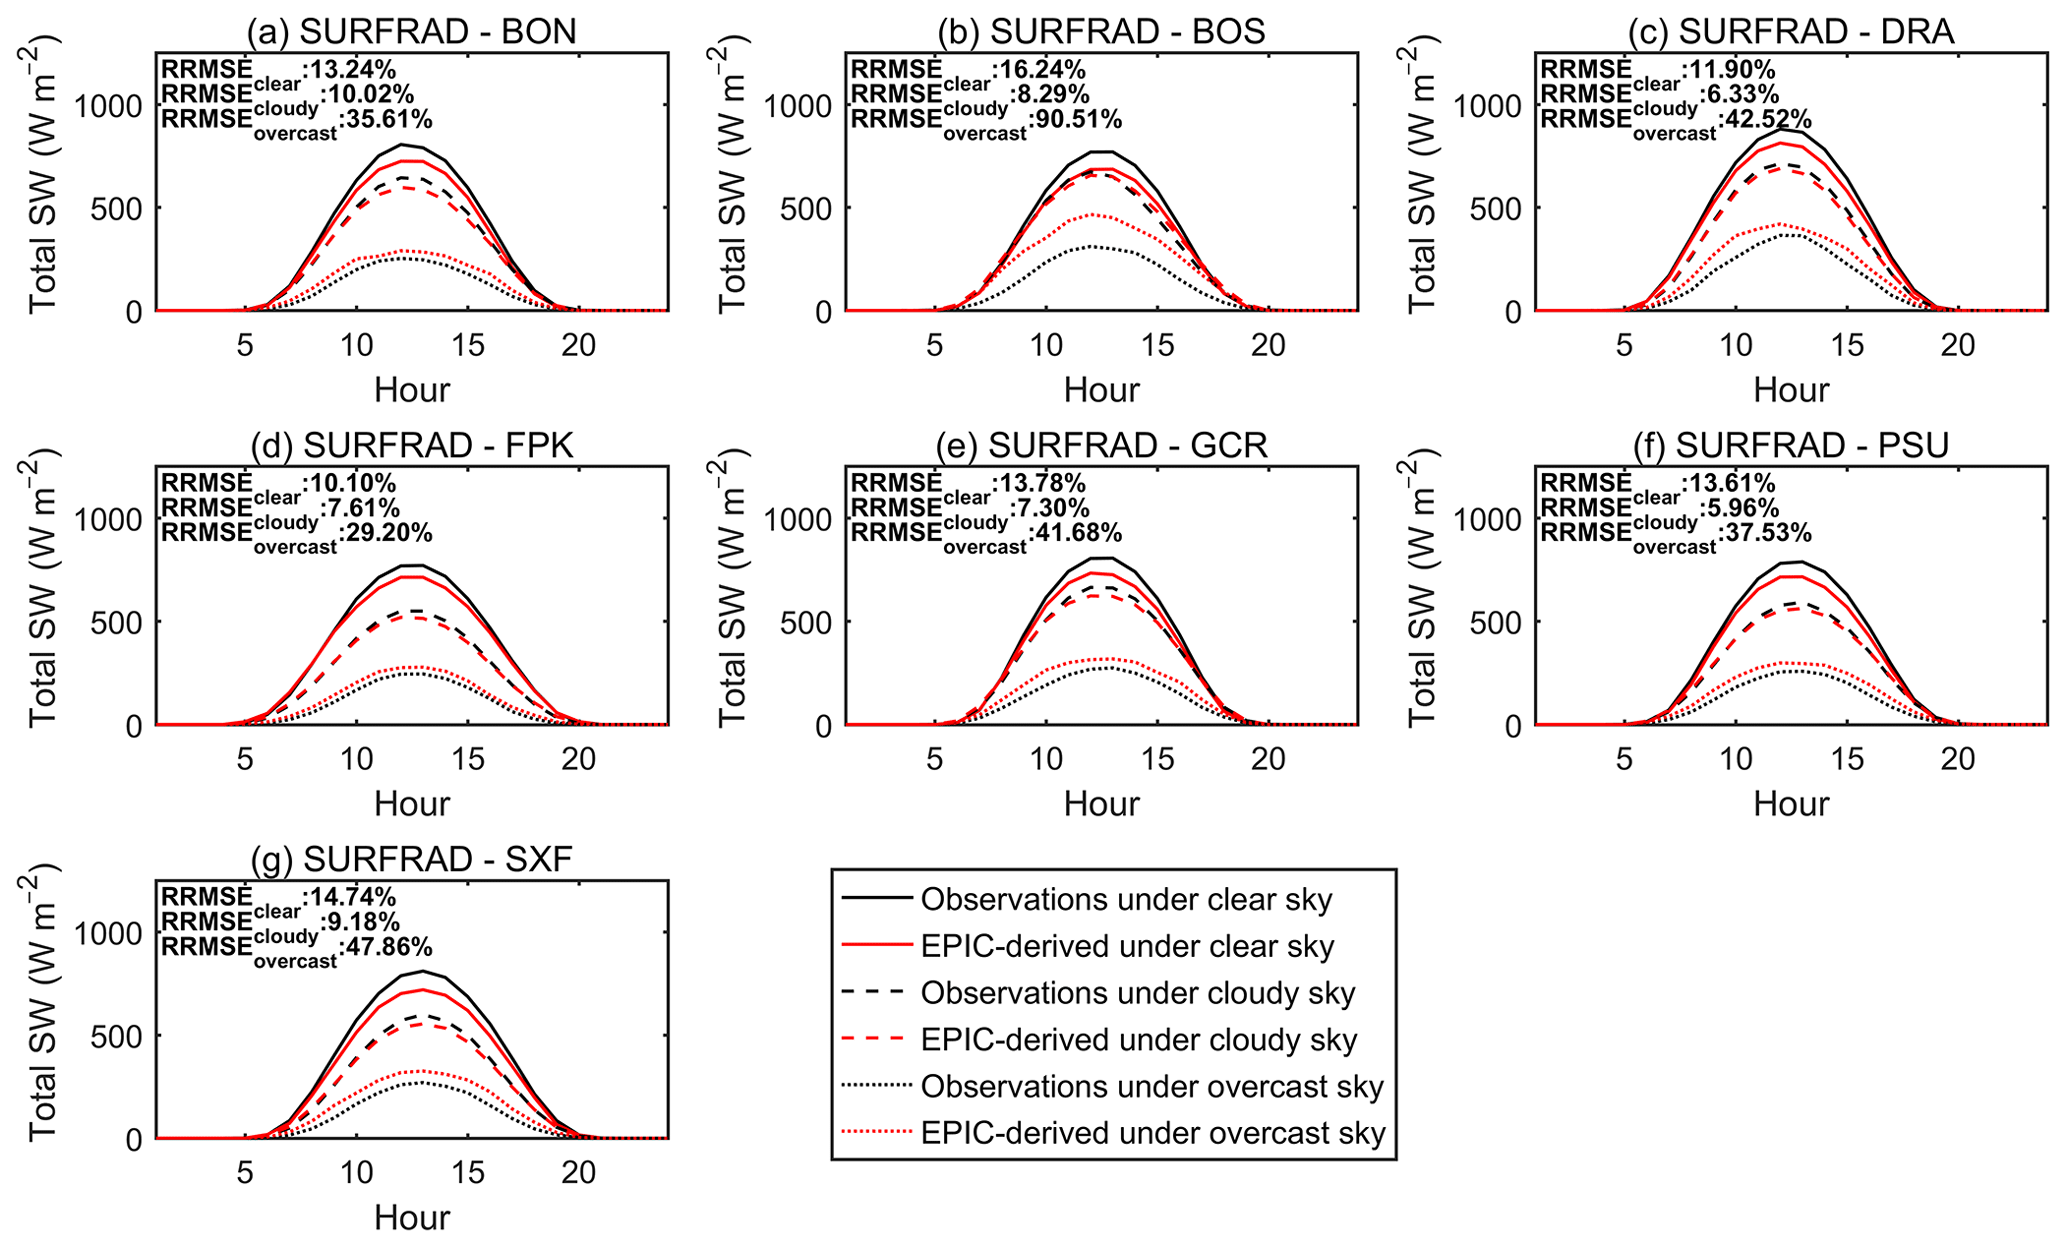
Figure 4Diurnal variations in both EPIC- and ground-based total SWs, averaged, from June 2015 to June 2019 for different sky conditions at seven SURFRAD sites.

Figure 5Evaluation of EPIC-based hourly SW–PAR estimates at different local hours from 07:00 to 18:00 local solar time.
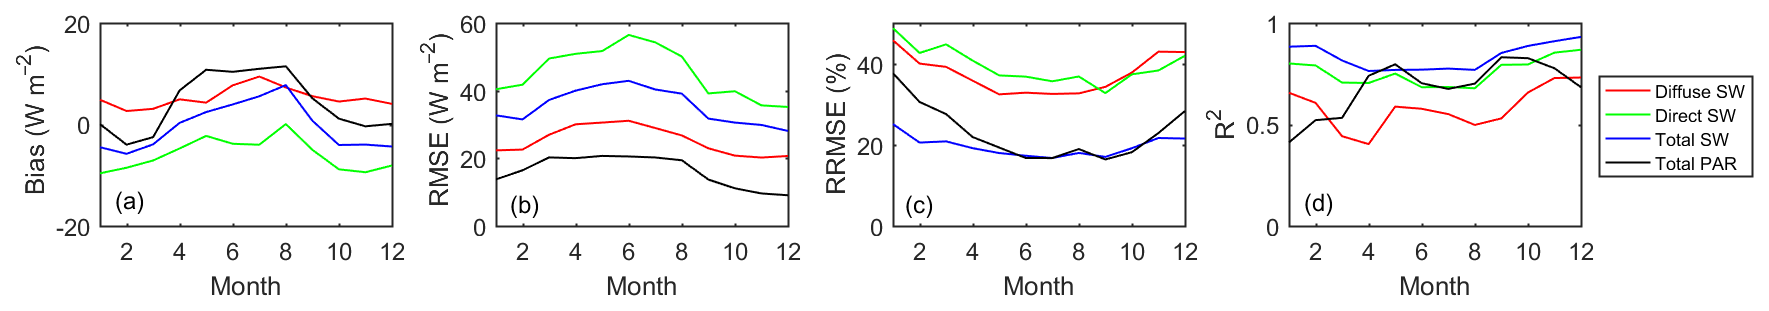
Figure 6Evaluation of EPIC-based daily SW–PAR estimates for different months during the study period.
We further analyzed the accuracy of our products at both different local times and for different months. Figure 5 shows that the accuracy of hourly SW–PAR estimates changes with the change in local time. The SW–PAR estimates for nearly local noon have negative biases and larger RMSEs but smaller RRMSEs, whereas those for early morning or later afternoon have positive biases and smaller RMSEs but larger RRMSEs. However, R2 values of total SW and PAR estimates are generally larger than 0.7 for all local times. The daily SW–PAR estimates show good accuracy for all months. Total SW and PAR estimates from May to August have positive biases and larger RMSEs but smaller RRMSEs. The R2 values of SW–PAR estimates show little monthly and seasonal dependency. These results confirm that both EPIC-based hourly and daily products have reliable accuracy, although the magnitudes of SW–PAR and cloud and atmospheric conditions at different times (i.e., hour, day and month) may affect the accuracy and uncertainties of these products.
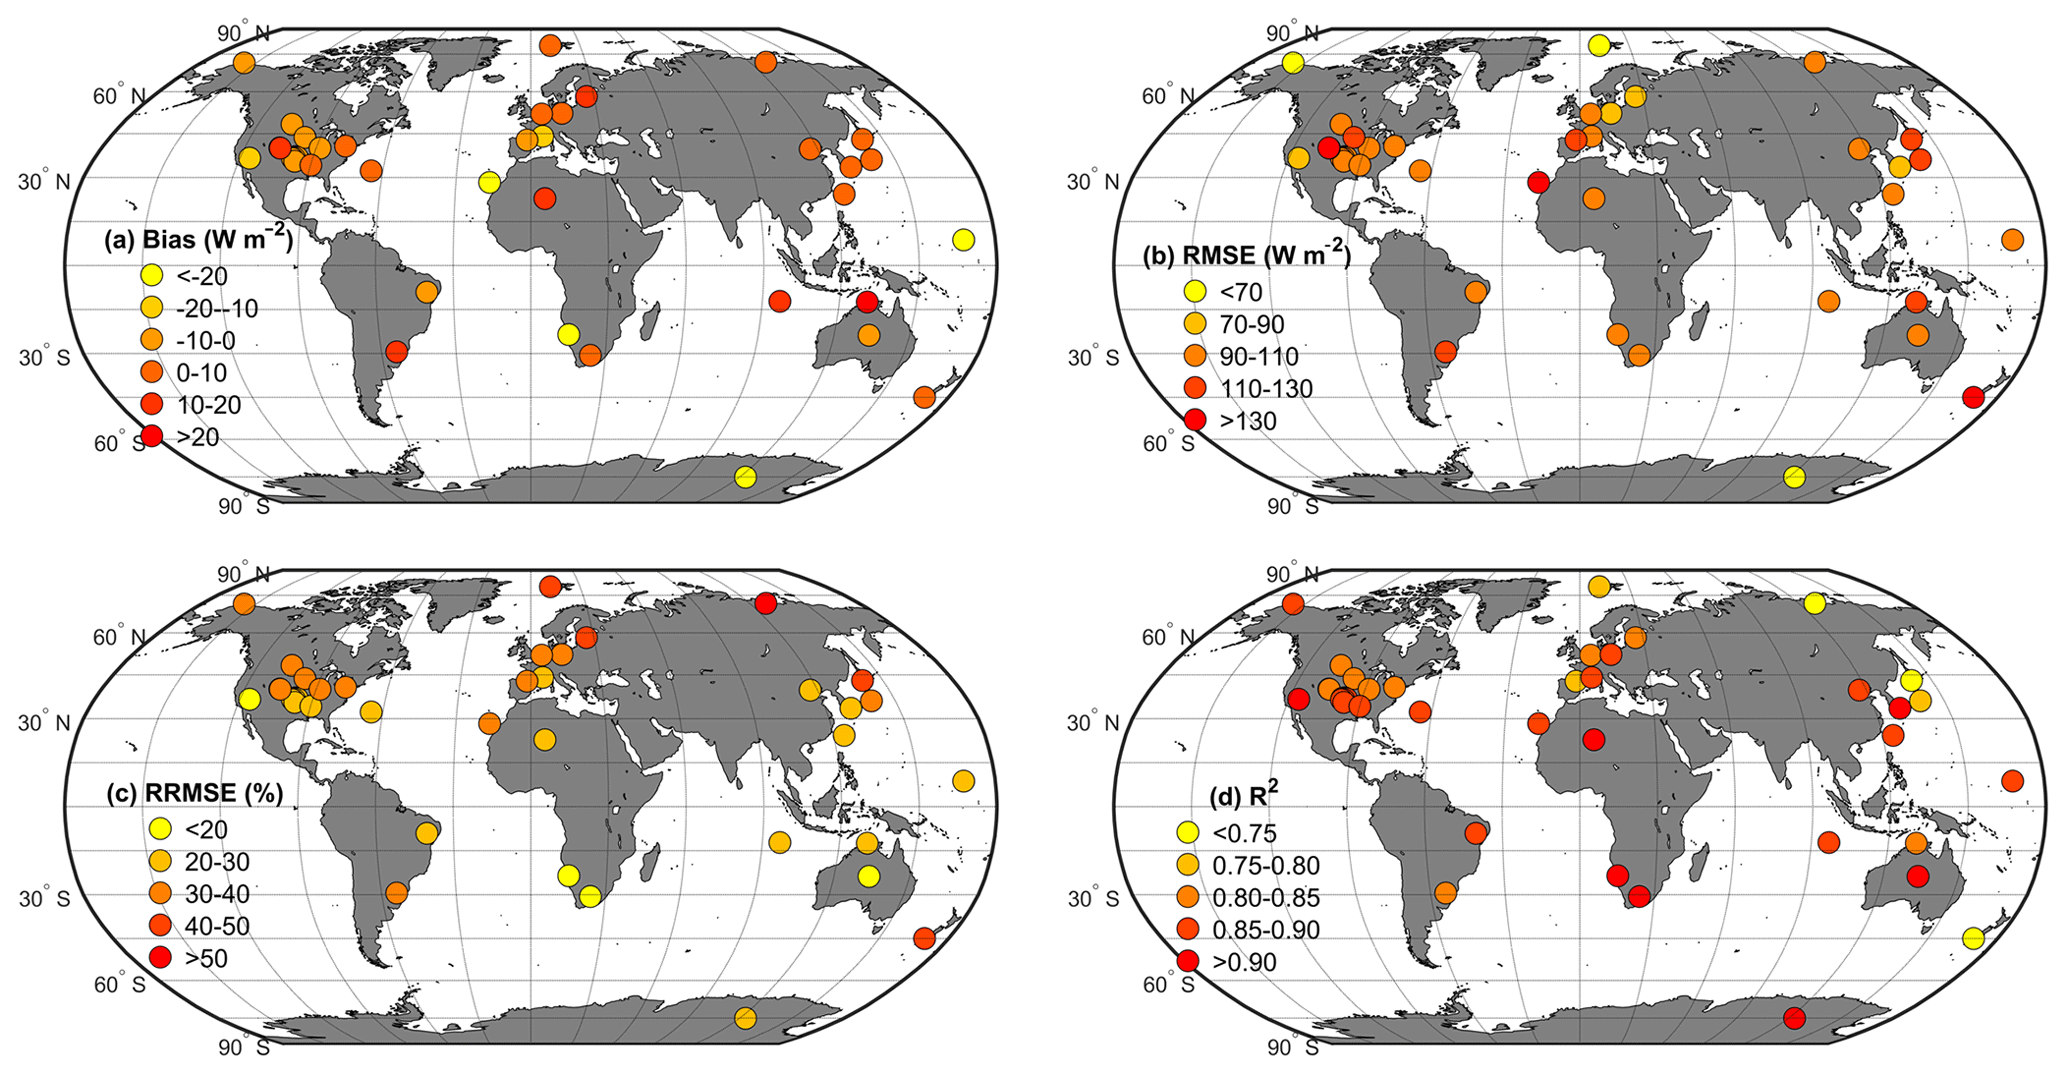
Figure 7Spatial distributions of accuracy statistical metrics for EPIC-based hourly total SW at all ground-based sites. Circles with different colors indicate their different values.
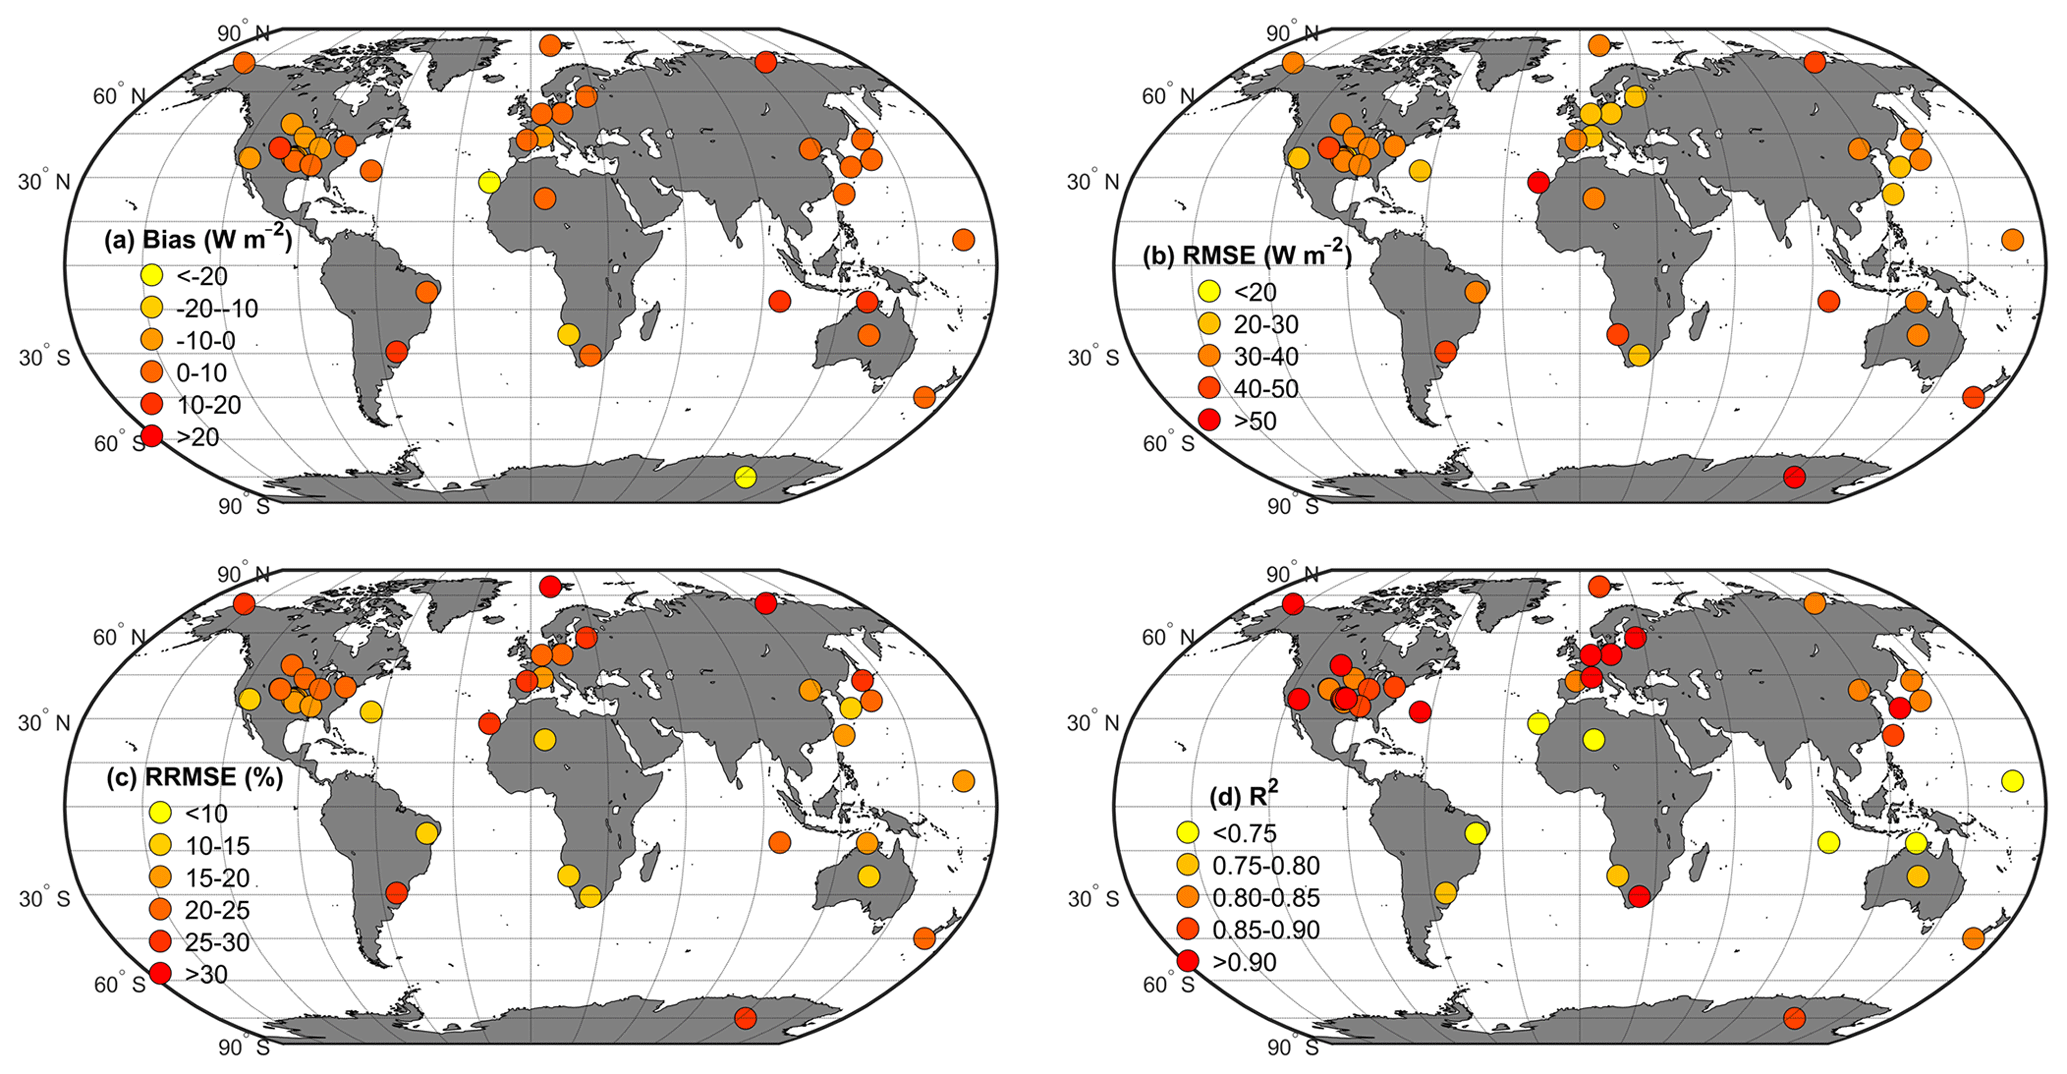
Figure 8Spatial distributions of accuracy statistical metrics for EPIC-based daily total SW at all ground-based sites. Circles with different colors indicate their different values.
3.1.3 Spatial distribution of estimated errors of derived products
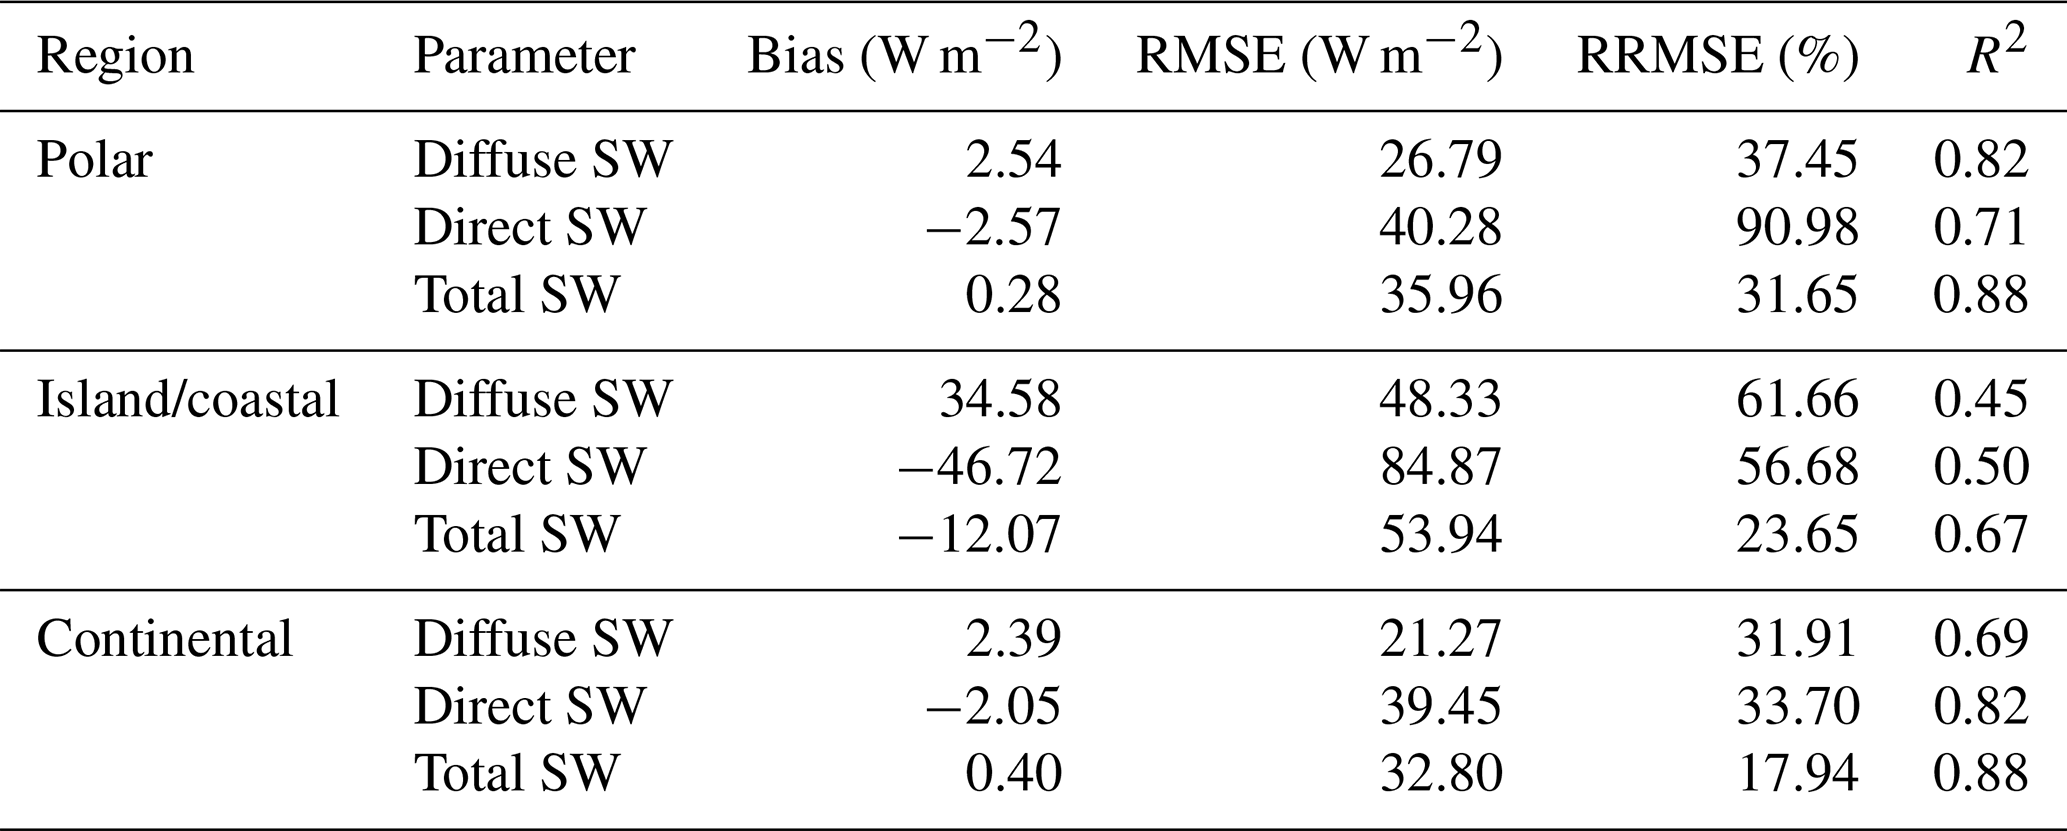
The hourly and daily total SW estimates show similar spatial patterns in their accuracy statistics composed of biases, RMSEs, RRMSEs and R2 values (Figs. 7 and 8). Polar regions have relatively small RMSEs but large RRMSEs, due to long-term or frequent ice/snow cover in these regions and a lack of proper accounting for land surface albedo in current products; the island and coastal regions show the worst performance with high bias, large RMSE and low R2; and derived products for most of the continental sites perform well but show large spatial heterogeneities related to different land cover types, climate zones, surface topography, etc. The BSRN-IZA site, a high-mountain station located in Tenerife (Canary Islands, Spain), exhibits high negative bias and large errors and uncertainties, which can be explained by its geographic location on Tenerife within the Teide volcano area (García et al., 2019) and the particular weather conditions for this area where the clouds affect the lower parts of the island (below 2000 m above sea level) while the sky over the upper parts of the island probably remains clear (Urraca et al., 2018). In general, EPIC-derived products have higher accuracy in continental regions with low bias and small RMSE and RRMSE, whereas island or coastal regions show very large bias and large RMSE and RRMSE values (Tables 1 and 2), probably caused by the rapidly changing weather conditions and the mixture of land and water in a grid cell (edge effects), which is identical with other studies (Boland et al., 2016; Wang and Pinker, 2009).
Table 1Evaluation of EPIC-based hourly SW estimates against the ground-based measurements for different regions.
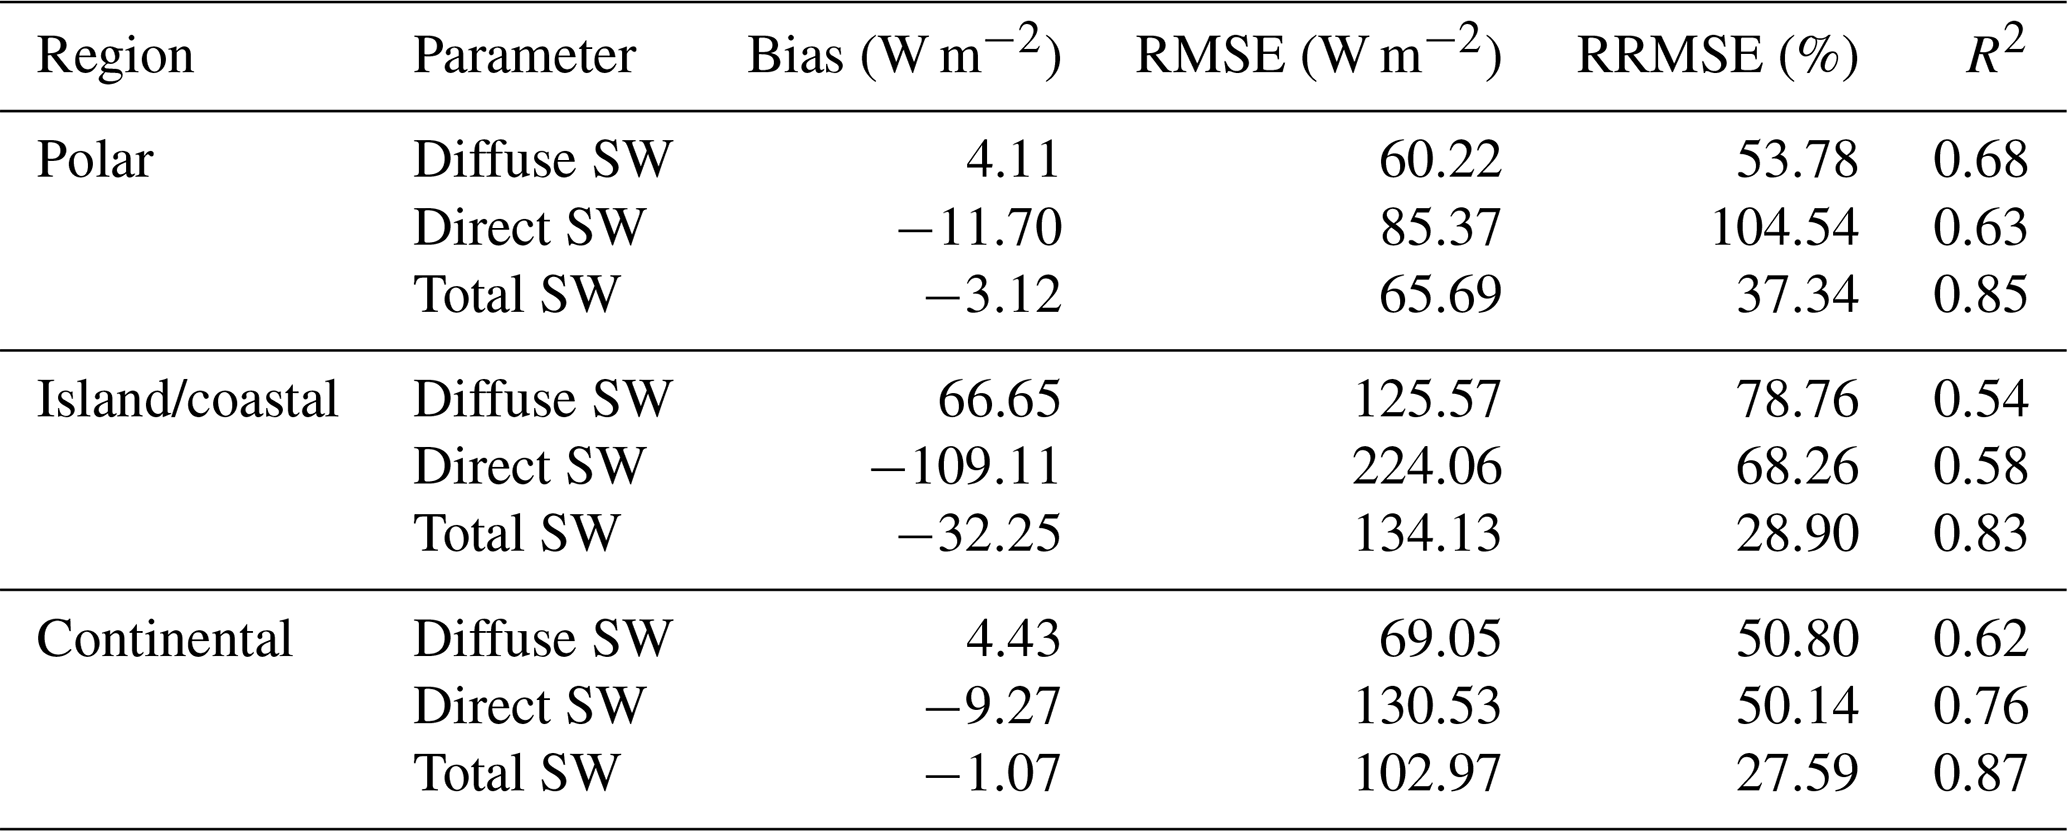
Table 2Evaluation of EPIC-based daily SW estimates against the ground-based measurements for different regions.
3.2 Global spatiotemporal patterns of derived products
We investigated the spatial patterns of averaged total SWs during the 3 whole years of 2016–2018 for different seasons: (1) spring, March, April, and May (MAM); (2) summer, June, July, and August (JJA); (3) autumn, September, October, and November, (SON); (4) winter, December, January, and February (DJF). Figure 9a–d show the EPIC-based products reflect the heterogenous spatial distributions and track the globally seasonal variations that are mainly due to the sun angle variations. They also have a consistent pattern when compared with the CERES-derived products (Fig. 9e–f). Figure S4 shows that EPIC- and CERES-derived estimates have small differences over most regions, especially in spring, autumn and winter, but some large discrepancies are observed in the Tibetan Plateau due to the frequent ice/snow cover and in the Congo basin due to the complex cloud and atmospheric conditions. However, our EPIC-derived products can reveal more spatial details than CERES-derived estimates due to their higher spatial resolution.

Figure 9Global distributions of EPIC- and CERES-derived total SW fluxes for different seasons during the study period, 2016–2018.
Figure 10 shows the temporal variations in both EPIC- and CERES-based monthly total SWs for the land surface of the globe, Northern Hemisphere and Southern Hemisphere from June 2015 to June 2019. All EPIC- and CERES-based products show similar temporal variations. From autumn (SON) to next spring (MAM), EPIC-based global SWs coincide well with CERES-derived ones, whereas in Summer (JJA), EPIC-based global SWs are lower than CERES-derived ones, due to the differences in the Northern Hemisphere. The differences in spatial resolution, driving data, retrieval models/algorithms, etc. contribute to these discrepancies. Figure 11 displays the temporal variations in daily zonal averaged total SWs and PAR products. EPIC- and CERES-based estimates present highly consistent latitude-gradient distributions and temporal variations. Figure S5 shows the differences between EPIC- and CERES-based SW–PAR estimates. Overall, total SW and PAR and their direct and diffuse components have small differences, but the direct and diffuse components of SW show relatively large differences in the Northern Hemisphere, possibly due to the underestimation of CERES-based direct components and overestimation of CERES-derived diffuse components (Hao et al., 2019).
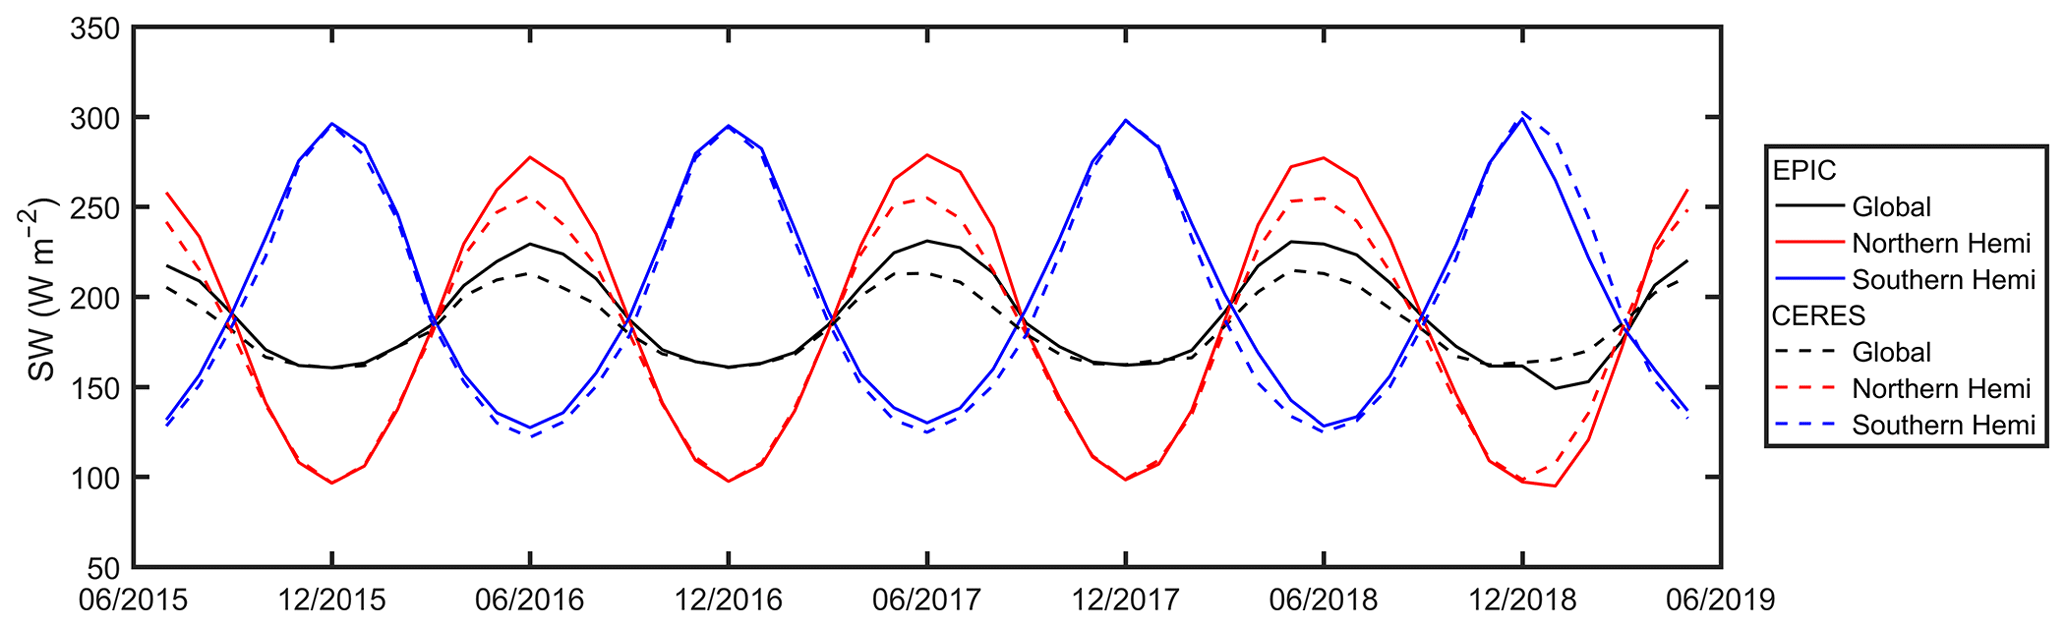
Figure 10Temporal variations in EPIC- and CERES-based monthly total SW for the land surface of the globe, Northern Hemisphere and Southern Hemisphere.

Figure 11Temporal variations in (a, c) EPIC- and (b, d) CERES-based zonally averaged daily total (a, b) SW and (c, d) PAR for global land areas. The vertical dark bars in (a, c) are due to the missing data.
The proposed new SW–PAR products presented here make full use of the unique advantages of DSCOVR/EPIC, an instrument that observes nearly the entire sunlit areas of the Earth, from pole to pole, every 1–2 h. These promising products have some unique attributes: (1) show high correlations with the ground station observations, (2) present reasonable and identical spatiotemporal SW–PAR patterns but more spatial details when compared to CERES products and (3) accurately capture the diurnal cycles of SW–PAR. In addition, they are based on a single instrument, EPIC, and thus avoid the sensor-to-sensor differences and inconsistencies inherent in multisource datasets. The DSCOVR/EPIC science team is continuing to refine their algorithms and upgrade the product quality, and we plan to update our products accordingly.
We expect and hope these products will have multiple uses in diverse Earth science communities. When combined with the DSCOVR/EPIC-derived vegetation data, our globally high-accuracy products can be used to understand the diurnal variabilities and underlying processes of photosynthesis and evapotranspiration for terrestrial ecosystems. By virtue of the decomposition of the direct and diffuse PARs, our products are expected to improve the estimates of ecosystem photosynthesis capacity and primary production. Our products may also be valuable for site selection for solar power production and solar energy management.
Some sources of uncertainties probably affect the accuracy and reliability of our products (see Figs. 2 and 3). There are some geolocation, intercalibration and misregistration issues in the current EPIC L1B version 2 products (Molina García et al., 2019), which will be improved in the version 3 products (announced in the DSCOVR 2019 Science Team Meeting, Greenbelt, MD) in future. The current EPIC L2 atmospheric and cloud products have large uncertainties or gaps in the ice/snow-covered regions and when the solar angle is large (> 70∘) (Yang et al., 2019; Herman et al., 2018; Xu et al., 2017). We used the CERES data to fill the gaps, especially in the polar regions. To allow users maximum flexibility, we also provided quality flags that indicate whether pixels are successfully retrieved or gap-filled in the derived products. Current algorithms/models neglect the impact of water vapor and land surface albedo, which could lead to some additional biases and uncertainties. This problem will be addressed through the combination with high-quality EPIC-view water vapor products such as the EPIC-view Multi-Sensor Global Cloud and Radiance Composites (Khlopenkov et al., 2017) and the development of land surface albedo products based on the EPIC Multi-Angle Implementation of Atmospheric Correction (MAIAC) products (Hao et al., 2019). We also did not account for the impacts of spatial mismatch between ground-based observation and EPIC-based data. In the future, we will collect long-term, high-quality and widely distributed ground-based datasets to improve and evaluate our products.
The spatial resolution of our current products is relatively coarse (). The effective spatial resolution of the original EPIC image is relevant to the observing angle and is about 10 km at nadir (near the center of the image) and 20 km at 60∘ (Marshak et al., 2018). Higher-spatial-resolution SW–PAR products are desired for mapping of carbon and water fluxes as well as solar energy assessment and operation, especially for islands and coastal regions (see Tables 1 and 2). Spatial scale mismatch between land surface properties and derived SW–PAR estimates can limit the applications of our products (Ryu et al., 2018). We suggest that spatial downscaling techniques can be used to improve our proposed products (Wang et al., 2019), especially for rugged terrain (e.g., the Tibetan Plateau), where topographic effects (e.g., varied elevation, rotation of solar geometry, shadowing, terrain occlusion and multi-scattering) on SW–PAR should be considered and assessed (Zhang et al., 2019; Hao et al., 2018b, a). We believe such analysis and assessment can greatly benefit next-generation missions of deep-space satellites/sensors such as DSCOVR/EPIC, for optimizing and balancing the trade-off between data amount (spatial–temporal resolution) and transmission time, perhaps leading to improved spatiotemporal resolution of future data products from such missions.
Finally, one shortcoming of current products is the relatively short period of the derived data records which cover only 4 years. Such record length is not adequate to detect any globally long-term trends. A feasible solution is to merge DSCOVR/EPIC products with reanalysis data and products to produce globally continuous, consistent and long-term SW–PAR datasets, through correcting the reanalysis data based on satellite data (Feng and Wang, 2018). With the increasing record length of EPIC data, it is anticipated that the temporal coverage of our proposed products will also be extended to support long-term analysis in the future.
Both the derived hourly and daily DSCOVR/EPIC-based global SW–PAR products are available at DataHub (https://doi.org/10.25584/1595069, Hao et al., 2020), Pacific Northwest National Laboratory (PNNL). The hourly data are grouped by day in distinct NetCDF files, which are named “EPIC_SW_PAR_Hourly_yyyymmdd.nc”, where “yyyy”, “mm” and “dd” denote year, month, and day (UTC time). The daily data are grouped by month in distinct NetCDF files, which are named “EPIC_SW_ PAR_ Daily_yyyymm.nc”, where “yyyy” and “mm” denote year and month (UTC time). Each NetCDF file contains latitude, longitude, time, diffuse SW, direct SW, diffuse PAR, direct PAR and the corresponding quality flags which indicate whether the pixel is gap-filled or not. The scale factor for the direct and diffuse SW–PAR is 0.1. The total SW–PAR estimates can be calculated by combining the direct and diffuse components. The information about the version, creation date, reference, contact mails and other comments is also included in the file.
This paper presents the first globally hourly and daily SW–PAR products, with a spatial resolution of for the period of June 2015–June 2019 based on the DSCOVR/EPIC observations. The newly developed products are the first of their kind because of high temporal frequency (hourly) and global coverage at a spatial resolution of , only based on a single instrument, DSCOVR/EPIC. We evaluated the EPIC-derived products against the globally distributed ground-based data, and we analyzed and compared the spatiotemporal variations in the proposed products with the well-characterized and widely used CERES products. EPIC-derived SW–PAR estimates and their direct and diffuse components show good consistencies with the globally distributed ground-based observations. The EPIC-derived products accurately capture the diurnal variabilities of SW–PAR under different sky conditions. The comparisons with CERES data indicate that the developed products reflect complex spatial heterogeneities and capture substantial seasonal variabilities of SW–PAR effectively with the same temporal resolution of hourly but higher spatial resolution. The promising products offer an invaluable resource for solar photovoltaic applications and understanding and exploring the diurnal cycles of terrestrial water, carbon and energy fluxes at various temporal and spatial scales. We plan to update our proposed products as additional EPIC observations become available and with further improvements of the record length of EPIC data and algorithm refinements that are planned by the EPIC/DSCOVR science team in the future.
The supplement related to this article is available online at: https://doi.org/10.5194/essd-12-2209-2020-supplement.
CM and HD designed the study. HD and CM produced the products, analyzed the results and drafted the original paper. All authors contributed to the analysis and interpretation of the results and to improving this paper.
The authors declare that they have no conflict of interest.
The CERES and CAVE data were obtained from the NASA Langley Research Center Atmospheric Science Data Center. We thank the entire DSCOVR/EPIC team for the powerful L2 products and especially Pam Mlynczak for valuable information on CERES Edition 4.1 products. We also thank Ben Bond-Lamberty for the valuable suggestions and Emmanuel Bonilla for his help on sharing the data on DataHub of the PNNL.
This work was supported by a Laboratory Directed Research and Development project sponsored by the Pacific Northwest National Laboratory (PNNL) of the U.S. Department of Energy. Dalei Hao was sponsored by the China Scholarship Council. The research was performed using resources available through Research Computing at the PNNL. The PNNL is operated by Battelle for the U.S. Department of Energy under contract DE-AC05-76RL01830.
This paper was edited by David Carlson and reviewed by Meredith Brown and one anonymous referee.
Augustine, J. A., DeLuisi, J. J., and Long, C. N.: SURFRAD – A national surface radiation budget network for atmospheric research, B. Am. Meteorol. Soc., 81, 2341–2358, 2000.
Boland, J., David, M., and Lauret, P.: Short term solar radiation forecasting: Island versus continental sites, Energy, 113, 186–192, 2016.
Burt, J. and Smith, B.: Deep space climate observatory: The DSCOVR mission, 2012 IEEE Aerospace Conference, Big Sky, MT, USA, 3–10 March 2012, 1–13, 2012.
Chen, M. and Zhuang, Q.: Evaluating aerosol direct radiative effects on global terrestrial ecosystem carbon dynamics from 2003 to 2010, Tellus B, 66, 21808, 2014.
Damm, A., Elbers, J., Erler, A., Gioli, B., Hamdi, K., Hutjes, R., Kosvancova, M., Meroni, M., Miglietta, F., and Moersch, A.: Remote sensing of sun-induced fluorescence to improve modeling of diurnal courses of gross primary production (GPP), Glob. Change Biol., 16, 171–186, 2010.
Driemel, A., Augustine, J., Behrens, K., Colle, S., Cox, C., Cuevas-Agulló, E., Denn, F. M., Duprat, T., Fukuda, M., Grobe, H., Haeffelin, M., Hodges, G., Hyett, N., Ijima, O., Kallis, A., Knap, W., Kustov, V., Long, C. N., Longenecker, D., Lupi, A., Maturilli, M., Mimouni, M., Ntsangwane, L., Ogihara, H., Olano, X., Olefs, M., Omori, M., Passamani, L., Pereira, E. B., Schmithüsen, H., Schumacher, S., Sieger, R., Tamlyn, J., Vogt, R., Vuilleumier, L., Xia, X., Ohmura, A., and König-Langlo, G.: Baseline Surface Radiation Network (BSRN): structure and data description (1992–2017), Earth Syst. Sci. Data, 10, 1491–1501, https://doi.org/10.5194/essd-10-1491-2018, 2018.
Farquhar, G. D. and Roderick, M. L.: Pinatubo, diffuse light, and the carbon cycle, Science, 299, 1997–1998, 2003.
Feng, F. and Wang, K.: Merging satellite retrievals and reanalyses to produce global long-term and consistent surface incident solar radiation datasets, Remote Sensing, 10, 115, https://doi.org/10.3390/rs10010115, 2018.
García, R. D., Cuevas, E., Ramos, R., Cachorro, V. E., Redondas, A., and Moreno-Ruiz, J. A.: Description of the Baseline Surface Radiation Network (BSRN) station at the Izaña Observatory (2009–2017): measurements and quality control/assurance procedures, Geosci. Instrum. Method. Data Syst., 8, 77–96, https://doi.org/10.5194/gi-8-77-2019, 2019.
Gu, L., Baldocchi, D., Verma, S. B., Black, T., Vesala, T., Falge, E. M., and Dowty, P. R.: Advantages of diffuse radiation for terrestrial ecosystem productivity, J. Geophys. Res.-Atmos., 107, ACL 2-1–ACL 2-23, 2002.
Hao, D., Wen, J., Xiao, Q., Wu, S., Lin, X., Dou, B., You, D., and Tang, Y.: Simulation and analysis of the topographic effects on snow-free albedo over rugged terrain, Remote Sensing, 10, 278, https://doi.org/10.3390/rs10020278, 2018a.
Hao, D., Wen, J., Xiao, Q., Wu, S., Lin, X., You, D., and Tang, Y.: Impacts of DEM Geolocation Bias on Downward Surface Shortwave Radiation Estimation Over Clear-Sky Rugged Terrain: A Case Study in Dayekou Basin, China, IEEE Geosci. Remote Sens. Lett., 16, 10–14, 2018b.
Hao, D., Asrar, G. R., Zeng, Y., Zhu, Q., Wen, J., Xiao, Q., and Chen, M.: Estimating hourly land surface downward shortwave and photosynthetically active radiation from DSCOVR/EPIC observations, Remote Sens. Environ., 232, 111320, https://doi.org/10.1016/j.rse.2019.111320, 2019.
Hao, D., Chen, M., Asrar, G. R., Zeng, Y., Zhu, Q., Wen, J., and Xiao, Q: A global DSCOVR/EPIC-based hourly/daily shortwave radiation/PAR dataset, DataHub for Pacific Northwest National Laboratory, https://doi.org/10.25584/1595069, 2020.
Herman, J., Huang, L., McPeters, R., Ziemke, J., Cede, A., and Blank, K.: Synoptic ozone, cloud reflectivity, and erythemal irradiance from sunrise to sunset for the whole earth as viewed by the DSCOVR spacecraft from the earth–sun Lagrange 1 orbit, Atmos. Meas. Tech., 11, 177–194, https://doi.org/10.5194/amt-11-177-2018, 2018.
Huang, G., Li, Z., Li, X., Liang, S., Yang, K., Wang, D., and Zhang, Y.: Estimating surface solar irradiance from satellites: Past, present, and future perspectives, Remote Sens. Environ., 233, 111371, https://doi.org/10.1016/j.rse.2019.111371, 2019.
Kato, S., Rose, F. G., Rutan, D. A., Thorsen, T. J., Loeb, N. G., Doelling, D. R., Huang, X., Smith, W. L., Su, W., and Ham, S.-H.: Surface irradiances of edition 4.0 clouds and the earth's radiant energy system (CERES) energy balanced and filled (EBAF) data product, J. Climate, 31, 4501–4527, 2018.
Khahro, S. F., Tabbassum, K., Talpur, S., Alvi, M. B., Liao, X., and Dong, L.: Evaluation of solar energy resources by establishing empirical models for diffuse solar radiation on tilted surface and analysis for optimum tilt angle for a prospective location in southern region of Sindh, Pakistan, Int. J. Elec. Power, 64, 1073–1080, 2015.
Khlopenkov, K., Duda, D., Thieman, M., Minnis, P., Su, W., and Bedka, K.: Development of multi-sensor global cloud and radiance composites for earth radiation budget monitoring from DSCOVR, Proc. SPIE 10424, Remote Sensing of Clouds and the Atmosphere XXII, 104240K, https://doi.org/10.1117/12.2278645, 2017.
Korany, M., Boraiy, M., Eissa, Y., Aoun, Y., Abdel Wahab, M. M., Alfaro, S. C., Blanc, P., El-Metwally, M., Ghedira, H., Hungershoefer, K., and Wald, L.: A database of multi-year (2004–2010) quality-assured surface solar hourly irradiation measurements for the Egyptian territory, Earth Syst. Sci. Data, 8, 105–113, https://doi.org/10.5194/essd-8-105-2016, 2016.
Letu, H., Yang, K., Nakajima, T. Y., Ishimoto, H., Nagao, T. M., Riedi, J., Baran, A. J., Ma, R., Wang, T., and Shang, H.: High-resolution retrieval of cloud microphysical properties and surface solar radiation using Himawari-8/AHI next-generation geostationary satellite, Remote Sens. Environ., 239, 111583, https://doi.org/10.1016/j.rse.2019.111583, 2020.
Li, X., Al-Yaari, A., Schwank, M., Fan, L., Frappart, F., Swenson, J., and Wigneron, J.-P.: Compared performances of SMOS-IC soil moisture and vegetation optical depth retrievals based on Tau-Omega and Two-Stream microwave emission models, Remote Sens. Environ., 236, 111502, https://doi.org/10.1016/j.rse.2019.111502, 2020.
Liang, S., Wang, K., Zhang, X., and Wild, M.: Review on estimation of land surface radiation and energy budgets from ground measurement, remote sensing and model simulations, IEEE J. Sel. Top. Appl., 3, 225–240, 2010.
Liou, K. N., Gu, Y., Leung, L. R., Lee, W. L., and Fovell, R. G.: A WRF simulation of the impact of 3-D radiative transfer on surface hydrology over the Rocky Mountains and Sierra Nevada, Atmos. Chem. Phys., 13, 11709–11721, https://doi.org/10.5194/acp-13-11709-2013, 2013.
Loeb, N. G., Doelling, D. R., Wang, H., Su, W., Nguyen, C., Corbett, J. G., Liang, L., Mitrescu, C., Rose, F. G., and Kato, S.: Clouds and the earth's radiant energy system (CERES) energy balanced and filled (EBAF) top-of-atmosphere (TOA) edition-4.0 data product, J. Climate, 31, 895–918, 2018.
Marshak, A., Herman, J., Adam, S., Karin, B., Carn, S., Cede, A., Geogdzhayev, I., Huang, D., Huang, L.-K., and Knyazikhin, Y.: Earth observations from DSCOVR EPIC instrument, B. Am. Meteorol. Soc., 99, 1829–1850, 2018.
Mercado, L. M., Bellouin, N., Sitch, S., Boucher, O., Huntingford, C., Wild, M., and Cox, P. M.: Impact of changes in diffuse radiation on the global land carbon sink, Nature, 458, 1014–1017, 2009.
Molina García, V., Sasi, S., Efremenko, D. S., and Loyola, D.: Improvement of EPIC/DSCOVR Image Registration by Means of Automatic Coastline Detection, Remote Sensing, 11, 1747, https://doi.org/10.3390/rs11151747, 2019.
Ohmura, A., Dutton, E. G., Forgan, B., Fröhlich, C., Gilgen, H., Hegner, H., Heimo, A., König-Langlo, G., McArthur, B., and Müller, G.: Baseline Surface Radiation Network (BSRN/WCRP): New precision radiometry for climate research, B. Am. Meteorol. Soc., 79, 2115–2136, 1998.
Pinker, R., Zhang, B., and Dutton, E.: Do satellites detect trends in surface solar radiation?, Science, 308, 850–854, 2005.
Raptis, P., Kazadzis, S., Psiloglou, B., Kouremeti, N., Kosmopoulos, P., and Kazantzidis, A.: Measurements and model simulations of solar radiation at tilted planes, towards the maximization of energy capture, Energy, 130, 570–580, 2017.
Roderick, M. L. and Farquhar, G. D.: The cause of decreased pan evaporation over the past 50 years, Science, 298, 1410–1411, 2002.
Rutan, D., Rose, F., Smith, N., and Charlock, T.: Validation data set for CERES surface and atmospheric radiation budget (SARB), WCRP/GEWEX Newsletter, 11, 11–12, 2001.
Rutan, D. A., Kato, S., Doelling, D. R., Rose, F. G., Nguyen, L. T., Caldwell, T. E., and Loeb, N. G.: CERES synoptic product: Methodology and validation of surface radiant flux, J. Atmos. Ocean. Tech., 32, 1121–1143, 2015.
Ryu, Y., Jiang, C., Kobayashi, H., and Detto, M.: MODIS-derived global land products of shortwave radiation and diffuse and total photosynthetically active radiation at 5 km resolution from 2000, Remote Sens. Environ., 204, 812–825, 2018.
Sweerts, B., Pfenninger, S., Yang, S., Folini, D., Van der Zwaan, B., and Wild, M.: Estimation of losses in solar energy production from air pollution in China since 1960 using surface radiation data, Nat. Energ., 4, 657–663, 2019.
Urraca, R., Huld, T., Gracia-Amillo, A., Martinez-de-Pison, F. J., Kaspar, F., and Sanz-Garcia, A.: Evaluation of global horizontal irradiance estimates from ERA5 and COSMO-REA6 reanalyses using ground and satellite-based data, Sol. Energ., 164, 339–354, 2018.
Van Heerwaarden, C. C., Vilà-Guerau de Arellano, J., Gounou, A., Guichard, F., and Couvreux, F.: Understanding the daily cycle of evapotranspiration: A method to quantify the influence of forcings and feedbacks, J. Hydrometeorol., 11, 1405–1422, 2010.
Wang, D., Liang, S., Zhang, Y., Gao, X., Brown, M. G., and Jia, A.: A New Set of MODIS Land Products (MCD18): Downward Shortwave Radiation and Photosynthetically Active Radiation, Remote Sensing, 12, 168, https://doi.org/10.3390/rs12010168, 2020.
Wang, H. and Pinker, R.: Shortwave radiative fluxes from MODIS: Model development and implementation, J. Geophys. Res.-Atmos., 114, D20201, https://doi.org/10.1029/2008JD010442, 2009.
Wang, W., Yin, G., Zhao, W., Wen, F., and Yu, D.: Spatial Downscaling of MSG Downward Shortwave Radiation Product Under Clear-Sky Condition, IEEE T. Geosci. Remote, 3264–3272, https://doi.org/10.1109/TGRS.2019.2951699, 2019.
Wang, X., Wu, J., Chen, M., Xu, X., Wang, Z., Wang, B., Wang, C., Piao, S., Lin, W., and Miao, G.: Field evidences for the positive effects of aerosols on tree growth, Glob. Change Biol., 24, 4983–4992, 2018.
Wielicki, B. A., Barkstrom, B. R., Harrison, E. F., Lee III, R. B., Smith, G. L., and Cooper, J. E.: Clouds and the Earth's Radiant Energy System (CERES): An earth observing system experiment, B. Am. Meteorol. Soc., 77, 853–868, 1996.
Wild, M., Gilgen, H., Roesch, A., Ohmura, A., Long, C. N., Dutton, E. G., Forgan, B., Kallis, A., Russak, V., and Tsvetkov, A.: From dimming to brightening: Decadal changes in solar radiation at Earth's surface, Science, 308, 847–850, 2005.
Wyser, K., O'Hirok, W., and Gautier, C.: A simple method for removing 3-D radiative effects in satellite retrievals of surface irradiance, Remote Sens. Environ., 94, 335–342, 2005.
Xu, X., Wang, J., Wang, Y., Zeng, J., Torres, O., Yang, Y., Marshak, A., Reid, J., and Miller, S.: Passive remote sensing of altitude and optical depth of dust plumes using the oxygen A and B bands: First results from EPIC/DSCOVR at Lagrange-1 point, Geophys. Res. Lett., 44, 7544–7554, 2017.
Yang, B., Knyazikhin, Y., Mõttus, M., Rautiainen, M., Stenberg, P., Yan, L., Chen, C., Yan, K., Choi, S., and Park, T.: Estimation of leaf area index and its sunlit portion from DSCOVR EPIC data: Theoretical basis, Remote Sens. Environ., 198, 69–84, 2017.
Yang, Y., Meyer, K., Wind, G., Zhou, Y., Marshak, A., Platnick, S., Min, Q., Davis, A. B., Joiner, J., Vasilkov, A., Duda, D., and Su, W.: Cloud products from the Earth Polychromatic Imaging Camera (EPIC): algorithms and initial evaluation, Atmos. Meas. Tech., 12, 2019–2031, https://doi.org/10.5194/amt-12-2019-2019, 2019.
Zhang, S., Li, X., She, J., and Peng, X.: Assimilating remote sensing data into GIS-based all sky solar radiation modeling for mountain terrain, Remote Sens. Environ., 231, 111239, https://doi.org/10.1016/j.rse.2019.111239, 2019.
Zhang, X., Liang, S., Zhou, G., Wu, H., and Zhao, X.: Generating Global LAnd Surface Satellite incident shortwave radiation and photosynthetically active radiation products from multiple satellite data, Remote Sens. Environ., 152, 318–332, 2014.
Zhao, L., Lee, X., and Liu, S.: Correcting surface solar radiation of two data assimilation systems against FLUXNET observations in North America, J. Geophys. Res.-Atmos., 118, 9552–9564, 2013.