the Creative Commons Attribution 4.0 License.
the Creative Commons Attribution 4.0 License.
 | 21 Aug 2020
A high-resolution reanalysis of global fire weather from 1979 to 2018 – overwintering the Drought Code
Megan McElhinny
Justin F. Beckers
Chelene Hanes
Mike Flannigan
Piyush Jain
We present a global high-resolution calculation of the Canadian Fire Weather Index (FWI) System indices using surface meteorology from the ERA5 HRES reanalysis for 1979–2018. ERA5 HRES represents an improved dataset compared to several other reanalyses in terms of accuracy, as well as spatial and temporal coverage. The FWI calculation is performed using two different procedures for setting the start-up value of the Drought Code (DC) at the beginning of the fire season. The first procedure, which accounts for the effects of inter-seasonal drought, overwinters the DC by adjusting the fall DC value with a fraction of accumulated overwinter precipitation. The second procedure sets the DC to its default start-up value (i.e. 15) at the start of each fire season. We validate the FWI values over Canada using station observations from Environment and Climate Change Canada and find generally good agreement (mean Spearman correlation of 0.77). We also show that significant differences in early season DC and FWI values can occur when the FWI System calculation is started using the overwintered versus default DC values, as is highlighted by an example from 2016 over North America. The FWI System moisture codes and fire behaviour indices are made available for both versions of the calculation at https://doi.org/10.5281/zenodo.3626193 (McElhinny et al., 2020), although we recommend using codes and indices calculated with the overwintered DC, unless specific research requirements dictate otherwise.
- Article
(5210 KB) - Full-text XML
- BibTeX
- EndNote


Climate reanalyses provide a numerical and geospatial description of past and present climate (Bengtsson et al., 2007). This method of climate simulation assimilates weather observations into dynamic climate models of the atmosphere and relevant Earth systems to represent the atmospheric and surface states at a given time, usually for a historical period of multiple decades to the near-present. The gridded product of reanalysis is spatially and temporally continuous for the duration of the model simulation and has the added benefit of producing data in remote areas that are sometimes inaccessible to direct monitoring (Bengtsson et al., 2007). The best climate reanalyses use the same model configuration for the duration of the simulation, thus eliminating inhomogeneities that may occur through other modes of climate tracking and providing a useful tool for studying weather-related phenomena.
Past research in the field of reanalysis and fire weather has analysed the correlation between metrics of fire danger produced by reanalyses and those produced from weather stations at local to continental scales. In comparing observed and reanalysis-derived indices of fire weather, reanalyses have been found to be an effective tool for indicating fire danger (Bedia et al., 2012; Venäläinen et al., 2014; Field et al., 2015). Other studies have investigated the relationship between fire weather indices calculated from reanalyses and measures of the fire regime, such as annual area burned (Bedia et al., 2014), trends in fire season length (Jain et al., 2017), and quantification of global seasonal fire danger (Vitolo et al., 2019). Reanalyses have also been used to investigate the spatio-temporal variation in fire danger indices across continents (Lu et al., 2011) and to develop new indices that investigate the validity of incorporating synoptic and meso-scale weather processes into metrics of fire behaviour (Srock et al., 2018). Recently, research has begun to investigate the application of reanalyses in prediction of future fire weather and fire behaviour patterns by evaluating how they can supplement the coarse resolution of global climate models on local scales through statistical downscaling (Bedia et al., 2013). Although climate reanalysis has been found to be a useful and reliable tool for calculating indices of fire behaviour, some metrics of fire danger require specific temporal weather measurements, such as noon local standard time measurements, that many reanalyses cannot directly provide (Herrera et al., 2013). However, the concerns raised around this shortcoming have been addressed in recent years by new reanalysis products with better temporal resolution, among other improvements.
Many countries, including Canada, use the Canadian Fire Weather Index (FWI) System to determine the effects of weather on forest fuel moisture and subsequently fire behaviour (Lawson and Armitage, 2008). The FWI System considers surface temperature, relative humidity, 24 h accumulated precipitation, and wind speed at 10 m to calculate moisture in three fuel layers represented by three moisture codes respectively: the Fine Fuel Moisture Code (FFMC), the Duff Moisture Code (DMC), and the Drought Code (DC). These values, plus wind speed, are then used to calculate indices of potential fire behaviour; the Initial Spread Index (ISI) and Buildup Index (BUI) from which the Fire Weather Index (FWI) and Daily Severity Rating (DSR) are produced.
The DC is one of three moisture codes that impacts fire behaviour and is the metric that tracks moisture in the deepest layer of forest floor fuels as well as in large, dead, woody debris (Wotton, 2009). Due to its depth, the DC is the slowest-changing moisture code with a time lag of 52 d (Van Wagner, 1987). Essentially, the DC value decreases with effective rainfall and increases with evapotranspiration so that higher values indicate a higher likelihood that a wildfire will persist and smoulder (Van Wagner, 1987).
In areas where winter precipitation is sufficient (i.e. greater than 200 mm rain or snow equivalent), moisture reserves are typically recharged in the spring so that the default DC value of 15 represents near saturation of deep organic layers (Alexander, 1982; Lawson and Armitage, 2008). However, when this is not the case, an alternative method to start up the FWI calculation uses an overwintered value of the DC. This value is determined from the final DC of the preceding fire season, representing any potential fall moisture deficit and a percentage of overwinter precipitation assumed available to recharge that deficit (Lawson and Armitage, 2008). The main body of thought behind using the overwintered DC is that it accounts for fall drought conditions and/or dry winter conditions and thus may indicate drier moisture conditions, leading to more severe fire weather risk at the beginning of the fire season than is suggested by the default DC.
A number of empirical field studies further support the need for overwintering the DC when calculating FWI System indices. Lawson and Dalrymple (1996) describe a method for ground-truthing (i.e. the process of calibrating from and/or validating against field sample measurements) the DC with destructive sampling, which can be executed at any time during the fire season. They concluded that overwintering the DC was adequate for broad areas but that site-specific calibration may still be necessary. Confirming this finding, Bourgeau-Chavez et al. (2007) demonstrated that the default start-up value of DC was not sufficient for describing spring fuel moisture in Alaska and Girardin et al. (2006) showed that both area burned and number of large fires were correlated with the previous season's DC. Furthermore, Wilmore (2001) showed that default DC values overpredicted spring fuel moisture and that overwintering the DC led to improvements in estimates of drought conditions, although this could be further improved upon using an alternative site-specific overwintering equation.
Although these papers largely indicate that the overwintered DC is more representative of actual conditions than the default DC, many note that regional adjustments for the carry-over fraction from the previous season's fall moisture and the coefficient for effectiveness of winter precipitation in recharging moisture reserves in the spring are necessary when calculating the overwintered DC (Lawson and Armitage, 2008; Anderson and Otway, 2003). In analysing the conditions leading up to the Fort McMurray wildfire in Alberta, Canada, it was found that accounting for observations of fuel moisture when calculating the start-up DC value can additionally improve the accuracy of fire danger detection (Elmes et al., 2018).
ERA5 HRES is a high-resolution reanalysis dataset named for and produced by the European Centre for Medium-Range Weather Forecasts (ECMWF) reanalysis high-resolution product, of which the dataset is the fifth generation (after FGGE, ERA-15, ERA-40, and ERA-Interim; Hennerman and Berrisford, 2019). The spatial and temporal continuity and resolution of this dataset makes it a useful tool for analysing past weather and associated phenomenon. The main purpose of this paper is to document the calculation of FWI System indices using the global ERA5 HRES reanalysis (hereafter known as ERA5). We perform the calculation using both default and overwintered DC start-up values, the latter being important for some regions with snow cover or ground freeze over winter.
The ERA5 reanalysis product is produced from the CY41R2 global ensemble system of the ECMWF Integrated Forecast System (Copernicus Climate Change Service (C3S), 2017). Weather observations from satellites and in situ data from the World Meteorological Organization are integrated into the global ensemble using 4-dimensional variational analysis data assimilation (Hennerman and Berrisford, 2019).
The high-resolution realization is 31 km globally or 0.28125∘ on a reduced Gaussian grid (output at 0.25∘ on a regular geographic grid), which provides an improvement in precision over its predecessor, ERA-Interim, for which the resolution was 79 km globally (Hennerman and Berrisford, 2019). Additionally, ERA5 has a finer resolution compared to other global reanalysis products including the NCEP North American Regional Reanalysis (NARR), NCEP-DOE Reanalysis 2, and NASA's Modern-Era Retrospective analysis for Research and Applications (MERRA) as well as MERRA-2. The ERA5 dataset covers 1979 to 2–3 months before present (our calculation only used data up to 2018 to obtain a full final year), on an hourly scale producing numerous global climatological variables including surface and upper-atmosphere quantities. For this study we obtained surface variables including temperature (K), dew point temperature (K), U and V components of wind (m s−1), precipitation (m), and a land–sea mask, available from the ECMWF Climate Data Store (CDS) website (https://cds.climate.copernicus.eu/cdsapp#!/dataset/reanalysis-era5-single-levels?tab=form, last access: 17 May 2019).
Compared with the ERA-Interim product, ERA5 has been shown to perform better with respect to variation in data quality over space and time, tropospheric representation, representation of tropical cyclones, soil moisture accuracy, sea surface temperature and sea ice cover detection, the global precipitation and evaporation balance, and precipitation over land especially in the deep tropics (Hennerman and Guillory, 2019). One of the most impressive improvements to the ERA5 dataset is with respect to precipitation modelling. Multiple studies have been conducted to determine the accuracy with which ERA5 detects various aspects of past precipitation events. One study, conducted in the Assiniboine River basin of the northern Great Plains, found that of six reanalysis products, including CaPA, ERA-Interim, ERA5, JRA-55, MERRA-2, and NLDAS-2, the ERA5 dataset consistently performed in the top three regarding precipitation detection, correlation to observed precipitation events, mean absolute error, and root mean square error (RMSE; Xu et al., 2019). A study in the Fram Strait, off the coast of Greenland, found that of ERA5, ERA-Interim, JRA-55, CFSv2, and MERRA-2, the ERA5 reanalysis produced the most accurate simulation of radiosonde profiles over the strait and showed the lowest vertically averaged absolute biases for every variable except relative humidity, which was best simulated by JRA-55 (Graham et al., 2019). Over North America, ERA5 was consistently found to have lower precipitation (and temperature) biases than ERA-Interim, reducing the median gap between observations by 40 % compared to its predecessor (Tarek et al., 2020). ERA5 performance was found to be equivalent to directly observed data for most of the region, excluding the eastern USA where observations were more accurate. Finally, a study conducted over the contiguous United States found that of 26 (sub)daily precipitation datasets, ERA5 had the best performance of the compared uncorrected precipitation products, meaning those using only satellite and/or reanalysis data (Beck et al., 2019). The significant capabilities of the ERA5 reanalysis product indicate the impressive advances in Earth system modelling that have been made in recent years by the ECMWF. With the improved representation of surface weather from ERA5 in mind, we used the product to calculate indices of fire weather for the entire globe.
3.1 Fire weather input variables
The requirements of the FWI calculation stipulate that 2 m temperature (∘C), 10 m wind speed (km h−1), and 2 m relative humidity (%) measurements be taken at noon LST for each global time zone and that precipitation (mm) be accumulated over the previous 24 h ending at noon LST of each day (Van Wagner, 1987; see Lawson and Armitage, 2008, for details on weather station sensors). To facilitate subsetting the data to noon for each time zone, we created a land index from the ECMWF land–sea mask and a shapefile of global time zones (retrieved from the Natural Earth website, https://www.naturalearthdata.com/downloads/10m-cultural-vectors/timezones/, last access: 18 May 2019). The land index contained information regarding the location of each ECMWF grid cell over land or water as well as the time zone (as an offset from UTC±00:00) the grid cell covered. It should be noted that cells containing any amount of land were considered to be completely over land and that cells entirely over water were not processed in subsequent steps of the project.
To account for the noon LST requirement, the UTC offset values contained in each grid cell of the land index were used to select the first noon LST layer of each ECMWF monthly surface weather variable. A sequence of 24 h increments was then applied to each cell, starting at the first noon LST layer, to select (or sum in the case of precipitation) 24 h increments between the noons LST of each day.
To account for the correct FWI units, the temperature (K) and accumulated precipitation (m) data were converted to degrees Celsius and millimetres respectively. Relative humidity was calculated from the subsetted datasets for temperature and dew point temperature according to a derivation of the Rothfusz regression (Rothfusz, 1990), Eqs. (1) and (2):
where T is temperature (∘C), Td is dew point temperature (∘C), and RH is relative humidity (%). For wind speed, the subsetted datasets for the U component and V component of wind were converted to wind speed according to Eq. (3):
where u is the U component of wind (m s−1), v is the V component of wind (m s−1), and WS is wind speed (km h−1). Once each weather variable was subset into daily noon LST values and converted into the correct units, all monthly datasets for a year were bound together to produce annual datasets of daily values for each element of fire weather.
3.2 Overwintering masks
3.2.1 Overwintered Drought Code
In regions covered by snow over winter, the fire season is considered to be active on the third day after snow has disappeared and the fire season is considered to be over when snow covers the ground. Alternatively, as a proxy for the snow condition, the fire season is considered to be active on the fourth day following 3 consecutive days with a maximum temperature of 12 ∘C or higher and the fire season is considered to be over after 3 consecutive days with a maximum temperature of 5 ∘C or lower (Wotton and Flannigan, 1993; Lawson and Armitage, 2008). Using this definition of overwintering means that the fire season can switch on and off throughout the year. For example, the upper and lower maximum temperature thresholds may be met multiple times throughout the year resulting in short periods of fire season in the shoulder seasons (where the maximum daily temperature condition is met for short periods before and/or after the main fire season), in addition to a longer fire season period. The 24 h maximum temperature of each day (using local standard time) were calculated from the ECMWF data using the hourly 2 m temperature data. Accounting for the maximum temperature thresholds, we created binary masks of overwintering for each year from the annual datasets of midnight LST 24 h maximum temperature, with the process of overwintering the DC in mind.
3.2.2 Default Drought Code
When the default DC is used to start up the FWI calculation, it is not desirable to include short shoulder fire seasons since the DC value is reset at the beginning of each fire season period, which leads to discontinuities in the calculated codes and indices. Thus, we only used the longest continuous fire season period from the Drought Code overwintering masks, by creating a mask for default DC with a single fire season start and end date per year in each grid cell of the Northern Hemisphere (NH) and Southern Hemisphere (SH). For NH grid cells, we saved the longest continuous fire season between 1 January and 31 December of the same calendar year, and for SH cells, we saved the longest fire season between 1 July of 1 calendar year and 30 June of the next calendar year, with each time period chosen to contain the boreal and astral summers respectively. Although SH cells were processed across years, the final product was organized to contain the overwintering status values for each cell on the globe for a calendar year in both the NH and SH. It is important to note that in some cases, a fire season run would extend beyond the defined end of year. Here, we added the length of days for which the fire season extended into the new year to the length of the fire season in the preceding year. Nevertheless, the main fire season was still defined as the longest run of fire season days within the defined year (corresponding to each hemisphere) for each calendar year.
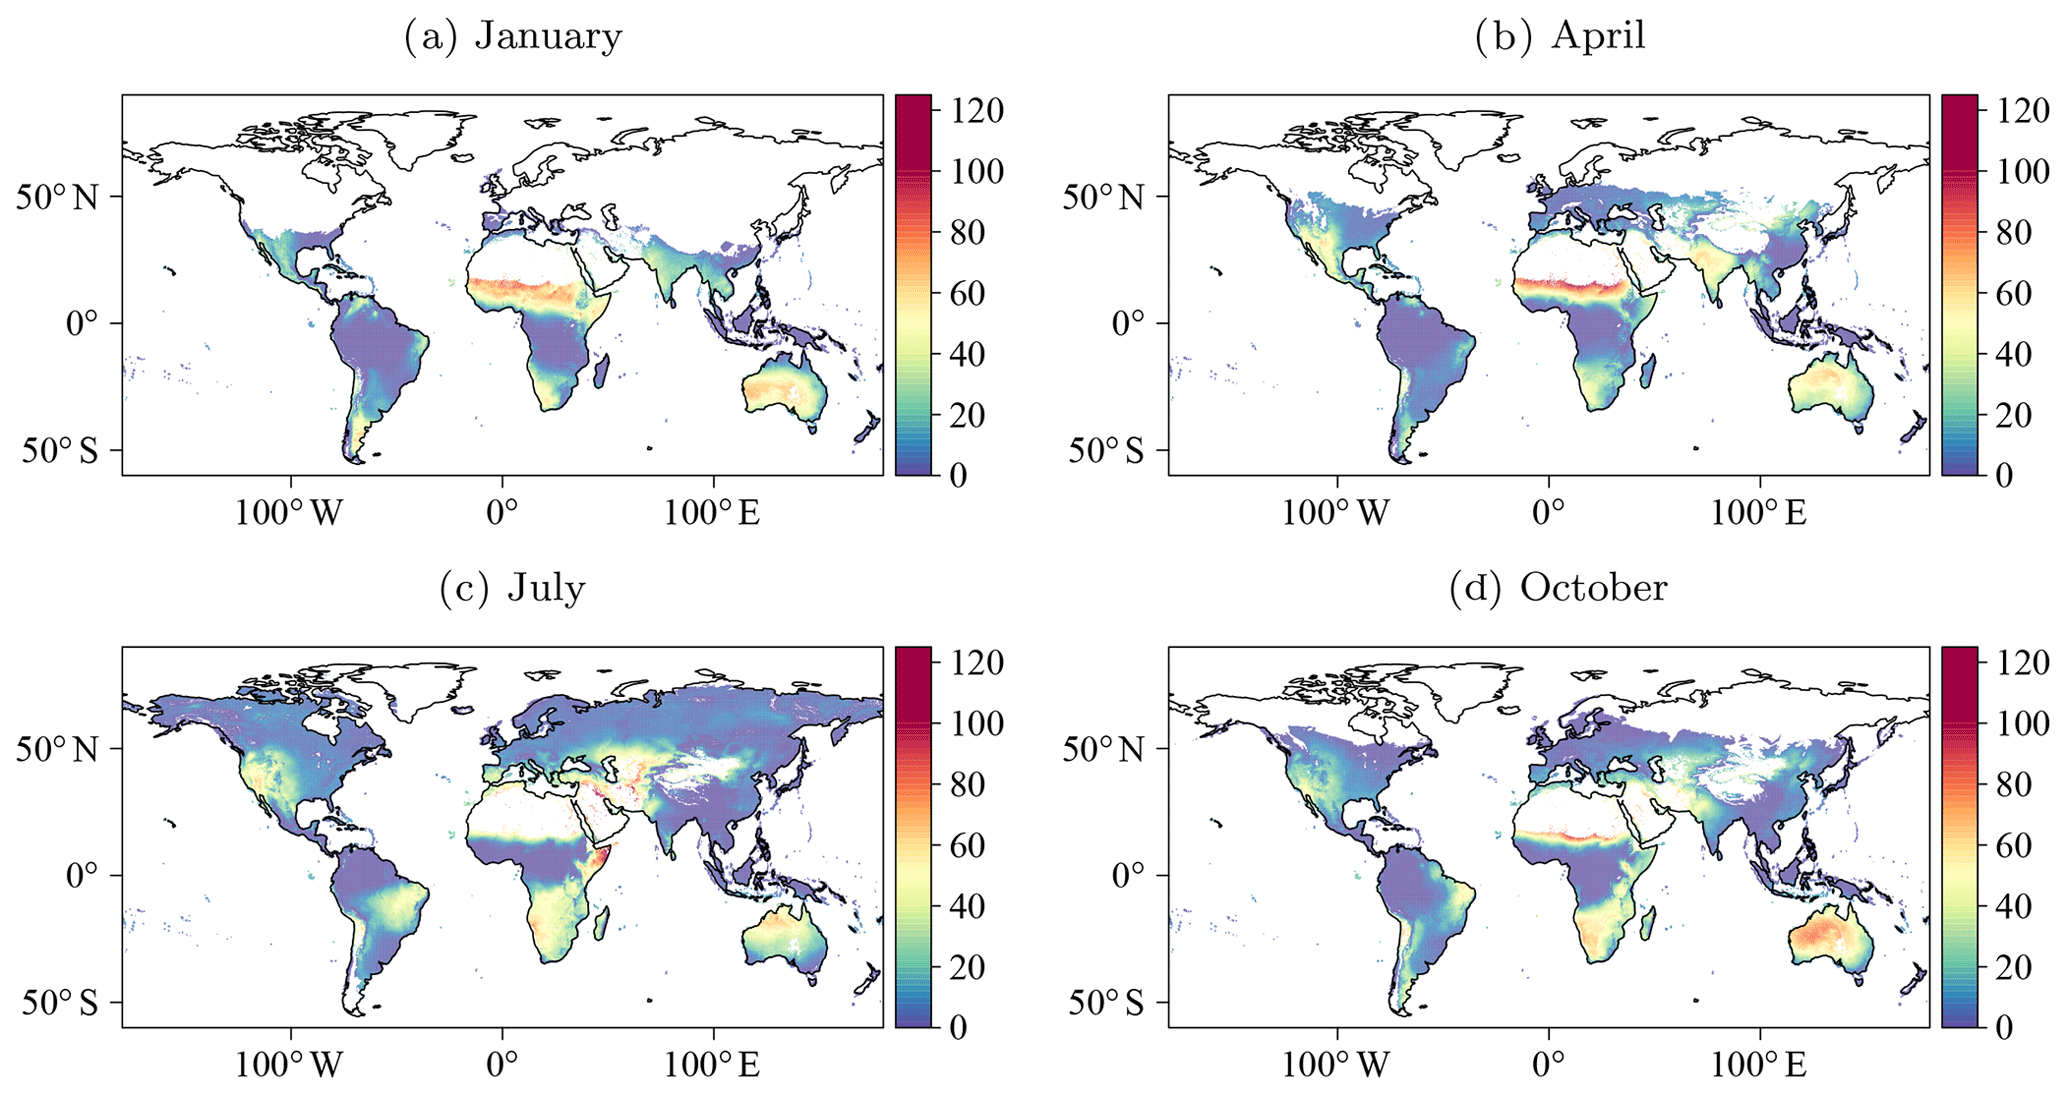
Figure 1Monthly climatologies of mean FWI values for January (a), April (b), July (c), and October (d). Barren areas (e.g. the Sahara) and any locations where overwintering is active for greater than 50 % of the temporal record are masked out. Barren areas are further masked using land cover data available from Li et al. (2018), part of the ESA Climate Change Initiative – Land Cover led by UCLouvain (2017). Map displayed in World Geodetic System 1984 projection (WGS84, EPSG:4326).
3.3 Annual FWI System indices
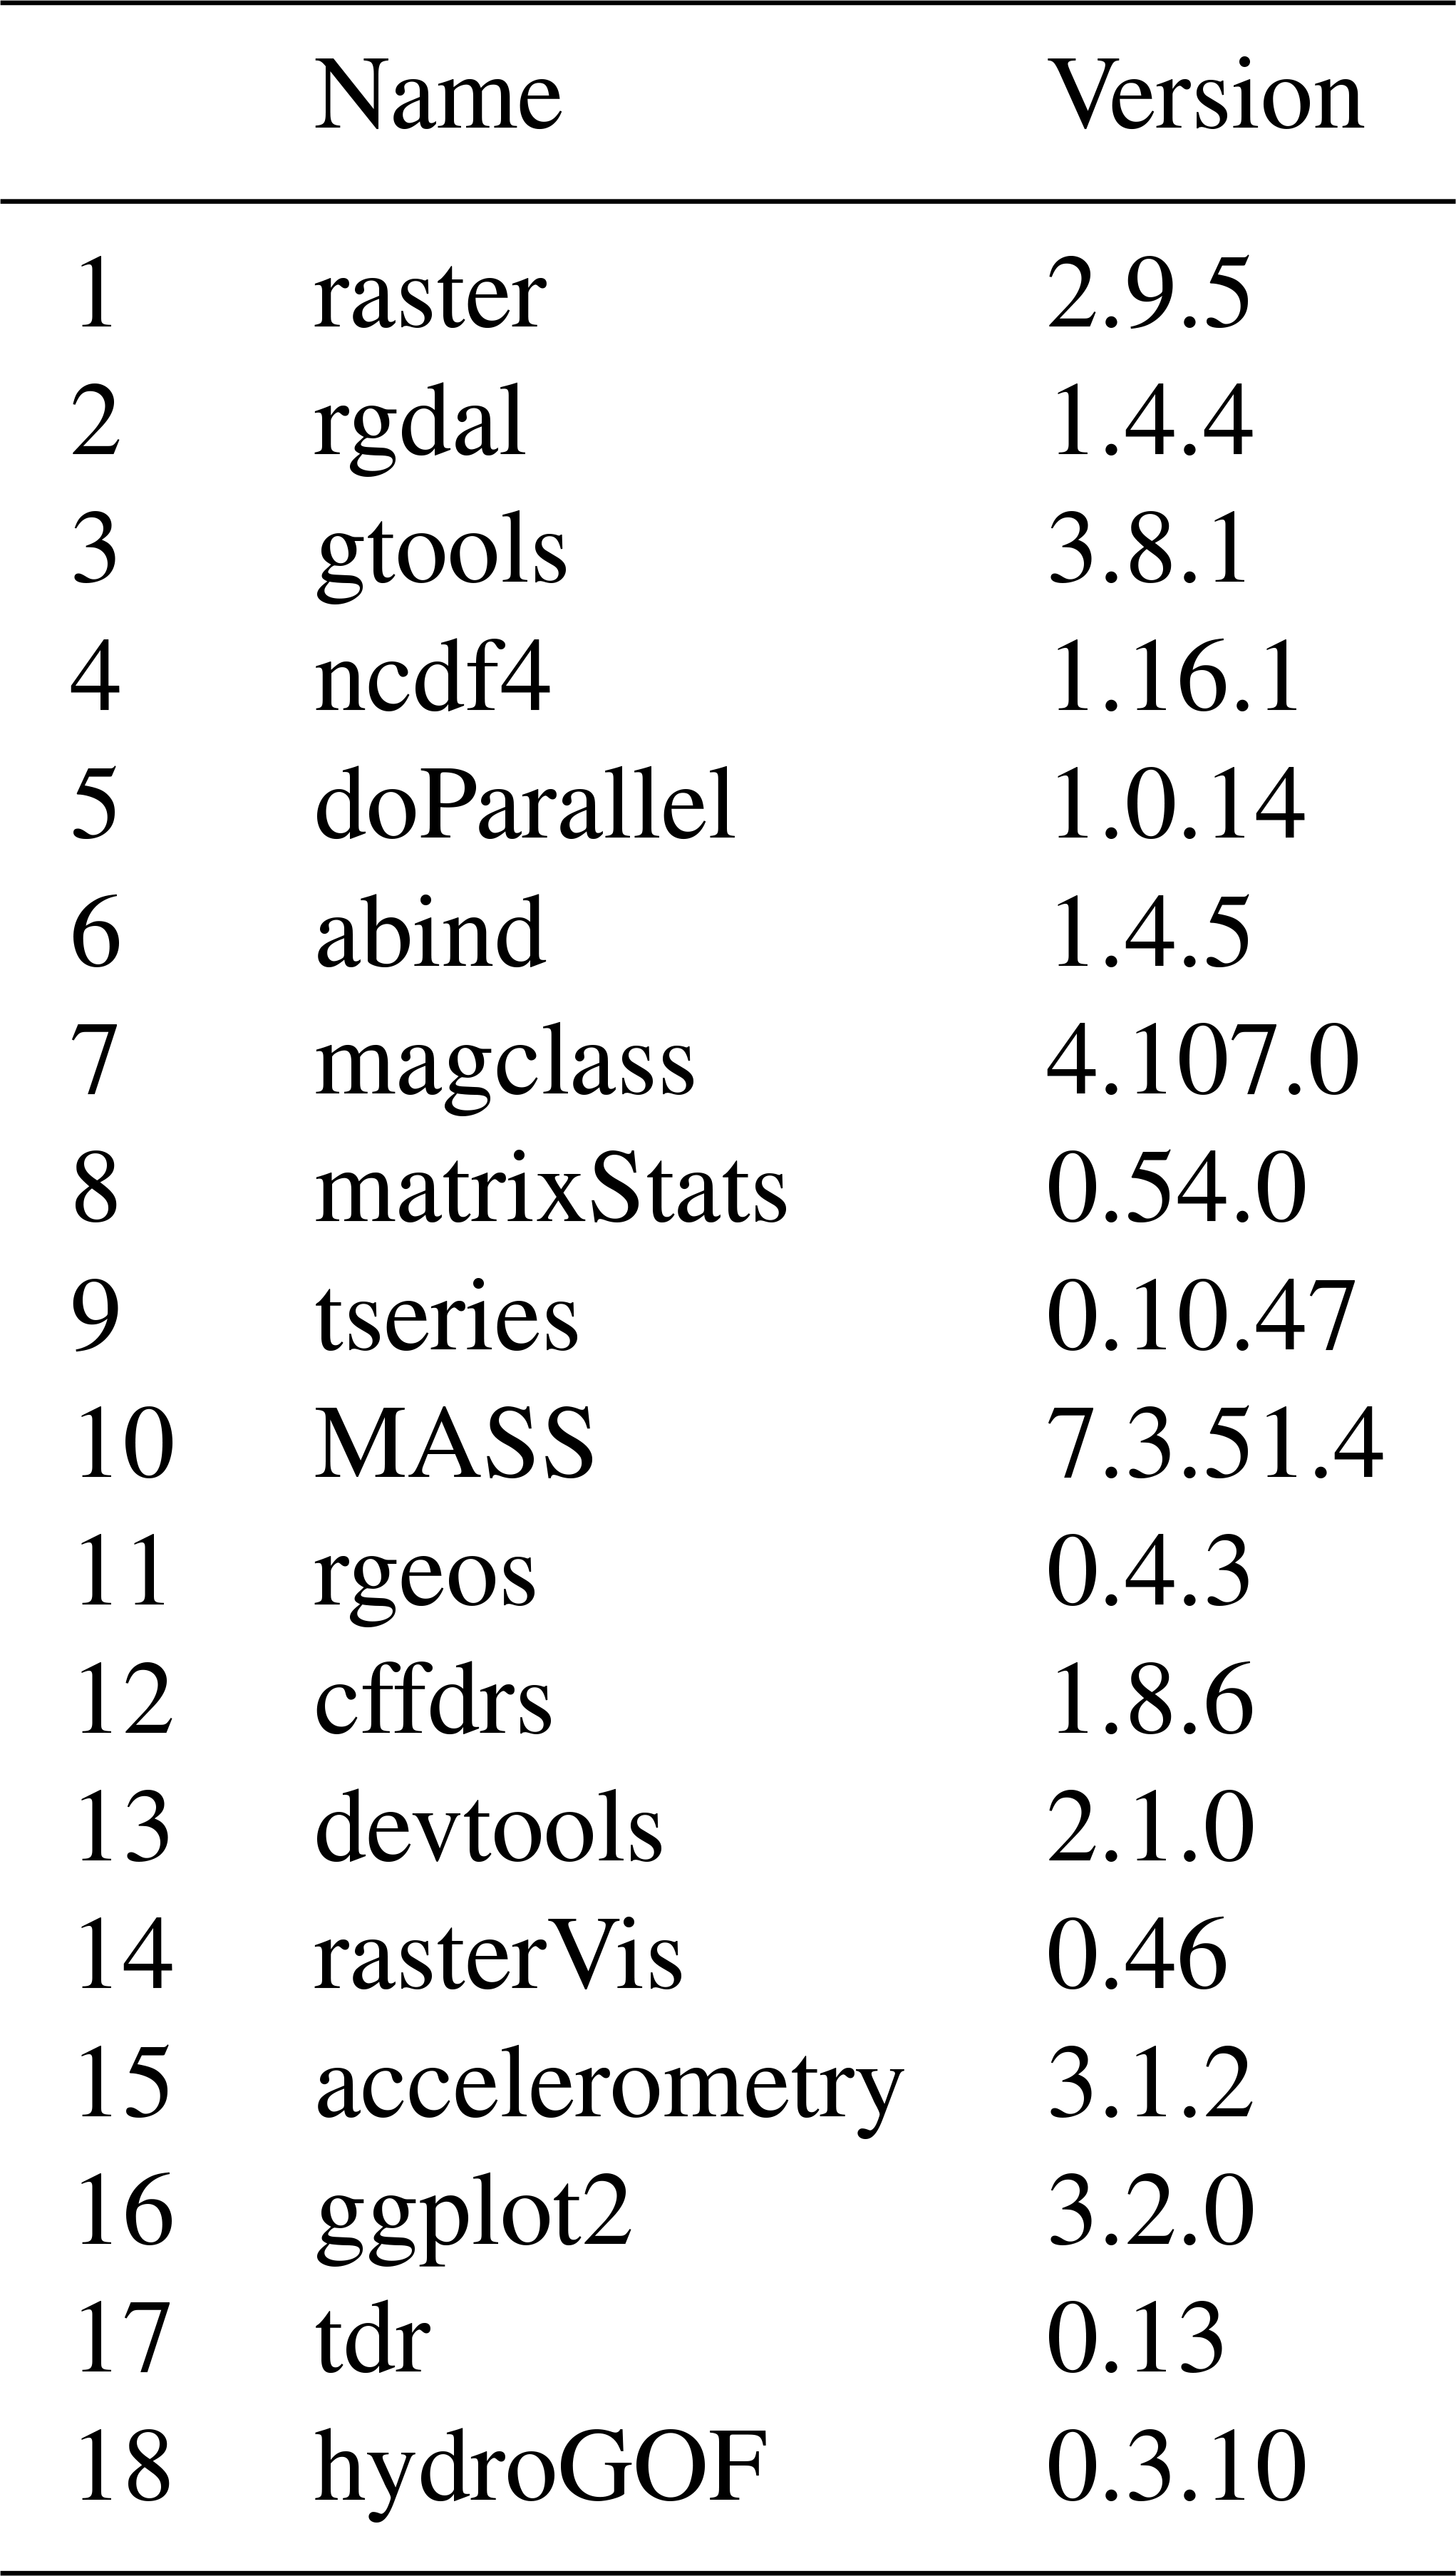
Daily FWI System outputs, including FFMC, DMC, DC, ISI, BUI, FWI, and DSR were calculated using the cffdrs package in R (Version 1.8.5; Wang et al., 2017) with the elements of fire weather data as inputs (for a full listing of R packages and versions used for the calculation see Appendix B). When accounting for the overwintered DC, we programmed the fwiRaster function according to a delta mask. The delta value for each day was calculated by subtracting the previous day's overwintered DC mask value from the current day's mask value for each grid cell. This created four cases:
-
Case 1. The delta mask was equivalent to 1. This indicated that it was the first day of overwintering (the fire season was inactive) at that location, and thus we saved the DC of the previous day and the 24 h accumulated precipitation of the current day.
-
Case 2. The delta mask was equivalent to 0, and the current day's overwintering mask was equivalent to 1. This indicated that the overwintering status of the location was active (but it was not the first day of overwintering), and thus we saved the sum of the current day's precipitation and all precipitation since overwintering began.
-
Case 3. The delta mask was equivalent to −1. This indicated that it was the first day of the fire season at that location, and thus we calculated the start-up DC (a.k.a. the overwintered DC) from the saved DC value when overwintering began and the precipitation that accumulated through the overwintering period, using the overwintering Drought Code function of the cffdrs package (Wang et al., 2017). The final value of accumulated precipitation represents the total value of precipitation that fell during the period defined by the maximum temperature threshold criteria. Additionally, we set the FFMC and DMC to the default values of 85 and 6 respectively and stopped accumulating precipitation.
-
Case 4. The delta mask was equivalent to 0, and the current day's overwintering mask was equivalent to 0. This indicated that the fire season status of the location was active (but it was not the first day of the fire season), and thus the FWI calculation was reliant on the current day's weather variables and the previous day's FWI moisture code outputs.
When accounting for the default DC, the delta mask was produced from the default Drought Code overwintering masks as above. However, this resulted in only two relevant cases: Case 3 and 4. Case 4 was the same for the overwintered DC situation, but Case 3 was different in that the start-up DC was set to 15, rather than calculating the overwintered DC value.
In the case of the overwintered DC, the adjusted start-up values of the DC were calculated using the wDC function in the cffdrs R package. In particular, we set the two required coefficients for this function as a=1 (representing carry-over fraction of last fall's moisture) and b=0.75 (default value of effectiveness of winter precipitation in recharging moisture reserves in spring). As noted by Lawson and Armitage (2008) and Anderson and Otway (2003), the overwintered DC is most accurately represented when regional conditions are analysed and the coefficients of the wDC function are adjusted accordingly. However, the ERA5 dataset did not contain information that allowed us to vary these coefficients, and thus we chose the default values.
FWI indices in the overwintered and default DC situations were calculated for Case 3 and 4. When Case 3 was identified, FWI indices were calculated from the default FFMC and DMC, that day's values for the elements of fire weather, and the overwintered DC or default DC value depending on which overwintering mask was used. When Case 4 was identified, FWI indices were calculated from that day's elements of fire weather and the previous day's moisture codes in both Drought Code situations. We produced two final datasets of daily FWI System indices for 1979 to 2018: the first used the overwintered DC value at fire season start-up and calculated FWI values each time the maximum temperature thresholds were met, and the second used the default DC value at fire season start-up and only produced FWI values for the longest annual fire season in each hemisphere.
4.1 Climatologies
Mean FWI values vary spatially and temporally based on climatological conditions and surface topography. Figure 1 shows monthly climatologies of mean FWI values for January, April, July, and October, which are indicative of global seasonal changes in FWI values. Note that the absence of values in the northern latitudes for January, April, and October represents grid cells where the FWI System calculation is suspended because it is outside of the fire season period.
4.2 Validation for Canada
It is instructive to examine the accuracy of the ERA5 FWI System calculation when compared with station observations, particularly given its intended use as a proxy for observed data. We perform a simple validation for Canada, for which the FWI System was initially developed and calibrated. We used FWI values calculated from the historical Environment and Climate Change Canada (ECCC) archive from 1979 to 2009, which represented the temporal period of quality-controlled data overlapping the ERA5 reanalysis data (Natural Resources Canada – Canadian Forest Service, Wildland Fire Information Systems, 2016).
For the validation, we considered three simple metrics: (1) mean absolute error (mean(|X1−X0|)), (2) mean bias error (MBE; mean(X1−X0)), and (3) Spearman rank correlation (SRC; ρs(X0,X1)), denoting X1 as the FWI values calculated from the ERA5 reanalysis dataset and X0 as the FWI values calculated using ECCC station data. Figure 2 shows the spatial distribution of the three metrics with histograms of their values. Overall, citing the mean values with the 5th and 95th percentiles (in square brackets) gives MAE = 5.005049, 90 % CI [1.58, 11.05]; MBE , 90 % CI [−10.15, 0.26]; and SRC = 0.7764061, 90 % CI [0.63, 0.88]. These results suggest that although there is a strong correlation between the reanalysis and observed FWI values, the FWI values calculated from ERA5 exhibit a negative bias, particularly in Alberta, Canada (see Fig. 2b). Note, the higher density of stations in Alberta can be attributed to a greater number of ECCC stations in the ECCC historical archive, including those from provincial weather station networks including both Alberta Agriculture and Forestry and the Alberta Wildfire management branch.
An investigation into the source of the model bias is outside the scope of this paper. However, we note that FWI values from the ERA5 reanalysis may be underestimated due to biases in wind speed and precipitation, as noted in one recent study in Canada (Betts et al., 2019). With respect to non-gauge-corrected precipitation models, ERA5 performs well compared with other datasets (Beck et al., 2019). Nevertheless, users of the dataset documented here should be aware of any limitations in model bias and accuracy for their intended study area and period of interest.
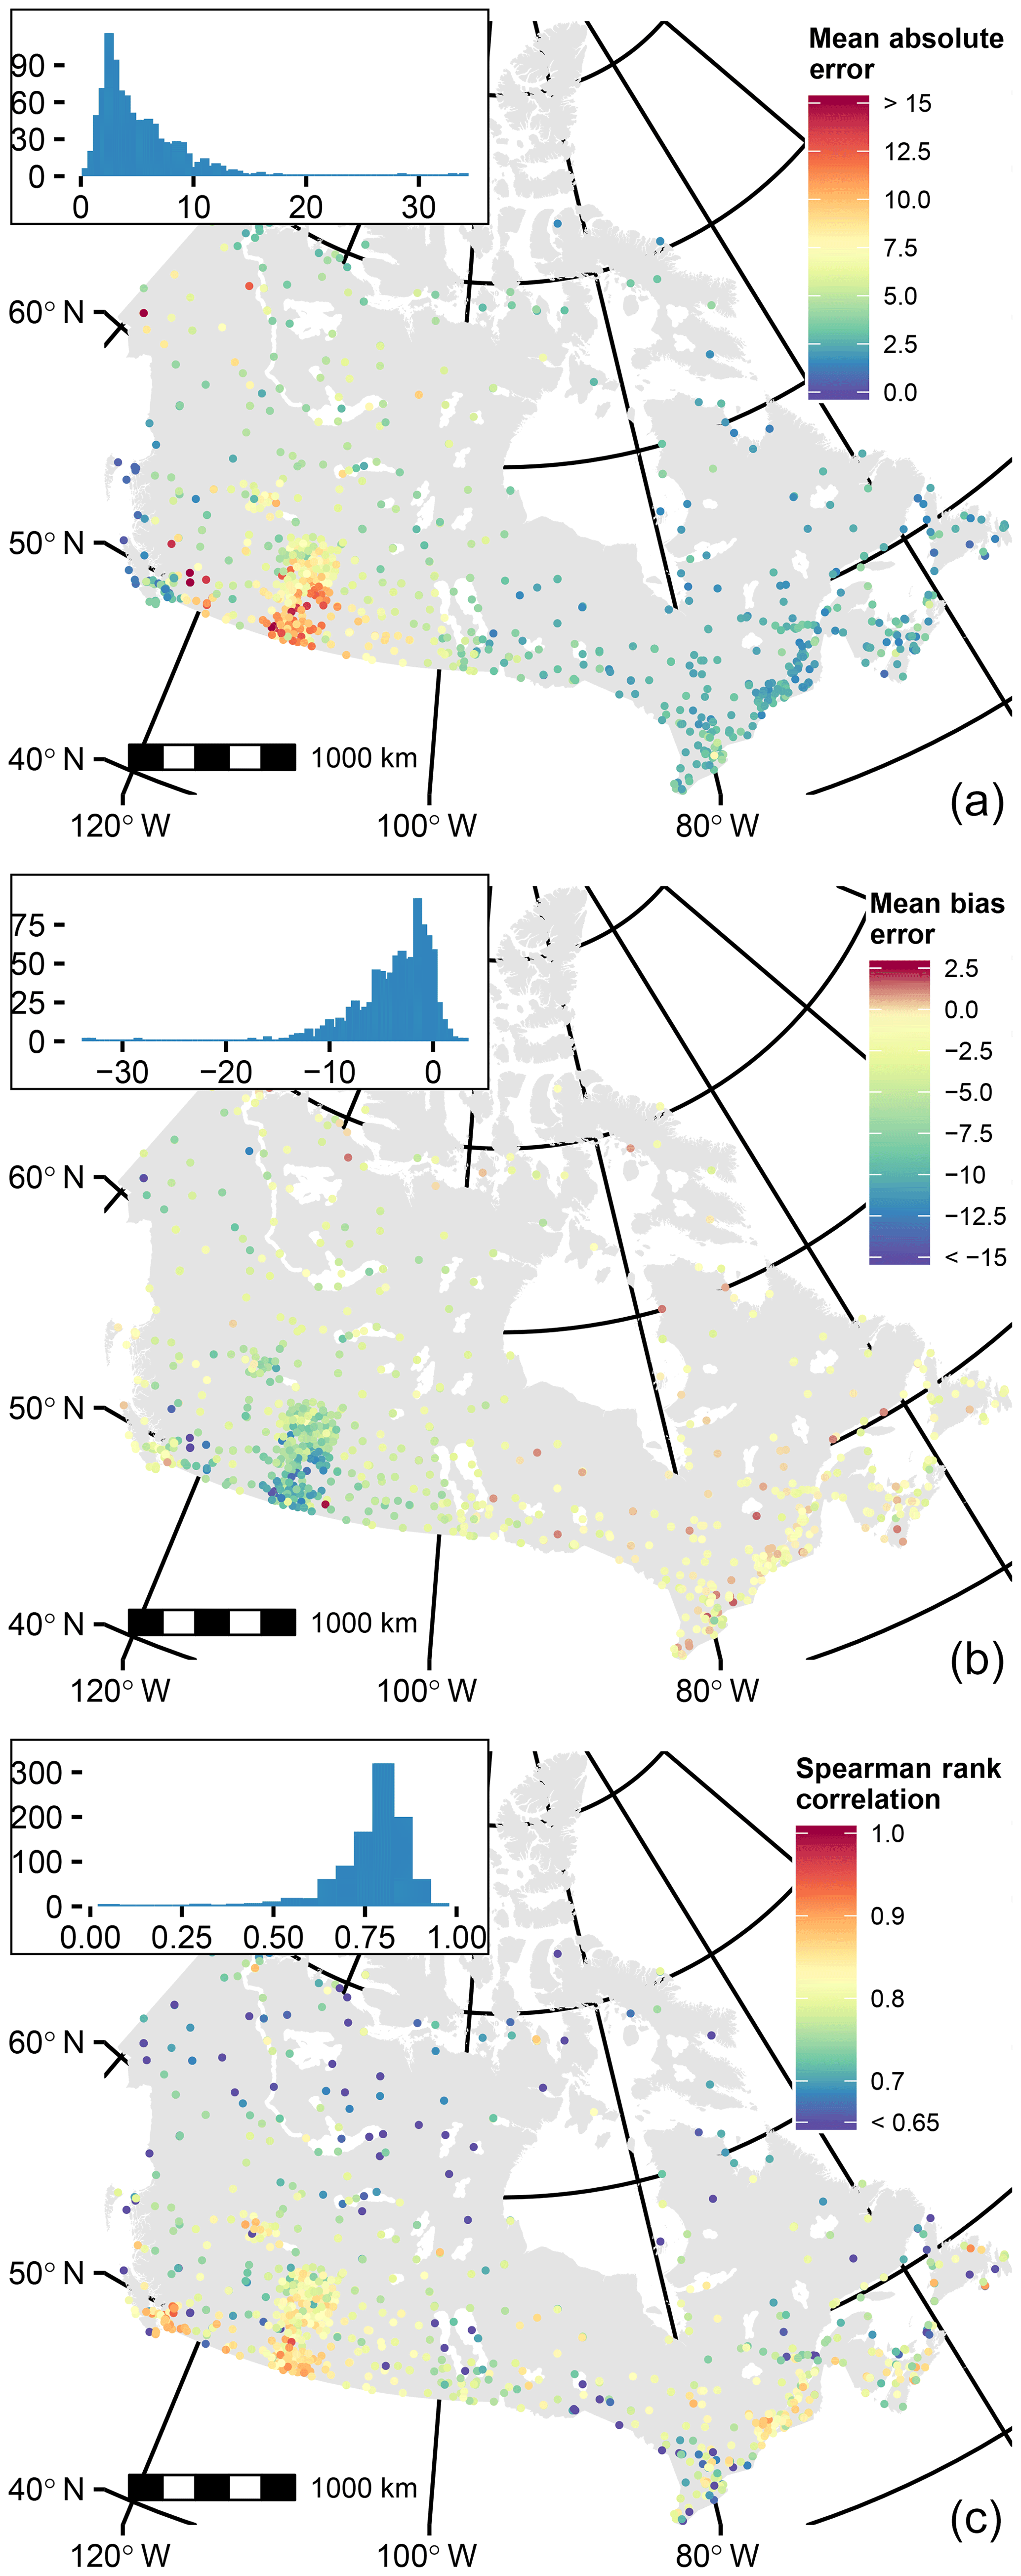
Figure 2Validation of FWI values calculated from the ERA5 reanalysis compared with observed FWI values calculated from ECCC station data for 1979–2009. Spatial distribution and histogram values are shown for the mean absolute error (a), mean bias error (b), and Spearman rank correlation (c). Map displayed in Atlas of Canada Lambert conformal projection (EPSG:3978).

Figure 3Differences in FWI calculation using the default DC start-up value versus the overwintered DC start-up value for North America in 2016. (a) Start-up day of year for FWI calculation based on longest period satisfying the meteorological fire season condition given by Wotton and Flannigan (1993). (b) The difference between overwintered DC and default DC start-up values (i.e. DC = 15) on the day of year given by (a). (c) The difference in FWI values corresponding to (b). (d) The corresponding difference in fire spread days (defined as FWI > 19 as per Podur and Wotton, 2011). Map displayed in Atlas of Canada Lambert conformal projection (EPSG:3978).
4.3 Effect of overwintering the Drought Code
As discussed earlier, overwintering the Drought Code can modify the FWI System indices, particularly in areas with low overwinter precipitation and during spring (i.e. after snowmelt but before fuel moisture can be recharged from precipitation events). To explore this possibility further, we show differences between FWI calculations where the process of overwintering the DC is performed and alternatively when the default DC start-up value (DC = 15) is used. We focus on the case of calculated DC and FWI values for 2016 over North America. Fuel moisture preceding the Fort McMurray wildfire (Alberta, Canada) in 2016 is widely considered to have been anomalously low due to low overwinter precipitation and severe fall drought conditions (Elmes et al., 2018). Figure 3 shows the day of year associated with fire season start-up (panel a), the difference in DC values (overwintered vs. default) on the corresponding start-up day of year (panel b), the corresponding difference in FWI values (panel c), and the difference in spread day events for 2016 between the overwintered and default calculations (panel d). These results show that even a modest difference in FWI values at start-up can lead to important differences in the number and spatial distribution of fire spread days between the overwintered and default calculations; in general, the greater number of fire spread days associated with the overwintered calculation may therefore account for sizeable differences in modelling area burned where DC, BUI, or FWI metrics are used as explanatory variables. Note that the results for other years (not shown) show a similar spatial pattern to the 2016 results.
We also found (not shown) that central and eastern Siberia displayed differences between the two calculations, most likely due to the low overwinter precipitation that occurs there (Stocks et al., 1996). In general, we found that regions where overwintering leads to drier fuel moisture conditions correspond to areas of low overwinter precipitation and were largely confined to western North America and parts of Eurasia. For regions where overwintering is likely to have an effect on spring fuel conditions, we therefore recommend using the version of the FWI calculation that overwinters the Drought Code.
The FWI System indices calculated using both procedures (i.e. default and overwintered start-up values of the DC) can be downloaded from Zenodo as annual NetCDF files of daily values from https://doi.org/10.5281/zenodo.3626193 (McElhinny et al., 2020). Note that this product is not intended to be updated annually.
The Global Fire Weather Indices dataset developed from the ECMWF ERA5 HRES reanalysis product is a publicly available global dataset that presents seven key variables representing fuel moisture (FFMC, DMC, DC) and potential fire behaviour (ISI, BUI, FWI, and DSR). The dataset covers a period of 1979 to 2018 and accounts for the procedures of using the default DC or alternatively the overwintered DC to calculate fire behaviour at fire season start-up. This dataset shows that there can be a significant difference in DC (and therefore also BUI, FWI, and DSR) values, particularly at the beginning of the fire season, depending on which procedure is employed, suggesting that fire danger in some regions may be more severe than what is predicted by the default DC.
The FWI calculated from the ECMWF data shows generally strong agreement with calculations based on Canadian weather station data (mean Spearman correlation of 0.77, mean absolute error of 5.0, and mean bias of −3.7). However, there are several caveats that are important to consider for users of the data. First, it is important to note that the assumptions made for the overwintering process include that (a) the carry-over fraction from the previous season's fall moisture is always 1 and (b) the coefficient for effectiveness of winter precipitation in recharging moisture reserves in the spring is always 0.75. In reality these coefficients would vary spatially and temporally to reflect variations in topography as well as weather and climate. Second, as reanalyses represent modelled data, there are biases associated with model and/or data uncertainty. For example ERA5 has been shown to exhibit a negative daytime wind speed bias in the Canadian Prairies (Betts et al., 2019). Lastly, although the resolution of the produced dataset is considered fine in relation to other reanalysis products (e.g. ERA-Interim), there may still be unresolved fine-scale variations in fire behaviour indices due to topographic or microclimatic variations. Regardless of these caveats, this dataset provides historical fire weather and potential fire behaviour data that users should find useful for several research applications including calibration of FWI-based fire prediction models, historical relationships between fire weather and fire danger at regional to global scales, baseline data for future fire danger projections under climate change scenarios, and analysis of regional or global trends in fire weather or behaviour.
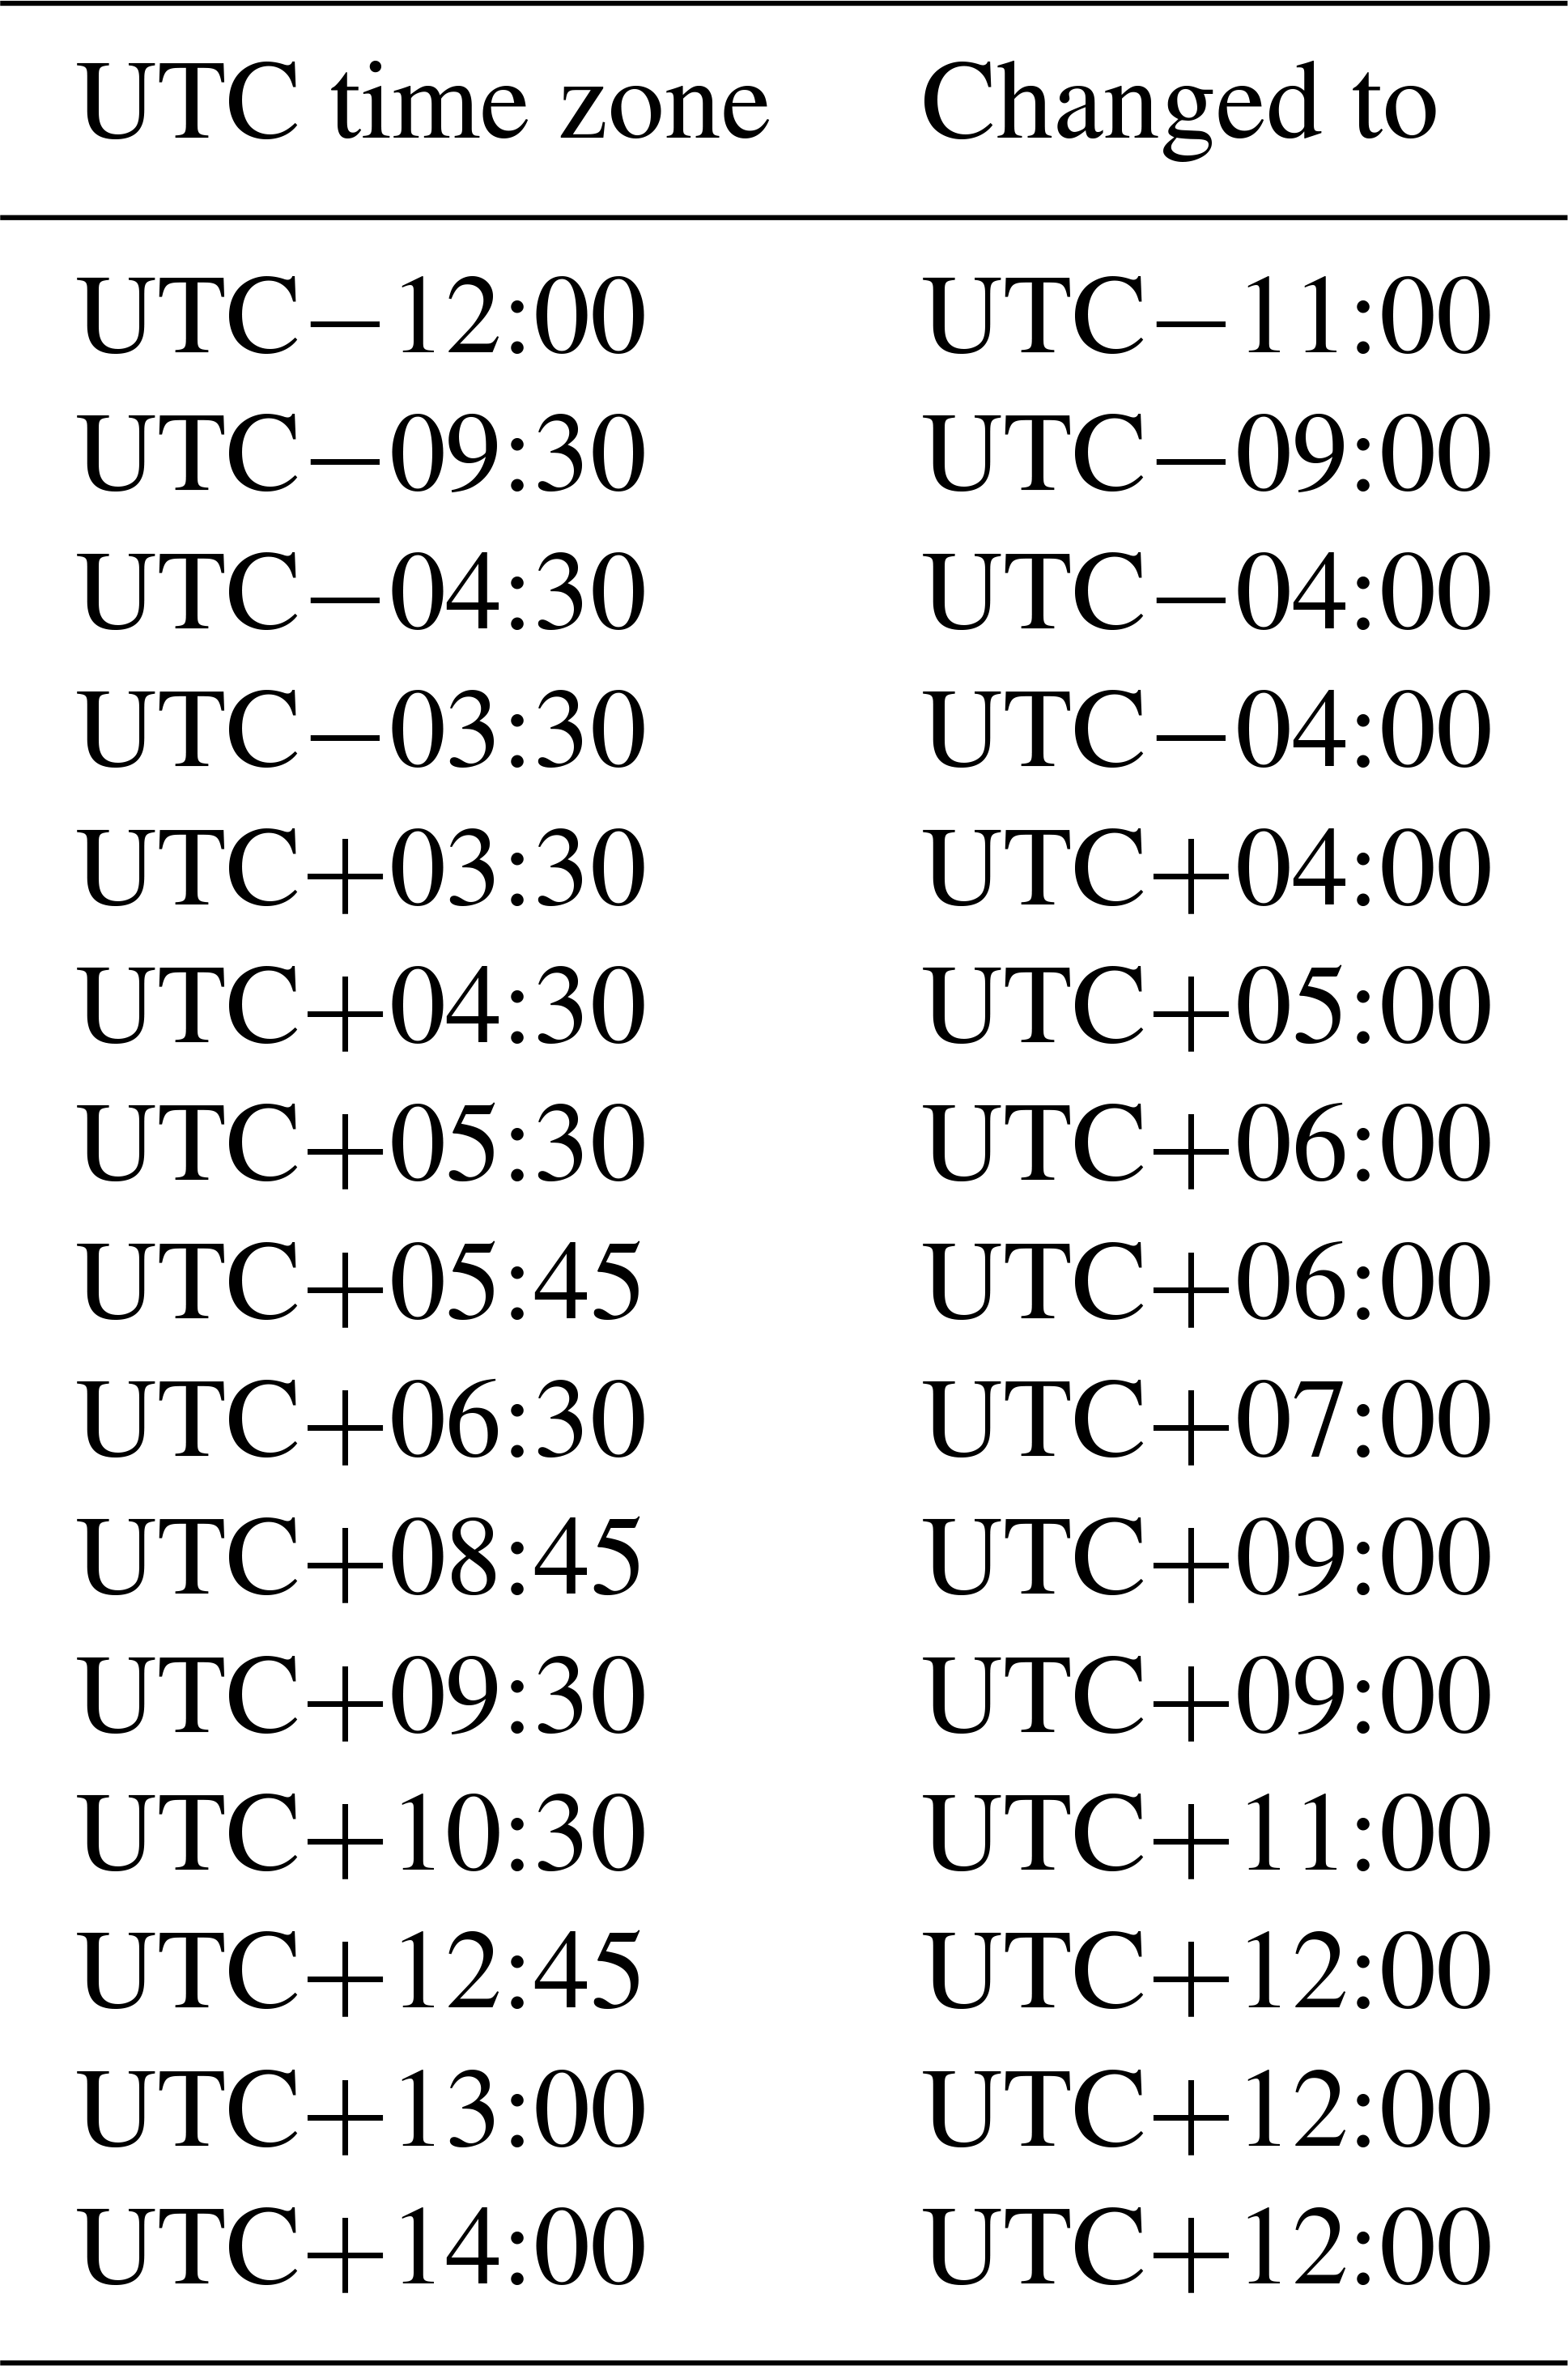
Table B1R packages and versions used for the FWI calculation presented in this paper.
MM, MF, and PJ devised the methodology. MM, JFB, and PJ wrote and optimized the R code for the FWI calculation. MM and JFB performed analysis and produced the final graphics. MM, JFB, CH, and PJ wrote the manuscript. All authors contributed to editing the manuscript.
The authors declare that they have no conflict of interest.
This paper was edited by Jens Klump and reviewed by two anonymous referees.
Alexander, M.: Calculating spring Drought Code starting values in the Prairie Provinces and Northwest Territories, Canadian Forestry Service, Forest Management Note 12, Edmonton, AB, Canada, 1982.
Anderson, K. R. and Otway, S.: Validating the overwintering effect the Drought Code in Elk Island National Park. Canadian Forestry Service, Am. Meteorol. Soc., Paper J11.4, Boston, Massachusetts, USA, 2003.
Beck, H. E., Pan, M., Roy, T., Weedon, G. P., Pappenberger, F., van Dijk, A. I. J. M., Huffman, G. J., Adler, R. F., and Wood, E. F.: Daily evaluation of 26 precipitation datasets using Stage-IV gauge-radar data for the CONUS, Hydrol. Earth Syst. Sci., 23, 207–224, https://doi.org/10.5194/hess-23-207-2019, 2019.
Bedia, J., Herrera, S., and Gutiérrez, J. M.: Assessing the predictability of fire occurrence and area burned across phytoclimatic regions in Spain, Nat. Hazards Earth Syst. Sci., 14, 53–66, https://doi.org/10.5194/nhess-14-53-2014, 2014.
Bedia, J., Herrera, S., Gutiérrez, J. M., Zavala, G., Urbieta, I. R., and Moreno, J. M.: Sensitivity of fire weather index to different reanalysis products in the Iberian Peninsula, Nat. Hazards Earth Syst. Sci., 12, 699–708, https://doi.org/10.5194/nhess-12-699-2012, 2012.
Bedia, J., Herrera, S., Martin, D. S., Koutsias, N., and Gutierrez, J. M.: Robust projections of Fire Weather Index in the Mediterranean using statistical downscaling. Clim. Change., 120, 229–247, https://doi.org/10.1007/s10584-013-0787-3, 2013.
Bengtsson, L., Arkin, P., Berrisford, P., Bougeault, P., Folland, C. K., Gordon, C., Haines, K., Hodges, K. I., Jones, P., Kallberg, P., Rayner, N., Simmons, A. J., Stammer, D., Thorne, P. W., Uppala, S., and Vose, R. S.: The need for dynamical climate reanalysis, B. Am. Meteorol. Soc., 88, 495–501, https://doi.org/10.1175/BAMS-88-4-495, 2007.
Betts, A. K., Chan, D. Z., and Desjardins, R. L.: Near-surface biases in ERA5 over the Canadian Prairies, Front. Environ. Sci., 7, 129, https://doi.org/10.3389/fenvs.2019.00129, 2019.
Bourgeau-Chavez, L. L., Garwood, G., Riordan, K., Cella, B., Kwart, M., and Murphy, K.: Improving the prediction of wildfire potential in boreal Alaska with satellite imaging radar, Polar Record, 43, 321–330, 2007.
Copernicus Climate Change Service (C3S): ERA5: Fifth generation of ECMWF atmospheric reanalyses of the global climate, Copernicus Climate Change Service Climate Data Store (CDS), available at: https://cds.climate.copernicus.eu/cdsapp#!/home (last access: 17 May 2019), 2017.
Elmes, M. C., Thompson, D. K., Sherwood, J. H., and Price, J. S.: Hydrometeorological conditions preceding wildfire, and the subsequent burning of a fen watershed in Fort McMurray, Alberta, Canada, Nat. Hazards Earth Syst. Sci., 18, 157–170, https://doi.org/10.5194/nhess-18-157-2018, 2018.
Field, R. D., Spessa, A. C., Aziz, N. A., Camia, A., Cantin, A., Carr, R., de Groot, W. J., Dowdy, A. J., Flannigan, M. D., Manomaiphiboon, K., Pappenberger, F., Tanpipat, V., and Wang, X.: Development of a Global Fire Weather Database, Nat. Hazards Earth Syst. Sci., 15, 1407–1423, https://doi.org/10.5194/nhess-15-1407-2015, 2015.
Girardin, M. P., Bergeron, Y., Tardif, J. C., Gauthier, S., Flannigan, M. D., and Mudelsee, M.: A 229-year dendroclimatic-inferred record of forest fire activity for the boreal shield of Canada, Int. J. Wildland Fire, 15, 375–388, 2006.
Graham, R. M., Hudson, S. R., and Maturilli, M.: Improved performance of ERA5 in Arctic Gateway relative to four global atmospheric reanalyses, Geophys. Res. Lett., 46, 6138–6147, https://doi.org/10.1029/2019GL082781, 2019.
Hennerman, K. and Berrisford, P.: ERA5 data documentation, available at: https://confluence.ecmwf.int/display/CKB/ERA5+data+documentation, last access: 12 August 2019.
Hennerman, K. and Guillory, A.: What are the changes from ERA-Interim to ERA5, available at: https://confluence.ecmwf.int/pages/viewpage.action?pageId=74764925, last access: 12 August 2019.
Herrera, S., Bedia, J., Gutierrez, J. M., Fernandez, J., and Moreno, J. M.: On the projection of future fire danger conditions with various instantaneous/mean-daily data sources, Clim. Change., 118, 827–840, https://doi.org/10.1007/s10584-012-0667-2, 2013.
Jain, P., Wang, X. L., and Flannigan, M. D.: Trend analysis of fire season length and extreme fire weather in North America between 1979 and 2015, Int. J. Wildland Fire, 26, 1009–1020, https://doi.org/10.1071/WF17008, 2017.
Lawson, B. D. and Armitage, O. B.: Weather guide for the Canadian Forest Fire Danger Rating System, Natural Resources Canada, Canadian Forest Service, Northern Forestry Centre, Edmonton, AB, Canada, 2008.
Lawson, B. D. and Dalrymple, G. N.: Ground-truthing the Drought Code: Field verification of overwinter recharge of forest floor moisture, Natural Resources Canada, Canadian Forest Service, Pacific Forestry Centre, FRDA Report 268, Victoria, British Columbia, Canada, 1996.
Li, W., MacBean, N., Ciais, P., Defourny, P., Lamarche, C., Bontemps, S., Houghton, R. A., and Peng, S.: Gross and net land cover changes in the main plant functional types derived from the annual ESA CCI land cover maps (1992–2015), Version 2.0.7, available at: http://maps.elie.ucl.ac.be/CCI/viewer/download.php (last access: 26 August 2019), 2018.
Lu, W., Charney, J. J., Zhong, S., Bian, X., and Liu, S.: A North American regional reanalysis climatology of the Haines Index, Int. J. Wildland Fire, 20, 91–103, https://doi.org/10.1071/WF0896, 2011.
McElhinny, M., Jain, P., Beckers, J. F., Hanes, C., and Flannigan, M.: Global Fire Weather Indices – with default and overwintered DCstartup, Zenodo, https://doi.org/10.5281/zenodo.3626193, 2020.
Natural Resources Canada: Canadian Forest Service, Wildland Fire Information Systems, Canadian Forest Fire Weather Index System data from the Canadian Wildland Fire Information System , using weather observations from Canadian and American federal government sources, Version 3.0, Northern Forestry Centre, Edmonton, AB, Canada, available at: http://cwfis.cfs.nrcan.gc.ca/downloads/fwi_obs/, last access: 1 January 2016.
Podur, J. and Wotton, B. M.: Defining fire spread event days for fire-growth modelling, Int. J. Wildl. Fire, 20, 497–507, 2011.
Rothfusz, L. P.: The heat index equation. National Weather Service, Technical Attachment SR 90-23, Fort Worth, TX, USA, 1990.
Srock, A. F., Charney, J. J., Potter, B. E., and Goodrick, S. L.: The Hot-Dry-Windy Index: A new fire weather index, Atmosphere, 9, 279, https://doi.org/10.3390/atmos9070279, 2018.
Stocks, B. J., Cahoon, D. R., Levine, J. S., Cofer, W. R., and Lynham, T. J.: Major 1992 forest fires in central and eastern Siberia: satellite and fire danger measurements, in: Fire in Ecosystems of Boreal Eurasia, Springer, Dordrecht, 139–150, 1996.
Tarek, M., Brissette, F. P., and Arsenault, R.: Evaluation of the ERA5 reanalysis as a potential reference dataset for hydrological modelling over North America, Hydrol. Earth Syst. Sci., 24, 2527–2544, https://doi.org/10.5194/hess-24-2527-2020, 2020.
Van Wagner, C. E.: Development and structure of the Canadian Forest Fire Weather Index System. Canadian Forestry Service, Forestry Technical Report 35, Ottawa, ON, Canada, 1987.
Venäläinen, A., Korhonen, N., Hyvärinen, O., Koutsias, N., Xystrakis, F., Urbieta, I. R., and Moreno, J. M.: Temporal variations and change in forest fire danger in Europe for 1960–2012, Nat. Hazards Earth Syst. Sci., 14, 1477–1490, https://doi.org/10.5194/nhess-14-1477-2014, 2014.
Vitolo, C., Giuseppe, F. D., Krzeminski, B., and San-Miguel-Ayanz, J.: A 1980–2018 global fire danger reanalysis datasetfor the Canadian Fire Weather Indices, Sci. Data, 6, 190032, https://doi.org/10.1038/sdata.2019.32, 2019.
Wang, X., Wotton, B. M., Cantin, A., Parisien, M. A., Anderson, K., Moore, B., and Flannigan, M. D.: Cffdrs: an R package for the Canadian Forest Fire Danger Rating System, Ecol. Process., 6, 5, https://doi.org/10.1186/S13717-017-0070-Z, 2017.
Wilmore, B.: Duff moisture dynamics in black spruce feather moss stands and their relation to the Canadian Forest Fire Danger Rating System, MS thesis, University of Alaska Fairbanks, 2001.
Wotton, B. M.: Interpreting and using outputs from the Canadian Forest Fire Danger Rating System in research applications, Environ. Ecol. Stat., 16, 107–131, https://doi.org/10.1007/s10651-007-0084-2, 2009.
Wotton, B. M. and Flannigan, M. D.: Length of the fire season in changing climate, For. Chron., 69, 187–192, https://doi.org/10.5558/TFC69187-2, 1993.
Xu, X., Frey, S. K., Boluwade, A., Erler, A. R., Khader, O., Lapen, D. R., and Sudicky, E.: Evaluation of variability among different precipitation products in the Northern Great Plains, J. Hydrol.-Reg. Stud., 24, 100608–100626, https://doi.org/10.1016/j.ejrh.2019.100608, 2019.