the Creative Commons Attribution 4.0 License.
the Creative Commons Attribution 4.0 License.
 | 06 Aug 2020
Generalized models to estimate carbon and nitrogen stocks of organic soil horizons in Interior Alaska
Kristen Manies
Mark Waldrop
Jennifer Harden
Boreal ecosystems comprise one-tenth of the world's land surface and contain over 20 % of the global soil carbon (C) stocks. Boreal soil is unique in that its mineral soil is covered by what can be quite thick layers of organic soil. These organic soil layers, or horizons, can differ in their state of decomposition, source vegetation, and disturbance history. These differences result in varying soil properties (bulk density, C concentration, and nitrogen concentration) among soil horizons. Here we summarize these soil properties, as represented by over 3000 samples from Interior Alaska, and examine how soil drainage and stand age affect these attributes. The summary values presented here can be used to gap-fill large datasets when important soil properties were not measured, provide data to initialize process-based models, and validate model results. These data are available at https://doi.org/10.5066/P960N1F9 (Manies, 2019).
- Article
(8639 KB) - Full-text XML
-
Supplement
(410 KB) - BibTeX
- EndNote


Boreal soils play an important role in the global carbon (C) budget and are estimated to store between 375–690 Pg C (Hugelius et al., 2014; Bradshaw and Warkentin, 2015; Khvorostyanov et al., 2008), which is over 20 % of the global soil C stock (Jackson et al., 2017). A large portion of this C can be found within the organic soil layer (Jorgenson et al., 2013). Although plant inputs into the soil can be relatively high during the summer, C losses from the soil are low, as cool and/or freezing soil temperatures result in low rates of decomposition. The imbalance between C inputs and losses results in organic soils that can be quite thick and store large amounts of C (Jorgenson et al., 2013). There is also considerable C found in the mineral soil of these systems, especially where protected by permafrost (O'Donnell et al., 2011). Thus, both organic and mineral soil play an important role in determining the amount of C stored in boreal ecosystems.
Nitrogen (N) also plays an important role in boreal ecosystems due to N limitations on plant growth (Herndon et al., 2020). N inputs to boreal ecosystems often begin with N fixation from cyanobacteria, usually associated with mosses, or symbiotic actinomycetes, mainly the genus Frankia. Net N mineralization increases over the course of upland succession, until late in this process when black spruce (Picea mariana) forests become established, at which time rates drop sharply (Kielland et al., 2006). Boreal ecosystems can have N restricted by certain species, such as Sphagnum spp., through competitive interactions and slow rates of turnover (Malmer et al., 2003). In addition, N cycling can become limited due to environmental factors such as permafrost or anaerobic conditions (Limpens et al., 2006; Bonan, 1990). Once released, N availability impacts decomposition and plant growth and, therefore, can also influence rates of C accumulation and loss.
Boreal organic soils are unique when compared to soils from other regions. These organic soils can be thick, ranging from several centimeters to several meters (Ping et al., 2006). They are also comprised of layers, or horizons, which as they deepen and increase in age also increase in their degree of decomposition. These organic soil horizons are also influenced by the vegetation from which they formed (Deluca and Boisvenue, 2012). Vegetative history is usually determined by post-disturbance plant succession. Age and vegetative history affect not only the soil density but also C and N concentrations, resulting in large differences in C and N storage among horizons.
The main disturbances that affect boreal soil properties are fire and permafrost thaw. Fires affect boreal soils through the combustion of litter and surface organic layers (as ground fuel; Harden et al., 2000), with the amount and depth of combustion regulated by fire severity (Turetsky et al., 2011). Fire directly affects surface organic soils, both in elemental composition and structure (Neff et al., 2005). In addition, there are indirect effects of fire on soil properties. The loss of insulating organic soil results in a darkened soil surface, which in turn warms post-fire soils, increasing decomposition rates from the surface downward (Genet et al., 2013; O'Neill et al., 2002). In addition, both fire return interval and fire severity influence post-fire vegetation and the re-accumulation of organic soil layers. As different tree and understory species have different amounts of C and N in their tissues (Van Cleve et al., 1983), changes in post-fire vegetation affect soil C and N accumulation rates and thus the concentration of these elements in surface soil. Permafrost thaw also affects soil properties in several ways. By definition, thaw exposes older, previously sequestered C to warmer soil temperatures (Osterkamp et al., 2009), increasing rates of decomposition (Mu et al., 2016; Schadel et al., 2016). In well-drained sites, post-thaw conditions usually result in water draining from the soil, resulting in oxic conditions (Estop-Aragonés et al., 2018). In lowlands, permafrost thaw often results in subsidence and inundation, changing the ecosystem from a forested permafrost plateau to a thermokarst wetland (Schuur et al., 2015). Fire can often be a trigger for this rapid permafrost thaw (Myers-Smith et al., 2008). Post-thaw vegetation changes affect both C and N inputs, again affecting the concentration of these elements within surface organic soil layers. As both fire frequency and permafrost thaw are expected to increase in the future (Hinzman et al., 2005), biogeochemical models have a need to characterize how these disturbances will impact C and N stocks. To accurately represent future scenarios, models need to include the distinct properties of organic soil horizons found in the boreal region (Flato et al., 2013).
Despite the need to accurately portray the state and dynamic nature of boreal organic soil properties, these soils have not been widely characterized or compiled into a common framework. Instead, much of the work regarding boreal soils has focused on predicting C and N stocks for combined organic and mineral soil horizons to a predetermined depth (Johnson et al., 2011; Bauer et al., 2006). Ping (2010) examined organic soils for Alaska, but only focused on black spruce (Picea mariana) forests. In addition, Michaelson et al. (2013) compiled a great deal of Alaskan-based soil data, although they present these data for the organic soil layer as a whole. Therefore, there is currently no source of summarized data of soil properties by organic soil horizon. To fill this gap, we summarized soil properties from a database of over 3000 observations from Interior Alaska (Fig. 1). Soil properties were categorized by degree of decomposition (via classification into distinct organic soil horizons), soil drainage, and stand age. This dataset can be used in many ways including field comparisons, models construction, and model validation.
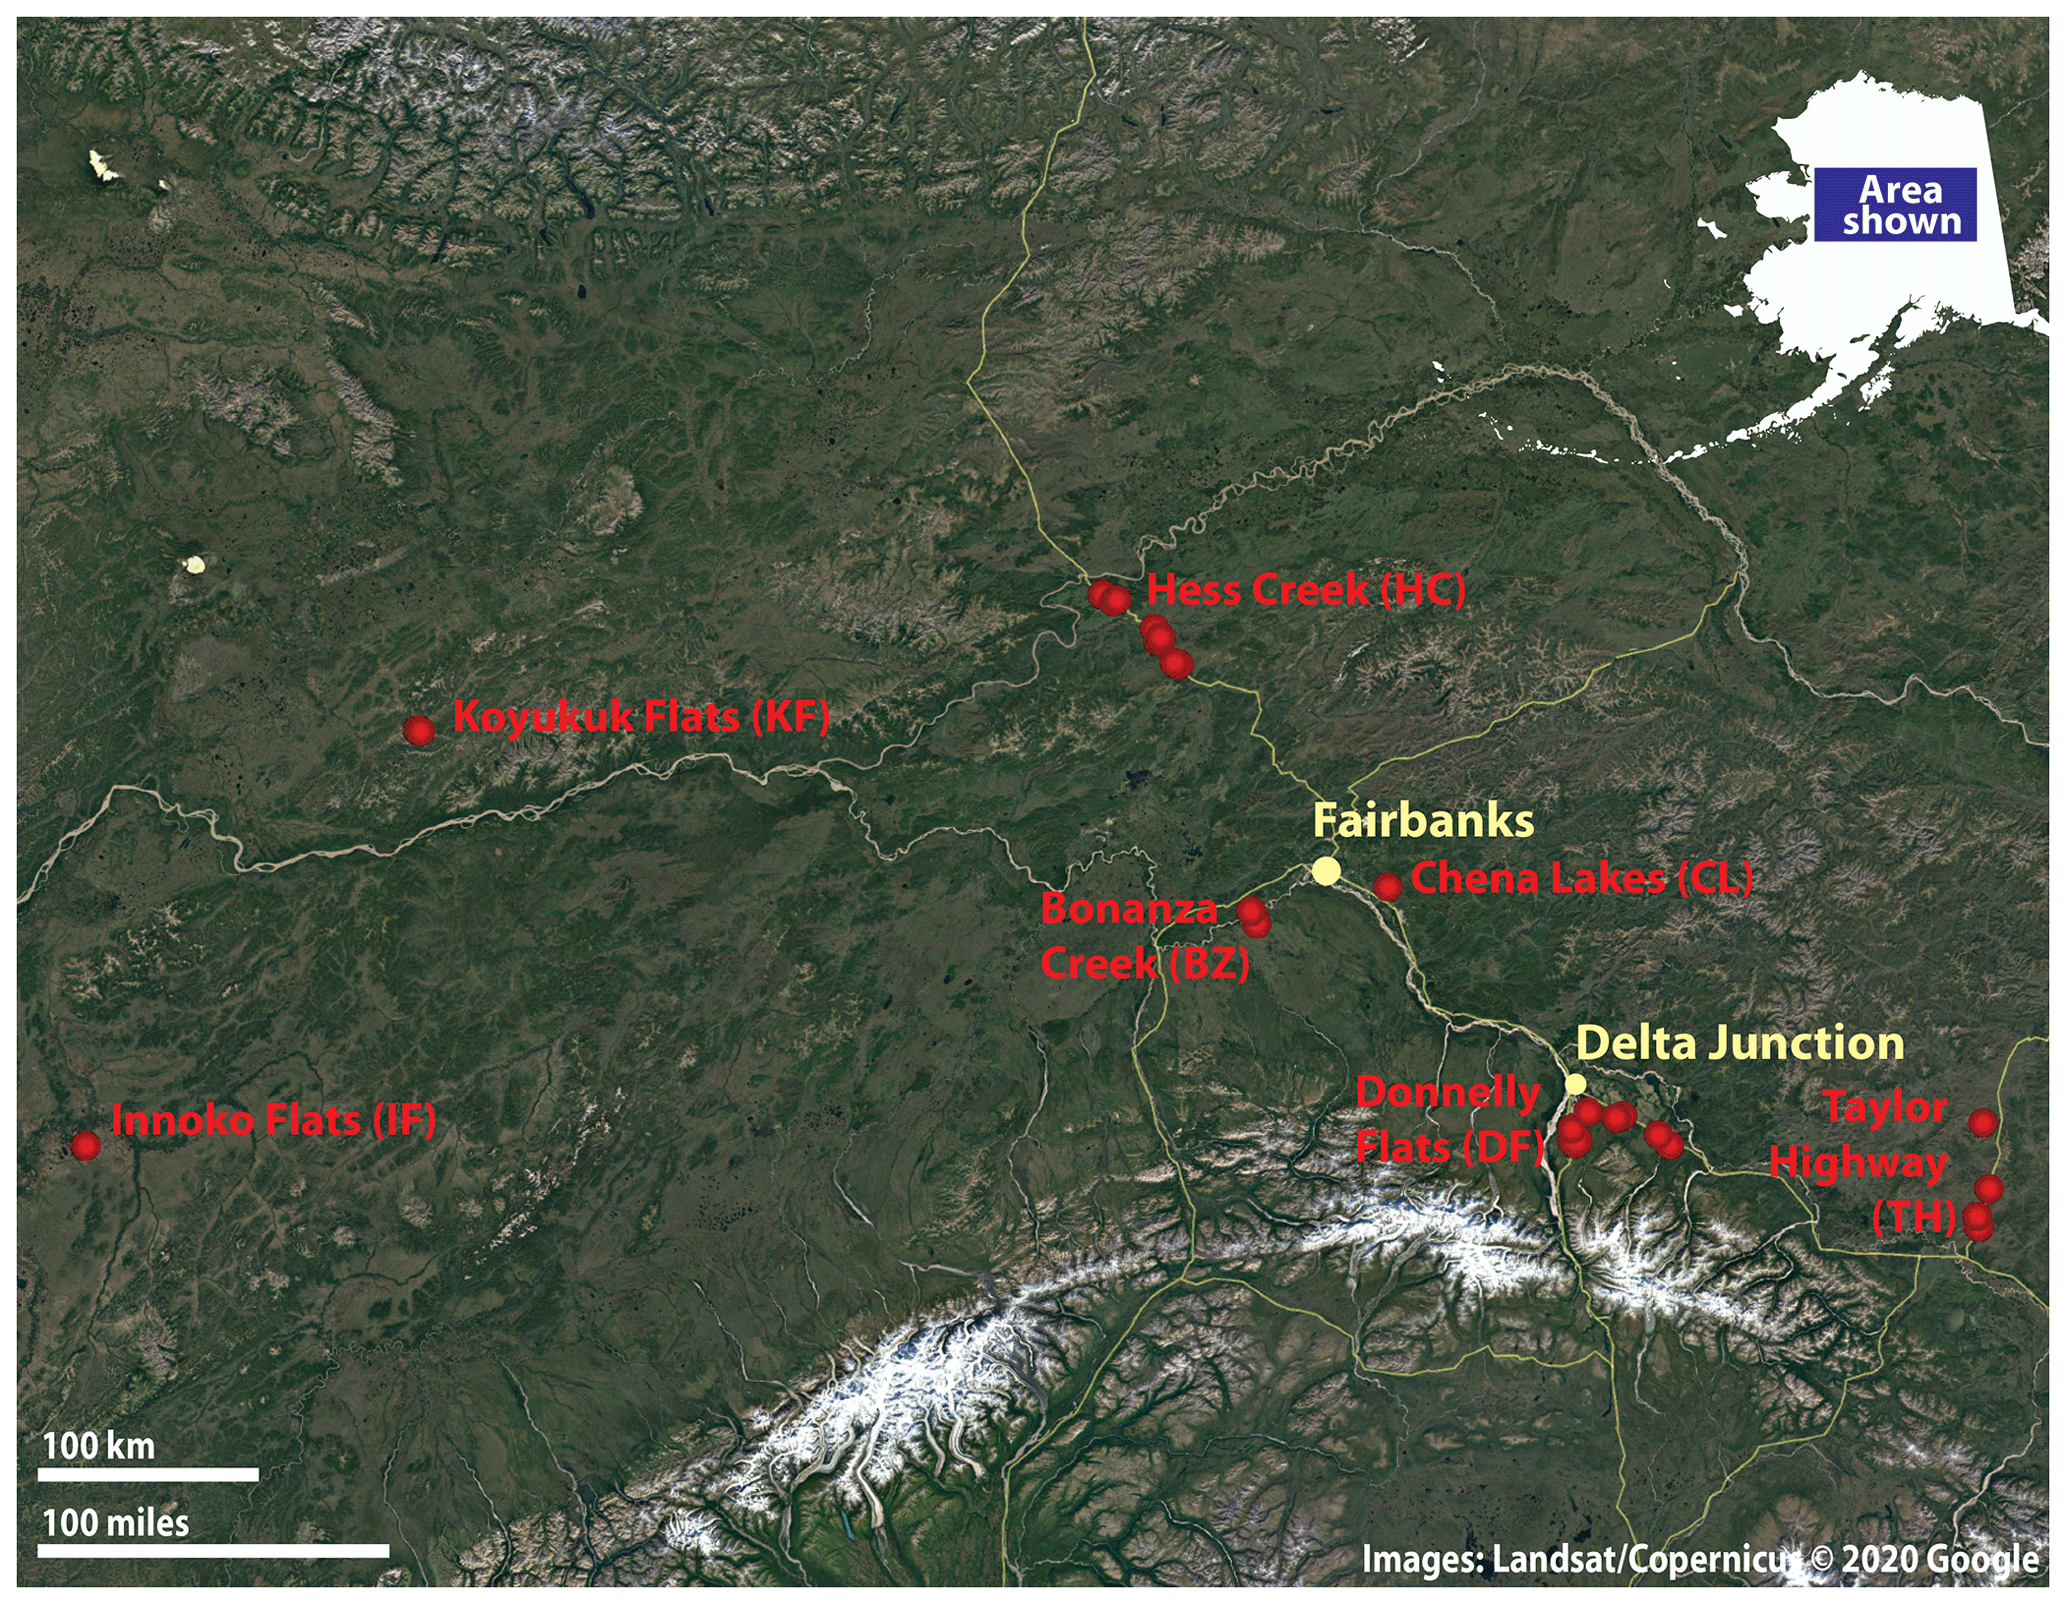
Figure 1Location of the sites used in this study, all located within Interior Alaska. Regions, as ascribed in the dataset, are noted in red. Cities are written in yellow (map data: Google, 2020).
2.1 Field site classifications
Soil cores were sampled at 58 different sites located within several areas of Interior Alaska (Fig. 1). Several different ecosystem types were sampled, including black spruce forests (∼ 50 %), wetlands (∼ 26 %), and deciduous and mixed forests (∼ 16 %). Between 1 and 14 soil profiles were sampled at each site, for a total of 292 soil profiles. Sampling took place over a 15-year period from 2000 to 2015. We examined the effect of fire or permafrost thaw disturbance on soil properties by categorizing each of the soil profiles in relation to time since the last disturbance, which we divided into three age classes: new (<5 years old), young (5–50 years old), and mature (>50 years old). All new sites were recently burned and thus had lost some portion of their surface organic horizons (Harden et al., 2000), while young sites experienced either fire or permafrost thaw.
In addition, sites were classified according to their soil drainage. Although classifications of soil drainage have been established for many soil types (Soil Survey Division Staff, 1993), the presence of permafrost, and its effect on drainage and soil moisture, necessitates modifications of this system (Expert Committee on Soil Survey, 1982). Although generally described (Harden et al., 2003; Johnstone et al., 2008), a soil drainage classification for permafrost landscapes is lacking. Here we present a soil drainage classification decision tree, developed over the past 2 decades, for areas of discontinuous permafrost (Fig. 2). Well-drained sites are similar to traditional drainage classifications, in that water moves through the soil rapidly. However, moderately well-drained drainage sites have permafrost between 75 and 150 cm, which increases soil moisture of surface organics. Somewhat poorly, poorly, and very poorly drained sites have some factor (permafrost, soil texture, or landscape position) that inhibits drainage and causes redoximorphic features such as blue-grey colors in the mineral soil to appear. Somewhat poorly drained sites have a shallow active layer (often around 50 cm), which affects soil moisture and surface vegetation. Poorly drained sites experience saturated surface conditions only while seasonal ice is present (usually May through early July), while very poorly drained sites have saturated surface soils during the entire growing season.
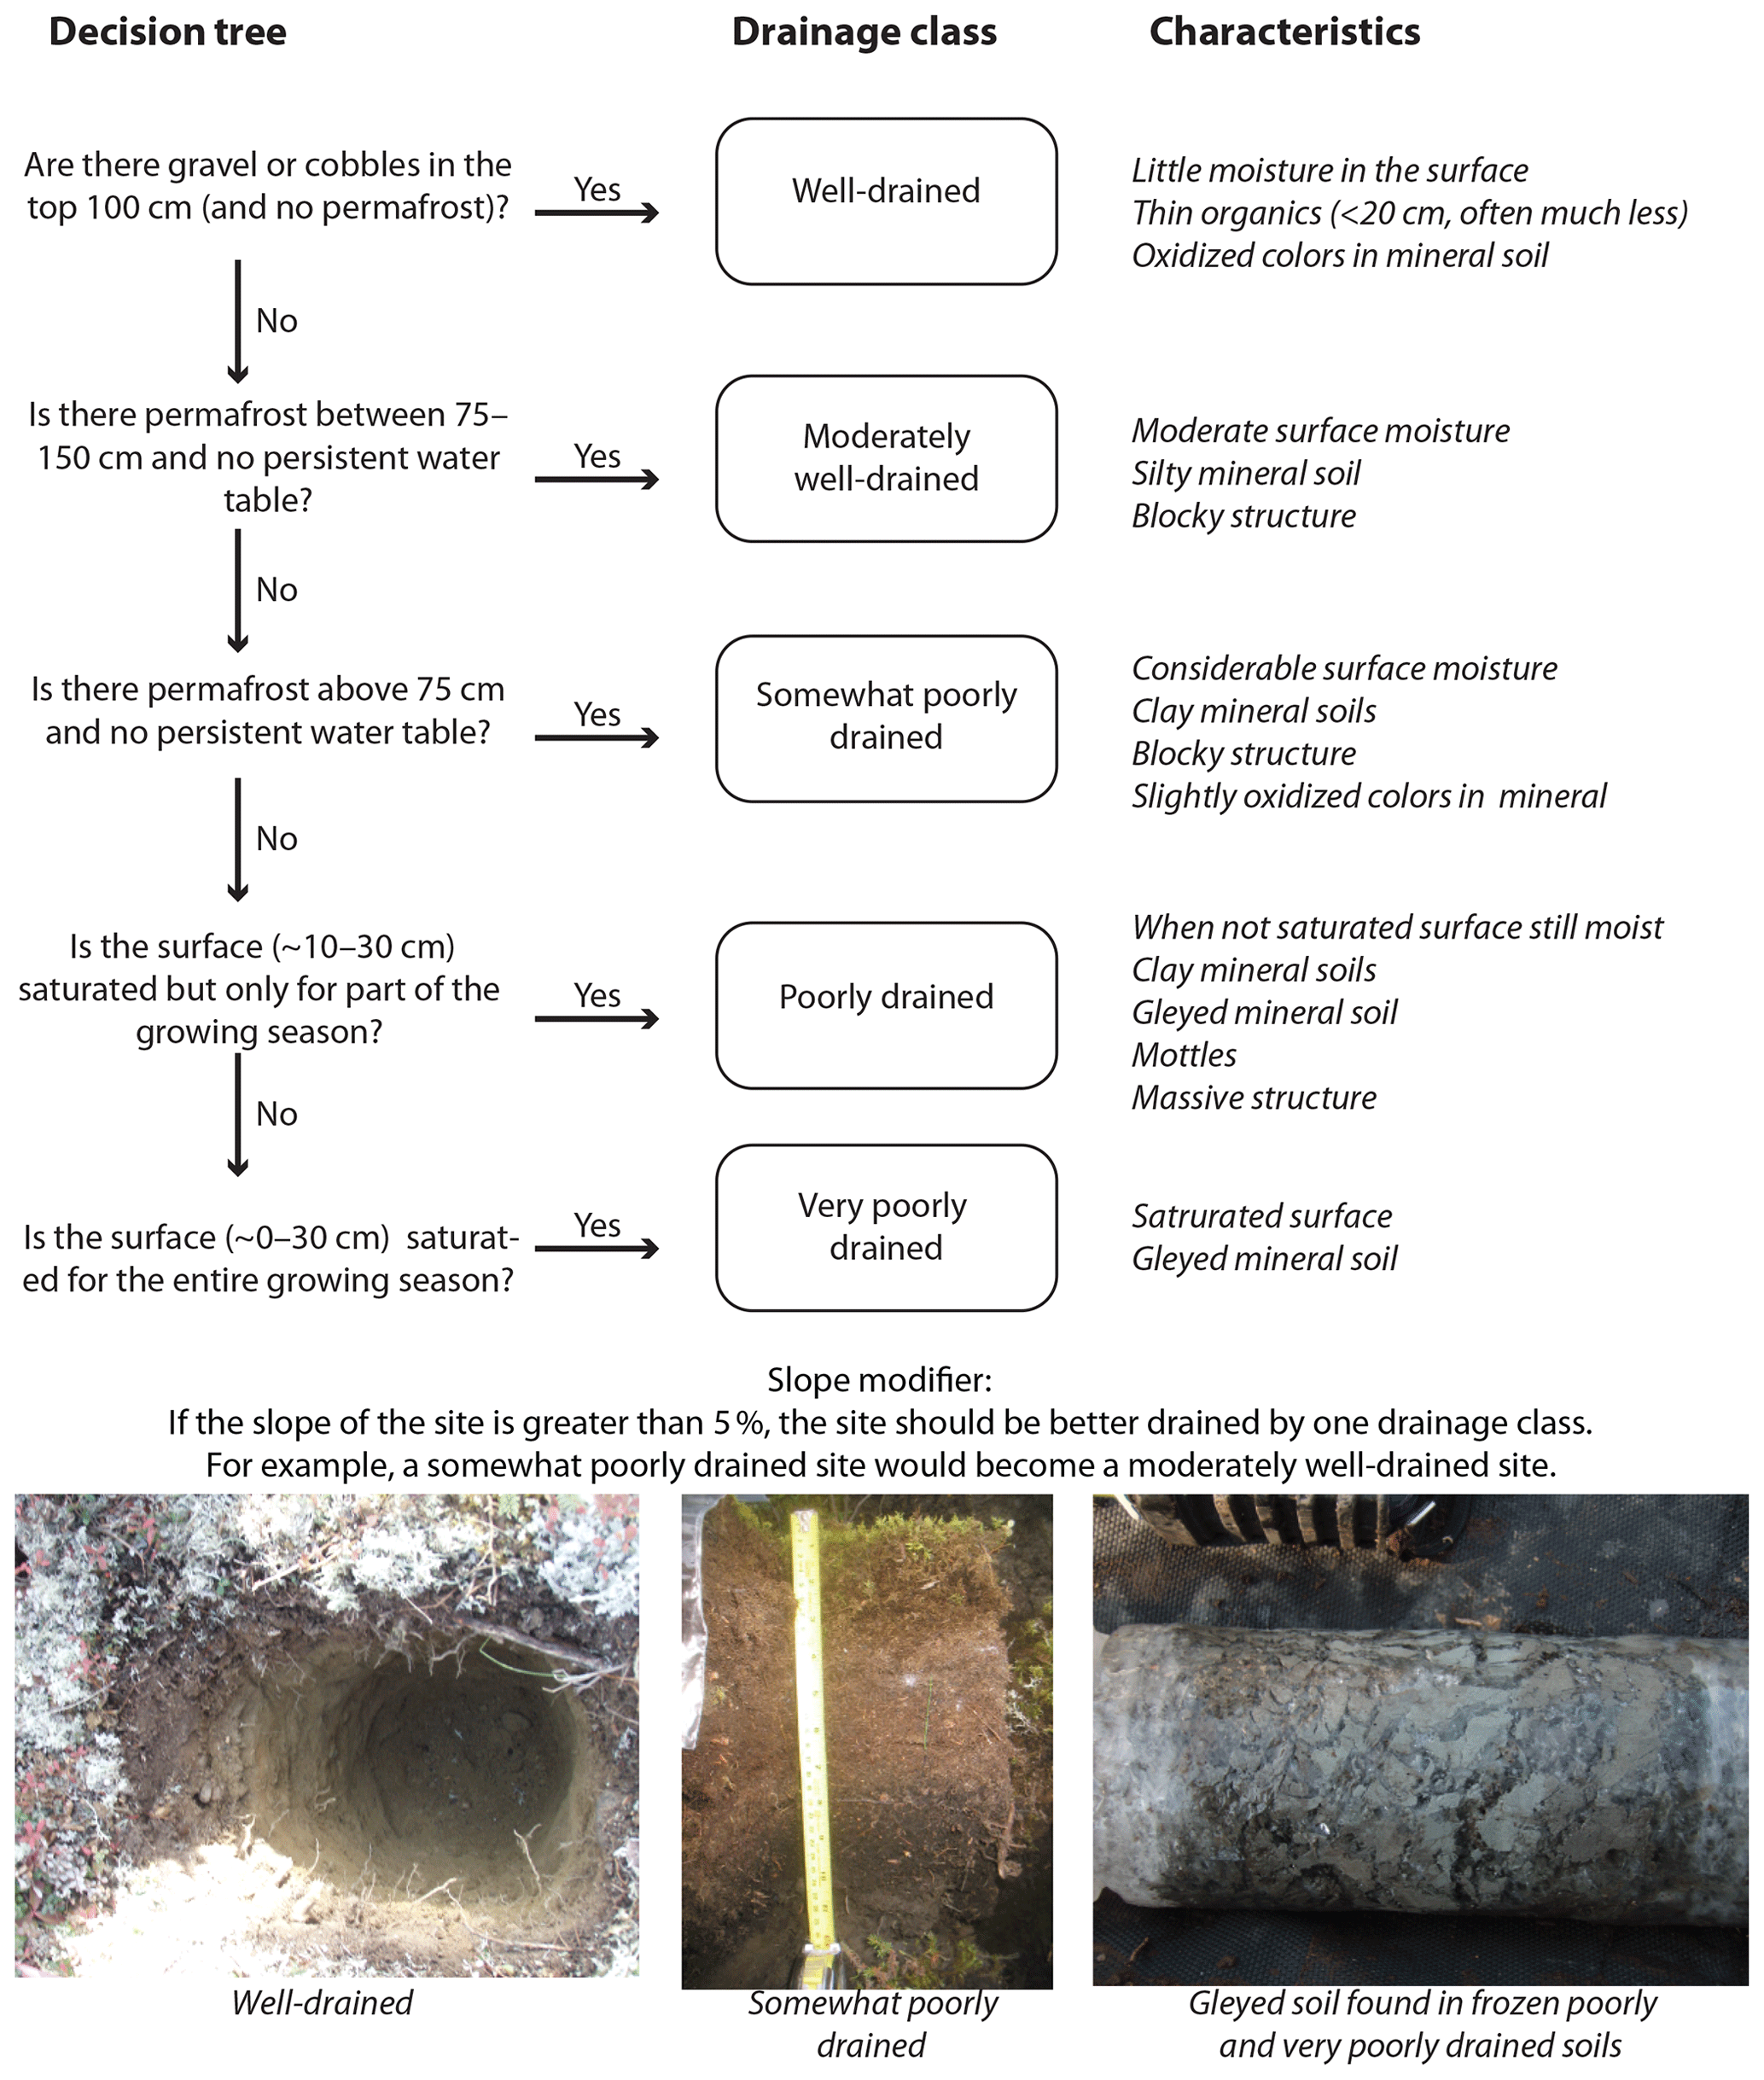
Figure 2Soil drainage class decision tree. Beginning in the top left, if the soil meets the criteria, one has found the designated drainage class, having the characteristics located on the right. If the soil of interest does not meet the criteria, one moves down to the next drainage class to determine if its criteria is met. Drainage classes are also modified by slopes of greater than 5 % by moving up one drainage class.
Modification of the drainage class occurs when sites are on a slope. When sites are located on a slope of greater than 5 %, drainage increases (Woo, 1986; Carey and Woo, 1999), and therefore drainage class designation (Fig. 2) is increased by one step. This is called the hillslope modifier. In addition, because burning increases active layer thickness (Gibson et al., 2018), recently burned sites may have deeper permafrost or no permafrost at all. Because the effects of these drier soil properties may not have yet propagated through factors such as thickness of the deeper organic layers, for many analyses, including this paper, it makes more sense to ascribe their soil drainage using nearby unburned sites.
2.2 Soil sampling methodology
Soil cores were obtained using several different methods. The first method, most often used with surface horizons, involved cutting soil blocks to a known volume. Another method often used involves a coring device inserted into a hand drill (4.8 cm diameter; Nalder and Wein, 1998). Wetter sites were sometimes sampled while frozen using a Snow, Ice, and Permafrost Research Establishment (SIPRE) corer (7.6 cm diameter; Rand and Mellor, 1985). Alternatively, if wetter sites were sampled unfrozen we used a “frozen finger”. This coring method uses a thin-walled, hollow tube (∼ 6.5 cm diameter), sealed at one end, which is inserted into the ground until it hits mineral soil. A slurry of dry ice and alcohol is then poured into the corer, freezing the unfrozen material surrounding the corer to the outside. The corer is removed and the exterior of the core is scraped to remove any large roots or material that stuck to the sample during removal. Another method occasionally used in unfrozen saturated soils involves the insertion and careful removal of PVC tubing sharpened on one end. Finally, a variety of commercial or homemade soil corers were used to obtain volumetric samples for ∼ 6 % of these data, usually for mineral soil samples. For some soil profiles, two coring methods were combined to create continuous samples from the surface to the mineral soil. While most cores were sampled into the mineral soil, some cores ended at or before the organic–mineral interface due to the presence of permafrost without proper sampling equipment or because the cores were collected for the purpose of only studying surface organics. All sampling methods were volumetric, providing the basis for bulk density calculations (g cm−3)
Organic soil layers or horizons were described and then subdivided according to field-based visual and tactical factors such as level of decomposition, color, and root abundance, regardless of region or soil drainage. These horizons provided the basis for our analyses and are based on the Canadian (Soil Classification Working Group, 1998) and U.S. Department of Agriculture's Natural Resource Conservation Service (Soil Survey Staff, 1998) soil survey techniques. A description of the horizons and the codes we used to represent them are found in Table 1; in summary there are six main horizons: live moss (L), dead moss (D), fibric (mostly undecomposed; F), mesic (more decomposed; M), humic (very decomposed; H), and mineral soil (Min).
Table 1A description of the soil horizons, as assigned by examining the composition of the soil horizon, including the degree of decomposition, color, and root abundance.
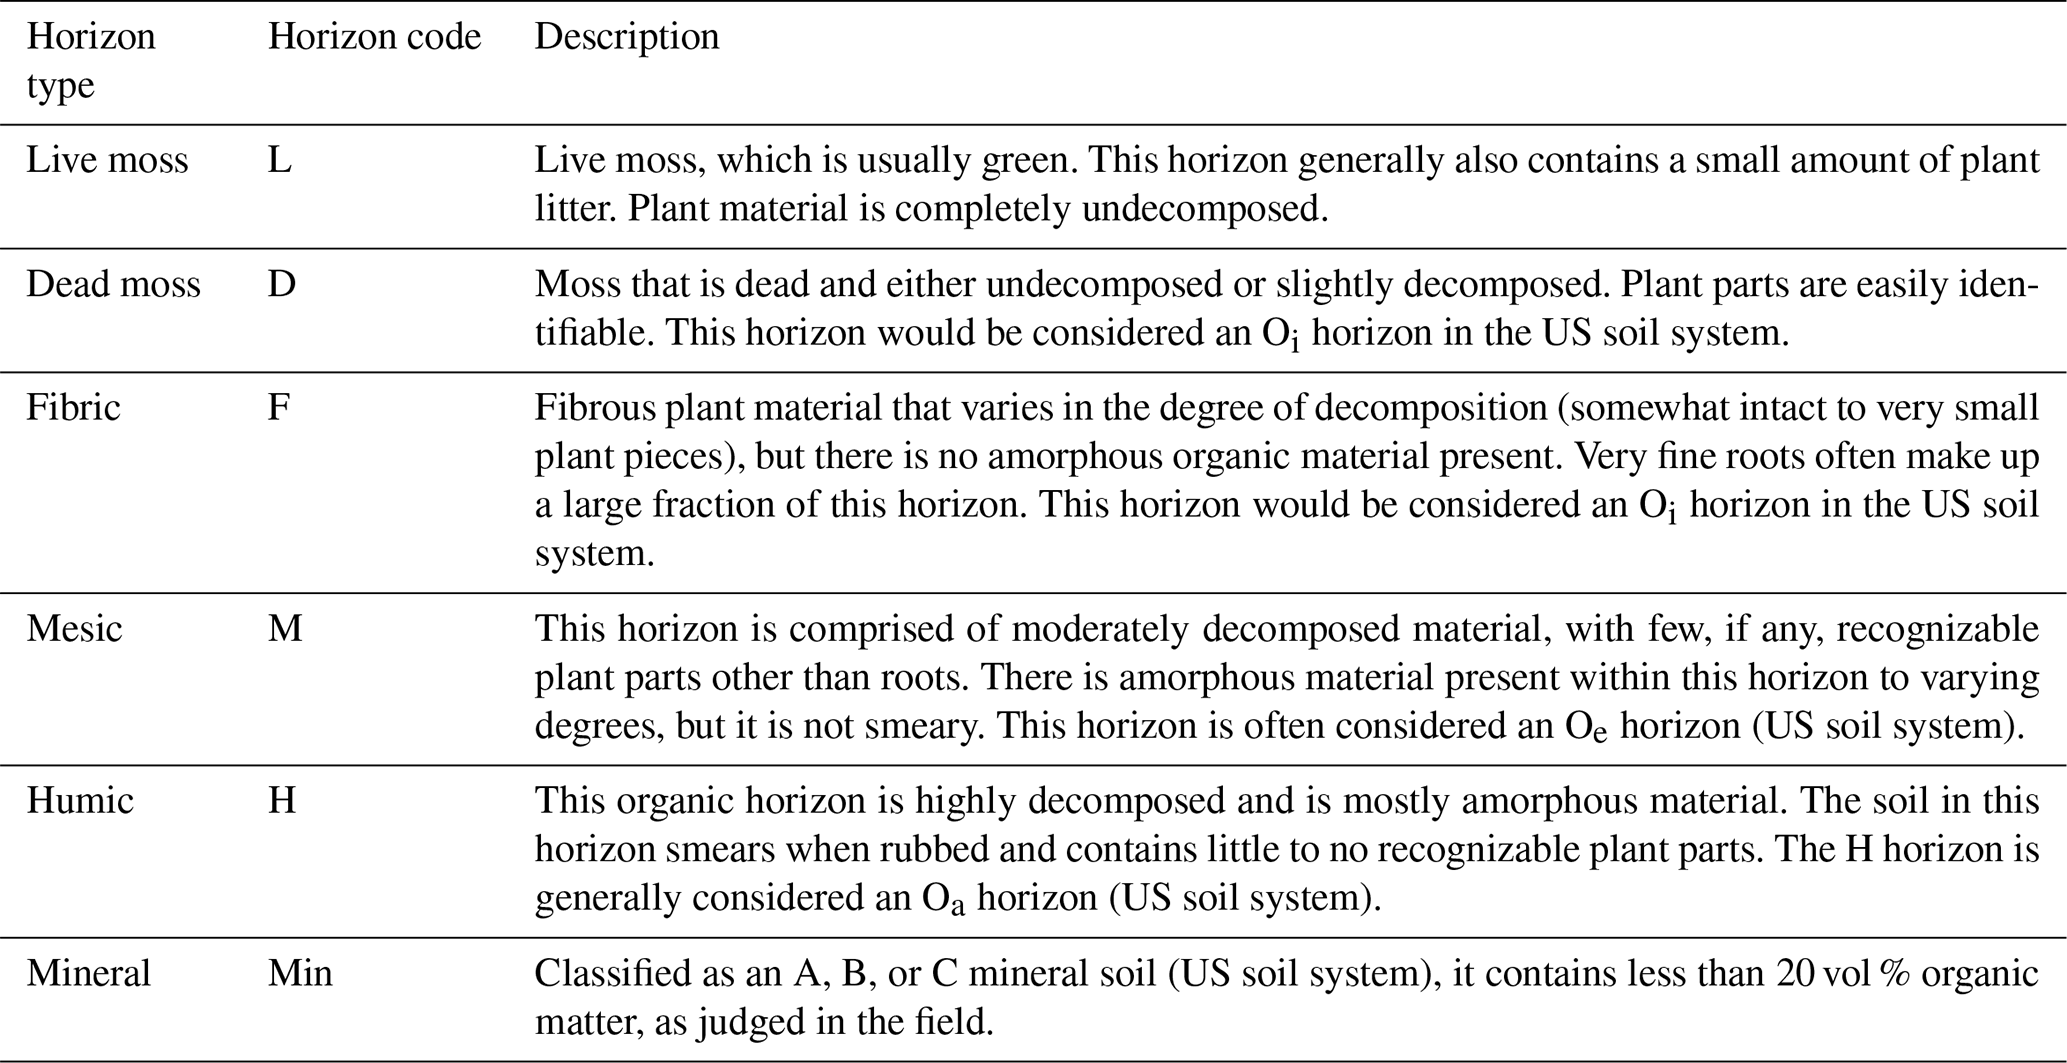
To aid researchers who may need to have these properties summarized in a more simplified scheme (as in Yi et al., 2009; O'Donnell et al., 2009), we also combined horizons post hoc into a simplified scheme. Here, the fibrous horizon consists of both the dead moss (D) and fibric (F) horizons, while the amorphous horizon combined the mesic (M) and humic (H) horizons. These combinations were based on similarities in decomposition state and depth within the organic soil profile. We also present data for several types of surface horizons that are only found a small fraction of sites; those data are presented separately. Ash and burned organic surface horizons are only found in recently burned sites. Lichen- and litter-dominated horizons are only found on the surface of ∼ 16 % of profiles and related to well-drained forest conditions. Our field studies also found several horizon types (buried wood, grass, etc.) for which we had few observations (5 or less), and thus these were not included in our analyses.
2.3 Laboratory methodology
Once returned from the field, samples were weighed and air-dried at room temperature (20–30 ∘C) to a constant mass and then oven-dried for 24–48 h in a forced-draft oven. Organic soils (live moss, dead moss, fibric, mesic, and humic horizons) were oven-dried at 65 ∘C to avoid the alteration of organic matter chemistry. Mineral soils were oven-dried at 105 ∘C. Mineral soil samples were gently crushed using a mortar and pestle, with care to break only aggregates, and then sieved through a 2 mm screen. Soil particles that did not pass through the screen were removed, weighed, and saved separately; soil that passed through the screen was then ground by using a mortar and pestle to pass through a 60 mesh (0.246 mm) screen. The ground material was mixed and placed in a labeled glass sample bottle for subsequent analyses. Organic soil samples were weighed, and roots wider than 1 cm in diameter were removed, weighed, and saved separately. The remaining sample material was then milled in an Udy Corp. Cyclone Sample Mill to pass through a 0.25 mm screen and placed in a labeled glass vial.
We analyzed soil samples for total C and N using a Carlo Erba NA1500 elemental analyzer (Fisons Instruments). Samples were combusted in the presence of excess oxygen. The resulting sample gases were carried by a continuous flow of helium through an oxidation furnace, followed by a reduction furnace, to yield CO2, N2, and water vapor. Water was removed by a chemical trap and CO2 and N2 were chromatographically separated before the quantification of C and N (Pella, 1990a, b). We assumed that mineral soil samples below pH 7, which are common to Interior Alaska, had no inorganic carbon (IC) present, and thus total C represents total organic C. For mineral–soil horizons where IC was present, we removed carbonates using the acid fumigation technique (Komada et al., 2008) prior to running samples. To do this, we pre-weighed samples in silver capsules and transferred them to a desiccator. Samples were wetted with 50 µL of deionized water and then exposed to vaporous hydrochloric acid (12 M) for a minimum of 6 h, during which carbonates degassed from samples as carbon dioxide.
2.4 Data quality and statistical methodology
Often the soil descriptions at the interface of the organic and mineral soil included notations indicating that these horizons consisted of mixed organics and mineral soil. Using visual and textural cues in the field, horizons were categorized as either mineral (<20 % C) or organic (≥ 20 % C). However, chemistry data sometimes show these horizons were miscategorized due to slight underestimations or overestimations of organic matter (OM) content (for example, a mineral soil with 22 % C). We used C chemistry to remove organic soils with < 20 % C from our analyses.
All statistical analyses were run using the R program (R Core Team, 2017). Data were transformed to meet assumptions of normality (Table S1). The effects of drainage and age class for all soil horizons, with the exception of the fibrous and amorphous horizons, were tested for significant differences among the different soil horizons using the mixed-effects model command lmer (lme4; Bates et al., 2015), using soil profile (or soil core) as the random effect. When significant, differences among drainage types or age class were determined using estimated marginal means (least-squares means; emmeans) (Lenth et al., 2020). No interactions were examined. Evaluation for the fibrous and amorphous horizons, as all samples were within a single soil profile, was done using the analysis of variance model (aov) with the Tukey honestly significant difference (TukeyHSD) function.
3.1 Bulk density
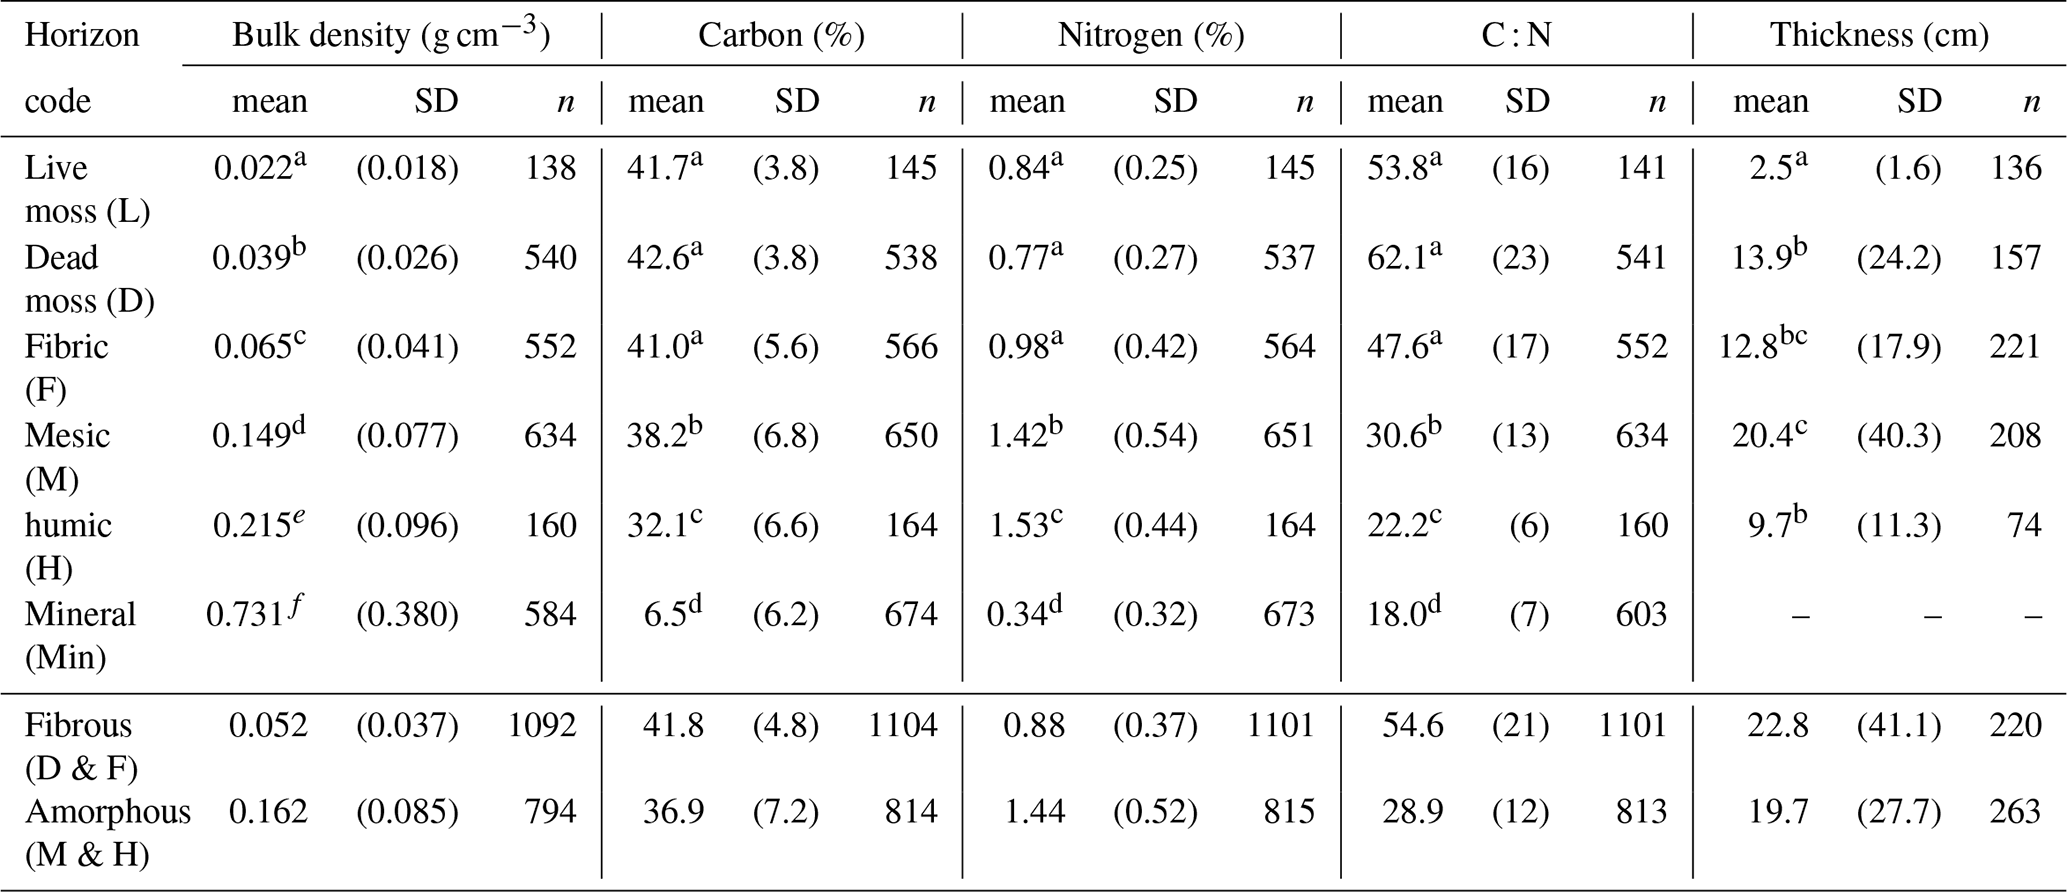
Bulk density varied by depth and was significantly different (p<0.05) among all horizon types (live moss, dead moss, fibric, mesic, humic, and mineral soil; Table 1). Surprisingly, as they are comprised of very similar material, even the live and dead moss horizons had significantly different bulk densities. Bulk density increases ∼ 10-fold from one organic horizon to the next down the soil profile (from 0.022 g cm−3 for live moss to 0.215 g cm−3 for the humic horizon). These differences are likely related to the length of time each soil horizon has had to decompose. As soil horizons become older, plant fibers break down physically and biologically, becoming smaller and more compressed.
Bulk density also varied by drainage class, particularly at the deeper depths. Well-drained sites tended to have higher bulk densities than other poorer soil drainage classes, especially for the deeper soil horizons (e.g., fibric and mesic; Table S2). Higher bulk densities with better drainage are likely related to two factors: (1) the influence of lichens and litter, which are often found at well-drained sites and have higher bulk densities than moss (Table 4), and (2) the influence of mineral soil, which, due to shallower organic soils, is more likely to be incorporated into fibric (F) and mesic (M) horizons. Greater mineral incorporation into organic layers of shallow well-drained soils is supported by the lower C percentage values also found within well-drained F and M horizons (Table S3). New sites (<5 years old) often had higher bulk densities than the older age classes (Table S2). There were, however, very few significant differences in bulk density by age class, so this factor does not appear to play strong role in determining bulk density.
Table 2Bulk density (g cm−3), C (%), N (%), C : N ratio, and thickness (cm) for the main horizon codes averaged across all drainage and age classes. Significant differences (p<0.05) among the main six horizon codes are indicated with different letters. There are no thickness values for mineral soil because these results would reflect the thickness sampled, not the actual thickness of this horizon. SD is 1 standard deviation.
3.2 Carbon
Upper, shallow organic soil horizons (live moss, dead moss, and fibric horizons) differ from deeper horizons (mesic and humic horizons) in several respects. Shallow horizons are consistently higher in % C than deeper horizons (Table 2). However, upper, shallow horizons are lower in bulk density than deeper horizons (Table 2), and thus C density values (g cm−3) increase dramatically with depth (Fig. 3). Therefore, even though the deeper organic horizons (M and H) have slightly lower C concentrations than the shallow horizons, their high bulk densities result in large amounts of C at depth. In fact, given average thickness, bulk density, and C percentage (Table 2), approximately 75 % of the soil C is stored in the mesic and humic soil horizons.
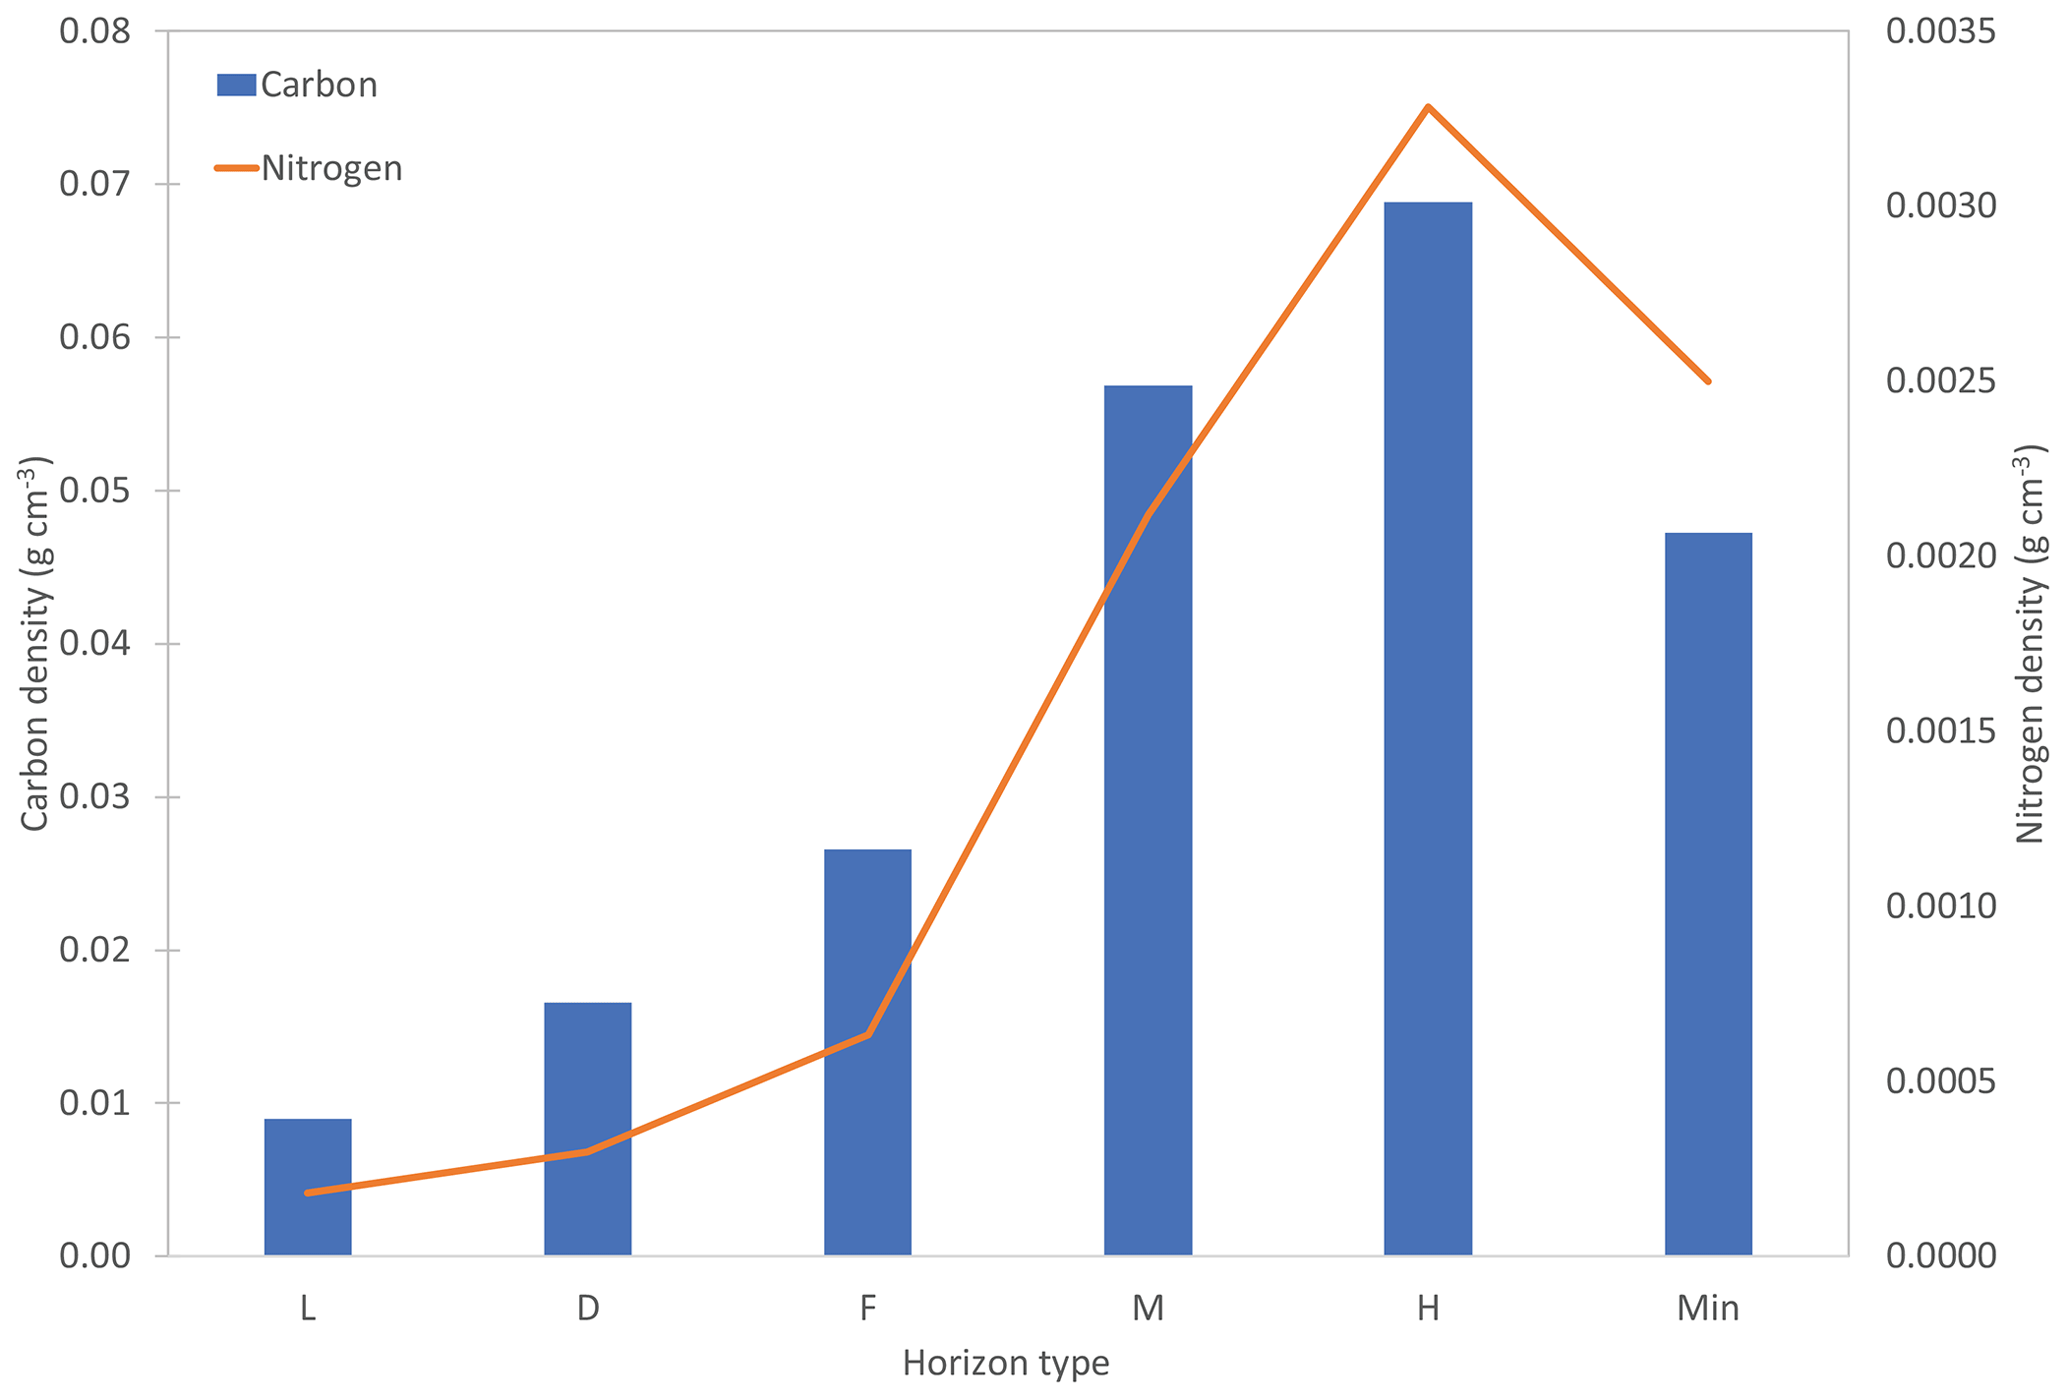
Figure 3Trends in carbon and nitrogen density (g cm−3) by horizon type using average values for bulk density, carbon, and nitrogen (Table 2). Horizon designations are as follows: L is live moss, D is dead moss, F is fibric, M is mesic, H is humic, and Min is mineral.
There were few clear trends with C concentration with drainage class; although moderately well-drained sites usually had higher C concentrations than the other drainage classes, especially somewhat poorly drained sites (Table S3). Lower C values for the fibric and mesic well-drained sites are likely due to the inclusion of mineral soil material into these horizons. While this difference is likely due in large part to natural processes such as cryoturbation or aeolian contributions, these horizons are thinner in well-drained sites (Table 3), so any accidental inclusion of mineral soil within these horizons during sampling would have more of an effect.
Table 3Thickness (cm) of the main horizon codes by soil drainage and age class. The mineral soil horizon was not included in this table because the way in which we sampled mineral soil led to arbitrary thicknesses. Significant differences (p<0.05) for horizon codes among drainage classes are indicated with different letters. SD is 1 standard deviation.
C concentration increased with increasing age class for all organic horizons except the humic horizon (Table S3). Since all sites classified as “new” were recently disturbed by fire, this increase could be due to the inclusion of more live roots and/or the loss of ash in older stands. Ash has a lower C content (Table 4) and is a component of recently burned soil's surface horizons.
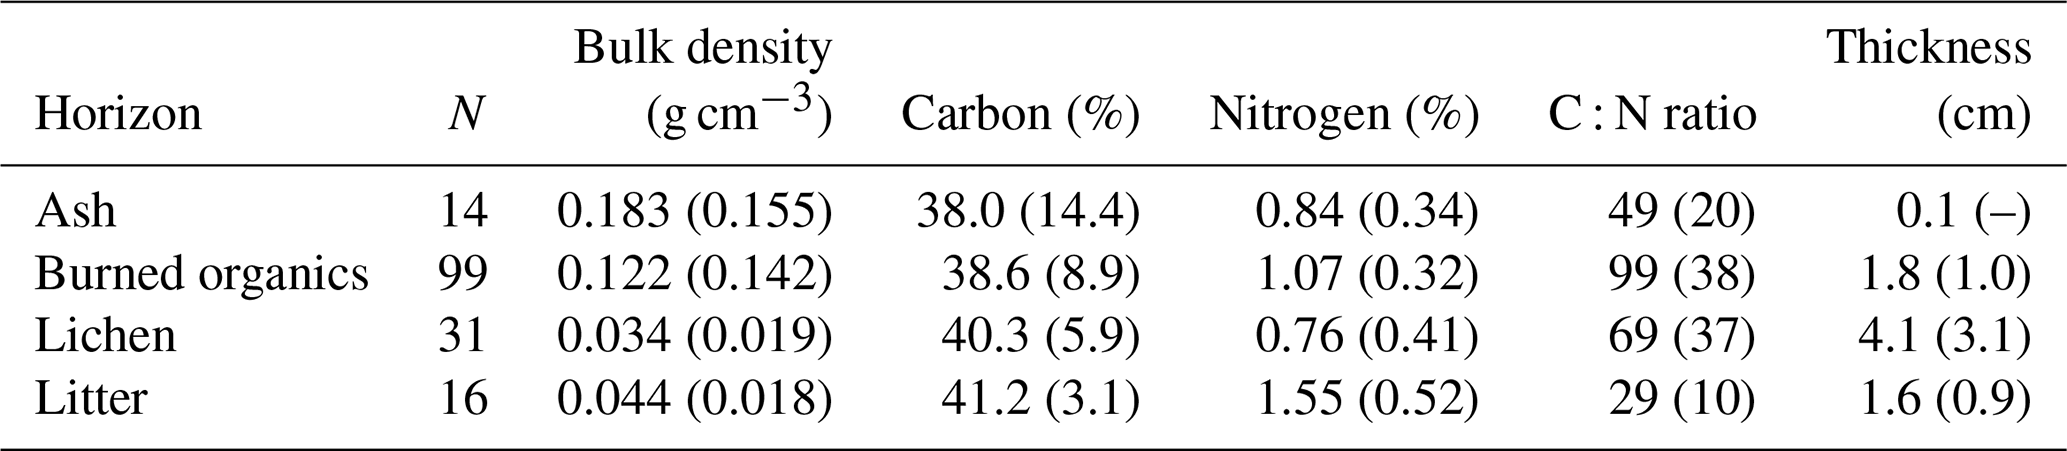
Table 4Physical and chemical properties of additional surface horizons. Number of observations, bulk density (g cm−3), C (%), N (%), C : N ratio, and thickness (cm) of non-main horizon codes. Values in parenthesis are standard deviations.
3.3 Nitrogen
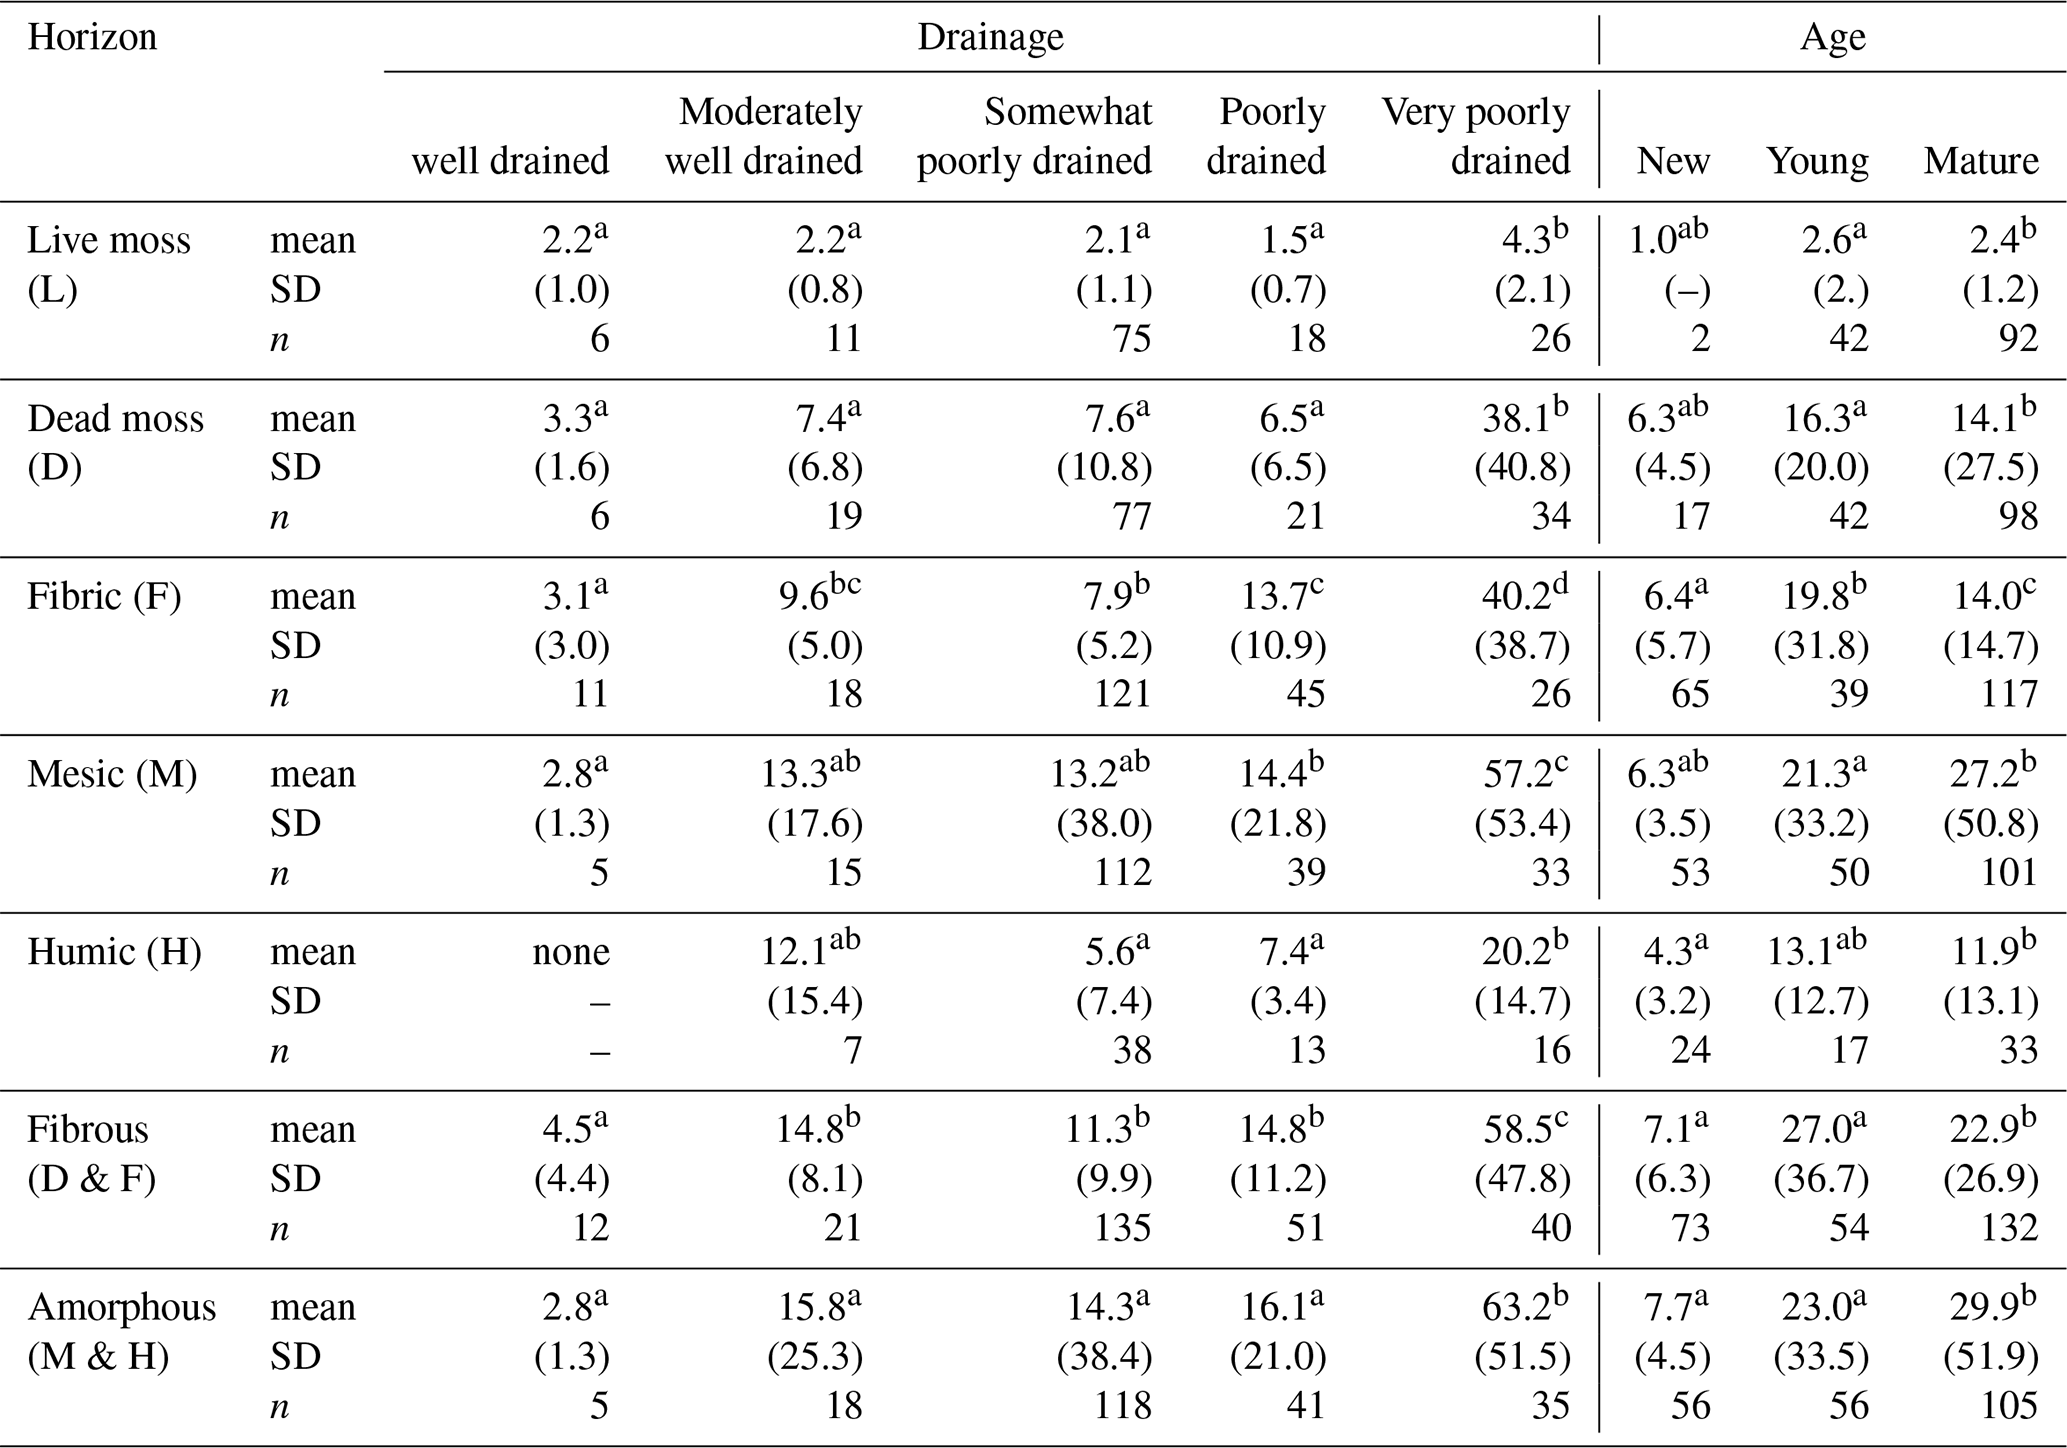
N concentration within the organic horizons increased with depth and then declined again in the mineral soil (Table 2). There was significant variability in N by drainage class for each horizon type (Table S4). The poorly and very poorly drained sites had greater concentrations of N than other drainage classes for the fibric (F), mesic (M), humic (H), and mineral horizons and lower concentrations of N in the dead moss (D) horizon. These higher values are likely because N builds up under saturated conditions, due to low rates of microbial activity, limiting decomposition (Limpens et al., 2006). There was also more N in the live and dead moss horizons of the new and younger stands (Table S3). These differences are likely related to differences in N quality of early succession litterfall (Bonan, 1990).
3.4 C : N ratio
C : N ratios patterns followed those of C and N, with the surface organic horizons (live moss, dead moss, and fibrics) having more similar values than the deeper soil organic horizons (Table 2). Well-drained sites tended to have lower C : N ratios (Table S5), likely caused by the lower C concentrations found there (see Sect. 3.2). C : N ratio increased with age class, but only in the surface organic horizons (live moss, dead moss, and fibrics). These trends appear to be more influenced by differences in N by age class than changes in C.
3.5 Soil horizon thickness
The factor that varied the most by horizon was the thickness of each horizon type (Table 2), and, unlike most of the other factors, the standard deviation was often greater than the mean. There was a very strong effect of drainage on horizon thickness, with the well-drained sites having much thinner soil horizons (and no humic horizon) than the other drainage classes and the very poorly drained sites having much thicker soil horizons that the other drainage classes (Table 3). Age class also plays a role in horizon thickness: new sites (<5 years old) had much thinner organic soil horizons than young or mature sites (Table 3). Since new sites recently burned, these thin soil horizons are the result of the loss of organics due to combustion. Both fire return interval and fire severity impact the amount of legacy soil remaining (Harden et al., 2012); therefore, fire history likely plays a large role in horizon thickness.
Vegetation could also influence horizon thickness. An examination of the data that included current surface vegetation found greater thicknesses for sites with Sphagnum sp. and sedges, although this factor usually was not statistically significant. Historical vegetation could also influence horizon thickness. For instance, if a site was Sphagnum dominated in the past, even if it is not the current surface vegetation, the soil profile is more likely to have thicker soil horizons due to the slow decomposition rate of Sphagnum (Turetsky et al., 2008). Because such historical factors are difficult to measure and predict, we recommend that researchers obtain their own measurements of organic horizon thickness whenever possible and, if using the thickness data presented in Table 3, account for the variability found for thickness estimates in their analyses.
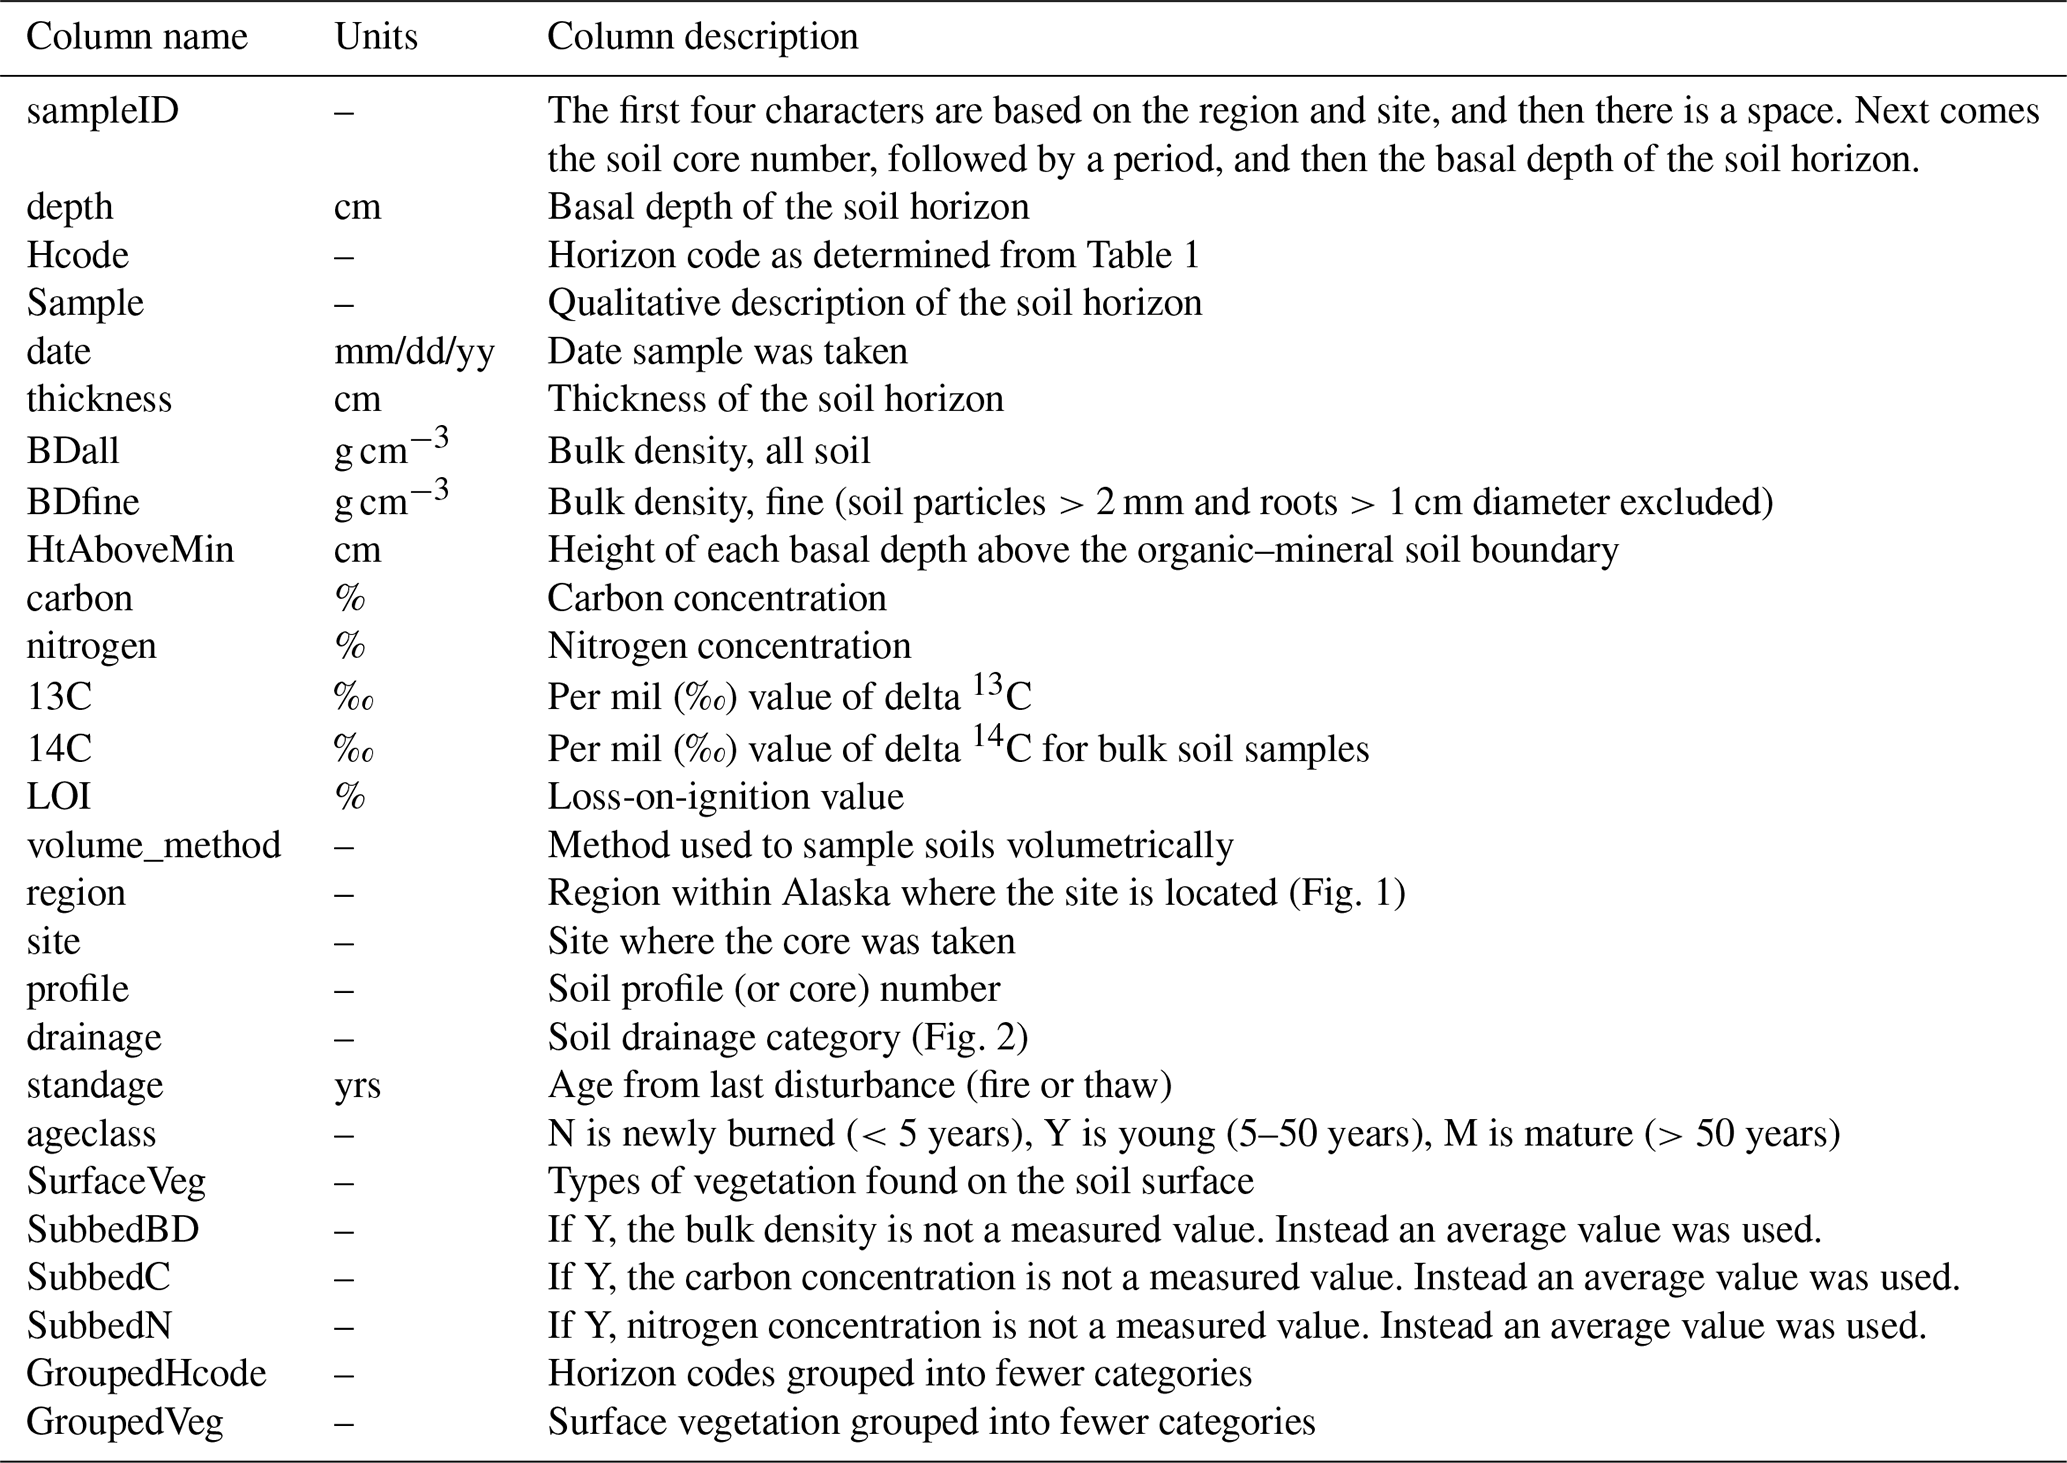
Table 5Data columns found in megaAlaska_v11-2 for ScienceBase.csv. This data file can be found at http://doi.org/10.5066/P960N1F9 (Manies, 2019).
4.1 Comparison to other datasets
Our data are the first of their kind to present organic horizon data across a range of Alaskan boreal ecosystems. Other studies have examined organic soil as a separate entity from mineral soil but with certain limitations. Michaelson et al. (2013) used Alaskan USDA-NRCS soil pedon data to examine soil properties of both organic and mineral soil but present these data for the organic portion as a whole. This study shows that there is significant variation in bulk density and C and N concentration across organic horizons, and therefore, one should not disregard these horizon-based variations. In a separate study, Ping et al. (2010) separated the organics into two horizons from boreal black spruce stands (Osurface, Oe ∕ Oa). Our study supports the results of Ping et al. (2010), which found a decrease in C : N ratios with increasing depth. Moreover, our study provides data from a fuller suite of soil horizons and includes data from bogs, fens, and deciduous forests.
4.2 How well do these values represent other data?
We tested how well our data from Interior AK can predict C and N stocks in other studies. Our first test was for 142 samples taken from two fire chronosequences located near Thompson, Manitoba (Manies et al., 2006). Each chronosequence represents a different drainage class: moderately well drained versus somewhat poorly drained. These data were based on the same methods of sampling and describing soil horizons. Using the horizon designations (Table 1) and horizon thickness (cm) from the Canadian data, we assigned bulk density, C, and N values (Table 2). These predicted horizon-based C and N stocks were summed for each soil profile and compared to the measured values. We found our predicted stocks were relatively evenly distributed between being lower or higher than measured stocks (Fig. S1), with the majority of estimated stocks (> 85 %) within 50 % of measured stocks and over 60 % within 20 % of measured stocks. Soil profiles with much higher predicted stocks than measured stocks were due to very low measured bulk densities (e.g., a measured bulk density for a fibric horizon of 0.01 g cm−3, as compared to the predicted value of 0.06 g cm−3). The differences we found between measured and predicted stocks could be due to regional differences between the Alaskan and Canadian sites in factors such as disturbance history or vegetation composition. In addition, accurate bulk density measurements are time consuming to take correctly (Nalder and Wein, 1998) and could also play a role.
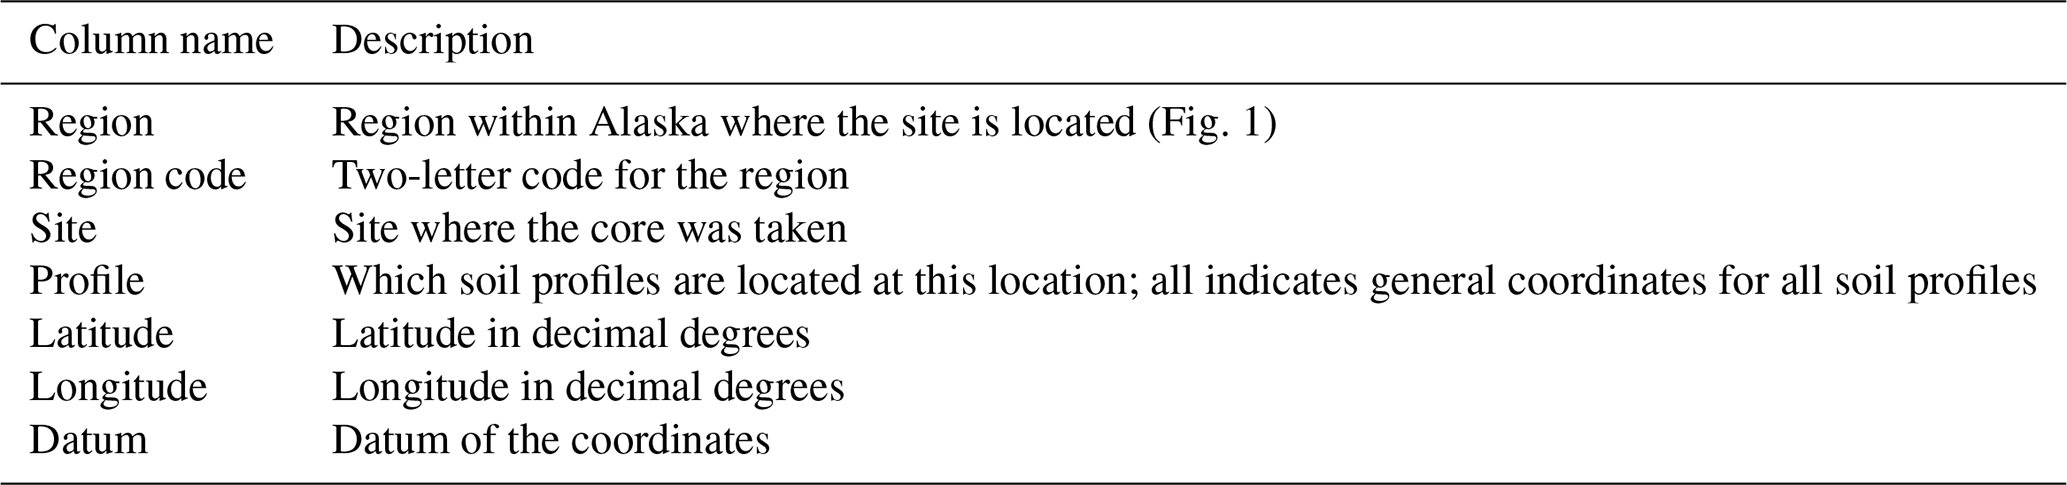
Table 6Data columns found in Site_GPS_coordinates_v2. This data file can be found at http://doi.org/10.5066/P960N1F9 (Manies, 2019).
To further explore the predictive capabilities of our data, we also compared predicted versus measured C stocks for a second study, this one located within Alaska (Kane and Ping, 2004), in which horizon thickness (all samples), C percentage (all samples), and bulk density (one 5.08 cm diameter sample per horizon per site) for soil profiles were measured along a continuum of tree productivity. To calculate predicted C stocks we used their thickness values with bulk density and C percentage values from Table 1. However, Kane and Ping (2004) used the US Soil System to describe and sample their soils, dividing the organic soil profile into Oi and Oe ∕ Oa horizons. We chose to represent their Oi data, which they described as slightly decomposed moss, using our fibrous horizon and their Oe ∕ Oa data, which they described as intermediately decomposed moss with rare saprics, as our amorphous horizon. Predicted C stocks were higher than measured stocks (Fig. S2). This result was mostly due to differences in bulk density values between our amorphous horizon and their Oe ∕ Oa horizon. Their study had Oe ∕ Oa bulk density values that ranged between 0.06 and 0.12 g cm−2, which is typical of our fibric (F) and mesic (M) horizons (Table 2). When we model their Oe ∕ Oa data using F values, we slightly underestimate stocks, while if we model their Oe ∕ Oa data using M values we slightly overestimate their stocks (Fig. S2). Thus, bulk density measurements play a role in these differences. These results also demonstrate that soil description protocols play an important role in characterizing C and N stocks and, in this case, the different system used to identify and sample organic soil horizons may not be equivalent.
4.3 Caveats and suggestions for use
One of the important uses of this dataset is the potential for estimating C and N stocks based on simple field characterizations of organic soil horizons of North American boreal forests and wetlands. Because soil sampling and processing is quite time intensive, researchers may decide to measure thicknesses of the various soil horizons within their sites, using the descriptors in Table 1, and then calculate C and N stocks using the average values presented in Tables 2, S2, S3, or S4. This approach minimizes errors associated with the high variability found for horizon thicknesses due to variable site histories.
While C stocks of mineral soils were not evaluated in this study, this region contains large amounts of C within mineral soils, especially within Yedoma deposits (Hugelius et al., 2014; O'Donnell et al., 2011). The mineral soil data presented here mostly represent the uppermost mineral soil. Additional examinations into bulk density and C concentrations of Alaskan mineral soil can be found in Ping et al. (2010), Michaelson et al. (2013), and Ebel et al. (2019).
Although our data provide an important resource for several properties of organic horizons, we acknowledge that our samples are dominated by mature sites from areas that are not well drained. Therefore, as additional soil horizon data is sampled, we encourage researchers to expand upon the work presented here.
All data used in this paper are available from https://doi.org/10.5066/P960N1F9 (Manies, 2019). This publication includes both .csv data files and metadata. A short description of these files and the data found within them can be found in Tables 5 and 6. In addition, many additional soil attributes not included in that publication, such as the Von Post decomposition index and additional soil chemistry information, can be found for the majority of these data through various U.S. Geological Survey Open-File Reports (Manies et al., 2017, 2016, 2014, 2004; O'Donnell et al., 2013, 2012).
Boreal ecosystems are especially sensitive and vulnerable due to climate change. Models may not accurately forecast high-latitude biogeochemical processes for many reasons (Flato et al., 2013). One reason for the discrepancies between model results and data is that many models lack the input data required, including important factors for modeling soil thermal dynamics like bulk density (Koven et al., 2013; Khvorostyanov et al., 2008). While these processes are starting to be incorporated into land surface and regional models (see, for example, Genet et al., 2013; Koven et al., 2011), currently few models include the distinct properties of organic soils that are found in the boreal region (Flato et al., 2013). The > 3000 soil samples from > 290 soil profiles that are presented in this paper provide information regarding the important soil properties of bulk density, C concentration, N concentration, C : N ratios, and thickness by organic soil horizon. Such data are needed for initializing and validating models related to boreal organic soils. In addition, these data can be used by scientists to calculate C and N stocks where researchers only have soil horizon thickness data or to address shortcomings of missing data in instances when an important soil property was not measured.
The supplement related to this article is available online at: https://doi.org/10.5194/essd-12-1745-2020-supplement.
KM prepared the manuscript with the help of MW and JH. All authors were involved in supporting the collection of these data.
The authors declare that they have no conflict of interest.
We would like to acknowledge the Bonanza Creek LTER and the USGS Fairbanks office for their support of our work over the years. We would also like to thank the many people who assisted in collecting these samples.
This work has been supported by the U.S. Geological Survey (Land Resources, Climate and Land Use Change, and Global Change programs); the National Science Foundation, Division of Environmental Biology (grant no. 0425328); the National Science Foundation, Division of Earth Sciences (grant no. 0630249); and the National Aeronautics and Space Administration, Terrestrial Ecology program (grant no. NNX09AQ36G).
This paper was edited by Birgit Heim and reviewed by two anonymous referees.
Bates, D., Maechler, M., Bolker, B., and Walker, S.: Fitting Linear Mixed-Effects Models Using lme4, J. Stat. Softw., 67, 1–48, https://doi.org/10.18637/jss.v067.i01, 2015.
Bauer, I. E., Bhatti, J. S., Cash, K. J., Tarnocai, C., and Robinson, S. D.: Developing Statistical Models to Estimate the Carbon Density of Organic Soils, Can. J. Soil Sci., 86, 295–304, 2006.
Bonan, G. B.: Carbon and Nitrogen Cycling in North American Boreal Forests. I. Litter Quality and Soil Thermal Effects in Interior Alaska, Biogeochemistry, 10, 1–28, 1990.
Bradshaw, C. J. A. and Warkentin, I. G.: Global estimates of boreal forest carbon stocks and flux, Global Planet. Change, 128, 24–30, 10.1016/j.gloplacha.2015.02.004, 2015.
Carey, S. K. and Woo, M. K.: Hydrology of two slopes in subarctic Yukon, Canada, Hydrol. Process., 13, 2549–2562, 10.1002/(SICI)1099-1085(199911)13:16<2549::AID-HYP938>3.0.CO;2-H, 1999.
Deluca, T. H. and Boisvenue, C.: Boreal forest soil carbon: distribution, function and modelling, Forestry, 85, 161–184, 10.1093/forestry/cps003, 2012.
Ebel, B. A., Koch, J. C., and Walvoord, M. A.: Soil Physical, Hydraulic, and Thermal Properties in Interior Alaska, USA: Implications for Hydrologic Response to Thawing Permafrost Conditions, Water Resour. Res., 55, 4427–4447, 10.1029/2018wr023673, 2019.
Estop-Aragonés, C., Cooper, M. D. A., Fisher, J. P., Thierry, A., Garnett, M. H., Charman, D. J., Murton, J. B., Phoenix, G. K., Treharne, R., Sanderson, N. K., Burn, C. R., Kokelj, S. V., Wolfe, S. A., Lewkowicz, A. G., Williams, M., and Hartley, I. P.: Limited release of previously-frozen C and increased new peat formation after thaw in permafrost peatlands, Soil Biol. Biochem., 118, 115–129, https://doi.org/10.1016/j.soilbio.2017.12.010, 2018.
Expert Committee on Soil Survey: The Canada Soil Information System (CanSIS): Manual for describing soils in the field, LRRI Contribution No. 82-52, Ottawa, Canada, 175 pp., 1982.
Flato, G., Marotzke, J., Abiodun, B., Braconnot, P., Chou, S. C., Collins, W., Cox, P., Driouech, F., Emori, S., Eyring, V., Forest, C., Gleckler, P., Guilyardi, E., Jakob, C., Kattsov, V., Reason, C., and Rummukainen, M.: Evaluation of Climate Models, in: Climate Change 2013: The Physical Science Basis. Contribution of Working Group I to the Fifth Assessment Report of the Intergovernmental Panel on Climate Change, edited by: Stocker, T. F., Qin, D., Plattner, G.-K., Tignor, M., Allen, S. K., Boschung, J., Nauels, A., Xia, Y., Bex, V., and Midgley, P. M., Cambridge University Press, Cambridge, UK, and New York, NY, USA, 741–866, 2013.
Genet, H., McGuire, A. D., Barrett, K., Breen, A., Euskirchen, E. S., Johnstone, J. F., Kasischke, E. S., Melvin, A. M., Bennett, A., Mack, M. C., Rupp, T. S., Schuur, A. E. G., Turetsky, M. R., and Yuan, F.: Modeling the effects of fire severity and climate warming on active layer thickness and soil carbon storage of black spruce forests across the landscape in interior Alaska, Environ. Res. Lett., 8, 45016–45016, 2013.
Gibson, C. M., Chasmer, L. E., Thompson, D. K., Quinton, W. L., Flannigan, M. D., and Olefeldt, D.: Wildfire as a major driver of recent permafrost thaw in boreal peatlands, Nat. Commun., 9, 3041, 10.1038/s41467-018-05457-1, 2018.
Harden, J. W., Trumbore, S. E., Stocks, B. J., Hirsch, A., Gower, S. T., O'Neill, K. P., and Kaisischke, E. S.: The role of fire in the boreal carbon budget, Glob. Change Biol., 6, S174–S184, 2000.
Harden, J. W., Meier, R., Silapaswan, C., Swanson, D. K., and McGuire, A. D.: Soil drainage and its potential for influencing wildfires in Alaska, in: Studies by the U.S. Geological Survey in Alaska, 2001, edited by: Galloway, J., U.S. Geological Survey Professional Paper 1678, 139–144, 2003.
Harden, J. W., Manies, K. L., O'Donnell, J., Johnson, K., Frolking, S., and Fan, Z.: Spatiotemporal analysis of black spruce forest soils and implications for the fate of C, J. Geophys. Res., 117, G01012, 10.1029/2011JG001826, 2012.
Herndon, E., Kinsman-Costello, L., and Godsey, S.: Biogeochemical Cycling of Redox-Sensitive Elements in Permafrost-Affected Ecosystems, in: Biogeochemical Cycles, edited by: Dontsova, K., Balogh-Brunstad, Z., and Le Roux, G., AGU Geophysical Monograph Series, Wiley, 245–265, 2020.
Hinzman, L. D., Bettez, N. D., Bolton, W. R., Chapin, F. S., Dyurgerov, M. B., Fastie, C. L., Griffith, B., Hollister, R. D., Hope, A., Huntington, H. P., Jensen, A. M., Jia, G. J., Jorgenson, T., Kane, D. L., Klein, D. R., Kofinas, G., Lynch, A. H., Lloyd, A. H., McGuire, A. D., Nelson, F. E., Oechel, W. C., Osterkamp, T. E., Racine, C. H., Romanovsky, V. E., Stone, R. S., Stow, D. A., Sturm, M., Tweedie, C. E., Walker, M. D., Walker, D. A., Webber, P. J., Welker, J. M., Winker, K. S., and Yoshikawa, K.: Evidence and implications of recent climate change in northern Alaska and other arctic regions, Climatic Change, 72, 251–298, https://doi.org/10.1007/s10584-005-5352-2, 2005.
Hugelius, G., Strauss, J., Zubrzycki, S., Harden, J. W., Schuur, E. A. G., Ping, C.-L., Schirrmeister, L., Grosse, G., Michaelson, G. J., Koven, C. D., O'Donnell, J. A., Elberling, B., Mishra, U., Camill, P., Yu, Z., Palmtag, J., and Kuhry, P.: Estimated stocks of circumpolar permafrost carbon with quantified uncertainty ranges and identified data gaps, Biogeosciences, 11, 6573–6593, https://doi.org/10.5194/bg-11-6573-2014, 2014.
Jackson, R. B., Lajtha, K., Crow, S. E., Hugelius, G., Kramer, M. G., and Piñeiro, G.: The Ecology of Soil Carbon: Pools, Vulnerabilities, and Biotic and Abiotic Controls, Annu. Rev. Ecol. Evol. S., 48, 419–445, 10.1146/annurev-ecolsys-112414-054234, 2017.
Johnson, K. D., Harden, J. W., McGuire, A. D., Bliss, N. B., Bockheim, J. G., Clark, M., Nettleton-Hollingsworth, T., Jorgenson, M. T., Kane, E. S., Mack, M., O'Donnell, J., Ping, C. L., Schuur, E. A. G., Turetsky, M. R., and Valentine, D. W.: Soil carbon distribution in Alaska in relation to soil-forming factors, Geoderma, 167–168, 10.1016/j.goederma.2011.10.006, 2011.
Johnstone, J. F., Hollingsworth, T. N., and Chapin, F. S., III: A key for predicting postfire successional trajectories in black spruce stands of interior Alaska, Gen. Tech. Rep. PNW-GTR-767, Portland, OR, U.S. Department of Agriculture, Forest Service, Pacific Northwest Research Station, 37 pp., 2008.
Jorgenson, M. T., Harden, J. W., Kanevskiy, M., O'Donnell, J. A., Wickland, K. P., Ewing, S. A., Manies, K. L., Zhuang, Q., Shur, Y., Striegl, R. G., and Koch, J. C.: Reorganization of vegetation, hydrology, and soil carbon after permafrost degradation across heterogeneous boreal landscapes, Environ. Res. Lett., 8, 035017, 10.1088/1748-9326/8/3/035017, 2013.
Kane, E. S. and Ping, C.-L.: Soil carbon stabilization along productivity gradients in interior Alaska: Summer 2003, Bonanza Creek LTER – University of Alaska Fairbanks, BNZ:132, https://doi.org/10.6073/pasta/d09433eee2cb6587eca672864cf7e90f, 2004.
Khvorostyanov, D. V., Krinner, G., Ciais, P., Heimann, M., and Zimov, S. A.: Vulnerability of permafrost carbon to global warming. Part I: model description and role of heat generated by organic matter decomposition, Tellus B, 60, 250–264, 10.1111/j.1600-0889.2007.00333.x, 2008.
Kielland, K., Olson, K., Ruess, R. W., and Boone, R. D.: Contribution of winter processes to soil nitrogen flux in taiga forest ecosystems, Biogeochemistry, 81, 349–360, 10.1007/s10533-006-9045-3, 2006.
Komada, T., Anderson, M. R., and Dorfmeier, C. L.: Carbonate removal from coastal sediments for the determination of organic carbon and its isotopic signatures, δ13C and Δ14C: comparison of fumigation and direct acidification by hydrochloric acid, Limnol. Oceanogr.-Meth, 6, 254–262, 2008.
Koven, C. D., Ringeval, B., Friedlingstein, P., Ciais, P., Cadule, P., Khvorostyanov, D., Krinner, G., and Tarnocai, C.: Permafrost carbon-climate feedbacks accelerate global warming, P. Natl. Acad. Sci. USA, 108, 14769–14774, 10.1073/pnas.1103910108, 2011.
Koven, C. D., Riley, W. J., and Stern, A.: Analysis of permafrost thermal dynamics and response to climate change in the CMIP5 Earth System Models, J. Climate, 26, 1877–1900, 2013.
Lenth, R., Signmann, H., Love, J., Buerkner, P., and Herve, M.: emmeans: Estimated Marginal Means, aka Least-Squares Means, R package version 1.4.8. available at: https://CRAN.R-project.org/package=emmeans, last access: 30 July 2020.
Limpens, J., Heijmans, M. M. P. D., and Berendse, F.: The Nitrogen Cycle in Boreal Peatlands, in: Boreal Peatland Ecosystems, edited by: Wieder, R. K., and Vitt, D., Ecol. Stud., Springer Berlin Heidelberg, 195–230, 2006.
Malmer, N., Albinsson, C., Svensson, B. M., and Wallén, B.: Interferences between Sphagnum and vascular plants: effects on plant community structure and peat formation, Oikos, 100, 469–482, 10.1034/j.1600-0706.2003.12170.x, 2003.
Manies, K.: Data Supporting Generalized models to estimate carbon and nitrogen stocks of organic layers in Interior Alaska, U.S. Geological Survey, https://doi.org/10.5066/P960N1F9, 2019.
Manies, K. L., Harden, J. W., Silva, S. R., Briggs, P. H., and Schmid, B. M.: Soil data from Picea mariana stands near Delta Junction, Alaska of different ages and soil drainage types, U.S. Geological Survey, Open File Report 2004-1271, 19 pp., 2004.
Manies, K. L., Harden, J. W., and Veldhuis, H.: Soil data from a moderately well and somewhat poorly drained fire chronosequence near Thompson, Manitoba, Canada, U.S. Geological Survey, Open File Report 2006-1291, 17 pp., 2006.
Manies, K. L., Harden, J. W., and Hollingsworth, T. N.: Soils, Vegetation, and Woody Debris Data from the 2001 Survey Line Fire and a Comparable Unburned Site, U.S. Geological Survey, Open-File Report 2014-1049, 36 pp., 2014.
Manies, K. L., Harden, J. W., Fuller, C. C., Xu, X., and McGeehin, J. P.: Soil Data for a Vegetation Gradient Located at Bonanza Creek Long Term Ecological Research Site, Tanana Flats Region, Alaska, U.S. Geological Survey, 20 pp., 2016.
Manies, K. L., Fuller, C. C., Jones, M. C., Waldrop, M. P., and McGeehin, J. P.: Soil data for a thermokarst bog and the surrounding permafrost plateau forest, located at Bonanza Creek Long Term Ecological Research Site, Interior Alaska, Open File Report 2016-1173, 11 pp., 2017.
Michaelson, G. J., Ping, C.-L., and Clark, M.: Soil Pedon Carbon and Nitrogen Data for Alaska: An Analysis and Update, Open J. Soil Sci., 3, 132–142, 10.4236/ojss.2013.32015, 2013.
Mu, C., Zhang, T., Zhang, X., Li, L., Guo, H., Zhao, Q., Cao, L., Wu, Q., and Cheng, G.: Carbon loss and chemical changes from permafrost collapse in the northern Tibetan Plateau, J. Geophys. Res.-Biogeo., 121, 1781–1791, 10.1002/2015JG003235, 2016.
Myers-Smith, I. H., Harden, J. W., Wilmking, M., Fuller, C. C., McGuire, A. D., and Chapin III, F. S.: Wetland succession in a permafrost collapse: interactions between fire and thermokarst, Biogeosciences, 5, 1273–1286, https://doi.org/10.5194/bg-5-1273-2008, 2008.
Nalder, I. A. and Wein, R. W.: A new forest floor corer for rapid sampling, minimal disturbance and adequate precision, Silva Fenn., 32, 373–381, 1998.
Neff, J. C., Harden, J. W., and Gleixner, G.: Fire effects on soil organic matter content and composition in boreal Interior Alaska, Can. J. Forest Res., 35, 2178–2187, 2005.
O'Donnell, J. A., Romanovsky, V. E., Harden, J. W., and McGuire, A. D.: The effect of soil moisture content on the thermal conductivity of soil organic horizons from black spruce ecosystems in Interior Alaska, Soil Sci., 646–651, 10.1097/SS.0b013e3181c4a7f8, 2009.
O'Donnell, J. A., Harden, J. W., McGuire, A. D., Kanevskiy, M. Z., and Jorgenson, M. T.: The effect of fire and permafrost interactions on soil carbon accumulation in an upland black spruce ecosystem of interior Alaska: Implications for post-thaw carbon loss, Glob. Change Biol., 1461–1474, 10.1111/j.1365-2486.2010.02358.x, 2011.
O'Donnell, J. A., Harden, J. W., Manies, K. L., and Jorgenson, M. T.: Soil data for a collapse-scar bog chronosequence in Koyukuk Flats National Wildlife Refuge, Alaska, 2008, U.S. Geological Survey, Open-File Report, 14 pp., 2012.
O'Donnell, J. A., Harden, J. W., Manies, K. L., Jorgenson, M. T., Kanevskiy, M., and Xu, X.: Soil data from fire and permafrost-thaw chronosequences in upland black spruce (Picea mariana) stands near Hess Creek and Tok, Alaska, U.S. Geological Survey, 16 pp., 2013.
O'Neill, K. P., Kasischke, E. S., and Richter, D. D.: Environmental controls on soil CO2 flux following fire in black spruce, white spruce, and aspen stand of interior Alaska, Can. J. Forest Res., 32, 1525–1541, 2002.
Osterkamp, T. E., Jorgenson, M. T., Schuur, E. A. G., Shur, Y. L., Kanevskiy, M. Z., Vogel, J. G., and Tumskoy, V. E.: Physical and ecological changes associated with warming permafrost and thermokarst in Interior Alaska, Permafrost Periglac., 20, 235–256, 2009.
Pella, E.: Elemental organic analysis. Part 1 – Historical developments, American Laboratory, 22, 116–125, 1990a.
Pella, E.: Elemental organic analyzer, Part 2 – State of the art, American Laboratory, 22, 28–32, 1990b.
Ping, C., Boone, R. D., Clark, M. H., Packee, E. C., and Swanson, D. K.: State factor control of soil formation in Interior Alaska, in: Alaska's changing boreal forest, edited by: Chapin Iii, F. S., Oswood, M. W., Van Cleve, K., Viereck, L. A., and Verbyla, D. L., Oxford University Press, Oxford, 21–38, 2006.
Ping, C. L., Michaelson, G. J., Kane, E. S., Packee, E. C., Stiles, C. A., Swanson, D. K., and Zaman, N. D.: Carbon Stores and Biogeochemical Properties of Soils under Black Spruce Forest, Alaska, Soil Sci. Soc. Am. J., 74, 969–978, 2010.
R Core Team: R: A language and environment for statistical computing, R Foundation for Statistical Computing, Vienna, Austria, 2017.
Rand, J. and Mellor, M.: Ice-coring augers for shallow depth sampling, U.S. Army Cold Regions Research and Engineering Laboratory, CRREL Report 85-21, Hanover, USA, 27 pp., 1985.
Schadel, C., Bader, M. K. F., Schuur, E. A. G., Biasi, C., Bracho, R., Capek, P., De Baets, S., Diakova, K., Ernakovich, J., Estop-Aragones, C., Graham, D. E., Hartley, I. P., Iversen, C. M., Kane, E., Knoblauch, C., Lupascu, M., Martikainen, P. J., Natali, S. M., Norby, R. J., O'Donnell, J. A., Chowdhury, T. R., Santruckova, H., Shaver, G., Sloan, V. L., Treat, C. C., Turetsky, M. R., Waldrop, M. P., and Wickland, K. P.: Potential carbon emissions dominated by carbon dioxide from thawed permafrost soils, Nat. Clim. Change, 6, 950–953, 10.1038/nclimate3054, 2016.
Schuur, E. A., McGuire, A. D., Schädel, C., Grosse, G., Harden, J. W., Hayes, D. J., Hugelius, G., Koven, C. D., Kuhry, P., Lawrence, D. M., Natali, S. M., Olefeldt, D., Romanovsky, V. E., Schaefer, K., Turetsky, M. R., Treat, C. C., and Vonk, J. E.: Climate change and the permafrost carbon feedback, Nature, 520, 171–179, 10.1038/nature14338, 2015.
Soil Classification Working Group: Canadian System of Soil Classification, 3rd edn., National Research Council Canada Research Press, Ontario, Ottawa, 188 pp., 1998.
Soil Survey Division Staff: Examination and Description of Soil Profiles, in: Soil survey manual, edited by: Ditzler, C., Scheffe, K., and Monger, H. C., USDA, Government Printing Office, Washington, D.C., USA, 1993.
Soil Survey Staff: Keys to soil taxonomy, 8th ed., Pocahontas Press, Blacksburg, Virginia, 599 pp., 1998.
Turetsky, M. R., Crow, S. E., Evans, R. J., Vitt, D. H., and Wieder, R. K.: Trade-offs in resource allocation among moss species control decomposition in boreal peatlands, J. Ecol., 96, 1297–1305, 10.1111/j.1365-2745.2008.01438.x, 2008.
Turetsky, M. R., Kane, E. S., Harden, J. W., Ottmar, R. D., Manies, K. L., Hoy, E., and Kasichke, E. S.: Recent acceleration of biomass burning and carbon losses in Alaskan forests and peatlands, Nat. Geosci., 4, 27–31, 10.1038/NGEO1027, 2011.
Van Cleve, K., Oliver, L., Schlentner, R., Viereck, L. A., and Dyrness, C. T.: Productivity and nutrient cycling in taiga forest ecosystems, Can. J. Forest Res., 13, 747–766, 1983.
Woo, M. K.: Permafrost hydrology in North America, Atmos. Ocean, 24, 201–234, 10.1080/07055900.1986.9649248, 1986.
Yi, S., Manies, K., Harden, J., and McGuire, A. D.: Characteristics of organic soil in black spruce forests: Implications for the application of land surface and ecosystem models in cold regions, Geophys. Res. Lett., 36, L05501, 10.1029/2008GL037014, 2009.