the Creative Commons Attribution 4.0 License.
the Creative Commons Attribution 4.0 License.
 | 08 Jul 2020
AIMERG: a new Asian precipitation dataset (0.1°/half-hourly, 2000–2015) by calibrating the GPM-era IMERG at a daily scale using APHRODITE
Ziqiang Ma
Jintao Xu
Jun Yang
Guoqiang Tang
Yuanjian Yang
Zhou Shi
Precipitation estimates with fine quality and spatio-temporal resolutions play significant roles in understanding the global and regional cycles of water, carbon, and energy. Satellite-based precipitation products are capable of detecting spatial patterns and temporal variations of precipitation at fine resolutions, which is particularly useful over poorly gauged regions. However, satellite-based precipitation products are the indirect estimates of precipitation, inherently containing regional and seasonal systematic biases and random errors. In this study, focusing on the potential drawbacks in generating Integrated Multi-satellitE Retrievals for Global Precipitation Measurement (IMERG) and its recently updated retrospective IMERG in the Tropical Rainfall Measuring Mission (TRMM) era (finished in July 2019), which were only calibrated at a monthly scale using ground observations, Global Precipitation Climatology Centre (GPCC, 1.0∘/monthly), we aim to propose a new calibration algorithm for IMERG at a daily scale and to provide a new AIMERG precipitation dataset (0.1∘/half-hourly, 2000–2015, Asia) with better quality, calibrated by Asian Precipitation – Highly Resolved Observational Data Integration Towards Evaluation of Water Resources (APHRODITE, 0.25∘/daily) at the daily scale for the Asian applications. The main conclusions include but are not limited to the following: (1) the proposed daily calibration algorithm (Daily Spatio-Temporal Disaggregation Calibration Algorithm, DSTDCA) is effective in considering the advantages from both satellite-based precipitation estimates and the ground observations; (2) AIMERG performs better than IMERG at different spatio-temporal scales, in terms of both systematic biases and random errors, over mainland China; and (3) APHRODITE demonstrates significant advantages compared to GPCC in calibrating IMERG, especially over mountainous regions with complex terrain, e.g. the Tibetan Plateau. Additionally, results of this study suggest that it is a promising and applicable daily calibration algorithm for GPM in generating the future IMERG in either an operational scheme or a retrospective manner.
The
AIMERG data are freely accessible at https://doi.org/10.5281/zenodo.3609352 (for the period from 2000 to 2008)
(Ma et al., 2020a) and https://doi.org/10.5281/zenodo.3609507
(for the period from 2009 to 2015) (Ma et al., 2020b).
Highlights.
-
A new effective daily calibration approach, DSTDCA, for improving the GPM-era IMERG is provided.
-
New AIMERG precipitation data (0.1∘/half-hourly, 2000–2015, Asia) are provided.
-
Bias of AIMERG is significantly improved compared with that of IMERG.
-
APHRODITE is more suitable than GPCC in anchoring IMERG over Asia.
- Article
(14991 KB) - Full-text XML
- BibTeX
- EndNote


Precipitation is among the most essential hydroclimatic factors and also the most difficult to estimate due to its great small-scale variabilities (Yatagai et al., 2012; Huffman et al., 2019a). A high-spatio-temporal-resolution precipitation dataset with fine quality is essential for various scientific and operational applications, including but not limited to driving the hydrological models and supporting the predictions of droughts and floods (Beck et al., 2017, 2018). There are mainly two principal approaches for measuring the global precipitation: ground-based gauge observing and satellite-based remote sensing, which result in three mainstream global precipitation products, namely gauge analysis precipitation data, satellite-based-only precipitation estimates, and satellite–gauge combined precipitation products, based on the consideration that ground-based gauge data are clearly important for anchoring the satellite estimates (Huffman et al., 2007, 2019a).
In recent years, a large number of quasi-global satellite precipitation products with various temporal and spatial resolutions have been developed and released to the public, such as the PMW-based CPC Morphing technique (CMORPH) (for abbreviations, see the Appendix) (Joyce et al., 2004), as well as IR-based PERSIANN (Sorooshian et al., 2000) and PERSIANN-CCS (Hong et al., 2004). As the milestone in the satellite-based precipitation measurement process, the TRMM and its successor GPM have developed a flexible framework for generating the most popular precipitation products, TMPA (1998–present, 0.25∘/3-hourly) and IMERG (2014–present, 0.1∘/half-hourly), as well as the retrospective IMERG (2000–present, 0.1∘/half-hourly) from the GPM era to the TRMM era, which aims at intercalibrating, merging, and interpolating all MW estimates of the GPM constellation, IR estimates, and gauge observations (Huffman et al., 2019b). The final run version of IMERG (hereafter referred to as IMERG), incorporating the monthly gauge analysis, provides the state-of-the-art precipitation estimate with finest spatio-temporal resolutions so far, while it still contains large uncertainties, e.g. greatly overestimating the precipitation, at daily and hourly scales from region to region, especially over mountainous areas such as the Tibetan Plateau, China (Tang et al., 2016; Lu et al., 2020; Xu et al., 2019), which is potentially a result of the calibration procedures in the process of generating IMERG. Currently, the IMERG product (following the gauge correction method of the TMPA approach) (Huffman et al., 2007) has been produced by anchoring the multi-satellite-only precipitation estimates using the monthly analysis satellite–gauge product (1.0∘/monthly, 1979 to the present, delayed by about 3 months) from the GPCC (Adler et al., 2003, 2018); therefore, IMERG performed better at monthly and annual scales than those at finer temporal scales (e.g. daily, hourly).
Satellite-based precipitation products have significant advantages in detecting the variations of precipitation at fine spatio-temporal resolutions, especially over the poorly gauged regions. However, as the indirect estimates of precipitation, satellite-based precipitation products inherently contain regional, seasonal, and diurnal systematic biases and random errors (Ebert et al., 2007), which could be effectively alleviated by anchoring the satellite-only precipitation products using gauge-based observations (Huffman et al., 2007). Therefore, great efforts have been made to explore the calibrations on the satellite-only precipitation estimates using gauge analysis. Historically, the Global Precipitation Climatology Project (GPCP) has provided the lion's share of the early efforts in the process of developing calibration algorithms for the satellite-only precipitation estimates in generating SG products (2.5∘/monthly). For instance, to correct the bias of the multi-satellite-only estimates (mainly based on PMW and IR data) on a regional scale, the multi-satellite estimate was firstly multiplied by the ratio of the large-scale (with moving window size 5×5) average gauge analysis to the large-scale average of the multi-satellite estimate, and then the SG estimate was finally derived by combining the gauge-adjusted multi-satellite estimate and the gauge analysis with inverse-error-variance weighting (Huffman et al., 1997; Adler et al., 2003, 2018). Recently, a two-step strategy was proposed to remove the bias inherent in the multi-satellite-only precipitation estimates using the PDF matching method and to combine the bias-corrected estimates with the gauge analyses using the OI algorithm (Xie and Xiong, 2011; Shen et al., 2014). And a similar improved PDF algorithm was applied to generate the Global Satellite Mapping of Precipitation (GSMaP) data, which was adjusted at the daily scale by the gauge analysis (0.5∘/daily) from the CPC (Mega et al., 2014), while the GPM-era IMERG adjusted the multi-satellite precipitation estimates (0.1∘/half-hourly) at the monthly scale using the ratios between the original monthly multi-satellite-only and the monthly satellite–gauge data, in combination with the original monthly multi-satellite-only and GPCC (1.0∘), in the month (Huffman et al., 2019a). There is still much room for exploring the improved algorithms for calibrating the multi-satellite-only precipitation estimates at finer spatio-temporal scales, e.g. 0.25∘/daily, which is also one of the next vital focuses by the GPM (Huffman et al., 2019a).
As for anchoring the satellite precipitation estimates, the quality and spatio-temporal resolutions of the gauge analysis precipitation data are the key factors. Though the GPCC has developed a series of gauge-based precipitation analysis datasets with the quality and spatio-temporal resolutions continually improved, accurate estimations of precipitation over the land are still very difficult with limited networks of rain gauges. In Asia, great efforts have also been made to generate gauge analysis precipitation products at the monthly scale (Chen et al., 2002; Mitchell and Jones, 2005; Matsuura and Willmott, 2009; Schneider et al., 2008), and limited explorations at the daily scale, e.g. Rajeevan and Bhate (2009), explored daily grid precipitation data over India with data from more than 2500 rain gauges. Meanwhile, significant differences among those products have been reported by Yatagai et al. (2005, 2012). To more accurately monitor and predict the Asian hydro-meteorological environment, the APHRODITE project (starting in 2006) aimed at developing the state-of-the-art gridded precipitation datasets at the resolutions of 0.25∘/daily covering all of Asia based on the largest numbers of ground observations from multi-sources. Since the release of APHRODITE products (1951–2015, 0.25∘/daily, last update 5 October 2018), APHRODITE daily grid precipitation datasets have been widely used, and they are distinguished from other gauge analysis data by considering the different interpolation schemes and climatology characteristics, especially over mountainous regions with complex terrain such as the Tibetan Plateau (Yatagai et al., 2012).
The aim of this study is to explore the calibration approach at a daily scale for the retrospective IMERG data using the APHRODITE product, in both TRMM and GPM eras, from 2000 to 2015. Therefore, a new calibration approach, Daily Spatio-Temporal Disaggregation Calibration Algorithm (DSTDCA), is proposed and suggested for the GPM in their future algorithms; meanwhile, a new AIMERG precipitation dataset (0.1∘/half-hourly, 2000–2015, Asia) (Ma et al., 2020a, b) with better quality is to be provided publicly for the Asian applications.
2.1 IMERG
To generate the IMERG product, IMERG focuses on intercalibrating, merging, and interpolating all satellite MW-based precipitation estimates, together with MW-calibrated IR-based precipitation estimates, precipitation gauge analyses, and potentially other precipitation estimators at fine spatio-temporal scales for the TRMM and GPM eras over the entire globe. Initially, IMERG was only available after June 2014. Currently, IMERG is at its version 06 stage (https://pmm.nasa.gov/sites/default/files/document_files/IMERG_ATBD_V06.pdf, last access: 17 January 2020), based on which IMERG has been a retrospect to the TRMM era at the end of September 2019, and IMERG is now available back to June 2000 (0.1∘/half-hourly) (https://pmm.nasa.gov/data-access/downloads/gpm, last access: 17 January 2020). The final run of IMERG combines the GPCC Monitoring Product, the V8 Full Data Analysis for the majority of the time (currently 1998–2016), and the V6 Monitoring Product from 2017 to the present. The monitoring product is posted about 2 months after the month of observations from ∼7000 to 8000 stations worldwide, which is relatively sparse, especially over Asia (Schneider et al., 2014, 2018).
2.2 APHRODITE
Since the release of the APHRODITE product (0.25∘/Daily, 1951–2007), it has been widely used as one of state-of-the-art daily grid precipitation datasets over Asia for hydro-climatological related studies (Yatagai et al., 2012; Ménégoz et al., 2013; Sunilkumar et al., 2019). APHRODITE has been demonstrated to replicate ground truth observations very well (Duncan and Biggs, 2012) and represents the optimal dataset for analysing historical precipitation variability and change. Recently, the APHRODITE data have been updated from the former period 1951–2007 to the longer period 1951–2015, in September 2018, with continuous efforts of quality control (QC) flagging some data (Hamada et al., 2011). The APHRODITE data could be available through the website http://aphrodite.st.hirosaki-u.ac.jp/download/ (last access: 17 January 2020).
2.3 CMPA
The China Merged Precipitation Analysis (CMPA, 0.1∘/hourly, 2008–2015) has been generated by using hourly rain gauge data at more than 30 000 automatic weather stations in China, with the combination of the CMORPH precipitation product, and provided by the Chinese Meteorological Administration (http://data.cma.cn, last access: 17 January 2020) (Shen et al., 2014). The OI method was adopted to estimate the areal precipitation distribution based on the gauge observations (Yong et al., 2010), but relatively large uncertainty still exists in the interpolated precipitation field, particularly over western China with relatively sparse gauge networks. For grid boxes with gauges, the observed precipitation values are exactly the gauge observations or the averaged observations when more than one gauge is located in a grid.
2.4 Point-based rain gauge data from meteorological stations
The hourly rain gauge datasets from 57 835 national ground stations used in this study, in 2015, were collected from the National Meteorological Information Center of CMA (http://data.cma.cn). All the gauge data have undergone strict quality control in three levels, which include the (1) extreme values' check, (2) internal consistency check, and (3) spatial consistency check (Shen et al., 2010). Most gauges are located over the eastern and southern parts of mainland China, and relatively sparse gauge networks are located across the northern and western parts, especially over the Tibetan Plateau. The limited number of gauges could be a source of error in the evaluation of satellite precipitation products in such areas (Shen et al., 2014).
2.5 Point-based rain gauge data from hydrological stations
The hourly ground precipitation observations from around 500 hydrological stations (the number of station varied from year to year) used in this study were collected from the Hydrology Bureau of Zhejiang Province, southeastern China (http://data.cma.cn/). The quality control follows two steps: (1) the datasets are filtered by the threshold value after being collected from rain gauges; (2) the outliers are identified through manual processing. With careful data quality control, the rain gauge datasets have satisfying performances on the accuracy and validity.
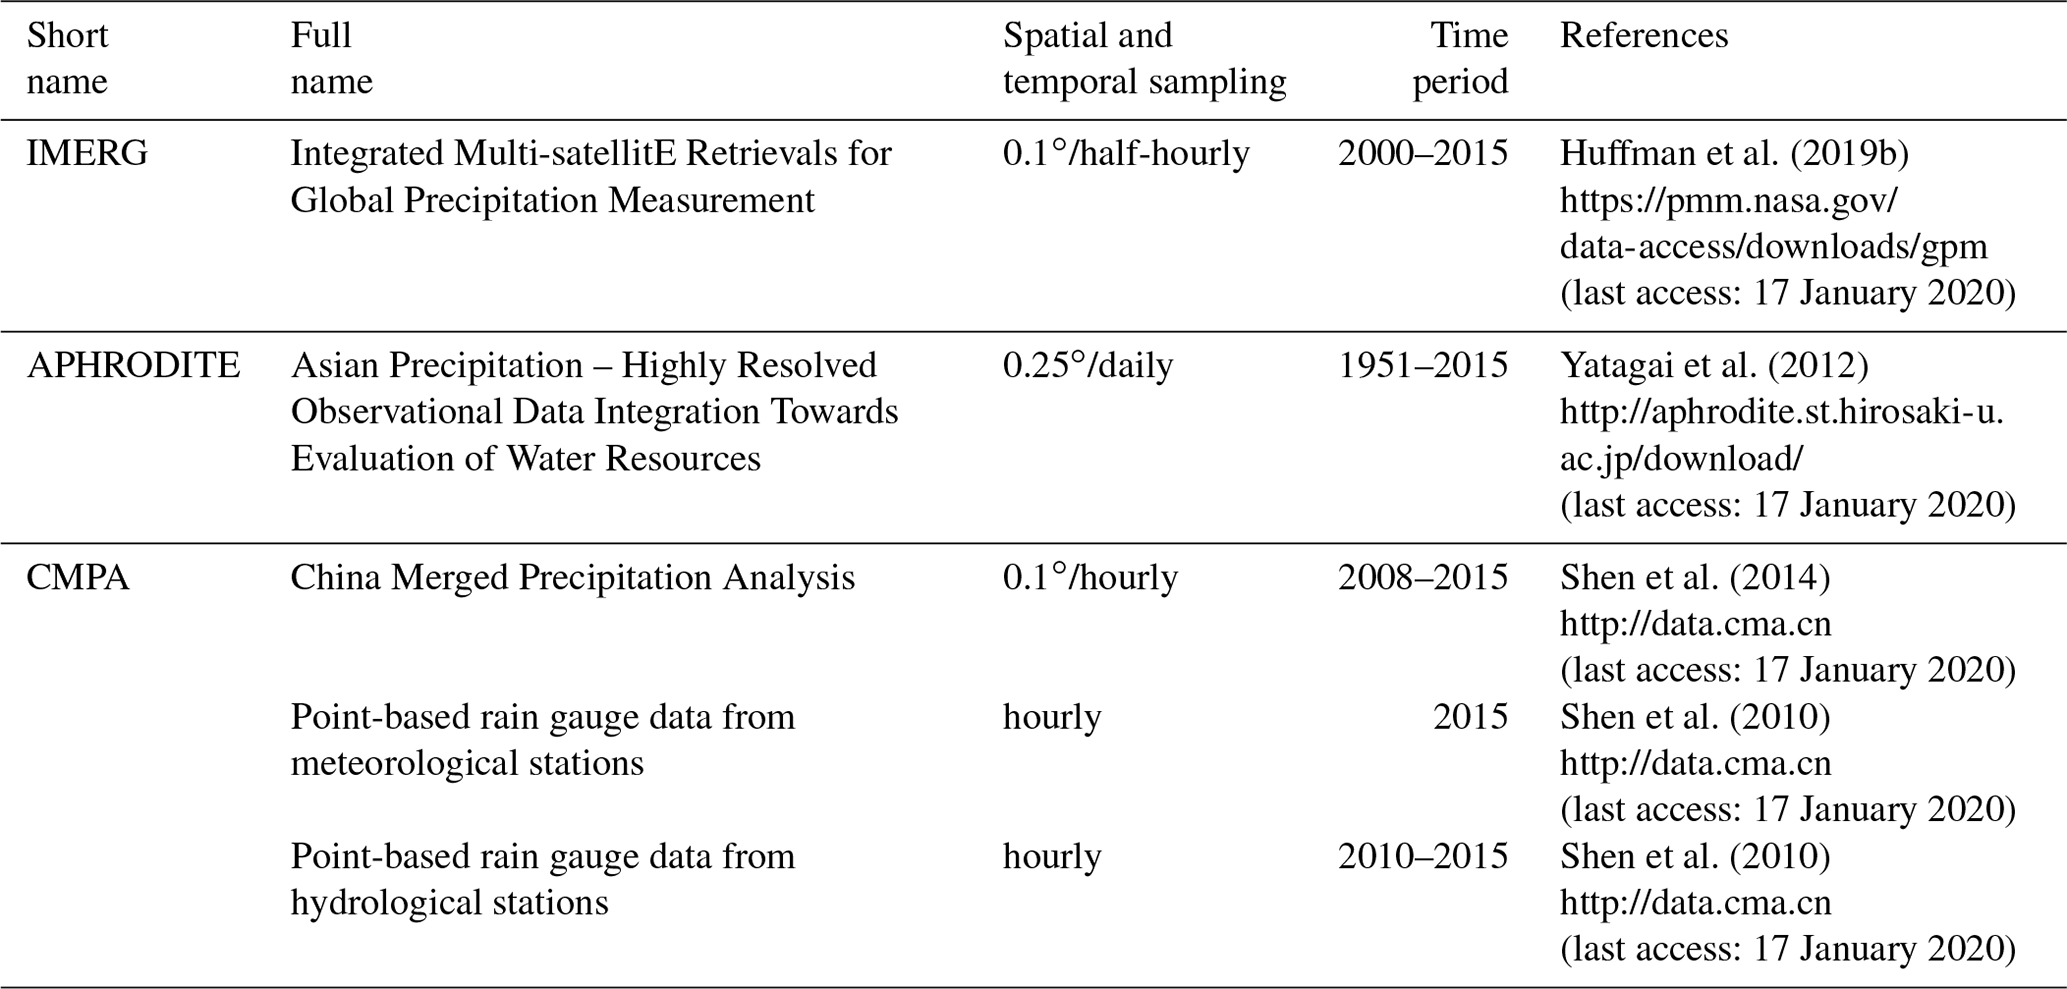
There are five datasets used in this study (refer to Table 1 for a summary of the datasets). IMERG and APHRODITE have been used for generating the AIMERG data, and the others have been used for evaluating and comparing IMERG and AIMERG at different scales.
Table 1List of satellite-based, gauge-based, and satellite–gauge combination precipitation products used in this study.
3.1 Calibration procedure of the Daily Spatio-Temporal Disaggregation Calibration Algorithm, DSTDCA
According to previous evaluations on IMERG (Lu et al., 2020; Xu et al., 2019), there are at least two characteristics resulting its significant overestimations: (1) the amplitude of hourly or half-hourly estimated rainfall rates are significantly amplified by IMERG compared with ground observations, which might be caused by the benchmark of GPCC and GPCP SG data for calibrations; and (2) the IMERG algorithm is generally over-detecting precipitation events, resulting in a large number of false alarms but unreal precipitation events. Therefore, this study selects the APHRODITE data as the benchmark for calibrating IMERG at a daily scale, based on the proposed approach, DSTDCA, and the main steps of the DSTDCA are shown as follows:
-
IMERG data (0.1∘/half-hourly) are accumulated to IMERG data at the daily scale (0.1∘), which are used to generate the spatial disaggregation weights. As the spatial resolution of APHRODITE data is 0.25∘, the moving window size of 3 by 3 is selected, and the daily spatial disaggregation weights (0.1∘) based on IMERG are obtained by calculating the ratios between the daily rainfall accumulations at the central grid and the average daily rainfall accumulations in the corresponding 3×3 window. The daily spatial disaggregation weights consider the relative spatial patterns of the precipitation captured by IMERG.
-
Based on the daily precipitation accumulations of IMERG, the half-hourly temporal disaggregation weights (0.1∘) are derived by calculating the ratios between the half-hourly precipitation estimates and the corresponding daily precipitation estimates. If the daily accumulation estimate is equal to zero, then each half-hourly temporal disaggregation weight is set to zero.
-
As there is a small fraction of grids in APHRODITE with no data at a daily scale, the no-data grids in APHRODITE data are firstly filled with the data according to their nearest neighbour with effective value.
-
For spatial calibrations, the daily calibrated IMERG data using APHRODITE data are obtained by multiplying the spatial disaggregation weights based on IMERG (0.1∘/daily) from step (1) by daily APHRODITE data (0.25∘/daily) from step (3). In this step, to match IMERG (0.1∘) and APHRODITE (0.25∘), the numbers and weights of the APHRODITE grids corresponding to each IMERG pixel are determined, according to the relative spatial locations and coverage relationships between each pixel of IMERG (0.1∘) and the corresponding pixels of APHRODITE (0.25∘).
-
For temporal calibrations, the half-hourly calibrated IMERG data are obtained by multiplying the half-hourly temporal disaggregation weights (0.1∘/half-hourly) from step (2) by the daily calibrated IMERG from step (4).
-
By considering the situations in which APHRODITE data captured the precipitation while IMERG did not, the half-hourly calibrated IMERG is further processed by equally disaggregating the value from the daily APHRODITE data at the corresponding grid into 48 half-hourly periods, which are regarded as the half-hourly calibrated IMERG values in the corresponding day.
-
By considering the situations in which IMERG data captured the precipitation while APHRODITE did not, the 48 half-hourly calibrated IMERG values in the corresponding days and locations are all set to values of zero, to meet the ground truth observations. And this consideration has already been conducted in step (4).
After all the above-mentioned procedures, the final calibrated AIMERG (0.1∘/ half-hourly) data are obtained by considering both the total precipitation controls and the effective precipitation events measured by the ground truth observations by APHRODITE data over Asia. And the flowchart of the Daily Spatio-Temporal Disaggregation Calibration Algorithm, DSTDCA, can be clearly seen in Fig. 1.
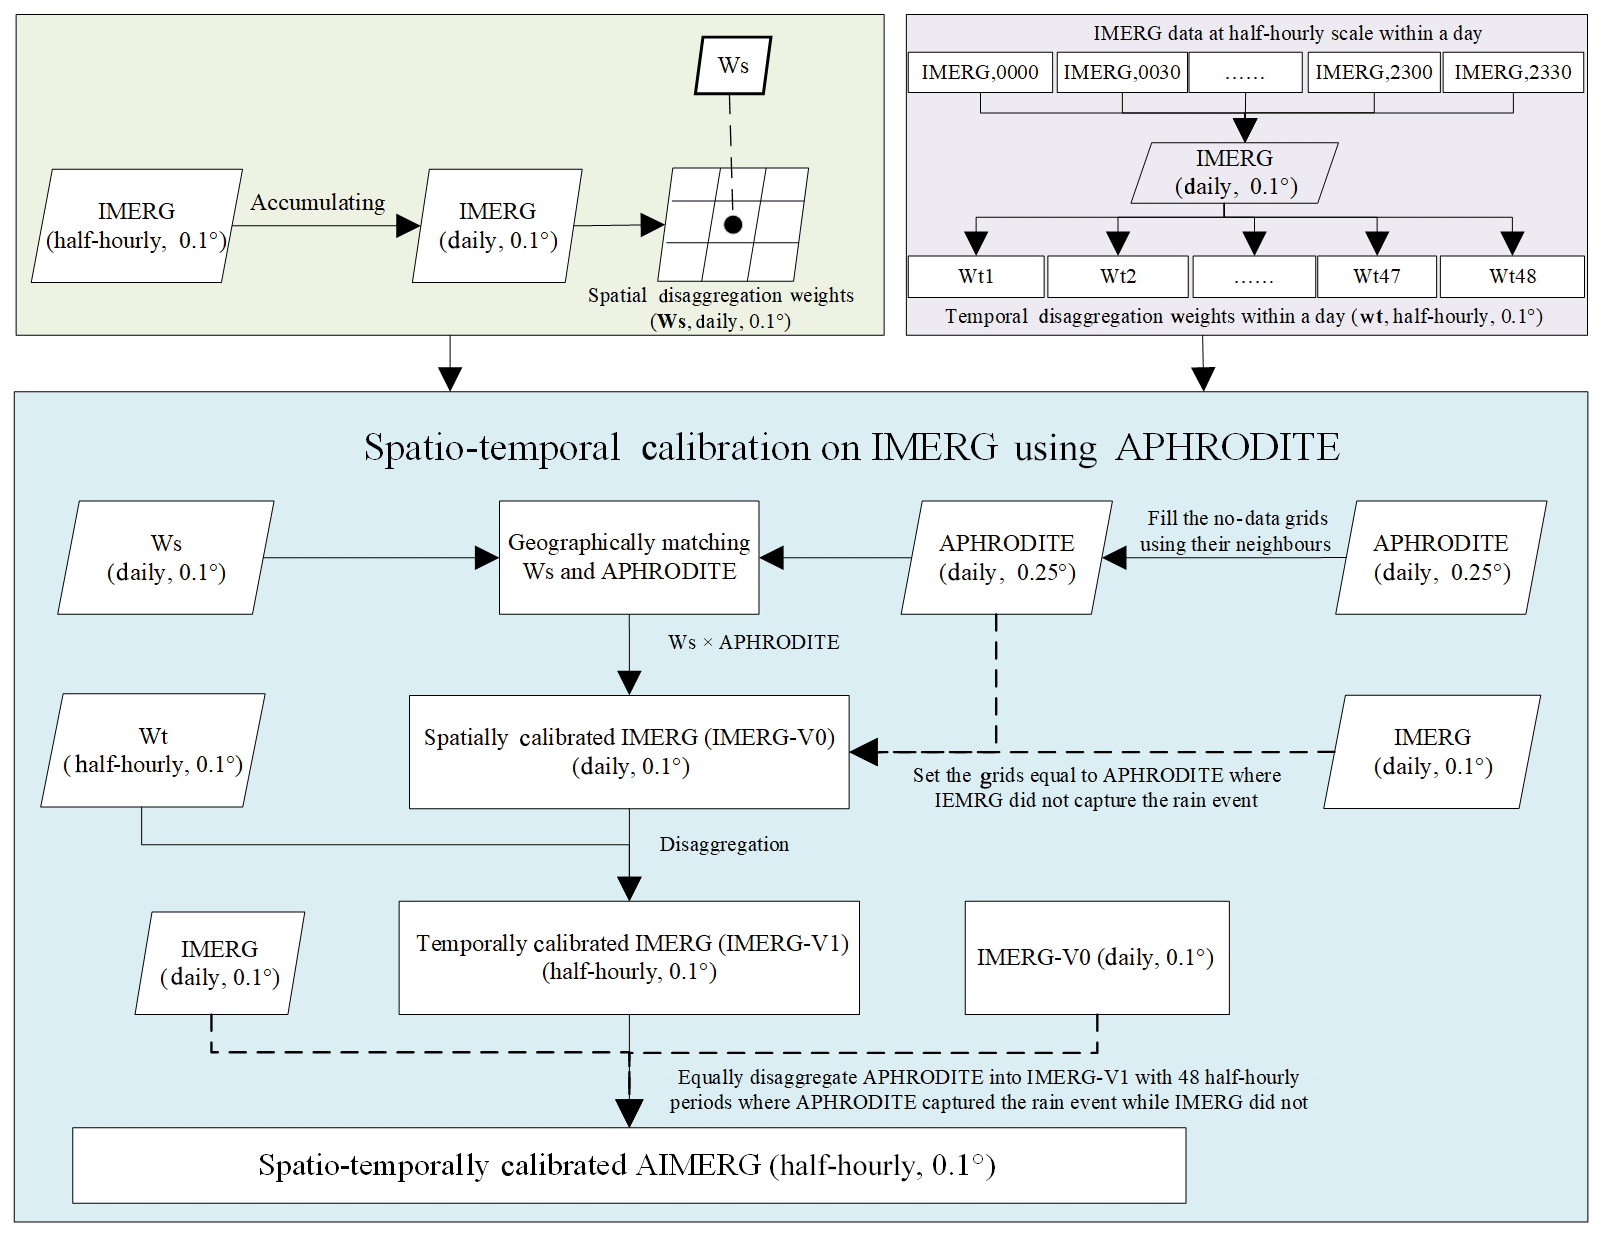
Figure 1The flowchart of the Daily Spatio-Temporal Disaggregation Calibration Algorithm, DSTDCA, to generate the AIMERG dataset over Asia, 2000–2015.
3.2 Evaluation metrics
To evaluate IMERG and its calibrations comprehensively, seven metrics (CC, MAE, BIAS, RMSE, POD, FAR, and CSI) were selected in this study (Tang et al., 2016). Generally, CC is used to describe the agreements between satellite estimates and gauge observations; MAE, RMSE, and BIAS are used to indicate the error and bias of satellite estimates compared with gauge observations; and the POD, FAR, and CSI are used to demonstrate the capabilities to correctly capture the precipitation events of satellite precipitation estimates against the ground observations. The detailed information of these evaluation metrics is listed in Table 2.
Table 2Formulas and perfect values of the evaluation metrics used in this study.
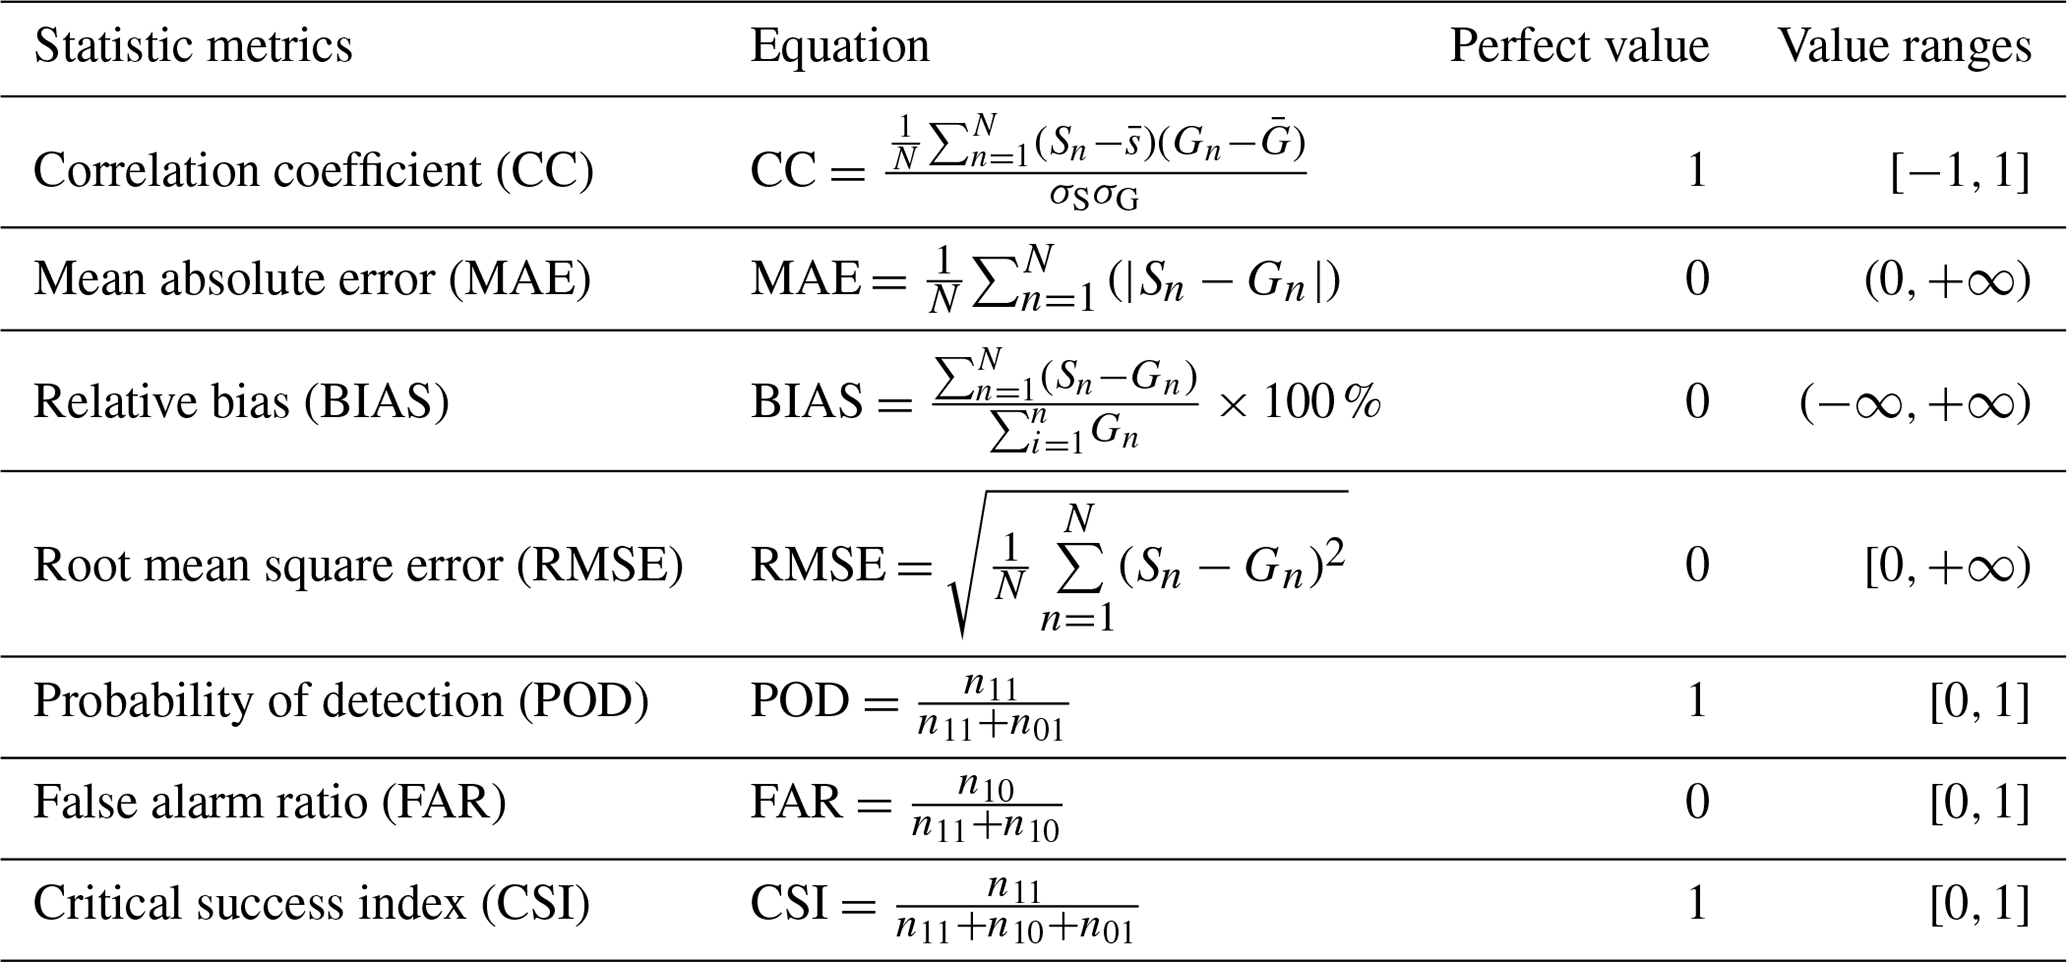
n is the sample numbers; Sn is the satellite precipitation estimate; Gn is gauge-based precipitation; σG is the standard deviations of gauge-based precipitation; σS is the standard deviations of the satellite-based precipitation estimate. n11 is the precipitation event detected by both gauge and satellite simultaneously; n10 is the precipitation event detected by the satellite but not detected by the gauge; n01 is contrary to n10; n00 is the precipitation events detected neither by the gauge nor the satellite.
4.1 IMERG product
Generally, both IMERG and APHRODITE share similar spatial patterns with precipitation volumes decreasing from southeast to northwest in Asia, while compared with APHRODITE data (Fig. 2b), IMERG greatly overestimates the precipitation over Arunachal Pradesh, coastal Indochina and Western Ghats, and Indonesia (Fig. 2a). Corrected by APHRODITE, the spatial patterns and volumes of AIMERG are much more similar to those of APHRODITE, especially along the Himalayas, coastal Indochina and Western Ghats, and Indonesia (Fig. 2c). Compared with APHRODITE, AIMERG seems to float up and down in terms of volume; for instance, AIMERG is larger and smaller than APHRODITE in eastern Indonesia and northeastern Asia, respectively. Though AIMERG is smaller than IMERG over most regions, there are still some areas where the volumes of AIMERG are larger than those of IMERG, e.g. in the western Tibetan Plateau (Fig. 2d).
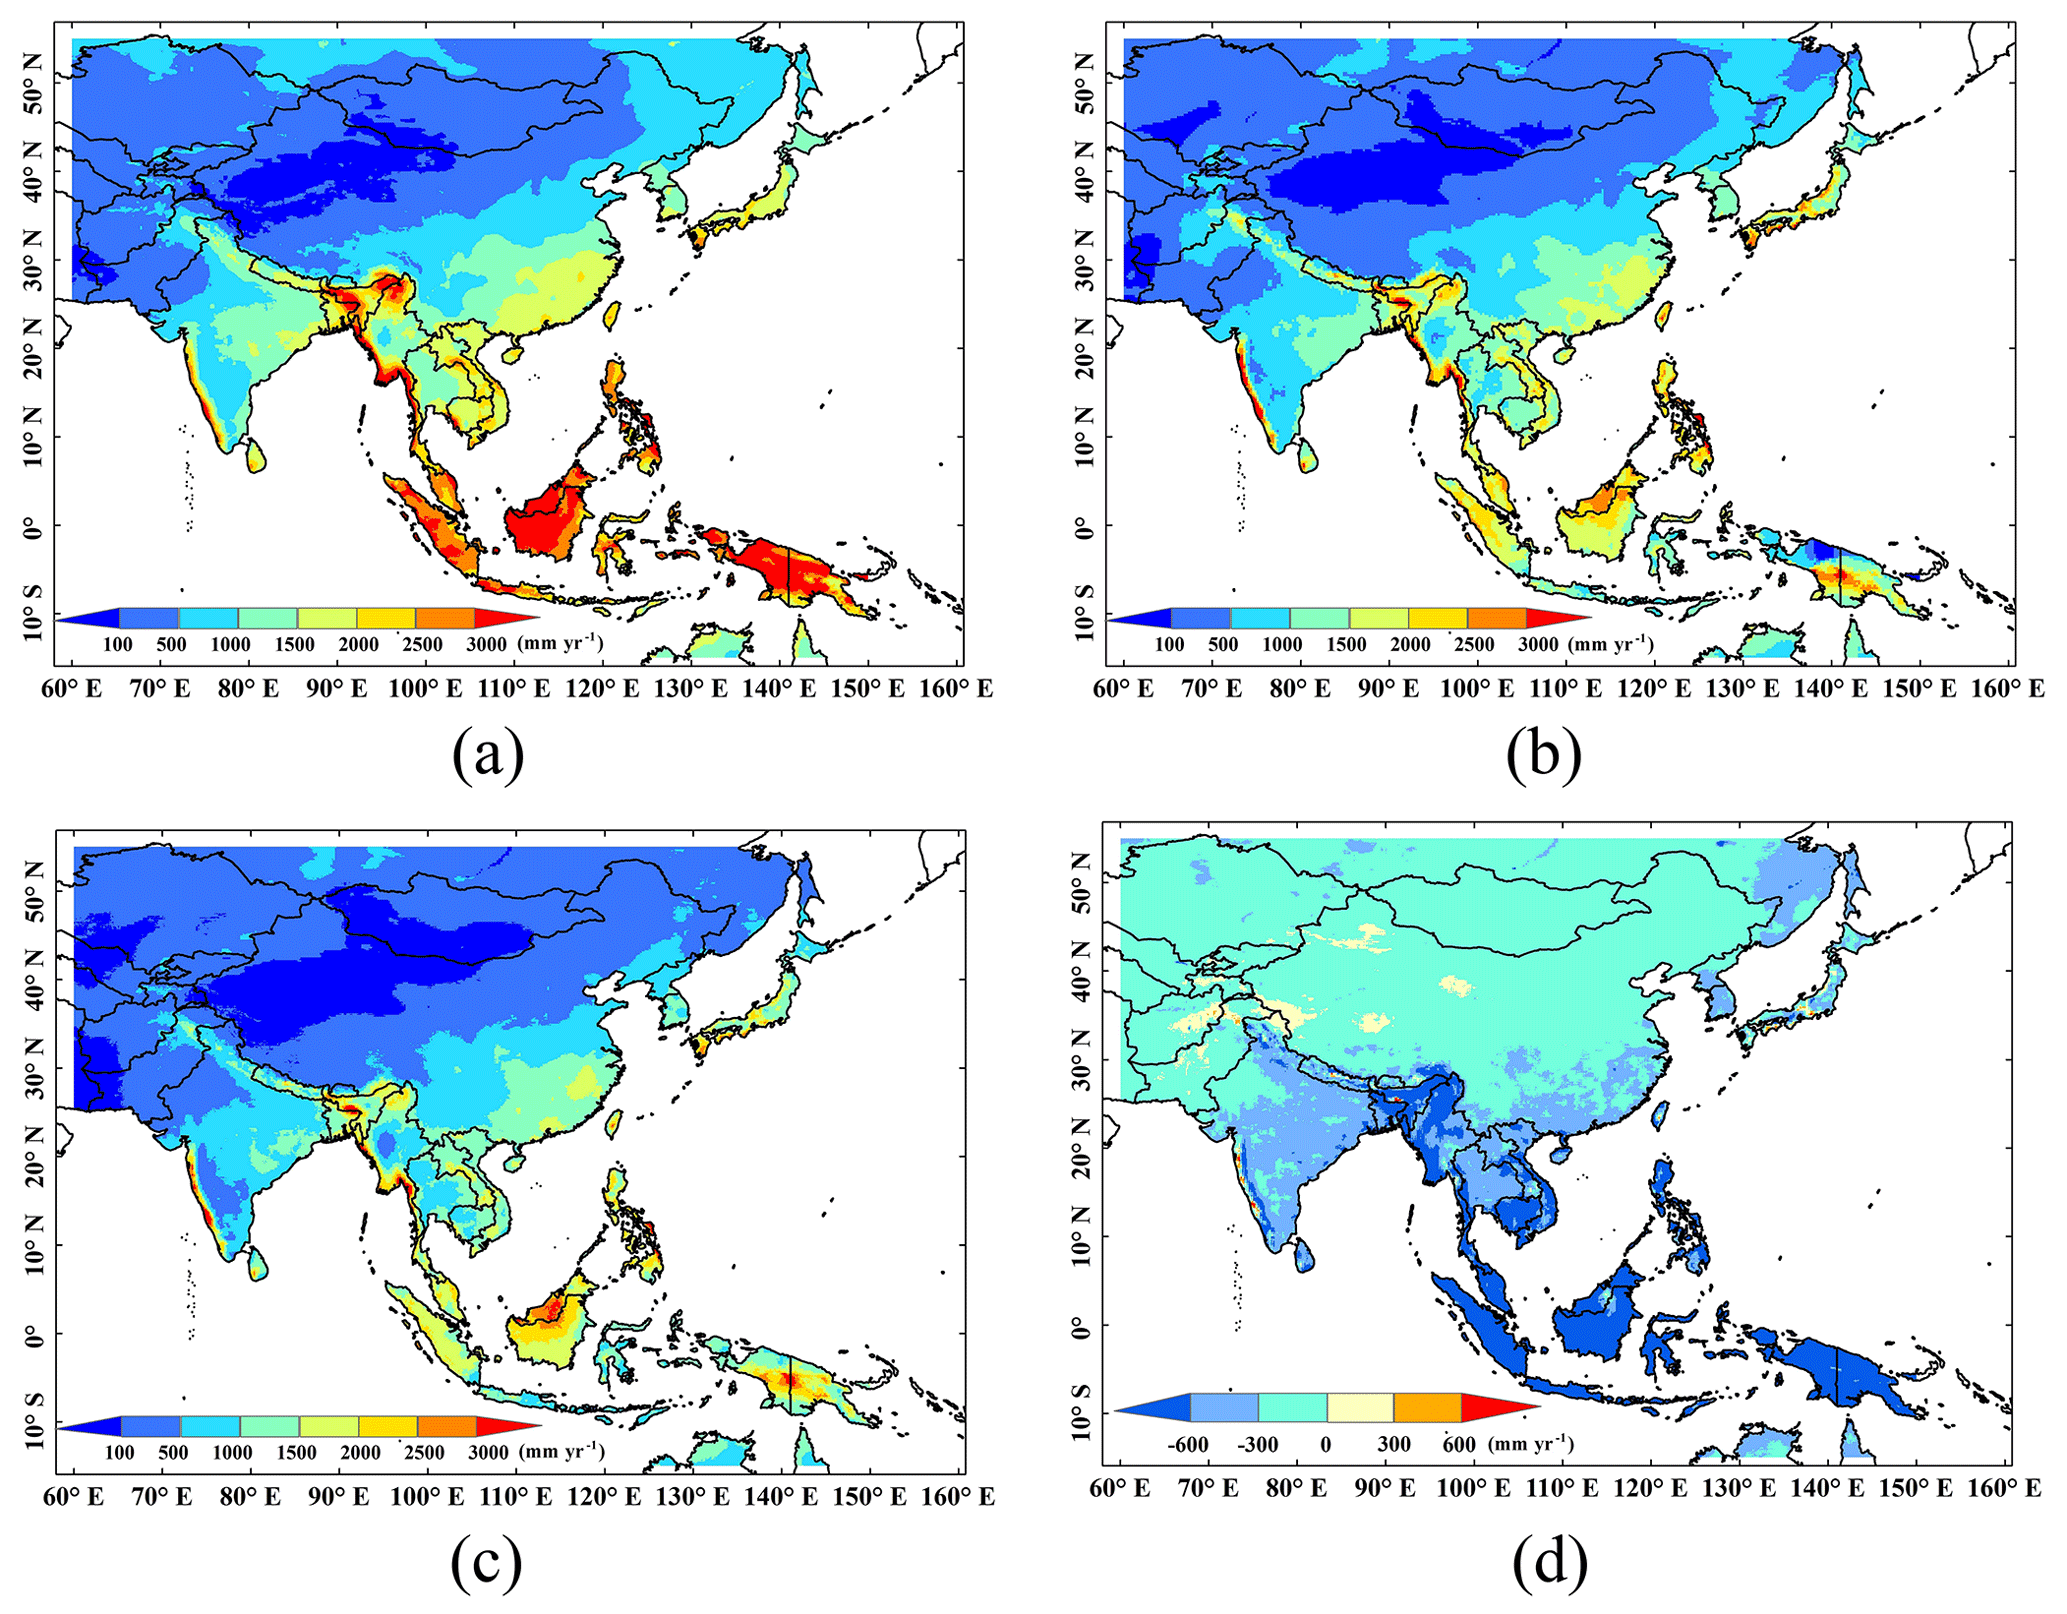
Figure 2Spatial patterns of Asian mean annual gridded precipitation products of (a) IMERG, 0.1∘; (b) APHRODITE, 0.25∘; (c) AIMERG, 0.1∘; and (d) AIMERG-IMERG, 0.1∘, during the period of 2001–2015. For visualization, the spatial maps were generated using ArcGIS 10.3 (http://www.esri.com/software/arcgis/, last access: 1 July 2015).
The temporal patterns of the mean areal precipitation over monsoon Asia of the three products demonstrate that the systematic bias of IMERG is significantly reduced in both dry and wet seasons, shown in Fig. 3. IMERG is around 1.5 times larger than APHRODITE at a monthly scale. Though much more close to APHRODITE, AIMERG is still a little smaller than APHRODITE, which means the calibration algorithm proposed by this study tends to underestimate the precipitation compared with the calibration benchmark, APHRODITE. At a daily scale, IMERG is generally larger than APHRODITE, while in some special days APHRODITE is larger than IMERG, which might result in AIMERG possibly being larger than IMERG.

Figure 3The temporal variations of mean Asian gridded precipitation products of IMERG, APHRODITE, and AIMERG, respectively, during the period of 2001–2015.
4.2 Assessments on IMERG and AIMERG at national and regional scales
The spatial patterns of CMPA are much more similar to those of AIMERG, especially in southeastern China, where dense rain gauges are located, while both CMPA and IMERG overestimate the precipitation along the Himalayas, where the meteorological gauges are sparse and mainly the satellite-based observations are applied (Fig. 4). Obviously, IMERG significantly overestimates the precipitation in the southeast coast of China, where typhoons always occur (Fig. 4b). For deciding the subregions (Fig. 4d), we have mainly considered three aspects: the representative climatic zones in China, the local distributions of the gauge stations, and the complexity of the topography. For instances, subregion 1 represents the high-latitude plain in the most north-eastern region of China under a cold climate (top left: 54.0∘ N, 115.0∘ E; bottom right: 47.0∘ N, 135.0∘ E); subregion 2 represents the south-eastern coastal area of China influenced greatly by the Asian monsoons (top left: 26.0∘ N, 115.0∘ E; bottom left: 24.0∘ N, 119.0∘ E; bottom right: 31.0∘ N, 124.0∘ E; top right: 34.0∘ N, 120.0∘ E); subregion 3 represents the most southern region including the island of Hainan in the tropical zone (top left: 24.0∘ N, 105.0∘ E; bottom right: 18.0∘ N, 115.0∘ E); subregion 4 represents the inner area of China covering the Yunnan–Kweichow Plateau (also known as the Yunnan–Guizhou Plateau) and Sichuan Basin, under a humid inland climate (top left: 33.0∘ N, 100.0∘ E; bottom right: 27.0∘ N, 107.0∘ E); subregion 5 represents the most southern Tibetan Plateau along the Himalayas with complex terrains and high elevations above ∼4000.0 m (top left: 33.0∘ N, 80.0∘ E; bottom right: 27.0∘ N, 95.0∘ E); subregion 6 represents central Asia with complex terrains covering the entire Tian Shan in China under an arid inland climate (top left: 45.0∘ N, 80.0∘ E; bottom right: 40.0∘ N, 92.0∘ E).
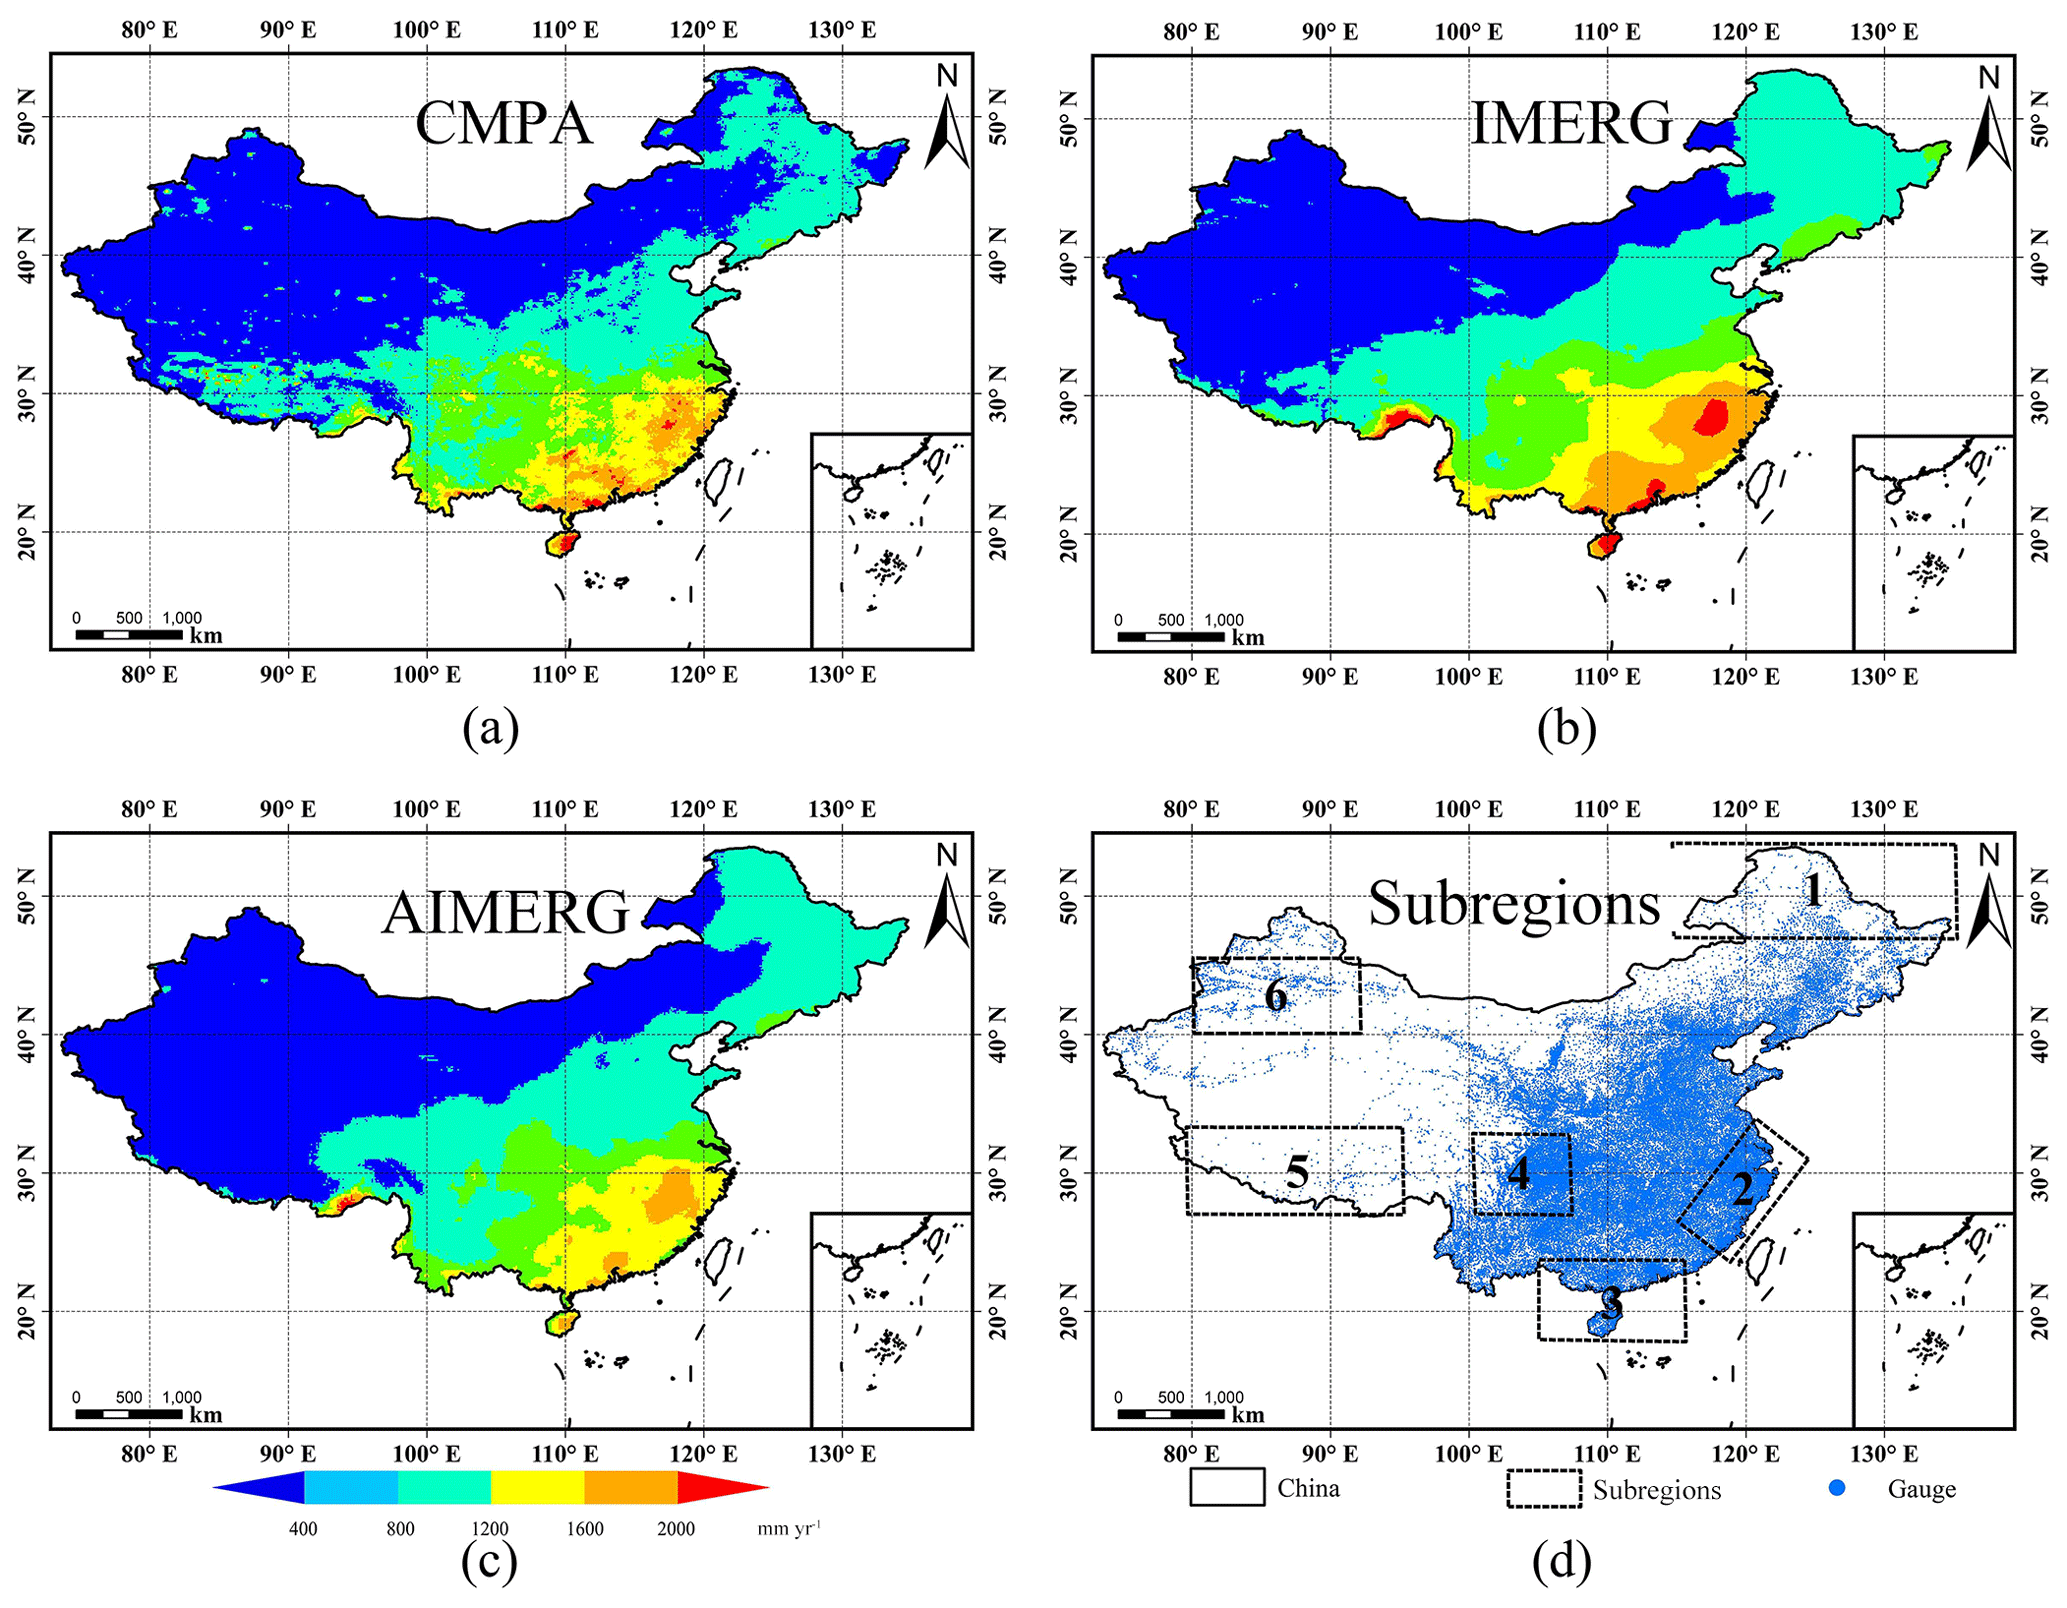
Figure 4Spatial patterns of (a) CMPA, (b) IMERG, and (c) AIMERG over mainland China from 2008 to 2015, and (d) the spatial distributions of more than 50 000 automatic meteorological stations in mainland China. The accurate boundary information of the subregion: subregion 1 (top left: 54.0∘ N, 115.0∘ E; bottom right: 47.0∘ N, 135.0∘ E); subregion 2 (top left: 26.0∘ N, 115.0∘ E; bottom left: 24.0∘ N, 119.0∘ E; bottom right: 31.0∘ N, 124.0∘ E; top right: 34.0∘ N, 120.0∘ E); subregion 3 (top left: 24.0∘ N, 105.0∘ E; bottom right: 18.0∘ N, 115.0∘ E); subregion 4 (top left: 33.0∘ N, 100.0∘ E; bottom right: 27.0∘ N, 107.0∘ E); subregion 5 (top left: 33.0∘ N, 80.0∘ E; bottom right: 27.0∘ N, 95.0∘ E); subregion 6 (top left: 45.0∘ N, 80.0∘ E; bottom right: 40.0∘ N, 92.0∘ E). For visualization, the spatial maps were generated using ArcGIS 10.3 (http://www.esri.com/software/arcgis/, last access: 1 July 2015). Publisher's remark: Please note that the above figure contains disputed territories.
The magnitudes of IMERG, AIMERG, and CMPA are compared at the national and regional scale over mainland China from 2008 to 2015 (Fig. 5). Generally speaking, CMPA and AIMERG are almost the same and are significantly smaller than IMERG at both annual and monthly scales. Additionally, CMPA is still a little larger than AIMERG over mainland China, which could possibly be a result of the use of satellite observations in CMPA and IMERG (Fig. 6a). The overall situations of the three product in subregion 1 and 2 are similar to those over mainland China (Fig. 6b–c), while both CMPA and IMERG are significantly larger than AIMERG (Fig. 6d–f). In subregion 6, the Tian Shan, CMPA is almost larger than IMERG, which indicates that large uncertainties should be focused on subregion 6 (Fig. 6g).
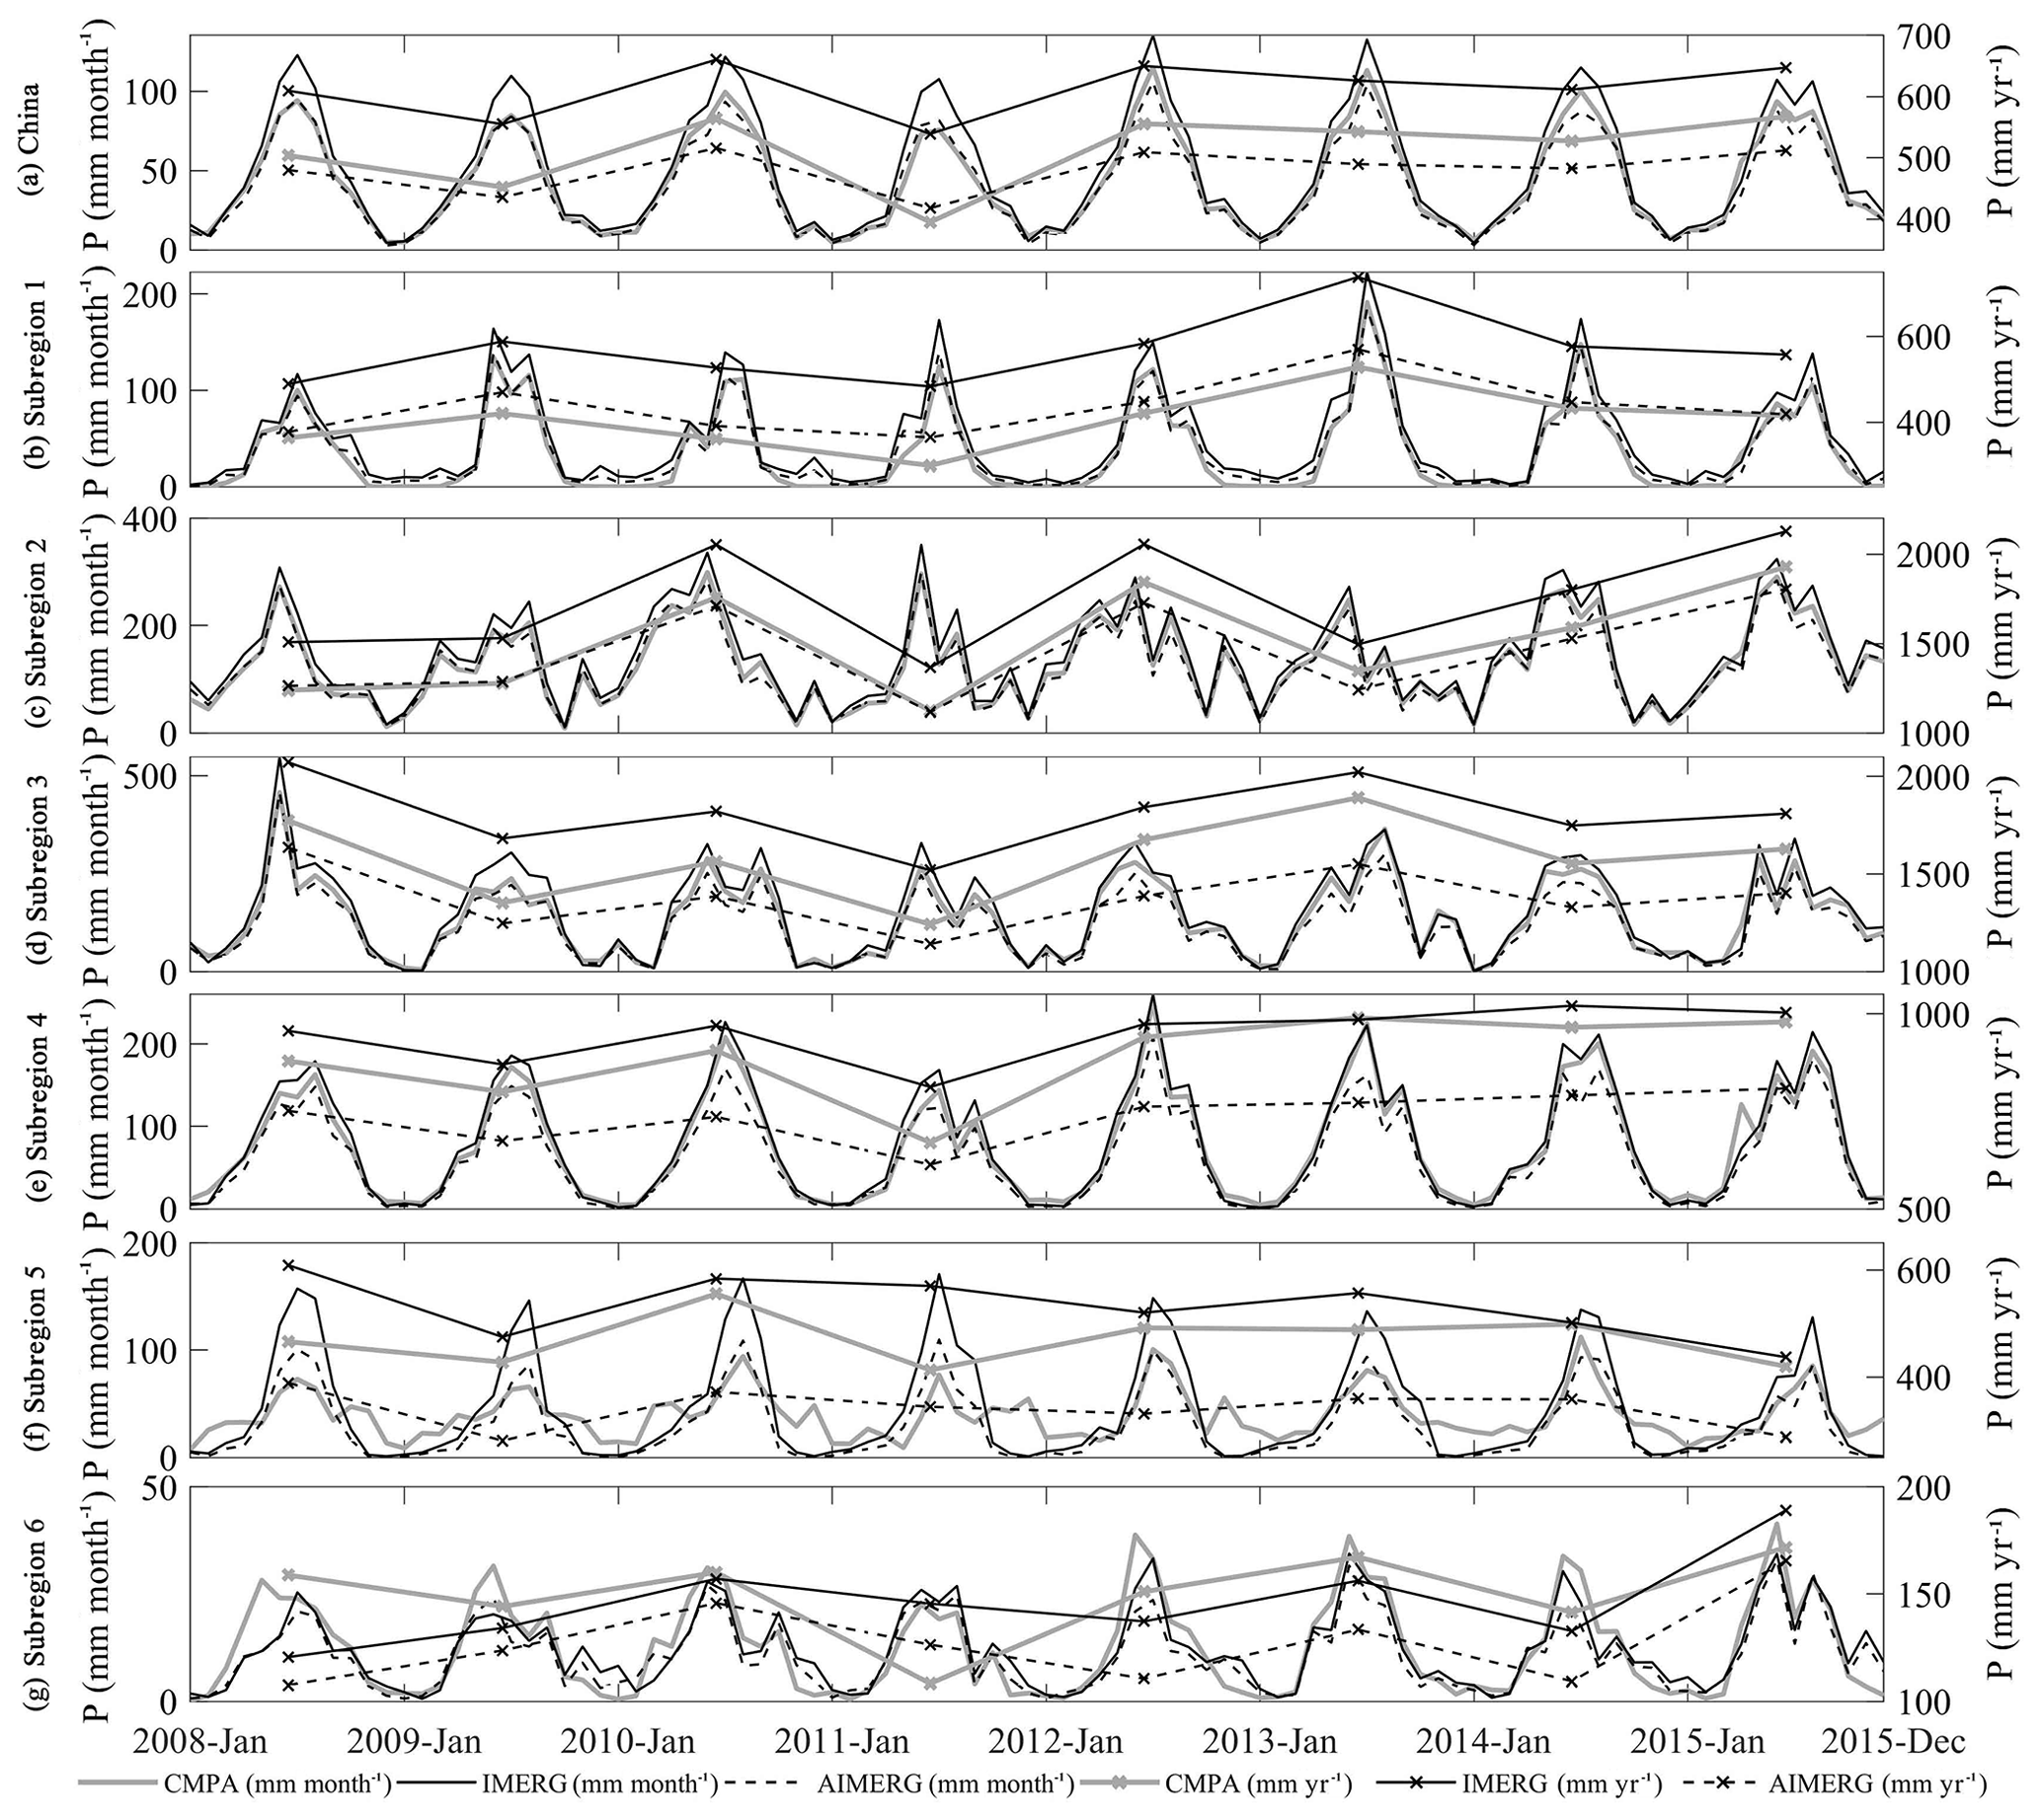
Figure 5The temporal patterns of mean areal precipitation of IMERG, CMPA, and AIMERG over mainland China and subregions from 2008 to 2015, at monthly and annual scales.
As this study aims to propose a new algorithm for calibrating the IMERG product at the daily scale, the daily spatial patterns of IMERG, CMPA, and AIMERG have also been explored, which generally agree with those of IMERG, CMPA, and AIMERG at a monthly scale (Fig. 6). In mountainous region, along the Himalayas, with relatively small precipitation, CMPA is much larger and smaller than the other two products (both IMERG and AIMERG) in dry seasons and wet seasons respectively (Fig. 6f). One phenomenon that should be noted is that CMPA seems abnormal along the Himalayas, which might be a result of the limited ground observations used in CMPA, shown in Fig. 4d, while APHRODITE data integrate large numbers of ground observations from the neighbour countries, such as India, Nepal, and Bhutan, providing valuable information for retrieving a high-quality precipitation product around the Tibetan Plateau (Yatagai, 2012). Calibrated by APHRODITE at a daily scale, AIMERG is significantly smaller than IMERG and CMPA at annual and monthly scales, while there are also some situations in which AIMERG is larger than IMERG and CMPA at a daily scale, e.g. in subregion 6 over the Tian Shan.
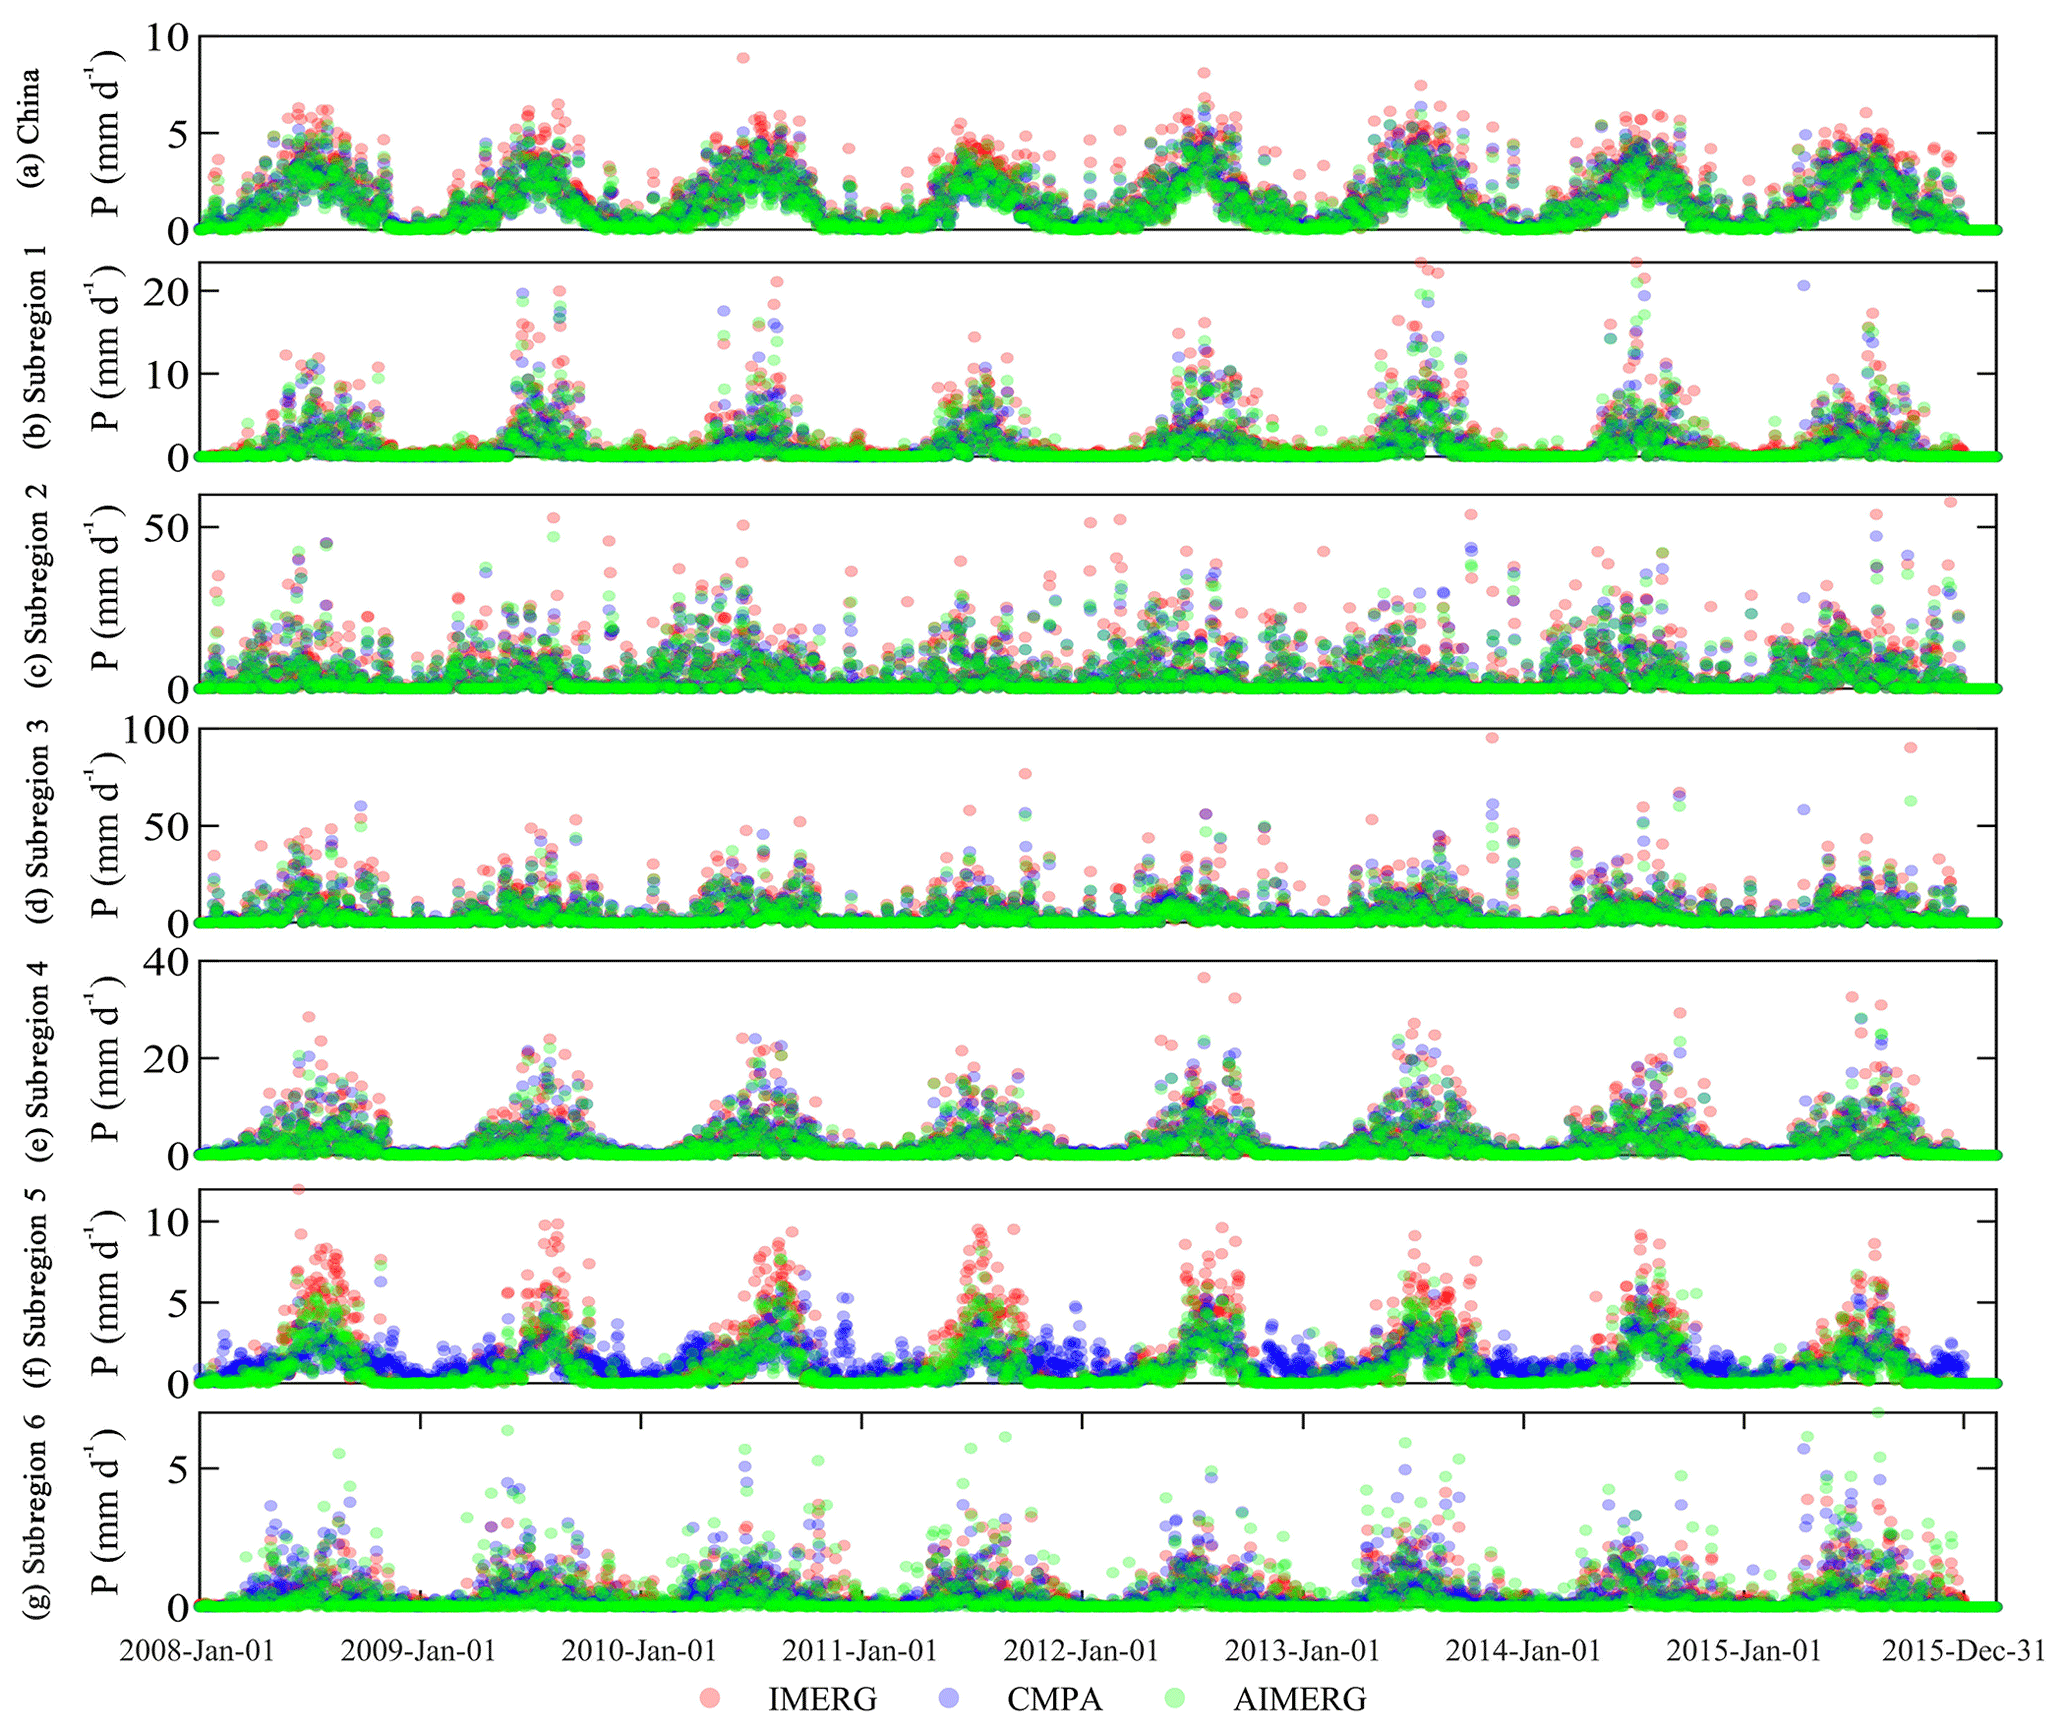
Figure 6The temporal patterns of mean areal precipitation of IMERG, CMPA, and AIMERG over mainland China and subregions from 2008 to 2015, at a daily scale.
Hourly ground observation data from more than 50 000 meteorological stations were used to assess the quality of IMERG and its calibrations, AIMERG, over the six subregions in 2015 (Fig. 7). The temporal patterns and volumes of mean areal precipitation by AIMERG and ground observations are almost the same, while IMERG is generally larger than AIMERG and ground observations. Meanwhile, IMERG still the problems in overestimating and underestimating the precipitation in dry seasons (relatively large precipitation occurring) and wet seasons (relatively small precipitation happening), respectively, e.g. in subregion 6, over the Tian Shan. In terms of quantitative indices (standard deviation, RMSD, and CC), AIMERG generally outperforms IMERG against the ground observations, especially in subregion 5, along the Himalayas, which indicates that the ground information from the neighbour countries integrated into the APHRODITE data greatly benefits the calibration results, AIMERG.

Figure 7The temporal patterns and the volumes of IMERG, ground observations, and AIMERG in six subregions at a daily scale, and the Taylor diagrams of performances on IMERG and AIMERG against ground observations in terms of the centred root-mean-square difference, correlation coefficient, and standard deviation in the six subregions at an hourly scale in 2015.
Figure 8 illustrates the numerical distributions of contingency statistics for IMERG and AIMERG at an hourly scale in six subregions in 2015. Generally, the POD values of AIMERG are larger than those of IMERG (Fig. 8a), and FAR values of AIMERG are overall smaller than those of IMERG in each subregion (Fig. 8b), which results in better performances of the comprehensive index, CSI, combining both the characteristics of POD and FAR, in each subregion (Fig. 8c). Additionally, both IMERG and AIMERG perform best in subregion 2 and worst in subregion 3.
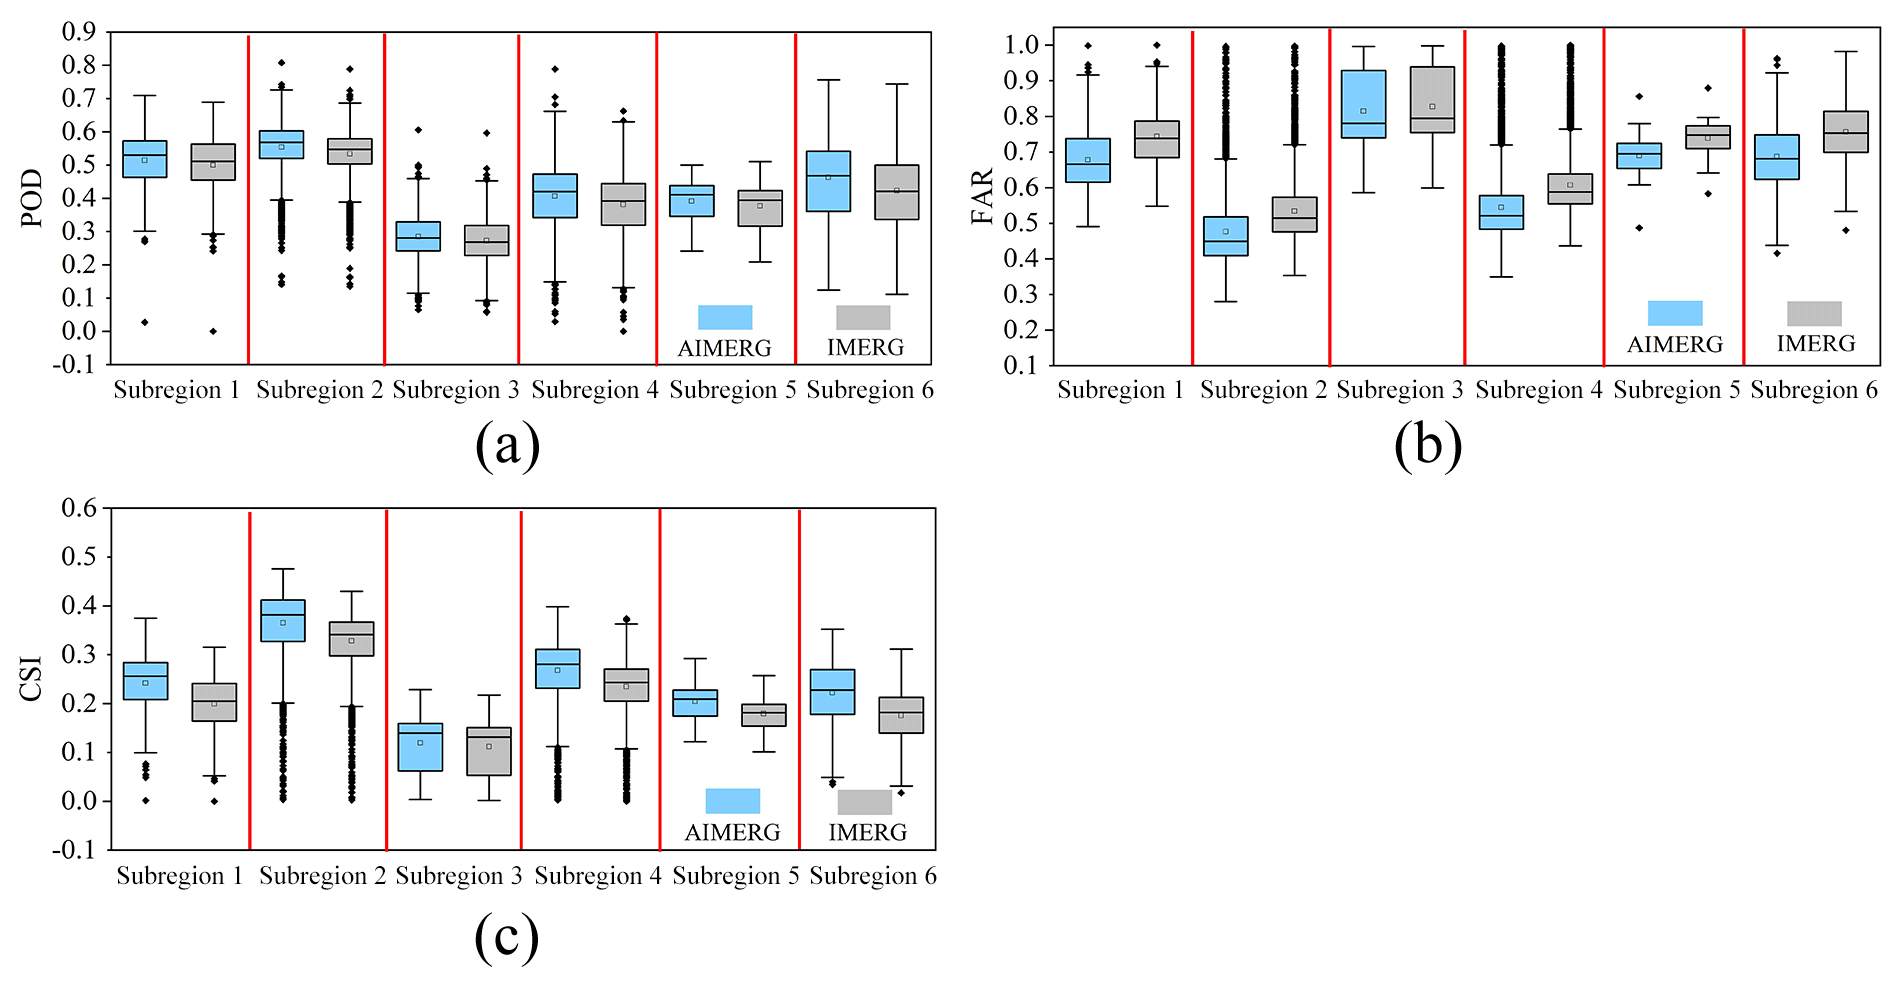
Figure 8The boxplots demonstrate results of the precipitation events by IMERG and AIMERG against the ground observations from the meteorological stations at an hourly scale in six subregions in 2015.
To assess the quality of IMERG and AIMERG, entirely independent precipitation data from around 500 hydrological stations at an hourly scale, from 2010 to 2015, were applied, which are relatively evenly distributed in the Zhejiang province (Fig. 9a). The POD values of AIMERG (∼0.9) are generally larger than those of IMERG (∼0.8), while the FAR values of AIMERG (∼0.3) are significantly smaller than those of IMERG (∼0.4), which results in the overall capabilities of AIMERG to capture the precipitation events being improved by more than 10 %, compared to IMERG, in terms of the CSI. The relatively smaller POD values and larger FAR values of IMERG in the Zhejiang province, southeastern coast of China, might be one of the potential drawbacks in accurately estimating the precipitation both qualitatively and quantitatively.
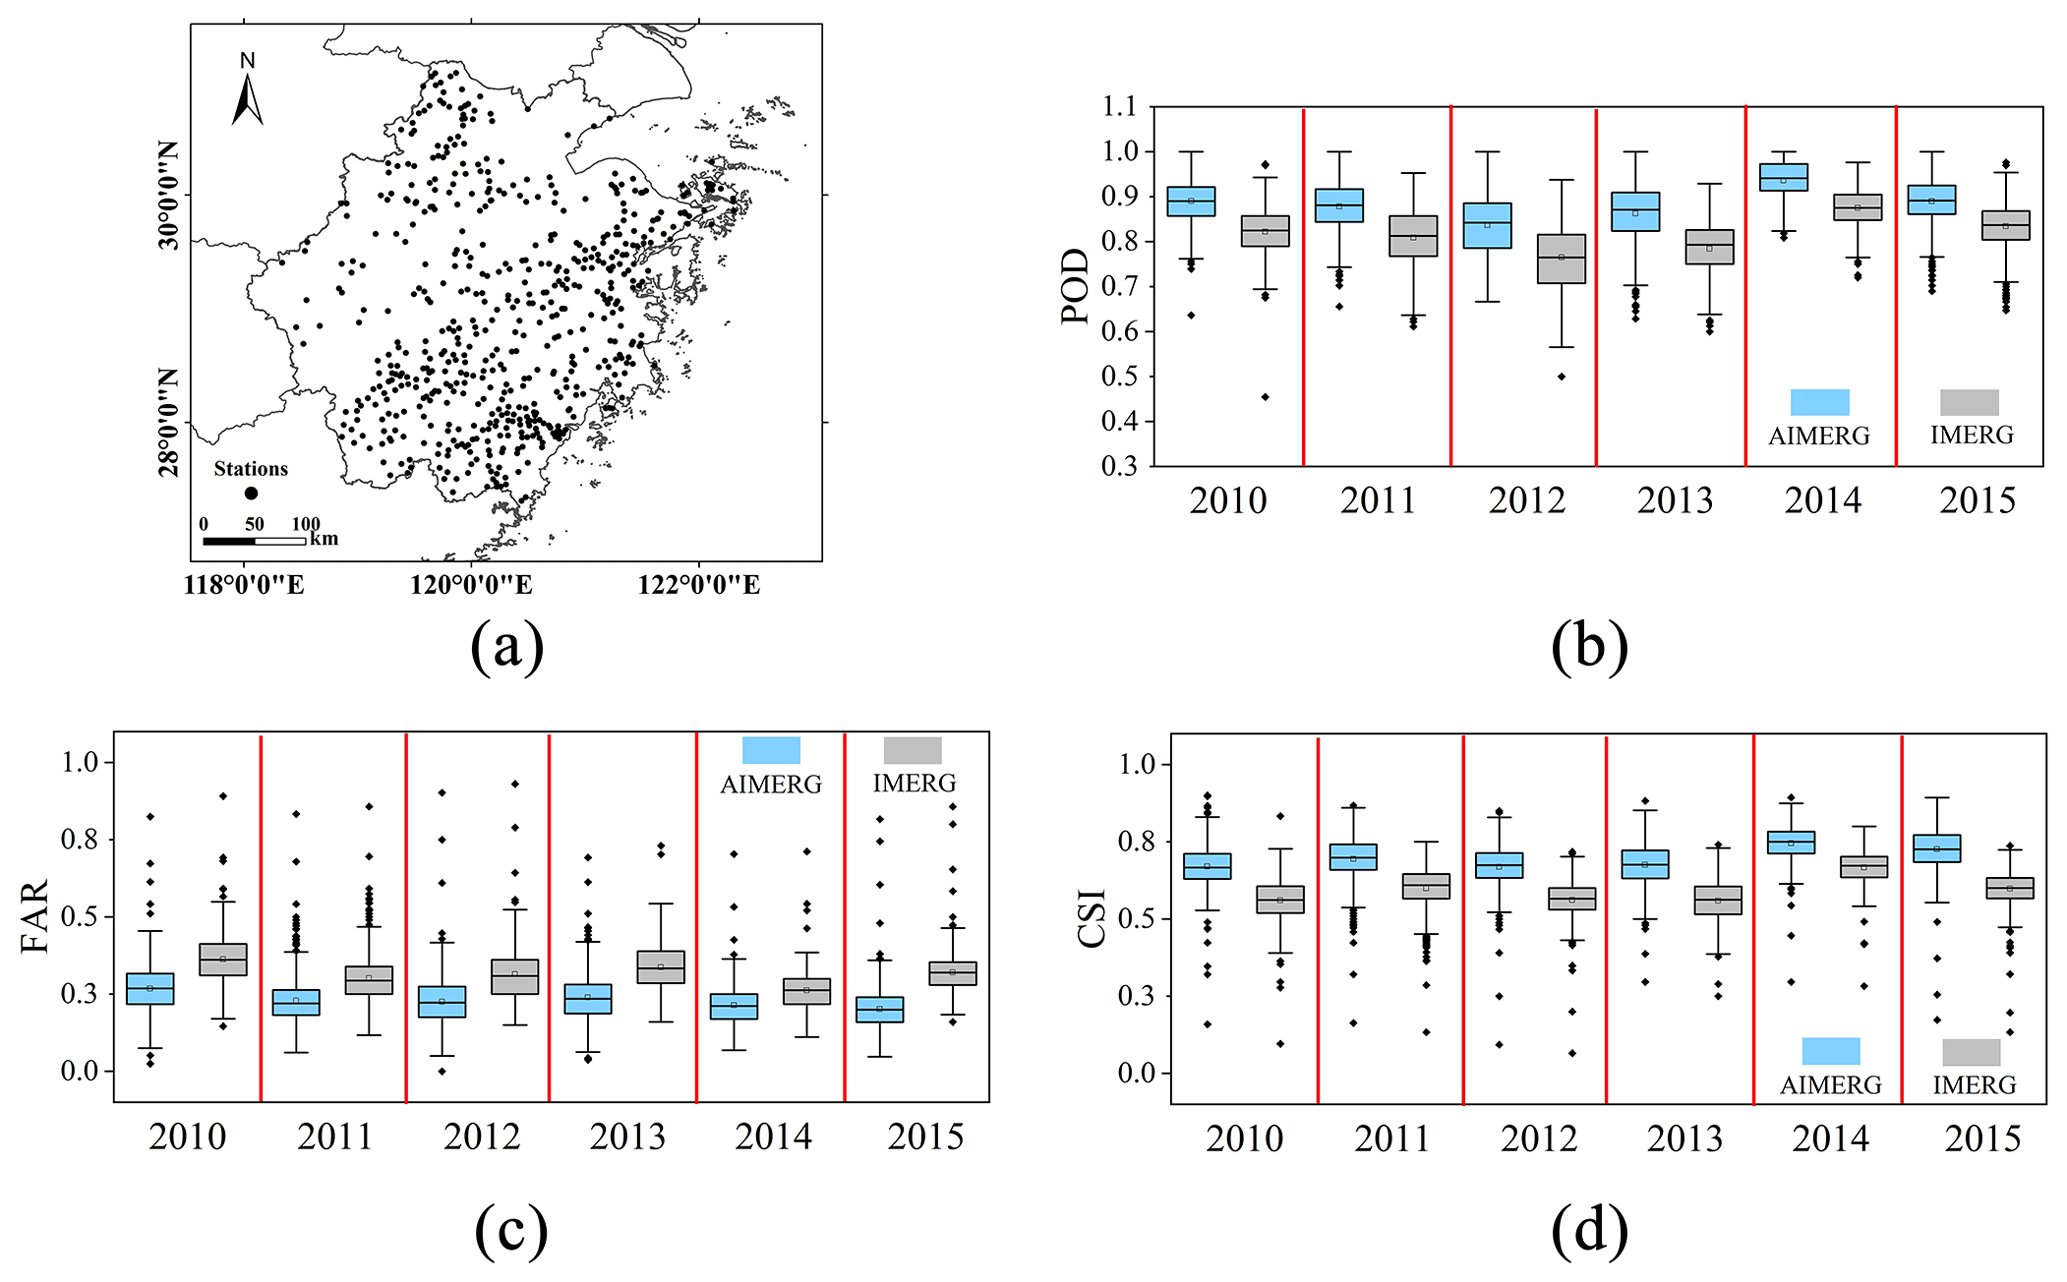
Figure 9The boxplots demonstrate results of the precipitation events by IMERG and AIMERG against the ground observations from hydrological stations, respectively, at an hourly scale in the Zhejiang province in 2010–2015. For visualization, the spatial maps were generated using ArcGIS 10.3 (http://www.esri.com/software/arcgis/).
From the temporal patterns of mean areal precipitation of IMERG, AIMERG, and ground observations from hydrological stations in the Zhejiang province in 2010–2015 (Fig. 10), IMERG is generally larger than both AIMERG and ground observations. For instance, IMERG significantly overestimates the precipitation with up to 10 times that of AIMERG and ground observations, such as in the typical periods 00:00 on 11 June to 00:00 on 14 June 2015 and 00:00 on 29 August to 00:00 on 1 September 2015. Additionally, both the temporal patterns and the magnitudes of AIMERG are almost same as those of ground observations, compared with those of IMERG. Meanwhile, in some pentads with the heavy rain events, both AIMERG and ground observations are larger than IMERG.
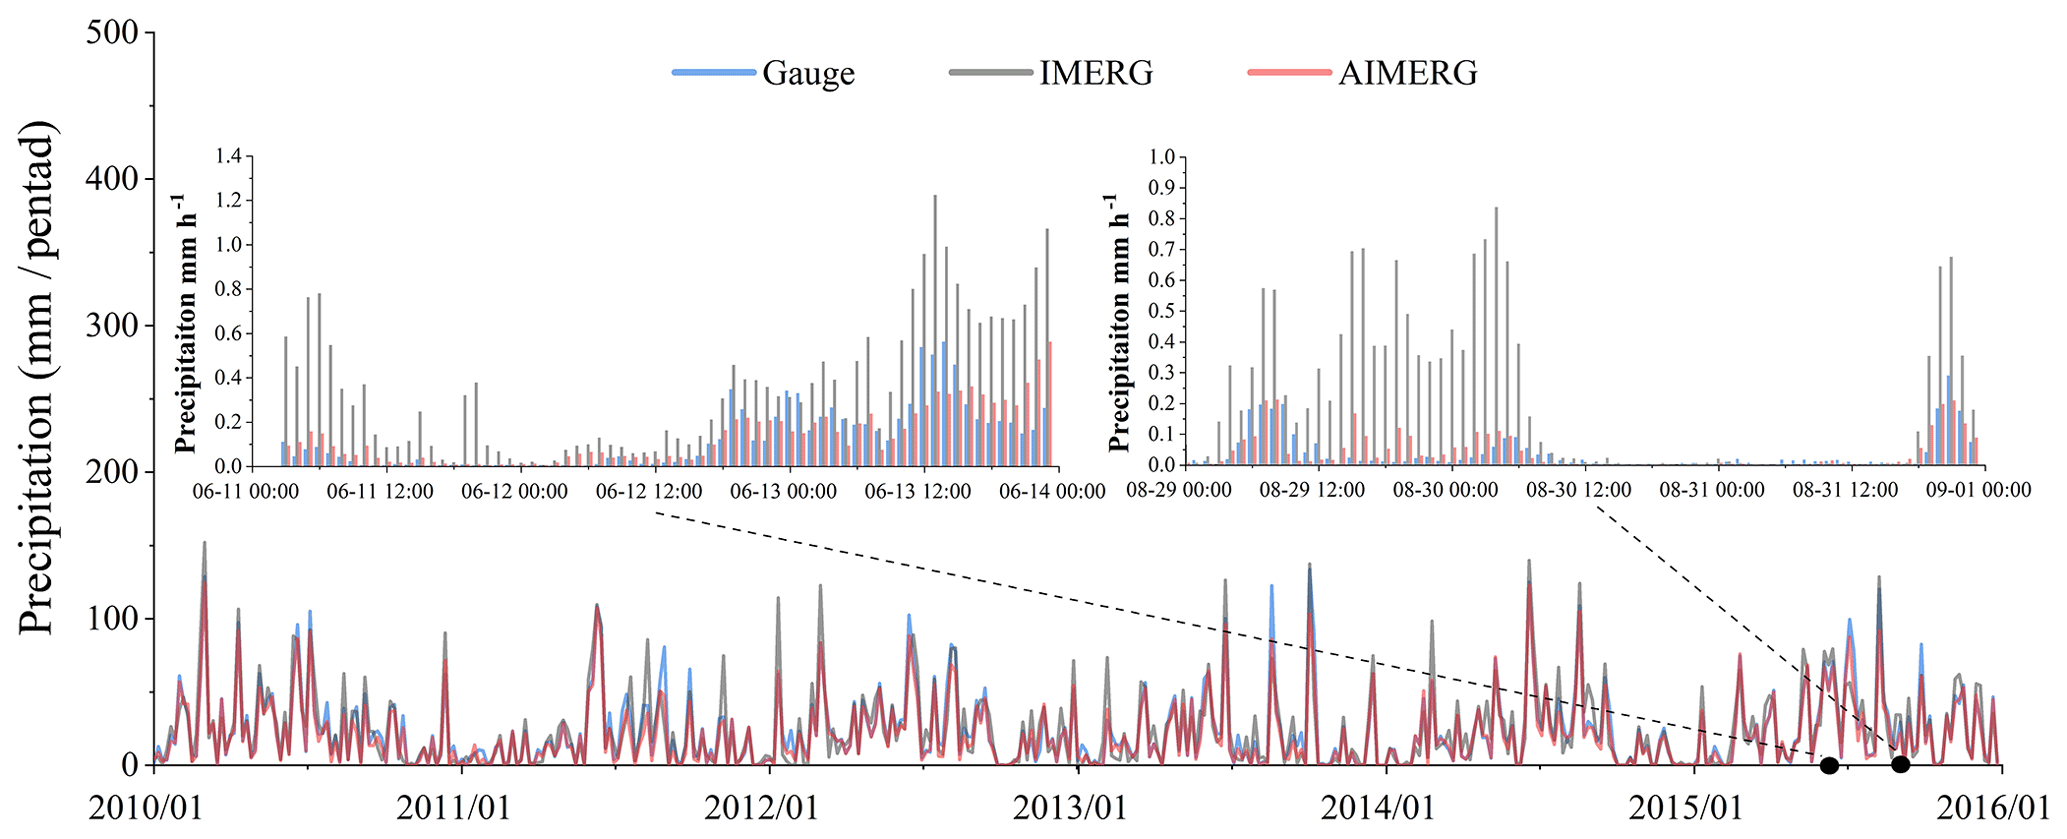
Figure 10The temporal patterns of mean areal precipitation of IMERG, AIMERG, and the ground observations from the independent hydrological stations at a daily/hourly scale in the Zhejiang province in 2010–2015.
4.3 The performances of AIMERG and other products in capturing the heavy rainfall event
One of the primary aims of the satellite-based precipitation estimates is to provide the high-quality rainfall information, accurately capturing both the spatial patterns and volumes of the rainfall at an hourly scale during the heavy rainfall events. Recently, Tang et al. (2020) has conducted a comprehensive comparison of the GPM-era IMERG with nine other state-of-the-art high-resolution precipitation products, six satellite-based precipitation products (TRMM 3B42, 0.25∘/3 h; CMORPH, 0.25∘/3 h; PERSIANN-CDR, 0.25∘/1 d; GSMaP, 0.1∘/1 h; CHIRPS, 0.05∘/1 d; SM2RAIN, 0.25∘/1 d), and three reanalysis datasets (ERA5, ∼0.25∘/1 h; ERA-Interim, ∼0.75∘/3 h; MERRA2, /1 h) from 2000 to 2018 and found that the IMERG product generally outperformed other datasets, except the Global Satellite Mapping of Precipitation (GSMaP), which was adjusted at the daily scale by the gauge analysis (0.5∘/daily) from the CPC (Mega et al., 2014). Therefore, we have quantitatively and horizontally compared AIMERG with GSMaP, as well as IMERG against ground observations.
In this study, the typhoon, Chan-hom, is selected as an example for assessing the quality of AIMERG and other products, which occurred in the typical period 00:00–11:00 on 11 July 2015 in the Zhejiang province (Fig. 11a–d). Generally, the spatial patterns of IMERG, GSMaP, AIMERG are similar to those of the ground observations, with the increasing volumes of rainfall from the southwest to the northeast. In terms of the three satellite-based rainfall estimates, IMERG underestimates the rainfall more than those of GSMaP and AIMERG in the heavy rainfall events (Fig. 11b), with largest regions in the southwestern Zhejiang (rainfall <10 mm h−1). Though GSMaP estimates the rainfall more than IMERG in both spatial coverages and volumes (Fig. 11c), AIMERG provides much more details than GSMaP, especially over the northeastern Zhejiang province (Fig. 11c). As pointed out by various studies (e.g. Tang et al., 2020), the satellite-based precipitation products generally overestimate the volumes in small rainfall events but underestimate the volumes during the heavy rainfall events. From this aspect, AIMERG outperforms the GSMaP as well as the original IMERG, owing to the daily calibrations using the ground observations.
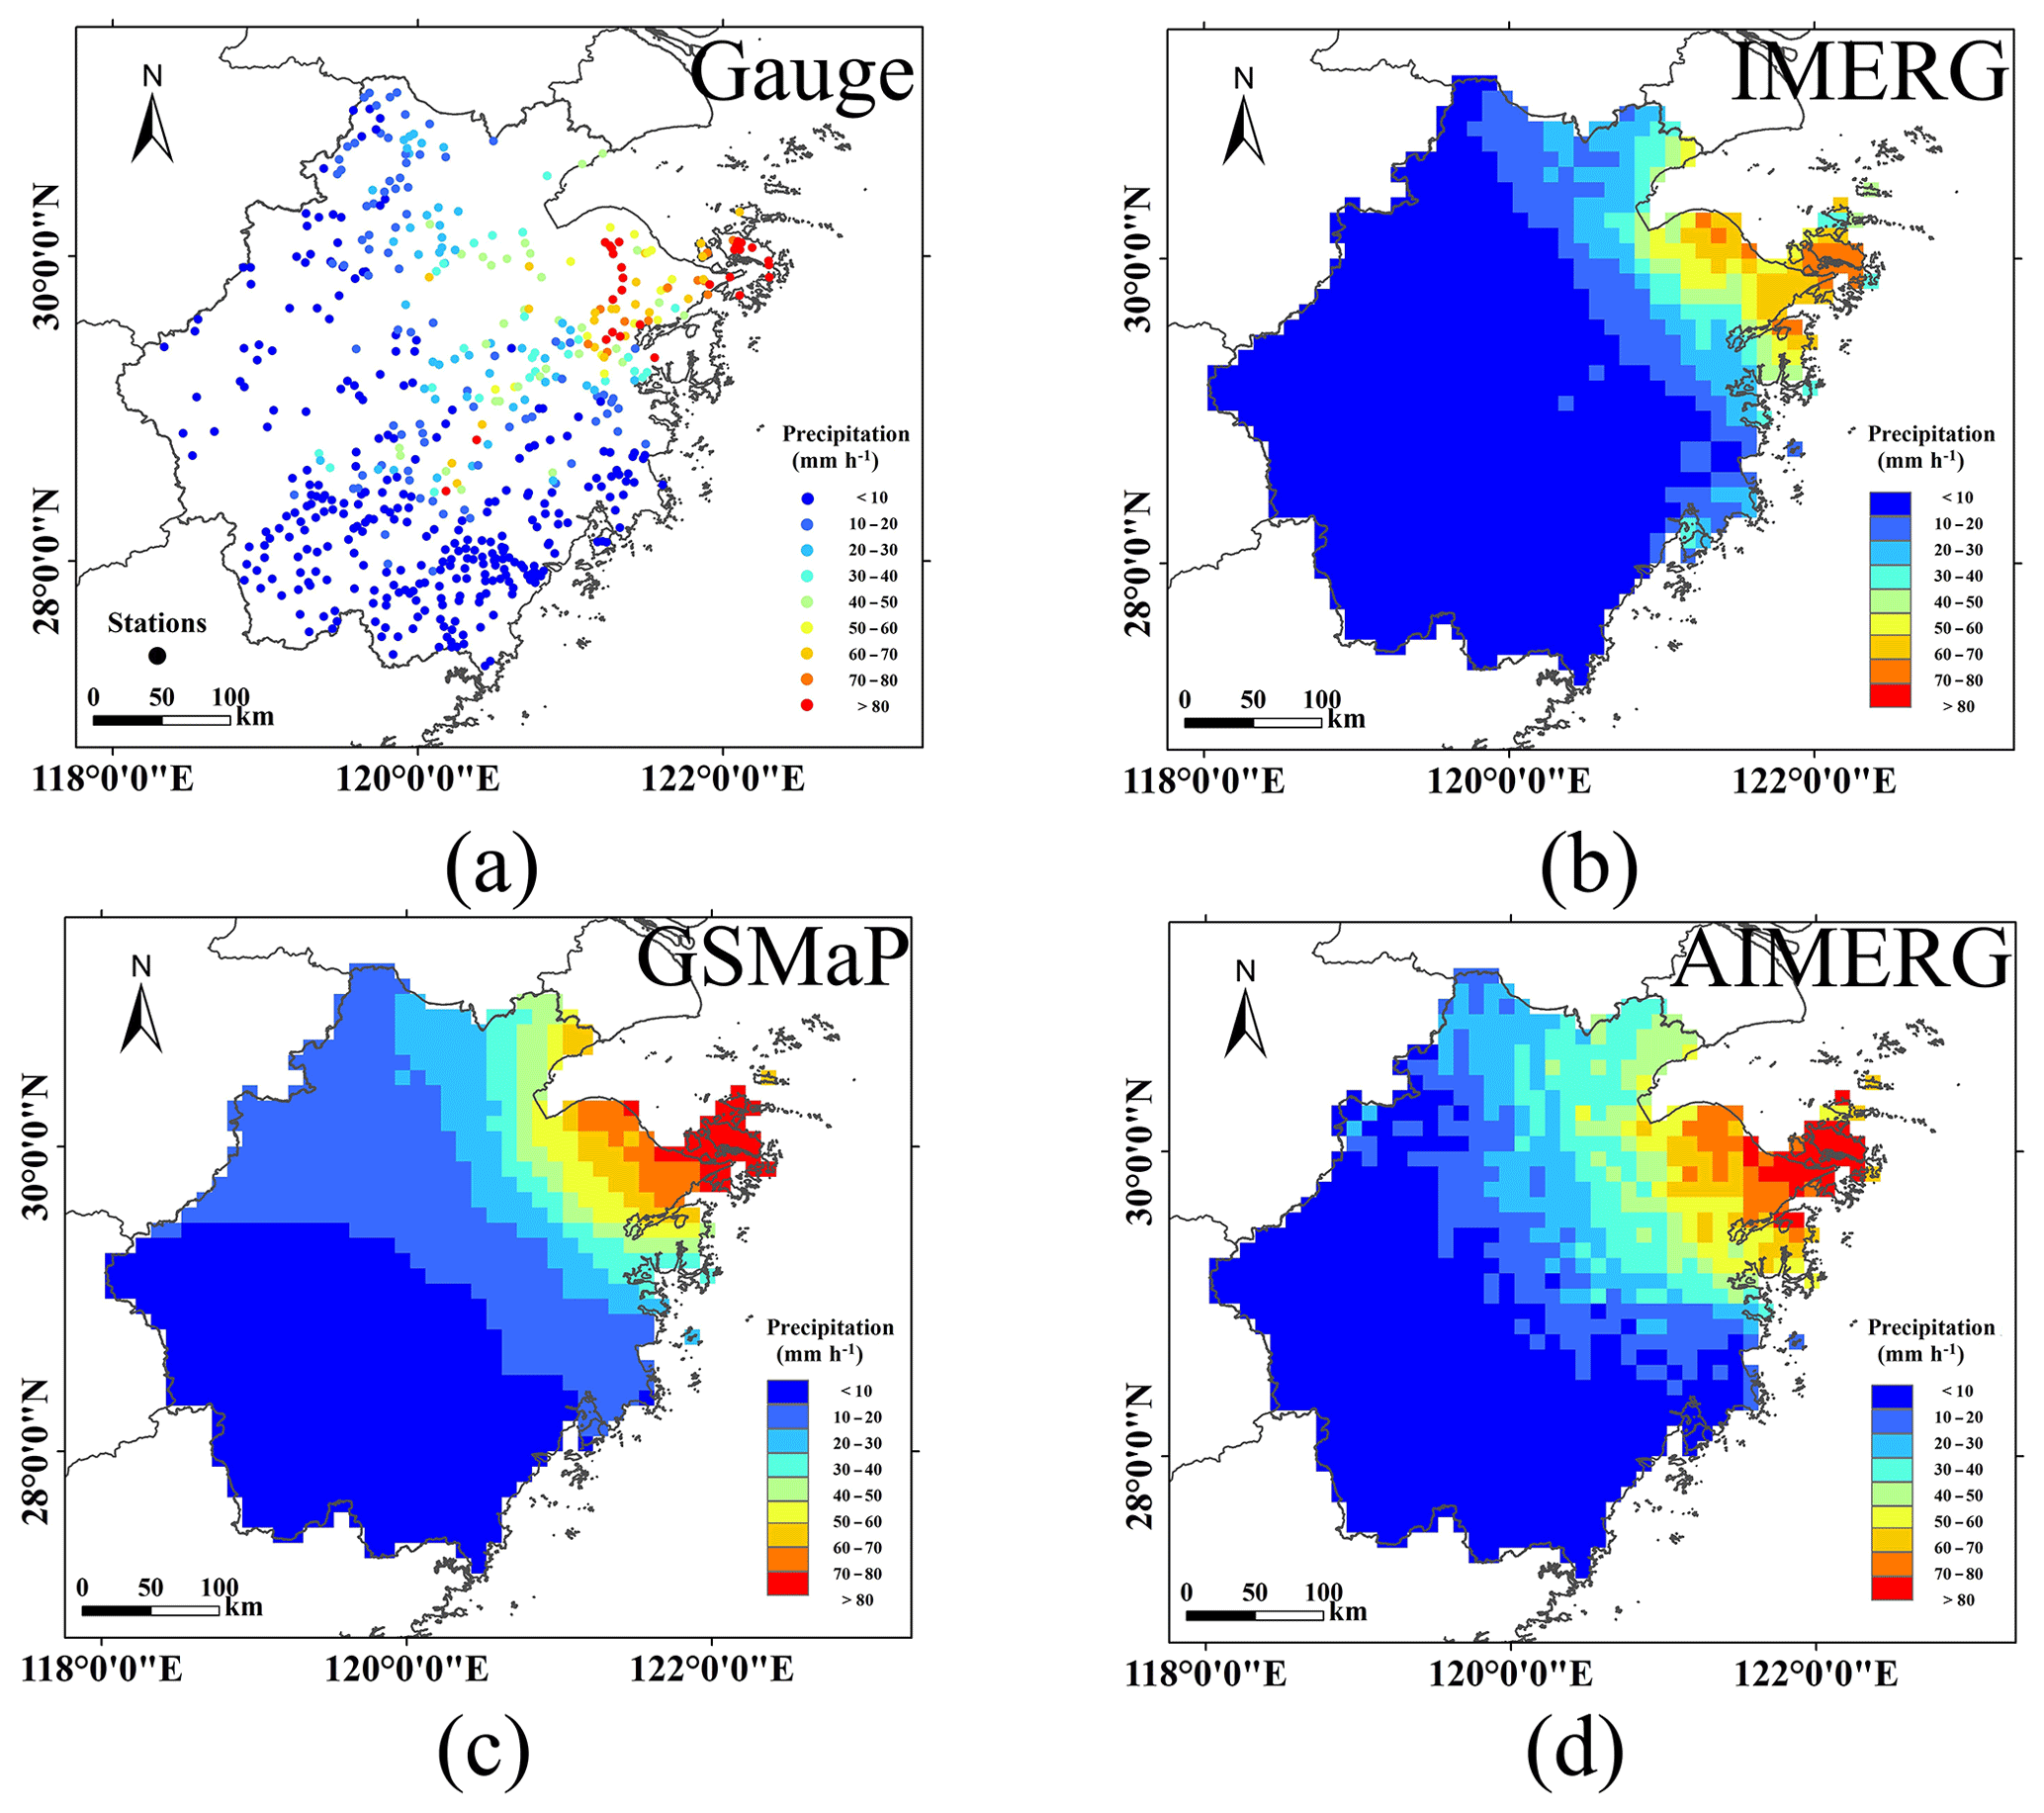
Figure 11The spatial patterns of precipitation measured by (a) IMERG, (b) GSMaP, and (c) AIMERG during the typhoon, Chan-hom, which occurred in the typical period 00:00–11:00 on 11 July 2015 in the Zhejiang province. For visualization, the spatial maps were generated using ArcGIS 10.3 (http://www.esri.com/software/arcgis/).
To quantitatively assess the performances of AIMERG, GSMaP, and IMERG, they are also evaluated against the ground observations during the typhoon, Chan-hom, which occurred in the typical period 00:00–11:00 on 11 July 2015 in the Zhejiang province (Fig. 12a–c). From the statistics, not only the systematic bias of IMERG (around −50 %) is significantly improved, with the bias of AIMERG around −10 %, but also the random errors of IMERG (RMSE ∼2.7 mm h−1, MAE ∼1.5 mm h−1) are also reduced, compared with AIMERG (RMSE ∼2.5 mm h−1, MAE ∼1.4 mm h−1), which meant the calibrations using APHRODITE on IMERG improved the abilities of the original IMERG product to more accurately estimate the quantitative precipitation volumes, especially in heavy rainfall events (Fig. 12a and c). Meanwhile, AIMERG significantly overwhelms GSMaP in terms of both bias and random errors. For instance, GSMaP underestimates the precipitation (bias %) twice as large as AIMERG (bias %), and the random errors of GSMaP (MAE ∼1.97 mm h−1, RMSE ∼3.26 mm h−1) are also significantly larger than those of AIMERG (MAE ∼1.44 mm h−1, RMSE ∼2.50 mm h−1) (Fig. 12b and c). Compared with the original IMERG, though the random errors of GSMaP are relatively larger, the bias of GSMaP ( %) is significantly smaller than that of the original IMERG ( %), which is due to the calibrations on the GSMaP at the daily scale (Fig. 12a and b). In future, we also encourage researchers to comprehensively evaluate and compare AIMERG with other high-resolution precipitation products at various spatio-temporal scales.
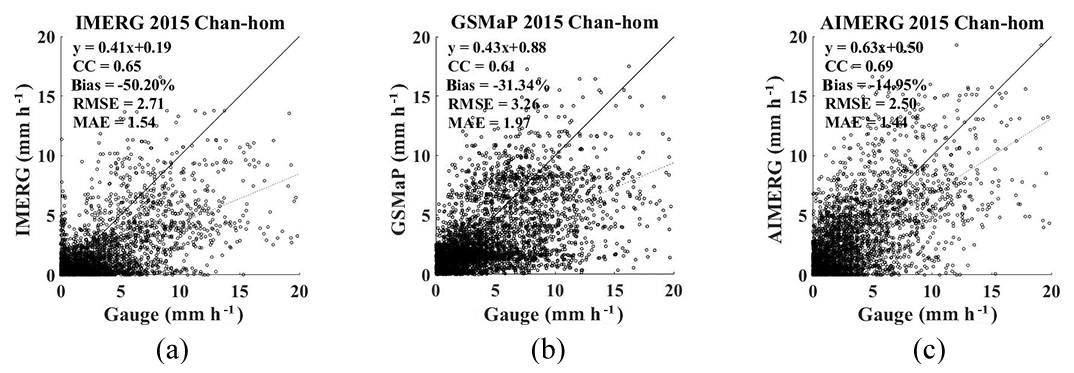
Figure 12The scatterplots of (a) IMERG, (b) GSMaP, and (c) AIMERG against ground observations during the typhoon, Chan-hom, which occurred in the typical period 00:00–11:00 on 11 July 2015 in the Zhejiang province.
The extent of AIMERG could cover northern Eurasia, the Middle East, monsoon Asia, and Japan. This study mainly evaluated AIMERG in mainland China, which calls for Asia-wide evaluations in the future to assess both the algorithm and the corresponding precipitation product. For regions with relatively dense rain gauge networks, it is better to quantitatively and horizontally evaluate AIMERG and other precipitation estimates against ground observations, using statistical evaluations (Lu et al., 2020; Xu et al., 2019; Tang et al., 2020), for example, in Japan and India. While for regions with relatively sparse rain gauge networks, it is optimal to horizontally compare the performances and abilities of AIMERG with those of other products in precipitation-related application fields, e.g. in hydrological simulations at basin scales (Ma et al., 2018).
5.1 The potential drawbacks in processing the IMERG product
From the document Algorithm Theoretical Basis Document (ATBD) Version 06 for generating the final IMERG product (Huffman et al., 2019a), we find that there are mainly two steps in the process: the first step is to derive the multi-satellite-only precipitation inversion estimates, and the second step is to calibrate the multi-satellite-only precipitation estimates using the interpolated precipitation product based on ground observations, e.g. GPCC (1.0∘/monthly). Lacking a mature calibration algorithm for calibrating the multi-satellite-only precipitation estimates at a daily scale, the current IMERG final product is only calibrated using the GPCC at a monthly scale. The two aims of this study are to provide (1) a spatio-temporal calibration algorithm (DSTDCA) for anchoring the satellite-based precipitation estimates at a daily scale and (2) a new precipitation product with finer quality, namely AIMERG (half-hourly, , 2000–2015, Asia) (Ma et al., 2020a, b), for research in Asia. For anchoring the IMERG final product, we introduce the APHRODITE data (daily, , 2000–2015, Asia), which were interpolated based on the ground observations from the large numbers of rain gauges. Though the general spatial patterns of monthly mean precipitation estimates from both APHRODITE and GPCC, from 1951 to 2015, are similar, their volumes demonstrate significant differences, especially along the Himalayas, coastal Indochina and Western Ghats, and Indonesia (Fig. 13a–b). To much more clearly demonstrate the relative values of GPCC and APHRODITE, the spatial patterns of the ratio of monthly mean values of APHRODITE to those of GPCC are illustrated in Fig. 13c, from which we find that GPCC significantly overestimates the precipitation in the tropical rain range along Indonesia and along the southern Himalayas with complex terrain, while it significantly underestimates the precipitation in the northwestern Tibetan Plateau and Middle East compared with the ground truth product, APHRODITE. Illustrated by Fig. 13, the GPCC plays vital roles in the final IMERG product, and the introduction of APHRODITE for calibrating IMERG would greatly benefit the quality of AIMERG.
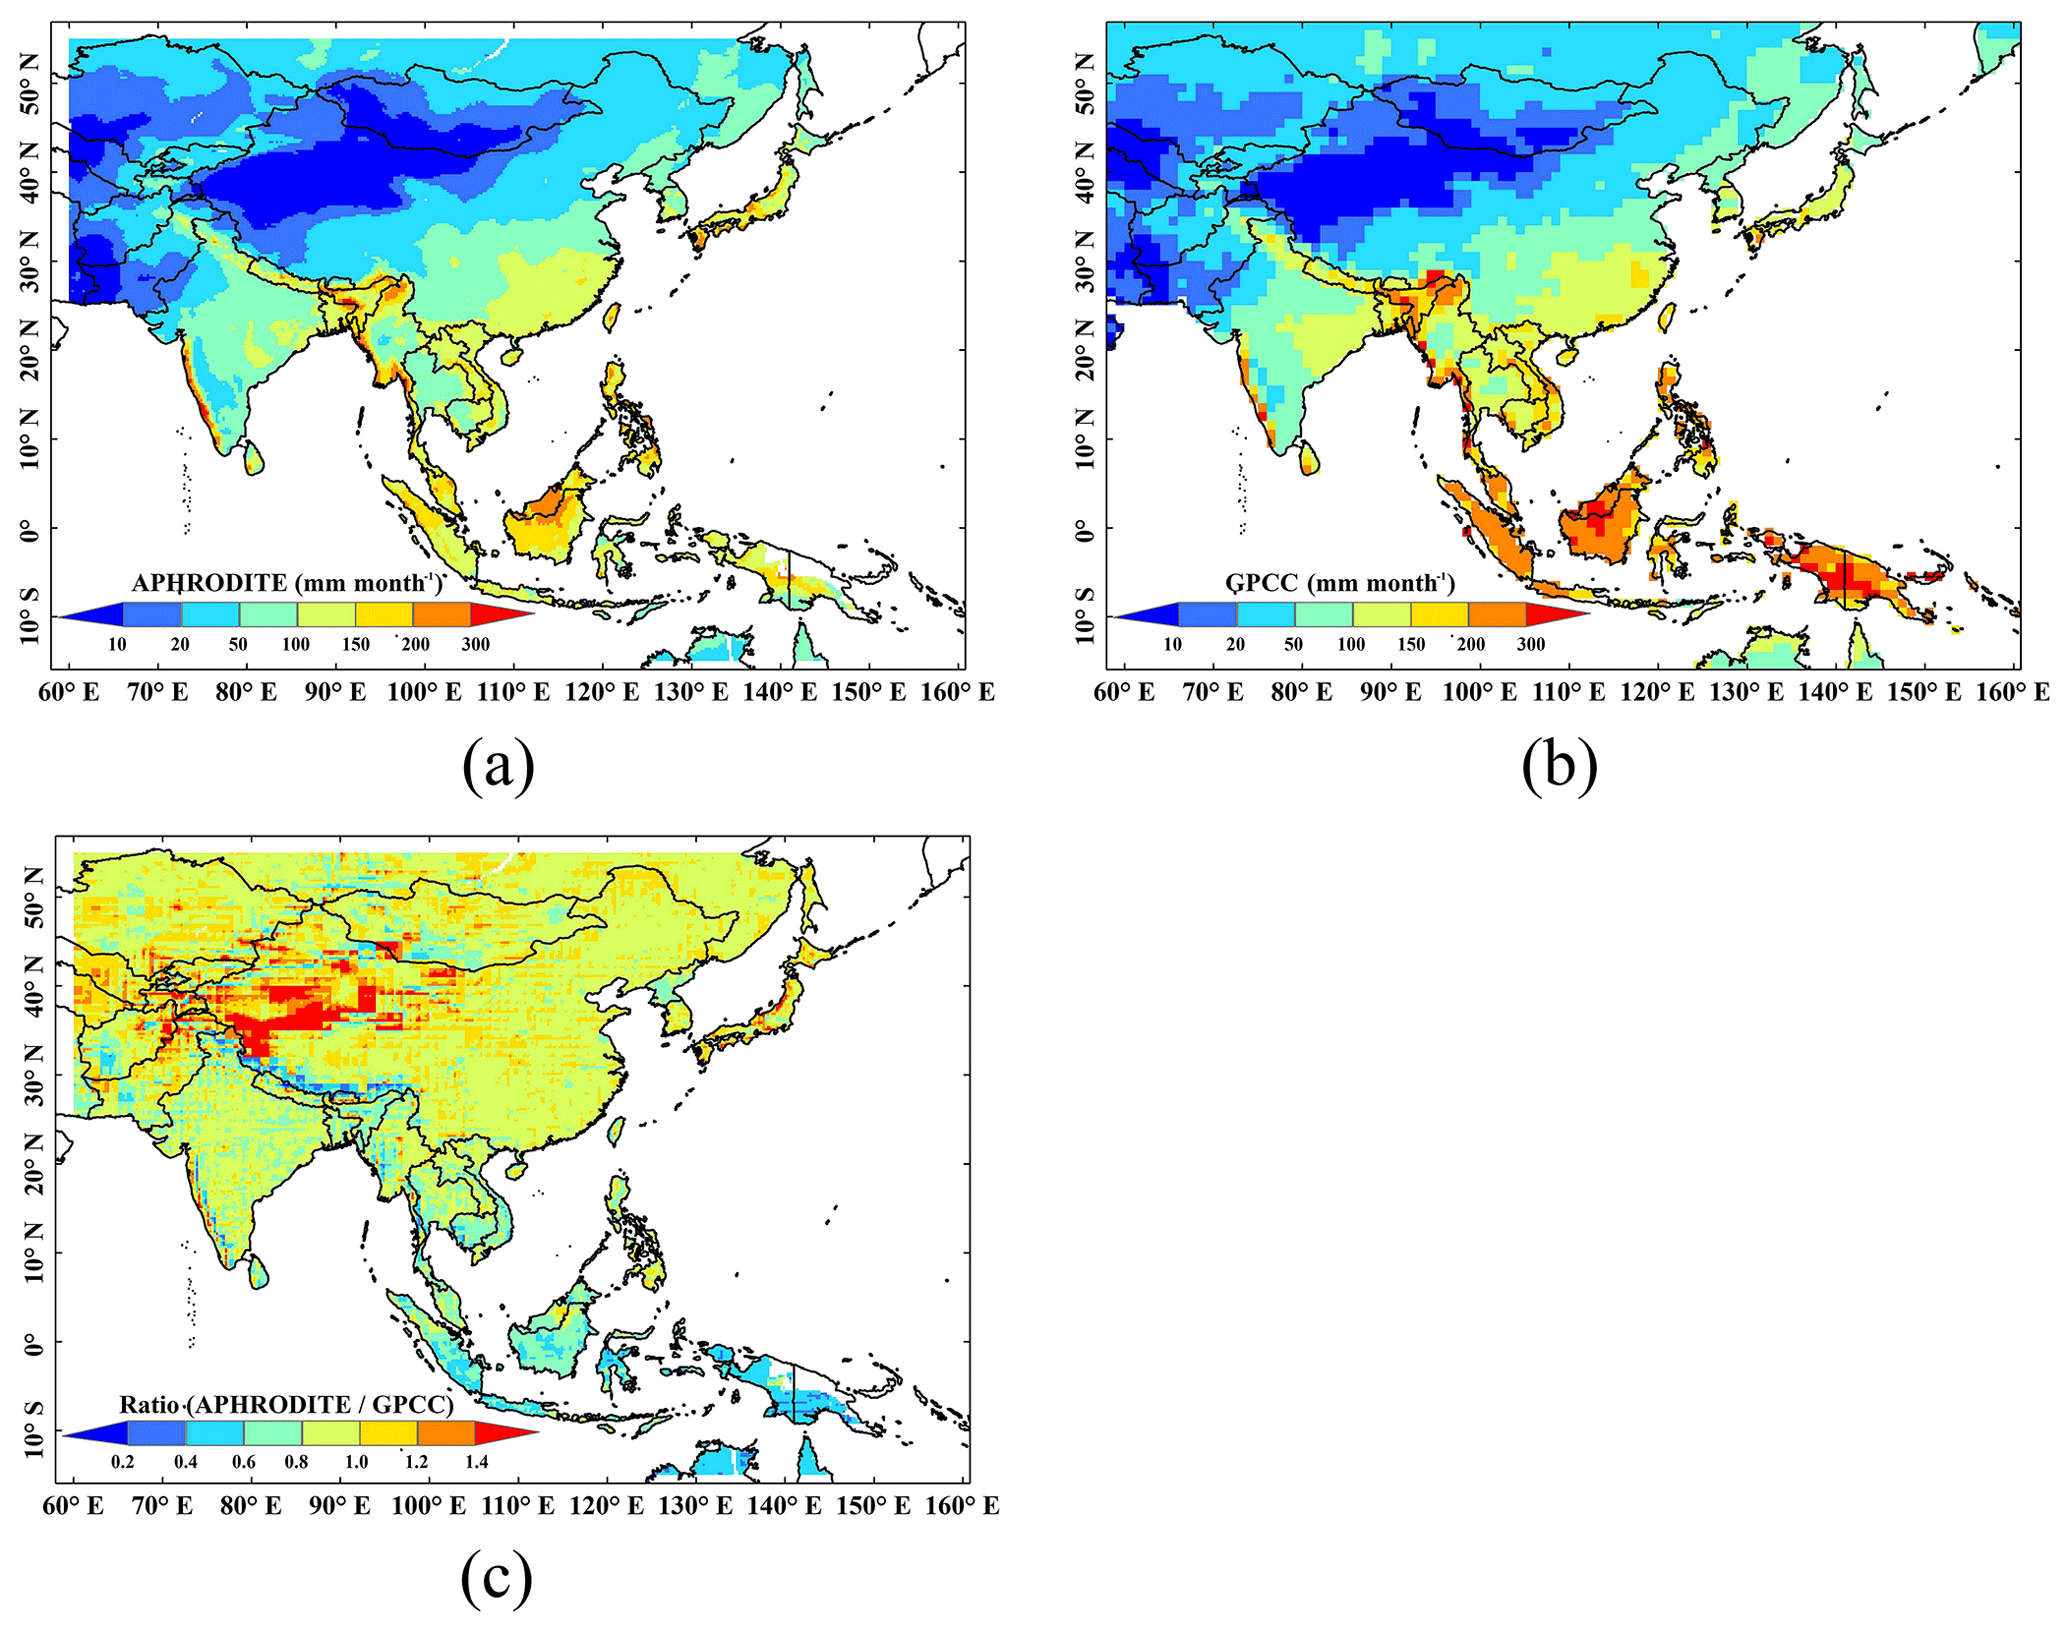
Figure 13The spatial patterns of the monthly mean precipitation of (a) APHRODITE and (b) GPCC as well as (c) ratios between monthly mean values of APHRODITE and GPCC over Asia in the period from 1951 to 2015. For visualization, the spatial maps were generated using ArcGIS 10.3 (http://www.esri.com/software/arcgis/).
There are mainly two kinds of errors in the multi-satellite-only precipitation product, including systematic bias and random errors (Shen et al., 2014). As seen in the above-mentioned results, the random errors of AIMERG are alleviated by using the APHRODITE data compared with IMERG (e.g. Figs. 4–13). In terms of the systematic errors, we compared the monthly Asian mean precipitation estimates of both APHRODITE and GPCC, from 1951 to 2015 (Fig. 14). The monthly Asian mean precipitation of APHRODITE varies between ∼25 mm per month and ∼100 mm per month, while that of GPCC ranges between ∼50 mm per month and ∼150 mm per month, which results in the ratios of APHRODITE to GPCC fluctuating significantly from ∼0.2 to ∼0.9, with an average value ∼0.7, which means that the GPCC at least overestimates the precipitation by more than ∼30 % compared with APHRODITE. Therefore, the introduction of APHRODITE data would greatly reduce the systematic errors of the IMERG final product over Asia.
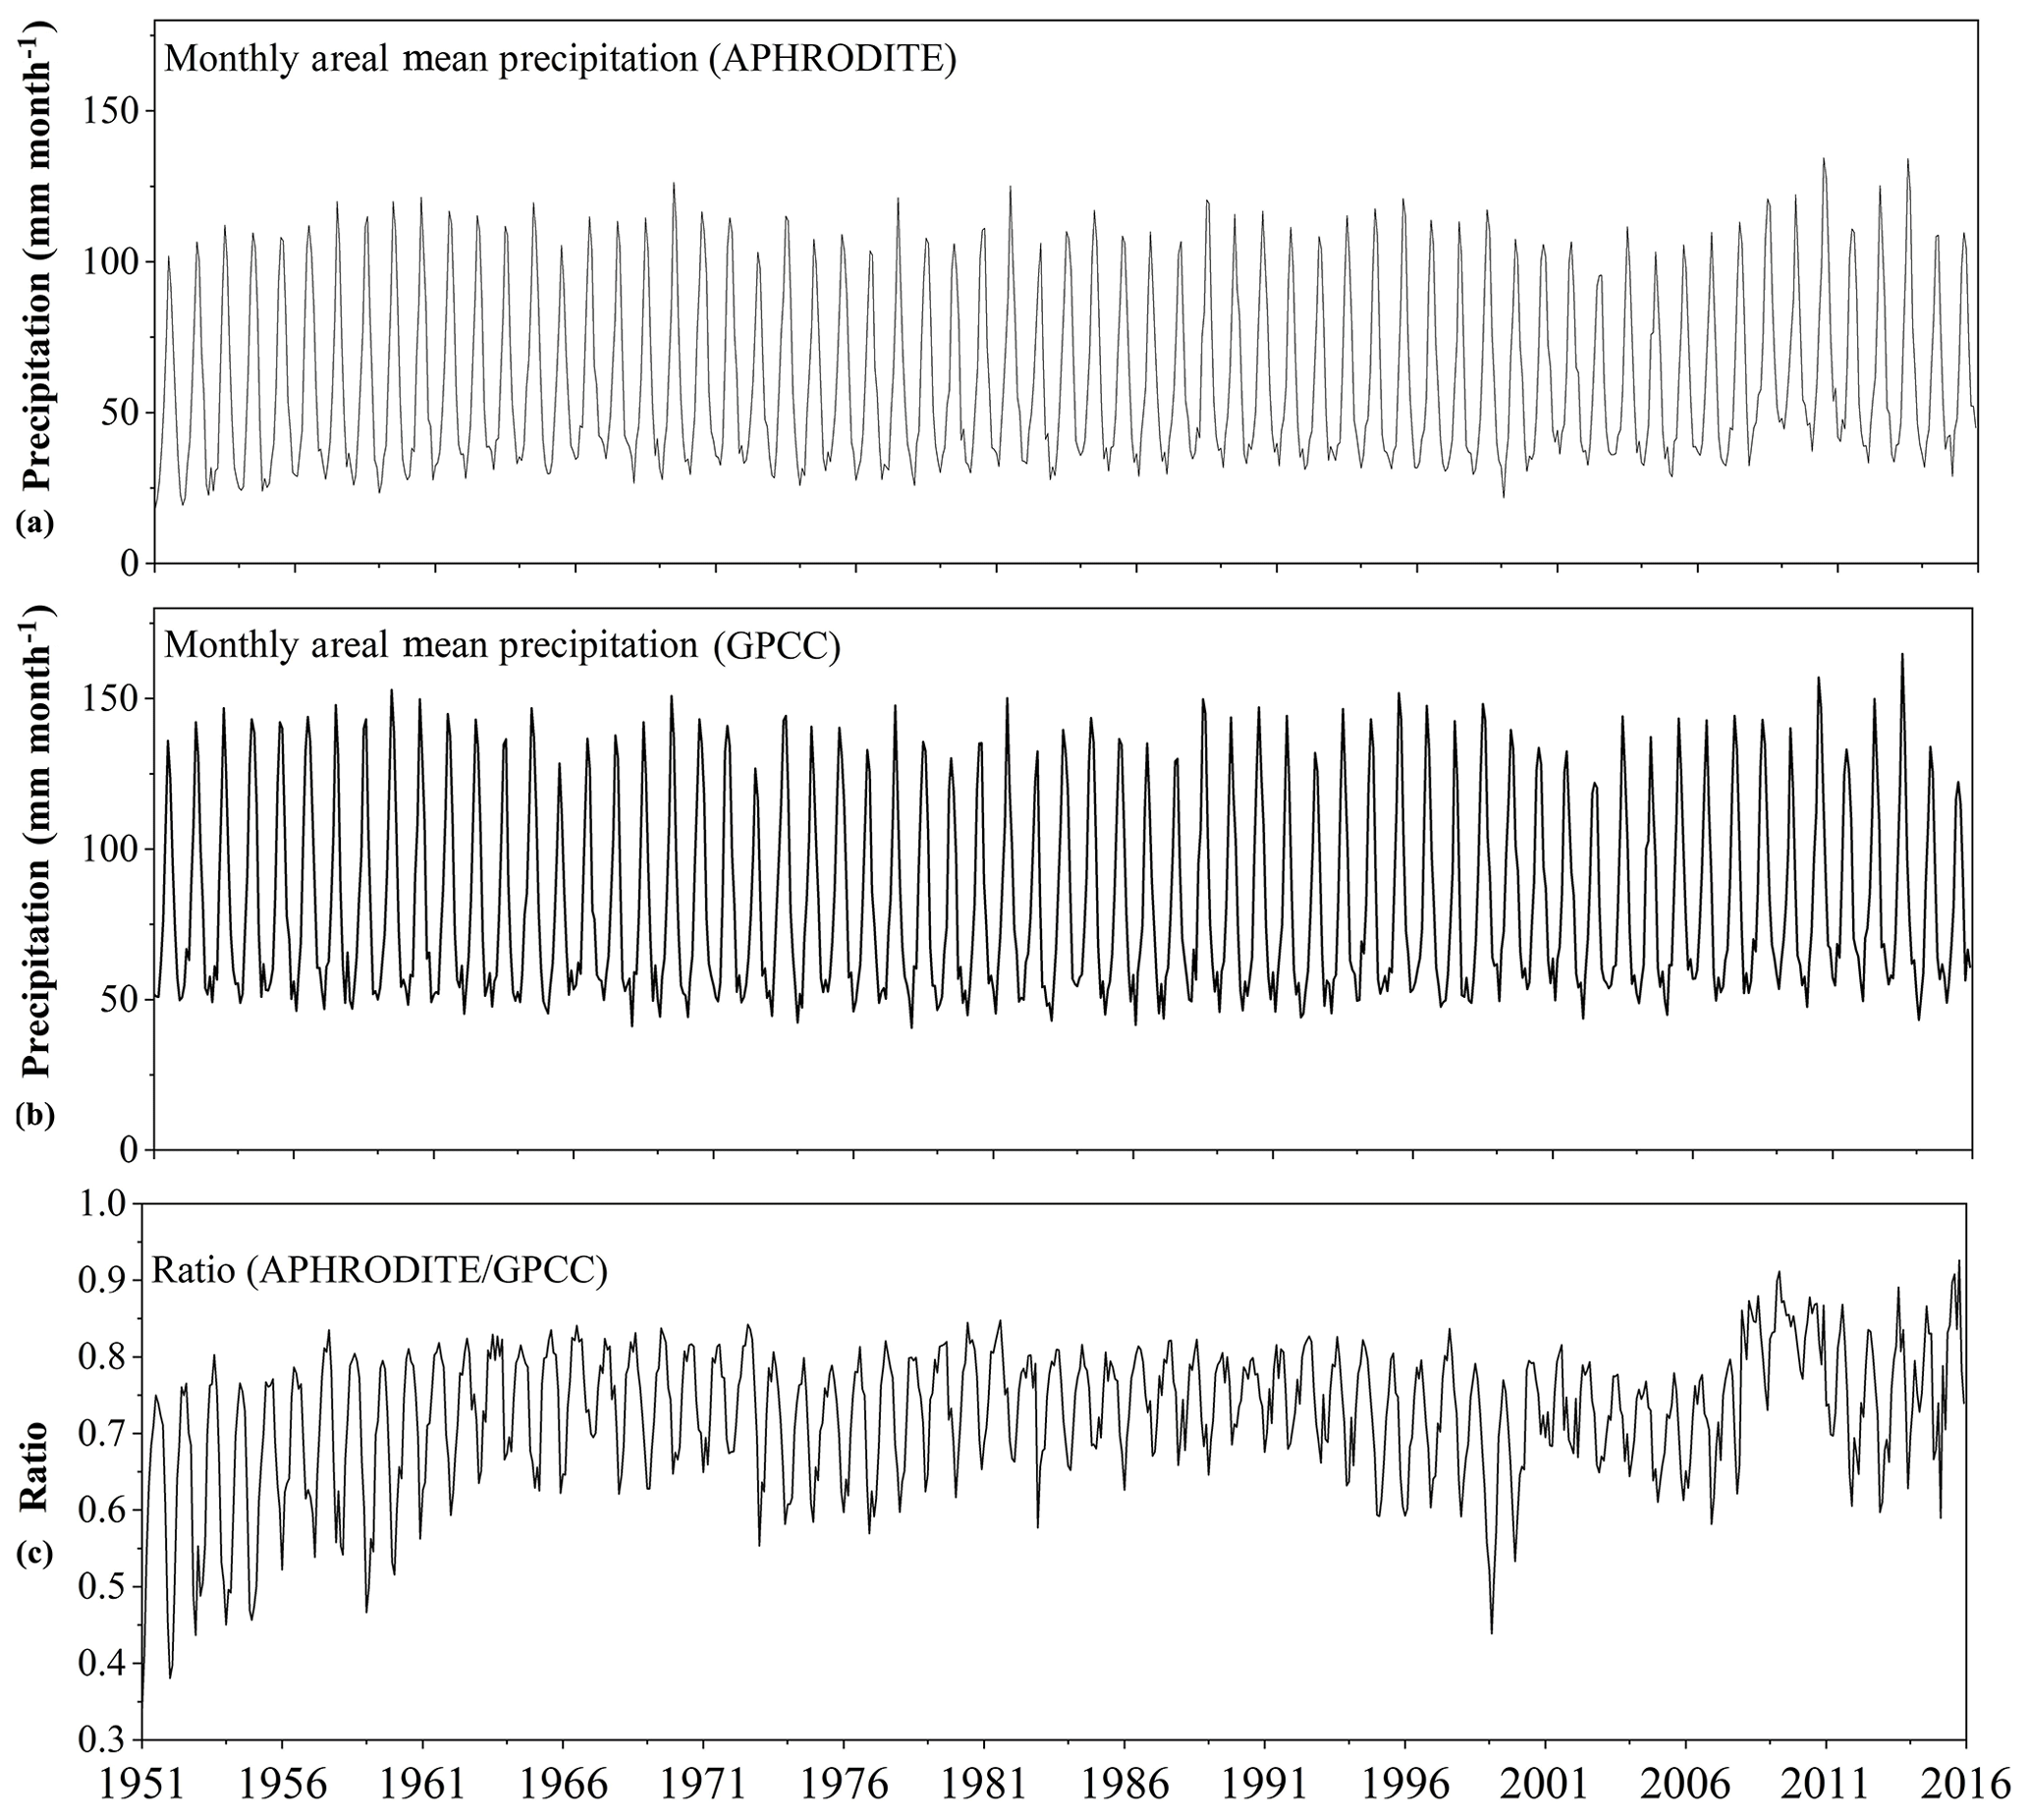
Figure 14The temporal patterns of monthly areal mean precipitation of (a) APHRODITE and (b) GPCC and monthly (c) ratio values of corresponding areal mean APHRODITE/GPCC, 1951–2015.
5.2 The controls on the range of the spatial weights based on IMERG
As demonstrated in the document of the ATBD (Huffman et al., 2019a), gauge information is introduced into the original multi-satellite-only half-hourly data to generate the final IMERG product. Firstly, the ratio between the monthly accumulation of the half-hourly multi-satellite-only field and the monthly satellite–gauge field is calculated, and then each half-hourly field of multi-satellite-only precipitation estimates in the corresponding month is multiplied by the ratio field to generate the half-hourly calibrated IMERG. After various experiments, the ratio values between the monthly satellite–gauge and the monthly accumulation of half-hourly multi-satellite-only fields is limited to the range [0.2, 3] (Huffman et al., 2019a). The cap of 3 is decided due to the value of 2 (used in TRMM V6) being too restrictive. Meanwhile, the cap of 3 is finally applied because it performed better in matching the two accumulations than that of other larger values, for instance, the cap of 4 resulted in the introduction of unrealistic shifts to histogram of half-hourly precipitation rates for the month. Additionally, early in TRMM the lower bound of 0.5 was applied, which suggested a smaller value of the lower bound allows matching between the two accumulations without creating the egregious high snapshot values when the upper bound was expanded too far.
Inspired by the range of the ratio values between the monthly satellite–gauge and the monthly accumulation of half-hourly multi-satellite-only fields in generating IMERG, we consider that the range [0, 1.5] of the daily spatial disaggregation weights in this study is reasonable after carefully checking the distributions of the spatial disaggregation weights. The lower bound of 0 was selected based on the consideration that if IMERG did not capture the daily precipitation event then the spatial disaggregation weight is still equal to zero, which agrees as much as possible with the original IMERG, while there are at least two reasons for setting the upper bound of the spatial disaggregation weights to 1.5: (1) most numerical values of spatial disaggregation weights are in the range [0, 1.5] and (2) there are obvious anomalies in the final calibrated AIMERG, especially along the coastal regions and edges of the specific precipitation event coverages, where the values of the spatial disaggregation weights are larger than 1.5. Though the range [0, 1.5] of spatial disaggregation weights was applied to obtain the final AIMERG in this study, we also consider that this is still an open-ended issue.
5.3 The advantages of APHRODITE data in anchoring the multi-satellite-only precipitation product
It has been a great challenge to obtain precipitation estimates over the Tibetan Plateau and its surroundings, as there are very limited ground observations in this region, especially in its western parts (Ma et al., 2017). Incorporating a uniform precipitation gauge analysis is important and critical for controlling the bias that typifies the satellite precipitation estimates, e.g. using GPCC for TMPA and IMERG (Huffman et al., 2019a). Those projects (e.g. GPCC, TRMM, GPM) demonstrate that even monthly gauge analyses contribute significant improvements to the satellite-only precipitation estimates, at least for some regions in some seasons. Primarily explorations at CPC suggested substantial improvements in the bias corrections using daily gauge analysis, especially for regions where there is a dense network of gauges (Mega et al., 2014). Foreseeably, GPM would try their best to calibrate the GPM multi-satellite-only precipitation estimates at finer spatio-temporal scales (e.g. 0.25∘/daily) worldwide.
Currently, GPCC has been adopted to calibrate the TRMM TMPA and the GPM-era IMERG at a monthly scale. The Deutscher Wetterdienst (DWD) Global Precipitation Climatology Centre (GPCC) was established in 1989 to provide high-quality precipitation analyses over land based on conventional precipitation gauges from ∼7000 to 8000 stations worldwide (Schneider et al., 2014, 2018). And two GPCC products were applied in IMERG, the V8 Full Data Analysis for the majority of the time (currently 1998–2016), and the V6 Monitoring Product from 2017 to the present. Compared with GPCC, APHRODITE has inherent advantages with a significantly larger number of ground observations and finer spatio-temporal resolutions over Asia. APHRODITE projects aim at collecting as much gauge information as possible from the Asian countries. There are mainly three kinds of gauge information sources used in APHRODITE analysis: the GTS-based data, data precompiled by other projects or organizations, and APHRODITE's own collection. More detailed information on the APHRODITE data sources could be found at the website http://www.chikyu.ac.jp/precip/ (last access: 17 January 2020) and the research of Yatagai et al. (2012). Compared with the GPCC with the limited ground observations in and around the Tibetan Plateau in China, the neighbouring countries provide plenty of ground observations in the APHRODITE data, in mountainous regions, and in semi-arid and arid regions. Additionally, the spatio-temporal resolutions of APHRODITE (0.25∘/daily) are finer than those of GPCC (1.0∘/monthly). Therefore, APHRODITE has significant advantages in calibrating the IMERG data at a daily scale.
The AIMERG data are freely accessible at https://doi.org/10.5281/zenodo.3609352 (for the period from 2000 to 2008) (Ma et al., 2020a) and https://doi.org/10.5281/zenodo.3609507 (for the period from 2009 to 2015) (Ma et al., 2020b).
As the milestone in the satellite-based precipitation measurement process, the TRMM and its successor GPM generate the most popular and the state-of-the-art satellite precipitation products for water-cycle-related scientific research and applications, TMPA (1998–present, 0.25∘/3-hourly) and IMERG (2014–present, 0.1∘/half-hourly), as well as the retrospective IMERG (2000–present, 0.1∘/half-hourly) from the GPM era to the TRMM era. In this study, focusing on the potential drawbacks in generating IMERG and its recently updated retrospective IMERG in the TRMM era, which were only calibrated at a monthly scale using ground observations (GPCC, 1.0∘/monthly), we introduce another daily gauge analysis product, APHRODITE (last update 5 October 2018), to calibrate IMERG at a 0.25∘/daily scale. Compared with GPCC, APHRODITE has inherent advantages with a significantly larger number of ground observations and finer spatio-temporal resolutions (0.25∘/daily) over Asia.
We have proposed a new algorithm (Daily Spatio-Temporal Disaggregation Calibration Algorithm, DSTDCA) for calibrating IMERG at a daily scale and provided a new AIMERG precipitation dataset (0.1∘/half-hourly, 2000–2015, Asia) (Ma et al., 2020a, b) with better quality, calibrated by APHRODITE at a daily scale for the Asian applications. The main conclusions include but are not limited to the following: (1) the proposed daily calibration algorithm is effective in considering the advantages from both satellite-based precipitation estimates and the ground observations; (2) AIMERG performs better than IMERG at different spatio-temporal scales, in terms of both systematic biases and random errors, over mainland China; and (3) APHRODITE demonstrates significant advantages compared to GPCC in calibrating IMERG, especially over mountainous regions with complex terrain, e.g. the Tibetan Plateau. Additionally, results of this study suggest that it is a promising and applicable daily calibration algorithm for GPM in generating the future IMERG in either an operational scheme or a retrospective manner.
| AIMERG | Asian precipitation dataset by calibrating the GPM-era IMERG at a daily scale using APHRODITE |
| APHRODITE | Asian Precipitation – Highly Resolved Observational Data Integration Towards Evaluation of Water Resources |
| ATBD | Algorithm Theoretical Basis Document |
| BIAS | Relative bias |
| CC | Correlation coefficient |
| CHIRPS | Climate Hazards group Infrared Precipitation with Stations |
| CLIMAT | Monthly climatological data |
| CMA | Chinese Meteorological Administration |
| CMORPH | Climate Prediction Center (CPC) MORPHing technique |
| CPC | Climate Prediction Center |
| CSI | Critical success index |
| DSTDCA | Daily Spatio-Temporal Disaggregation Calibration Algorithm |
| DWD | Deutscher Wetterdienst |
| ERA5 | Fifth generation of ECMWF atmospheric reanalyses of the global climate |
| ERA-Interim | ECMWF Reanalysis – Interim |
| FAR | False alarm ratio |
| GEWEX | Global Energy and Water Exchanges |
| GPCC | Global Precipitation Climatology Centre |
| GPM | Global Precipitation Measurement |
| GSMaP | Gauge-adjusted Global Satellite Mapping of Precipitation V7 |
| GTS | Global Telecommunications System |
| IMERG | Integrated Multi-satellitE Retrievals for Global Precipitation Measurement |
| IR | Infrared |
| MAE | Mean absolute error |
| MERRA2 | The Modern-Era Retrospective Analysis for Research and Applications, Version 2 |
| MW | Microwave |
| NHMs | National hydrological and meteorological services |
| NMIC | National Meteorological Information Center |
| OI | Optimal interpolation |
| Probability density function | |
| PERSIANN | Precipitation Estimation from Remotely Sensed Information using Artificial Neural Networks |
| PERSIANN-CCS | Precipitation Estimation from Remotely Sensed Information using Artificial Neural Networks Cloud Classification System |
| PERSIANN-CDR | PERSIANN Climate Data Record |
| PMW | Passive microwave |
| POD | Probability of detection |
| QC | Quality control |
| RMSD | Root mean square deviation |
| RMSE | Root mean square error |
| SG | Satellite–gauge |
| SM2RAIN | Soil Moisture to Rain based on ESA Climate Change Initiative (CCI) |
| SYNOP | Synoptic weather report |
| TMPA | TRMM Multi-satellite Precipitation Analysis |
| TRMM 3B42 | Tropical Rainfall Measuring Mission Multi-satellite Precipitation Analysis 3B42 V7 |
ZM designed and organized the manuscript. JX, SZ, JY, and YY prepared the related materials and ran the models for generating AIMERG and the related assessments. GT and ZS made contributions to the scientific framework of this study and discussed the interpretation of the results. YH co-advised this study. All authors discussed the results and commented on the manuscript.
The authors declare that they have no conflict of interest.
This study was financially supported by the Key R&D Program of the Ministry of Science and Technology, China (grant no. 2018YFC1506500); the National Natural Science Foundation of China (grant no. 41901343); the Second Tibetan Plateau Scientific Expedition and Research (STEP) program (grant no. 2019QZKK0105); the China Postdoctoral Science Foundation (grant no. 2018M630037 and 2019T120021); and the Open Fund of the State Key Laboratory of Remote Sensing Science, China (grant no. OFSLRSS201909).
The contribution of the data providers is also greatly appreciated, including the Chinese Meteorological Data Sharing Service System (http://cdc.nmic.cn/home.do, last access: 17 January 2020), the APHRODITE data provider (http://aphrodite.st.hirosaki-u.ac.jp/download/, last access: 17 January 2020), and the IMERG data provider (https://pmm.nasa.gov/data-access/downloads/gpm, last access: 17 January 2020).
This study was financially supported by the Key R&D Program of the Ministry of Science and Technology, China (grant no. 2018YFC1506500); the National Natural Science Foundation of China (grant no. 41901343); the Second Tibetan Plateau Scientific Expedition and Research (STEP) program (grant no. 2019QZKK0105); the China Postdoctoral Science Foundation (grant no. 2018M630037 and 2019T120021); and the Open Fund of the State Key Laboratory of Remote Sensing Science, China (grant no. OFSLRSS201909).
This paper was edited by David Carlson and reviewed by Asim Biswas and one anonymous referee.
Adler, R. F., Huffman, G. J., Chang, A., Ferraro, R., Xie, P., Janowiak, J., Rudolf, B., Schneider, U., Curtis, S., Bolvin, D., Gruber, A., Susskind, J., Arkin, P., and Nelkin, E.: The Version-2 Global Precipitation Climatology Project (GPCP) Monthly Precipitation Analysis (1979–Present), J. Hydrometeorol., 4, 1147–1167, https://doi.org/10.1175/1525-7541(2003)004<1147:TVGPCP>2.0.CO;2, 2003.
Adler, R. F., Sapiano, M., Huffman, G. J., Wang, J.-J., Gu, G., Bolvin, D. T., Chiu, L., Schneider, U., Becker, A., Nelkin, E. J., Xie, P., Ferraro, R., and Shin, D.-B.: The Global Precipitation Climatology Project (GPCP) Monthly Analysis (New Version 2.3) and a Review of 2017 Global Precipitation, Atmosphere, 9, 138, https://doi.org/10.3390/atmos9040138, 2018.
Beck, H. E., van Dijk, A. I. J. M., Levizzani, V., Schellekens, J., Miralles, D. G., Martens, B., and de Roo, A.: MSWEP: 3-hourly 0.25° global gridded precipitation (1979–2015) by merging gauge, satellite, and reanalysis data, Hydrol. Earth Syst. Sci., 21, 589–615, https://doi.org/10.5194/hess-21-589-2017, 2017.
Beck, H. E., Wood, E. F., Pan, M., Fisher, C. K., Miralles, D. G., van Dijk, A. I. J. M., McVicar, T. R., and Adler, R. F.: MSWEP V2 Global 3-Hourly 0.1∘ Precipitation: Methodology and Quantitative Assessment, B. Am. Meteorol. Soc., 100, 473–500, https://doi.org/10.1175/BAMS-D-17-0138.1, 2018.
Chen, M., Xie, P., Janowiak, J., and Arkin, P.: Global Land Precipitation: A 50-yr Monthly Analysis Based on Gauge Observations, J. Hydrometeorol., 3, 249–266, https://doi.org/10.1175/1525-7541(2002)003<0249:GLPAYM>2.0.CO;2, 2002.
Duncan, J. M. A. and Biggs, E. M.: Assessing the accuracy and applied use of satellite-derived precipitation estimates over Nepal, Appl. Geogr., 34, 626–638, https://doi.org/10.1016/j.apgeog.2012.04.001, 2012.
Ebert, E. E., Janowiak, J. E., and Kidd, C.: Comparison of Near-Real-Time Precipitation Estimates from Satellite Observations and Numerical Models, B. Am. Meteorol. Soc., 88, 47–64, https://doi.org/10.1175/BAMS-88-1-47, 2007.
Hamada, A., Arakawa, O., and Yatagai, A.: An automated quality control method for daily rain-gauge data, Global Environ. Res., 15, 183–192, 2011.
Hong, Y., Hsu, K.-L., Sorooshian, S., and Gao, X.: Precipitation Estimation from Remotely Sensed Imagery Using an Artificial Neural Network Cloud Classification System, J. Appl. Meteorol., 43, 1834–1853, https://doi.org/10.1175/JAM2173.1, 2004.
Huffman, G. J., Adler, R. F., Arkin, P., Chang, A., Ferraro, R., Gruber, A., Janowiak, J., McNab, A., Rudolf, B., and Schneider, U.: The Global Precipitation Climatology Project (GPCP) Version 1 data set, B. Am. https://doi.org/10.1175/1520-0477(1997)078<0005:TGPCPG>2.0.CO;2, 1997.
Huffman, G. J., Bolvin, D. T., Nelkin, E. J., Wolff, D. B., Adler, R. F., Gu, G., Hong, Y., Bowman, K. P., and Stocker, E. F.: The TRMM Multisatellite Precipitation Analysis (TMPA): Quasi-Global, Multiyear, Combined-Sensor Precipitation Estimates at Fine Scales, J. Hydrometeorol., 8, 38–55, https://doi.org/10.1175/JHM560.1, 2007.
Huffman, G. J., Bolvin, D. T., Braithwaite, D., Hsu, K., Joyce, R., Kidd, C., Nelkin, E. J., Sorooshian, S., Tan, J., and Xie, P.: NASA Global Precipitation Measurement (GPM) Integrated Multi-satellitE Retrievals for GPM (IMERG), Algorithm Theoretical Basis Document (ATBD) Version 06, NASA/GSFC, Greenbelt, MD, USA, 38 pp., 2019a.
Huffman, G. J., Stocker, E. F., Bolvin, D. T., Nelkin, E. J., and Tan, J.: GPM IMERG Final Precipitation L3 Half Hourly 0.1 degree x 0.1 degree V06, Greenbelt, MD, Goddard Earth Sciences Data and Information Services Center (GES DISC), https://doi.org/10.5067/GPM/IMERG/3B-HH/06, 2019b.
Joyce, R. J., Janowiak, J. E., Arkin, P. A., and Xie, P.: CMORPH: A Method that Produces Global Precipitation Estimates from Passive Microwave and Infrared Data at High Spatial and Temporal Resolution, J. Hydrometeorol., 5, 487–503, https://doi.org/10.1175/1525-7541(2004)005<0487:CAMTPG>2.0.CO;2, 2004.
Lu, H., Ding, L., Ma, Z., Li, H., Lu, T., Su, M., and Xu, J.: Spatiotemporal Assessments on the Satellite-Based Precipitation Products From Fengyun and GPM Over the Yunnan-Kweichow Plateau, China, Earth Space Sci., 7, e2019EA000857, https://doi.org/10.1029/2019EA000857, 2020.
Ma, Z., Shi, Z., Zhou, Y., Xu, J., Yu, W., and Yang, Y.: A spatial data mining algorithm for downscaling TMPA 3B43 V7 data over the Qinghai–Tibet Plateau with the effects of systematic anomalies removed, Remote Sens. Environ., 200, 378–395, https://doi.org/10.1016/j.rse.2017.08.023, 2017.
Ma, Z., Tan, X., Yang, Y., Chen, X., Kan, G., Ji, X., Lu, H., Long, J., Cui, Y., and Hong, Y.: The First Comparisons of IMERG and the Downscaled Results Based on IMERG in Hydrological Utility over the Ganjiang River Basin, Water-sui, 10, 1392, https://doi.org/10.3390/w10101392, 2018.
Ma, Z., Xu, J., Zhu, S., Tang, G., Yang, Y., Shi, Z., and Hong, Y.: AIMERG: a new Asian precipitation dataset (0.1∘/half-hourly, 2000–2008) by calibrating GPM IMERG at daily scale using APHRODITE [Data set], Zenodo, https://doi.org/10.5281/zenodo.3609352, 2020a.
Ma, Z., Xu, J., Zhu, S., Tang, G., Yang, Y., Shi, Z., and Hong, Y.: AIMERG: a new Asian precipitation dataset (0.1∘/half-hourly, 2009–2015) by calibrating GPM IMERG at daily scale using APHRODITE [Data set], Zenodo, https://doi.org/10.5281/zenodo.3609507, 2020b.
Matsuura, K. and Willmott C. J.: Terrestrial precipitation: 1900–2008 gridded monthly time series (version 2.01), Center for Climatic Research Department of Geography Center for Climatic Research, University of Delaware, available at: http://climate.geog.udel.edu/~climate/html_pages/Global2_Ts_2009/README.global_ p_s_2009.html (last access: 17 January 2020), 2009.
Mega, T., Ushio, T., Kubota, T., Kachi, M., Aonashi, K., and Shige, S.: Gauge adjusted global satellite mapping of precipitation (GSMaP_Gauge), in: 2014 XXXIth URSI General Assembly and Scientific Symposium (URSI GASS), Beijing, China, 1–4, 17–23 August 2014.
Ménégoz, M., Gallée, H., and Jacobi, H. W.: Precipitation and snow cover in the Himalaya: from reanalysis to regional climate simulations, Hydrol. Earth Syst. Sci., 17, 3921–3936, https://doi.org/10.5194/hess-17-3921-2013, 2013.
Mitchell, T. D. and Jones, P. D.: An improved method of constructing a database of monthly climate observations and associated high-resolution grids, Int. J. Climatol., 25, 693–712, https://doi.org/10.1002/joc.1181, 2005.
Rajeevan, M. and Bhate, J.: A high resolution daily gridded rainfall dataset (1971–2005) for mesoscale meteorological studies, Curr. Sci., 96, 558–562, 2009.
Schneider, U., Fuchs, T., Meyer-Christoffer, A., and Rudolf, B.: Global precipitation analysis products of the GPCC, Global Precipitation Climatology Centre, DWD, 13 pp., 2008.
Schneider, U., Becker, A., Finger, P., Meyer-Christoffer, A., Ziese, M., and Rudolf, B.: GPCC's new land surface precipitation climatology based on quality-controlled in situ data and its role in quantifying the global water cycle, Theor. Appl. Climatol., 115, 15–40, https://doi.org/10.1007/s00704-013-0860-x, 2014.
Schneider, U., Finger, P., Meyer-Christoffer, A., Ziese, M., and Becker, A.: Global Precipitation Analysis Products of the GPCC. GPCC Internet Publication, DWD, 17 pp., 2018.
Shen, Y., Feng, M. N. Zhang, H. Z., and Gao, X.: Interpolation methods of China daily precipitation data, J. Appl. Meteorol. Sci., 21, 279–286, https://doi.org/10.3969/j.issn.1001-7313.2010.03.003, 2010 (in Chinese).
Shen, Y., Zhao, P., Pan, Y., and Yu, J.: A high spatiotemporal gauge-satellite merged precipitation analysis over China, J. Geophys. Res.-Atmos., 119, 3063–3075, https://doi.org/10.1002/2013JD020686, 2014.
Sorooshian, S., Hsu, K.-L., Gao, X., Gupta, H. V., Imam, B., and Braithwaite, D.: Evaluation of PERSIANN System Satellite-Based Estimates of Tropical Rainfall, B. Am. Meteorol. Soc., 81, 2035–2046, https://doi.org/10.1175/1520-0477(2000)081<2035:EOPSSE>2.3.CO;2, 2000.
Sunilkumar, K., Yatagai, A., and Masuda, M.: Preliminary evaluation of GPM IMERG rainfall estimates over three distinct climate zones with APHRODITEm Earth Space Sci., 6, 1321–1335, https://doi.org/10.1029/2018EA000503, 2019.
Tang, G., Ma, Y., Long, D., Zhong, L., and Hong, Y.: Evaluation of GPM Day-1 IMERG and TMPA Version-7 legacy products over Mainland China at multiple spatiotemporal scales, J. Hydrol., 533, 152–167, https://doi.org/10.1016/j.jhydrol.2015.12.008, 2016.
Tang, G., Clark, M. P., Papalexiou, S. M., Ma, Z., and Hong, Y.: Have satellite precipitation products improved over last two decades? A comprehensive comparison of GPM IMERG with nine satellite and reanalysis datasets, Remote Sens. Environ., 240, 111697, https://doi.org/10.1016/j.rse.2020.111697, 2020.
Xie, P. and Xiong, A.: A conceptual model for constructing high-resolution gauge-satellite merged precipitation analyses, J. Geophys. Res.-Atmos., 116, D21106, https://doi.org/10.1029/2011JD016118, 2011.
Xu, J., Ma, Z., Tang, G., Ji, Q., Min, X., Wan, W., and Shi, Z.: Quantitative Evaluations and Error Source Analysis of Fengyun-2-Based and GPM-Based Precipitation Products over Mainland China in Summer, 2018, Remote Sens., 11, 2992, https://doi.org/10.3390/rs11242992, 2019.
Yatagai, A., Xie, P., and Kitoh, A.: Utilization of a New Gauge-based Daily Precipitation Dataset over Monsoon Asia for Validation of the Daily Precipitation Climatology Simulated by the MRI/JMA 20-km-mesh AGCM, SOLA, 1, 193–196, https://doi.org/10.2151/sola.2005-050, 2005.
Yatagai, A., Kamiguchi, K., Arakawa, O., Hamada, A., Yasutomi, N., and Kitoh, A.: APHRODITE: Constructing a Long-Term Daily Gridded Precipitation Dataset for Asia Based on a Dense Network of Rain Gauges, B. Am. Meteorol. Soc., 93, 1401–1415, https://doi.org/10.1175/BAMS-D-11-00122.1, 2012.
Yong, B., Ren, L.-L., Hong, Y., Wang, J.-H., Gourley, J. J., Jiang, S.-H., Chen, X., and Wang, W.: Hydrologic evaluation of Multisatellite Precipitation Analysis standard precipitation products in basins beyond its inclined latitude band: A case study in Laohahe basin, China, Water Resour. Res., 46, W07542, https://doi.org/10.1029/2009WR008965, 2010.