the Creative Commons Attribution 4.0 License.
the Creative Commons Attribution 4.0 License.
 | 09 Jun 2020
Quality assurance and control on hydrological data off western Sardinia (2000–2004), western Mediterranean
Roberto Sorgente
Mireno Borghini
Seven oceanographic cruises in 5 years were organized in the Sea of Sardinia with the repeated collection of physical, chemical and biological data. An accurate and sustained quality assurance on physical sensors was enacted through pre- and postcruise calibration and verified during in situ acquisitions with the use of redundant sensors and other instruments. Moreover, for dissolved oxygen and conductivity, seawater samples at standard depths were frequently analyzed on board. Then an accurate quality control was used to verify all hydrological data profiles, which passed a further quality check following standard procedures. Finally all hydrological data have been included in two online public open-access datasets in the SEANOE (SEA scieNtific Open data Edition) repository (https://doi.org/10.17882/59867 and https://doi.org/10.17882/70340; Ribotti et al., 2019a, b). During and after all cruises Chlorophyll a and nutrient analyses were also carried out, but these data are not yet open access; the same applies for water current profiles, both at casts and during vessel moves, and geophysical data. These ocean data are the first covering the Sea of Sardinia for its whole extension. Here data and assurance and control procedures used are described as they have become standards in deep-sea acquisitions over the years.
- Article
(2230 KB) - Full-text XML
- BibTeX
- EndNote


Between May 2000 and January 2004 the National Research Council (CNR) of Italy collected hydrodynamic, chemical and biological data in the Sea of Sardinia during seven multidisciplinary oceanographic cruises, MedGOOS 1 to MedGOOS 7. These cruises were the first covering the whole Sea of Sardinia, from the shelf to the open sea, with oceanographic measurements. They were realized with the main aim of making a useful contribution to the knowledge of the local upper, intermediate and deep circulation and its interaction with the general Mediterranean circulation.
The study area is limited to between 38 and 42∘ N in latitude and between 7∘ E and the western Sardinian coast in longitude, with an offshore bottom reaching a depth of 2950 m in the abyssal plain. The shelf extends from 5.5 km in the north to 37 km in its center with a shelf break at about a 200 m depth (Conforti et al., 2016; Brambilla et al., 2019). It is an area of passage of recirculating waters between the two Mediterranean sub-basins and the Atlantic Ocean (Astraldi et al., 19varia99; Millot, 2005; Millot and Taupier-Letage, 2005; Schroeder et al., 2013) and is strongly influenced by the Algerian large-scale dynamics (Bouzinac and Millot, 1999; Puillat et al., 2002; Pessini et al., 2018). Very energetic surface fronts, cyclonic and anticyclonic vortices, and up- and downwelling events play an important role in the variability in and transport of physical, biological and chemical characteristics of the water masses (Puillat et al., 2003, 2006; Santinelli et al., 2008; Olita et al., 2013, 2014). Here, thanks to the data acquired during the first MedGOOS cruises, Puillat et al. (2003) and Ribotti et al. (2004) identified the main water masses usually observed in the rest of the western Mediterranean sea, like the Atlantic Water (AW) in the upper 150 m, the Winter Intermediate Water and its modified version known as the temperature minimum layer (Benzohra and Millot, 1995; Sorgente et al., 2003; Allen et al., 2008) at about 100–120 m depth in the AW, the intermediate waters below to an 800 m depth and the Western Mediterranean Deep Water (WMDW) to the bottom. Here, since 2005 the old WMDW has been undermined by the warmest and saltier new WMDW that diffused all over the western Mediterranean sub-basin due to the transfer of the Eastern Mediterranean Transient signal inside. This water is characterized by high heat and salt content from the advected Levantine Intermediate Water (LIW), forming the new WMDW in the northwestern Mediterranean sub-basin (Gasparini et al., 2005; Schroeder et al., 2006; Zunino et al., 2012; Ribotti et al., 2016).
Due to such oceanographic importance, since the 1950s French or Italian unsystematic cruises have been organized in the area, whose data are available in the PANGAEA (https://www.pangaea.de, last access: 20 December 2019) and SEANOE (SEA scieNtific Open data Edition) repositories (Dumas et al., 2018). In 2014, the NATO Science and Technology Organization (STO) Centre for Maritime Research and Experimentation (CMRE), based in La Spezia, organized a 2-week experiment with extensive use of ocean instruments and two research vessels in a limited area (110 km × 110 km). Its aims were to improve local ocean numerical simulations and forecasts and study the local ocean variability and structures (Onken, 2017a, b; Knoll et al., 2017; Hemming et al., 2017; Onken et al., 2018; Hernandez-Lasheras and Mourre, 2018).
Then recent experiments with drifters and deep-sea gliders were realized in the Sea of Sardinia and between Sardinia and the Balearic Islands, partially described by Olita et al. (2014).
In 2000–2004, instruments, sensors and data passed stringent controls following internationally accepted oceanographic processes necessary to obtain high-quality data. These practices included quality assurance, control and assessment according to standards and best practices that have been refined till the present (Hood et al., 2010; Bushnell et al., 2019; Pearlman et al., 2019). In this paper we describe all the procedures or best practices followed to assure and control the quality of the acquired data during the MedGOOS cruises, the sensors used, and the sensors' calibrations and intercomparisons.
Acquired hydrological data are in two datasets stored in an open-access repository, SEANOE (Ribotti et al., 2019a, b), linked with the EMODnet data network of marine centers and European thematic data portals like SeaDataNet and EurOBIS.
In the following two sections (Sects. 2 and 3) the vessel, instruments and sensors used in the seven cruises are described, with a distinction between data in repositories (Sect. 2) and not part of any repository (Sect. 3). The calibration of temperature and conductivity sensors is described Sect. 4, while in Sect. 5 the onboard control of CTD sensor stability is detailed. Discussion and conclusions close the paper.
During the seven cruises, profiles of physical–chemical parameters were acquired at planned stations, whose number varied due to the length of and the strategy adopted in each cruise, the wideness of the covered area, and the sea conditions. So the activities range from the 38 stations realized during the 6 d long MedGOOS 1 in 2000 and the 92 during the 21 d long MedGOOS 6 in 2003. In September 2001, only the southern part of the Sea of Sardinia with 41 stations was covered due to bad weather conditions.
The 61.30 m long R/V Urania of CNR was used in all cruises. This was a modern multidisciplinary research vessel equipped with instruments to study physical and chemical water quality parameters and laboratories for biological and geological analyses. For its dynamic positioning the vessel was equipped with an integrated navigation system constituting two DGPS antennas and one Loran-C receiver that ensured an optimal use of the scientific equipment during the cruises. Such a system was managed through software by Andrews Hydrographics installed on a 33 MHz HP386 PC, which permitted the downloading of navigation and meteorological data in ASCII format with geographic and kilometric coordinates at a frequency of 10 min.
On board, an SBE 911plus CTD probe (by Sea-Bird Scientific, Inc.), mounted on a 24 10 L Niskin bottles rosette for water column sampling, was used to acquire hydrological data during all the seven cruises (Fig. 1).
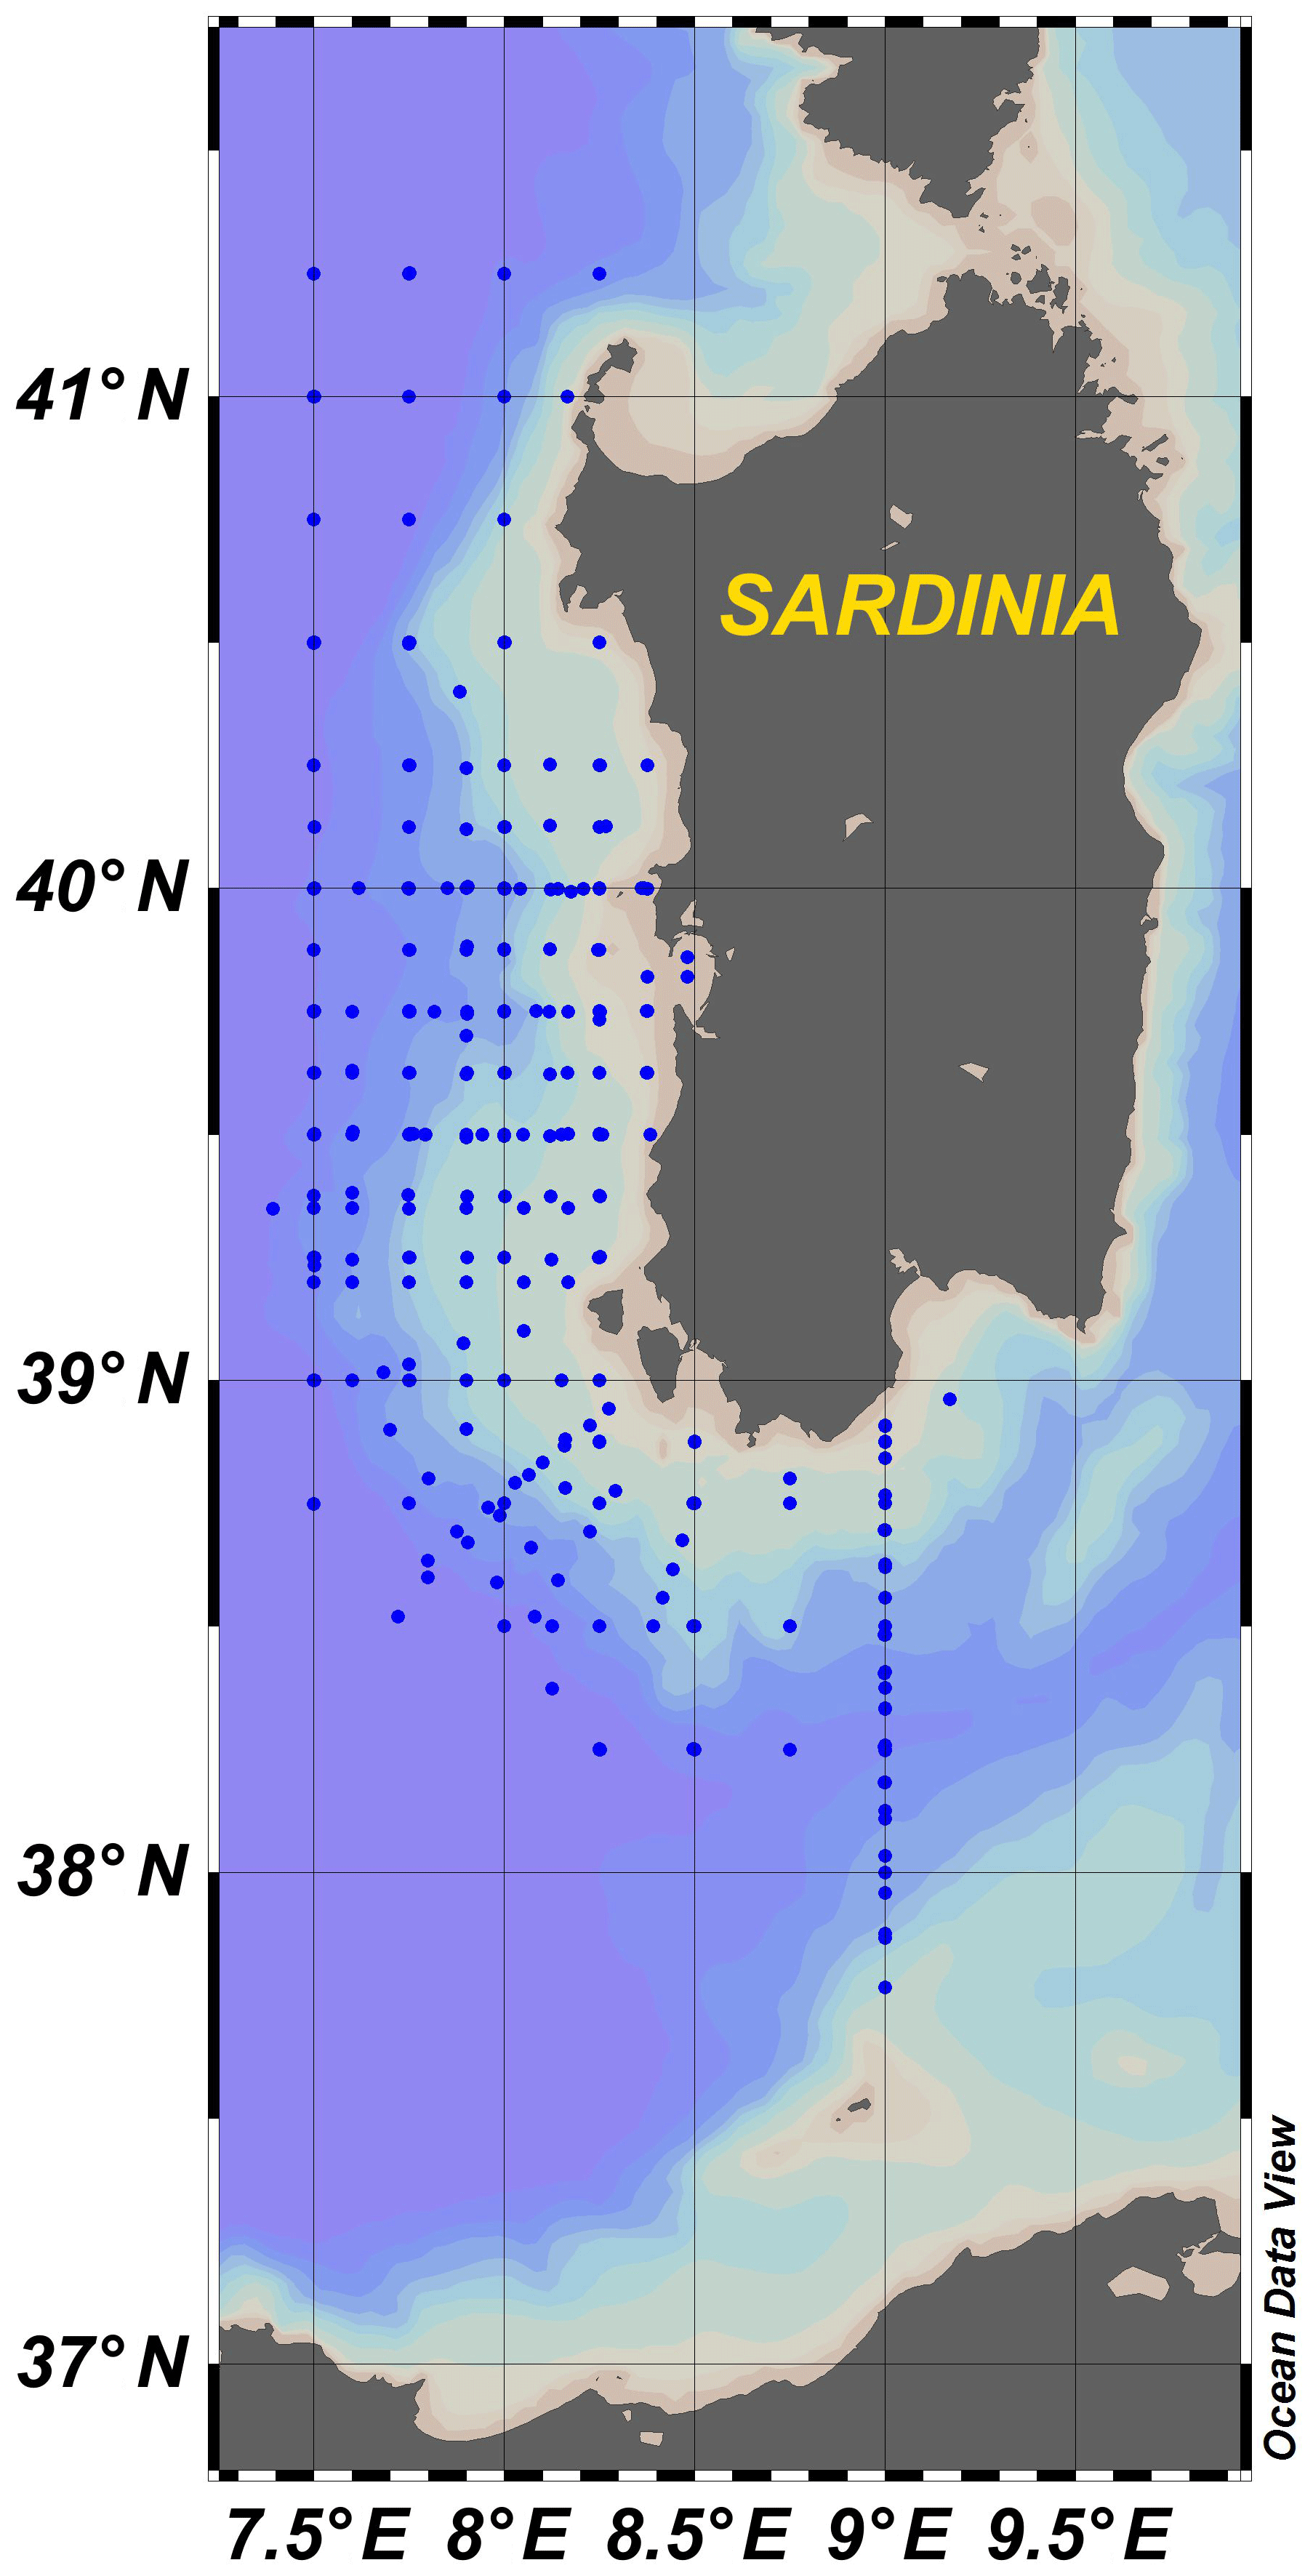
Figure 1All the CTD casts during the seven cruises in the Sea of Sardinia (western Mediterranean).
Specifically, the sensors installed on the probe had the following characteristics (Table 1).
-
Pressure (db). A Digiquartz 4000 pressure transducer was used. The transducer had a resolution of 0.01 ppm, oscillator frequency of 34–38 KHz and temperature range of 0–125 ∘C.
-
Water temperature (∘C). An SBE 3F thermometer was used with a response time of 70 ms, temperature range of −5 to +35 ∘C, accuracy of about 0.004 ∘C yr−1 and a resolution of 0.0003 ∘C. The international practical temperature scale known as IPTS-68 was applied on data from MedGOOS 1, 2 and 6, while the international temperature scale of 1990, known as ITS-90, was applied on data from MedGOOS 4 and from MedGOOS 3, 5, 7 on secondary sensors.
-
Conductivity (mS cm−1). An SBE 4 sensor was used with a range of 0.0–7 S m−1, resolution of 0.00004 S m−1, accuracy of about 0.0003 S m−1 per month, and response time of 0.085sec with pump or 0.17 s without pump.
-
Dissolved oxygen. An SBE 13 Beckman or YSI sensor was used with a range of 0.0–15 mL L−1, accuracy of 0.1 mL L−1, resolution of 0.01 mL L−1 and response time of 2 s at a temperature of 25 ∘C during cruises MedGOOS 1, 2, 3 and 4. During cruises MedGOOS 5, 6 and 7, an SBE 43 polarographic membrane sensor for pumped CTD applications with titanium (7000 m) housing was used with a range of 120 % of surface saturation in all natural waters and accuracy of ±2 % of saturation.
-
Fluorescence. A Sea Tech Inc. fluorometer was used with the energy emitted by the flash lamp of 0.25 J for the flash, a temperature range of 0–25 ∘C and a resolution of 0.15 µg L−1.
Redundant or secondary sensors were always used for a data quality assessment (as defined in Bushnell et al., 2019) of both temperature and salinity measurements, except during the cruise MedGOOS 1 in May–June 2000 (see Table 1). A secondary SBE 43 sensor for dissolved oxygen was also added just in the last three cruises, from MedGOOS 5 to 7. These redundant sensors were a useful method of comparison to evaluate the stability of primaries both during the acquisition and at a following visual quality check of profiles.
Table 1The list of sensors used and activities realized during the seven MedGOOS cruises. Numbers in brackets for reversing thermometers are the numbers of the Niskin bottles where installed.
For the same reason, RTM 4002 digital deep-sea reversing thermometers by Sensoren Instrumente Systeme GmbH (SiS) were mounted on Niskin bottles during MedGOOS 4 (three thermometers) and 5 (four thermometers). These instruments acquired sea temperature at depths, defined by the closing of the Niskin bottle they were mounted on, usually sampling near the bottom where temperature is more stable. Reversing thermometers had a depth range of up to 10 000 m and a temperature range of between −2 ∘C and +40 ∘C. They had a resolution of ±0.001 ∘C between −2.000 and 19.999 ∘C and of ±0.01 ∘C between 20.00 and 40.00 ∘C and a stability of 0.00025 ∘C per month. Its pressure housing was made of a glass tube closed at its ends by metal stoppers, one containing the platinum sensor and the other the battery. Its internal mercury switch was activated by inverting the instrument at defined depths.
In some cruises (see Table 1) current meter data were acquired both at a station (lowered acoustic Doppler current profiler or LADCP) and en route (shipborne acoustic Doppler current profiler or SADCP), while geophysical sub-bottom profiler data were just acquired during the cruise MedGOOS 2. At casts, the real-time display of CTD data made it possible to identify a certain number of stations where to take water samples for the estimation of nutrients (nitrites, nitrates and phosphates), Chlorophyll a, chromophoric dissolved organic matter (CDOM) and dissolved organic carbon (DOC). As all these data are not in the two datasets in the SEANOE repository mentioned above (Ribotti et al., 2019a, b), they will be shortly described here as part of the cruises data. All measures were carried out trying to reconcile the different procedures.
The sub-bottom profiler was a GeoPulse Transmitter Model 5430A at frequencies ranging between 2 and 15 kHz with a maximum emitted power of 10 kW. It was just used on a small portion of the western Sardinian shelf north of Oristano in April 2001 during the cruise MedGOOS 2.
Starting from the cruise MedGOOS 2, profiles of current speed were acquired during CTD casts by two synchronized 300 kHz RDI Workhorse acoustic Doppler current profilers (ADCPs), by RD Instruments Inc. (now Teledyne), USA, configured in “Lowered” mode and installed on the rosette with one looking up (named slave) and the other down (named master). They acquired horizontal current data in 20 cells each with a 10 m width from the instrument with an impulse per second. Then under the keel of the vessel, a 38 kHz ADCP profiled currents in 8 m wide cells over a 1000 m depth through an impulse per second during transfers between stations. Another impulse was used to correct the water speed and obtain its real speed as regards the sea bottom (bottom tracking). Configuration of ADCPs used in the two modes, Lowered and Shipborne, in 2001–2004 are in agreement with the more recent internationally recognized GO-SHIP protocols described by Hood et al. (2010).
For Chlorophyll a (Chl a), CDOM and DOC, all the water samples were filtered on 0.42 µm Whatman GF/F glass microfiber filters for Chl a and 0.22 µm membrane filter (Sartorius, Minisart, SM 16534 K) for DOC and CDOM; this was to remove the particulate fraction immediately after collection. Then filters were frozen at +4 ∘C to be analyzed at labs following standard procedures described by Lazzara et al. (1990) for Chl a and by Vignudelli et al. (2004) and Santinelli et al. (2008) for CDOM and DOC. For nutrients, during the first three MedGOOS cruises, water samples were partially analyzed on board by a Systea μCHEM autoanalyzer, while remaining samples were frozen at −20 ∘C following Strickland and Parsons (1972). In the following cruises all water samples were frozen and then analyzed once back in the laboratory.
The pre- and postcruise calibration of the sensors of temperature and conductivity was performed at the oceanographic instrument (CTD) calibration facilities of the SACLANT Undersea Research Center (SACLANTCEN, now STO-CMRE) in La Spezia, Italy. The center was funded in 1959 initially for submarine warfare, but it developed and maintained an oceanographic instruments test and calibration facility that enabled the acquisition of high-quality ocean data and was unique in Italy for years. Two calibration seawater tanks were equipped with two very high precision Neil Brown ATB-1250 platinum resistance thermometer bridges for temperature and two very high precision Neil Brown CSA-1250 conductivity–salinity adaptors for conductivity. Seawater samples were analyzed for conductivity by a high-precision 8400B Autosal laboratory salinometer, from Guildline Instruments Ltd., standardized with International Association for the Physical Sciences of the Oceans (IAPSO) Standard Seawater and an accuracy of <0.002 psu on a range of salinity between 2 and 42 psu.
Before SBE sensors calibration, the two temperature sensors in the bath were adjusted to a triple-point-of-water cell (TPW) at the temperature of 0.01 ∘C and a thermometric standard gallium-melting-point cell for the highest value of 29.7646 ∘C. So at SACLANTCEN a calibration of these sensors was realized exceeding World Ocean Circulation Experiment (WOCE) standards (Millard and Yang, 1993). These two calibrations permitted us to substantially generate a slope correction, used in the configuration file of the SBE Seasoft suite of programs, for data acquired during each cruise, thus improving their quality.
Despite the calibration of temperature and conductivity sensors before and after each cruise, all sensors can significantly drift over the course of a cruise. This can dramatically reduce the quality of the data. As high-quality conductivity and oxygen data enable the definition of local water masses with high precision, particularly in the deep sea, then the use of international standards is mandatory in oceanography. The stability of conductivity and dissolved oxygen (DO) sensors must be verified on board through a comparison with data from water samples. During the cruise all involved personnel and all acquired data are usually together, so it is relatively easy to check and correct repetitive problems before they can further degrade the data.
Conductivity data were checked against the onboard analyses by a Guildline 8400B Autosal laboratory salinometer, similar to that described above, while DO data were analyzed using the Winkler titration method with a measured precision in triplicate analyzed samples of 0.01 mL L−1 (expressed in standard deviation units). The sampling was at defined depths at the surface; at 25, 50, 100, 200, 300, 400, 500, 750, 1000, 1250, 1500, 1750, 2000, 2500 and 3000 m; and at the bottom.
The Autosal salinometer was operated in a small temperature-regulated room, part of the onboard wet laboratory, and its bath temperature was held at 24±2 ∘C. The salinometer was standardized daily with the use of IAPSO Standard Seawater provided by 200 mL clear sealed glass bottles, before starting the analyses. Seawater for conductivity was taken after that for DO and collected in 250 mL clear bottles with screw caps. Each bottle and cap was rinsed three times with the sampled water, and each bottle was filled to its shoulder. Then the bottles were stored for no longer than 24 h in the conditioned room before their analyses. Niskin bottles collected water at the deepest casts of the cruise and at least once a day.
The oxygen sensors used during the cruises were not calibrated, so during each cruise different verifications were realized to verify possible sensors shifts through the Winkler titration method (Winkler, 1888). This method, used for in situ DO analyses, consists of reacting oxygen in the samples with two reagents (I and II) and with a final titration. The reagent I is a solution of MnSO4 and NaOH, while the reagent II is a solution of NaI and H2SO4. The utmost attention is paid to draw the oxygen samples first from Niskin bottles and into dark glass bottles. This avoids the formation of air bubbles during the sampling itself or the execution of the analysis. The sampling was realized as for conductivity considering frequency and methodology. The water sampled at 100 m of depth was used to obtain three blank solutions in dark glass bottles and one standard solution in a larger plastic bottle. So blanks and standards were run often. Then different quantities of reagents were added: 0.5 mL (the usual for all samples) of reagent I and reagent II in the first blank, its double in the second blank, and its triple in the third. No reagents were initially added in the standard solution. All samples and the three blank solutions, not the standard, were left in the dark for at least 2 h and then analyzed within 24 h of their collection. During the analysis of the standard solution and reagents I and II, 0.5 mL L−1 of H2SO4 and then of KIO3 were added. The samples have been analyzed through the program TIAMO (TItration And MOre) 2.0 by Metrohm. Thanks to the data from the water samples, the possible estimations of changes in slope (Soc) and offset (Voffset), in the linear relationship between oxygen concentration and voltage output that indicate a loss of sensitivity of the sensors, were realized performing a linear regression line of the data calculated from the following Eq. (1) (Owens and Millard Jr., 1985; Millard and Yang, 1993; SBE, 2008a):
where Oxsol(T,S) is the oxygen solubility (mL L−1) at a defined temperature and salinity; T and K are the CTD temperatures in ∘C and in K; P is the CTD pressure (dbar); and A, B, C and E are calibration coefficients.
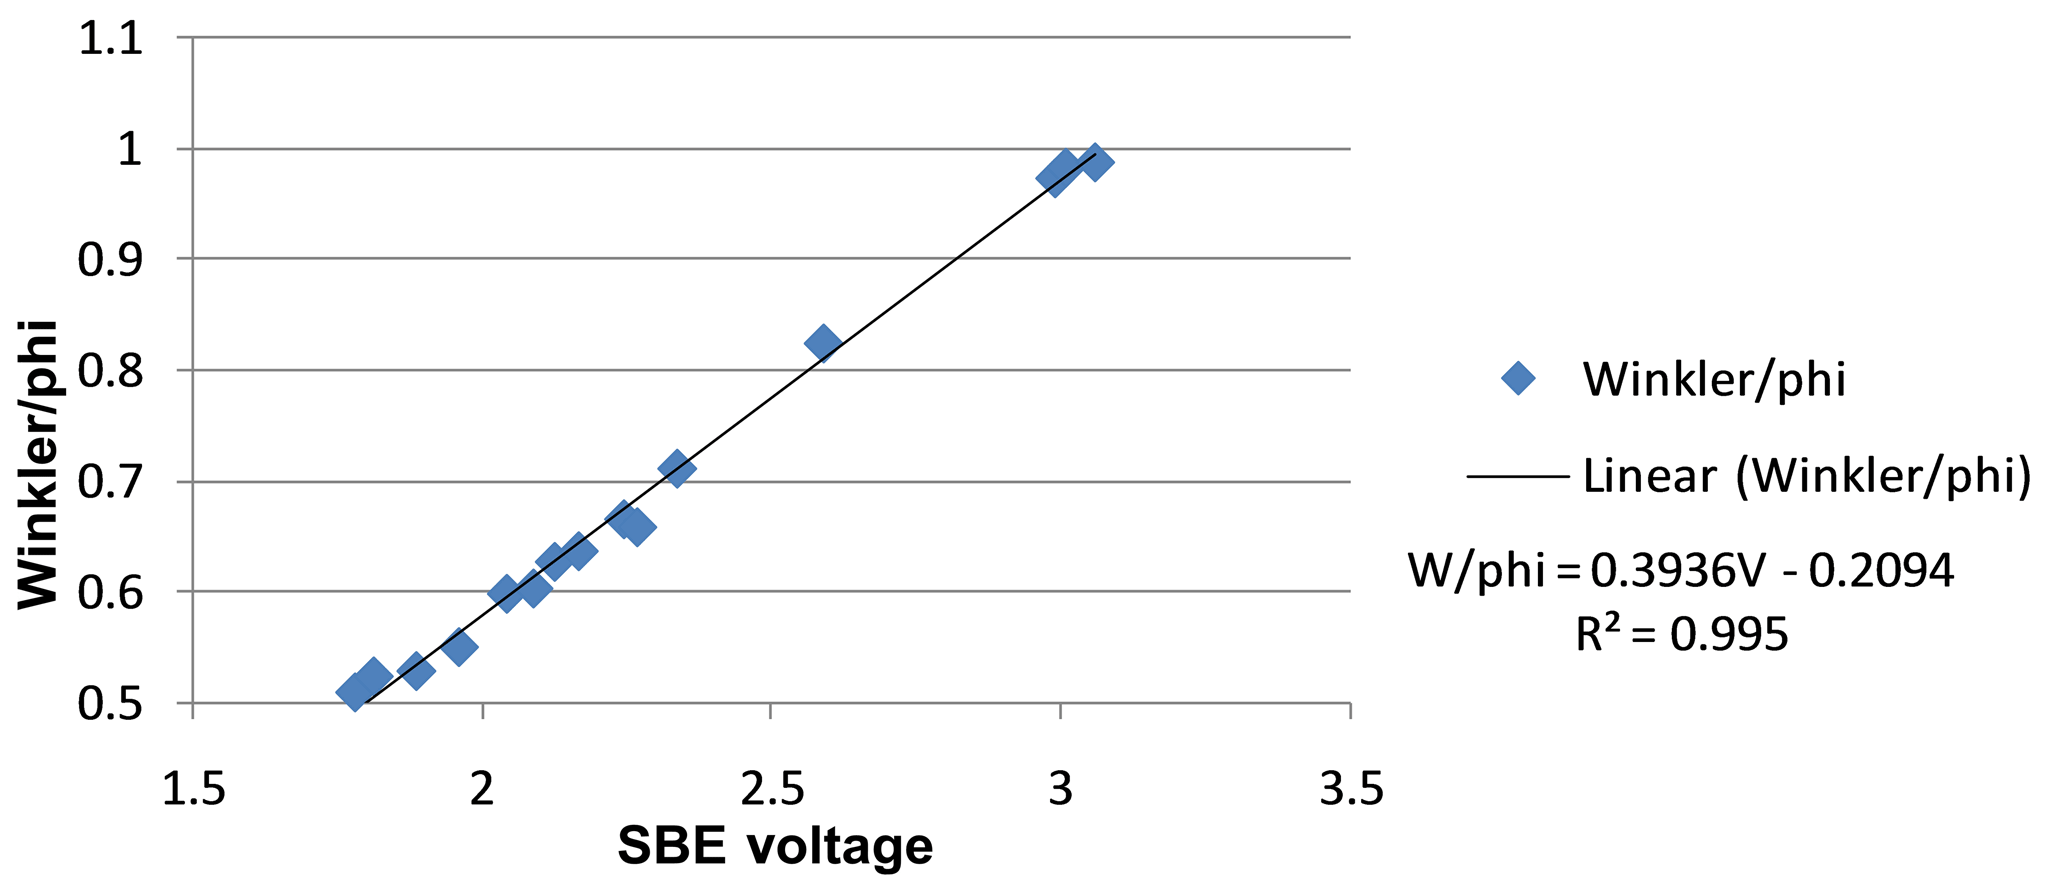
At a defined deep station, the regression is calculated by using the measured Winkler oxygen concentration divided by φ as a dependent variable and the oxygen sensor output voltage as an independent variable.
In Fig. 2 an example of linear regression applied on a deep CTD station with the calculation of the new Soc (0.3936) and the new Voffset SOC .
During cruises from MedGOOS 4 to MedGOOS 7 temperature data were checked at defined depths against reversing thermometers installed that correspond to the bottles numbered 1, 3, 5 and 7 of the rosette sampler.
Furthermore CTD and oxygen data were compared with those analyzed on board from samples or acquired with other instruments in order to determine or visually check possible shifts. Acquired CTD data were processed through the standardized procedures of the SBE Data Processing software. After comparisons and in the case of malfunction, the use of the secondary sensor instead of the primary was evaluated (see in Fig. 3 a plot for conductivity and DO).
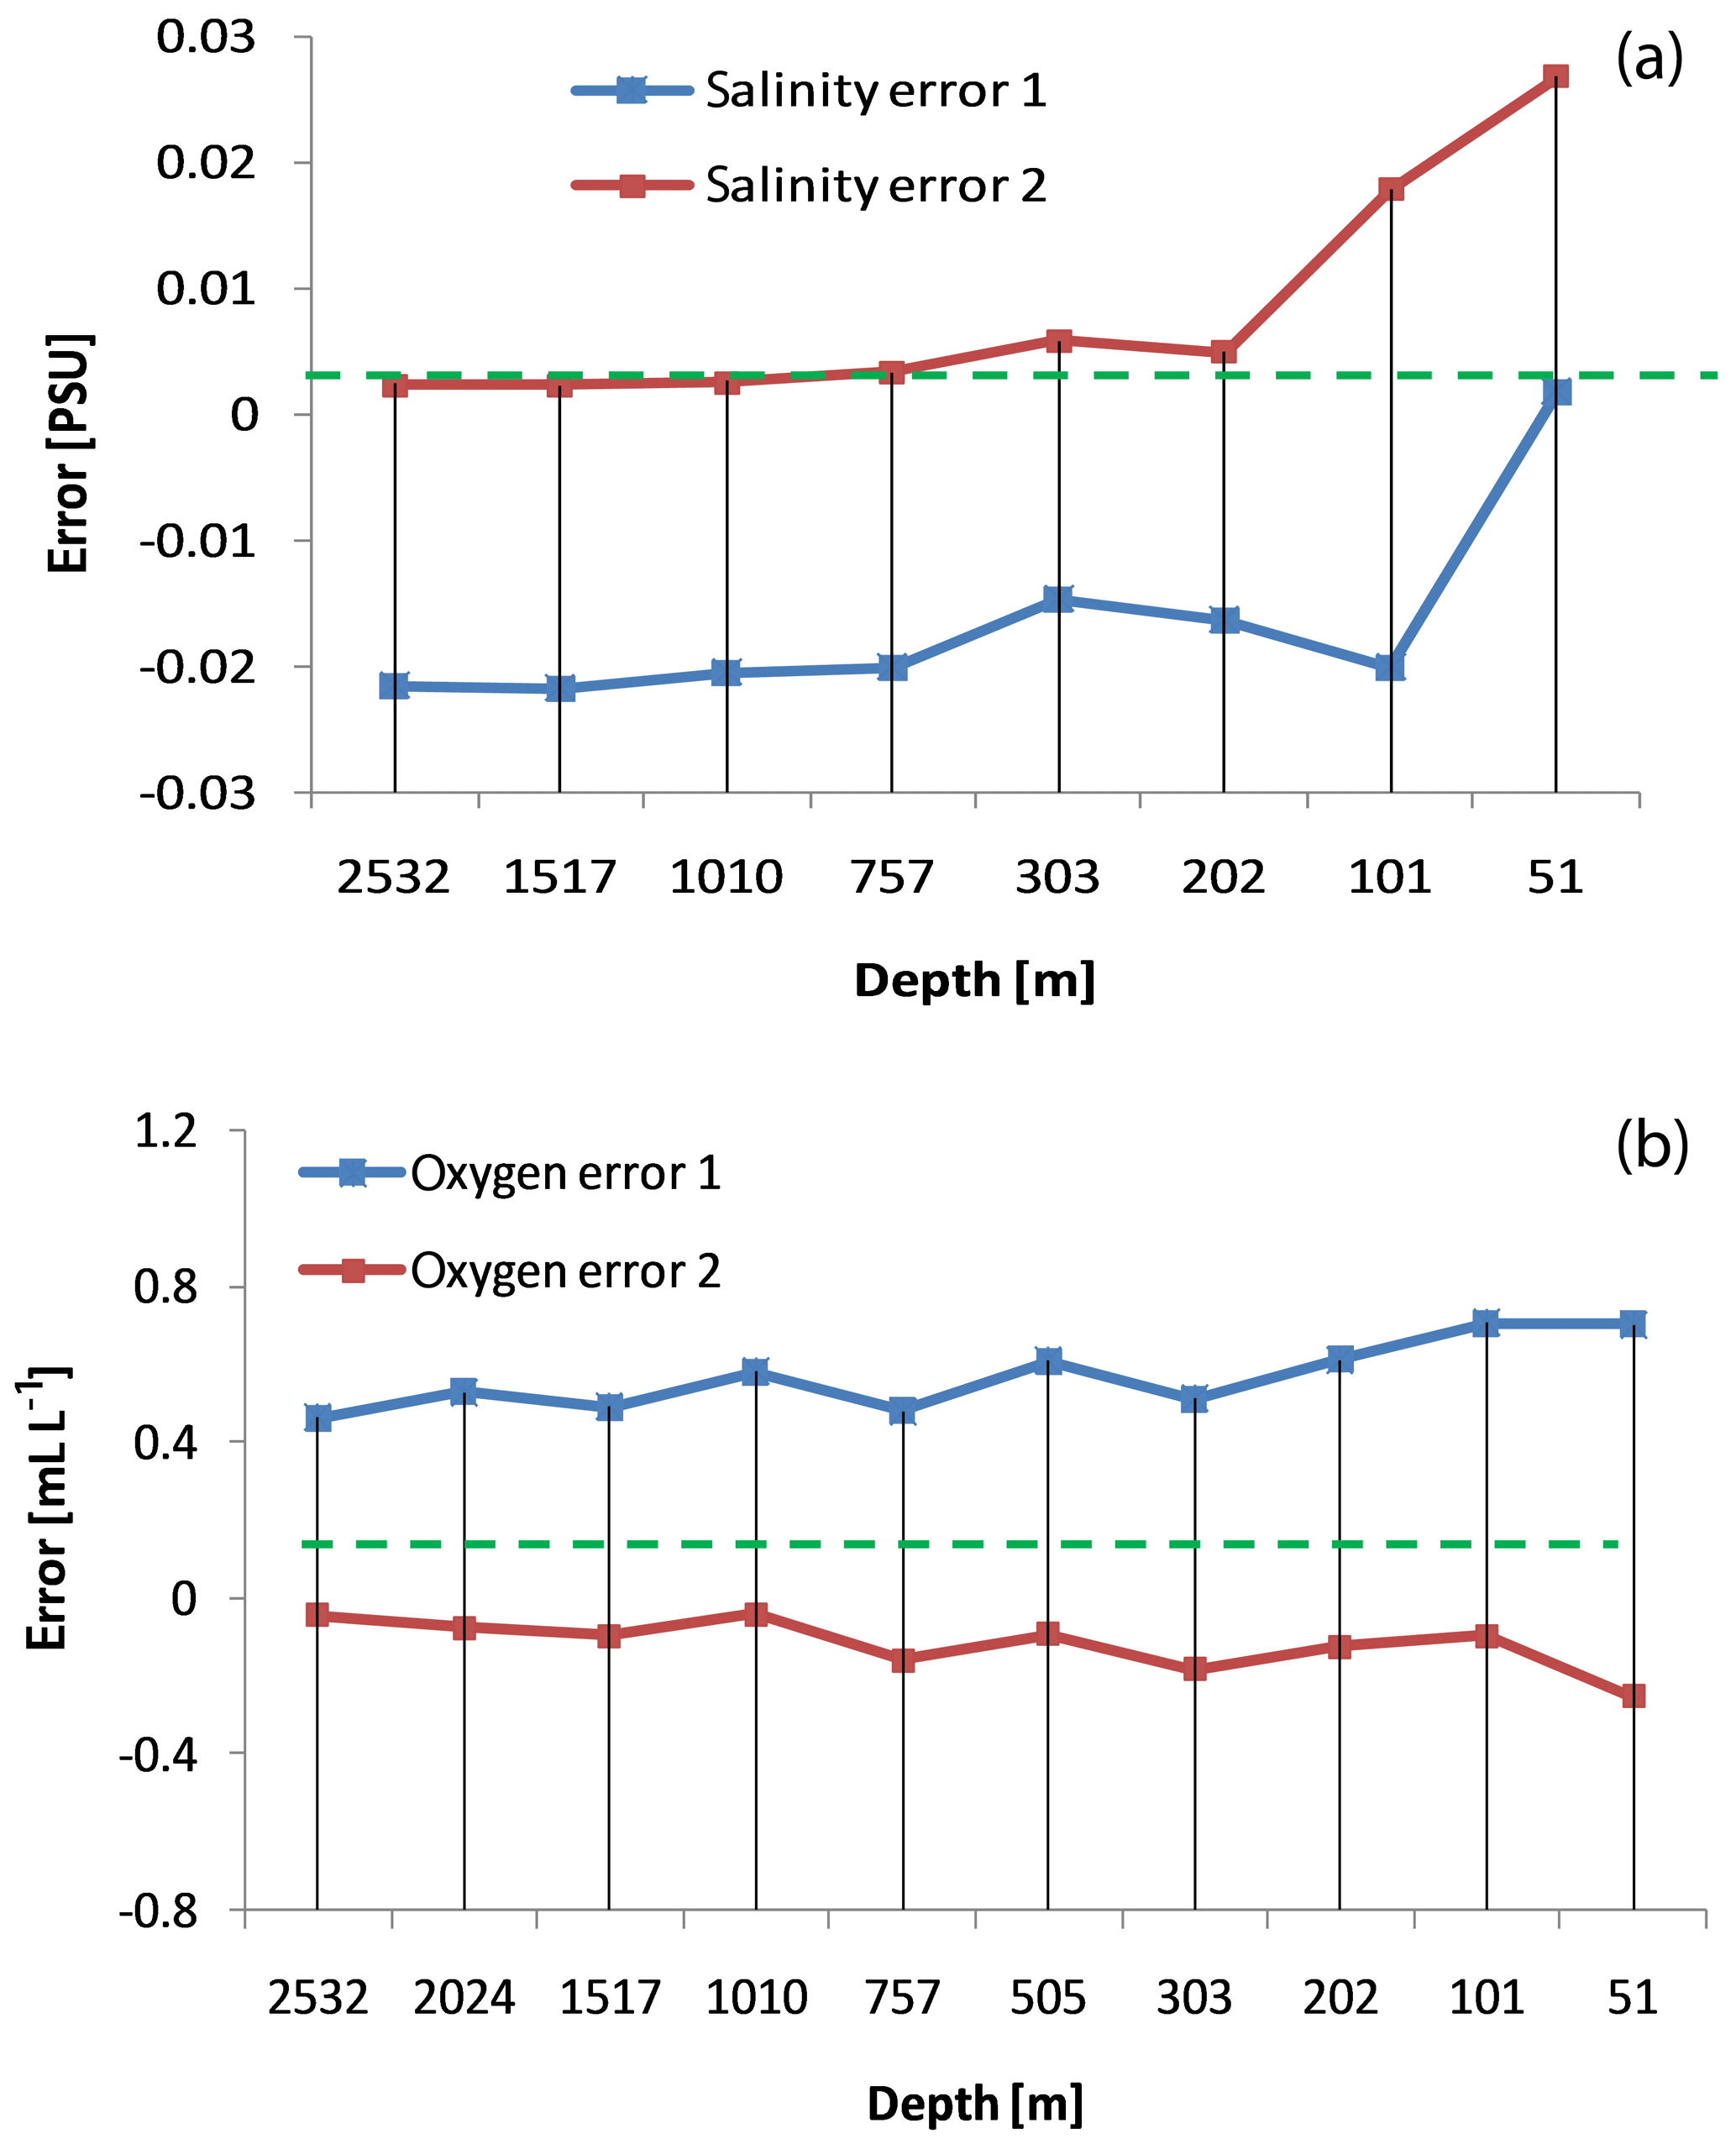
Figure 3The salinity (a) and DO (b) errors between what was measured by the sensor on the probe and what was measured on board from water samples for the two conductivity and oxygen sensors, 1 and 2, along a vertical profile in a deep station.
After the postcruise calibration, if the shift was constant or systematic then an average of all data (primary, secondary, samples, etc) was used to correct data. If the shift was random, Soc and Voffset for DO, slope and offset for conductivity and temperature were recalculated and the data corrected following the procedures described in the application note numbers 64-2 (SBE, 2008b, 2012) and 31 (SBE, 2016), respectively.
Chl a fluorescence was calibrated following the instructions given by SBE (2008a) where the Seasoft coefficients for the Sea Tech fluorometer are calculated. No validation of the data has been applied after the cruises. The fluorescence is reported in relative fluorescence units (RFU) in the datasets. Also pressure sensors were not calibrated as they are usually stable, but, if problems occurred, they were sent to SBE Inc. in the United States for calibration.
The two datasets described in this study are publicly available free of charge from the SEANOE data repository (Ribotti et al., 2019a, https://doi.org/10.17882/59867, and Ribotti et al., 2019b, https://doi.org/10.17882/70340). The presented datasets are composed of CTD data in Ocean Data View (ODV) TXT spreadsheet and collection file formats divided per cruise. Metadata are available in TXT, RIS, XLS, RTF and BIBTEX formats.
The rescue and reprocessing of hydrodynamic data is ongoing in order to reorganize them, in a quality controlled manner, into a database. The same will be carried out for the biological parameters. A first dataset of nutrients data from more recent cruises (late 2014–2017) is available at https://doi.org/10.5194/essd-2019-136 (Belgacem et al., 2019).
Several processes to obtain high-quality ocean data were followed during the 2000–2004 MedGOOS cruises in the Sea of Sardinia, western Mediterranean. Quality assurance, control and assessment, according to standard and best practices, defined at international level (see Bushnell et al., 2019) and after decades of application in ocean data acquisition, were considered during all cruises and are in agreement with recent standardized procedures for all sensors (Hood et al., 2010). Sensors underwent pre- and postcruise calibration and included redundancies during cruises; results were compared with water samples analyzed on board. These efforts have led to the achievement of the standard precision required even today, thanks to the accuracy of the sensors used. Uncertainty in measurements, defined as “the quantification of the doubt that exists about results of any measurements”, exists in these data but has been reduced by the skill of the same operators or analysts following all the processes at any time for all the included years and cruises. Now oceanographic data from seven cruises are collected in two open-access datasets available online, including ocean parameters like conductivity, temperature, DO and Chlorophyll a fluorescence. These ocean data are the first available for the Sea of Sardinia and are important for characterizing the general circulation and the dynamics in the western Mediterranean.
AR led some cruises, organized the two datasets and led the writing of the paper. MB led some cruises, finalized quality assurance and quality control procedures described in the paper, and collaborated in the paper writing. RS collaborated in the paper writing.
The authors declare that they have no conflict of interest.
The data used in this work have been collected in the framework of national and European projects like the Italian MIUR project SIMBIOS (Operative Programme of the Marine Environment Plan, Cluster C10, Project no. 13 – D.n. 778.RIC); the EU Marie Curie Host Fellowship ODASS (HPMD-CT-2001-00075); the EU MAMA (EVR1-CT-2001-20010), the EU MFSPP (MAS3-CT98–0171); and the EU MFSTEP (EVK3-CT-2002-00075). The authors thank the chiefs and the crews on board the R/V Urania for their essential support during the mentioned cruises, Massimiliano Di Bitetto as CNR cruises leader or coleader and, Silvana Vallerga in charge of some funding projects. We also want to thank Giuseppe Maria Rosario Manzella from the Italian National Agency for New Technologies, Energy and Sustainable Economic Development (ENEA) in La Spezia (Italy) for the creation and maintenance of the Mediterranean Marine Database for years. This work is dedicated to Gabriele Petrone, who died on 25 August 2015 aboard the R/V Urania.
This paper was edited by Francois Schmitt and reviewed by Sarantis Sofianos and Alain Lefebvre.
Allen, J. T., Painter, S. C., and Rixen, M.: Eddy transport of Western Mediterranean Intermediate Water to the Alboran Sea, J. Geophys. Res., 113, C04024, https://doi.org/10.1029/2007JC004649, 2008.
Astraldi, M., Balopoulos, S., Candela, J., Font, J., Gacic, M., Gasparini, G. P., Manca, B., Theocharis, A., and Tintoré, J.: The role of straits and channels in understanding the characteristics of Mediterranean circulation, Prog. Oceanogr., 44, 65–108, https://doi.org/10.1016/S0079-6611(99)00021-X, 1999.
Belgacem, M., Chiggiato, J., Borghini, M., Pavoni, B., Cerrati, G., Acri, F., Cozzi, S., Ribotti, A., Alvarez, M., Lauvset, S. K., and Schroeder, K.: Dissolved Inorganic Nutrients in the Western Mediterranean Sea (2004–2017), Earth Syst. Sci. Data Discuss., https://doi.org/10.5194/essd-2019-136, in review, 2019.
Benzohra, M. and Millot, C.: Characteristics and circulation of the surface and intermediate water masses off Algeria, Deep-Sea Res. Pt. I, 42, 1803–1830, https://doi.org/10.1016/0967-0637(95)00043-6, 1995.
Bouzinac, C. and Millot, C.: Hydrology and currents observed in the channel of Sardinia during the PRIMO1 experiment from November 1993 to October 1994, J. Marine Syst., 20, 333–355, https://doi.org/10.1016/S0924-7963(98)00074-8, 1999.
Brambilla, W., Conforti, A., Simeone, S., Carrara, P., Lanucara, S., and De Falco, G.: Data set of submerged sand deposits organised in an interoperable spatial data infrastructure (Western Sardinia, Mediterranean Sea), Earth Syst. Sci. Data, 11, 515–527, https://doi.org/10.5194/essd-11-515-2019, 2019.
Bushnell, M., Waldmann, C., Seitz, S., Buckley, E., Tamburri, M., Hermes, J., Henslop, E., and Lara-Lopez, A.: Quality Assurance of Oceanographic Observations: Standards and Guidance Adopted by an International Partnership, Front. Mar. Sci., 6, 706, https://doi.org/10.3389/fmars.2019.00706, 2019.
Conforti, A., Budillon, F., Tonielli, R., and De Falco, G.: A newly discovered Pliocene volcanic field on the western Sardinia continental margin (western Mediterranean), Geo-Mar. Lett., 36, 1–14, https://doi.org/10.1007/s00367-015-0428-0, 2016.
Dumas, F., Garreau, P., Louazel, S., Correard, S., Fercoq, S., Le Menn, M., Serpette, A., Garnier, V., Stegner, A., Le Vu, B., Doglioli, A., and Gregori, G.: PROTEVS-MED field experiments: Very High Resolution Hydrographic Surveys in the Western Mediterranean Sea, SEANOE, https://doi.org/10.17882/62352, 2018.
Gasparini, G. P., Ortona, A., Budillon, G., Astraldi, M., and Sansone, E.: The effect of the Eastern Mediterranean Transient on the hydrographic characteristics in the Strait of Sicily and in the Tyrrhenian Sea, Deep-Sea Res. Pt. I, 52, 915–935, https://doi.org/10.1016/j.dsr.2005.01.001, 2005.
Hemming, M. P., Kaiser, J., Heywood, K. J., Bakker, D. C. E., Boutin, J., Shitashima, K., Lee, G., Legge, O., and Onken, R.: Measuring pH variability using an experimental sensor on an underwater glider, Ocean Sci., 13, 427–442, https://doi.org/10.5194/os-13-427-2017, 2017.
Hernandez-Lasheras, J. and Mourre, B.: Dense CTD survey versus glider fleet sampling: comparing data assimilation performance in a regional ocean model west of Sardinia, Ocean Sci., 14, 1069–1084, https://doi.org/10.5194/os-14-1069-2018, 2018.
Hood, E. M., Sabine, C. L., and Sloyan, B. M. (Eds.): The GO-SHIP Repeat Hydrography Manual: A Collection of Expert Reports and Guidelines, IOCCP Report No.14, ICPO Publication Series No.134, available at: http://www.go-ship.org/HydroMan.html (last access: 6 June 2020), version 1, 2010.
Knoll, M., Borrione, I., Fiekas, H.-V., Funk, A., Hemming, M. P., Kaiser, J., Onken, R., Queste, B., and Russo, A.: Hydrography and circulation west of Sardinia in June 2014, Ocean Sci., 13, 889–904, https://doi.org/10.5194/os-13-889-2017, 2017.
Lazzara, L., Bianchi, F., Falcucci, M., Hull, V., Modich, M., and Ribera D'Alcalà, M.: Pigmenti clorofilliani, in: Metodi nell'ecologia del plancton marino, Nova Thalassia, 1st Edn., edited by: Innamorati, M., Ferrari, I., Marino, D., and Ribera D'Alcalà, M., Edizione LINT, Trieste, Italy, 11, 207–223, 1990.
Millard, R. C. and Yang, K.: CTD Calibration and Processing Methods Used at Woods Hole Oceanographic Institution, Woods Hole Oceanog. Inst. Tech. Rept., WHOI-93-44, 101 pp., 1993.
Millot, C.: Circulation in the Mediterranean Sea: Evidences, debates and unanswered questions, Sci. Mar., 69, 5–21, https://doi.org/10.3989/scimar.2005.69s15, 2005.
Millot, C. and Taupier-Letage, I.: Circulation in the Mediterranean Sea, in: The Mediterranean Sea. Handbook of Environmental Chemistry book series, edited by: Saliot, A., Springer, Berlin-Heidelberg, Germany, 5k, https://doi.org/10.1007/b107143, 2005.
Olita, A., Ribotti, A., Fazioli, L., Perilli, A., and Sorgente, R.: Surface circulation and upwelling in the western Sardinia sea: a numerical study, Cont. Shelf Res., 71, 95–108, https://doi.org/10.1016/j.csr.2013.10.011, 2013.
Olita, A., Sparnocchia, S., Cusí, S., Fazioli, L., Sorgente, R., Tintoré, J., and Ribotti, A.: Observations of a phytoplankton spring bloom onset triggered by a density front in NW Mediterranean, Ocean Sci., 10, 657–666, https://doi.org/10.5194/os-10-657-2014, 2014.
Onken, R.: Validation of an ocean shelf model for the prediction of mixed-layer properties in the Mediterranean Sea west of Sardinia, Ocean Sci., 13, 235–257, https://doi.org/10.5194/os-13-235-2017, 2017a.
Onken, R.: Forecast skill score assessment of a relocatable ocean prediction system, using a simplified objective analysis method, Ocean Sci., 13, 925–945, https://doi.org/10.5194/os-13-925-2017, 2017b.
Onken, R., Fiekas, H.-V., Beguery, L., Borrione, I., Funk, A., Hemming, M., Hernandez-Lasheras, J., Heywood, K. J., Kaiser, J., Knoll, M., Mourre, B., Oddo, P., Poulain, P.-M., Queste, B. Y., Russo, A., Shitashima, K., Siderius, M., and Thorp Küsel, E.: High-resolution observations in the western Mediterranean Sea: the REP14-MED experiment, Ocean Sci., 14, 321–335, https://doi.org/10.5194/os-14-321-2018, 2018.
Owens, W. B. and Millard Jr., R. C.: A new algorithm for CTD oxygen calibration, J. Phys. Oceanogr., 5, 621–631, https://doi.org/10.1175/1520-0485(1985)015<0621:ANAFCO>2.0.CO;2, 1985.
Pearlman, J., Bushnell, M., Coppola, L., Karstensen, J., Buttigieg, P. L., Pearlman, F., Simpson, P., Barbier, M., Muller-Karger, F. E., Munoz-Mas, C., Pissierssens, P., Chandler, C., Hermes, J., Heslop, E., Jenkyns, R., Achterberg, E. P., Bensi, M., Bittig, H. C., Blandin, J., Bosch, J., Bourles, B., Bozzano, R., Buck, J. J. H., Burger, E. F., Cano, D., Cardin, V., Llorens, M. C., Cianca, A., Chen, H., Cusack, C., Delory, E., Garello, R., Giovanetti, G., Harscoat, V., Hartman, S., Heitsenrether, R., Jirka S., Lara-Lopez, A., Lantéri, N., Leadbetter, A., Manzella, G. M. R., Maso, J., McCurdy, A., Moussat, E., Ntoumas, M., Pensieri S., Petihakis, G., Pinardi, N., Pouliquen, S., Przeslawski, R., Roden, N. P., Silke J., Tamburri, M. N., Tang H., Tanhua, T., Telszewski, M., Testor, P., Thomas, J., Waldmann, C., and Whoriskey, F.: Evolving and Sustaining Ocean Best Practices and Standards for the Next Decade, Front. Mar. Sci., 6, 277, https://doi.org/10.3389/fmars.2019.00277, 2019.
Pessini, F., Olita, A., Cotroneo, Y., and Perilli, A.: Mesoscale eddies in the Algerian Basin: do they differ as a function of their formation site?, Ocean Sci., 14, 669–688, https://doi.org/10.5194/os-14-669-2018, 2018.
Puillat, I., Taupier-Letage, I., and Millot, C.: Algerian Eddies lifetime can near 3 years, J. Marine Syst., 31, 245–259, https://doi.org/10.1016/S0924-7963(01)00056-2, 2002.
Puillat, I., Sorgente, R., and Ribotti, A.: Circulation in the Sardinian Sea: a synergetic approach by in situ data, a three dimensional model and infrared imagery. In: Abstract Proceedings of the EGS-AGU-EUG Joint Assembly, Nice, France, 6–11 April 2003, 5, 13117, 2003.
Puillat, I., Sorgente, R., Ribotti, A., Natale, S., and Echevin, V.: Westward branching of LIW induced by Algerian anticyclonic eddies close to the Sardinian slope, Chem. Ecol., 22, S293–S305, https://https://doi.org/10.1080/02757540600670760, 2006.
Ribotti, A., Puillat, I., Sorgente, R., and Natale, S.: Mesoscale circulation in the surface layer off the southern and western Sardinia island in 2000–2002, Chem. Ecol., 20, 345–363, https://doi.org/10.1080/02757540410001727963, 2004.
Ribotti, A., Sorgente, R., Olita, A., Orilia, F., Borghini, M., and Reseghetti, F.: Indication of recent warming process at intermediate level in the Tyrrhenian Sea from SOOP XBT measurements, Mediterr. Mar. Sci., 17/2, 467–483, https://doi.org/10.12681/mms.1196, 2016.
Ribotti, A., Di Bitetto, M., Borghini, M., and Sorgente, R.: CTD profiles in western Sardinia (2000–2004), western Mediterranean, SEANOE database, https://doi.org/10.17882/59867, 2019a.
Ribotti, A., Perilli, A., Sorgente, R., and Borghini, M.: Hydrological profiles in the Mediterranean Sea (2002–2006), SEANOE database, https://doi.org/10.17882/70340, 2019b.
Santinelli, C., Ribotti, A., Sorgente, R., Gasparini, G. P., Nannicini, L., Vignudelli, S., and Seritti, A.: Coastal dynamics and dissolved organic carbon in the western Sardinian shelf (Western Mediterranean), J. Marine Syst., 74, 167–188, https://doi.org/10.1016/j.jmarsys.2007.12.005, 2008.
SBE: AN-9: Calculating SEASOFT Coefficients for Sea Tech Fluorometer and WET Labs Flash Lamp Fluorometer (FLF), 1 pp., 2008a.
SBE: AN-64-2: SBE 43 Dissolved Oxygen Sensor Calibration and Data Corrections using Winkler Titrations, 10 pp., 2008b.
SBE: AN-64-2: AN64-2: SBE 43 Dissolved Oxygen Sensor Calibration and Data Corrections, 5 pp., 2012.
SBE: AN-31: Computing Temperature & Conductivity Slope & Offset Correction Coefficients from Lab Calibration & Salinity Bottle Samples, 8 pp., 2016.
Schroeder, K., Gasparini, G. P., Tangherlini, M. and Astraldi, M.: Deep and intermediate water in the western Mediterranean under the influence of the Eastern Mediterranean Transient, Geophys. Res. Lett., 33, L21607, https://doi.org/10.1029/2006GL027121, 2006.
Schroeder, K., Millot, C., Bengara, L., Ben Ismail, S., Bensi, M., Borghini, M., Budillon, G., Cardin, V., Coppola, L., Curtil, C., Drago, A., El Moumni, B., Font, J., Fuda, J. L., García-Lafuente, J., Gasparini, G. P., Kontoyiannis, H., Lefevre, D., Puig, P., Raimbault, P., Rougier, G., Salat, J., Sammari, C., Sánchez Garrido, J. C., Sanchez-Roman, A., Sparnocchia, S., Tamburini, C., Taupier-Letage, I., Theocharis, A., Vargas-Yáñez, M., and Vetrano, A.: Long-term monitoring programme of the hydrological variability in the Mediterranean Sea: a first overview of the HYDROCHANGES network, Ocean Sci., 9, 301–324, https://doi.org/10.5194/os-9-301-2013, 2013.
Sorgente, R., Ribotti, A., and Puillat, I.: Water masses and diagnostic circulation west off Sardinia from March 23rd to April 4th, 2001, in: Building the European Capacity in Operational Oceanography, Proceedings of the Third International Conference on EuroGOOS; Athens, Greece, 2–6 December 2002, Elsevier Oceanography Series, 69, 100–104, https://doi.org/10.1016/S0422-9894(03)80017-X, 2003.
Strickland, J. D. H. and Parsons, T. R.: A practical handbook of seawater analyses, Bull. Fish. Research. Bd. Can., Bull. 167, 2nd Edn., edited by: Stevenson, J. C., Minister of Supply and Services, Ottawa Canada, 310 pp., 1972.
Vignudelli, S., Santinelli, C., Murru, E., Nannicini, L., and Seritti, A.: Distributions of dissolved organic carbon (DOC) and chromophoric dissolved organic matter (CDOM) in coastal waters of the northern Tyrrhenian Sea (Italy), Estuar. Coast. Shelf S., 60, 133–149, https://doi.org/10.1016/j.ecss.2003.11.023, 2004.
Winkler, L. W.: The determination of dissolved oxygen in water, Ber. Deut. Chem. Ges., 2843–2846, 1888.
Zunino, P., Schroeder, K., Vargas-Yáñez, M., Gasparini, G. P., Coppola, L., García-Martínez, M. C., and Moya-Ruiz, F.: Effects of the Western Mediterranean Transition on the resident water masses: pure warming, pure freshening and pure heaving, J. Marine Syst., 96–97, 15–23, https://doi.org/10.1016/j.jmarsys.2012.01.011, 2012.