the Creative Commons Attribution 4.0 License.
the Creative Commons Attribution 4.0 License.
 | 20 May 2020
Early instrumental meteorological observations in Switzerland: 1708–1873
Yuri Brugnara
Lucas Pfister
Leonie Villiger
Christian Rohr
Francesco Alessandro Isotta
Stefan Brönnimann
We describe a dataset of recently digitised meteorological observations from 40 locations in today's Switzerland, covering the 18th and 19th centuries. Three fundamental variables – temperature, pressure, and precipitation – are provided in a standard format after they have been converted into modern units and quality-controlled. The raw data produced by the digitisation, often including additional variables and annotations, are also provided. Digitisation was performed by manually typing the data from photographs of the original sources, which were in most cases handwritten weather diaries. These observations will be important for studying past climate variability in Central Europe and in the Alps, although the general scarcity of metadata (e.g. detailed information on the instruments and their exposure) implies that some caution is required when using them. The data described in this paper can be found at https://doi.org/10.1594/PANGAEA.909141 (Brugnara, 2020).
- Article
(6012 KB) - Full-text XML
- BibTeX
- EndNote


Past meteorological observations are fundamental to understanding climate variability. While recent variability dominated by anthropogenic warming has been extensively studied (Stocker et al., 2014), less is known about the previous centuries, a period characterised by large regional climate oscillations related to natural forcings (Brönnimann et al., 2019b; Neukom et al., 2019).
Global climate datasets based on instrumental observations typically begin in the late 19th century, when centralised meteorological networks were well established in most developed countries. The measurement of meteorological parameters in a scientific fashion, however, has a much longer history that goes back to the 17th century (Camuffo and Bertolin, 2012).
There are several reasons why early observations have been scarcely employed in modern climate research. One of the most important reasons concerns data quality, particularly for temperature. The lack of official standards before the creation of national weather services (NWSs) makes observations difficult to compare with modern records, especially if stations are few and far apart. Moreover, until at least the 1770s many different temperature scales, often ambiguously defined, were used and spirit of wine was commonly preferred to mercury as a thermometric liquid. Another difficulty is that most of the early observations have never been published in extenso and are only available as manuscripts scattered over thousands of archives. A recent global compilation of early instrumental records (Brönnimann et al., 2019a) found that half of the known records have not yet been digitised even as monthly means. Finally, the usability of some variables, such as pressure, has changed radically with the introduction of new assimilation techniques in reanalysis (Compo et al., 2006; Slivinski et al., 2019) so that their importance has been recognised only recently.
In the 18th and 19th centuries several influential scientists – such as Jacques-Barthélemy Micheli du Crest, Jean-André Deluc, Johann Heinrich Lambert, Marc-Auguste Pictet, and Heinrich von Wild – were active in today's Switzerland and at the forefront of research in the field of meteorological measurements, followed by a lively scientific community eager to use new and better instruments. Learned societies were founded in the main towns, where their members could present and discuss the latest scientific discoveries. Many of these societies had their own meteorological observatory or even set up a regional network of stations (Pfister, 1975; Hupfer, 2015, 2017; Pfister et al., 2019). However, very few records from the time before the creation of a NWS in 1863 have been used in modern climate research (e.g. Auchmann et al., 2012; Brugnara et al., 2015).
The project CHIMES (Swiss Early Instrumental Measurements for Studying Decadal Climate Variability) was funded in 2016 by the Swiss National Science Foundation to compile pre-NWS observations in Switzerland and make them available in digital format. In a first paper (Pfister et al., 2019) we described the large number of records that we found in archives and provided the digital images of nearly all documents. The present paper describes the data that we digitised and the necessary processing to make them usable. Additional details on many of the records are given in Brönnimann (2020).
2.1 Digitisation strategy
Given the large number of meteorological records found in Swiss archives (see Pfister et al., 2019), it was not possible to digitise everything within the available budget. Therefore, we had to set priorities. We selected 70 records from 40 locations according to the following criteria:
-
length of record (longer records preferred);
-
period covered (older records preferred);
-
potential for extending or improving a nearby record;
-
difficulty of the digitisation (readability, data structure);
-
at least one of the core variables (temperature, pressure, and precipitation) must be measured.
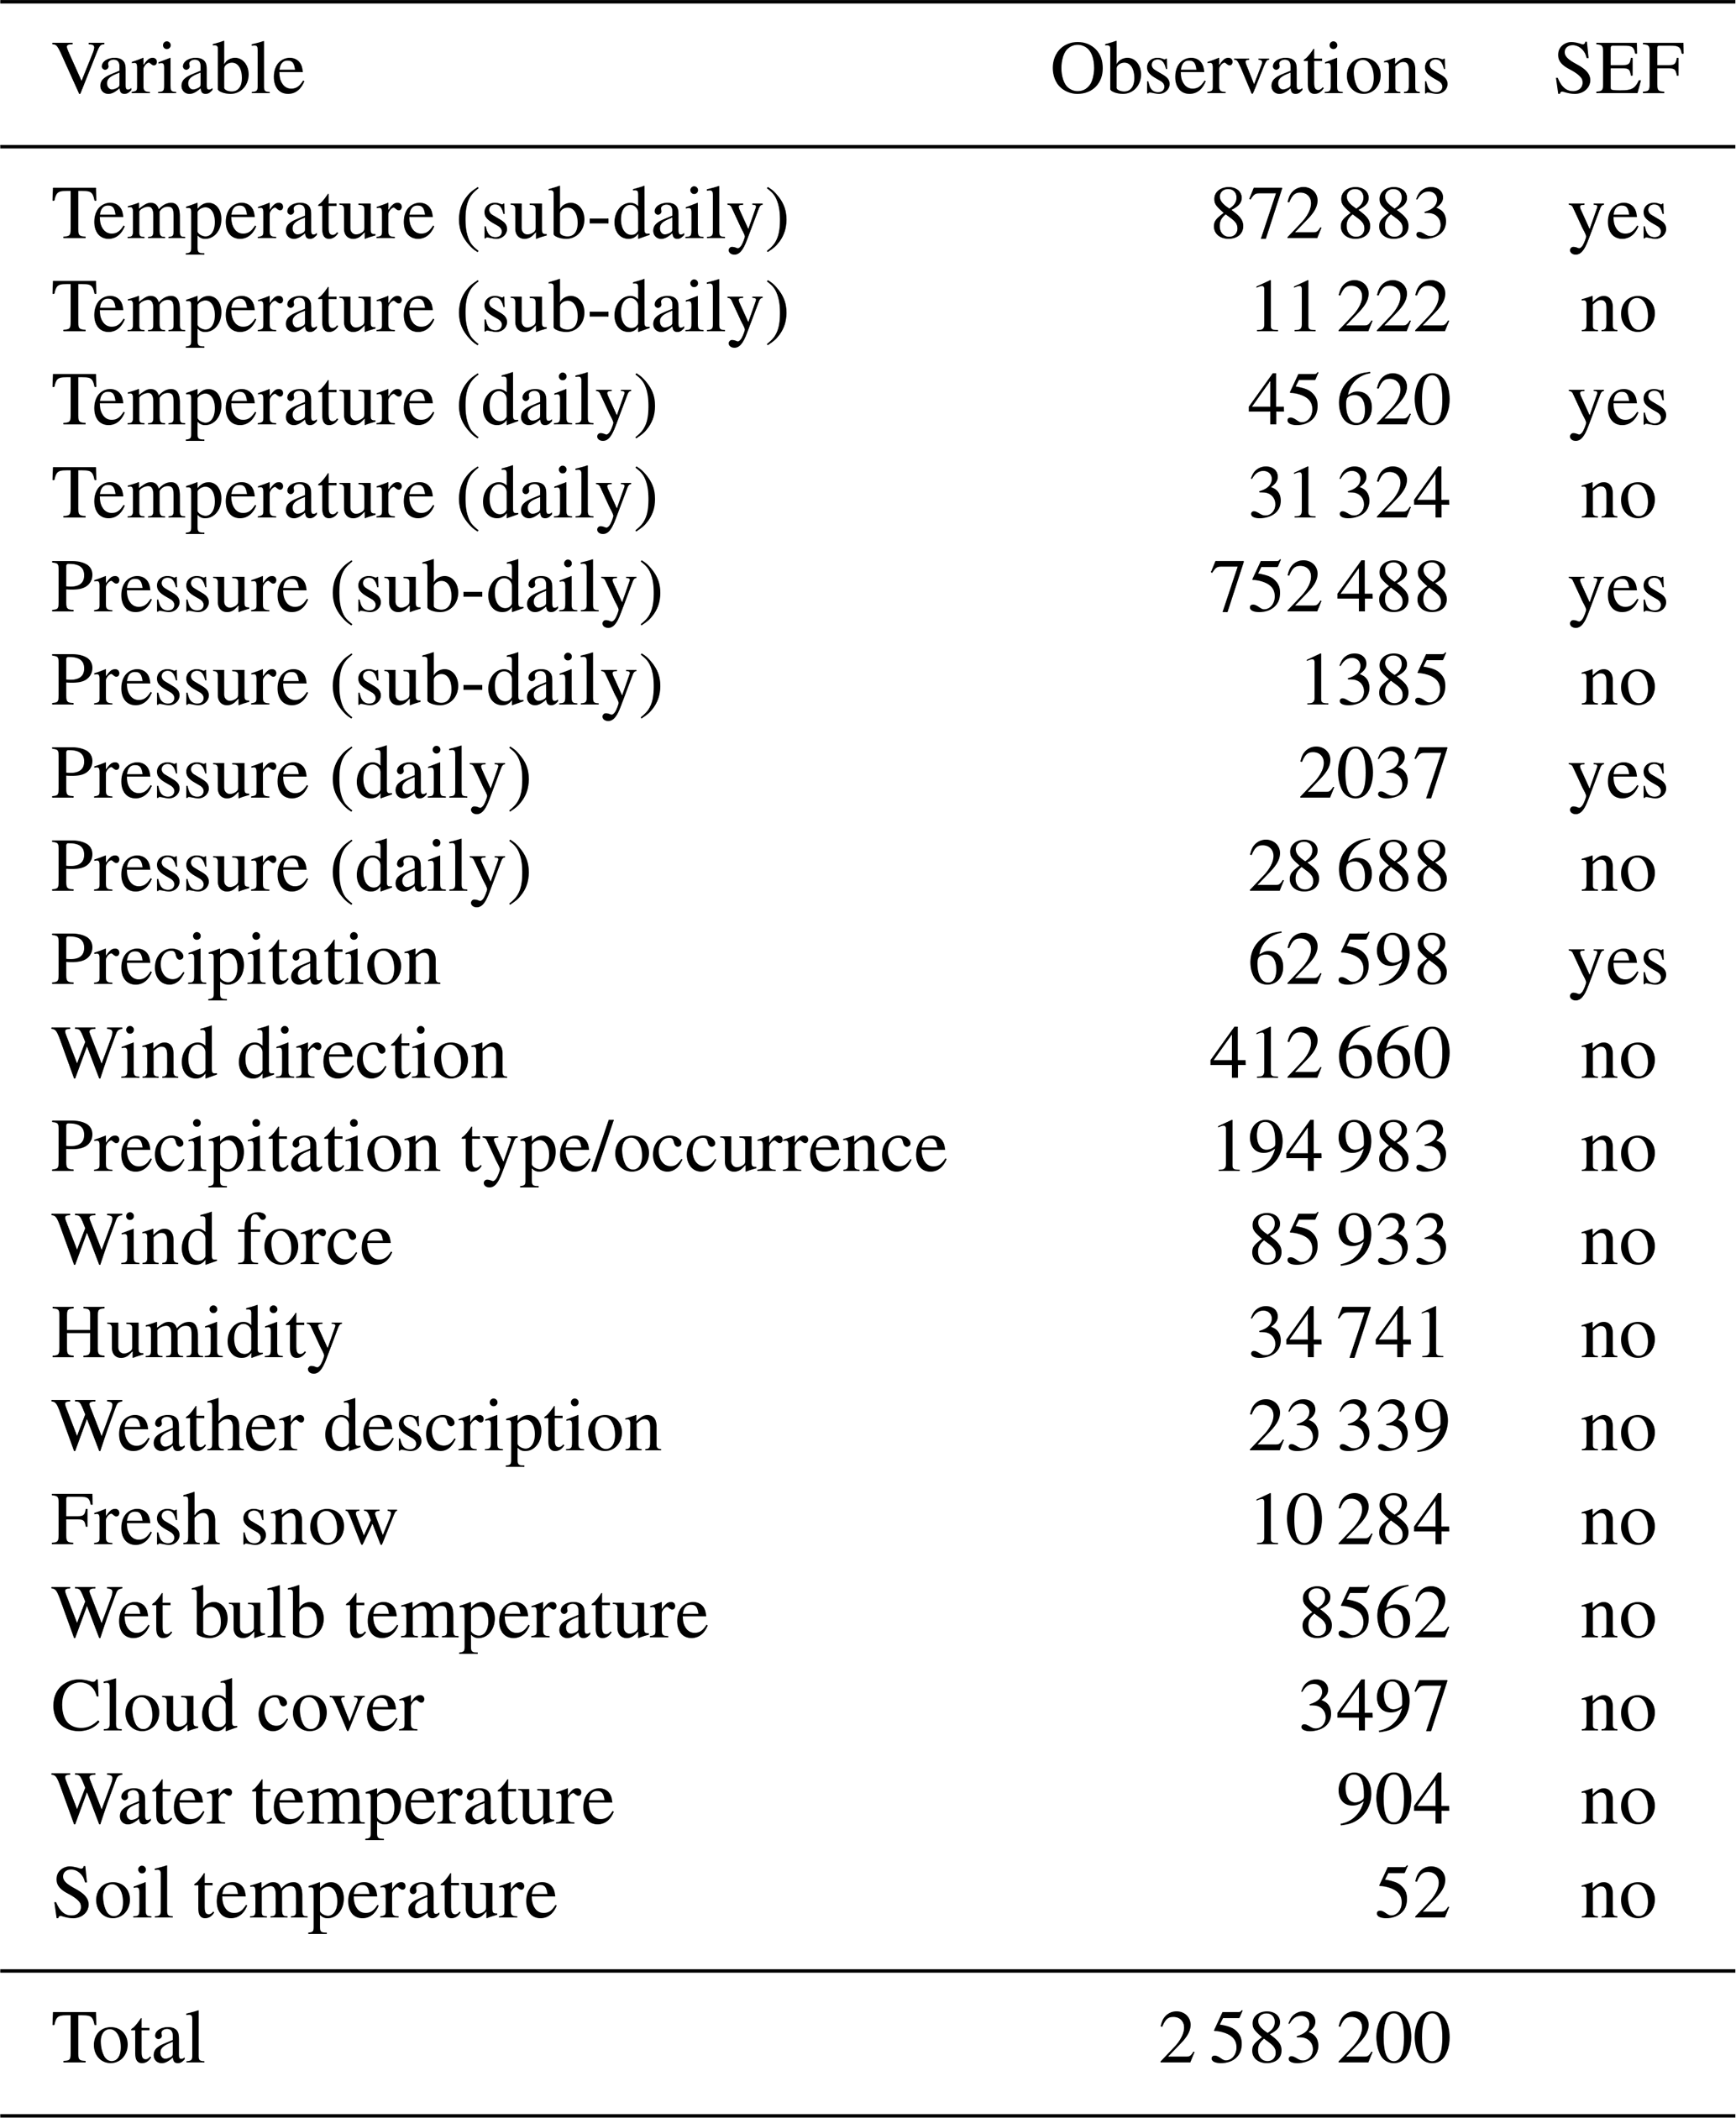
Information on variables and the period covered by each digitised record is shown in Fig. , while Fig. illustrates the geographical distribution of the locations for which data were digitised. Secondary variables (see Table 1) were digitised only when they did not significantly increase the time required to type the record. Qualitative descriptions of the weather were in general not digitised, with the exception of some printed sources. It is important to mention that digital images of most of the records are freely accessible online (Pfister, 2019).
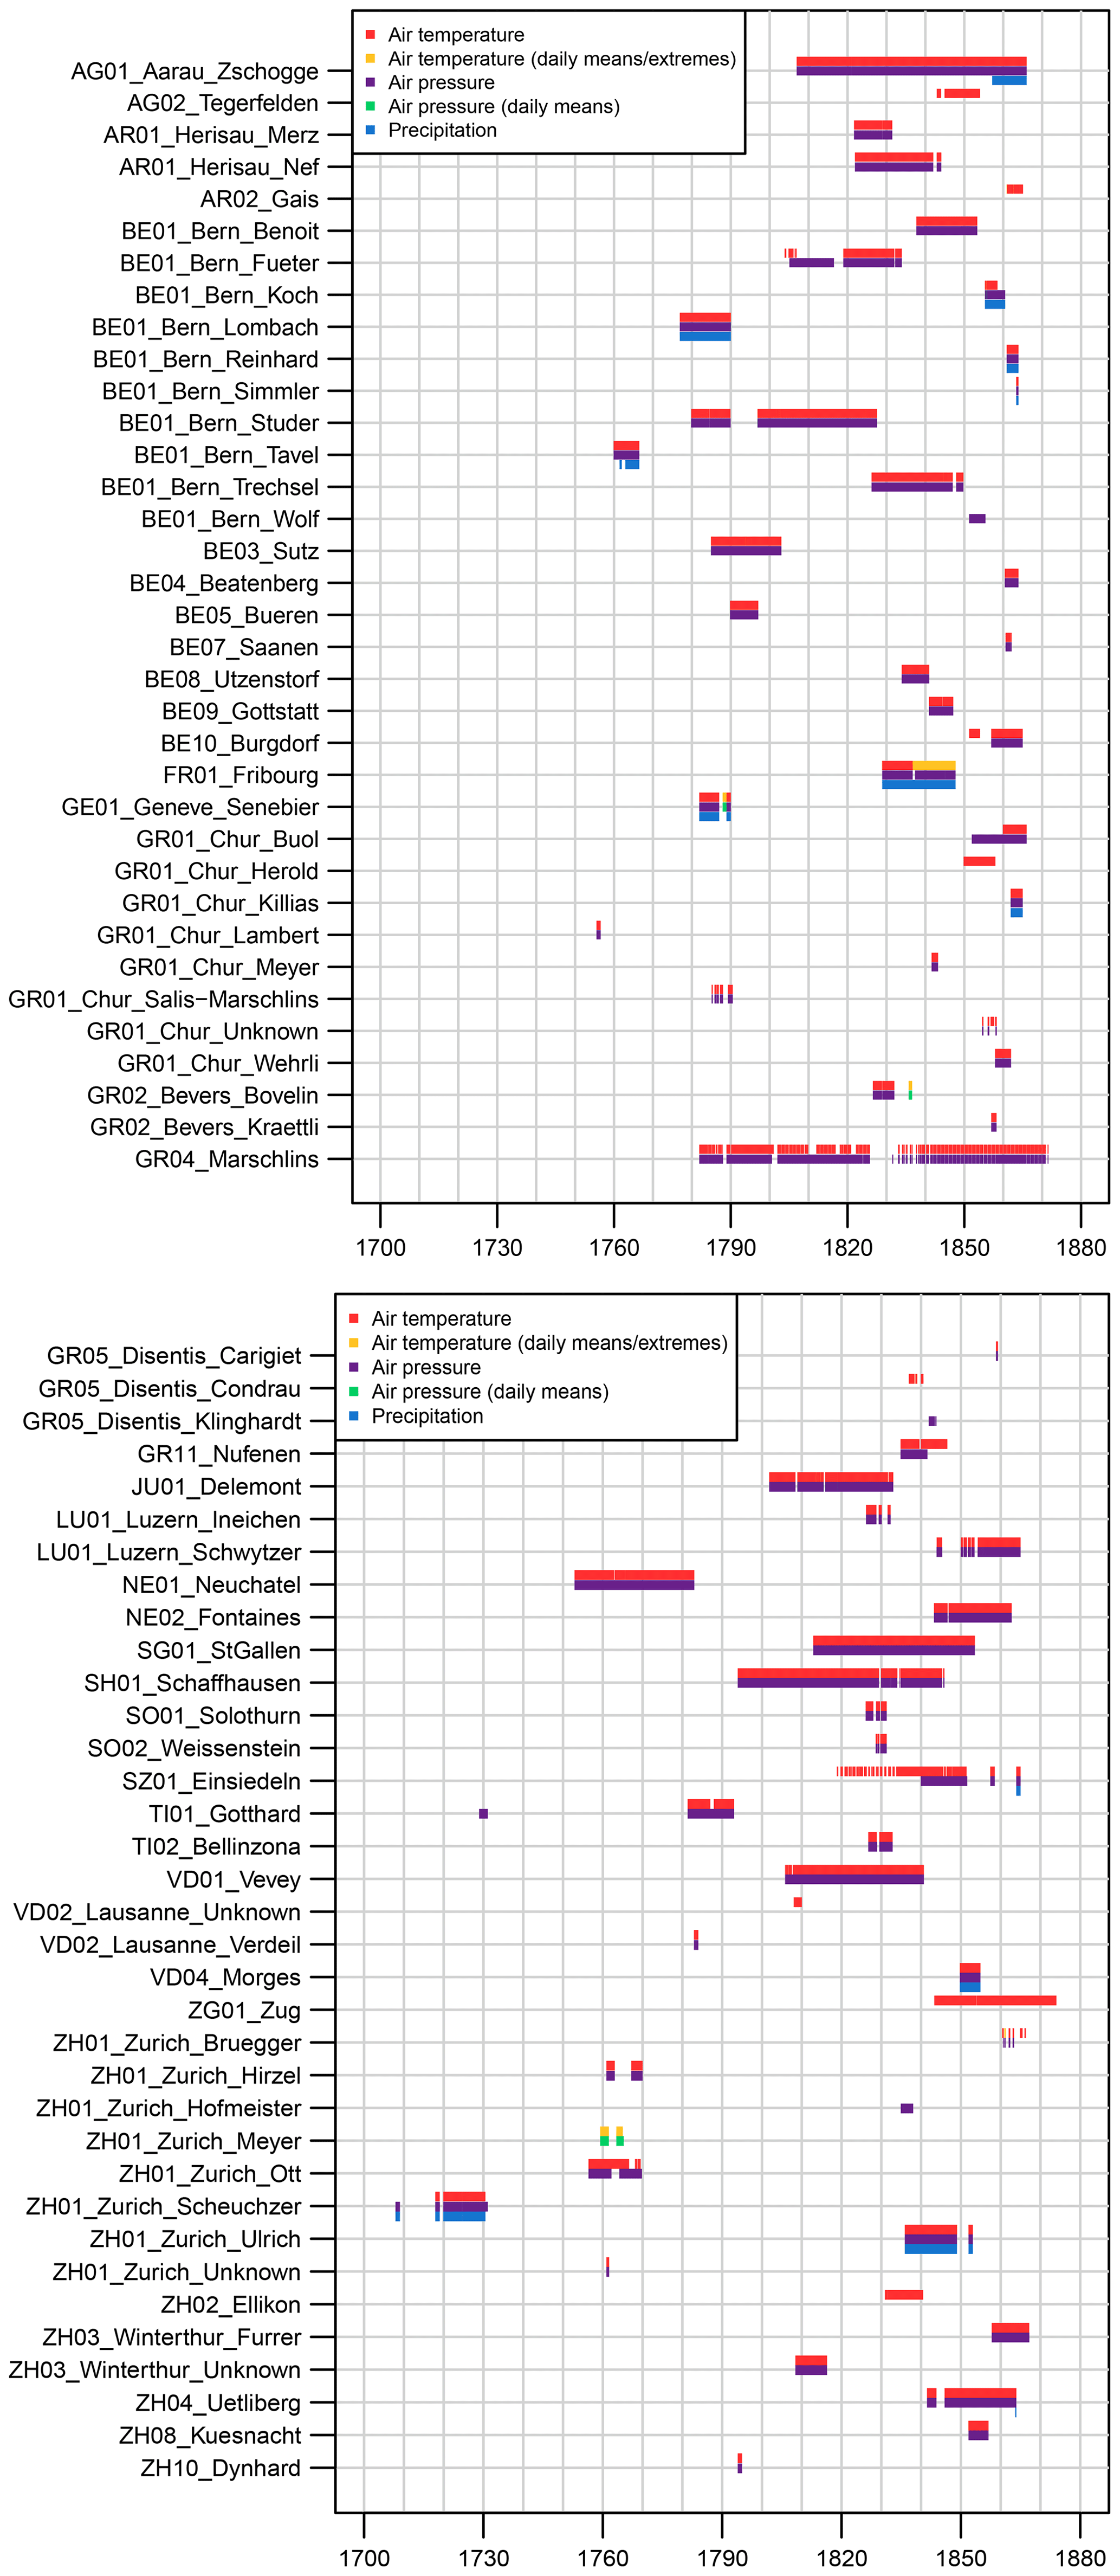
Table 1Number of digitised observations for each variable, with indication of whether they are provided as SEF files (observations in unknown units and redundant observations are not provided in SEF). Daily temperature observations include maximum, minimum, and mean temperature.
Manual typing was preferred over semi-automatic techniques such as optical character recognition given the large prevalence of handwritten sources. A citizen science approach (e.g. Hawkins et al., 2019) would have also been difficult because of the high heterogeneity in the structure of the documents.
The typing work was carried out by undergraduate geography and history students of the University of Bern. Each digitisation “package” – typically corresponding to about 10 h of work for 3 to 5 years of observations, with large variability among sources – was prepared by a trained climatologist and included a template and template-specific instructions. The packages were assigned to the students through an internet portal, which was also used by the students to upload the completed files. Each package was assigned to only one student, although some were reassigned to a different student because of quality issues (see Sect. 2.3). In total, nearly 300 packages were assigned to about 50 students over a period of 2 years.
2.2 Conversion to modern units
2.2.1 Historical background
Thermometers and temperature scales reached a certain degree of standardisation only in the late 18th century, more than a century after the invention of the liquid-in-glass thermometer. Until at least the 1770s many thermometers used for meteorological observations had unique characteristics, and even instruments graduated with the same nominal scale could read very different temperatures in the same conditions (Knowles Middleton, 1966; Camuffo et al., 2017). Therefore, converting the earliest temperature observations into modern units requires detailed information on the thermometer construction and calibration.
Figure 2 gives an overview of the scales used in our dataset and the periods in which they were employed. The Réaumur scale, originally defined by René-Antoine Ferchault de Réaumur in 1730, was clearly the dominant scale in Switzerland until the mid-19th century. Today's Celsius scale came into use only in the 1830s and became the prevalent scale by the 1850s.
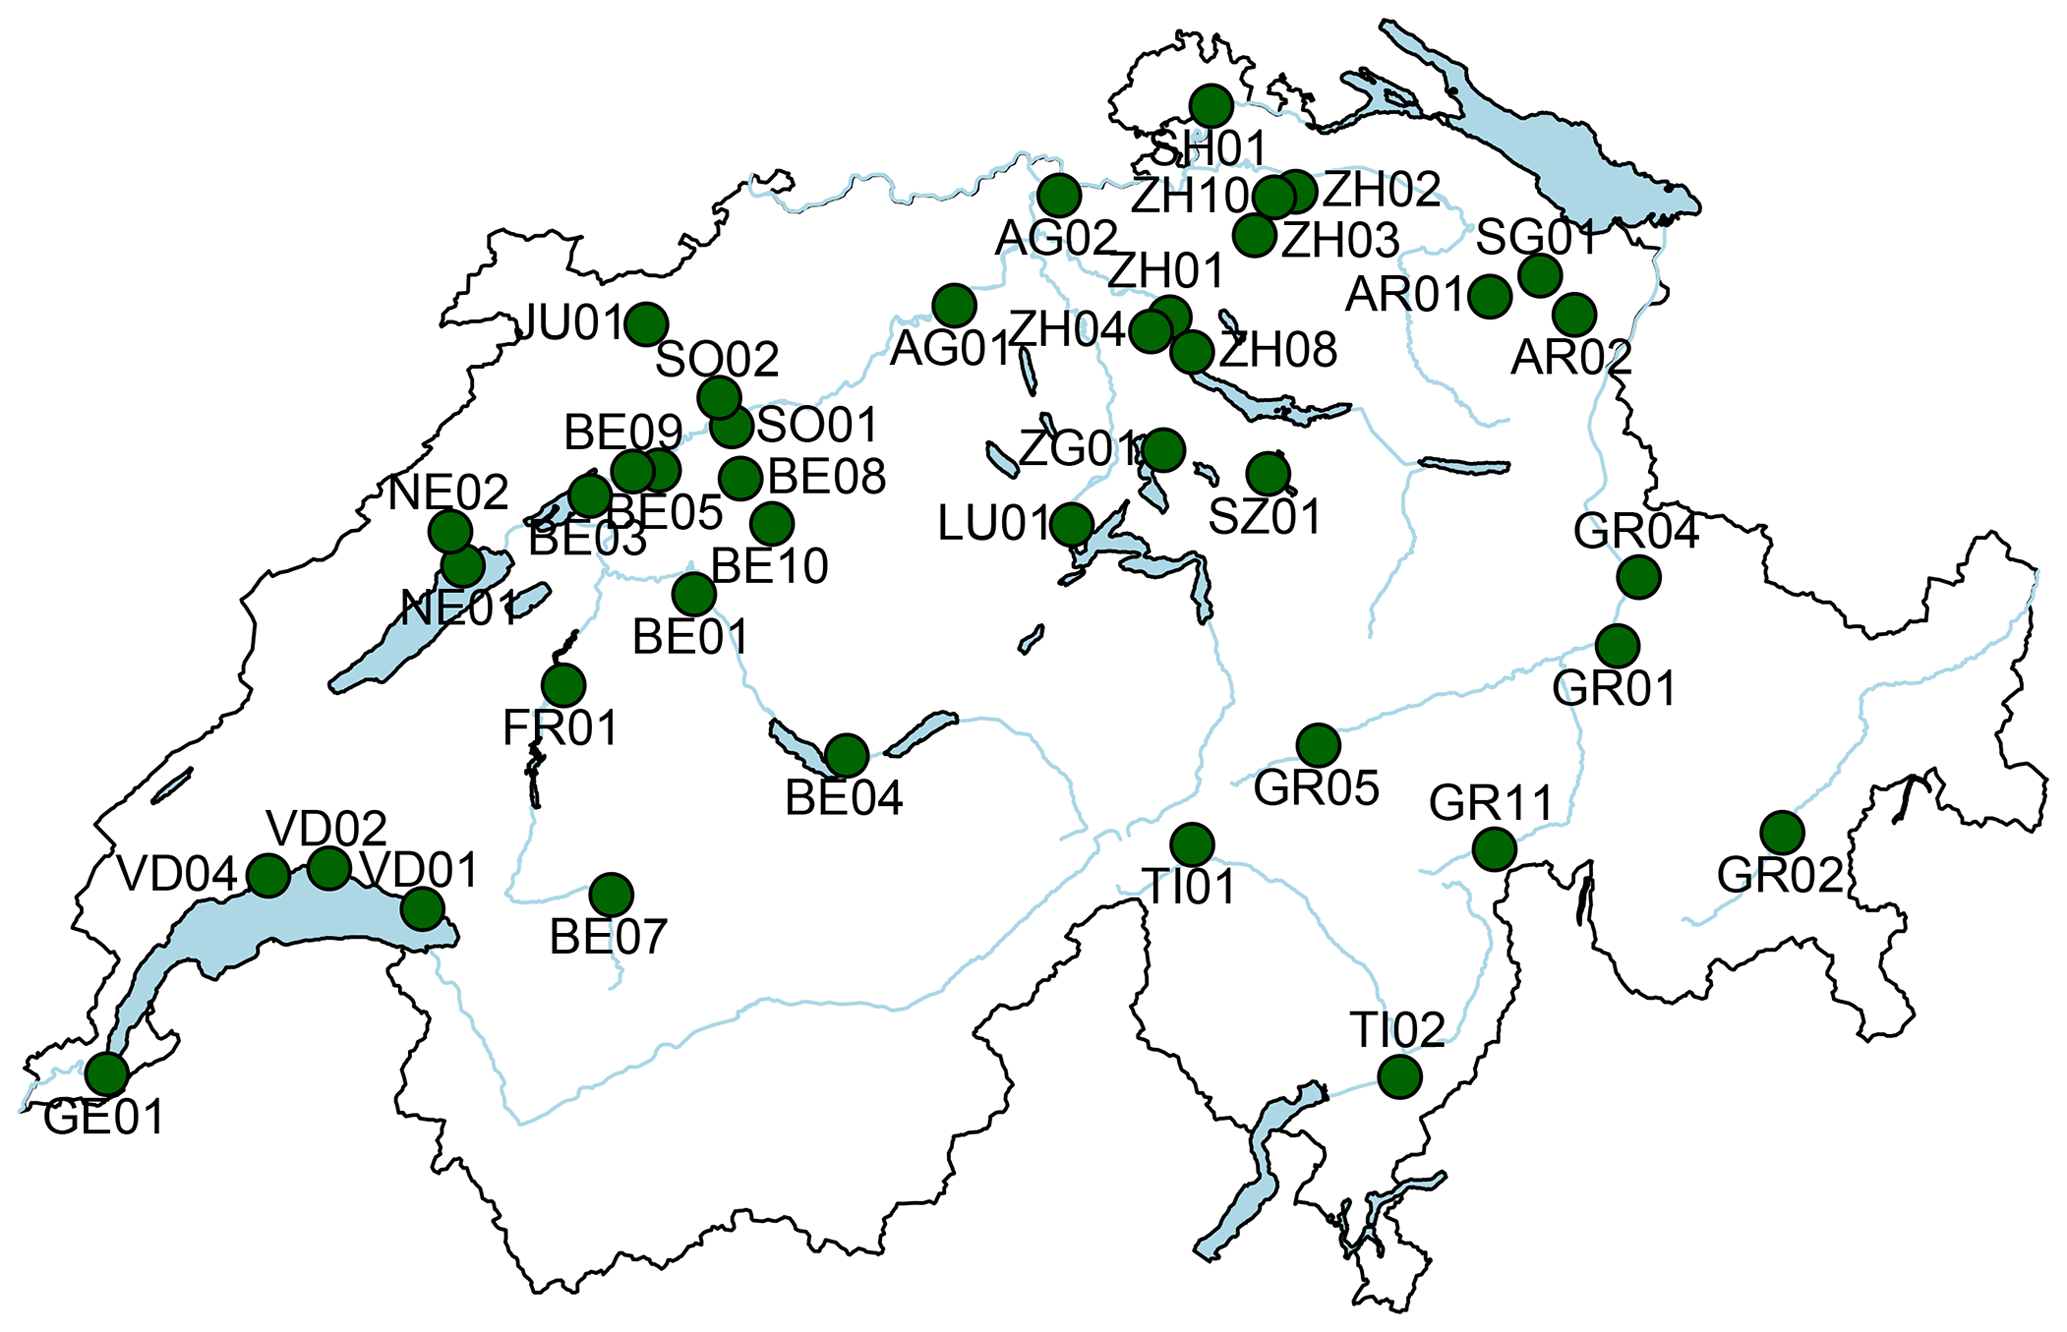
Figure 2Map of the locations for which data have been digitised.
The history of the Réaumur scale is rather complex as the principles given by Réaumur were very difficult to apply in practice; as a consequence, early Réaumur thermometers were not consistent with each other, and the construction methods changed radically over time (van Swinden, 1778; Knowles Middleton, 1966; Gauvin, 2012). Aside from Réaumur, early instrumental temperature measurements in Switzerland were greatly influenced by two Genevan scientists, Jacques-Barthélemy Micheli du Crest (1690–1766) and Jean-André Deluc (1727–1817). The former proposed in 1741 a “universal” thermometer filled with spirit of wine and graduated according to two fixed points: the temperature of the cellar of the Paris observatory (which Micheli du Crest believed to be more constant than the melting point of ice) and the boiling point of water at an atmospheric pressure of 27.75 Paris inches, corresponding to 0 and 100∘, respectively (Micheli du Crest, 1741). The lower fixed point was changed to the melting point of ice in as early as 1742 (Talas, 2002), but the zero remained at the “temperate” level of the observatory's cellar so that the melting point of ice was defined as −10.4∘. During the following decades, Micheli du Crest's thermometer proved to be very successful, particularly in the German-speaking Swiss cantons (central and eastern Switzerland) and in Bavaria, whereas most French scholars were uncomfortable with Micheli du Crest's disrespect of Réaumur's principles (Talas, 2002). Seven of the temperature records in our dataset (four in the canton of Zurich and three in the canton of Bern) were originally in Micheli du Crest units (Fig. 2). In Schaffhausen, the physician Johann Christoph Schalch read a similar thermometer for over 50 years, between 1794 and 1845.
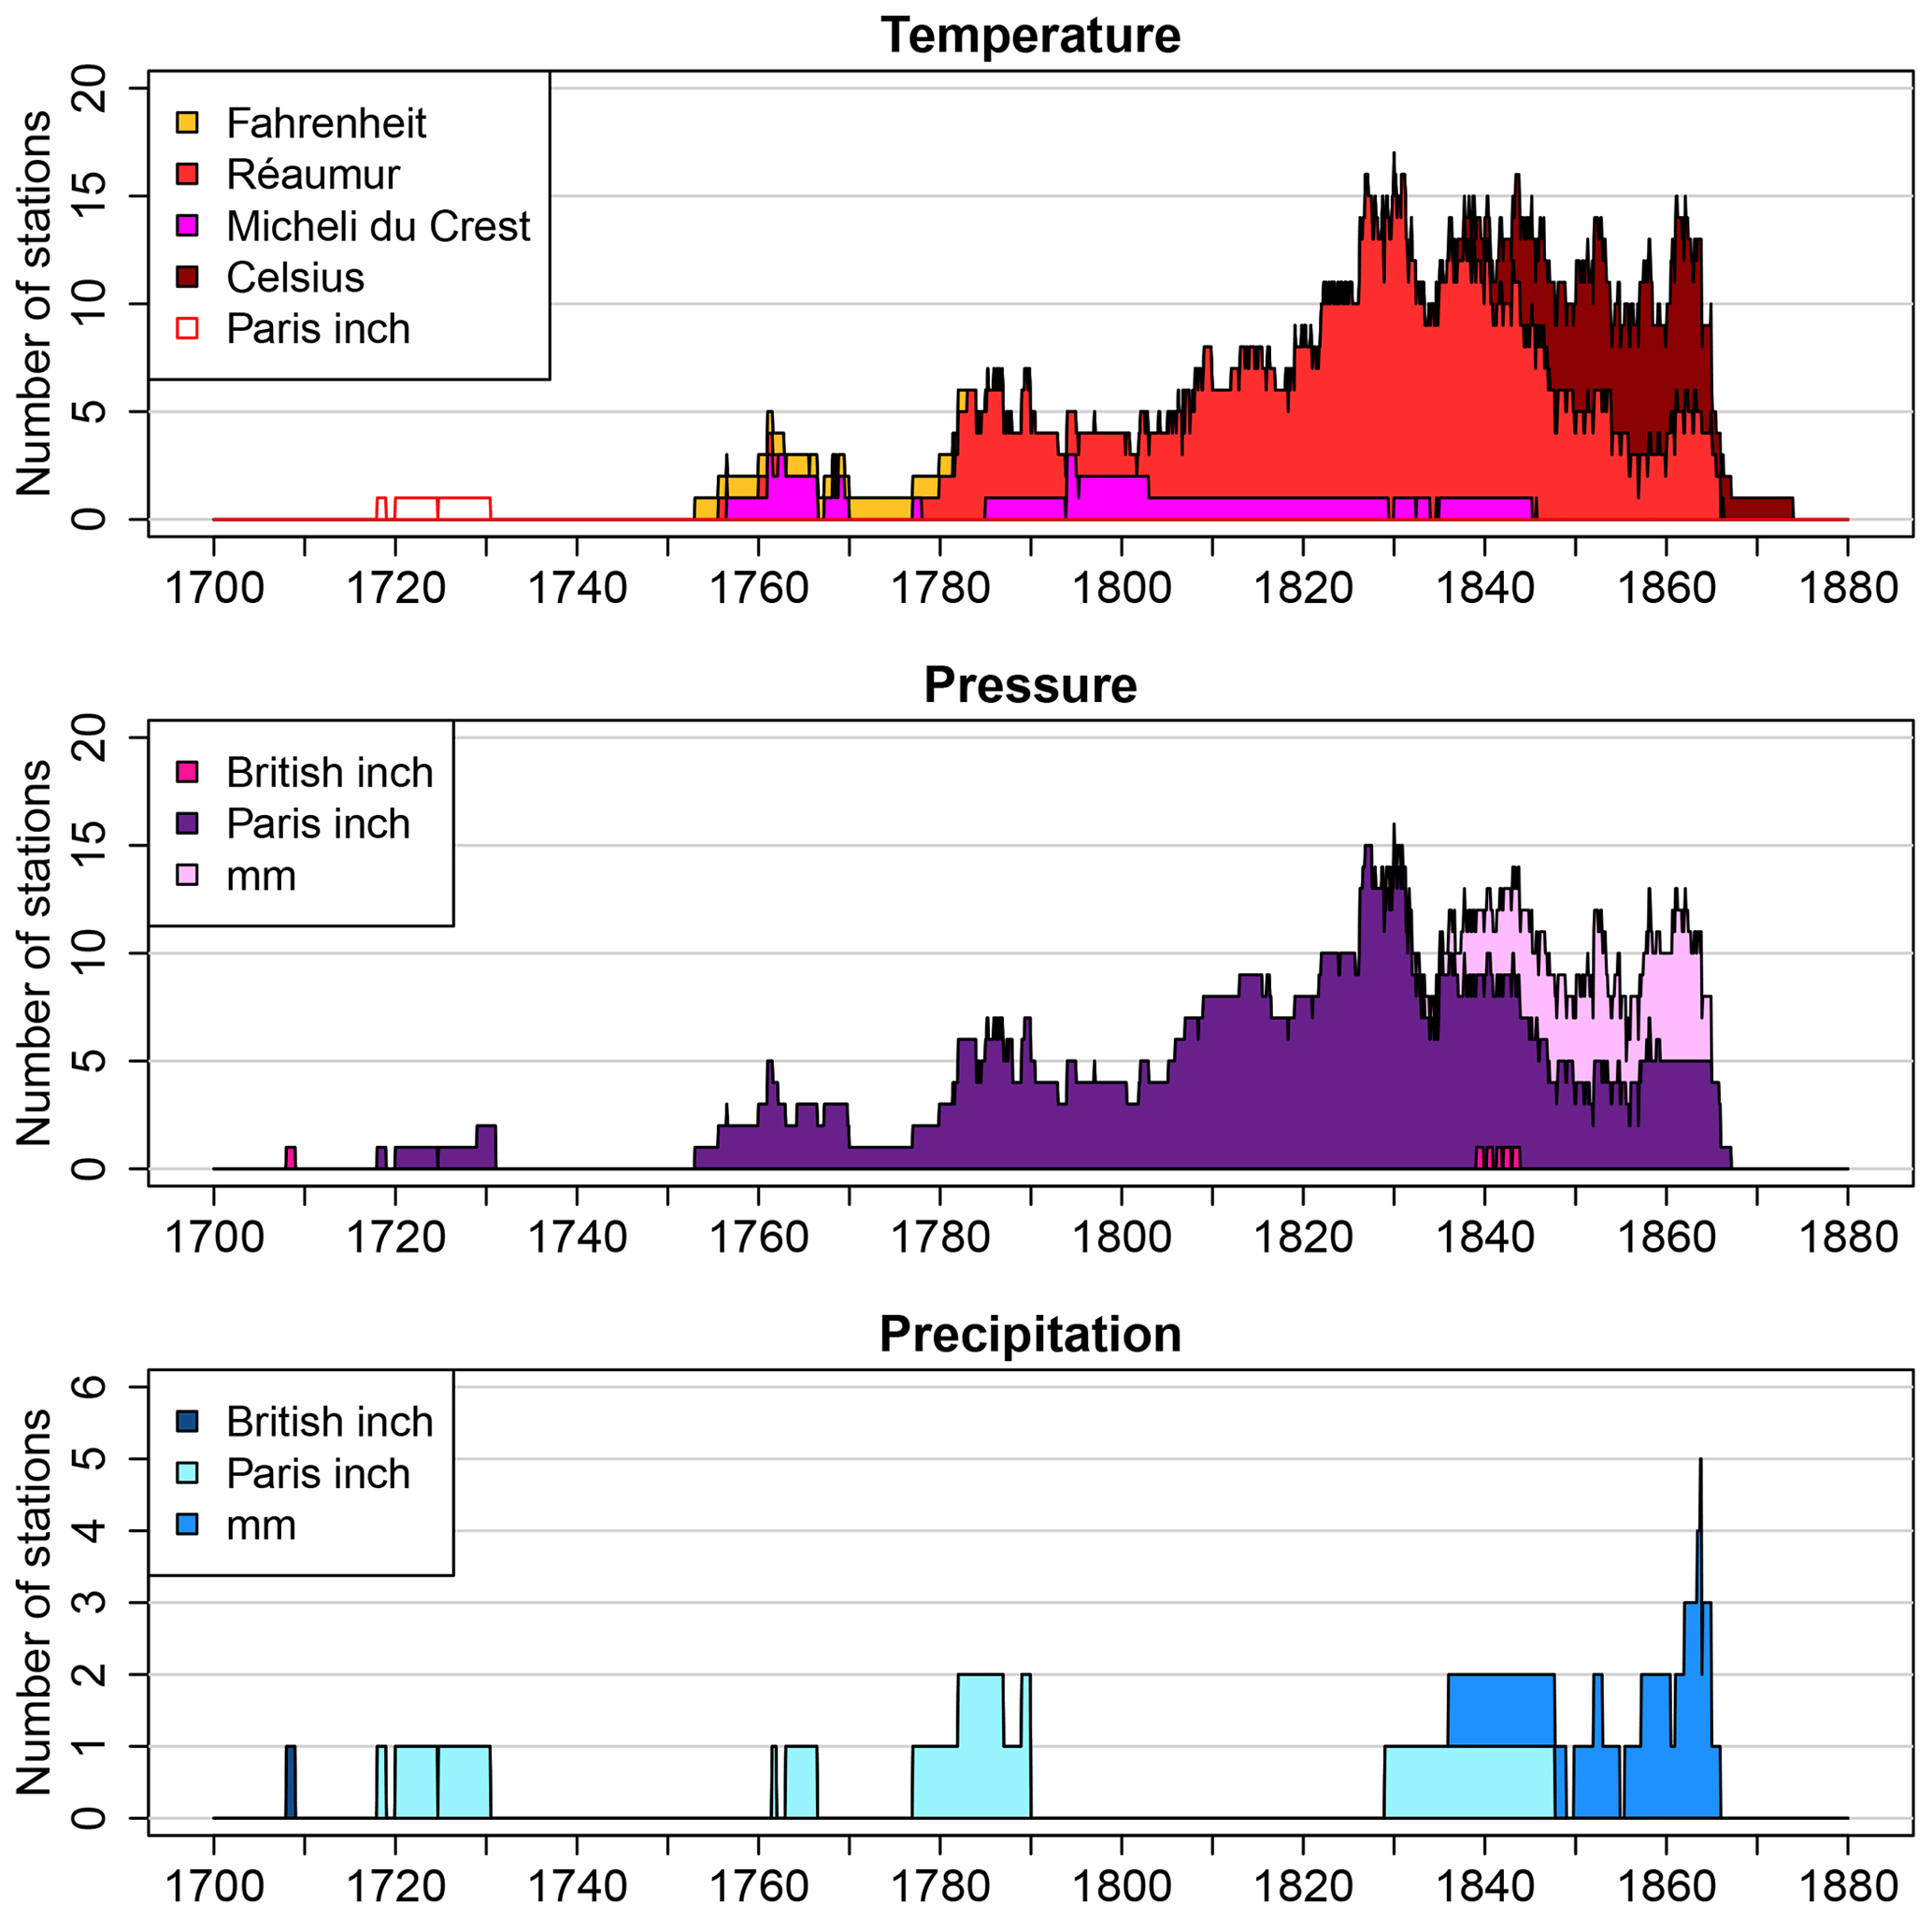
Figure 3Temporal evolution of the number of stations for which data have been digitised. Colours indicate the units in which the observations were reported.
In 1772, Deluc published a very influential work on meteorological instruments (Deluc, 1772) in which he advocated the superiority of mercury as a thermometric liquid and applied Micheli du Crest's ideas to a mercury thermometer. His fixed points were the melting point of ice (0∘) and the boiling point of water at a constant pressure (80∘). Deluc's publication gave a fundamental push to the reformation of the Réaumur thermometer – which used spirit of wine and whose scale was based on one fixed point – into the much better standardised mercury thermometers employed in most of Europe between the late 18th century and the mid-19th century (improperly called “Réaumur thermometers” by contemporaries). We assumed that all records in Réaumur units in our dataset from 1778 onwards were measured with the reformed thermometer.
An additional important source of uncertainty for temperature observations is the exposure of the thermometer. In the 18th century observers were aware that the thermometer should not be exposed to direct or scattered solar radiation or to precipitation, but proper radiation screens came into use only in the second half of the 19th century (e.g. Wild, 1860). In the first half of the 18th century, the common practice was to measure indoors next to an open window in an unheated room (e.g. Lambert, 1758) until comparisons with outdoor thermometers demonstrated the inadequacy of this set-up (e.g. Miles, 1747). In later years, the most popular solution was to hang the thermometer outside a north-facing window or on a north-facing wall (e.g. Carrard, 1763). Positioning-related biases can reach several degrees Celsius and are usually corrected using a statistical approach (e.g. Böhm et al., 2010; Brugnara et al., 2016); we plan to address this issue for some of the records in a separate paper.
Air pressure observations involve, to some extent, smaller difficulties than temperature: the liquid used was mercury with very few exceptions, and the problem of the scale definition is much less relevant since pressure is linearly proportional to the height of the mercury column. Moreover, barometers could be kept indoors and were not exposed to solar radiation or precipitation. There are still numerous sources of uncertainty, many depending on the construction of the barometer (e.g. Camuffo et al., 2006; Brugnara et al., 2015; Grimmer, 2019). The easiest to address is the expansion of mercury with temperature, which follows a linear equation (Brugnara et al., 2015). Unfortunately, even though Micheli du Crest himself had written about the importance of measuring the temperature of the barometer (Micheli du Crest, 1758), it is rare to find an 18th century record with this information. The first Swiss stations to provide an attached temperature were those taking part in the Palatine Meteorological Society's network (Cassidy, 1985), namely Gotthard Pass from 1781 and Geneva from 1783. In the 19th century, barometers often came with correction tables, and some observers annotated only the corrected values, while others also reported the raw readings and the attached temperature.
2.2.2 Temperature
The oldest temperature observations that we digitised are those of Johann Jakob Scheuchzer in Zurich, starting in 1718. However, available information on his thermometer was insufficient to attempt a conversion to modern units (he most likely employed an air thermometer; see Lenke, 1964).
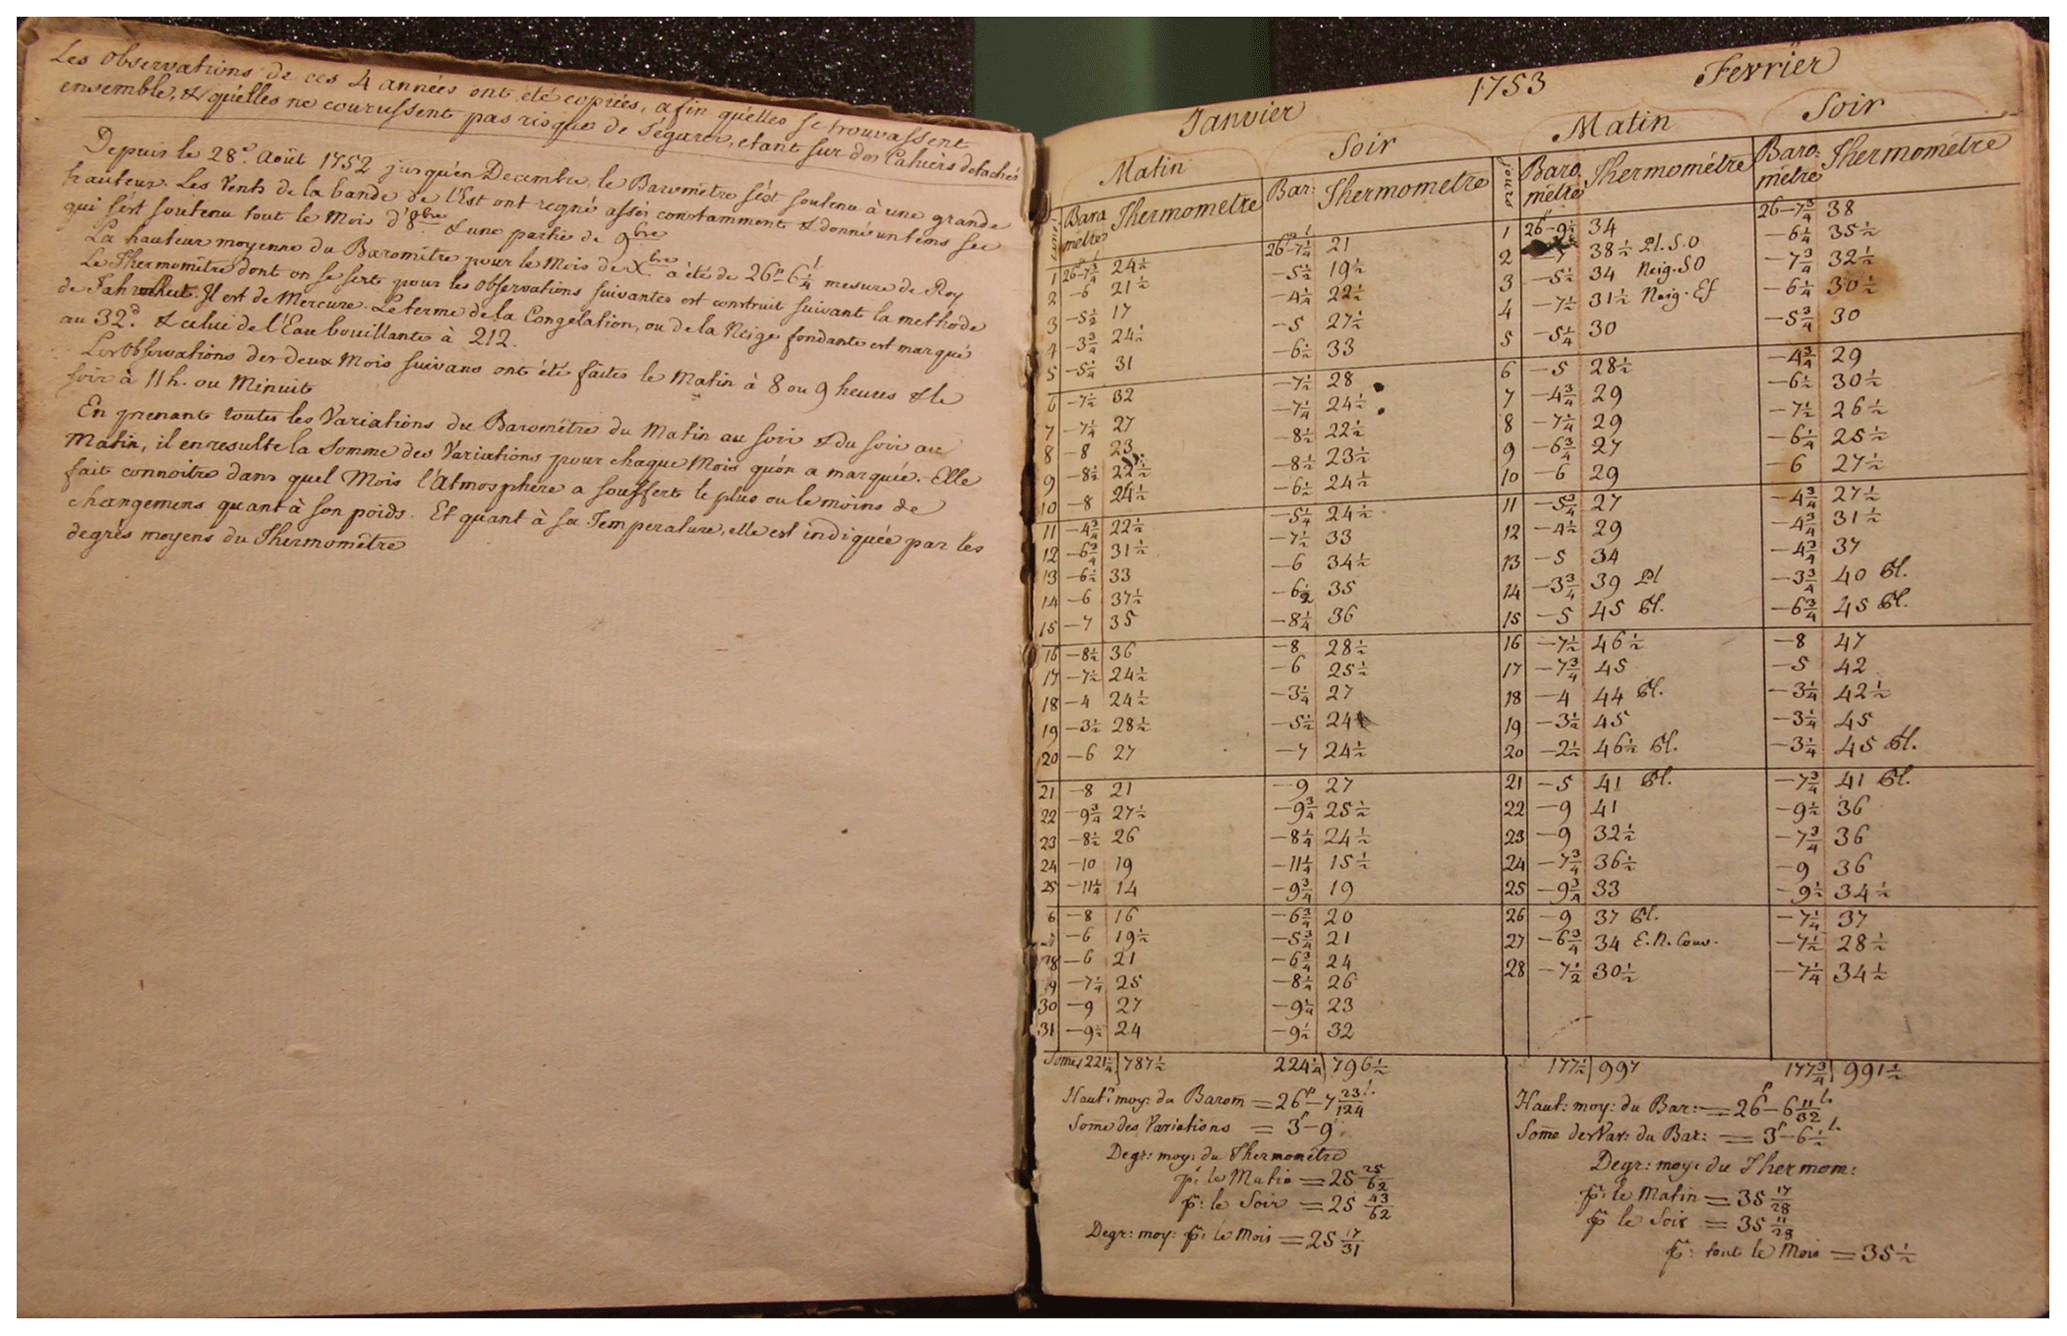
The next temperature record in chronological order is that of Neuchâtel, started in 1753 by Frédéric Moula, a mathematician who studied under Jean Bernoulli in Basel. He employed a Fahrenheit thermometer, the only one with this scale in our dataset. Moula was a mathematics professor in Berlin and Saint Petersburg before returning to Switzerland in 1752. He probably became familiar with Fahrenheit thermometers while abroad (Fahrenheit thermometers were particularly popular among German scientists in the first half of the 18th century; van Swinden, 1778). On the first page of the first book of observations (Fig. 3), Moula writes, “The thermometer used for the following observations is constructed using the Fahrenheit method. It is with mercury. The point of freezing, or of melting snow, is marked at 32 degrees. That of boiling water at 212” (translated from French by the authors). This description does not correspond to the original method proposed by Fahrenheit, which used the body temperature of a healthy man for the highest fixed point (Fahrenheit, 1724). Clearly, the Fahrenheit scale used by Moula is the reformed one still in use today; hence no special correction was necessary other than the standard conversion to degrees Celsius.
The first record measured on the Réaumur scale is the work of famous polymath Johann Heinrich Lambert. He made regular meteorological observations in Chur (south-eastern Switzerland) between 1750 and 1756, although we could only digitise the observations that he published (Lambert, 1758) for 1 year (August 1755 to July 1756; for the previous years Lambert published only monthly extremes). Unfortunately, he did not provide details on the thermometer in that publication. The raw observations for the previous years have been located but have yet to be imaged.
A few years later, in 1760, the Economic Society (Ökonomische Gesellschaft) of Bern started a network of eight meteorological stations, all provided with identical thermometers with the Réaumur scale. According to Pfister (1975), these thermometers were made by the French abbé Jean Antoine Nollet, an assistant of Réaumur and his main instrument-maker. However, this information alone is not sufficient to attempt a conversion into modern units, as Nollet himself did not strictly follow Réaumur's principles (Knowles Middleton, 1966; Talas, 2002). In fact, given the general lack of detailed information on how Réaumur thermometers were calibrated, we did not convert temperatures measured in Réaumur degrees before 1778. Luckily, the station of Bern – the only one of the Economic Society's network for which we digitised the data – switched to a Micheli du Crest thermometer in March 1762. The network did not have a long life as observations stopped in 1770.
To convert the Micheli du Crest scale we used the tables published by Deluc (1772) on the thermal expansion of mercury and the most refined spirit available at the time, which translates into the following equation for values above the freezing point (corresponding to −10.4∘):
where Rd is the reformed Réaumur scale according to Deluc, and DC is the Micheli du Crest scale. The quadratic term accounts for the deviation from linearity of the thermal expansion of the spirit (see also Camuffo and Della Valle, 2016).
For values below the freezing point, the best fit of Deluc's results gives the following equation:
We assume that all thermometers with the Micheli du Crest scale underwent the same construction and calibration procedure with one exception: the previously mentioned record of Schaffhausen by Johann Christoph Schalch. Here a thermometer made by the famous Bavarian instrument-maker Georg Friedrich Brander was used. Designated as the “Brander thermometer” by Schalch, this instrument resembled a Micheli du Crest thermometer but was probably filled with mercury instead of spirit.
Schalch's record was analysed before by Gisler (1983), who concluded that Schalch's thermometer was a standard Micheli du Crest spirit thermometer. Schalch carried out parallel observations between the Brander thermometer and a thermometer with the Réaumur scale from 1828 to 1842; a scatter plot of these observations is given in Fig. 4a. According to Gisler (1983), “The evaluation of the difference between simultaneous readings of Réaumur and Micheli du Crest thermometers showed clearly that the two thermometers could only be a spirit thermometer, described as a Brander, and a mercury thermometer according to Réaumur” (pp. 36–37, translated from German by the authors). This statement is not supported by any figure or table. By analysing Schalch's parallel observations, we found that the relationship between the two scales is best represented by a linear function:
where B is the scale of the Brander thermometer. A nearly identical conversion equation can be found on a loose sheet included in the Schalch papers stored at the Swiss Federal Archives (ref. code E3180-01#2005/90#217*), probably written when the observations were sent to the newly founded NWS in 1864.
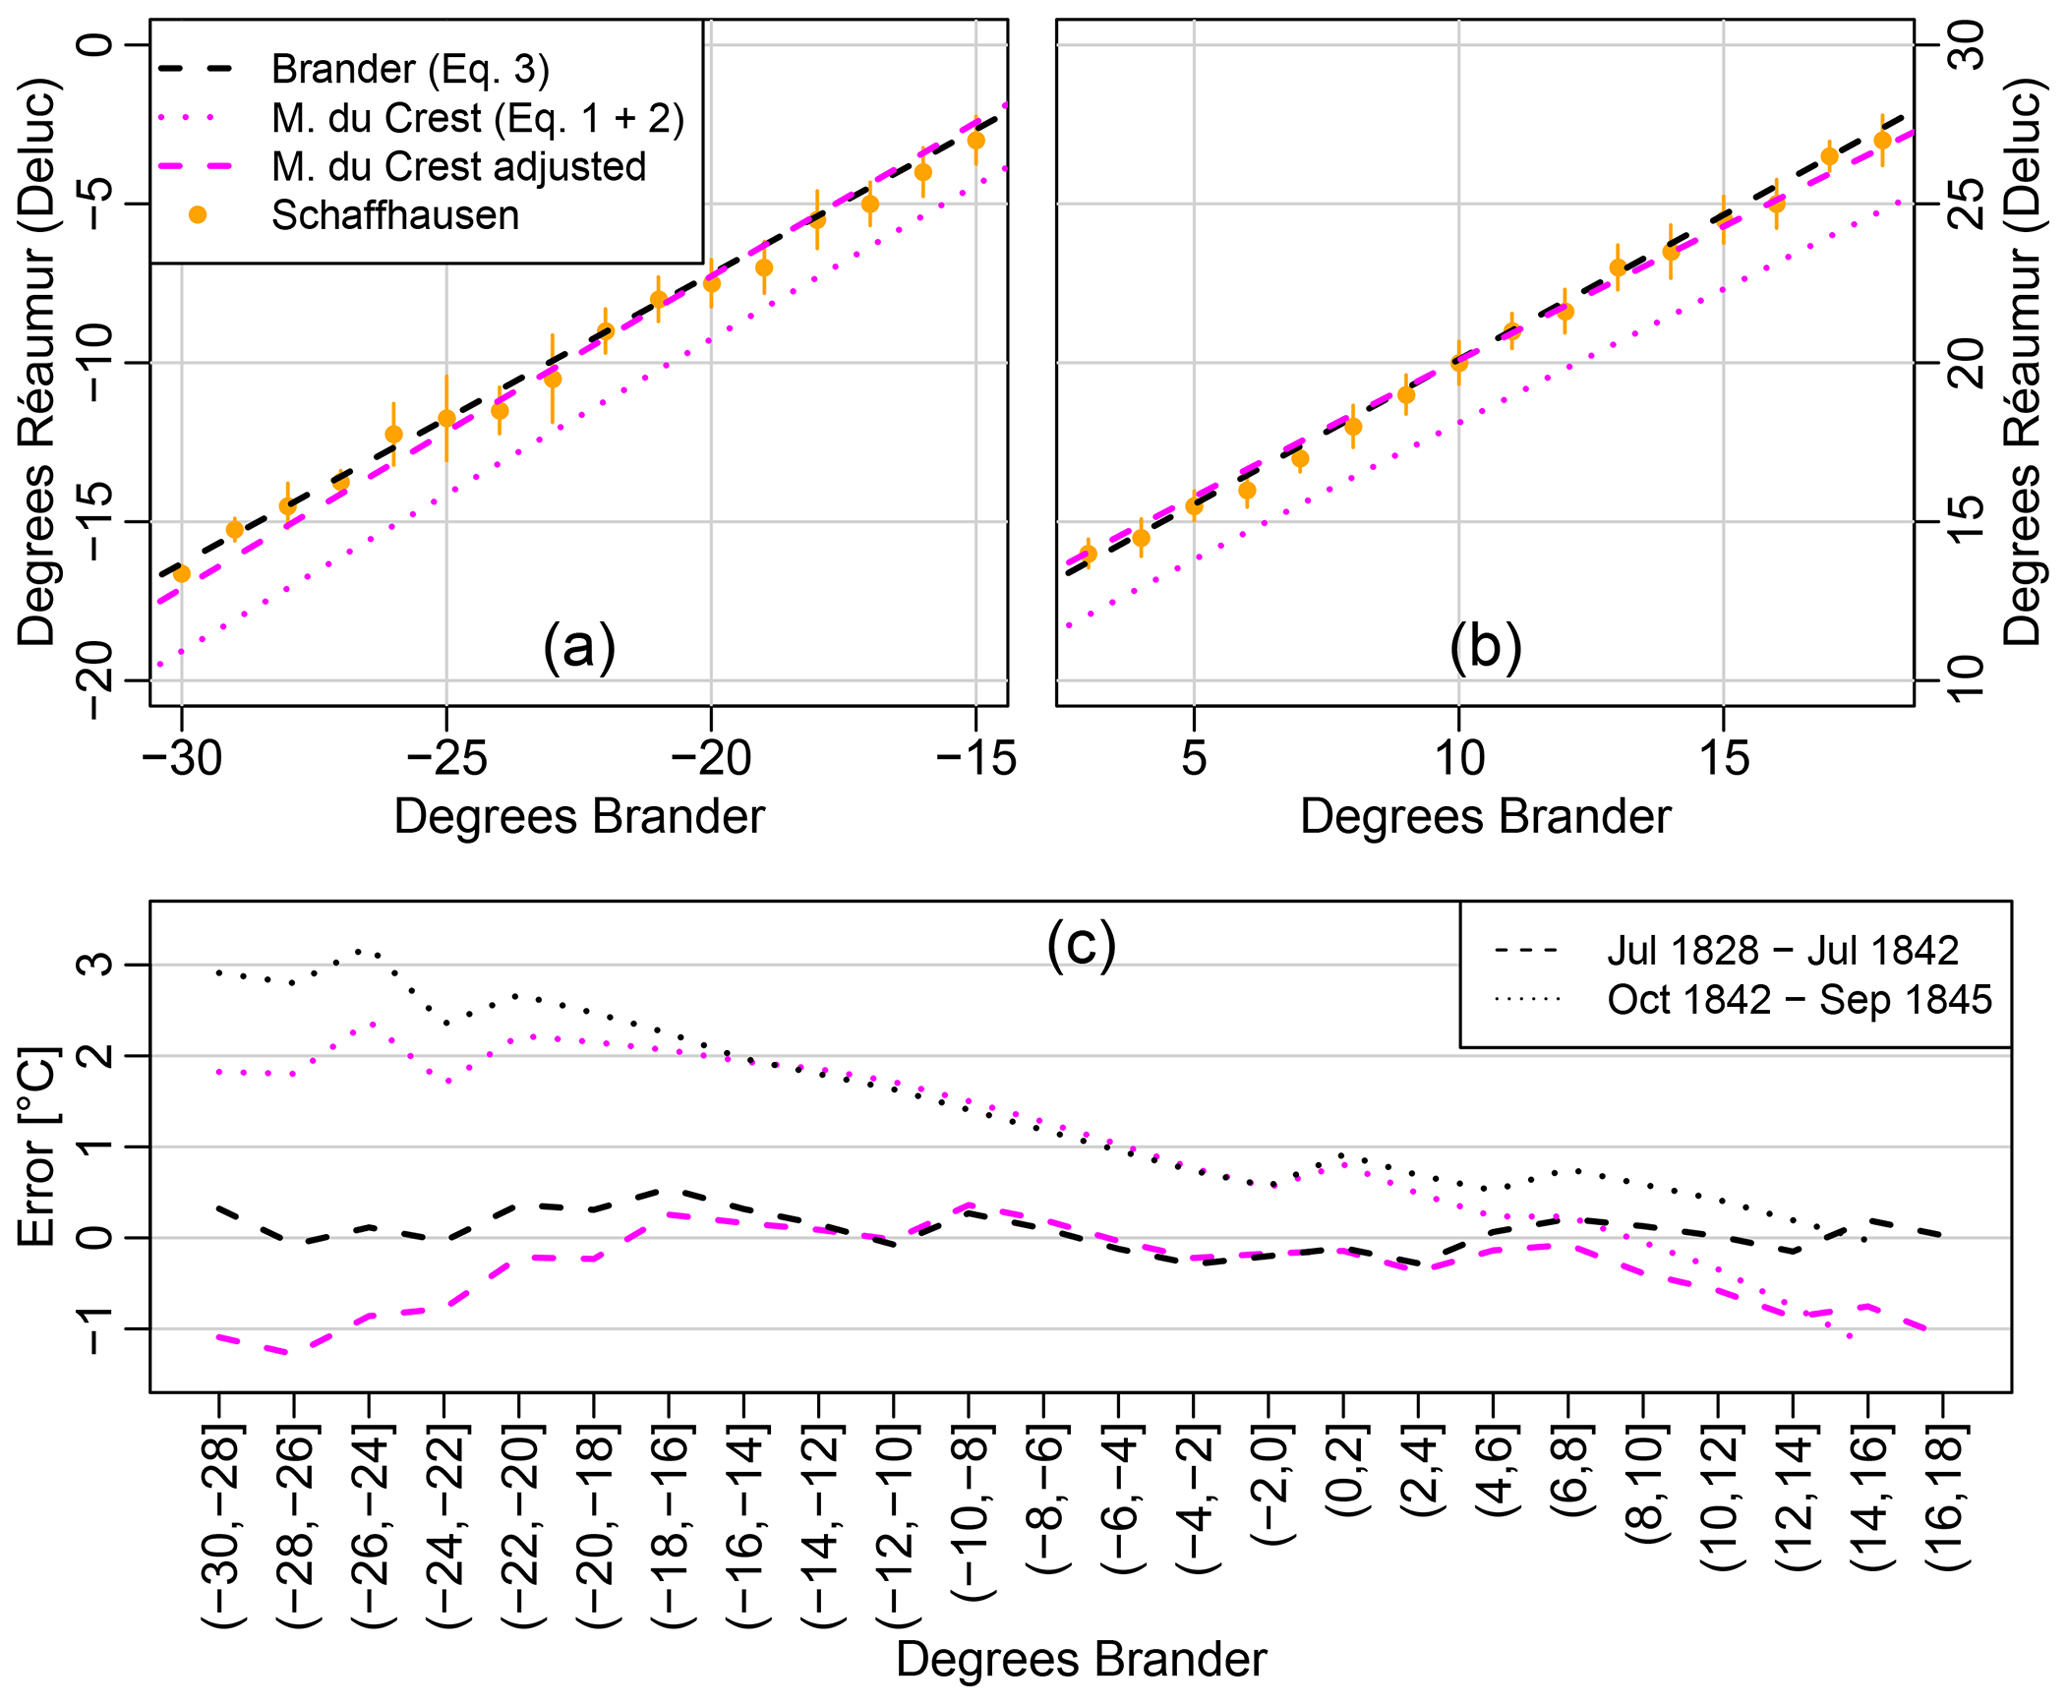
Figure 5(a, b) Scatter plot of parallel observations in Schaffhausen between a thermometer with the Brander scale and one with the Réaumur scale, made between 1828 and 1842. The points represent the median of the observations made with the Réaumur thermometer for intervals of 1∘ on the Brander thermometer, and the vertical bars are their standard deviation. The lines represent different possible conversion functions discussed in the text. (c) Median of differences between the parallel observations when using Eq. (3) (black lines) or a bias-adjusted Micheli du Crest scale (purple lines) for conversion for intervals of 2∘.
A linear relationship suggests that both thermometers were filled with the same liquid – most likely mercury. However, as the Brander thermometer was likely calibrated against an original Micheli du Crest thermometer, Eq. (3) gives very similar results to Eq. (1), aside from a constant shift (Fig. 4). In fact, Eq. (3) also implies that the zero of the Brander scale is at 11∘ Réaumur, 1.4∘ higher than defined in the Micheli du Crest scale. A possible explanation for this shift is that the zero of the Brander thermometer had risen over time because of the gradual contraction of the glass, a well-known source of systematic error particularly in mercury thermometers (Knowles Middleton, 1966; Winkler, 2009).
Brander was a correspondent of Micheli du Crest and had started to make thermometers with the Micheli du Crest scale in as early as 1757 (Talas, 2002); it is possible that he decided at some later point to use mercury instead of spirit, especially after Deluc's publication and Micheli du Crest's death. It is also likely that the thermometer was already rather old when Schalch started to make regular observations in 1794 given that Brander died in 1783. In fact, in 1782 a newspaper based in Augsburg (Augsburgische Ordinari Postzeitung n. 178, 26 July 1782) published a short piece about an earthquake in Schaffhausen, reporting a temperature measured in that city with a “Brander thermometer”, perhaps the same thermometer used by Schalch 12 years later. If so, most of the rise of the zero had probably already occurred when Schalch started his observations, meaning that Eq. (3) can be used for the entire record.
If, on the other hand, we use Eqs. (1) and (2) and correct for the shifted zero, we obtain an average underestimation of about 1 ∘C at low and high temperatures when comparing to the parallel observations in Réaumur (Fig. 4c). Equation (3) also produces a slightly lower root mean square error for the whole temperature range. Given these considerations, we adopted Eq. (3) for the conversion of the Brander scale.
Schalch's parallel record actually continues until 1845 but shows a large inhomogeneity in 1842 (Fig. 4c): in that year, between August and September, Schalch observed only one thermometer at a time, probably because he moved them apart. He usually read the Brander thermometer at noon and the other thermometer in the morning and in the evening. In October he resumed the parallel observations, but from that moment a seasonal cycle with an amplitude of about 2 ∘C appears in the bias, confirming that the two thermometers were no longer next to each other.
Conversion from Deluc's (or reformed) Réaumur scale is made by multiplying by a factor of 1.25. However, one must always keep in mind that the accuracy of the calibration and its stability over time probably varied among different instrument-makers. In particular, we did not apply any correction for the contraction of the glass as we rarely know the age of the instrument and its origin.
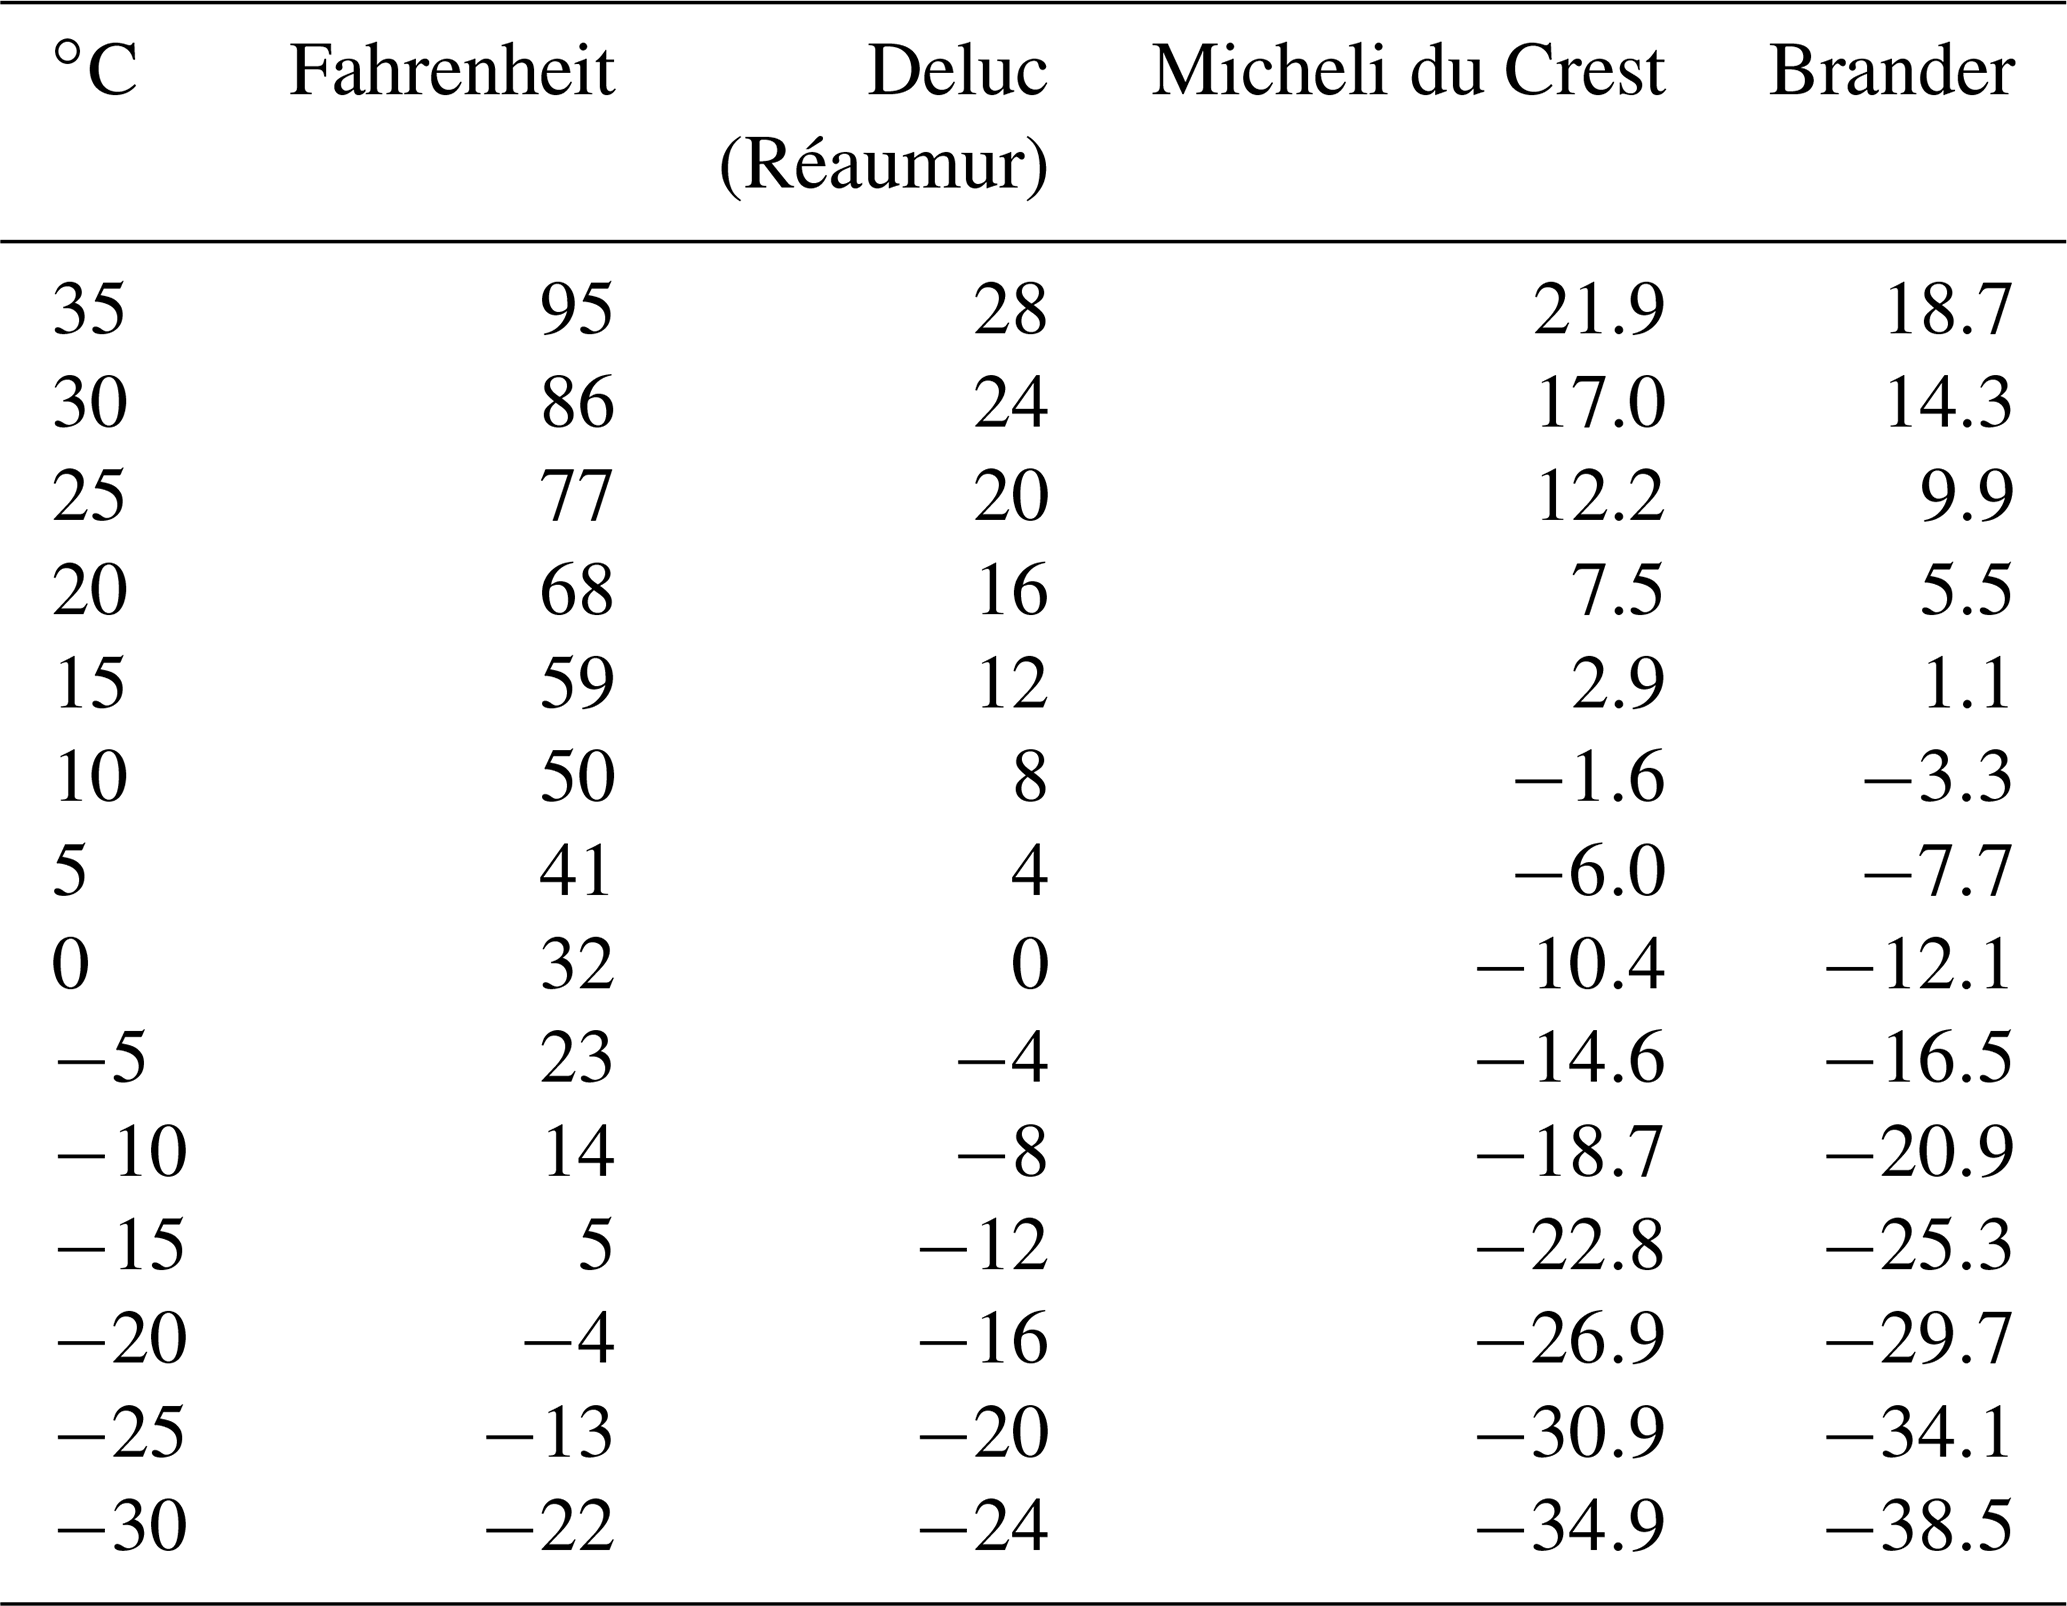
Table 2 gives an overview of the conversions applied to the different instruments mentioned in this section.
Table 2Conversion table for the different temperature scales encountered in the dataset.
2.2.3 Pressure
Our strategy for the temperature correction of barometer readings was to prefer a modern correction (WMO, 2008) over the corrected values provided by the observers. The latter was used only if the attached temperature was not provided. The converted data are accompanied by metadata that indicate for each observation whether the pressure was reduced to 0 ∘C, the original pressure reading, and the attached temperature in the original units. In addition, we applied a gravity correction to all pressure observations (WMO, 2008).
Before the introduction of the metric system, the standard unit for barometers in Switzerland was the Paris inch (pouce), corresponding to 27.07 mmHg, and the Paris line (ligne), corresponding to 1∕12 of a Paris inch. The oldest record of Scheuchzer was reported in British imperial inches (Fig. 2), corresponding to 25.4 mmHg, because it had been converted for publication in a British journal (Derham, 1709). Furthermore, a few years (1839–1843) of the record of Marschlins are compatible with a scale in British inches, although we did not find any metadata about the barometer. A few more records in the 1830s and 1840s (Einsiedeln, Gottstatt, and Utzenstorf; the latter two by the same observer) have unrealistically high pressure values, possibly because an unknown length unit different from the Paris inch was used.
The conversion from millimetres to hectopascals follows from the hydrostatic equation (WMO, 2008; Brugnara et al., 2015).
2.2.4 Precipitation
Precipitation was measured by only a small fraction of observers in the early instrumental era. Even though the oldest record of Scheuchzer dates back to 1708, there are never more than two stations measuring precipitation at the same time before the 1860s (Fig. 2). The units adopted were Paris lines and, more recently, millimetres (Scheuchzer's earliest record was published in British inches).
2.2.5 Time
The time of observation usually refers to local solar time. In the common data format all times are converted to Greenwich mean time (GMT). Some observers, particularly in remote locations, continued to use sundials after a standard time (Bern time, GMT+00:30) was introduced in Switzerland in 1848 (Wild, 1862). Given that the difference between mean local solar time and Bern time is less than 12 min anywhere in Switzerland, we assumed mean local solar time for every record.
Qualitative time entries such as “afternoon” were not converted. In this case, the time is missing in the data files and the original time entry is provided in a designated column. Times given as “sunrise” or “sunset” were converted using the R package suncalc version 0.5.0 (Thieurmel and Elmarhraoui, 2019).
2.3 Data quality assessment
For the quality control of the digitised observations we used a combination of manual checks and automatic tests implemented in the R package dataresqc version 1.0.3 (Brönnimann et al., 2018; Brugnara et al., 2019). The digitised sheets were first checked visually to make sure that the instructions were followed correctly by the student, that all the data were typed, and that there were no obvious systematic mistakes. Problematic packages (about 1 in 10) were reassigned to another student with improved instructions. Problems were mainly related to the wrong transcription of negative numbers and of non-decimal pressure readings as well as the systematic misinterpretation of the handwriting. The reassignment allowed us to estimate the error rate of the digitisation by comparing the columns not affected by evident systematic errors. Assuming that each and every value is digitised correctly by at least one student, we obtain an average error rate of 1.5 % for temperature (for a sample of 46 395 observations), 2.1 % for pressure (31 399 observations), and 1.4 % for precipitation (1165 observations). Pressure is affected by more digitisation errors than other variables because pressure readings usually contain more digits. Our estimates are rather pessimistic given that the packages that were reassigned were usually difficult ones. For printed sources (26 245 observations) the average error rate was 0.6 %, whereas for handwritten sources it rose to 2.3 % (52 714 observations).
The software dataresqc offers simple statistical and logical tests to detect suspicious values that are probable digitisation errors (typos). It only performs absolute tests; that is the consistency of the data with those from neighbouring stations was not checked. Nevertheless, it allowed us to detect and correct nearly 3000 typos for pressure and over 1100 typos for temperature, corresponding to about 1 in 5 estimated typos for pressure and 1 in 12 for temperature. The remaining suspicious values that were not digitisation errors were flagged in the final data format. The fraction of flagged data amounts to 0.2 %, corresponding to 3990 values.
The dataset (Brugnara, 2020) is provided in the Station Exchange Format (SEF), a standard format for the exchange of rescued climate data recently defined by the Copernicus Data Rescue Service (https://datarescue.climate.copernicus.eu/st_formatting-land-stations, last access: 15 May 2020) with the aim of facilitating ingestion into global repositories. Each file contains data and metadata for one variable and one observer in a tab-separated value (tsv) structure. Standard (i.e. available in all files) metadata include geographical coordinates, the name of the observer, and the type of corrections for pressure. To increase data traceability, a column in the SEF files contains the values in the original units and the original time.
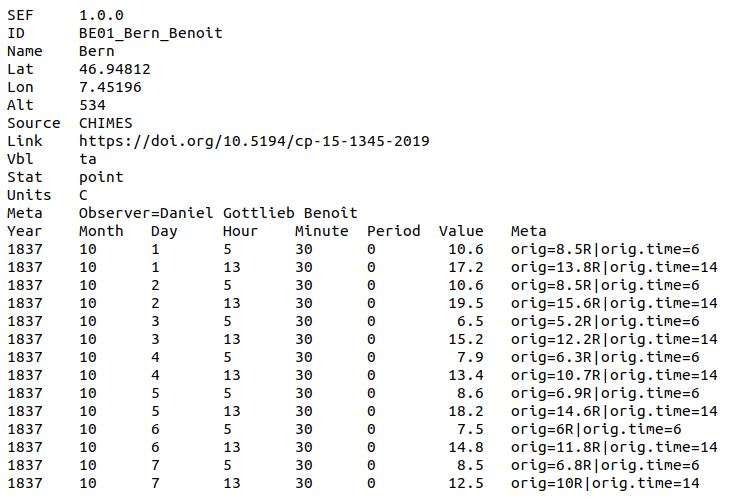
A total of 189 SEF files are available: 102 for temperature, 73 for pressure, and 14 for precipitation. Figure 5 shows an example of an SEF file. The filenames follow a standard structure composed of the following fields: project name, station code (as in Fig. ), station name, observer, starting and ending date, and variable code. In some cases, multiple thermometers and/or barometers were read by the same observer: here the suffix “bis” or “ter” is added to the filename to distinguish between the different instruments. Redundant daily averages (i.e. averages of digitised sub-daily observations) are not provided in SEF.
We also provide an R data file containing a data frame with all digitised material, including additional variables that have not been converted into SEF, as well as comments from the student who typed the data (e.g. notes on readability). The structure of the data frame is similar to the one of the SEF, with one observation time for each line, and it is explained in detail in an accompanying documentation file. Note that the data for the additional variables have not been quality-controlled.
The data described in this paper are available on PANGAEA: https://doi.org/10.1594/PANGAEA.909141 (Brugnara, 2020). The data are also incorporated into the Euro-Climhist database (Pfister et al., 2017).
A large number of early instrumental observations from Switzerland were digitised and converted to modern units. A quality control procedure was applied mainly to detect and correct digitisation errors.
These observations should be used keeping in mind some significant underlying uncertainties. Thermometers were affected by calibration errors and drifts and were poorly sheltered from radiation. Previous studies have shown that biases with respect to modern measurement standards can reach 5 ∘C in certain conditions (e.g. Böhm et al., 2010). Therefore, some adjustments need to be applied before the temperature observations can be compared with modern records.
Pressure observations can also be affected by substantial biases. Even though a barometer is not exposed to the weather, it is generally more difficult to read than a thermometer and requires more maintenance and know-how by the observer. Brugnara et al. (2015) estimated a root mean square error of 4 hPa for monthly sea-level pressure means obtained from observations made in the early 19th century (although this also includes the effect of the uncertainty in the elevation above sea level of the barometer). Pressure readings that were not corrected for temperature are affected by larger uncertainty.
In general one can assume that the errors in the measurements decrease with time thanks to the rapid scientific and technological progress that occurred between the 18th and the 19th centuries. The historical circumstances of the observations – who measured and why – are also important. Even though most of the observers had some scientific background, some were more interested in the accuracy of the measurements than others. The reader can find detailed information on the observers as well as a preliminary analysis of the observations for many of the records in Brönnimann (2020).
The records described in this paper have various lengths, some spanning several decades, and can potentially be merged with modern records in the future to create 200- or even 250-year-long daily temperature and pressure series for many Swiss cities (e.g. Aarau, Bern, Schaffhausen, St Gallen, Zurich) with few gaps. The high station density should facilitate the statistical correction of biases and inhomogeneities. The dataset is also important for the study of extreme events in the pre-industrial era. The most important variables have been converted to a standard ASCII format that is intended to facilitate data ingestion into global public repositories and consequent use by the scientific community.
YB wrote the manuscript, organised the digitisation, converted the data, and performed the quality control. LP and LV carried out the archive work, collected metadata, and organised the digitisation. SB, CR, and FAI led the project and contributed to the writing of the manuscript.
The authors declare that they have no competing interests.
This work has been supported by Euro-Climhist. We thank all the students who helped in digitising the historical data.
This research has been supported by the Swiss National Science Foundation (SNF) projects CHIMES (grant no. 169676) and REUSE (grant no. 162668) and by the European Union (H2020; ERC grant no. 787574 PALAEO-RA).
This paper was edited by Scott Stevens and reviewed by two anonymous referees.
Auchmann, R., Brönnimann, S., Breda, L., Bühler, M., Spadin, R., and Stickler, A.: Extreme climate, not extreme weather: the summer of 1816 in Geneva, Switzerland, Clim. Past, 8, 325–335, https://doi.org/10.5194/cp-8-325-2012, 2012. a
Böhm, R., Jones, P. D., Hiebl, J., Frank, D., Brunetti, M., and Maugeri, M.: The early instrumental warm-bias: a solution for long central European temperature series 1760–2007, Climatic Change, 101, 41–67, https://doi.org/10.1007/s10584-009-9649-4, 2010. a, b
Brönnimann, S. (Ed.): Swiss Early Instrumental Meteorological Series, vol. G96, Geographica Bernensia, https://doi.org/10.4480/GB2020.G96.01, 2020. a, b
Brönnimann, S., Brugnara, Y., Allan, R. J., Brunet, M., Compo, G. P., Crouthamel, R. I., Jones, P. D., Jourdain, S., Luterbacher, J., Siegmund, P., Valente, M. A., and Wilkinson, C. W.: A roadmap to climate data rescue services, Geosci. Data J., 5, 28–39, https://doi.org/10.1002/gdj3.56, 2018. a
Brönnimann, S., Allan, R., Ashcroft, L., Baer, S., Barriendos, M., Brázdil, R., Brugnara, Y., Brunet, M., Brunetti, M., Chimani, B., Cornes, R., Domínguez-Castro, F., Filipiak, J., Founda, D., Herrera, R. G., Gergis, J., Grab, S., Hannak, L., Huhtamaa, H., Jacobsen, K. S., Jones, P., Jourdain, S., Kiss, A., Lin, K. E., Lorrey, A., Lundstad, E., Luterbacher, J., Mauelshagen, F., Maugeri, M., Maughan, N., Moberg, A., Neukom, R., Nicholson, S., Noone, S., Nordli, O., Ólafsdóttir, K. B., Pearce, P. R., Pfister, L., Pribyl, K., Przybylak, R., Pudmenzky, C., Rasol, D., Reichenbach, D., Řezníčková, L., Rodrigo, F. S., Rohr, C., Skrynyk, O., Slonosky, V., Thorne, P., Valente, M. A., Vaquero, J. M., Westcottt, N. E., Williamson, F., and Wyszyński, P.: Unlocking pre-1850 instrumental meteorological records: A global inventory, B. Am. Meteorol. Soc., 100, ES389–ES413, https://doi.org/10.1175/BAMS-D-19-0040.1, 2019a. a
Brönnimann, S., Franke, J., Nussbaumer, S. U., Zumbühl, H. J., Steiner, D., Trachsel, M., Hegerl, G. C., Schurer, A., Worni, M., Malik, A., Flückiger, J., and Raible, C. C.: Last phase of the Little Ice Age forced by volcanic eruptions, Nat. Geosci., 12, 650–656, https://doi.org/10.1038/s41561-019-0402-y, 2019b. a
Brugnara, Y.: Swiss Early Meteorological Observations, PANGAEA, https://doi.org/10.1594/PANGAEA.909141, 2020. a, b, c
Brugnara, Y., Auchmann, R., Brönnimann, S., Allan, R. J., Auer, I., Barriendos, M., Bergström, H., Bhend, J., Brázdil, R., Compo, G. P., Cornes, R. C., Dominguez-Castro, F., van Engelen, A. F. V., Filipiak, J., Holopainen, J., Jourdain, S., Kunz, M., Luterbacher, J., Maugeri, M., Mercalli, L., Moberg, A., Mock, C. J., Pichard, G., Řezníčková, L., van der Schrier, G., Slonosky, V., Ustrnul, Z., Valente, M. A., Wypych, A., and Yin, X.: A collection of sub-daily pressure and temperature observations for the early instrumental period with a focus on the “year without a summer” 1816, Clim. Past, 11, 1027–1047, https://doi.org/10.5194/cp-11-1027-2015, 2015. a, b, c, d, e
Brugnara, Y., Auchmann, R., Brönnimann, S., Bozzo, A., Berro, D. C., and Mercalli, L.: Trends of mean and extreme temperature indices since 1874 at low-elevation sites in the southern Alps, J. Geophys. Res., 121, 3304–3325, 2016. a
Brugnara, Y., Gilabert, A., Ventura, C., and Hunziker, S.: dataresqc: Quality control tools for climate data developed by the C3S Data Rescue Service, available at: https://github.com/c3s-data-rescue-service/dataresqc, last access: 10 September 2019. a
Camuffo, D. and Bertolin, C.: The earliest temperature observations in the world: the Medici Network (1654–1670), Climatic Change, 111, 335–363, https://doi.org/10.1007/s10584-011-0142-5, 2012. a
Camuffo, D. and Della Valle, A.: A summer temperature bias in early alcohol thermometers, Climatic Change, 138, 633–640, https://doi.org/10.1007/s10584-016-1760-8, 2016. a
Camuffo, D., Cocheo, C., and Sturaro, G.: Corrections of systematic errors, data homogenisation and climatic analysis of the Padova pressure series (1725–1999), Climatic Change, 78, 493–514, https://doi.org/10.1007/s10584-006-9052-3, 2006. a
Camuffo, D., Della Valle, A., Bertolin, C., and Santorelli, E.: Temperature observations in Bologna, Italy, from 1715 to 1815: a comparison with other contemporary series and an overview of three centuries of changing climate, Climatic Change, 142, 7–22, https://doi.org/10.1007/s10584-017-1931-2, 2017. a
Carrard, B.: Abhandlung von den meteorologischen Beobachtungen, Abhandlungen und Beobachtungen durch die Ökonomische Gesellschaft zu Bern gesammelt, 4, 93–169, 1763. a
Cassidy, D. C.: Meteorology in Mannheim: The Palatine Meterological Society, 1780–1795, Sudhoffs Archiv, 69, 8–25, 1985. a
Compo, G. P., Whitaker, J. S., and Sardeshmukh, P. D.: Feasibility of a 100-year reanalysis using only surface pressure data, B. Am. Meteorol. Soc., 87, 175–190, https://doi.org/10.1175/BAMS-87-2-175, 2006. a
Deluc, J.: Recherches sur les modifications de l'atmosphère, Geneva, https://doi.org/10.3931/e-rara-1330, 1772. a, b
Derham, W.: Tables of the barometrical altitudes at Zurich in Switzerland in the year 1708, Philosophical Transactions, 26, 334–366, 1709. a
Fahrenheit, D.: Experimenta & Observationes De Congelatione Aquae in Vacuo Factae a D. G. Fahrenheit, R. S. S., Philosophical Transactions, 33, 78–84, 1724. a
Gauvin, J.-F.: The Instrument That Never Was: Inventing, Manufacturing, and Branding Réaumur's Thermometer During the Enlightenment, Ann. Sci., 69, 515–549, https://doi.org/10.1080/00033790.2011.609073, 2012. a
Gisler, O.: Die meteorologischen Beobachtungen von Schaffhausen (1794–1845) und Zürich (1767–1802) nebst einigen Betrachtungen über historische Niederschlagsreihen, vol. 12 of Physische Geographie, Geographisches Institut der Universität Zürich, Zurich, 1983. a, b
Grimmer, M.: The Meteorological Diaries of Johann Rudolf von Salis-Marschlins, 1781–1800, Master's thesis, Oeschger Centre for Climate Change Research, Bern, available at: https://occrdata.unibe.ch/students/theses/msc/283.pdf (last access: 15 May 2020), 2019. a
Hawkins, E., Burt, S., Brohan, P., Lockwood, M., Richardson, H., Roy, M., and Thomas, S.: Hourly weather observations from the Scottish Highlands (1883–1904) rescued by volunteer citizen scientists, Geosci. Data J., 6, 160–173, https://doi.org/10.1002/gdj3.79, 2019. a
Hupfer, F.: Das Wetter in Tabellen. Christian Gregor Brügger und die Institutionalisierung der Meteorologie, in: Die Naturforschenden, Auf der Suche nach Wissen über die Schweiz und die Welt, 1800–2015, edited by: Kupper, P. and Schär, B. C., hier + jetzt, Baden, 2015. a
Hupfer, F.: Das Wetter der Nation. Meteorologie, Klimatologie und der schweizerische Bundesstaat, 1860–1914, PhD thesis, Swiss Federal Institute of Technology, Zurich, https://doi.org/10.3929/ethz-b-000254661, 2017. a
Knowles Middleton, W. E.: A history of the thermometer and its use in meteorology, Johns Hopkins University Press, Baltimore, 1966. a, b, c, d
Lambert, J.: Observationes meteorologicas Curia Rhaetorum habitas, una cum variis in eas animadversionibus, Acta Helvetica, 3, 321–365, 1758. a, b
Lenke, W.: Untersuchung der ältesten Temperaturmessungen mit Hilfe des strengen Winters 1708–1709, Berichte des Deutschen Wetterdienstes 92, Deutscher Wetterdienst, Offenbach am Main, 1964. a
Micheli du Crest, J.-B.: Description de la method d'un thermometre universel, Valleyre, Paris, 1741. a
Micheli du Crest, J.-B.: Explication des Tables de Correction des effets du chaud & du froid dans le Barométre, Imhof, Basel, Acta Helvetica, 3, 94–104, 1758. a
Miles, H.: A letter from the Reverend Henry Miles D. D. to Mr. Henry Baker F. R. S. concerning the difference of the degrees of cold marked by a thermometer kept within doors, or without in the open air, Philosophical Transactions, 44, 613–616, 1747. a
Neukom, R., Steiger, N., Gómez-Navarro, J. J., Wang, J., and Werner, J. P.: No evidence for globally coherent warm and cold periods over the preindustrial Common Era, Nature, 571, 550–554, https://doi.org/10.1038/s41586-019-1401-2, 2019. a
Pfister, C.: Agrarkonjunktur und Witterungsverlauf im westlichen Schweizer Mittelland zur Zeit der Ökonomischen Patrioten 1755–1797, Lang, Liebefeld/Bern, 1975. a, b
Pfister, C., Rohr, C., and Jover, A.: Euro-Climhist: eine Datenplattform der Universität Bern zur Witterungs-, Klima-und Katastrophengeschichte, Wasser Energie Luft, 109, 45–48, 2017. a
Pfister, L.: Early instrumental meteorological measurements in Switzerland, Zenodo, https://doi.org/10.5281/zenodo.3066836, 2019. a, b
Pfister, L., Hupfer, F., Brugnara, Y., Munz, L., Villiger, L., Meyer, L., Schwander, M., Isotta, F. A., Rohr, C., and Brönnimann, S.: Early instrumental meteorological measurements in Switzerland, Clim. Past, 15, 1345–1361, https://doi.org/10.5194/cp-15-1345-2019, 2019. a, b, c
Slivinski, L. C., Compo, G. P., Whitaker, J. S., Sardeshmukh, P. D., Giese, B. S., McColl, C., Allan, R., Yin, X., Vose, R., Titchner, H., Kennedy, J., Spencer, L. J., Ashcroft, L., Brönnimann, S., Brunet, M., Camuffo, D., Cornes, R., Cram, T. A., Crouthamel, R., Domínguez-Castro, F., Freeman, J. E., Gergis, J., Hawkins, E., Jones, P. D., Jourdain, S., Kaplan, A., Kubota, H., Blancq, F. L., Lee, T.-C., Lorrey, A., Luterbacher, J., Maugeri, M., Mock, C. J., Moore, G. K., Przybylak, R., Pudmenzky, C., Reason, C., Slonosky, V. C., Smith, C. A., Tinz, B., Trewin, B., Valente, M. A., Wang, X. L., Wilkinson, C., Wood, K., and Wyszyński, P.: Towards a more reliable historical reanalysis: Improvements for version 3 of the Twentieth Century Reanalysis system, Q. J. Roy. Meteor. Soc., 145, 2876–2908, https://doi.org/10.1002/qj.3598, 2019. a
Stocker, T., Qin, D., Plattner, G.-K., Tignor, M., Allen, S. K., Boschung, J., Nauels, A., Xia, Y., Bex, V., and Midgley, P. M. (Eds.): Climate change 2013: The physical science basis, Cambridge University Press, Cambridge, UK, and New York, 2014. a
Talas, S.: Thermometers in the eighteenth century: J.B. Micheli du Crest's works and the cooperation with G.F. Brander, Nuncius, 17, 475–496, https://doi.org/10.1163/182539102X00063, 2002. a, b, c, d
Thieurmel, B. and Elmarhraoui, A.: Suncalc: R package for calculating sun/moon positions and phases, linked to suncalc.js, available at: https://github.com/datastorm-open/suncalc, last access: 10 September 2019. a
van Swinden, J. H.: Dissertation sur la comparaison des thermomètres, Rey, Amsterdam, 1778. a, b
Wild, H.: Ueber die Bestimmung der Lufttemperatur, in: Mitteilungen der Naturforschenden Gesellschaft Bern, 91–119, 1860. a
Wild, H.: Bericht über die meteorologischen Arbeiten im Kanton Bern im Jahr 1861, in: Mitteilungen der Naturforschenden Gesellschaft in Bern, 217–237, 1862. a
Winkler, P.: Revision and necessary correction of the long-term temperature series of Hohenpeissenberg, 1781–2006, Theor. Appl. Climatol., 98, 259–268, https://doi.org/10.1007/s00704-009-0108-y, 2009. a
WMO: Guide to meteorological instruments and methods of observation, WMO-No. 8, World Meteorological Organization, Geneva, 2008. a, b, c