the Creative Commons Attribution 4.0 License.
the Creative Commons Attribution 4.0 License.
Historical porosity data in polar firn
Kévin Fourteau
Laurent Arnaud
Xavier Faïn
Patricia Martinerie
David M. Etheridge
Vladimir Lipenkov
Jean-Marc Barnola
In the 1990s, closed and open porosity volumes of firn samples were measured by J.-M. Barnola using the technique of gas pycnometry, on firn from three different polar sites. They are the basis of a parameterization of closed porosity in polar firn, first introduced in Goujon et al. (2003) and used in several firn physics models (e.g., Buizert et al., 2012). However, these data and their processing have not been published in their own right yet. In this short article, we detail how they were processed by J.-M. Barnola and how the closed porosity parameterization was obtained. We show that the original data processing only partially accounts for the presence of reopened bubbles in the samples. Since the proper correction to apply for this effect is hard to estimate, we also processed the data without including a correction for reopened bubbles. Finally, we made these pycnometry data available in order to be used by the glaciology community, notably for the study of polar ice formation and of the composition of gas records in ice cores. They are hosted on the PANGAEA database: https://doi.org/10.1594/PANGAEA.907678 (Fourteau et al., 2019a).
- Article
(619 KB) - Full-text XML
- BibTeX
- EndNote
The enclosing of atmospheric air in the ice of polar regions is of great importance for the study of past climates. Indeed, ice cores drilled in the polar regions have the unique characteristics of containing bubbles of air from past atmospheres. They have thus been used to reconstruct the atmosphere history of major greenhouse gas concentrations for the last 800 000 years (Lüthi et al., 2008; Loulergue et al., 2008). However, in order to properly interpret the gas records from ice cores, it is necessary to understand the trapping of air in the ice (Schwander and Stauffer, 1984; Stauffer et al., 1985; Schwander et al., 1993; Rommelaere et al., 1997; Trudinger et al., 1997, 2002).
The snow at the surface of polar ice sheets is a porous material, and interstitial air can freely exchange with the atmosphere (Stauffer et al., 1985). Snow strata are progressively buried under new precipitation and are compressed due to the weight of the younger snow above. This buried, metamorphosed, and compacted snow is referred to as firn. With time the firn strata are further buried and their interstitial porous networks shrink. Depending on the local temperature and accumulation conditions, some of the pores start to pinch and encapsulate the interstitial air at depths between 50 and 100 m below the surface (Witrant et al., 2012). The porous network then continues to close until all the interstitial air is isolated from the atmosphere. The firn then becomes airtight ice with enclosed bubbles of atmospheric air.
One way to characterize the closing of the porous network and the trapping of gases is to measure the closed and the open pore volumes. Closed pores are pores that no longer connect to the atmosphere. On the other hand, open pores connect to the atmosphere through an interconnected porous network. Moreover, data of closed and open pore volumes are required for the usage of gas-trapping models (Rommelaere et al., 1997; Goujon et al., 2003; Buizert et al., 2012; Witrant et al., 2012). That is why closed and open volumes have been measured along various firn columns from Greenland and Antarctica (Schwander and Stauffer, 1984; Schwander et al., 1993; Schaller et al., 2017).
Such measurements were notably performed in the 1990s by J.-M. Barnola on firn cores drilled at the three polar sites of Vostok (Antarctica), Summit (Greenland), and DE08-2 (Antarctica), using the technique of gas pycnometry (Schwander and Stauffer, 1984; Stauffer et al., 1985). The three sites have very different characteristics, from the cold and low-accumulation site of Vostok to the high-accumulation site of Law Dome's DE08-2. Their respective accumulation rates and temperatures are given in Table 1. The three sites have been exploited for the range of environmental information they contain, from recent decades to more than 400 000 years before present (Barnola et al., 1987; Schwander et al., 1993; Trudinger et al., 1997). The obtained porosity data have been widely used to parameterize closed porosity as a function of density in firn physics models (Trudinger et al., 1997; Goujon et al., 2003; Buizert et al., 2012; Witrant et al., 2012). Unfortunately, J.-M. Barnola passed away before publishing the data in the peer-reviewed literature. For transparency, and to recognize J.-M. Barnola's effort, care, and foresight in undertaking the measurements at three remote sites, we decided to make them available. Our goal is also to provide an explanation of how the closed porosity parameterization proposed in Goujon et al. (2003) was derived. Moreover, measuring closed porosity is labor intensive and requires a large amount of firn material. As a result, this type of data are rather scarce. We hope that making these data available will help the ice core community to better understand the trapping of gases in polar ice.
Table 1Characteristics of the three investigated polar sites.

a Lipenkov et al. (1997). b Schwander et al. (1993). c Etheridge et al. (1996). d Etheridge et al. (1992).
The technique used by J.-M. Barnola to measure the closed and open porosity volumes in firn samples is the gas pycnometry method (Schwander and Stauffer, 1984; Stauffer et al., 1985). The pycnometry apparatus is composed of two airtight chambers of known volumes V1 and V2 with a valve between them allowing to either connect or isolate the chambers. A scheme is provided in the Supplement of Fourteau et al. (2019b). A pressure gauge is joined to the chamber V1 to monitor its internal pressure. For the measurements, a firn sample is placed in the first chamber V1, while the second one is isolated and vacuum-pumped. Placing a firn sample in the chamber V1 renders a volume Vs inaccessible to the gases. The pressure P in V1 is recorded. Then, the two chambers are connected, allowing the gas in chamber V1 to expand to a larger volume. The pressure after expansion P′ is then recorded. The system was designed to minimize the pressure drop, in order to avoid rupturing recently closed and still fragile pores. The volume Vs can be related to the recorded pressure by
where .
The protocol followed by J.-M. Barnola was to first execute an expansion without any sample in the first chamber, then a second expansion with the sample. In this case, Eq. (1) can be rearranged as
where R0 and R1 are respectively the pressure ratio in the cases without and with the firn sample in V1.
The volume inaccessible to gases is composed of the ice phase and of the closed pore phase. Therefore, one can deduce the closed and open porosity volumes:
where Vcl and Vo are the closed and open porosity volumes, Vice the volume of the ice phase, and Vcyl the volume of the firn sample. The volume of the ice phase is deduced from the mass M of the sample knowing that , where ρice is the density of pure ice. The density of pure ice is estimated using the temperature relationship ρice=0.9165 , where ρice is expressed in grams per cubic centimeter and T is the temperature expressed in degrees Celsius (Bader, 1964; Goujon et al., 2003). The volume of the firn sample Vcyl is measured geometrically with calipers.
Note that in the pycnometry experiment, all the pores reaching the edge of the sample are considered open. This means that some pores that are closed in the firn column (they do not reach the atmosphere) will be considered open during the pycnometry measurement. This is known as the cut-bubble effect and leads to an underestimation of the closed porosity (Martinerie et al., 1990; Schaller et al., 2017).
The firn samples used for the pycnometry measurements are cylindrical samples of about 4 to 5 cm in height and diameter. They were produced by machining on a lathe and trimmed with a drop saw in order to produce well-shaped cylinders. The measurements were performed in environments with a good temperature stability, to limit the effect of temperature variations. Finally, in order to avoid post-coring effects, all the samples were measured directly in the field, shortly after the drilling of the firn core.
For each of the three sites we retrieved a computer file containing the expansion ratios R0 and R1, the mass of the firn samples, their volumes, and the temperature during the experiment. We also retrieved the source codes that J.-M. Barnola used to process the data. Finally, we have the experiment notebooks of J.-M. Barnola.
3.1 Original data processing
In this section, we aim to reproduce the data processing performed by J.-M. Barnola. This is done for two reasons. First, the data have been used to derive a parameterization of the closed porosity in polar firn (Goujon et al., 2003), and it is therefore important to understand how they were processed. Second, the original processing includes corrections for experimental biases that were observed by J.-M. Barnola and that have to be taken into account.
The original source codes indicate that the processing included a correction to account for both a pycnometry system drift and the cut-bubble effect. This correction is based on the idea that the pycnometry method should ideally indicate fully open samples at low density (ρ<0.72 g cm−3) and fully closed ones at high density (ρ>0.86 g cm−3). A correcting factor α to be applied to the inaccessible volume Vs can thus be determined for each of these low and high-density samples. The α factors are such that the measurements of low-density firn samples (high-density firn samples) yields a fully open (closed) porosity. In the case of low-density firn, α is computed as , and in the case of high-density firn . J.-M. Barnola observed that the α factors are linearly related to the empty expansion ratio R0 (Fig. 1). This might come as a surprise as R0 is measured before the sample is inserted in the apparatus. Our understanding is that it reflects that α and R0 are simultaneously affected by system drifts. By monitoring the evolution of R0, one is able to estimate the correcting factor α to be applied. However, as seen in Fig. 1, the linear relationship is not the same for high-density and low-density firn samples. J.-M. Barnola derived intermediate linear relationships, in black in Fig. 1. Thus, for each firn sample (including mid-density samples), a correcting factor is determined thanks to the preceding empty expansion and applied to the inaccessible volume Vs. Finally, in all of the three measurement campaigns the volume V2 has been estimated to be of 7.2 cm3 (value found directly in J.-M. Barnola's processing codes). One should note that we were not able to identify the physical mechanism at the origin of the pycnometry system drift. Further work should be dedicated to this topic.
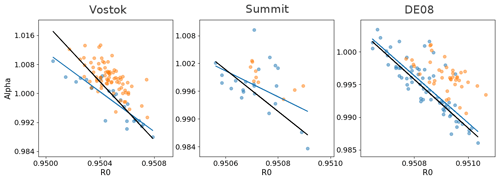
Figure 1In each panel, the blue dots are the correcting factors α computed for low-density firn as a function of the preceding R0, the orange dots are the correcting factors α computed for high-density firn as a function of R0, the black line is the linear relation originally derived by J.-M. Barnola, and the blue line is the linear regression based solely on the low-density α.
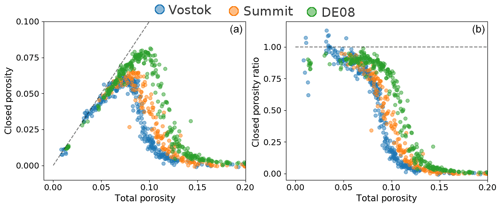
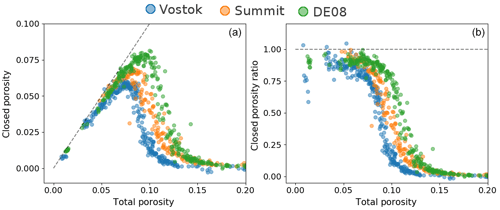
Figure 2Porosity data obtained using the J.-M. Barnola processing chain. (a) Closed porosity against total porosity. The dashed line represents where the closed porosity equals the total porosity. (b) Closed porosity ratio over total porosity. The dashed line indicates where the closed porosity ratio equals 1.
3.1.1 Vostok measurement campaign
The Vostok measurements were performed on the BH3 firn core, drilled during the austral summer 1991/92. For this measurement campaign, J.-M. Barnola observed a bias due to the measurement of sample volumes with a caliper, depending on the pressure applied by the caliper. He therefore proposed applying a volume correction of 0.9 % to the firn samples that were measured by applying a too weak pressure with the caliper. He also applied a 4 ∘C correction to the recorded temperatures in order to account for the heat dissipation of heated elements towards the temperature sensor. For the Vostok campaign measurements α is computed following , shown in black in the left panel of Fig. 1. These three corrections were found hard-coded in the Vostok processing source code and have been corroborated by the notebooks.
3.1.2 Summit measurement campaign
The firn porosity measurements of Summit were performed in the framework of the 1989 EUROCORE project. For this campaign the same volume correction of 0.9 % was applied to all the samples. Moreover, a weighting bias was found by J.-M. Barnola and is taken into account by applying a 0.9983 correction factor to the measured mass. Finally, the α correction is given by R0+43.820459, in black in the middle panel of Fig. 1. It is interesting to note that for Summit the correction chosen by J.-M. Barnola seems to be primarily based on the low-density α only.
3.1.3 DE08-2 measurement campaign
The DE08-2 measurements were performed during the austral summer 1992/93. For DE08-2, no volume or mass correction is reported in the original processing code. The α correction is given by , in black in the right panel of Fig. 1. Again, the correction chosen by J.-M. Barnola appears to be primarily based on the low-density α.
From these data, we can deduce the closed and open porosity volumes. Figure 2 displays closed porosity and closed porosity ratio values against total porosity. Closed porosity is defined as the volume fraction occupied by the closed pores in the firn sample, total porosity is defined as the volume fraction of all pores, and the closed porosity ratio is the ratio of the closed pore volume over the total porous volume. We chose to use volume fractions instead of porous volumes per gram of firn, as the former are not sensitive to temperature and therefore render the comparison between sites easier. Yet, the volume fraction data can easily be converted to porous volumes per gram of firn using the density of pure ice. It is interesting to note that the pycnometry data indicate that a cold site like Vostok reaches pore close-off at a higher density than a warm site like DE08-2. This is consistent with the results of Martinerie et al. (1994) that indicate an increase in the porous volume at close-off with temperature based on air content measurements. Finally, because of experimental dispersion, some firn samples were measured with a closed pore volume below zero or above the total porous volume. Potential users of the data should be aware that these values are not physically sound and reflect the experimental errors of the pycnometry method.
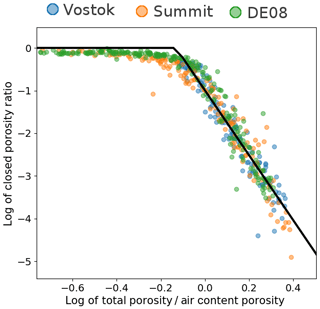
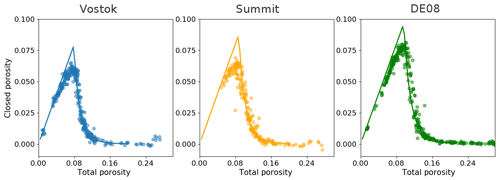
Figure 4Relationship between the logarithm of the closed porosity ratio and the logarithm of the total porosity. The solid black line corresponds to the Barnola parameterization. The closed porosity data were obtained with the original processing chain.
3.2 Uncertainty analysis
Unfortunately, the original data we retrieved do not allow us to perform a systematic uncertainty analysis. Indeed, we did not retrieve a quantification of the uncertainties of the raw measurements, such as the sample's mass or volume. We are therefore not able to propagate the uncertainties of the raw measurements to the final derived quantities, such as the density or the closed porosity ratio.
However, a recent pycnometry campaign was conducted for an East Antarctic firn core, including a dedicated uncertainty analysis (Sect. S1.3 of the Supplement in Fourteau et al., 2019b). The measurements were performed with the same pycnometry apparatus and with the same sample size as the data presented in this article. We can therefore expect the data of J.-M. Barnola to be affected by similar uncertainties. Fourteau et al. (2019b) quantified the errors associated with the measurements performed in the cold room and used to derived the density and the closed porosity of the samples. This includes the errors on the mass of the sample, their radius and height, the pressures of the chambers, and the volumes of the chambers. These errors were then propagated to obtain an estimation of the uncertainty of the density and closed porosity of the samples.
The analysis of Fourteau et al. (2019b) indicates that the uncertainty on density is fairly constant over the entire range of measurements with a value of 0.0082 g cm−3, that is to say an uncertainty of about 0.009 on density relative to pure ice. This represents a relative uncertainty of about 1 % on the derived density. Note that this is of the same order as the correction applied by J.-M. Barnola to the volumes of the Vostok samples. Contrary to density, the uncertainty of the closed porosity ratio is not constant over the entire range of data and increases from about 0.02 for low-density samples to about 0.2 for high-density samples. For both quantities, the dominant contribution to the final uncertainty is the uncertainty of the measured sample volume.
3.3 A new data processing
We identify one major issue in the processing elaborated by J.-M. Barnola. In the case of high-density firn samples, determining a correcting factor with encapsulates the effect both of system drift and of cut bubbles. Indeed, the assumption under which this factor is computed is that the pycnometry experiment should measure a fully closed sample at high density, de facto including a cut-bubble correction. However, the correction to be applied for cut bubbles is not the same at all densities (Schaller et al., 2017). It thus explains why the high- and low-density α relationship with R0 might differ. On the other hand, the low-density α does not include any cut-bubble correction and therefore should only account for system drifts. We therefore propose to correct the data using a linear regression between R0 and the low-density α only. These corrections are displayed as blue lines in Fig. 1. As shown in the figure, the new corrections mainly differ in the Vostok case. The closed porosity and closed porosity ratio after applying this new correction are displayed in Fig. 3.
It is important to note that these data are not corrected for cut bubbles and therefore do not directly represent the volume of closed pores in the firn column. We decided not to correct the data for cut bubbles in this article. Indeed, the appropriate corrections are hard to estimate and potentially site dependent (Schaller et al., 2017). Recently, Schaller et al. (2017) reported a fraction of reopened bubbles of up to 60 % for similarly sized B53 firn samples (East Antarctic plateau). Further research is needed to fully solve this problem.
The firn densification and gas-trapping model of Goujon et al. (2003) uses a parameterization of closed porosity proposed by J.-M. Barnola (Eq. 9 of Goujon et al., 2003). This Barnola parameterization relates the closed porosity to the total porosity with
where Pclosed is the closed porosity, Ptotal the total porosity, Pclose−off the close-off porosity that can be estimated using air content measurements or a temperature regression (Martinerie et al., 1994), and γ a factor valued at 0.37.
We are confident that the Barnola closed porosity parameterization was deduced from the pycnometry data described in Sect. 3.1, with the original processing chain. Indeed, there is a clear linear relationship between the logarithm of the closed porosity ratio and the logarithm of the total porosity normalized by the porosity at mean close-off deduced from air content data. This relation, displayed in Fig. 4, is consistent with the Barnola parameterization. The comparison between the experimental closed porosities and the Barnola parameterization is also displayed in Fig. 5. It is therefore important to acknowledge that the Barnola parameterization is based on data that are not fully corrected for cut bubbles. Future users of this parameterization should be aware of this potential limitation. However, since we are not able to properly estimate the corrections to be applied for cut bubbles, we cannot propose a new law replacing the Barnola parameterization at this point.
We evaluated the pycnometry data from three polar sites obtained in the 1990s by J.-M. Barnola. Based on original computer files, including raw data and processing source codes, we were able to reproduce the processing chain developed by J.-M. Barnola, including experimental bias corrections. We found that these data have not been fully corrected for the cut-bubble effect. We also confirm that the closed porosity data deduced from those pycnometry experiments were used to derive the Barnola closed porosity parameterization, first introduced in Goujon et al. (2003). Consequently, this parameterization suffers from the incomplete cut-bubble correction of the pycnometry data. More work is needed to quantify the volume of reopened bubbles in firn samples, but recent work highlighted a fraction of reopened bubbles reaching up to 60 % (Schaller et al., 2017).
Finally, we made these data publicly available on the PANGAEA database (Fourteau et al., 2019a). Note that the naming convention used in the database is different from the one used in the article. On the PANGAEA database “Poros open”, “Poros closed”, “Poros frac”, and “Poros vol” respectively correspond to the “open porosity volume”, “closed porosity volume”, “closed porosity ratio”, and “total porous volume” of this article. The three sites studied in this article are characterized by a wide range of accumulation rates and temperatures. Such data are crucial to understand the age, amount, and composition of the air enclosed in polar ice sheets. They could be useful for future studies focusing on the effect of the climatic conditions on pore closure and gas trapping, as well as to interpret long-term ice core atmospheric records.
The codes used to process the data were developed using Python 3. They will be provided upon direct request to the corresponding authors.
The pycnometry datasets generated with the new correction methodology are hosted on the PANGAEA database: https://doi.org/10.1594/PANGAEA.907678 (Fourteau et al., 2019a). The datasets generated using the original J.-M. Barnola correction methodology will be provided upon direct request to the corresponding authors.
The pycnometry measurements were performed by J-MB with the help of DME and VL. The original data files and notebooks were retrieved by LA, XF, and PM. The reconstruction of the original processing chain was carried out by LA, XF, KF, and PM. The codes to process the data were developed by KF. All authors contributed to the interpretation of the data. The manuscript was written by KF with the help of all the co-authors.
The authors declare that they have no conflict of interest.
We are grateful to Jakob Schwander for his help for the pycnometry measurements at the Summit site. We thank the 1991/92 Vostok, 1989 EUROCORE, and 1992/93 DE08-2 Law Dome ice core programs, as well as the field personnel that contributed to these successful shallow-drilling operations. We acknowledge Olivier Magand for his help retrieving the original notebooks and his tests of the pycnometry method. We are thankful to Christo Buizert and Johannes Freitag for reviewing the article and to Ge Peng for editing it.
This paper was edited by Ge Peng and reviewed by Christo Buizert and Johannes Freitag.
Bader, H.: Density of ice as a function of temperature and stress, Cold Regions Research and Engineering Laboratory, US Army Material Command, 1964. a
Barnola, J.-M., Raynaud, D., Korotkevich, Y. S., and Lorius, C.: Vostok ice core provides 160,000-year record of atmospheric CO2, Nature, 329, 408, https://doi.org/10.1038/329408a0, 1987. a
Buizert, C., Martinerie, P., Petrenko, V. V., Severinghaus, J. P., Trudinger, C. M., Witrant, E., Rosen, J. L., Orsi, A. J., Rubino, M., Etheridge, D. M., Steele, L. P., Hogan, C., Laube, J. C., Sturges, W. T., Levchenko, V. A., Smith, A. M., Levin, I., Conway, T. J., Dlugokencky, E. J., Lang, P. M., Kawamura, K., Jenk, T. M., White, J. W. C., Sowers, T., Schwander, J., and Blunier, T.: Gas transport in firn: multiple-tracer characterisation and model intercomparison for NEEM, Northern Greenland, Atmos. Chem. Phys., 12, 4259–4277, https://doi.org/10.5194/acp-12-4259-2012, 2012. a, b, c
Etheridge, D. M., Pearman, G. I., and Fraser, P. J.: Changes in tropospheric methane between 1841 and 1978 from a high accumulation-rate Antarctic ice core, Tellus B, 44, 282–294, https://doi.org/10.3402/tellusb.v44i4.15456, 1992. a
Etheridge, D. M., Steele, L. P., Langenfelds, R. L., Francey, R. J., Barnola, J.-M., and Morgan, V. I.: Natural and anthropogenic changes in atmospheric CO2 over the last 1000 years from air in Antarctic ice and firn, J. Geophys. Res.-Atmos., 101, 4115–4128, https://doi.org/10.1029/95JD03410, 1996. a
Fourteau, K., Arnaud, L., Faïn, X., Martinerie, P., Etheridge, D., Lipenkov, V., and Barnola, J.-M.: Gas pycnometry firn porosity data of firn ice cores from three polar sites, Pangaea, https://doi.org/10.1594/PANGAEA.907678, 2019a. a, b, c
Fourteau, K., Martinerie, P., Faïn, X., Schaller, C. F., Tuckwell, R. J., Löwe, H., Arnaud, L., Magand, O., Thomas, E. R., Freitag, J., Mulvaney, R., Schneebeli, M., and Lipenkov, V. Ya.: Multi-tracer study of gas trapping in an East Antarctic ice core, The Cryosphere, 13, 3383–3403, https://doi.org/10.5194/tc-13-3383-2019, 2019b. a, b, c, d
Goujon, C., Barnola, J.-M., and Ritz, C.: Modeling the densification of polar firn including heat diffusion: application to close-off characteristics and gas isotopic fractionation for Antarctica and Greenland sites, J. Geophys. Res.-Atmos., 108, 4792, https://doi.org/10.1029/2002jd003319, 2003. a, b, c, d, e, f, g, h, i
Lipenkov, V. Y., Salamatin, A. N., and Duval, P.: Bubbly-ice densification in ice sheets: II. Applications, J. Glaciol., 43, 397–407, https://doi.org/10.1017/S0022143000034973, 1997. a
Loulergue, L., Schilt, A., Spahni, R., Masson-Delmotte, V., Blunier, T., Lemieux, B., Barnola, J.-M., Raynaud, D., Stocker, T. F., and Chappellaz, J.: Orbital and millennial-scale features of atmospheric CH4 over the past 800,000 years, Nature, 453, 383–386, https://doi.org/10.1038/nature06950, 2008. a
Lüthi, D., Floch, M. L., Bereiter, B., Blunier, T., Barnola, J.-M., Siegenthaler, U., Raynaud, D., Jouzel, J., Fischer, H., Kawamura, K., and Stocker, T. F.: High-resolution carbon dioxide concentration record 650,000–800,000 years before present, Nature, 453, 379–382, https://doi.org/10.1038/nature06949, 2008. a
Martinerie, P., Lipenkov, V. Y., and Raynaud, D.: Correction of air-content measurements in polar ice for the effect of cut bubbles at the surface of the sample, J. Glaciol., 36, 299–303, https://doi.org/10.3189/002214390793701282, 1990. a
Martinerie, P., Lipenkov, V. Y., Raynaud, D., Chappellaz, J., Barkov, N., and Lorius, C.: Air content paleo record in the Vostok ice core (Antarctica): A mixed record of climatic and glaciological parameters, J. Geophys. Res.-Atmos., 99, 10565–10576, https://doi.org/10.1029/93JD03223, 1994. a, b
Rommelaere, V., Arnaud, L., and Barnola, J.-M.: Reconstructing recent atmospheric trace gas concentrations from polar firn and bubbly ice data by inverse methods, J. Geophys. Res.-Atmos., 102, 30069–30083, https://doi.org/10.1029/97jd02653, 1997. a, b
Schaller, C. F., Freitag, J., and Eisen, O.: Critical porosity of gas enclosure in polar firn independent of climate, Clim. Past, 13, 1685–1693, https://doi.org/10.5194/cp-13-1685-2017, 2017. a, b, c, d, e, f
Schwander, J. and Stauffer, B.: Age difference between polar ice and the air trapped in its bubbles, Nature, 311, 45–47, https://doi.org/10.1038/311045a0, 1984. a, b, c, d
Schwander, J., Barnola, J.-M., Andrié, C., Leuenberger, M., Ludin, A., Raynaud, D., and Stauffer, B.: The age of the air in the firn and the ice at Summit, Greenland, J. Geophys. Res.-Atmos., 98, 2831–2838, https://doi.org/10.1029/92jd02383, 1993. a, b, c, d
Stauffer, B., Schwander, J., and Oeschger, H.: Enclosure of air during metamorphosis of dry firn to ice, Ann. Glaciol., 6, 108–112, https://doi.org/10.3189/1985AoG6-1-108-112, 1985. a, b, c, d
Trudinger, C. M., Enting, I. G., Etheridge, D. M., Francey, R. J., Levchenko, V. A., Steele, L. P., Raynaud, D., and Arnaud, L.: Modeling air movement and bubble trapping in firn, J. Geophys. Res.-Atmos., 102, 6747–6763, https://doi.org/10.1029/96jd03382, 1997. a, b, c
Trudinger, C. M., Etheridge, D. M., Rayner, P. J., Enting, I. G., Sturrock, G. A., and Langenfelds, R. L.: Reconstructing atmospheric histories from measurements of air composition in firn, J. Geophys. Res.-Atmos., 107, ACH15-1–ACH15-13, https://doi.org/10.1029/2002JD002545, 2002. a
Witrant, E., Martinerie, P., Hogan, C., Laube, J. C., Kawamura, K., Capron, E., Montzka, S. A., Dlugokencky, E. J., Etheridge, D., Blunier, T., and Sturges, W. T.: A new multi-gas constrained model of trace gas non-homogeneous transport in firn: evaluation and behaviour at eleven polar sites, Atmos. Chem. Phys., 12, 11465–11483, https://doi.org/10.5194/acp-12-11465-2012, 2012. a, b, c


