the Creative Commons Attribution 4.0 License.
the Creative Commons Attribution 4.0 License.
 | 17 Jun 2019
Meteorological and evaluation datasets for snow modelling at 10 reference sites: description of in situ and bias-corrected reanalysis data
Richard Essery
Alan Barr
Paul Bartlett
Jeff Derry
Marie Dumont
Charles Fierz
Hyungjun Kim
Anna Kontu
Yves Lejeune
Danny Marks
Masashi Niwano
Mark Raleigh
Libo Wang
Nander Wever
This paper describes in situ meteorological forcing and evaluation data, and bias-corrected reanalysis forcing data, for cold regions' modelling at 10 sites. The long-term datasets (one maritime, one arctic, three boreal, and five mid-latitude alpine) are the reference sites chosen for evaluating models participating in the Earth System Model-Snow Model Intercomparison Project. Periods covered by the in situ data vary between 7 and 20 years of hourly meteorological data, with evaluation data (snow depth, snow water equivalent, albedo, soil temperature, and surface temperature) available at varying temporal intervals. Thirty-year (1980–2010) time series have been extracted from a global gridded surface meteorology dataset (Global Soil Wetness Project Phase 3) for the grid cells containing the reference sites, interpolated to 1 h time steps and bias-corrected. Although the correction was applied to all sites, it was most important for mountain sites hundreds of metres higher than the grid elevations and for which uncorrected air temperatures were too high and snowfall amounts too low. The discussion considers the importance of data sharing to the identification of errors and how the publication of these datasets contributes to good practice, consistency, and reproducibility in geosciences. The Supplement provides information on instrumentation, an estimate of the percentages of missing values, and gap-filling methods at each site. It is hoped that these datasets will be used as benchmarks for future model development and that their ease of use and availability will help model developers quantify model uncertainties and reduce model errors. The data are published in the repository PANGAEA and are available at https://doi.pangaea.de/10.1594/PANGAEA.897575.
Please read the corrigendum first before continuing.
-
Notice on corrigendum
The requested paper has a corresponding corrigendum published. Please read the corrigendum first before downloading the article.
-
Article
(5704 KB)
- Corrigendum
-
Supplement
(106 KB)
-
The requested paper has a corresponding corrigendum published. Please read the corrigendum first before downloading the article.
- Article
(5704 KB) - Full-text XML
- Corrigendum
-
Supplement
(106 KB) - BibTeX
- EndNote


In the past decade, several long-term datasets aimed at providing high-quality continuous meteorological and evaluation data for cold regions modelling have been published (Table 1). The importance of such datasets is twofold. Their primary value is scientific: they help us to understand key surface processes by enabling the development and evaluation of existing and new geophysical models for climate research and forecasting. The second, perhaps less obvious, value of having multiple long-term datasets is for meta-research; the smaller the studies or sample size, the less likely research findings are to be true (Ioannidis, 2005). In a snow modelling context, this is corroborated by Rutter et al. (2009) who found low correlations in performance statistics for the same snow models but in different years.
Here, we describe 10 long-term datasets (Table 1) from reference sites chosen to force and to evaluate models participating in the Earth System Model-Snow Model Intercomparison Project (ESM-SnowMIP) (Krinner et al., 2018), an international coordinated modelling effort that investigates snow schemes. ESM-SnowMIP is closely aligned with the Land Surface, Snow and Soil Moisture Model Intercomparison Project (LS3MIP; van den Hurk et al., 2016), which is a contribution to the Coupled Model Intercomparison Project Phase 6 (CMIP6), including global offline land model experiments with meteorological forcing data provided by the Global Soil Wetness Project Phase 3 (GSWP3; Kim, 2017). Two meteorological datasets are described for each site: one compiled from on-site measurements, the other derived from GSWP3. Previous iterations of SnowMIP have provided 19 site years of data from four sites in SnowMIP1 (Essery and Etchevers, 2004) and 9 site years of data from five sites in SnowMIP2 (Essery et al., 2009; Rutter et al., 2009); ESM-SnowMIP totals 136 site years of in situ data from 10 sites and 300 site years derived from GSWP3.
Measurement details at five of the sites have been described in dedicated publications within the last 8 years. The other five sites are partially described in a number of publications which, combined, give a broad overview of the data. All of the in situ measurements and the GSWP3 data are freely available either on the web or on request, but, previously, post-processing would have been required to homogenise the in situ datasets compiled by different teams or to downscale the reanalyses. This situation causes two major issues. Firstly, different modelling teams are likely to apply different post-processing methods, leading to numerous versions of the same dataset being used for scientific studies. Secondly, although time spent identifying and processing data has never been quantified in scientific literature, it is, to the best of our knowledge, a well-known but under-acknowledged time- consuming task for modellers.
The aim of this collaborative work is to provide easy-to-use, quality-controlled data in a format adopted by the climate modelling community to facilitate consistency, continuity, and reproducibility in snow research (Menard and Essery, 2019). As such, it complies with efforts in geosciences to foster best practices on data accessibility and documentation (Gil et al., 2016). The seven teams who collated the in situ datasets have provided updates since previous publications and details about instrumentation, gaps in the original data, and methods for gap filling. Such additions are first steps towards being able to quantify uncertainty in observed data, without which “meaningful evaluation of a model is impossible” (Clark et al., 2011). As the sites have already been described in previous publications (Table 1), Sect. 2 describes the in situ meteorological and evaluation data with the user in mind, highlighting differences and similarities between the sites but also areas where both instrumentation and modification of the data through modelling may increase uncertainty. Section 3 introduces the GSWP3 data and the site-specific downscaling methods. Finally, the Discussion highlights the importance of sharing data to identify errors and to improve practices in geosciences.
Table 1Data ownership and reference papers for the sites. Asterisks denote dedicated data description papers; the others are modelling papers in which a short description of a site is included.

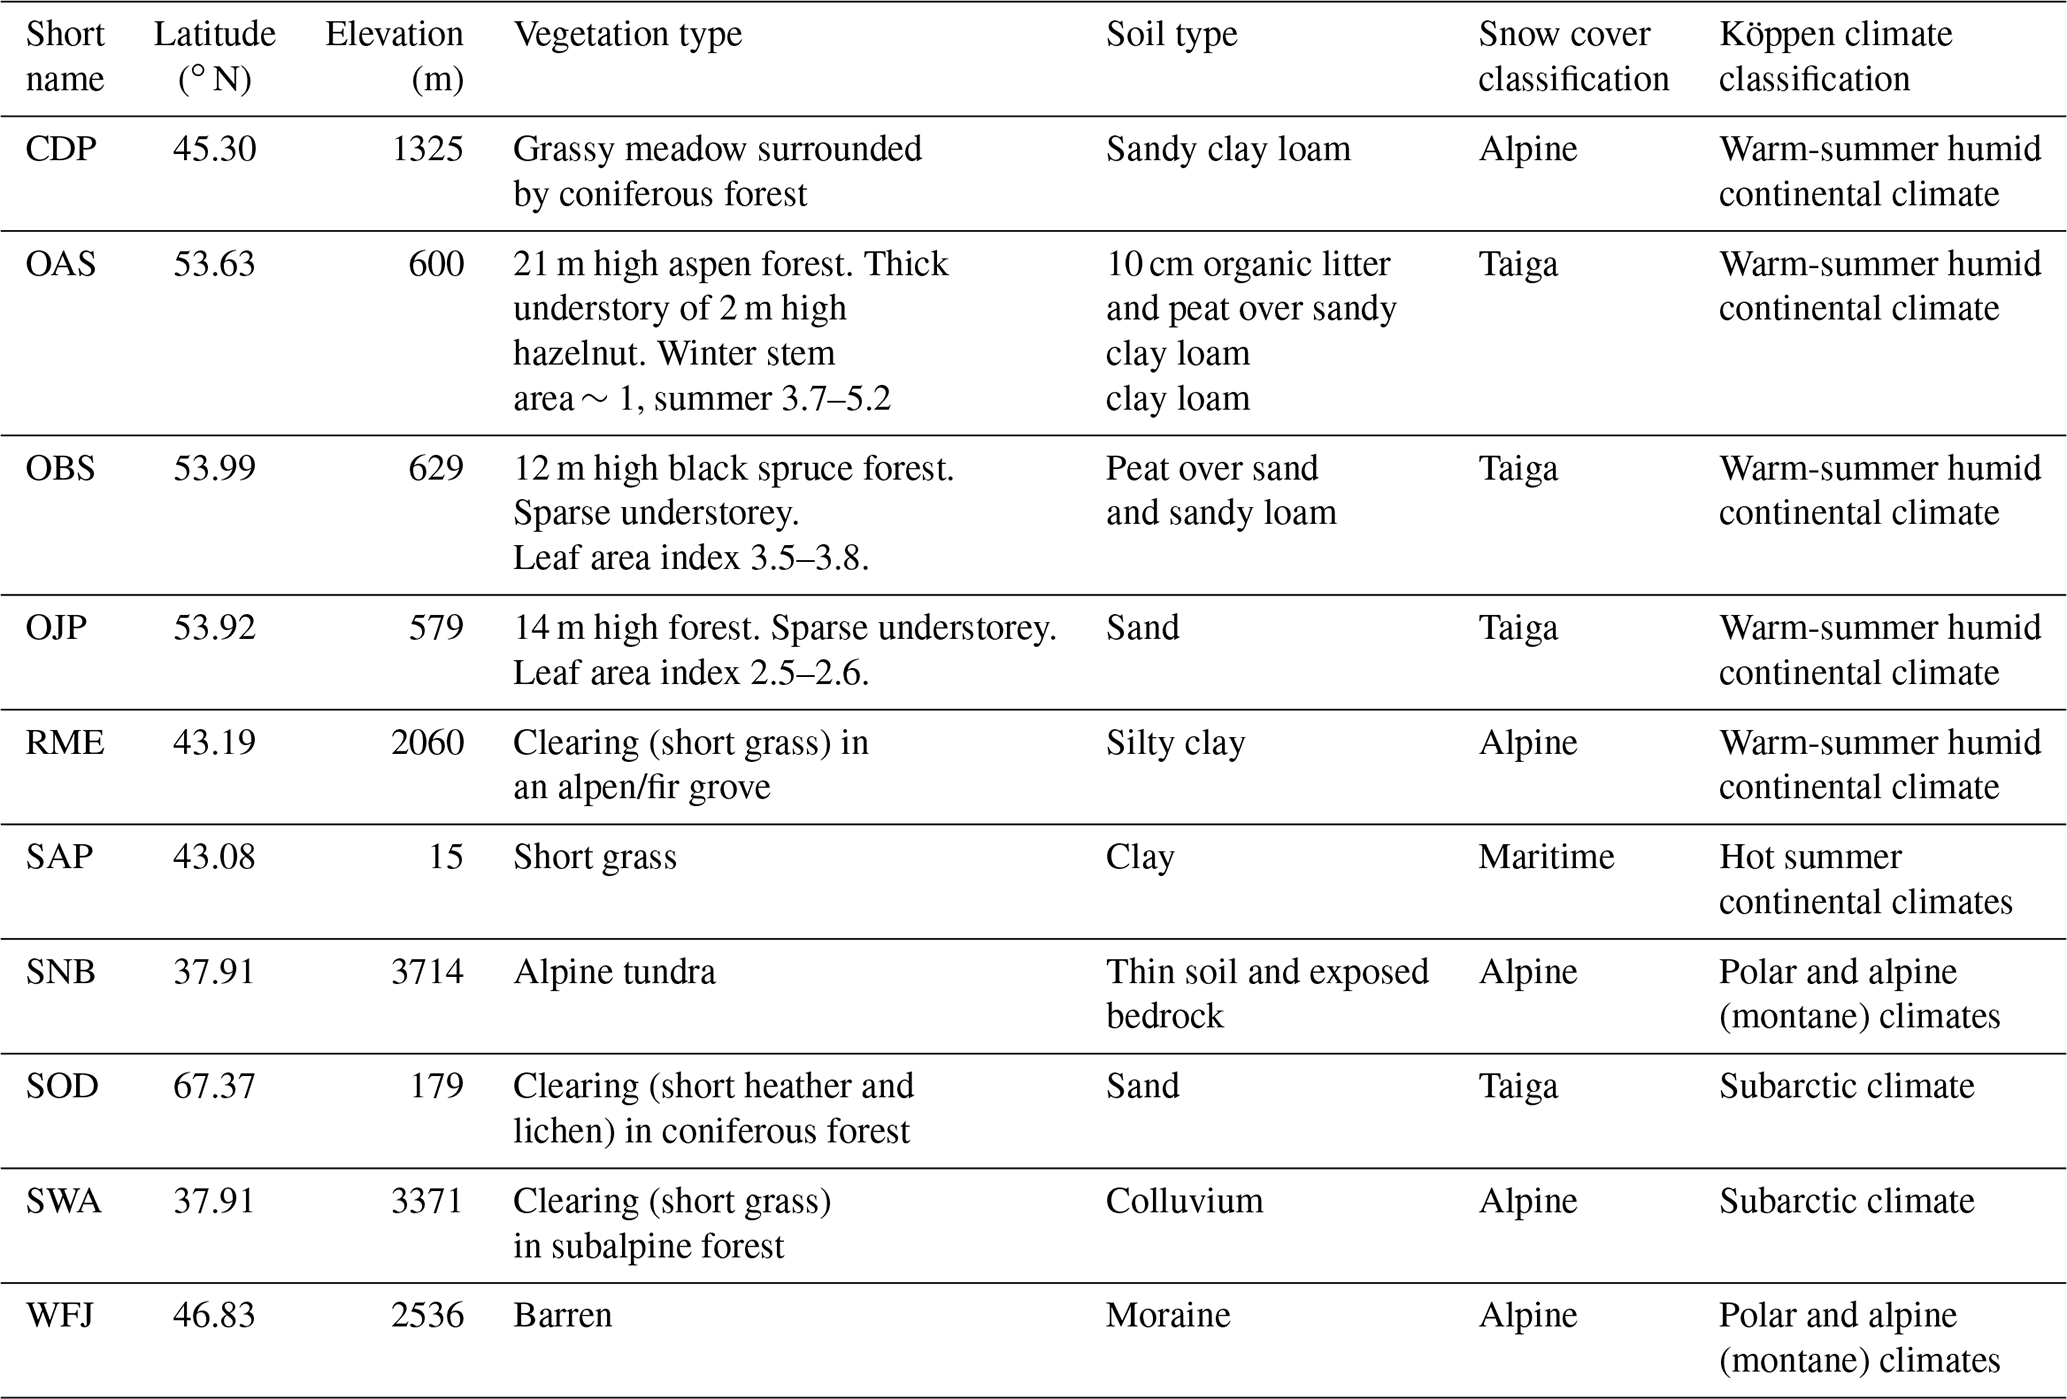
Broad geographic characteristics and the climate of each site, described by a snow cover classification and the Köppen climate classification from seasonal precipitation and air temperature, are shown in Table 2.
Both meteorological and evaluation data contain uncertainties and errors, partly due to instrument accuracy and calibration, gap filling of missing data, or subjective choices. Fully quantifying these uncertainties and errors is beyond the scope of this paper, but the information provided here, complemented by the Supplement which includes a list of instruments, details about missing data, and gap-filling methods, aims to highlight singular features as well as potential weaknesses in the data at each site.
2.1 Meteorological forcing data
All of the models participating in ESM-SnowMIP (Krinner et al., 2018) operate on energy balance principles, requiring incoming shortwave and longwave radiation fluxes, solid and liquid precipitation rates, air temperature, humidity, wind speed, and air pressure as forcing data.
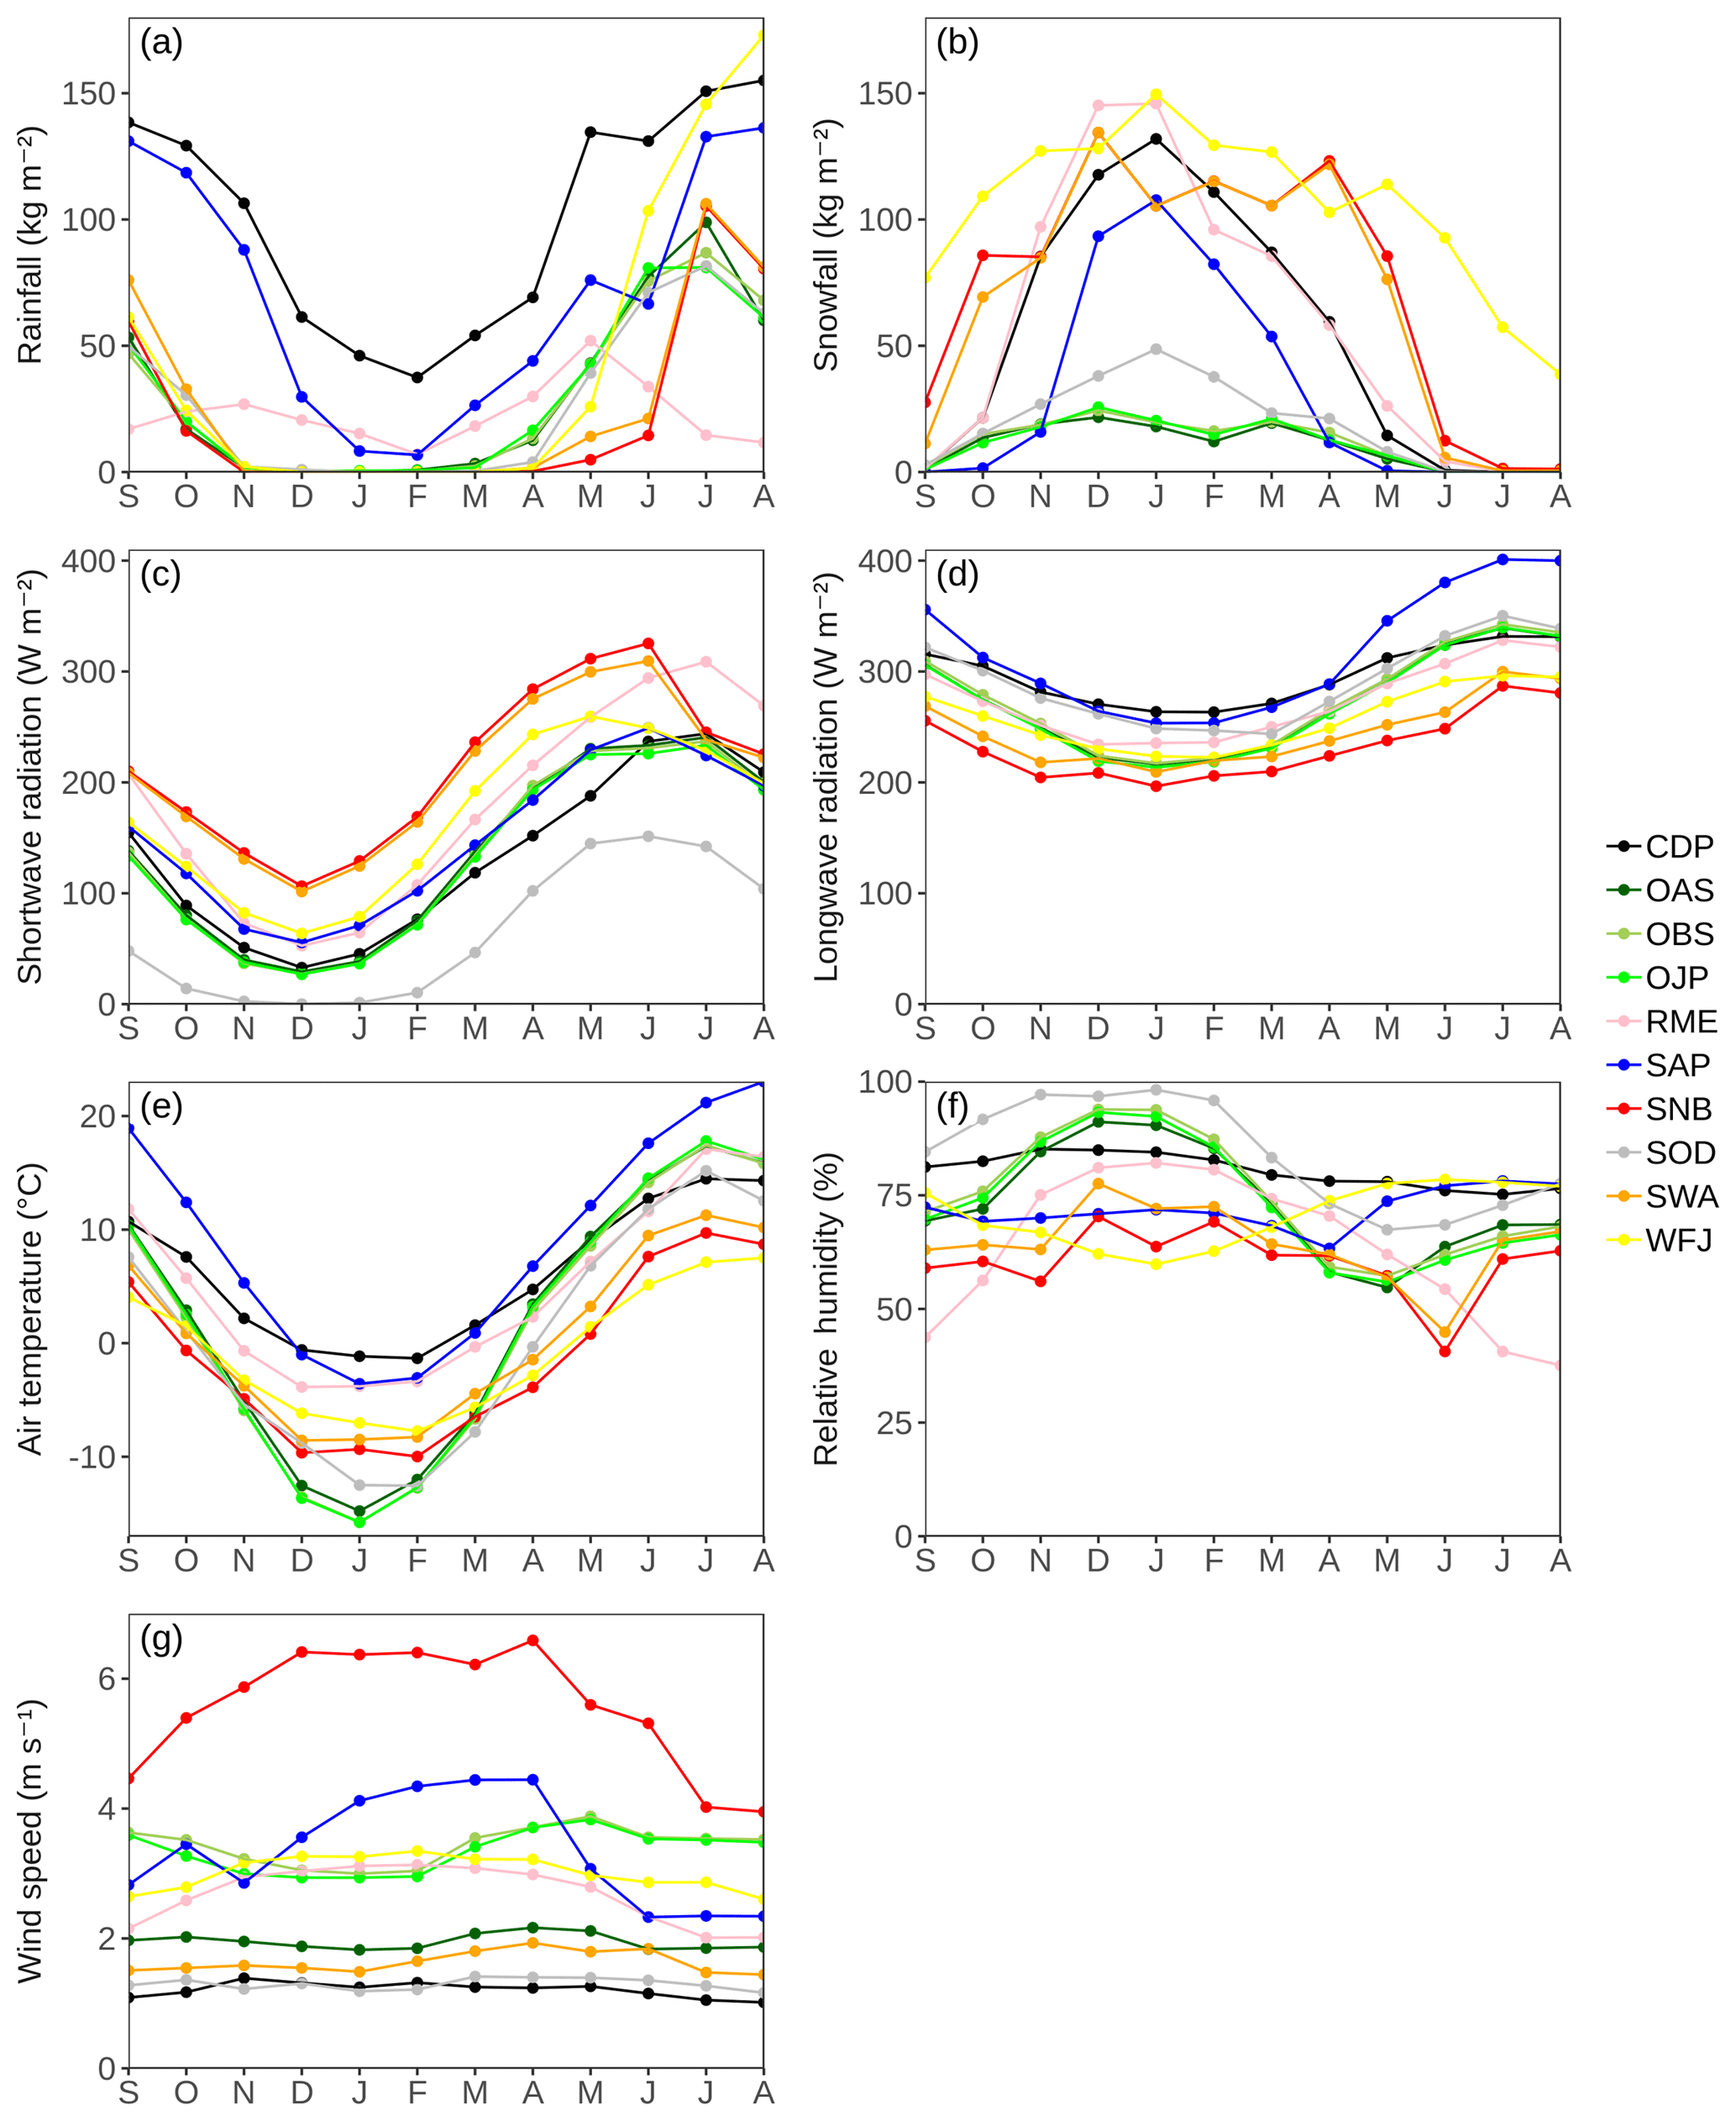
Figure 1Climatological monthly averaged meteorological forcing data. Wind speeds at all sites are normalised at 10 m height.
Figure 1 shows climatological monthly averages of all meteorological forcing variables except air pressure at all sites; note that “climatological” here refers to the time period for which variables are available at each site. Wind speeds provided in the datasets are measured at variable heights but are normalised for Fig. 1g to 10 m height assuming a logarithmic wind profile such that
where u is wind speed measured at height z1, d is a displacement height (2∕3 of vegetation height at BERMS and 0 at other sites), and z0 is a roughness length (1∕10 of vegetation height at BERMS and 0.1 m at the other sites).
2.1.1 Differences and similarities between sites
Of the 10 sites, 5 are mountainous (Col de Porte and Weissfluhjoch in the European Alps; Reynolds Mountain East, Senator Beck and Swamp Angel in the western USA), 3 are in the Canadian boreal forest (the Boreal Ecosystem Research and Monitoring Sites, BERMS, the acronym hereafter collectively describing the Old Aspen, Old Black Spruce and Old Jack Pine sites), 1 lies above the Arctic circle (Sodankylä) and 1 is urban (Sapporo). Most sites are in artificial forest gaps or in sheltered environments. All are situated in the Northern Hemisphere.
Sodankylä is the only site without incoming solar radiation in winter (14 d) and uninterrupted daylight in spring/summer (44 d). Air temperatures drop to −35 ∘C in most years at Sodankylä and BERMS; the lowest temperature recorded at any site was −41 ∘C at Old Black Spruce (Fig. 2). There is little in the forcing data to differentiate the three boreal sites other than wind speed, which is lower at the Old Aspen site than at the other two sites. Vegetation and soil characteristics are what distinguishes the boreal sites most (Table 2, Sect. 2.2).
All mountain sites are located within a narrow 10∘ latitude strip, but there is a difference of 2400 m between the lowest (CDP) and the highest (SNB) sites. Of the 10 sites, the mountain sites experience the most snowfall (WFJ, SNB, SWA, RME, and CDP in decreasing order), with Weissfluhjoch being the only site where snow falls year-round. On the other hand, Col de Porte and Reynolds Mountain East are the mountain sites with the warmest annual average temperature and can have rain in any month of the year. Sapporo has the highest annual mean (9.3 ∘C) and minimum (−15.8 ∘C) temperatures, although Col de Porte is generally warmer from December to February. Of the 10 sites, Senator Beck is the only one to have an annual mean temperature below freezing (−1 ∘C) (Fig. 2).
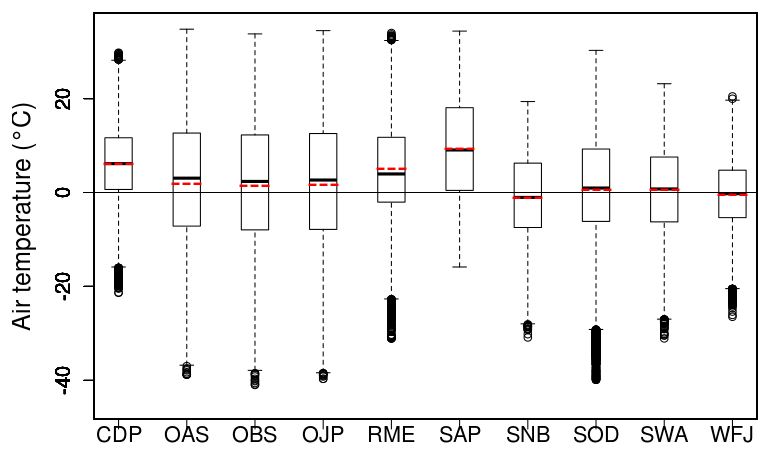
Figure 2Box plots of hourly air temperature including means (red dashed line) at all sites. Outliers beyond 1.5 times the interquartile range (25th to 75th percentiles) are marked with circles.
Col de Porte is situated in a dedicated experimental area (60 m ×50 m) in the south-east corner of a larger clearing (270 m× 360 m) within a spruce forest. As mentioned in Morin et al. (2012), all trees sheltering the north side of the experimental area were cut in summer 1999; mean wind speed at 10 m height was 1 m s−1 prior to the event but 1.26 m s−1 afterwards. Swamp Angel is also situated in a forest clearing, unlike the nearby exposed Senator Beck, where average wind speed in December and January is more than 4 times higher. Mann–Kendall (MK) tests show significant increasing trends in wind speed at these three sites. At Col de Porte, the trend starts in 1999 despite tree regrowth mentioned in Lejeune et al. (2019). MK shows a significant decreasing trend in wind speed at Reynolds Mountain East. It is unknown why such trends occur.
2.1.2 Site-specific measurement methods
The data presented here were prepared for a model intercomparison project but are expected to be used beyond this immediate purpose. As such, it is important that an understanding of possible errors, caveats, or singularities in data measurements used to force models are made clear to users, most of whom will not have visited any or all of the sites.
One such singularity concerns measurements of air temperature in Col de Porte, where the temperature sensor is generally moved weekly to keep it at a constant height above the snow. Temperature sensors are kept at fixed heights at the other sites, so it is recommended that measurement heights used in models be adjusted according to observed or simulated snow depths because this can have a significant impact on turbulent flux computations. Another issue with air temperature is that of instrument ventilation: depending on wind speed and solar radiation, unventilated instruments can overestimate air temperature by up to a daytime average of 2.5 ∘C (Georges and Kaser, 2002) or up to 10 ∘C for individual measurements (Huwald et al., 2009). Such errors are not corrected for in Reynolds Mountain East, the Senator Beck basin sites, or Sodankylä (temperature sensors at the other sites are artificially ventilated).
Humidity is measured using capacitive sensors at all of the sites except Weissfluhjoch. These sensors respond to changes in relative humidity (Anderson, 1995), but vapour fluxes in models are driven by specific humidity gradients. At temperatures below 0 ∘C, there are two possible definitions of relative humidity because of the different saturation vapour pressures over water and ice, but sensors calibrated following the World Meteorological Observation (WMO) convention of reporting relative humidity with respect to water at all temperatures are used at all of the sites except Weissfluhjoch. The consequences of this choice at three example sites (SAP, OJP, and SWA) are compared to measurements at Weissfluhjoch in Fig. 3. Although the consequences are not very significant at warmer sites such as Sapporo or Col de Porte (not shown), they are clear in data from colder sites such as Old Jack Pine and Swamp Angel, where relative humidity with respect to water is never observed much above the ice saturation point for a particular temperature. However, measurements from a chilled mirror dew point hygrometer at Weissfluhjoch show relative humidity with respect to ice can reach 100 %. In homogenising the datasets, relative humidity has been limited to a maximum of 100 % and converted to specific humidity using the site calibrations. To avoid the ambiguity in relative humidity, only specific humidity is provided in the datasets.

Figure 3Example scatter plots of relative humidity against temperature for four of the sites. The solid lines show ice saturation at temperatures below 0 ∘C and water saturation above. Lines of constant specific humidity near the upper end of the data.
Snowfall measurements are notoriously difficult; they are often underestimated and prone to large errors because much is lost to sublimation or displaced by wind. Such difficulties are acknowledged by the WMO which, rather than imposing a standardised method, advises that adjustment methods be chosen depending on environmental conditions and gauge types (Goodison et al., 1998; Nitu et al., 2018). Precipitation at all sites is measured either with tipping buckets or weighing gauges, and six different methods are applied by the seven collecting teams to correct for undercatch: yearly or constant scaling factors, model simulations, matching against snow water equivalent (SWE) or replicate gauges. As weighing gauges do not provide information on the type of precipitation, further choices have to be made about how to partition snowfall and rainfall. Figure 4 shows how the different methods used at each site affect the solid fraction of precipitation as a function of air temperature; total precipitation at Swamp Angel and Senator Beck is assumed to be same because of their proximity, so only the latter is shown. Partitioning methods include using dew point (RME, SAP, SWA, SNB) or air temperature (BERMS, SOD, WFJ) functions or thresholds and ancillary data such as snow depth and albedo measurements (CDP). More information about instrumentation, correction for undercatch, and partitioning is provided in the Supplement.
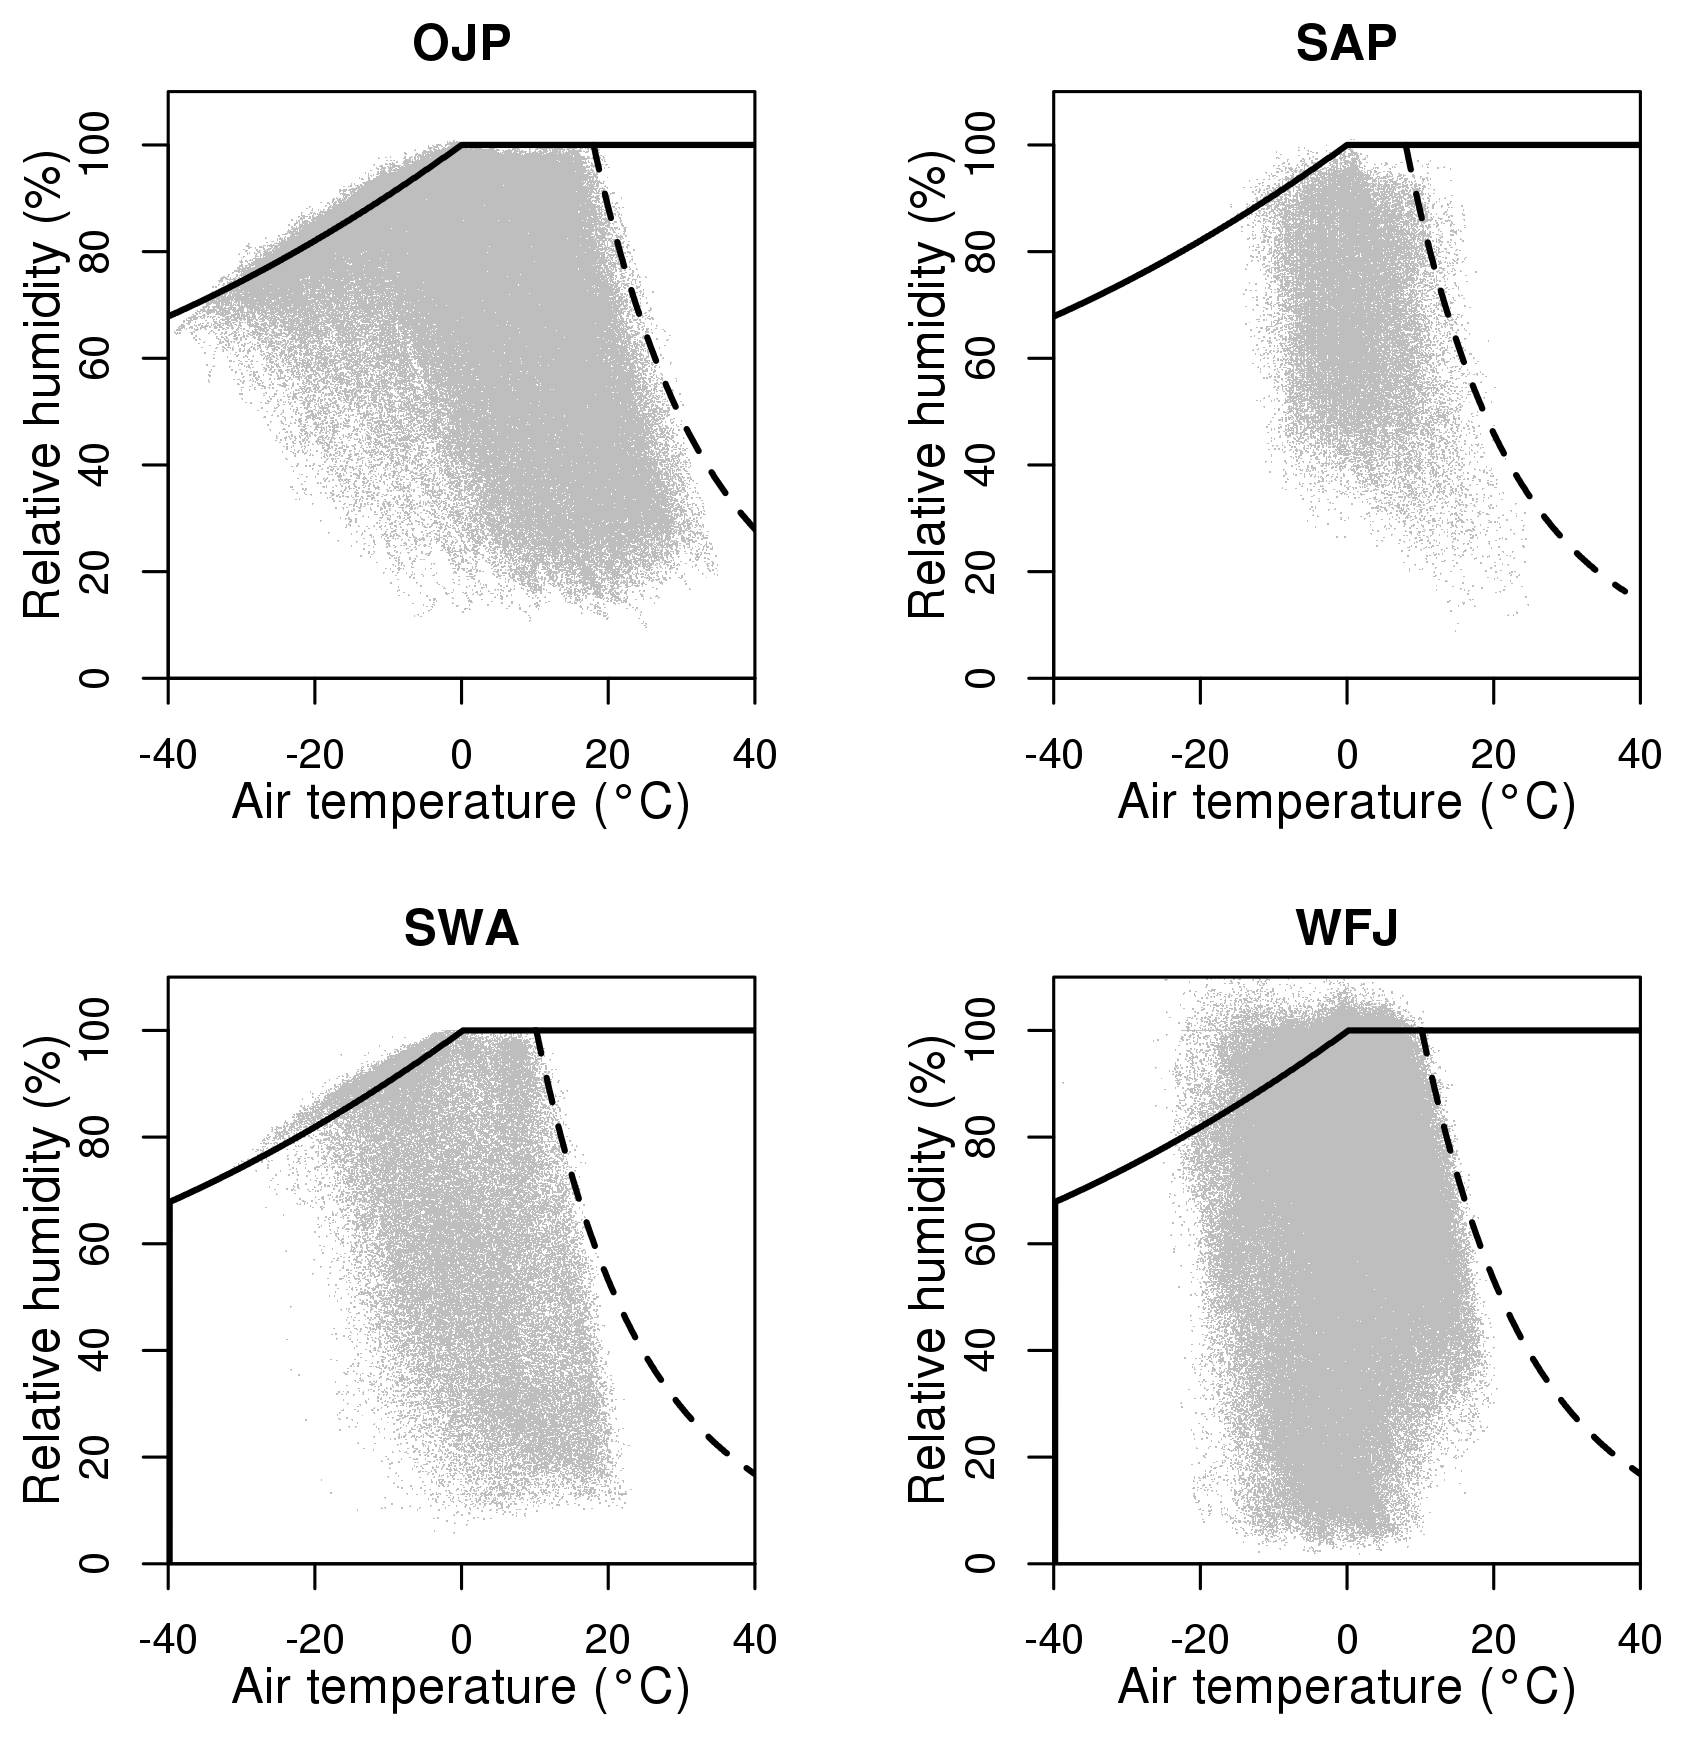
Figure 4Fraction of precipitation falling as snow at different temperatures, as imposed on the in situ data and fitted to the GSWP3 data.
Radiation measurements are also prone to errors and/or missing data because snow can settle on upward-looking sensors. In the absence of natural (wind) or forced ventilation and heating to prevent snow and frost accumulation, data are only reliable after the instruments have been wiped clean. Three of the sites (SAP, SOD, and WFJ) are located near staffed research stations, which allows frequent (daily to sub-weekly) and regular maintenance of all instruments (i.e. not restricted to radiometers). Col de Porte, Reynolds Mountain East, and the sites in the Senator Beck basin (SWA and SNB) are accessible from nearby research facilities, allowing regular (weekly to fortnightly) maintenance visits. Intensive monitoring associated with the BERMS project took place in the first years after the instruments were installed, but visits to the sites during winter have become sporadic. Methods for gap filling during snowfall events or while instruments are obstructed by snow vary; details for all sites are in the Supplement.
2.1.3 Modelling and modification to in situ data
Raw data are rarely used in snow modelling. At the very least, some time averaging of samples measured over very short intervals (seconds) is required. The longest time period used for averaging in the data occurs for air pressure for which the temporal coefficient of variation in pressure is always very small: a single value averaged for the site elevations is used when continuous measurements are not available (CDP, RME, SNB and SWA). For other variables, modelling fills, modifies, or provides consistency in a dataset.
At Col de Porte and Sapporo, where data outside of the snow season have not been published, all meteorological data are filled with downscaled (CDP) and bias-corrected (SAP) meteorological reanalysis data (publication of summer data for Col de Porte started in 2015; Lejeune et al., 2019).
Radiation and wind speed at Sodankylä are measured above the canopy, but evaluation data are measured in a nearby clearing. For consistency, the meteorological variables were modified by Essery et al. (2016) to emulate below-canopy measurements. Sky view fraction and transmissivity were calculated from hemispherical photographs to modify shortwave radiation such that the effects of shading were accounted for. Sky view fraction was also used to account for longwave emission from nearby trees in the modification of longwave radiation. Wind speed was scaled down to 2 m height using a ratio obtained from an anemometer installed for 1 week in the clearing.
Finally, at Reynolds Mountain East, where the data starts in 1988, longwave radiation measurements started in 2002. For consistency, all longwave radiation is modelled, but measured data are used to provide information on seasonal and diurnal variations (e.g. cloud cover, turbidity, canopy and terrain exposure conditions). Details of the methods used to model longwave radiation are in Reba et al. (2011).
2.2 Evaluation data
The largest uncertainties associated with snow in climate change predictions relate to its albedo and to its insulative properties. Successive IPCC reports have noted that Earth system models (ESMs) often underestimate soil temperatures at high latitudes (Randall et al., 2007; Flato et al., 2013; Koven et al., 2013), thus having implications on assessing the permafrost carbon feedback, i.e. the amplification of surface warming from carbon emissions released by thawing permafrost. Equally, model spread over snow–albedo feedback remains a major source of uncertainty in quantifying the contribution of decreasing snow cover to climate warming. Long-term datasets as presented here are therefore essential to evaluate model performance and to improve model representations of snow–soil–atmosphere interactions.
2.2.1 Snow depth and water equivalent
Although automatic sensors are increasingly being used to measure SWE, the most reliable methods to obtain snow mass are still manual (Pirazzini et al., 2018). They work by weighing snow mass in samplers of known volume or area, such as small cutters in snow pits or tubes to extract vertical snow cores. Nevertheless, such measurements are prone to errors: wet snow can stick to instruments, manual measurements can never be replicated in the same place because they are destructive, and subjectivity and skill do play a part; consistency can be hard to achieve if multiple people collect the data.
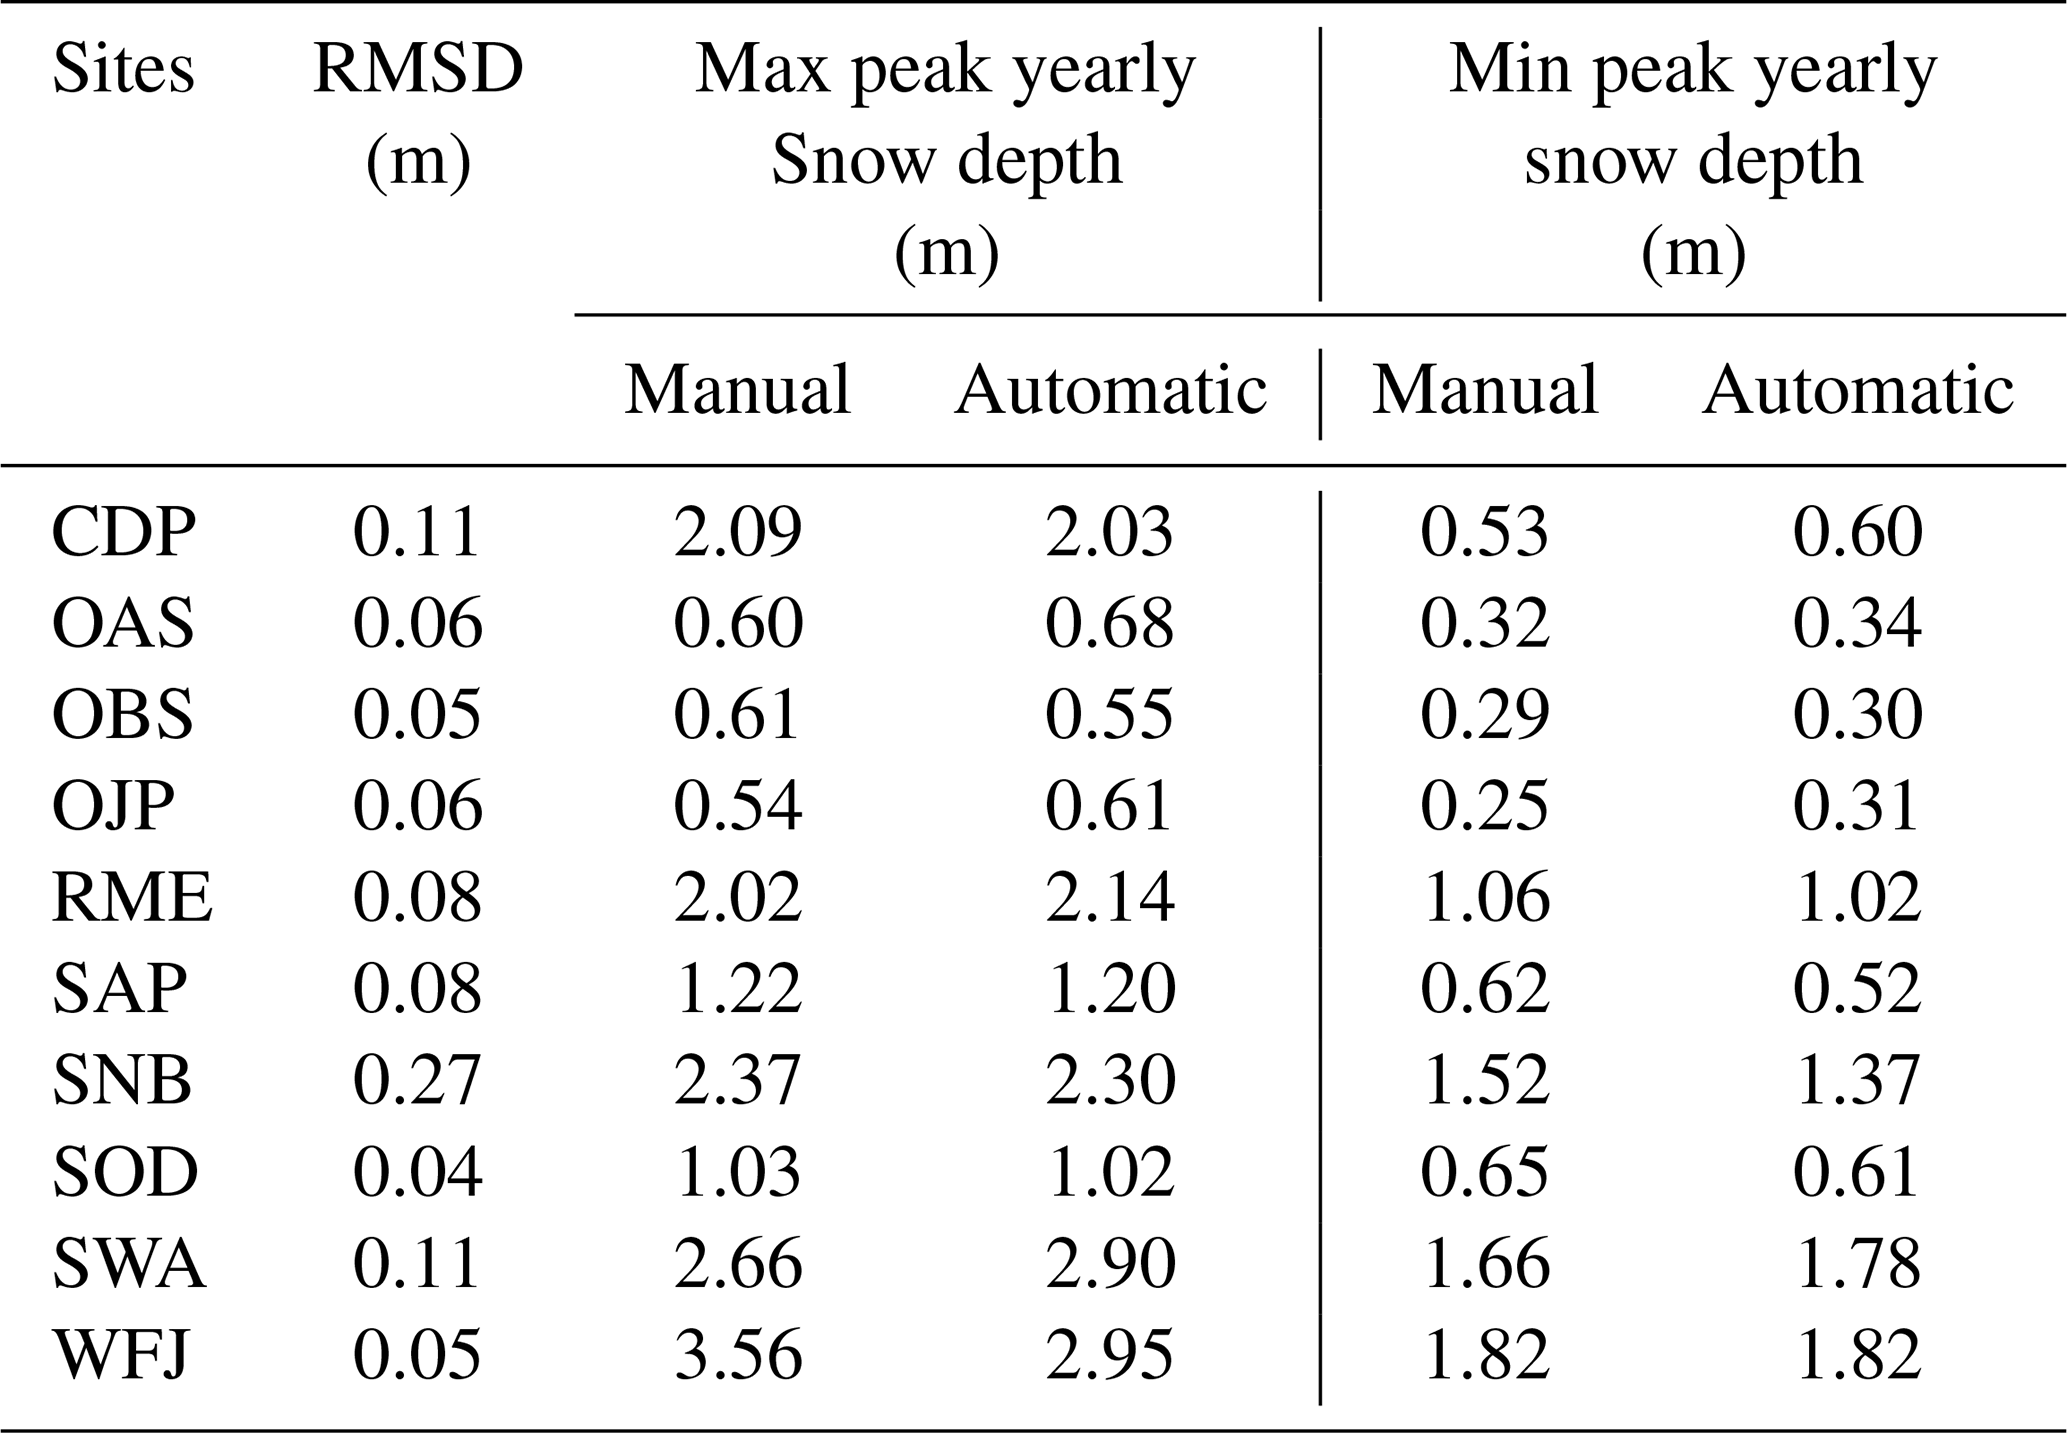
One way to quantify uncertainty caused by measurement errors, spatial variability, or a combination of both is to use replicate measurements of SWE and snow depth. Root-mean-square difference (RMSD) in snow depth can be calculated at all sites as all have both automatic and manual measurements. RMSD is shown in Table 3, along with maximum and minimum peak snow depth to normalise the difference. At Senator Beck, the snow pits cannot be collocated with the automated snow depth, so the spatial variability of snow is intrinsic to any comparisons between the manual and automated measurements. RMSD in SWE could only be calculated at two sites. At Col de Porte, three replicate weekly snow pits are available, two of which are used to calibrate automatic SWE measurements. Mean standard deviation is 17 kg m−2, and, although it increases with increasing snow amount, it is generally less than 10 % of mean SWE. At Reynolds Mountain East, a snow pillow next to a snow course is visited approximately 10 to 15 times during the snow season. RMSD between the two methods is 40 kg m−2, for annual maximum SWE ranging from 186 kg m−2 (1992) to 838 kg m−2 (1989).
Table 3Root-mean-square difference between manual and automatic snow depth measurements, maximum yearly snow depth, and minimum yearly snow depth for all sites.
Climatological averages of measured SWE and snow depth are shown in Figs. 5 and 6 respectively. Although all sites are situated in the Northern Hemisphere, and only one is above the Arctic Circle, the snow season characteristics provide a diverse range of scenarios for the evaluation and development of snow models, e.g. cold sites (e.g. SNB, SWA, SOD) with a well-defined snow season (snowpack building in autumn and winter, melting in spring/summer), warmer sites with occasional early- to mid-season snowmelt (CDP and SAP), forest sites with interception of snowfall by the canopy (BERMS), and sites with frequent summer (WFJ) and early autumn snowfall (CDP, WFJ) that can form snow cover that melts before the winter snowpack accumulates.


2.2.2 Albedo
Reflected shortwave radiation is measured at all sites except Sodankylä and Reynolds Mountain East, thus allowing calculations of albedo (Fig. 7). Daily effective albedos have been calculated at all sites with reflected shortwave radiation measurements using the method described in Morin et al. (2012). Hourly data are rejected during snowfall if incoming shortwave radiation is less than 20 W m−2 or if reflected shortwave radiation is less than 2 W m−2. For days with more than 5 h of data remaining after rejection, an albedo is calculated by dividing the sum of reflected shortwave radiation measurements by the sum of incoming shortwave radiation measurements. Information about errors and uncertainties in albedo due to incoming radiation measurements is in Sect. 2.1.2.
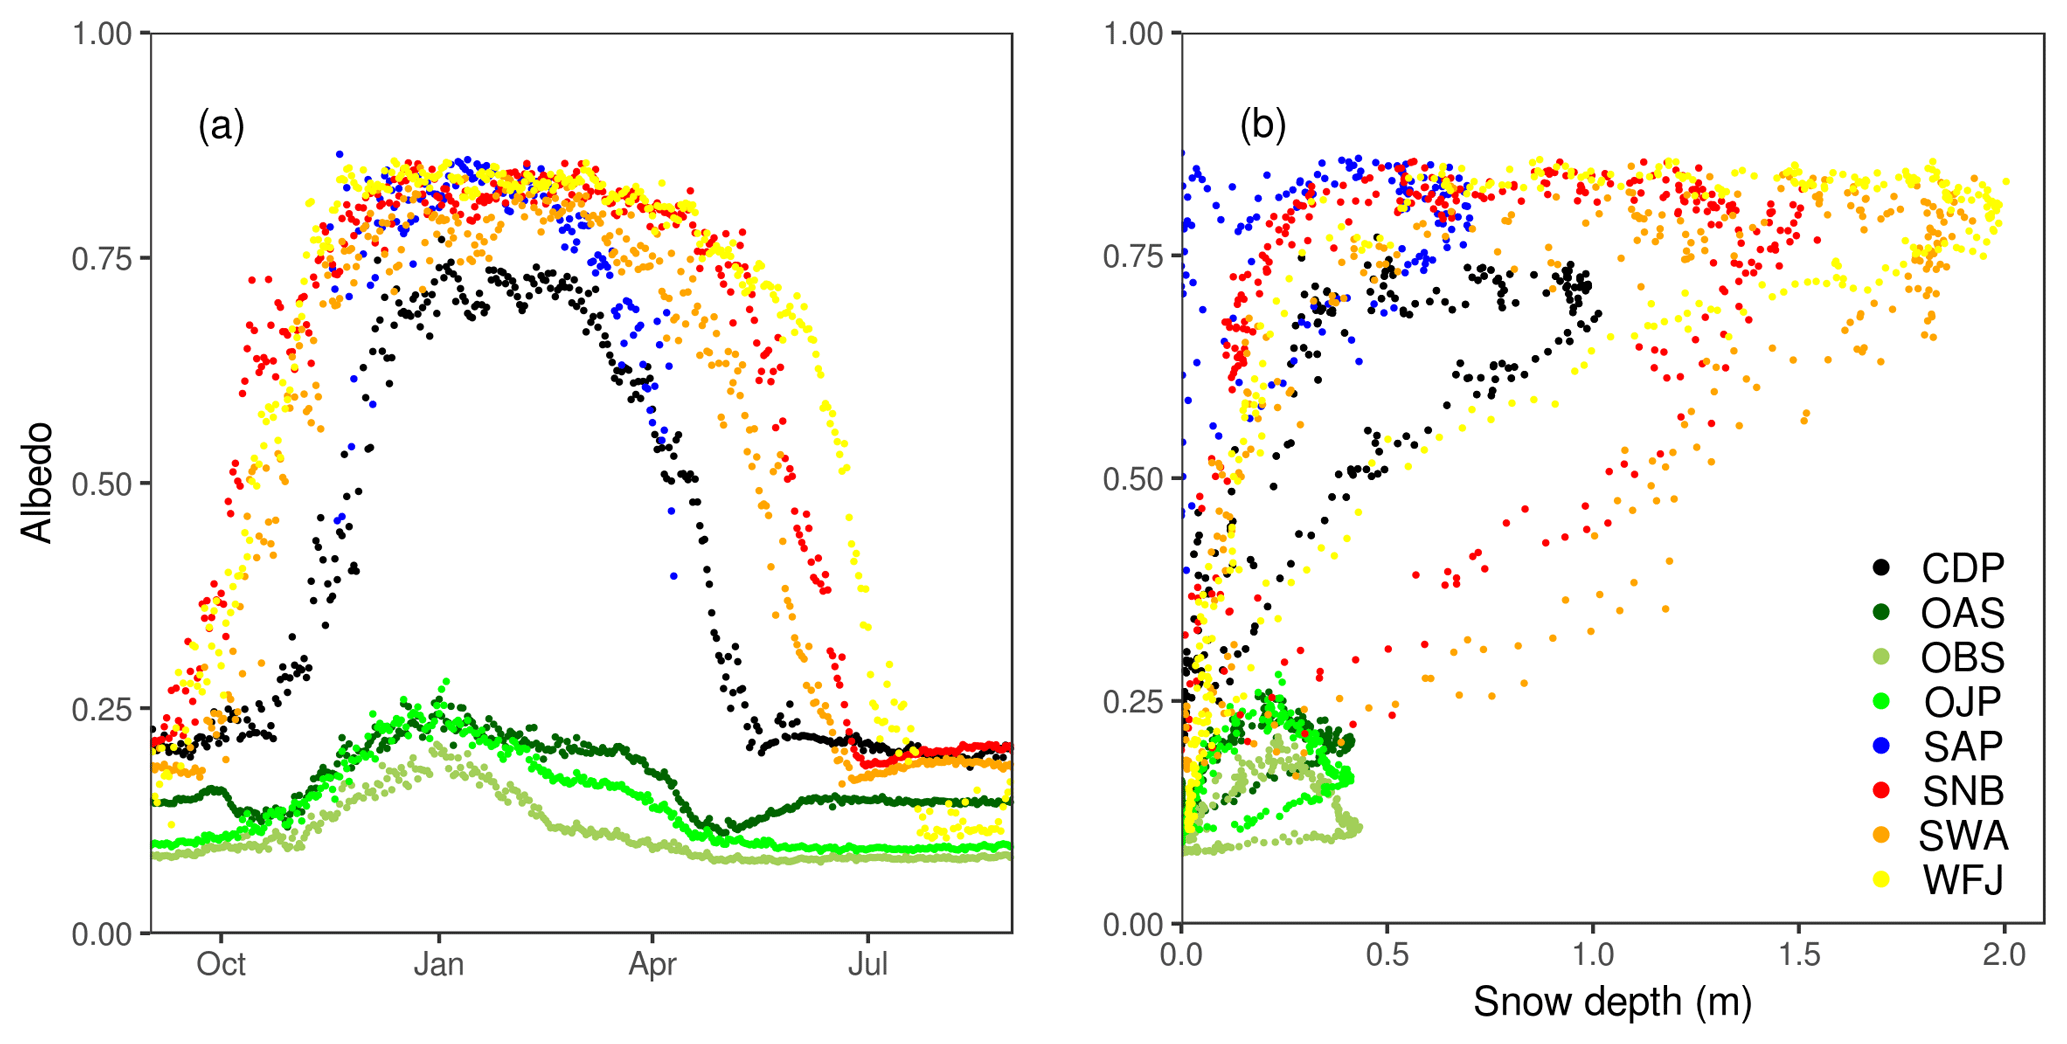
Figure 7Daily climatological averages of albedo over time (a) and as a function of snow depth (b) at all sites except RME and SOD.
Three of the sites have lower than expected albedo because of impurities in the snowpack. Frequent dust storms dirty the snow surface at Senator Beck and Swamp Angel (Painter et al., 2012); this is more noticeable during melt when other non-forested sites with comparable snow depths show higher albedo (Fig. 7b). Although not obvious from Fig. 7, model simulations suggest that the high concentrations of black carbon found in the Sapporo snowpack reduce albedo by 0.05 in winter and by 0.18 during melt (Aoki et al., 2011; Niwano et al., 2012). Figure 7b shows hysteresis at all of the sites, with snow cover of the same depth having lower albedo when melting than when accumulating.
2.2.3 Surface and soil temperature
Surface temperature (Fig. 8a) and soil temperatures (Fig. 8b) are available at eight of the sites. Surface temperature was calculated from measured outgoing longwave radiation assuming black body radiation except at the Senator Beck basin sites, where infrared temperature sensors are used. The pyranometers measuring outgoing longwave radiation are above the snow cover at Col de Porte, Sapporo, and Weissfluhjoch and above the canopy at BERMS.
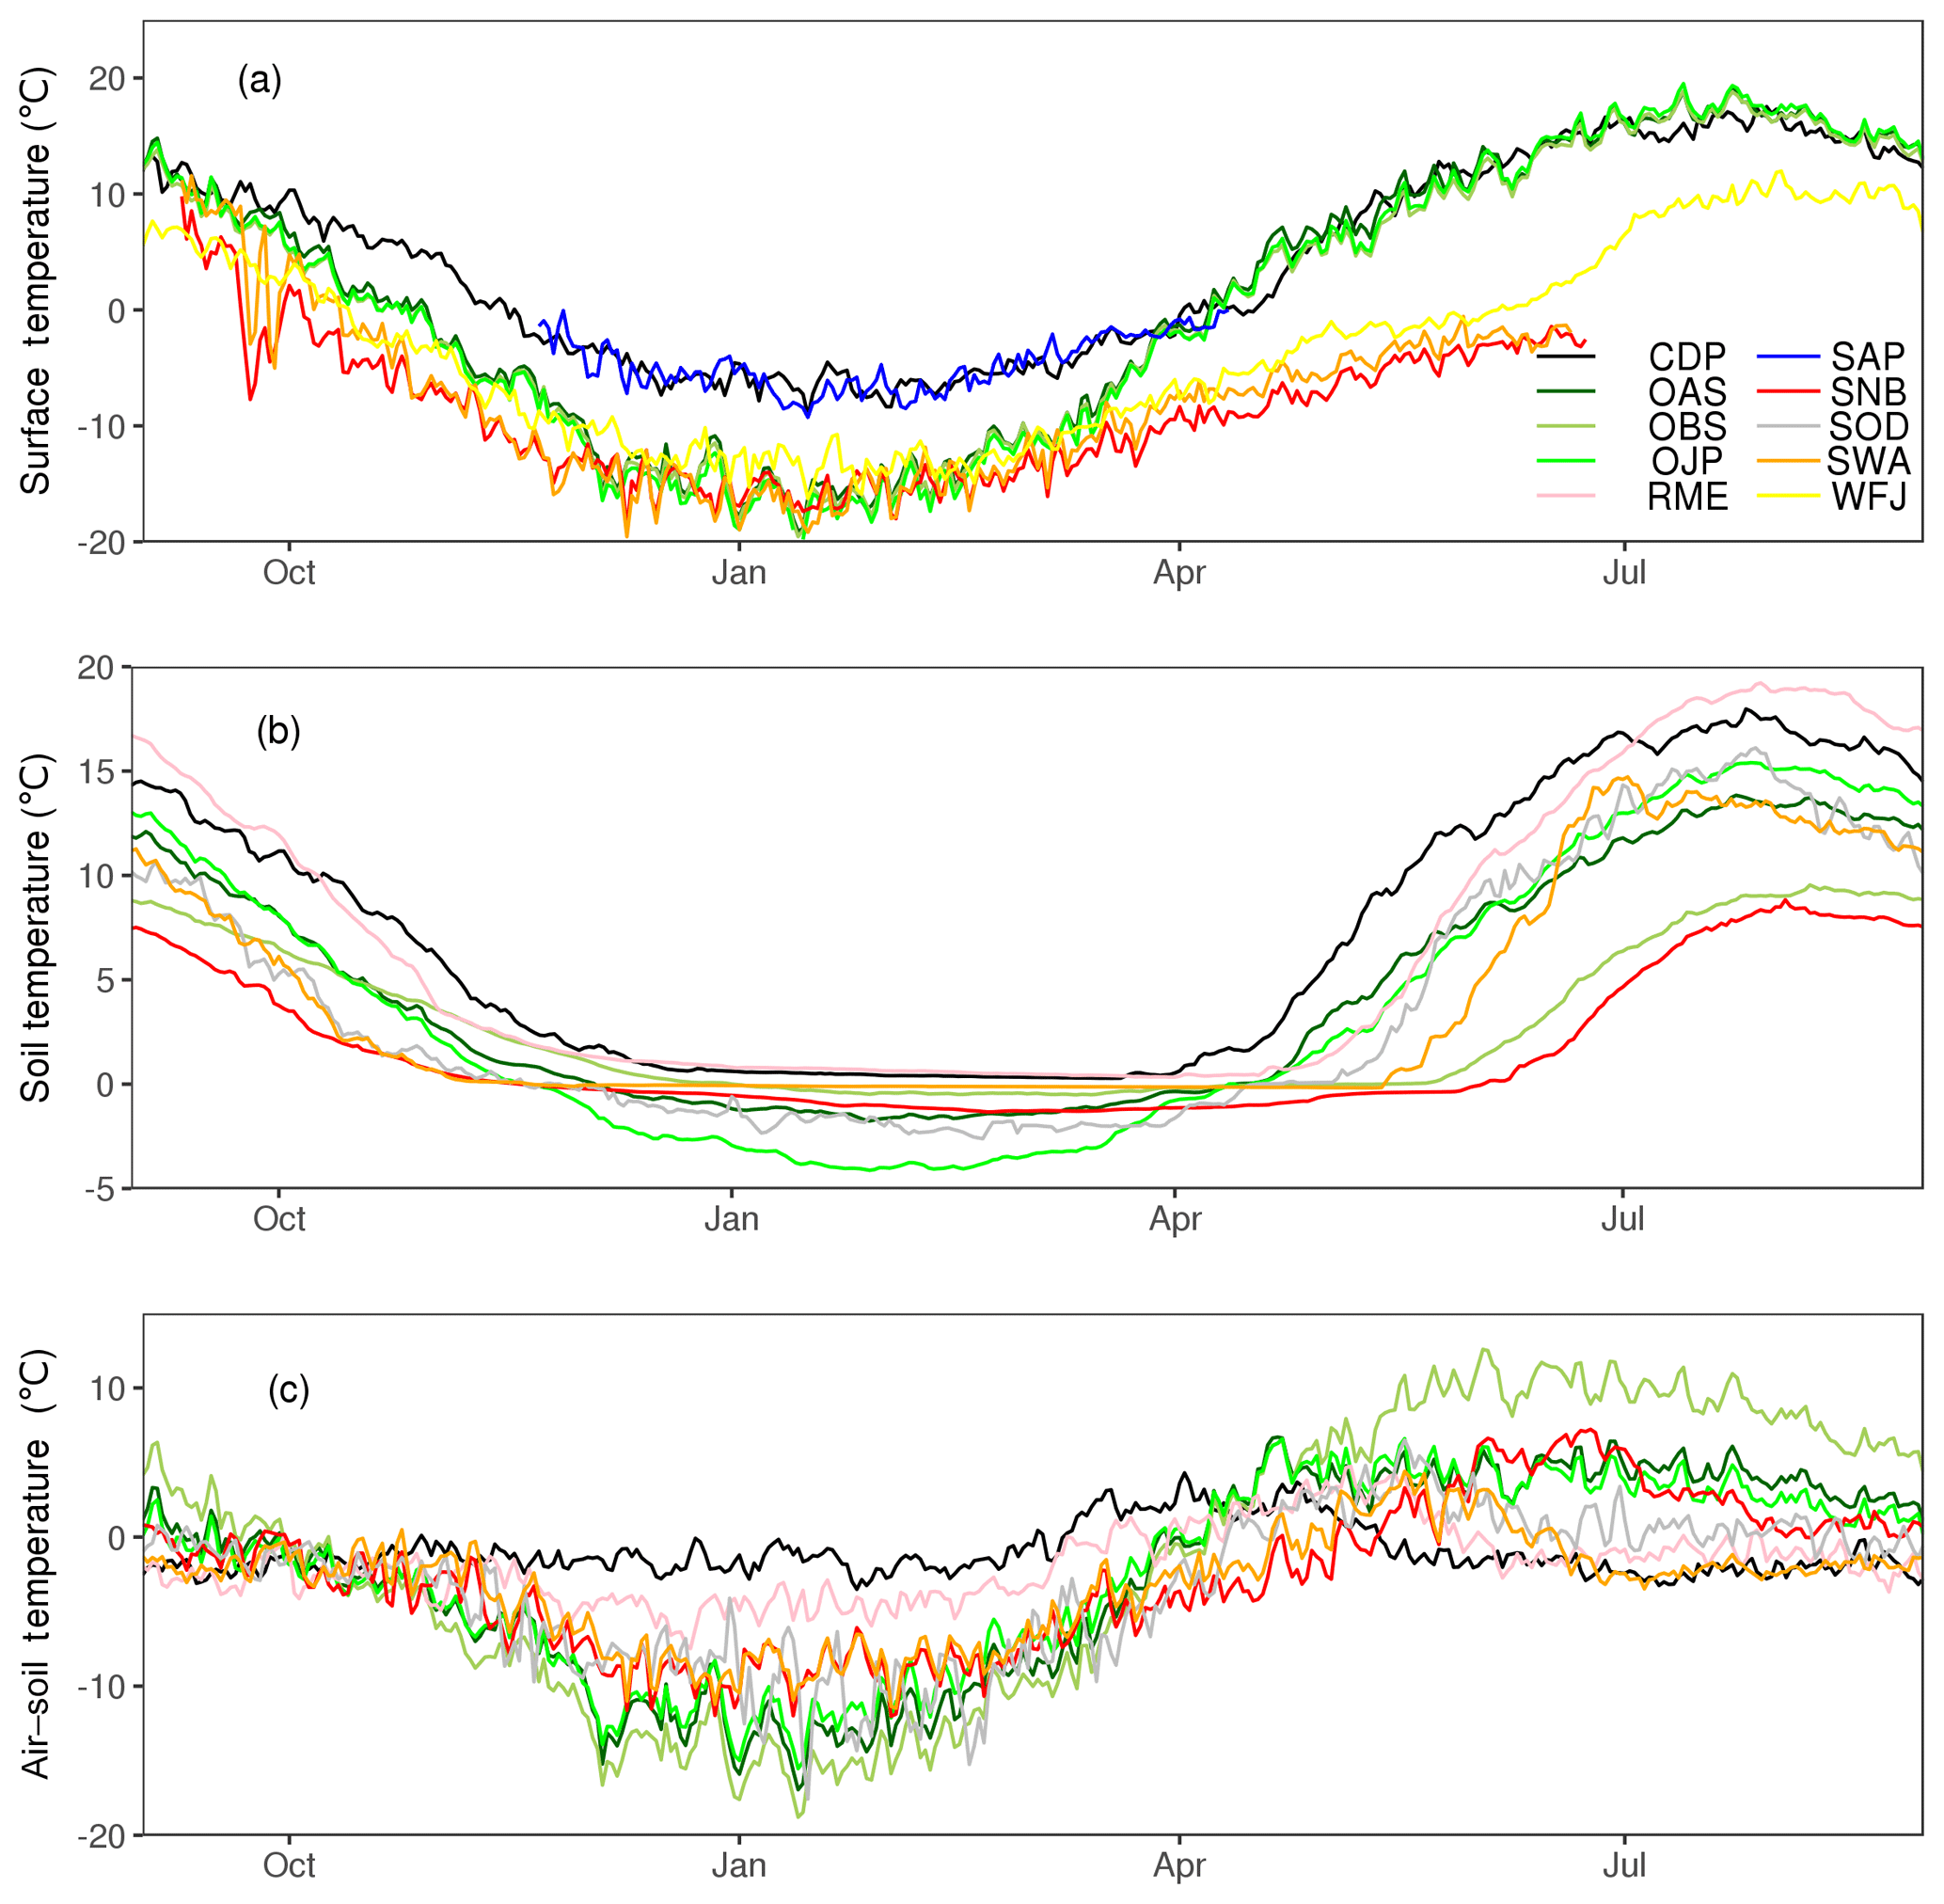
Figure 8Daily climatological averages of surface temperature (a), soil temperature (b), and differences between air and soil temperatures (c). Soil temperatures are shown at 30 cm depth at RME and at 10 cm depth at all other sites.
The strong insulating effect of snow is apparent in Fig. 8b–c for all sites with average winter air temperatures below 0 ∘C. Although freezing occurs in some individual years, daily climatological averages of winter soil temperatures, even at a shallow depth (10 cm), remain above freezing at six sites. The two exceptions are Old Jack Pine and Sodankylä, which show the highest annual ranges of temperatures, with climatologically averaged winter temperatures down to −5 ∘C and summer temperatures above 12 ∘C, and are the only two sites where soil temperatures do not plateau during the snow season.
The Land Surface, Snow and Soil Moisture Model Intercomparison Project (LS3MIP; van den Hurk et al., 2016) contribution to CMIP6 includes global offline land model experiments with meteorological forcing data provided by the Global Soil Wetness Project Phase 3 (GSWP3; Kim, 2017). GSWP3 forcing data were generated by a run of the Global Spectral Model at T248 (approximately 50 km) resolution nudged at each pressure level with meridional- and zonal-wind and air temperature from the 20th Century Reanalysis (Compo et al., 2011), followed by bias corrections described in Weedon et al. (2011) using observations of precipitation, air temperature, and surface radiation. All of the variables required for forcing land surface models are provided on a 0.5∘ global grid and 3 h time steps.
For ESM-SnowMIP, 1980–2010 forcing data have been extracted for GSWP3 grid cells containing reference sites and interpolated to 1 h time steps. The longer time period provides more variability for investigating the sensitivity of models to trends in forcing data. These data would also allow rerunning LS3MIP experiments at reference sites with models that do not have capabilities for global runs, but a complication is immediately apparent from the comparisons of site and grid data in Fig. 9. The maritime, boreal, and Arctic sites (SAP, OAS, OBS, OJP, SOD) are in areas with low relief and lie close to the mean elevations of their GSWP3 grid cells, but snow study sites in mid-latitude mountains (CDP, RME, SNB, SWA, WFJ) are typically established at higher elevations with longer snow seasons; most of the ESM-SnowMIP mountain sites are hundreds of metres higher than grid elevations (Fig. 9a). Consequently, GSWP3 temperatures at the mountain sites are too high (Fig. 9b), total precipitation is too low (Fig. 9c), and snowfall is much too low (Fig. 9d).

Figure 9Comparisons between elevations (a), temperatures (b), total precipitation (c), and snowfall (d) at ESM-SnowMIP reference sites and corresponding GSWP3 grid cells. Triangles identify mountain sites.
Site-specific bias corrections were therefore required and have been applied to all GSWP3 meteorological variables at all sites for model forcing. Quantile mapping was used to correct relative humidity within the 0 % to 100 % range, but only mean biases for overlapping data periods were removed from the other variables to retain the interannual and shorter variability in the large-scale forcing; the aim is to stay as close as possible to the global GSWP3 simulations without introducing gross elevation-dependent errors in site simulations. Offsets were applied to air temperature, pressure, and longwave radiation data, and multipliers were applied to precipitation, wind speed, and shortwave radiation data to avoid negative or spurious non-zero values. Site wind speeds were first normalised to the GSWP3 10 m reference height using a logarithmic profile and an assumed 0.1 cm roughness length.
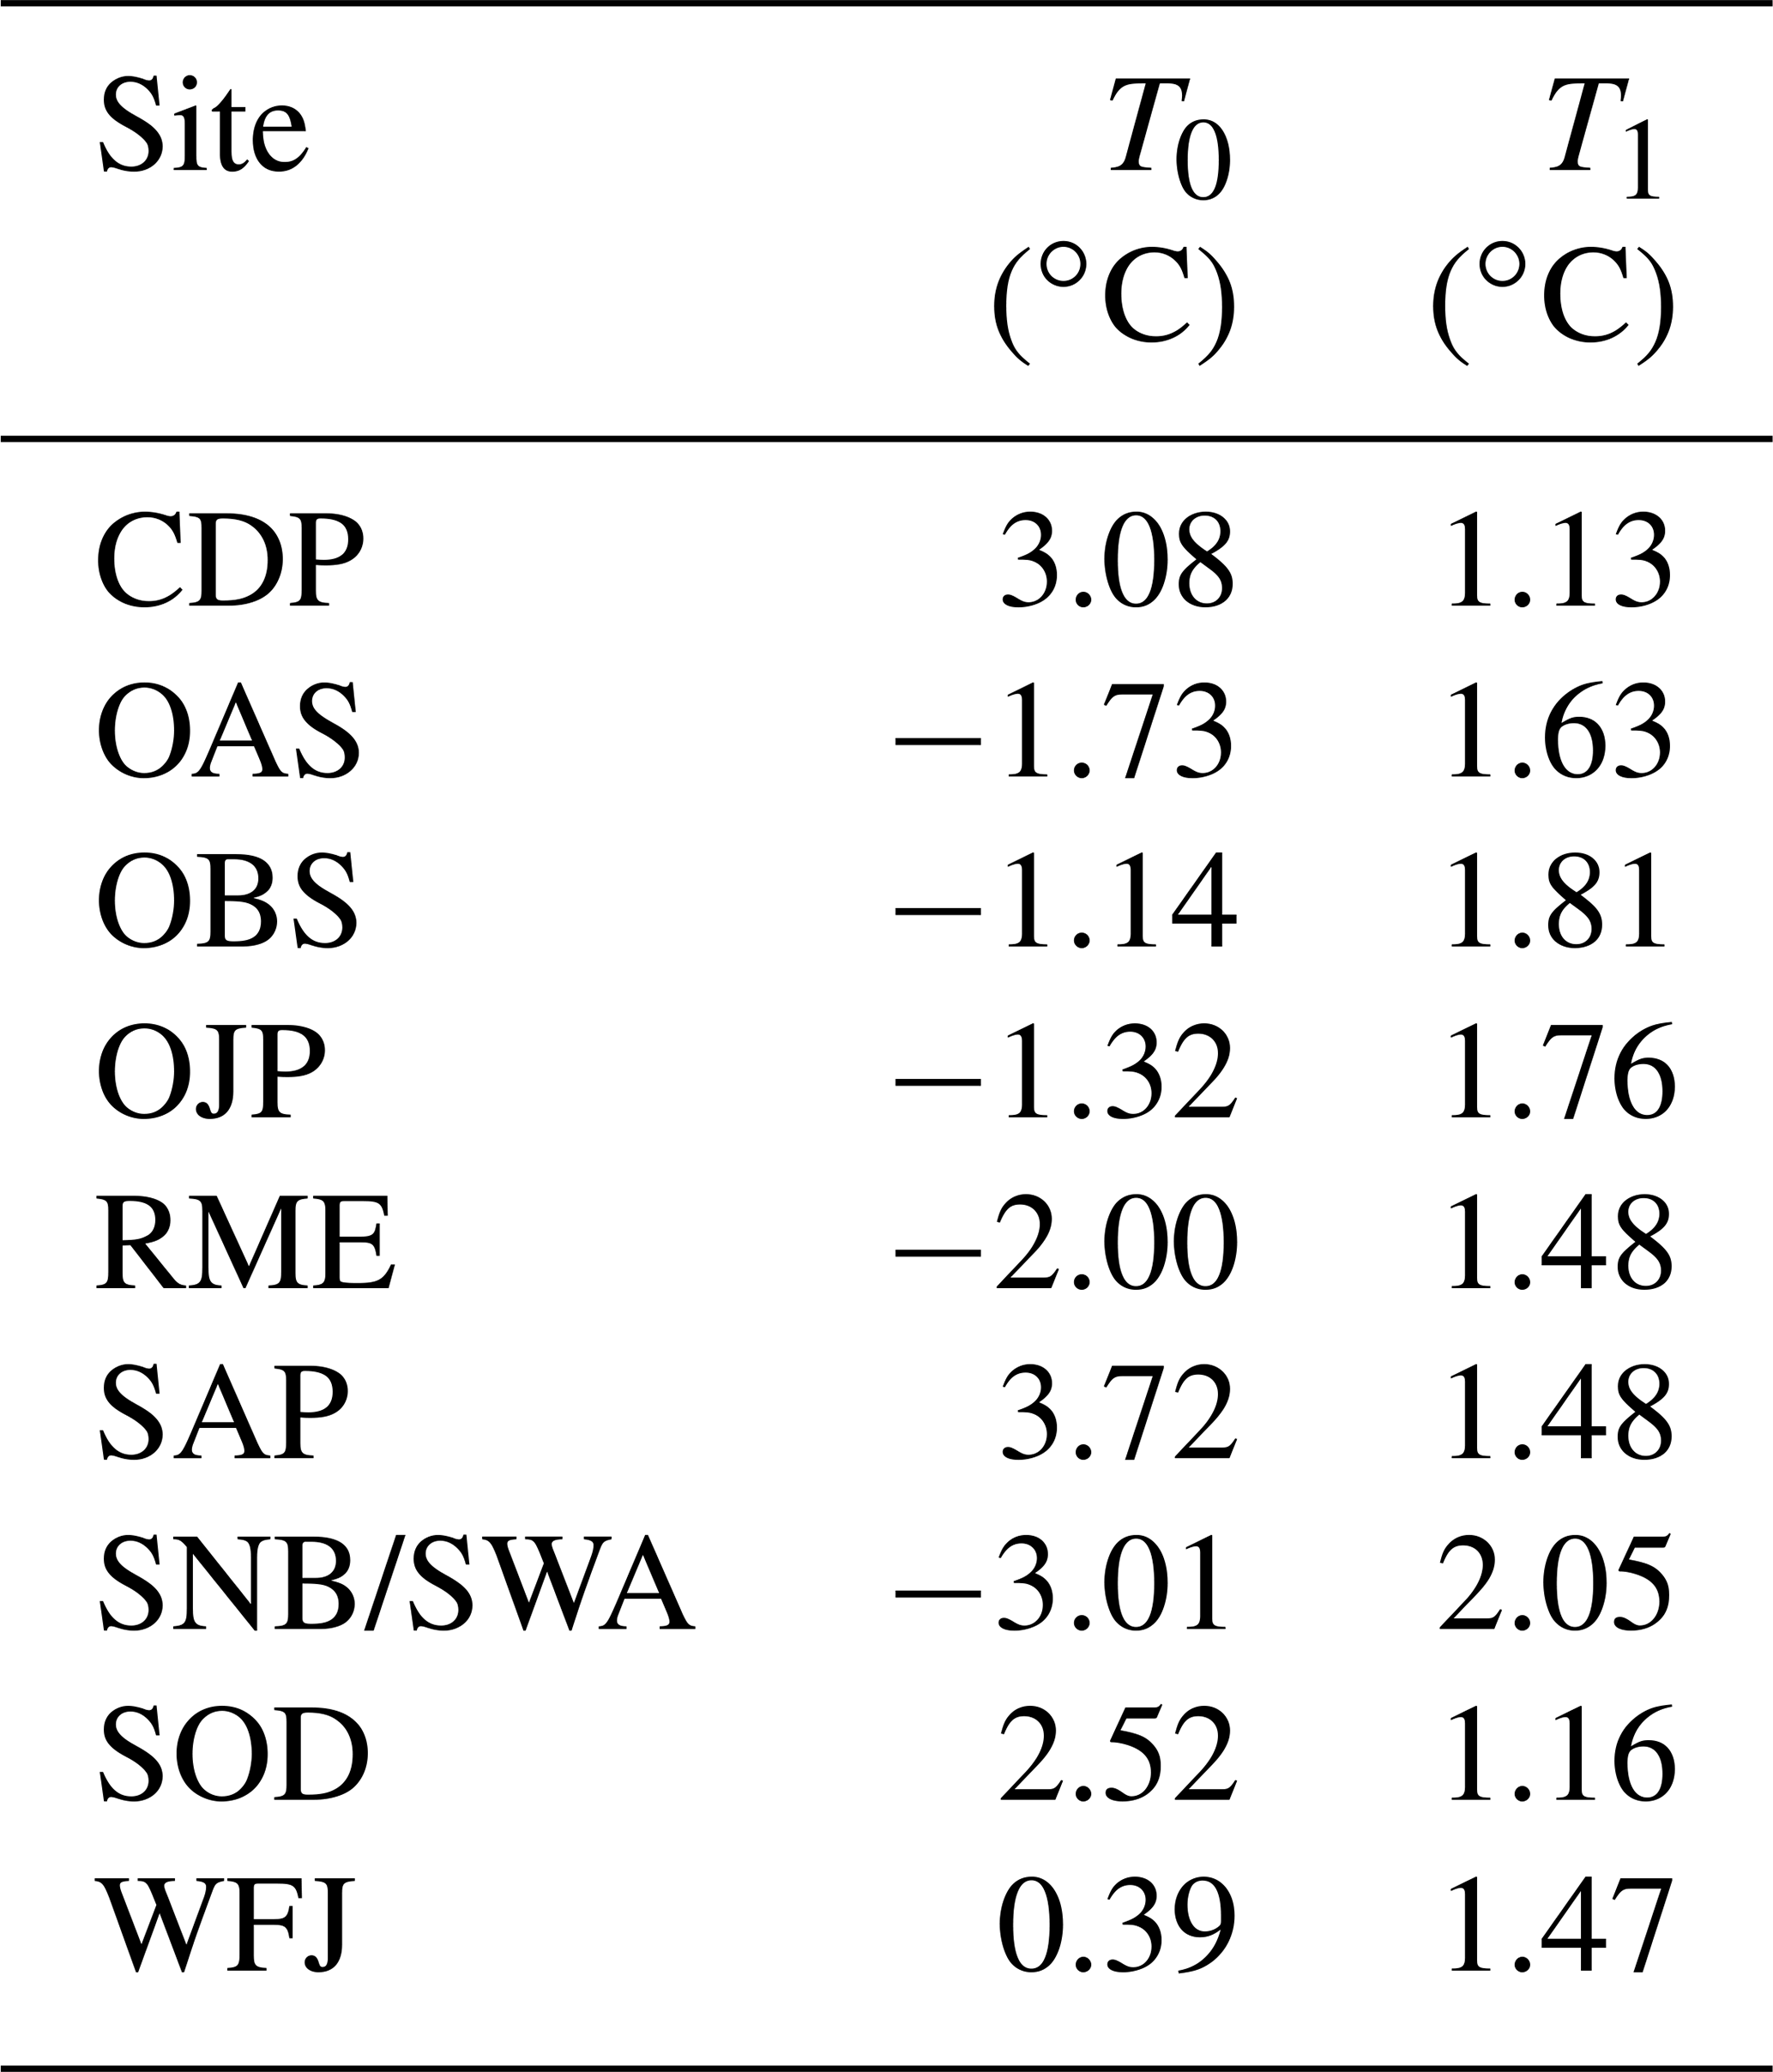
Total precipitation rate Pr in each time step was repartitioned into snowfall rate Sf=fsPr and rainfall rate depending on corrected air temperature T using a logistic curve:
with site-dependent parameters T0 and T1 fitted to unadjusted GSWP3 data (Table 4). Figure 4 shows that the logistic curve fits the GSWP3 data well at all sites with the exception of Sapporo, which has the unusual feature of some precipitation at low temperatures falling as rain and a significant fraction of snowfall at temperatures above 5 ∘C. Anomalous features in precipitation phase partitioning based on surface observations have been attributed to the mechanisms of snow formation as cold continental air masses flow over the Sea of Japan (Jennings et al., 2018).
Table 4Precipitation phase factors fitted to GSWP3 data at site locations (Senator Beck and Swamp Angel are located within the same 0.5∘ grid cell).
Annual mean temperature and snowfall variations are shown in Figs. 10 and 11 for the in situ and bias-corrected GSWP3 data at all sites. Although only mean errors for the periods of overlap have been removed, there is generally good correlation between annual means of GSWP3 data and site observations for overlapping years. Table 5 gives linear trends fitted to the in situ and bias-corrected GSWP3 annual mean temperatures and snowfall. 1998–2009 observations at BERMS show decreasing temperatures and increasing snowfall after the Saskatchewan drought of the early 2000s, but there are negligible trends in the longer GSWP3 series. Sapporo also has increasing snowfall in recent years but little trend in GSWP3. Some sites show stronger warming trends in the GSWP3 data, which will be useful for investigating modelled snow responses to warming.
Table 5Trends in annual mean temperatures and snowfall from in situ and GSWP3 data. Bold trends are statistically significant (Mann–Kendall p<0.05).
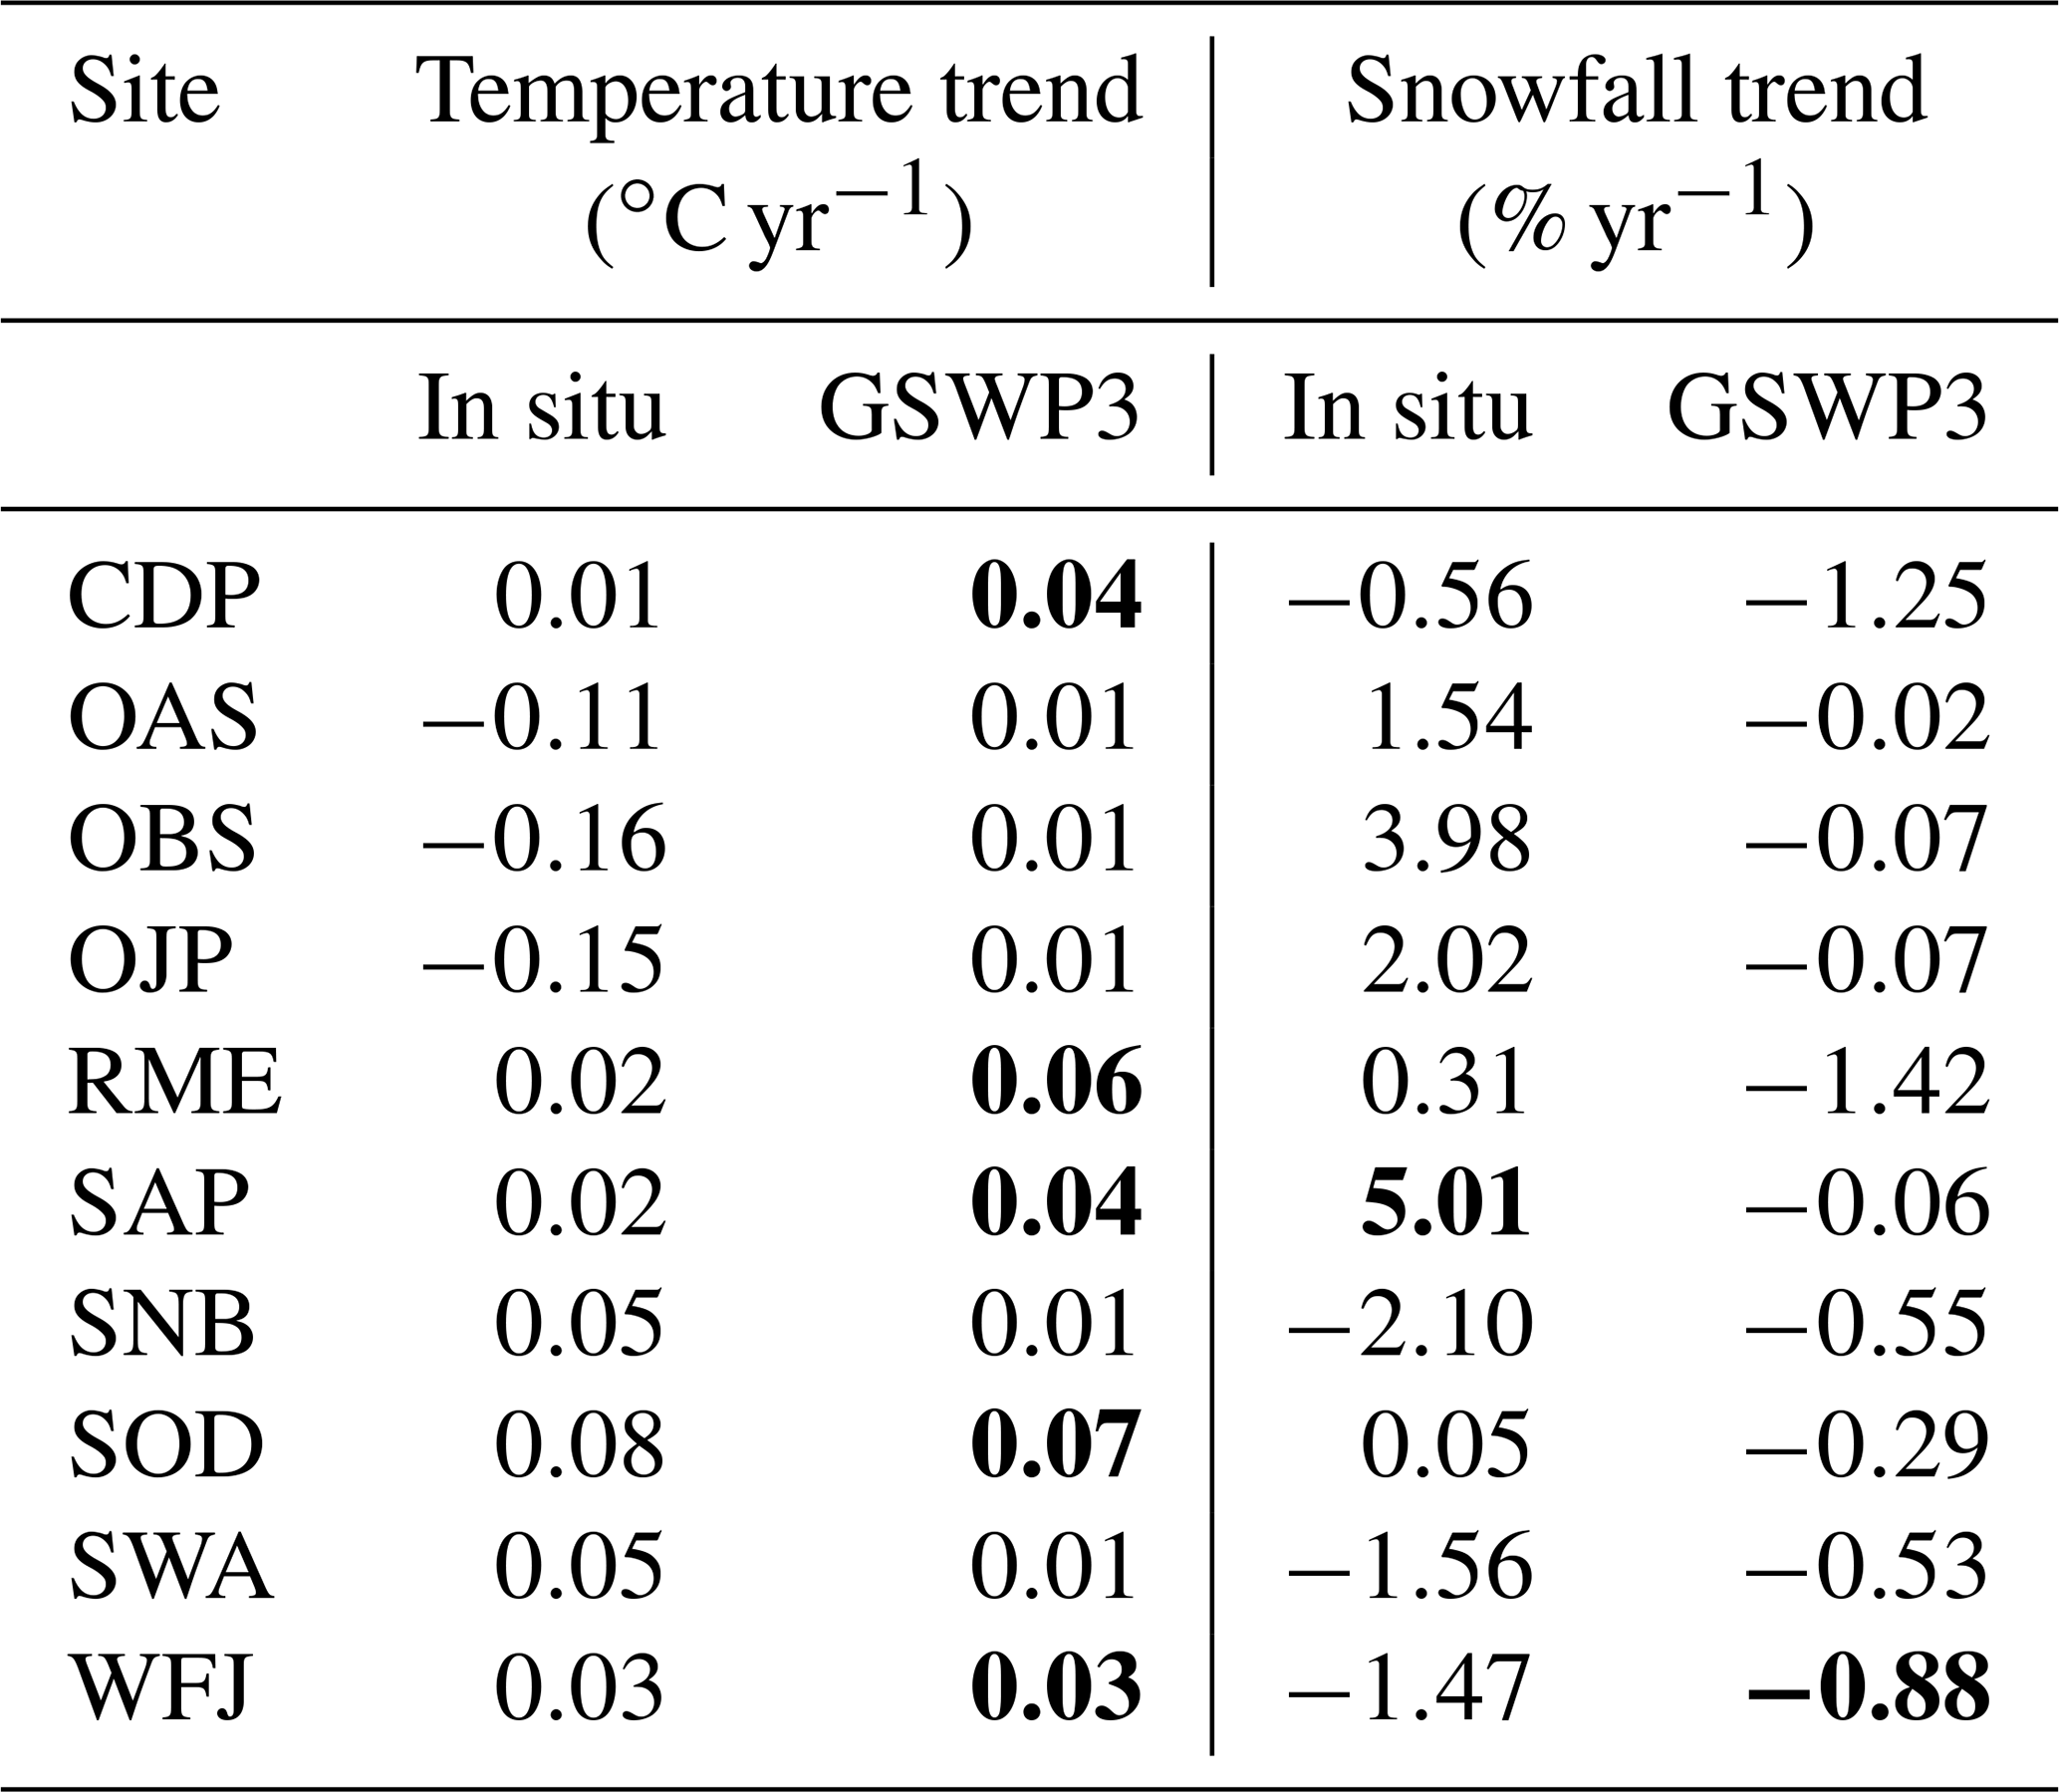
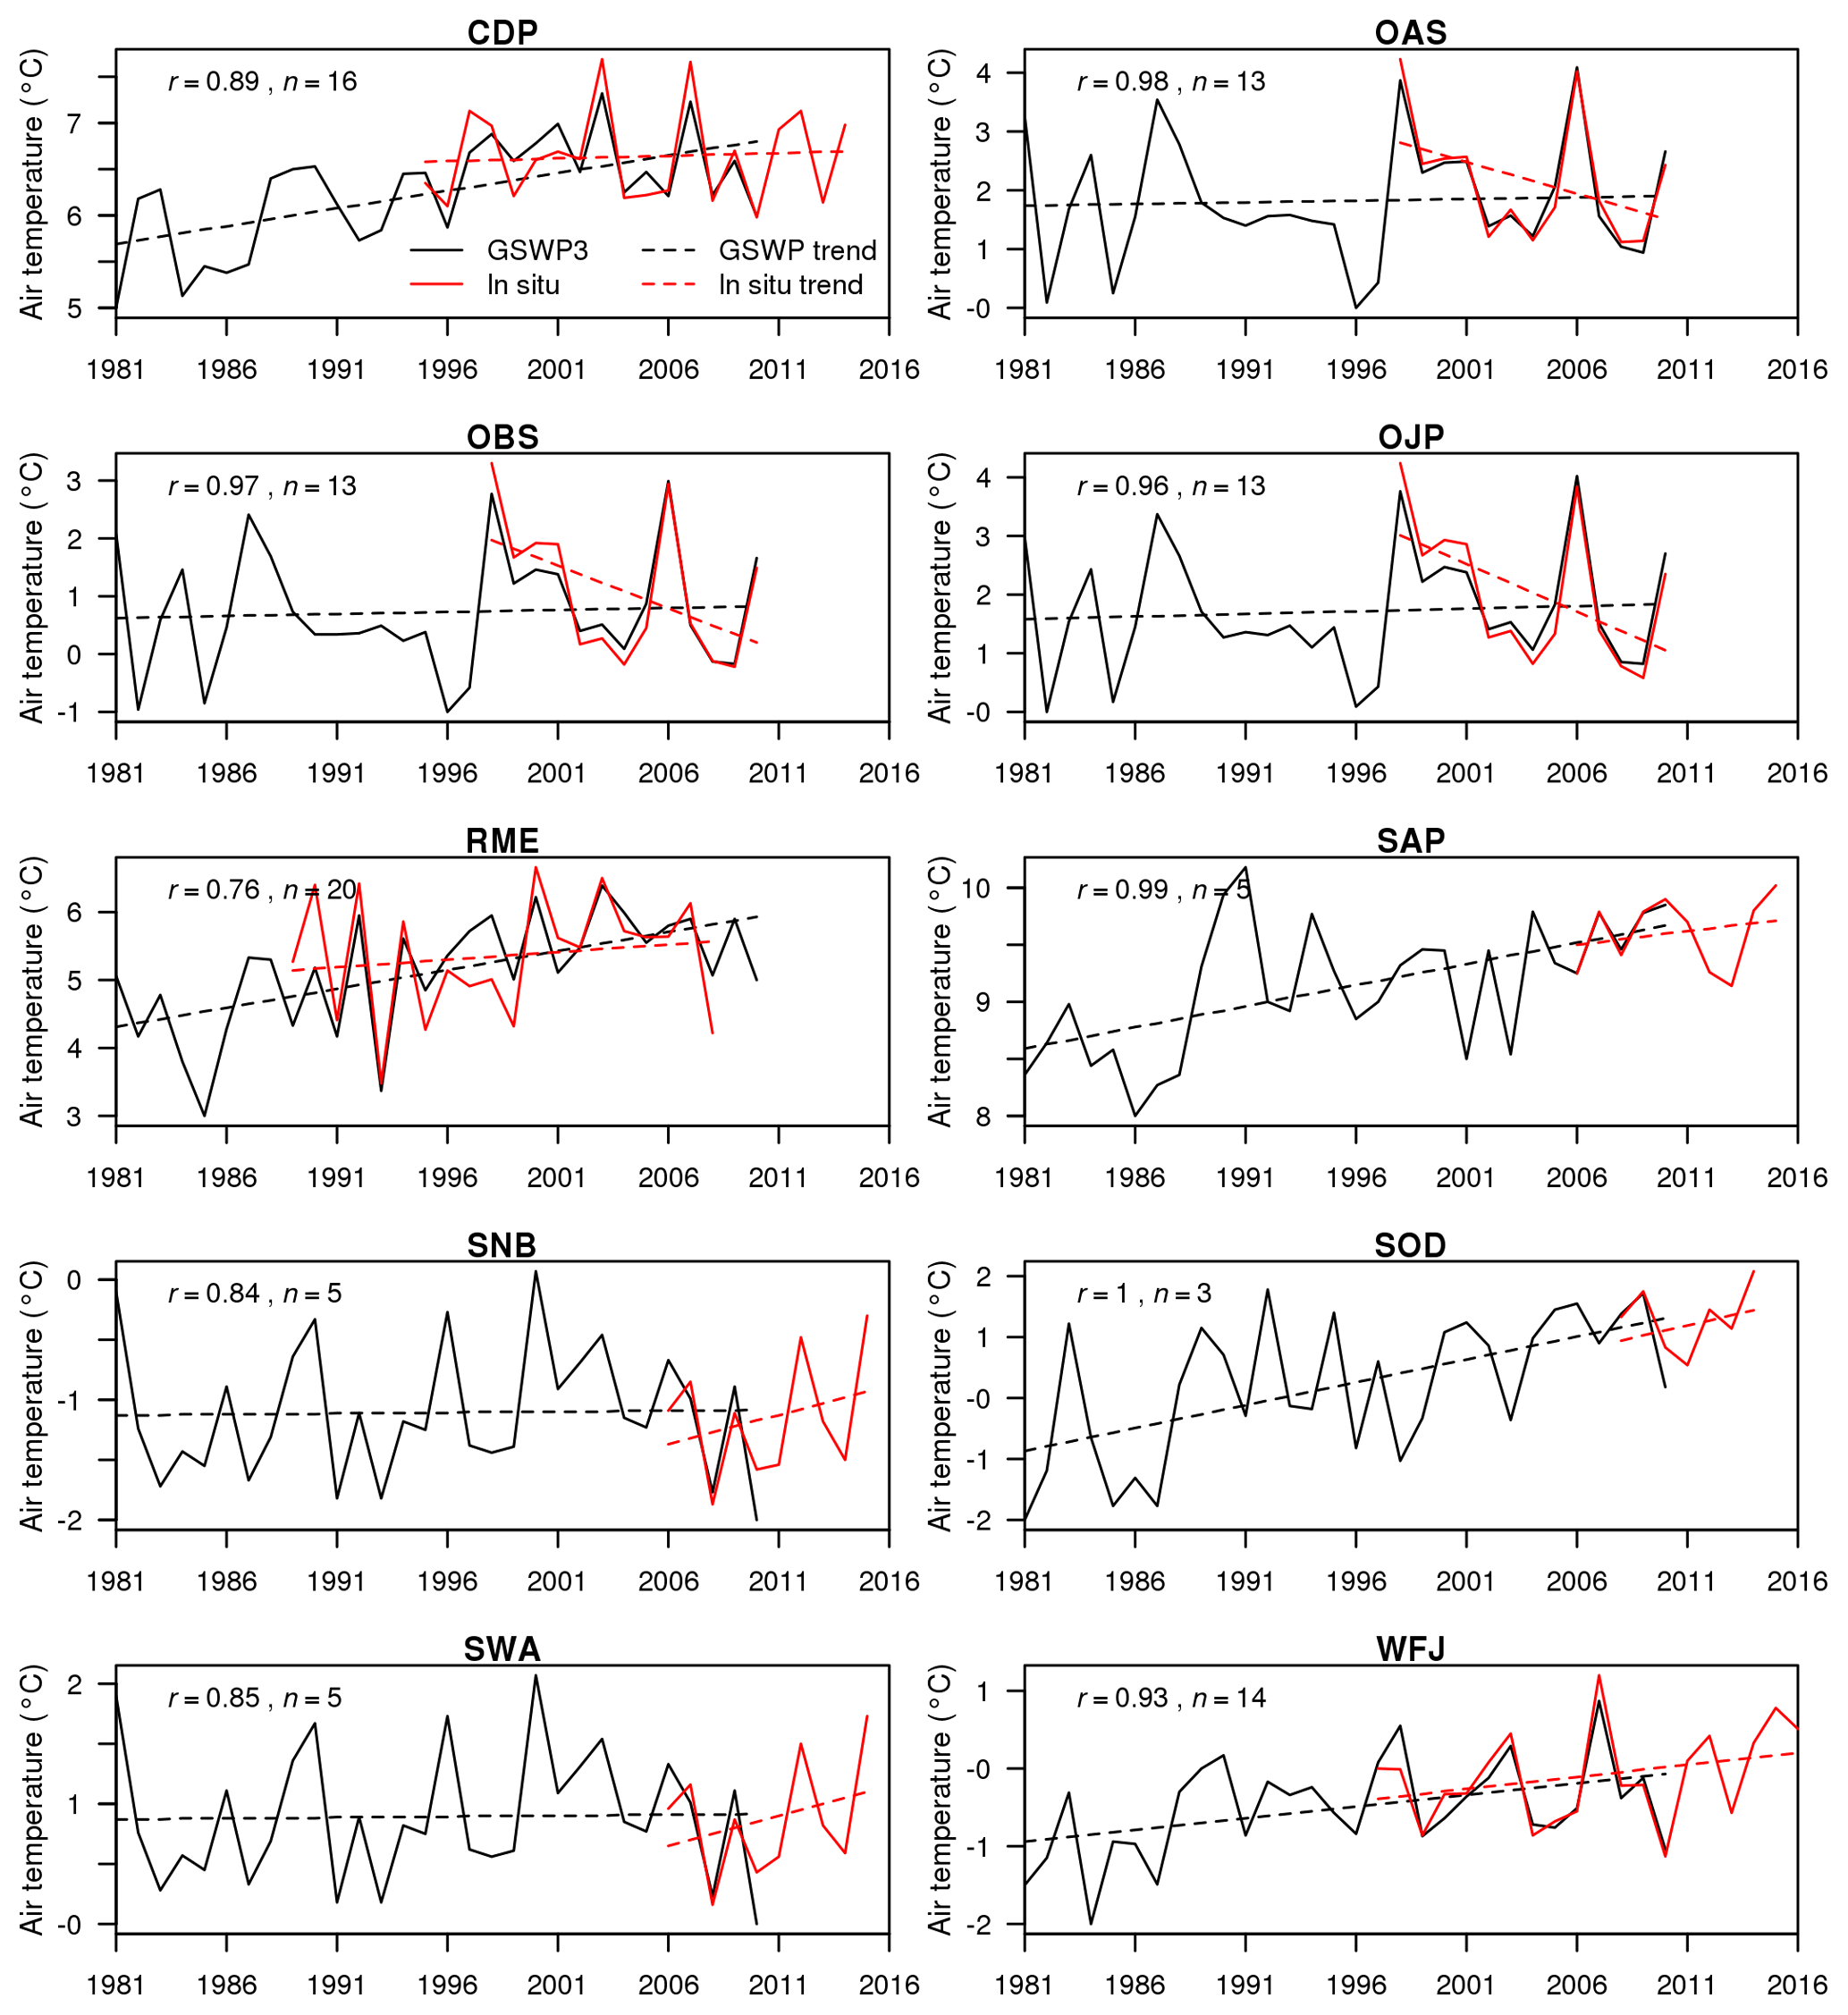
Figure 10Annual mean temperatures and fitted trends for years starting on 1 October at reference sites from GSWP3 and in situ data. Numbers show correlation (r) between GSWP3 and in situ air temperature for the n complete years of overlap.
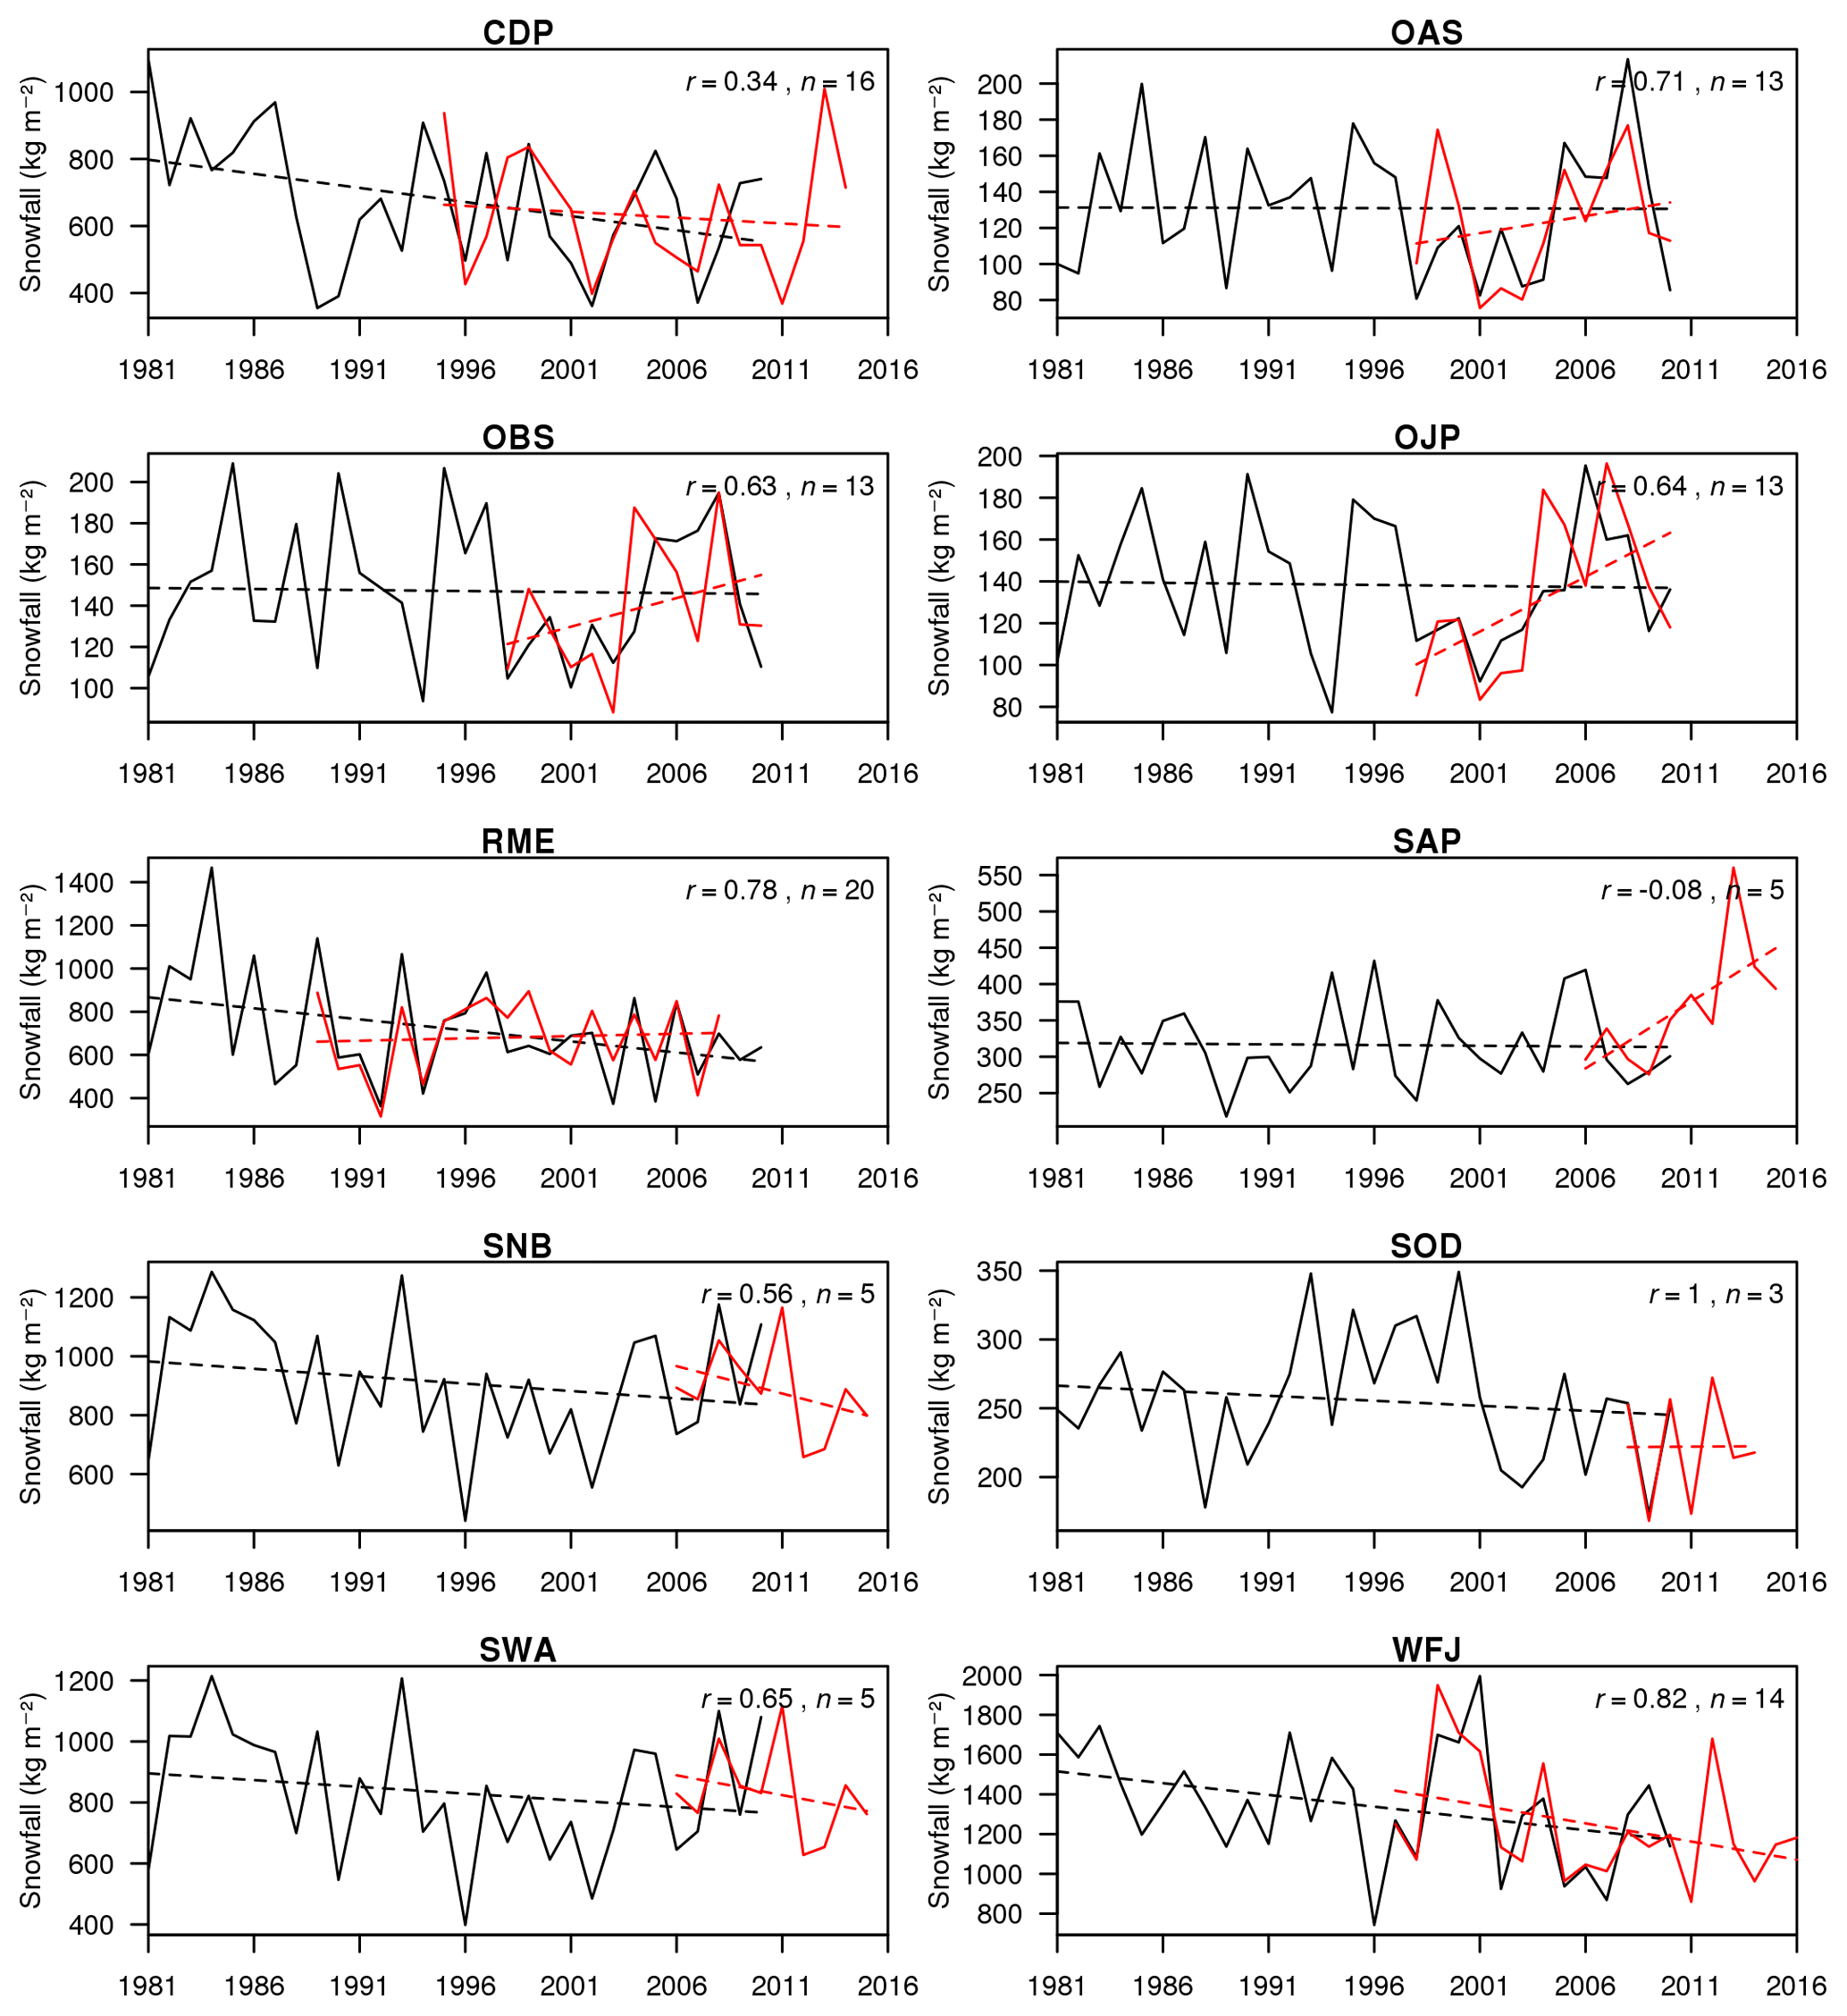
Figure 11Annual snowfall and fitted trends for years starting on 1 October at reference sites from GSWP3 and in situ data. Numbers show correlation (r) between GSWP3 and in situ snowfall for the n complete years of overlap. The legend is as in Fig. 10.
A number of errors were identified in the datasets in the course of the study. Firstly, we noted that snowfall at the Old Aspen was much lower than at the Old Black Spruce and Old Jack Pine during the 2007/08 winter. It was subsequently found that a gauge malfunction in November and December 2007 was not identified at the quality control (QC) stage. Secondly, two other errors were identified by decomposing time series: trend analyses showed an increase in wind speed at the Senator Beck basin sites from October 2012 to the end of the dataset in October 2015. Both sites measure wind speed at two heights; the lower wind speed measurements were used for the first 17 years of the dataset, but the upper wind speed was accidentally used for the last 3 years. At the same sites, instrument recalibration led to a small but statistically significant increasing trend in longwave radiation. These errors were included in the preliminary ESM-SnowMIP results shown in Krinner et al. (2018); erroneous years will either be neglected in future publications, or models will be forced with the corrected datasets which are published alongside this paper (see Sect. 6).
While unfortunate, such errors are symptomatic of long-term datasets for which consistent maintenance and data collection are problematic. Firstly, by definition, long-term monitoring stations might have been installed before metadata were kept electronically (and before the word “metadata” was invented in 1983; Merriam-Webster, 2018) and when information about changes of instruments or recalibrations was in notebooks which might never have been digitised, have now been lost, or never even existed. Equally, improvements in data storage capacities mean that temporal sampling intervals are shorter than they were. For example, measurements at Reynolds Mountain East were initially made every 15 min and averaged to hourly values; currently, 10 s samples and 5 min averages are aggregated to hourly values for most variables. Such factors are known to affect the values of meteorological variables (Hupet and Vanclooster, 2001), but it is beyond the scope of this study to attempt to quantify their contributions to errors or variations in the datasets. Secondly, immediate use of the data allows instrument malfunctions to be identified quickly. For example, a power supply failure was not identified at Sodankylä for 52 d in September and October 2011 because data were being collected but not used; more frequent QC checks are now in place. Thirdly, long-term monitoring stations are susceptible to funding cycles and to changes in climate change policies by successive governments. For example, BERMS, which were established in 1994, had the most frequent site visits from 2001 to 2008, but changing priorities led to less frequent snow surveys after 2008, with only one in the 2009/10 snow season. Finally, while automated QC protocols are in place, some checks require a subjective interpretation of the data and can therefore depend on just one person to identify errors due to malfunction, snow deposition on instruments, etc. Reliance on subjectivity or local knowledge – which in some cases is advocated as mentioned in Sect. 2.1.2 to choose the best method to correct undercatch in precipitation – diminishes the likelihood of the dataset being reproducible. In a discipline like geoscience, in which uncertainties and errors are required to be quantifiable, it is important to acknowledge that subjectivity is not. The closest estimate comes from a survey in which more than 40 % of scientists in the field of earth and environment admitted to failing to have reproduced their own experiments (Baker, 2016); the figure increased to more than 60 % when trying to reproduce other researchers' experiments. Nevertheless, human errors, or more appropriately “mistakes”, are not exclusive to data processing: Ménard et al. (2015) identified mistakes in the description files of the land surface model JULES that caused it to underperform considerably.
A recent and growing push towards standardising methods for data sharing and publishing may lead to errors being identified more systematically as more people have access to data. One of the advantages of open-source software is that bugs are reported by users, and their correction is, at times, a community effort which allows software to be improved quickly (Wu et al., 2016). Sharing of geoscientific models' source code, although still a fairly recent development compared to the field of engineering software, has equally led to model improvements through the identification and fixing of bugs beyond the model development teams (David et al., 2016). One might expect a similar trend for data sharing, whereby identifying errors becomes an asset to the community because, as mentioned by Gil et al. (2016) in their proposal for a framework for best practices in the publication of data papers, “data sharing makes authors double-check their work, improving science at the first stage as well as future reuse”. The more data are used, the more likely it is that mistakes, errors, and uncertainties are identified, and the less likely it will be that model results can, according to Clark et al. (2011), “at best be merely attributed to a nebulous mix of data and structural errors”; to this we can also add human errors.
The data presented and described in this paper are available in the data repository PANGAEA: https://doi.org/10.1594/PANGAEA.897575.
It is hoped that one of the legacies of ESM-SnowMIP will be for the datasets presented in this paper to be used as benchmarks for model development and to facilitate improvements in snow modelling. Cold region processes have been a major source of uncertainties in previous IPCC reports. The sparsity of long-term high-quality datasets in cold regions in the past may have contributed to this if one considers that ESMs are run globally, but their snow schemes are generally evaluated at a small number of sites; the first iteration of SnowMIP (Etchevers et al., 2002) 16 years ago included only one long-term (15-year) dataset and three short-term (fewer than two snow seasons) ones. Meta-research argues that it is misleading to emphasise statistically significant findings of any single team; what matters instead is the totality of the evidence (Ioannidis, 2005). It is equally misleading to draw conclusions on model performance when models are evaluated only at one or two sites for 1 or 2 years. The ease of use and availability of the datasets presented here, as well as further ESM-SnowMIP reference sites which will be located in more challenging conditions, should help model developers quantify – and reduce – model uncertainties and errors.
The supplement related to this article is available online at: https://doi.org/10.5194/essd-11-865-2019-supplement.
CBM led the writing of the paper and archived the data. RE prepared the data in the standardised format described in Sect. 6, bias-corrected GSWP3 data and wrote Sect. 3. The Supplement (metadata) and data provision are attributable to MD and YL for CDP, AB and PB for BERMS, DM for RME, MN for SAP, JD and MR for SNB and SWA, AK and RE for SOD, and CF and NW for WFJ. HK provided GSWP3 data, which were extracted for sites and interpolated by LW. All co-authors provided comments which contributed to the paper.
The authors declare that they have no conflict of interest.
The authors would like to thank all the staff and students who have collected the data presented in this paper over the years. CNRM/CEN is part of Labex OSUG@2020 (ANR10 LABX56). CDP is part of Observatoire des Sciences de l'Univers de Grenoble (OSUG), Observation pour l'Experimentation et la Recherche en Environnement CryObsClim and Systemes d'Observation et d'Experimentation au long terme pour la Recherche en Environnement des glaciers, GlacioClim. CDP contributes to OZCAR (Observatoires de la Zone Critique Applications et Recherches), one of the French components of the eLTER European Research Infrastructure (International Long-term Ecological Research Networks). It is also labelled as a member of the World Meteorological Observation (WMO) Global Cryospheric Watch CryoNet network and of the INARCH network. Hyungjun Kim acknowledges support by Grant-in-Aid for Specially promoted Research 16H06291 from JSPS. Masashi Niwano was supported in part by (1) the Japan Society for the Promotion of Science through Grants-in-Aid for Scientific Research numbers JP16H01772 (SIGMA project), JP15H01733 (SACURA project), JP17K12817, JP17KK0017, JP18H03363, and JP18H05054; (2) the Ministry of the Environment of Japan through the Experimental Research Fund for Global Environmental Research Coordination System; and (3) the Institute of Low Temperature Science, Hokkaido University, through the Grant for Joint Research Program (18S007 and 18G035). The sites at the Senator Beck Basin are maintained by the Center for Snow and Avalanche Studies with development funding from the U.S. National Science Foundation (ATM-0431955) and the USDA Forest Service. Alan Barr and Paul Bartlett acknowledge financial support from the Climate Research Division of Environment and Climate Change Canada and field and data management support from Joe Eley, Charmaine Hrynkiw, Dell Bayne, Natasha Neumann, Erin Thompson, and Steve Enns. Sodankylä is a member of the WMO Global Cryosphere Watch CryoNet network.
Work by Cécile B. Ménard and Richard Essery was supported by NERC grant NE/P011926/1.
This paper was edited by David Carlson and reviewed by two anonymous referees.
Anderson, P: Mechanism for the behaviour of hydroactive materials used in humidity sensors, J. Atmos. Ocean. Tech., 12, 662–667, 1995.
Aoki, T., Kuchiki, K., Niwano, M., Kodama, Y. , Hosaka, M., and Tanaka, T.: Physically based snow albedo model for calculating broadband albedos and the solar heating profile in snowpack for general circulation models, J. Geophys. Res., 116, D11114, https://doi.org/10.1029/2010JD015507, 2011.
Baker M.: 1,500 scientists lift the lid on reproducibility, Nature, 533, 452–454, https://doi.org/10.1038/533452a, 2016.
Bartlett, P. A., MacKay, M. D., and Verseghy, D. L.: Modified Snow Algorithms in the Canadian Land Surface Scheme: Model Runs and Sensitivity Analysis at Three Boreal Forest Stands, Atmos.-Ocean, 43, 207–222, https://doi.org/10.3137/ao.440301, 2006.
Clark, M. P. A, Kavetski, D., and Fenicia, F.: Pursuing the method of multiple working hypotheses for hydrological modeling, Water Resour. Res., 47, W09301, https://doi.org/10.1029/2010WR009827, 2011.
Compo, G. P., Whitaker, J. S., Sardeshmukh, P. D., Matsui, N., Allan, R. J., Yin, X.,Gleason, B. E., Vose, R. S., Rutledge, G., Bessemoulin, P., Brönnimann, S., Brunet, M., Crouthamel, R. I., Grant, A. N., Groisman, P. Y., Jones, P. D., Kruk, M., Kruger, A. C., Marshall, G. J., Maugeri, M., Mok, H. Y., Nordli, Ø., Ross, T. F., Trigo, R. M., Wang, X. L., Woodruff, S. D., and Worley, S. J.: The Twentieth Century Reanalysis Project, Q. J. Roy. Meteor. Soc., 137, 1–28, https://doi.org/10.1002/qj.776, 2011.
David, C., Famiglieti, J., Yang, Z.-L., Habets, F., and Maidment, D.: A decade of RAPID—Reflections on the development of an open source geoscience code, Earth and Space Science, 3, 226–244, https://doi.org/10.1002/2015EA000142, 2016.
Essery, R. and Etchevers, P., Parameter sensitivity in simulations of snowmelt, J. Geophys. Res., 109, 1–15, https://doi.org/10.1029/2004JD005036, 2004.
Essery, R., Rutter, N., Pomeroy, J., Baxter, R., Stähli, M., Gustafsson, D., Barr, A., Bartlett, P., and Elder, K.: SNOWMIP2: An Evaluation of Forest Snow Process Simulations, B. Am. Meteorol. Soc., 90, 1120–1135, https://doi.org/10.1175/2009BAMS2629.1, 2009.
Essery, R., Kontu, A., Lemmetyinen, J., Dumont, M., and Ménard, C. B.: A 7-year dataset for driving and evaluating snow models at an Arctic site (Sodankylä, Finland), Geosci. Instrum. Method. Data Syst., 5, 219–227, https://doi.org/10.5194/gi-5-219-2016, 2016.
Etchevers, P., Martin, E., Brown, R., Fierz, C., Lejeune, Y., Bazile, E., Boon, A., Dai, Y.-J., Essery, R., Fernandez, A., Gusev, Y., Jordan, R., Koren, V., Kowalczyck, E., Nasonova, R., Pyles, D., Schlosser, A. Shmakin, A., Smirnova, T. G., Strasser, U., Verseghy, D., Yamazaki, T., and Yang, Z.-L.: SnowMiP, an intercomparison of snow models: first results, in: Proceedings of the International snow science workshop, Penticton, Canada, 29 September–4 October 2002.
Flato, G., Marotzke, J., Abiodun, B., Braconnot, P., Chou, S., Collins, W., Cox, P., Driouech, F., Emori, S., Eyring, V., Forest, C., Gleckler, P., Guilyardi, E., Jakob, C., Kattsov, V., Reason, C., and Rummukainen, M.: Evaluation of climate models, in: Climate Change 2013: The Physical Science Basis. Contribution of Working Group I to the Fifth Assessment Report of the Intergovernmental Panel on Climate Change, edited by: Stocker, T., Qin, D., Plattner, G.-K., Tignor, M., Allen, S., Boschung, J., Nauels, A., Xia, Y., Bex, V., and Midgley, P., Cambridge University Press, Cambridge, 2013.
Georges, C. and Kaser, G.: Ventilated and unventilated air temperature measurements for glacier-climate studies on a tropical high mountain site, J. Geophys. Res., 107, 4775, https://doi.org/10.1029/2002JD002503, 2002.
Gil, Y., David, C., Demir, I., Essawy, B., Fulweiler, R., Goodall, J., Karlstrom, L., Lee, H., Mills, H., Oh, J.-H., Pierce, S., Pope, A., Tzeng, M., Villazimar, S., and Yu, X.: Toward the Geoscience Paper of the Future: Best practices for documenting and sharing research from data to software to provenance, Earth and Space Science, 3, 388–415, https://doi.org/10.1002/2015EA000136, 2016.
Goodison, B. E., Louie, P. Y. T., and Yang, D.: WMO solid precipitation measurement intercomparison, WMO Instruments and Observing Methods Rep. 67, WMO/TD-872, 212 pp., 1998.
Hupet, F. and Vanclooster, M.: Effect of the sampling frequency of meteorological variables on the estimation of the reference evapotranspiration, J. Hydrol., 243, 192–204, https://doi.org/10.1016/S0022-1694(00)00413-3, 2001.
Huwald, H., Higgins, C. W., Boldi, M.-O., Bou-Zeid, E., Lehning, M., and Parlange, M. B.: Albedo effects on radiative errors in air temperature measurements, Water Resour. Res., 45, W08431, https://doi.org/10.1029/2008WR007600, 2009.
Ioannidis, J. P. A.: Why Most Published Research Findings Are False, PLOS Med., 2, e124, https://doi.org/10.1371/journal.pmed.0020124, 2005.
Jennings, K. S., Winchell, T. S., Livneh, B., and Molotch, N. P.: Spatial variation of the rain–snow temperature threshold across the Northern Hemisphere, Nat. Commun., 9, 1148, https://doi.org/10.1038/s41467-018-03629-7, 2018.
Kim, H.: Global Soil Wetness Project Phase 3 Atmospheric Boundary Conditions (Experiment 1) [Data set], Data Integration and Analysis System (DIAS), https://doi.org/10.20783/DIAS.501, 2017.
Köppen, W.: Das geographische System der Klimate, in: Handbuch der Klimatologie, edited by: Köppen, W. and Geiger, R., Borntraeger, Berlin, 1936.
Koven, C. D., Riley, W. J., and Stern, A.: Analysis of Permafrost Thermal Dynamics and Response to Climate Change in the CMIP5 Earth System Models, J. Climate, 26, 1877–1900, https://doi.org/10.1175/JCLI-D-12-00228.1, 2013.
Krinner, G., Derksen, C., Essery, R., Flanner, M., Hagemann, S., Clark, M., Hall, A., Rott, H., Brutel-Vuilmet, C., Kim, H., Ménard, C. B., Mudryk, L., Thackeray, C., Wang, L., Arduini, G., Balsamo, G., Bartlett, P., Boike, J., Boone, A., Chéruy, F., Colin, J., Cuntz, M., Dai, Y., Decharme, B., Derry, J., Ducharne, A., Dutra, E., Fang, X., Fierz, C., Ghattas, J., Gusev, Y., Haverd, V., Kontu, A., Lafaysse, M., Law, R., Lawrence, D., Li, W., Marke, T., Marks, D., Ménégoz, M., Nasonova, O., Nitta, T., Niwano, M., Pomeroy, J., Raleigh, M. S., Schaedler, G., Semenov, V., Smirnova, T. G., Stacke, T., Strasser, U., Svenson, S., Turkov, D., Wang, T., Wever, N., Yuan, H., Zhou, W., and Zhu, D.: ESM-SnowMIP: assessing snow models and quantifying snow-related climate feedbacks, Geosci. Model Dev., 11, 5027–5049, https://doi.org/10.5194/gmd-11-5027-2018, 2018.
Landry, C. C., Buck, K. A., Raleigh, M. S., and Clark, M. P.: Mountain system monitoring at Senator Beck Basin, San Juan Mountains, Colorado: A new integrative data source to develop and evaluate models of snow and hydrologic processes, Water Resour. Res., 50, 1773–1788, https://doi.org/10.1002/2013WR013711, 2014.
Lejeune, Y., Dumont, M., Panel, J.-M., Lafaysse, M., Lapalus, P., Le Gac, E., Lesaffre, B., and Morin, S.: 57 years (1960–2017) of snow and meteorological observations from a mid-altitude mountain site (Col de Porte, France, 1325 m of altitude), Earth Syst. Sci. Data, 11, 71–88, https://doi.org/10.5194/essd-11-71-2019, 2019.
Menard, C. B. and Essery, R.: ESM-SnowMIP meteorological and evaluation datasets at ten reference sites (in situ and bias corrected reanalysis data), PANGAEA, https://doi.org/10.1594/PANGAEA.897575, 2019.
Ménard, C. B., Ikonen, J., Rautiainen, K., Aurela, M., Arslan, A. N., and Pulliainen, J.: Effects of Meteorological and Ancillary Data, Temporal Averaging, and Evaluation Methods on Model Performance and Uncertainty in a Land Surface Model, J. Hydrometeor., 16, 2559–2576, https://doi.org/10.1175/JHM-D-15-0013.1, 2015.
Merriam-Webster: Metadata – Definition of Metadata by Merriam-Webster, https://www.merriam-webster.com/dictionary/metadata#h1, last access: 18 December 2018.
Morin, S., Lejeune, Y., Lesaffre, B., Panel, J.-M., Poncet, D., David, P., and Sudul, M.: An 18-yr long (1993-–2011) snow and meteorological dataset from a mid-altitude mountain site (Col de Porte, France, 1325 m alt.) for driving and evaluating snowpack models, Earth Syst. Sci. Data, 4, 13–21, https://doi.org/10.5194/essd-4-13-2012, 2012.
Nitu, R., Roulet, Y.-A., Wolff, M., Earle, M., Reverdin, A., Smith, C., Kochendorfer, J., Morin, S., Rasmussen, R., Wong, K., Alastrué, J., Arnold, L., Baker, B., Buisán, S., Collado, J. L., Colli, M., Collins, B., Gaydos, A., Hannula, H.-R., Hoover, J., Joe, P., Kontu, A., Laine, T., Lanza, L., Lanzinger, E., Lee, G. W., Lejeune, Y., Leppänen, L., Mekis, E., Panel, J.-M., Poikonen, A., Ryu, S., Sabatini, F., Theriault, J., Yang, D., Genthon, C., van den Heuvel, F., Hirasawa, N., Konishi, H., Nishimura, K., and Senese, A.: WMO Solid Precipitation Intercomparison Experiment (SPICE) (2012–2015), World Meteorological Organization, Instruments and Observing Methods Report No. 131, 2018.
Niwano, M., Aoki, T., Kuchiki, K., Hosaka, M., and Kodama, Y.: Snow Metamorphism and Albedo Process (SMAP) model for climate studies: Model validation using meteorological and snow impurity data measured at Sapporo, Japan, J. Geophys. Res., 117, F03008, https://doi.org/10.1029/2011JF002239, 2012.
Painter, T. H., Skiles, S. M., Deems, J. S., Bryant, A. C., and Landry C. C.: Dust radiative forcing in snow of the Upper Colorado River Basin: 1. A 6 year record of energy balance, radiation, and dust concentrations, Water Resour. Res., 48, W07521, https://doi.org/10.1029/2012WR011985, 2012.
Pirazzini, R., Leppänen, L., Picard, G., Lopez-Moreno, J. I., Marty, C., Macelloni, G., Kontu, A., von Lerber, A., Tanis, C. M., Schneebeli, M., de Rosnay, P., and Arslan, A. N.: European In-Situ Snow Measurements: Practices and Purposes, Sensors, 18, 2016, https://doi.org/10.3390/s18072016, 2018.
Randall, D. A., Wood, R. A., Bony, S., Colman, R., Fichefet, T., Fyfe, J., Kattsov, V., Pitman, A., Shukla, J. Srinivasan, J., Stouffer, R. J., Sumi, A., and Taylor, K. E.: Climate Models and Their Evaluation, in: Climate Change 2007: The Physical Science Basis. Contribution of Working Group I to the Fourth Assessment Report of the Intergovernmental Panel on Climate Change, edited by: Solomon, S., Qin, D., Manning, M., Chen, Z., Marquis, M., Averyt, K. B., Tignor, M., and Miller H. L., Cambridge University Press, Cambridge, United Kingdom and New York, NY, USA, 2007.
Reba, M. L., Marks, D., Seyfried, M., Winstral, A., Kumar, M., and Flerchinger, G.: A long-term data set for hydrologic modeling in a snow-dominated mountain catchment, Water Resour. Res., 47, W07702, https://doi.org/10.1029/2010WR010030, 2011.
Rutter, N., Essery R. L. H., Pomeroy, J. W., et al.: Evaluation of forest snow processes models (SnowMIP2), J. Geophys. Res., 114, D06111, https://doi.org/10.1029/2008JD011063, 2009.
van den Hurk, B., Kim, H., Krinner, G., Seneviratne, S. I., Derksen, C., Oki, T., Douville, H., Colin, J., Ducharne, A., Cheruy, F., Viovy, N., Puma, M. J., Wada, Y., Li, W., Jia, B., Alessandri, A., Lawrence, D. M., Weedon, G. P., Ellis, R., Hagemann, S., Mao, J., Flanner, M. G., Zampieri, M., Materia, S., Law, R. M., and Sheffield, J.: LS3MIP (v1.0) contribution to CMIP6: the Land Surface, Snow and Soil moisture Model Intercomparison Project – aims, setup and expected outcome, Geosci. Model Dev., 9, 2809–2832, https://doi.org/10.5194/gmd-9-2809-2016, 2016.
Weedon, G. P., Gomes, S., Viterbo, P., Shuttleworth, W. J., Blyth, E., Österle, H., Adam, J. C., Bellouin, N., Boucher, O., and Best, M.: Creation of the WATCH Forcing Data and Its Use to Assess Global and Regional Reference Crop Evaporation over Land during the Twentieth Century, J. Hydrometeorol., 12, 823–848, https://doi.org/10.1175/2011JHM1369.1, 2011.
Wever, N., Schmid, L., Heilig, A., Eisen, O., Fierz, C., and Lehning, M.: Verification of the multi-layer SNOWPACK model with different water transport schemes, The Cryosphere, 9, 2271–2293, https://doi.org/10.5194/tc-9-2271-2015, 2015.
WSL Institute for Snow and Avalanche Research SLF: Weissfluhjoch dataset for ESM-SnowMIP, WSL Institute for Snow and Avalanche Research SLF. https://doi.org/10.16904/16, 2017.
Wu, H., Shi, L., Chen, C., Wang, Q., and Boehm, B.: Maintenance Effort Estimation for Open Source Software: A Systematic Literature Review, 2016 IEEE International Conference Software Maintenance and Evolution (ICSME), Raleigh, NC, USA, 2–7 October 2016, IEEE, 32–43, 2016.
The requested paper has a corresponding corrigendum published. Please read the corrigendum first before downloading the article.
- Article
(5704 KB) - Full-text XML
- Corrigendum
-
Supplement
(106 KB) - BibTeX
- EndNote