the Creative Commons Attribution 4.0 License.
the Creative Commons Attribution 4.0 License.
Geostrophic currents in the northern Nordic Seas from a combination of multi-mission satellite altimetry and ocean modeling
Felix L. Müller
Denise Dettmering
Claudia Wekerle
Christian Schwatke
Marcello Passaro
Wolfgang Bosch
Florian Seitz
A deeper knowledge about geostrophic ocean surface currents in the northern Nordic Seas supports the understanding of ocean dynamics in an area affected by sea ice and rapidly changing environmental conditions. Monitoring these areas by satellite altimetry results in a fragmented and irregularly distributed data sampling and prevents the computation of homogeneous and highly resolved spatio-temporal datasets. In order to overcome this problem, an ocean model is used to fill in data when altimetry observations are missing.
The present study provides a novel dataset based on a combination of along-track satellite-altimetry-derived dynamic ocean topography (DOT) elevations and simulated differential water heights (DWHs) from the Finite Element Sea ice Ocean Model (FESOM) version 1.4. This innovative dataset differs from classical assimilation methods because it substitutes altimetry data with the model output when altimetry fails or is not available.
The combination approach is mainly based on a principal component analysis (PCA) after reducing both quantities by their constant and seasonal signals. In the main step, the most-dominant spatial patterns of the modeled differential water heights as provided by the PCA are linked with the temporal variability in the estimated DOT from altimetry by performing a principal component synthesis (PCS). After the combination, the annual signal obtained by altimetry and a constant offset are re-added in order to reference the final data product to the altimetry height level. Surface currents are computed by applying the geostrophic flow equations to the combined topography. The resulting final product is characterized by the spatial resolution of the ocean model around 1 km and the temporal variability in the altimetry along-track derived DOT heights.
The combined DOT is compared to an independent DOT product, resulting in a positive correlation of about 80 %, to provide more detailed information about short periodic and finer spatial structures. The derived geostrophic velocity components are evaluated by in situ surface drifter observations. Summarizing all drifter observations in equally sized bins and comparing the velocity components shows good agreement in spatial patterns, magnitude and flow direction. Mean differences of 0.004 m s−1 in the zonal and 0.02 m s−1 in the meridional component are observed. A direct pointwise comparison between the combined geostrophic velocity components interpolated onto the drifter locations indicates that about 94 % of all residuals are smaller than 0.15 m s−1.
The dataset is able to provide surface circulation information within the sea ice area and can be used to support a deeper comprehension of ocean currents in the northern Nordic Seas affected by rapid environmental changes in the 1995–2012 time period. The data are available at https://doi.org/10.1594/PANGAEA.900691 (Müller et al., 2019).
- Article
(14128 KB) - Full-text XML
- BibTeX
- EndNote
Water mass flowing northward and southward through the Greenland Sea and Fram Strait represents the major pathways of the bidirectional water exchange between the Arctic Ocean and the global conveyor belt. Most of the water mass is transported via the northward-flowing West Spitsbergen Current (WSC) and the southward-flowing East Greenland Current (EGC). More than 60 % of the total water transport is based on geostrophic movements, caused for example by water density and sea level elevation variations (Rudels, 2012).
Geostrophic currents (GCs) can be directly derived from measurements of the dynamic ocean topography (DOT) with respect to the Earth's gravity field and rotation and the Coriolis force involved. In contrast to hydrographic pressure, temperature and salinity observations, collected by irregularly distributed in situ data (e.g., ARGO floats or ship-based measurements), satellite altimetry is the only possibility for obtaining spatially and temporally homogeneous information about the global geostrophic circulation. In situ sampling platforms can deliver high-resolution measurements, but in polar regions their availability is limited due to sparse spatial coverage and challenging environmental conditions. However, especially in sea ice areas, even geostrophic ocean currents derived by altimetry suffer from irregular sampling and data gaps. Furthermore, the generation of a dataset requires some sort of interpolation or gridding techniques, which cause smoothing effects and a coarser spatio-temporal resolution. Moreover, in open-ocean regions, beyond the sea ice edge, the spatial coverage of altimetry data is sparse due to the along-track acquisition geometry with constant and fixed orbit patterns. Hence, studies are limited to long-term means (e.g. Farrell et al., 2012) or to satellite altimetry missions dedicated to sea ice conditions (e.g., CryoSat-2; Kwok and Morison, 2015, and ICESat; Kwok and Morison, 2011). Nevertheless, monthly DOT estimates have been generated and published by Armitage et al. (2016) using DOT observations derived from long-term satellite altimetry. Furthermore, Armitage et al. (2017) presented a dataset based on a 12-year altimetry observation (from 2003 to 2014) of geostrophic currents at a monthly time frame on a longitude–latitude regular data grid up to a latitudinal limit of 81.5∘ N. The authors created a dataset which combines satellite-altimetry observations from ice-covered and open-ocean regions. Further publicly available geostrophic ocean current products based on observational data from satellite altimetry only and in combination with in situ buoys (e.g. Rio et al., 2014) are provided, for example, by the GlobCurrent project and by the Copernicus Marine Environment Monitoring Service (CMEMS). However, the latter's datasets are limited to open-ocean conditions.
Besides observation-based ocean circulation products, model simulations provide information about the ocean dynamics. In general, their resolution is much better than these of observations; however, they rely on the underlying mathematical or physical formulations, which naturally contain simplifications and suffer from deficiencies in process descriptions. Ocean models differ in spatio-temporal resolutions, forcing the model background and underlying mathematical formulations. Recent developments focus on so-called unstructured ocean models, allowing for locally highly refined spatial resolutions (Danilov, 2013), while keeping a coarser resolution in other regions of the Earth (e.g., Finite Element Sea ice Ocean Model in Wang et al., 2014, or Model for Prediction Across Scales, Ocean model – MPAS-Ocean – in Ringler et al., 2013). One of the unstructured models is the Finite Element Sea ice Ocean Model version 1.4 (FESOMv1.4) described by Wang et al. (2014). In the following text, FESOMv1.4 is abbreviated by FESOM.
For the northern Nordic Seas, an eddy-resolving configuration has been developed, enabling the simulation of small-scale eddies down to 1 km (Wekerle et al., 2017). Besides total ocean current velocities including wind-driven and geostrophic components, FESOM includes sea surface heights with respect to the bottom ocean topography, which can be also seen as an estimation of the dynamic ocean topography. Applying the gradient to these differential water elevations leads to the computation of simulated geostrophic currents. In contrast to observational based data, models show consistent spatio-temporal resolutions and enable investigations of ocean surface currents under the sea ice layer. However, they are limited to a fixed defined mathematical background and function as an assumption of the reality.
The current publication aims to present an innovative combined data product based on the advantages of both simulated and observed datasets. In contrast to other commonly used datasets or assimilation methods, the introduced product is mainly focused on the observational side by filling in modeled DOT elevations where altimetry data are missing or corrupted. Several investigations and consistency checks have been made by Müller et al. (2019), concluding with good agreement of simulated and observed DOT in terms of the most-dominant seasonal signals and spatial patterns aiming at a combination of the temporal variability provided by altimetry along-track derived DOT elevations with simulated spatio-temporally homogeneous DOT heights of the model. The combined dataset obtained is characterized by the spatially homogeneous resolution of the model and the temporal variability in altimetry-derived DOT elevations. This enables further studies of geostrophic surface currents in sea ice regions consistent in space and time and may help to deepen the knowledge about polar ocean current dynamics.
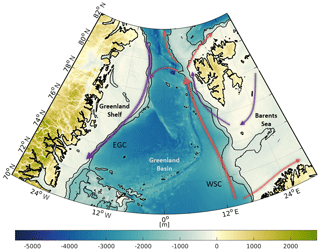
Figure 1Bathymetry of the study area (northern Nordic Seas and Fram Strait) based on RTopo2 topography model (Schaffer et al., 2016). Major current systems (West Spitsbergen Current – WSC; East Greenland Current – EGC) are displayed by arrows in red (inflowing Atlantic water) and blue (returning polar water). Contour lines indicate depths of −450 and −1500 m.
The dataset is based on a combination of multi-mission satellite-altimetry data from the ESA mission Envisat as well as ERS-2 and the eddy-resolving model, FESOM version 1.4 (Wang et al., 2014), covering a period of about 17 years. The combination approach is based on the commonly known principal component analysis (e.g. Jolliffe, 2002; Preisendorfer, 1988), which is successfully applied in historic sea level analyses and reconstruction investigations (e.g. Ray and Douglas, 2011; Church et al., 2004).
The study area covers the Fram Strait region, the Greenland Sea and parts of the Norwegian Sea as well as the Barents Sea (Fig. 1). The different regions are summarized by northern Nordic Seas. In geographical coordinates the investigation area is limited to 72 to 82∘ N and −30∘ W to 30∘ E.
The paper is structured in four sections. First, the datasets and combination method are introduced, followed by the results. Furthermore, the combination's reliability is evaluated by comparing the obtained datasets with in situ drifter velocities and independent satellite-derived DOT products. The study closes with a summary and concluding remarks of the most significant aspects.

Figure 2Exemplary pre-processed altimetry along-track DOT estimates for Envisat 3 d subcycle in March 2004 (a) and July 2006 (b), illustrating season-dependent data coverage.

Figure 3Exemplary differential water heights in March 2004 (a) and July 2006 (b) simulated by FESOM. Note the different scaling of color bars in comparison to Fig. 2.
2.1 Observations: radar altimetry data
The observational part of the combination is provided by high-frequency along-track satellite-derived dynamic ocean topography data of the ESA satellites ERS-2 and Envisat. The missions cover a period of about 17 years (May 1995–April 2012) up to a latitudinal limit of 81.5∘ N. The data pre-processing of ERS-2 and Envisat-observed ranges to derived DOT heights follows the descriptions of Müller et al. (2019). Altimetry ranges are retracked by ALES+ (Passaro et al., 2018), and open water and sea ice are discriminated by applying the method of Müller et al. (2017). The obtained sea surface heights are reduced to DOT estimates by subtracting the highly resolved Optimal Geoid Model for Modeling Ocean Circulation (OGMOC), developed up to a harmonic degree of 2190 (Gruber and Willberg, 2019). ALES+ has been chosen as an optimal retracking algorithm due to the ability for a consistent range estimation independent of the backscattering surface (open-ocean, lead and polynya). Coarse outliers are excluded from the dataset by filtering the sea surface heights on the basis of sea level anomalies (i.e., sea surface heights minus a mean sea surface) before transforming them into physical DOT heights. A time mean inter-mission offset is removed by taking the Envisat time series as a reference within a 6-month overlap period (January 2003–June 2003), considering only height observations from ice-free regions in the southern part of the investigation area. Before introducing the altimetry DOT elevations to the further processing steps, the ellipsoid referenced observation coordinates are transformed to consider the spherical Earth representation of the model.
Figure 2 shows, as an example, 3 d of altimetry data during the winter (March 2004) and summer (July 2006) season. In the winter, big data gaps can be noticed close to the eastern Greenland coast due to the presence of sea ice in contrast to summer, when most of the data are available.
2.2 Simulation: Finite Element Sea ice Ocean Model (FESOM)
The second part of the combination consists of simulated differential water heights (DWHs; e.g., Fig. 3) with respect to the ocean bottom topography (i.e., bathymetry). The bathymetry acts as geopotential surface, which enables a linkage to the altimetry-derived DOT heights (Androsov et al., 2018). FESOM is a global multi-resolution ocean circulation model with an included sea ice component resolving the major sea ice drift patterns. The model is based on the standard set of hydrostatic primitive equations in the Boussinesq approximation and is characterized by an unstructured triangular mesh with 47 vertical levels (Wang et al., 2014). The horizontal resolution in the configuration used in this study reaches up to 1 km in the Fram Strait and northern Greenland Sea area and can be described as “eddy-resolving”. Furthermore, the geographical model coordinates are referenced to a spherical Earth representation with a radius of 6367.50 km. More details of the FESOM configuration can be found in Wekerle et al. (2017). The present study uses only daily DWHs of the surface level covering the period 2002–2009.
2.3 Comparative datasets
For validation a comparison with externally generated absolute dynamic topography (ADT) elevations, from ADT-derived geostrophic velocity components and to geostrophic ocean velocity that reduced in situ drifter observations, is performed. The ADT data including geostrophic velocity components (Pujol and Mertz, 2019), provided by CMEMS, are characterized by a daily and 1∕4∘ spatial resolution and are based on multi-mission altimetry data. The ADT grids are created by adding temporally variable sea level anomalies to a mean dynamic topography and cover the complete time period of the developed datasets. However, no ADT and current data are available in sea ice areas, which limits the comparison to ice-free regions and seasons.
Further interpolated surface drifter trajectories from CMEMS (Rio and Etienne, 2018) with a 6 h interval are used. Following the pre-processing steps of the drifting buoys, described by Rio and Etienne (2018), all surface drifters are analyzed concerning their drogue status and local wind slippage corrections. Besides geostrophic velocities, drifter observations include ageostrophic movements (e.g., Ekman currents, Stokes drift, inertial oscillations, local wind effects, etc.). Hence, the drifter data must be corrected in order to enable a comparison with satellite-altimetry-derived and simulated derived geostrophic currents. Local wind corrections, also provided by CMEMS (Rio and Etienne, 2018), are directly subtracted from the drifter velocities, considering the drogue status. The Ekman current is taken from global grids providing velocities at 15 m depth (drogue on) and at the surface (drogue off) level. The computation of the Ekman fields follows the explanations and processing scheme of Rio and Hernandez (2003) and Rio et al. (2014). The 3-hourly available Ekman grids are downloaded from the GlobCurrent data repository and have a spatial resolution of 1∕4∘ and global coverage. However, grid nodes north of 78.875∘ N are not defined, which limits the comparison to central parts of the Greenland Sea and neglects the Fram Strait area. The Ekman velocities are interpolated to the drifter positions and subtracted from the drifting buoys velocity by taking the drogue status into account. The Stokes drift is provided globally (Rascle and Ardhuin, 2013, distributed by GlobCurrent) and applied only to undrogued surface drifter data in the same way as the Ekman fields (Rio et al., 2014). Following the suggestions of Andersson et al. (2011), the Ekman–Stokes-drift-reduced drifter velocities are low-pass filtered by a 25 h cutoff, two-point Butterworth filter to remove tidal and inertial oscillations. Furthermore, drifters showing observations with time gaps of more than 1 d are filtered separately (Andersson et al., 2011).
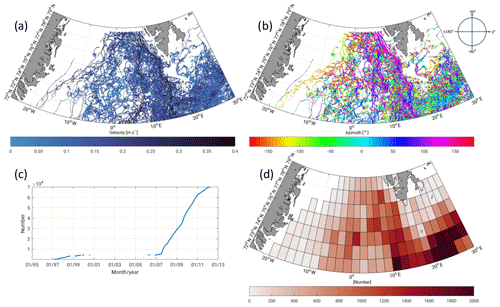
Most of the drifter buoys observations are collected in ice-free regions affected by currents (see Fig. A1). Analyzing the geostrophic amplitudes and phases, the major pathway and stream velocity of the West Spitsbergen Current is clearly identified, in contrast to the East Greenland Current, which is mostly covered by sea ice. Due to high variability, most of the drifter data can be found in the West Spitsbergen region and in the southern parts, where Atlantic water enters the Greenland Sea. Most of the drifting buoys are carried through the Fram Strait or enter the Barents Sea. Only a few drifter buoys turn around and follow the East Greenland Current. Furthermore, smaller eddies in the central Greenland Sea can be observed. In this study, nearly 70 000 in situ observations are available, of which 63 % are characterized by a drogue-on status. The number of drifter measurements strongly increases between 2007 and 2012. However, hardly any data can be used between 2000 and 2006. Nevertheless, a validation of the ERS-2 data products is possible between 1995 and 2000.
In order to generate a combined spatio-temporally consistent dataset based on irregular distributed altimetry observations, it is necessary to connect the along-track derived DOT estimates with a spatially consistent modeled DOT representation to fill the observation gaps. The following section describes briefly the combination of along-track DOT heights with the modeled water level, while keeping the spatial height reference of the altimetry observations.
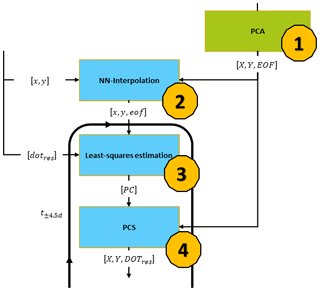
The combination is mainly based on a principal component analysis (PCA) transferring the method of historic sea level reconstruction (e.g. Church et al., 2004; Ray and Douglas, 2011) to the present purpose. Altimetry observed along-track DOT heights represent the temporal DOT variability, whereas the spatial signal is provided by FESOM. Figure 4 highlights the interrelationship of the datasets and gives an overview over the main processing chain. The individual work steps are described chronologically. The output of the processing steps are combined geostrophic currents (cGCs) and dynamic ocean topography (cDOT) data representing the temporal variability in the altimetry measurements and the spatial homogeneity of the ocean model.
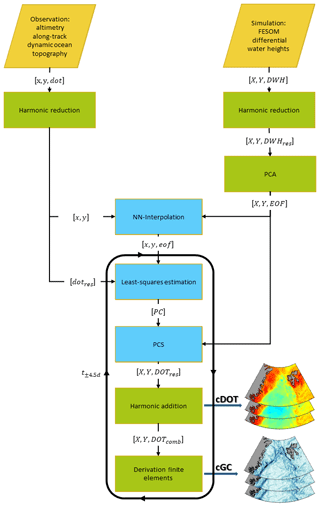
Figure 4Main processing chain for the generation of combined ocean topography (cDOT) and geostrophic currents (cGCs) showing the main processing steps, i.e., the combination (in light blue) and auxiliary steps (in green). The necessary input data are highlighted in orange. Upper-case coordinates (X,Y) are grid coordinates, whereas lower-case coordinates (x,y) are on the satellites’ tracks. The same holds for the datasets: data labeled in capital letters are given as a grid, and lower-case letters represent along-track quantities. The “comb” index stands for combined products, and “res” is residual products, reduced by annual signal and constant offset. For dataset abbreviations, see the main text.
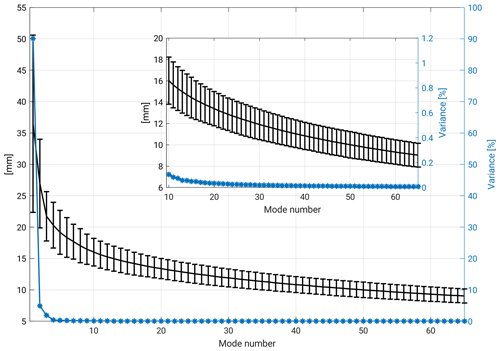
Figure 5Percentage of variance (blue) and daily averaged root-mean-square error (black) including standard deviation of FESOM original data and reconstructed signal for 65 modes of principal component synthesis. For better overview, modes 10–65 are zoomed in.
3.1 Data pre-processing
The input of the data production chain is along-track DOT elevations and daily simulated finite-element-formulated DWHs. In order to establish an equal combination basis, both datasets are treated equally. First, they are reduced by their time mean offsets and the most-dominant seasonal (i.e., annual) signal (Müller et al., 2019).
In a second step, the reduced FESOM grids are introduced to a PCA in order to decompose them in a linearly uncorrelated, temporal part (i.e principal components) describing the temporal evolution and in empirical orthogonal functions (EOFs) identifying the most-dominant spatial structures of the time series. They are sorted in a decreasing order with respect to their contribution to the total signal variance. In order to reconstruct the original signal, the principal components and the corresponding EOFs have to be multiplied and summed up. The product of one combination pair is called a mode. This inverse process of PCA is also called principal component synthesis (PCS). PCS is not necessarily always used to reconstruct the full signal; however the approach can be also limited to a certain number of retaining modes, representing a significant percentage of the total signal. Mathematical and functional relations are explained in Jolliffe (2002). In order to determine the number of the most significant EOFs, the root-mean-square error (RMSE) is computed for comparing the original FESOM DWH and the reconstructed signal. The RMSE is computed by (Barnston, 1992)
where l substitutes the original FESOM DWH and r the reconstructed grids of the day t, where the overbar is computed over all grid nodes. Figure 5 shows the evolution of the temporal amount of variance and the temporally averaged RMSE with respect to the individual number of modes. It is decided to use a RMSE threshold of 10 mm, corresponding to 50 modes and a summed variance of more than 99 %. In the following processing steps, only the spatial signals (i.e., EOFs) of FESOM are used. In contrast, the principal components, describing the temporal evolution of the different modes, are neglected.
3.2 Combination
The combination step links the pre-processed along-track DOT heights with the most significant spatial pattern obtained from the PCA of the FESOM differential water heights. The processing is based on daily temporal resolution, including 9 d of radar altimetry data for each time step. The time steps are referred to the mean of a 9 d time span (i.e., t±4.5 d). The combined DOT heights (cDOTs) can be represented by a linear combination of n combined estimated principal components and the obtained EOF grids from FESOM. The functional relation of the PCS is described in Eq. (2):
where n corresponds to the number of significant principal components and empirical orthogonal functions. PCi substitutes the n unknown combined principal components and EOFi(X,Y) the n most-dominant spatial pattern on the FESOM grid (see Sect. 3.1).
The principal components (PCi) are estimated by fitting the model EOFs to the altimetry-derived DOT elevations dotres. Therefore, the EOF grids are interpolated to the observation coordinates based on nearest-neighbor interpolation (NN-Interpolation), resulting in along-track sampled empirical orthogonal functions (eofi(x,y)). The solution for PCi is then given by applying the least-squares method (e.g. Koch, 1999) to Eq. (3):
where dot includes all altimetry-derived DOT heights within ±4.5 d and eofi(x,y) the corresponding along-track interpolated modeled EOFs. The result are n time series of combined principal components.
Furthermore, Gaussian weighting, which considers uncertainties in the altimetry DOT heights due to the presence of sea ice, is introduced to the least-squares process. The individual weights are defined by using an external sea ice concentration from the National Snow and Ice Data Center (NSIDC; Fetterer et al., 2017) interpolated via nearest-neighbor interpolation to the observation coordinates considering an enhanced error budget of altimetry range estimations due to noisier observations within the sea ice area. In a last step, the estimated principal components are introduced to the PCS (Eq. 2) in order to construct a combined DOT solution (cDOT). The individual combination steps are outlined in Fig. 6 and are briefly summarized in chronological order as follows:
-
Separation of reduced FESOM DWH into most-dominant spatial patterns (EOF) and time series of principal components applying PCA. However, the principal components obtained are not used but neglected, since new principal components are estimated from altimetry-derived DOT and most-dominant spatial patterns (EOF) of FESOM in the further combination steps.
-
Nearest-neighbor interpolation of EOF to altimetry along-track observations (x,y) obtaining profiled eof.
-
Least-squares estimation of combined principal components (PCi) by solving Eq. (3) based on altimetry DOT observations (dotres) and interpolated eof.
-
Application of Eq. (2) to obtain the combined DOT (cDOTres) dataset in the FESOM grid (X,Y) based on PCi (step 3) and EOF (step 1). Furthermore, an outlier detection based on an accuracy determination of the combined principal components is performed to reject erroneous combination estimations.
3.3 Data generation
In order to reconstruct the full signal and to rescale the combined heights to the altimetry height reference, the previous subtracted altimetry time mean offset and annual signal are re-added (Sect. 3.1). In the next step, combined geostrophic currents (cGCs) are obtained by computing the zonal (ug) and meridional (vg) geostrophic velocity components at the surface, given by Eq. (4):
where g is the acceleration of gravity (9.832 m s−2), f=2Ωsin ϕ the Coriolis force, ϕ the latitude and Ω the Earth's rotation rate. ∂h denotes the horizontal gradient in x and y direction of cDOT height h. The derivatives and are solved based on the finite-element method (see Appendix B), which prevents further smoothing effects, since no re-gridding to a regular grid is necessary. Furthermore, the geostrophic absolute velocity (Ag), phase ϕg and eddy kinetic energy (EKE) can be computed by applying Eq. (5):
where t substitutes the velocity at a certain time and the overbar indicates the mean velocity for a defined time period (e.g., quarterly).
The combined DOT and geostrophic current velocity fields are based on DOT heights derived from satellite-altimetry and simulated differential water heights from FESOM (Müller et al., 2019). The dataset spans a time period from mid-May 1995 to early April 2012 and covers the investigation area of the northern Nordic Seas limited to 72–82∘ N and −30∘ W–30∘ E. The dataset is saved in NetCDF format. As a result of the combination process, the processed grids are stored in daily temporal and unstructured spatial resolution with local refinements up to 1 km. Missing days in the dataset due to longer periods of missing altimetry observations and unreliable combined principal components are possible. The data product is given in units of meters in the case of DOT and in meters per second for the geostrophic components.
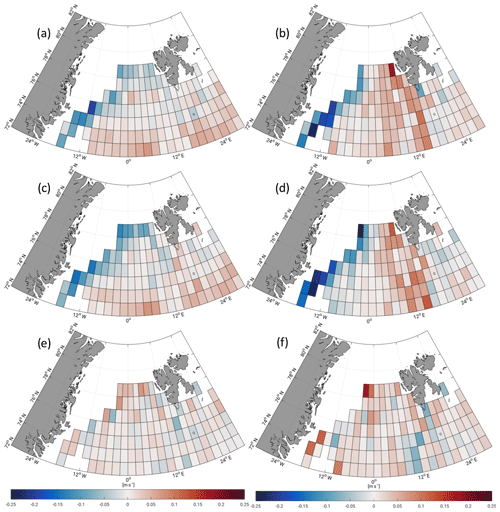
Figure 8Temporally averaged geostrophic u (a, c, e) and v (b, d, f) components of drifter observations (a, b), combined dataset (c, d) and differences (e, f), respectively, binned in (longitude–latitude) boxes within the investigation time (1995–2012).
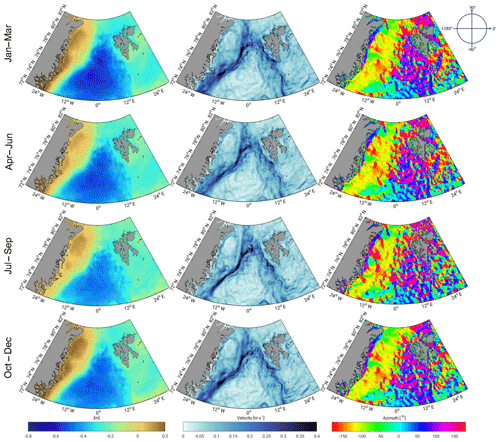
Figure 7 illustrates quarterly averaged daily combined DOT heights and derived geostrophic components expressed in velocity and azimuth. All meshes show the same spatial resolution with local refinements in the central Greenland Sea and Fram Strait region (approx. 1 km) and suggest the finite-element structure of the input model. The 3-monthly averaged cDOT fields vary by circa 1 m across the northern Nordic Seas, with maximum variations in the winter months. Furthermore, the anti-phase relationship in the annual oscillation (Bulczak et al., 2015) between the deep basins and the shelf areas in winter and summer can be seen. The derived geostrophic components show a strong meandering West Spitsbergen Current and a more clear flow structure in the East Greenland Current.
The produced datasets are compared to independent datasets providing daily sampled DOT heights and observations of surface drifter buoys. However, it must be noted that the comparison is challenging, since no dataset can be used as ground truth in the whole study area.
In order to follow a comparison with in situ observations, the combined geostrophic components are spatio-temporally interpolated to surface drifter locations. This enables the analyses of differences between geostrophic currents from observations and from the derived combined product. Therefore, the combination procedure is applied to the drifter epochs. This is done by interpolating the estimated combined principal components linearly to the drifter times followed by a PCS (Eq. 2) and a spatial nearest-neighbor interpolation to the drifter location. The results are combined DOT heights at the drifter observation time and location. In order to compare with the geostrophic drifter measurements, the cDOT heights are transformed into geostrophic velocities (Sect. 3.3). Following Andersson et al. (2011), the drifter observations are grouped into longitude–latitude boxes. In order to perform statistically reliable analyses, only bins with at least two different surface drifters and 50 observations are used (Andersson et al., 2011).
Figure 8 displays temporally averaged u and v components of the drifter observations (Fig. 8a, b) and the combined geostrophic currents (Fig. 8c, d). The differences (Fig. 8e, f) agree well with spatial patterns of the velocity components (i.e., drifter minus combination). The East Greenland and West Spitsbergen Current are resolved by both datasets in both velocity components. The drifter and the cGCs describe the same amplitude and flow direction in most of the bins. However, the v component shows bigger differences than the zonal component, caused mainly by a higher variability due to the primarily meridional flow direction of the currents in this area. Good agreement to the drifter data is shown by slight mean differences of 0.004 m s−1 ± 0.02 m s−1 in the zonal (u) and 0.01 m s−1 ± 0.04 m s−1 in the meridional (v) component.
When computing the RMSE between the measured geostrophic velocities and the combined velocities based on the individual trajectories for each drifter, a mean of 0.127 m s−1 ± 0.034 m s−1 in the case of the u velocity and 0.132 m s−1 ± 0.039 m s−1 for the v velocity are obtained. Moreover, the RMSE may reach 0.225 m s−1 for u and 0.232 m s−1 for v. Higher RMSE values can be found in regions with strong current activity (e.g., WSC).
Figure 9 shows the RMSE distribution of absolute velocity (Eq. 5) for the period 1995–2012 (blue curve). In addition, the same quantity derived based on the altimetry-only ADT currents is plotted in green. Both datasets are characterized by a very similar behavior. Nevertheless, the combination shows smaller residuals; 35 % of the combined residuals are smaller than 0.1 m s−1 in contrast to 27 % of the altimetry-only-derived geostrophic absolute velocity. In general, the results of both datasets are comparable to previous studies of the World Ocean and to Volkov and Pujol (2012), describing a maximal RMSE of around 0.2 m s−1 and a typical range of 0.07 to 0.15 m s−1 for the northern Nordic Seas in both components.
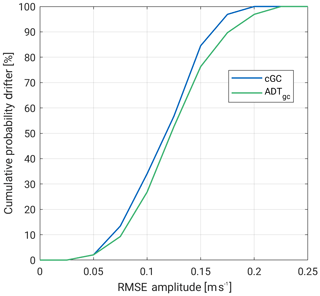
Figure 9RMSE of geostrophic absolute velocity between drifter observations and of the trajectories interpolated combined and ADT datasets from 1995 to 2012.
Figure 10 shows daily 3-monthly averaged EKE of the combined and ADT grids within the investigation period (1995–2012). The EKE results are computed by subtracting 3-month means from the daily datasets (Eq. 5). The ADT appears smoother and shows big data gaps in sea ice regions in comparison to the combined results. Furthermore, the combined eddy fields show finer eddy structures within the sea ice area and close to the Greenland coast. The cGCs are characterized by a higher spatial resolution and more variability in current regions.
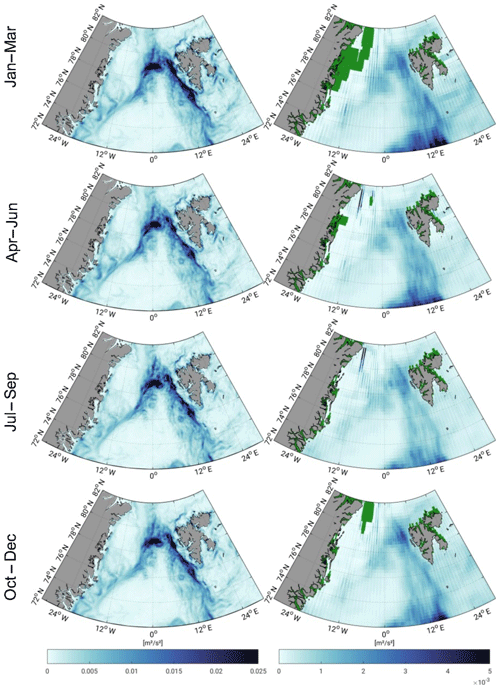
Figure 10Three-monthly averaged geostrophic eddy kinetic energy within the FESOM period (1995–2012) for combined results (left) and ADT grids (right). Green areas indicate missing values.
The cDOT grids are evaluated against the daily and spatial averaged time series of ADT fields. Therefore, the cDOT fields are spatially interpolated to the ADT grids. Figure 11 shows that their mean reduced temporal evolution of both datasets. The comparison covers the full investigation period but is spatially limited to ice-free regions. The time series indicate a positive temporal correlation of nearly 80 %. Both datasets display high-frequency patterns. Compared to the stronger smoothed ADT grids with a standard deviation (SD) of ±0.04 m, the cDOT heights are characterized by a higher variability (SD = ±0.05 m) and display short periodic structures. Nevertheless, a slight offset between the time series between 1995 and 2003 of 2.5 and 2.0 cm between 2003 and 2012 can be observed, which might occur due to a different applied mean epoch of the ADT computation or an unconsidered bias in the retracking procedure of ERS-2 and Envisat.
The final combined dataset can be downloaded from PANGAEA at https://doi.org/10.1594/PANGAEA.900691 (Müller et al., 2019). Envisat (SGDR) and ERS-2 (REAPER-SGDR) altimetry data are available from ESA (Envisat: https://doi.org/10.5270/EN1-85m0a7b – ESA, 2018; ERS-2: https://earth.esa.int/web/guest/-/radar-altimeter-reaper-sensor-geophysical-data-record-sgdr, last access: 24 October 2019 – Brockley et al., 2017). The used FESOM data can be downloaded from PANGAEA at https://doi.org/10.1594/PANGAEA.880569 or requested from Claudia Wekerle (AWI). The model code can be downloaded from https://swrepo1.awi.de/projects/fesom (last access: 24 October 2019) after registration. The in situ drifter observations and ADT grids with additional parameters are available via CMEMS (drifter data: http://resources.marine.copernicus.eu/?option=com_csw&view=details&product_id=INSITU_GLO_UV_L2_REP_OBSERVATIONS_013_044, last access: 13 January 2019 – Rio and Etienne, 2018; ADT: http://resources.marine.copernicus.eu/?option=com_csw&view=details&product_id=SEALEVEL_GLO_PHY_L4_REP_OBSERVATIONS_008_047, last access: 29 March 2019 – Pujol and Mertz, 2019). Data grids of the Ekman and Stokes drift are provided by GlobCurrent at http://globcurrent.ifremer.fr/products-data/data-catalogue (last access: 13 January 2019).
The current paper presents an innovative dataset based on a combination of height observations from satellite altimetry with spatial information provided by an ocean model (FESOM). In case of altimetry data, an open-water classification procedure is applied in order to exploit along-track water height measurements within the sea ice area. Furthermore, height offsets between the open ocean and the sea ice area are removed by using one single retracking algorithm.
The combination approach takes advantage of the principal component analysis, especially the separation of the model data into its most significant spatial patterns and temporal components with respect to the total variability. The 50 most-dominant patterns (EOF) are used to combine them with ERS-2 and Envisat-observed along-track DOT heights in order to fill in observational gaps and to enable investigations based on a homogeneous DOT representation. In detail, the spatial information from FESOM and the temporal variability from altimetry are linked. The height level of the final product is given by altimetry by re-adding the previous estimated and subtracted annual signal and constant offset, since the model height reference is not clearly defined, whereas the obtained spatial resolution is defined by FESOM, which is characterized by local refinements in ocean current active areas smaller than 1 km. The combination is computed on a daily resolution and covers a time span of 17 years (1995–2012).
Geostrophic currents are provided by computing zonal and meridional slope gradients of the finite-element mesh. This allows comprehensive variability analyses of ocean currents not only in open-ocean areas but also within sea ice regions. A comparison with altimetry-only datasets shows that the combination uses enhanced spatio-temporal resolution and displays short periodic structures and missing data gaps, especially in the regions covered by sea ice. Moreover, a positive correlation of nearly 80 % in open-ocean areas can be achieved.
A comparison with in situ surface drifter measurements, although limited to ice-free regions, indicates a similar and realistic representation of ocean current patterns and mesoscale eddies in the area of both datasets under investigation. Furthermore, good agreement in the comparison of binned surface drifter and derived combined geostrophic velocity components has been described.
A direct pointwise comparison for each drifter trajectory indicates a temporal RMSE of the differences between the drifter velocity components and the combination of about 0.13 m s−1. In general, the RMSE values obtained range from 0.05 to 0.10 m s−1 in areas with low-flow activity and up to 0.22 m s−1 in regions with high current energy. Following Volkov and Pujol (2012), these velocities are comparable to previous estimates for the World Ocean.
The presented data product supports long-term studies of the dynamic ocean topography and the ocean current regime in polar regions affected by sea ice. Aiming at a more than 25-year extension of the dataset, more conventional altimetry (Saral and ERS-1) as well as delay–Doppler altimetry data (e.g., Sentinel-3A, Sentinel-3B and CryoSat-2) will be added to the combination process in the future.
-
SSHs: sea surface heights are heights with respect to a reference ellipsoid.
-
SLAs: sea level anomalies are heights with respect to a mean sea level.
-
DOT: dynamic ocean topography describes heights with respect to a geopotential datum (i.e., geoid).
-
ADT: absolute dynamic topography is identical to DOT (nomenclature used by AVISO).
-
DWH: differential water height is simulated water height, with respect to a reference surface similar to the geoid but without considering secular changes (e.g., glacial isostatic adjustment – GIA, ocean bottom topography and self-gravitation). DWH and DOT are closely related.
The FESOM configuration that was used is based on a finite-element formulation. Regarding the spatial discretization, the global ocean is discretized by using tetrahedral elements. These elements are constructed by first generating a surface triangular mesh (x,y). In the vertical, z layers are used. The resulting vertical prisms are then cut into three tetrahedrons. In the finite-element method, variables are approximated as linear combinations of a finite set of basis functions {Ni}. Regarding the choice of these basis functions, FESOM uses a P1–P1 discretization, meaning that piecewise-linear basis functions are employed for both sea surface height η and horizontal velocity and , where N2-D and N3-D denote the number of 2-D and 3-D nodes, respectively. The ith basis function Ni is equal to 1 at node i and linearly vanishes to 0 within elements containing this node.
Derivatives are computed by transformation into a reference element. In 2-D, we consider the reference element defined by nodes , and . As local 2-D basis functions defined on , we choose the first-order polynomials , and , with its Jacobian matrix Any arbitrary element K in the physical domain defined by nodes a1, a2 and a3 can be mapped onto the reference element by affine-linear transformation: F: , , with and d=a1. When computing the gradient of a variable ϕ on the reference element , we obtain . Thus, the gradient in the physical domain can be expressed as .
We now compute the gradient of η on element K by inserting into the above equation: .
FLM processed the combination and wrote most of the paper. DD supervised the present study, contributed to the paper writing and helped with discussions of the results. CW provided the FESOM data and contributed to the paper writing. CS maintains the altimetry database (OpenADB) at DGFI-TUM and supported the discussions. MP developed the retracking algorithm and helped with discussions concerning the altimetry dataset. WB initiated the study. FS supervised the research.
The authors declare that they have no conflict of interest.
The authors thank Hélène Etienne from Collecte Localisation Satellites (CLS) for supporting the study with valuable advice regarding the surface drifter data processing. The authors thank the Chair of Astronomical and Physical Geodesy, Technical University of Munich (TUM), for providing the geoid model, OGMOC. We also thank ESA for providing ERS-2 and Envisat altimetry data, CMEMS for maintaining the ADT grids as well as the surface drifter velocities and GlobCurrent for providing ageostrophic currents (i.e., Ekman and Stokes drift). The simulations were performed at the North-German Supercomputing Alliance (HLRN). This work was mainly supported by the German Research Foundation (DFG). The publication is funded by the German Research Foundation (DFG) and TUM in the framework of the Open Access Publishing Program.
We thank two anonymous reviewers for their valuable comments that helped to improve the paper.
This research was mainly supported by the German Research Foundation (DFG) through grant nos. BO1228/13-1, DE2174/3-1 and TI296/7-2.
This paper was edited by Giuseppe M. R. Manzella and reviewed by two anonymous referees.
Andersson, M., Orvik, K. A., LaCasce, J. H., Koszalka, I., and Mauritzen, C.: Variability of the Norwegian Atlantic Current and associated eddy field from surface drifters, J. Geophys. Res.-Oceans, 116, C08032, https://doi.org/10.1029/2011JC007078, 2011. a, b, c, d
Androsov, A., Nerger, L., Schnur, R., Schröter, J., Albertella, A., Rummel, R., Savcenko, R., Bosch, W., Skachko, S., and Danilov, S.: On the assimilation of absolute geodetic dynamic topography in a global ocean model: impact on the deep ocean state, J. Geodesy, 93, 141–157, https://doi.org/10.1007/s00190-018-1151-1, 2018. a
Armitage, T. W. K., Bacon, S., Ridout, A. L., Thomas, S. F., Aksenov, Y., and Wingham, D. J.: Arctic sea surface height variability and change from satellite radar altimetry and GRACE, 2003–2014, J. Geophys. Res.-Oceans, 121, 4303–4322, https://doi.org/10.1002/2015JC011579, 2016. a
Armitage, T. W. K., Bacon, S., Ridout, A. L., Petty, A. A., Wolbach, S., and Tsamados, M.: Arctic Ocean surface geostrophic circulation 2003–2014, The Cryosphere, 11, 1767–1780, https://doi.org/10.5194/tc-11-1767-2017, 2017. a
Barnston, A. G.: Correspondence among the Correlation, RMSE, and Heidke Forecast Verification Measures; Refinement of the Heidke Score, Weather Forecast., 7, 699–709, doi10.1175/1520-0434(1992)007<0699:CATCRA>2.0.CO;2, 1992. a
Brockley, D. J., Baker, S., Féménias, P., Martínez, B., Massmann, F., Otten, M., Paul, F., Picard, B., Prandi, P., Roca, M., Rudenko, S., Scharroo, R., and Visser, P.: REAPER: Reprocessing 12 Years of ERS-1 and ERS-2 Altimeters and Microwave Radiometer Data, IEEE T. Geosci. Remote, 55, 5506–5514, https://doi.org/10.1109/TGRS.2017.2709343, 2017. a
Bulczak, A. I., Bacon, S., Naveira Garabato, A. C., Ridout, A., Sonnewald, M. J. P., and Laxon, S. W.: Seasonal variability of sea surface height in the coastal waters and deep basins of the Nordic Seas, Geophys. Res. Lett., 42, 113–120, https://doi.org/10.1002/2014GL061796, 2015. a
Church, J. A., White, N. J., Coleman, R., Lambeck, K., and Mitrovica, J. X.: Estimates of the Regional Distribution of Sea Level Rise over the 1950–2000 Period, J. Climate, 17, 2609–2625, https://doi.org/10.1175/1520-0442(2004)017<2609:EOTRDO>2.0.CO;2, 2004. a, b
Danilov, S.: Ocean modeling on unstructured meshes, Ocean Model., 69, 195–210, https://doi.org/10.1016/j.ocemod.2013.05.005, 2013. a
ESA: RA-2 Sensor and Geophysical Data Record – SGDR, https://doi.org/10.5270/en1-85m0a7b, 2018. a
Farrell, S. L., McAdoo, D. C., Laxon, S. W., Zwally, H. J., Yi, D., Ridout, A., and Giles, K.: Mean dynamic topography of the Arctic Ocean, Geophys. Res. Lett., 39, L01601, https://doi.org/10.1029/2011GL050052, 2012. a
Fetterer, F., K., Knowles, W., Meier, M., Savoie, and Windnagel, A. K.: Sea Ice Index, Version 3, north, Boulder, Colorado USA. NSIDC: National Snow and Ice Data Center, https://doi.org/10.7265/N5K072F8, 2017. a
Gruber, T. and Willberg, M.: Signal and Error Assessment of GOCE-based High Resolution Gravity Field Models, Journal of Geodetic Science, accepted, 2019. a
Jolliffe, I. T.: Principal Component Analysis, vol. 2, Springer-Verlag New York, https://doi.org/10.1007/b98835, 2002. a, b
Koch, K.-R.: Parameter Estimation and Hypothesis Testing in Linear Models, Springer Berlin Heidelberg, https://doi.org/10.1007/978-3-662-03976-2, 1999. a
Kwok, R. and Morison, J.: Dynamic topography of the ice-covered Arctic Ocean from ICESat, Geophys. Res. Lett., 38, L02501, https://doi.org/10.1029/2010GL046063, 2011. a
Kwok, R. and Morison, J.: Sea surface height and dynamic topography of the ice-covered oceans from CryoSat-2: 2011–2014, J. Geophys. Res.-Oceans,121, 674–692, https://doi.org/10.1002/2015JC011357, 2015. a
Müller, F. L., Dettmering, D., Wekerle, C., Schwatke, C., Bosch, W., and Seitz, F.: Geostrophic Currents in the northern Nordic Seas – A Combined Dataset of Multi-Mission Satellite Altimetry and Ocean Modeling, Dataset, https://doi.org/10.1594/PANGAEA.900691, 2019. a, b, c
Müller, F. L., Wekerle, C., Dettmering, D., Passaro, M., Bosch, W., and Seitz, F.: Dynamic ocean topography of the northern Nordic seas: a comparison between satellite altimetry and ocean modeling, The Cryosphere, 13, 611–626, https://doi.org/10.5194/tc-13-611-2019, 2019. a, b, c
Müller, F. L., Dettmering, D., Bosch, W., and Seitz, F.: Monitoring the Arctic Seas: How Satellite Altimetry Can Be Used to Detect Open Water in Sea-Ice Regions, Remote Sens., 9, 551, https://doi.org/10.3390/rs9060551, 2017. a
Passaro, M., Kildegaard, S. R., Andersen, O. B., Boergens, E., Calafat, F. M., Dettmering, D., and Benveniste, J.: ALES+: Adapting a homogenous ocean retracker for satellite altimetry to sea ice leads, coastal and inland waters, Remote Sens. Environ., 211, 456–471, https://doi.org/10.1016/j.rse.2018.02.074, 2018. a
Preisendorfer, R. W.: Principal component analysis in meteorology and oceanography, Elsevier Science Pub. Co., Amsterdam, New York, 1988. a
Pujol, M. I. and Mertz, F.: Product User Manual For Sea Level Sla Products, Global Ocean Gridded L4 Sea Surface Heights And Derived Variables Reprocessed (1993–Ongoing), 1.0, available at: http://resources.marine.copernicus.eu/?option=com_csw&view=details&product_id=SEALEVEL_GLO_PHY_L4_REP_OBSERVATIONS_008_047, last access: 29 March, 2019. a, b
Rascle, N. and Ardhuin, F.: A global wave parameter database for geophysical applications. Part 2: Model validation with improved source term parameterization, Ocean Model., 70, 174–188, https://doi.org/10.1016/j.ocemod.2012.12.001, 2013. a
Ray, R. D. and Douglas, B. C.: Experiments in reconstructing twentieth-century sea levels, Prog. Oceanogr., 91, 496–515, https://doi.org/10.1016/j.pocean.2011.07.021, 2011. a, b
Ringler, T., Petersen, M., Higdon, R. L., Jacobsen, D., Jones, P. W., and Maltrud, M.: A multi-resolution approach to global ocean modeling, Ocean Model., 69, 211–232, https://doi.org/10.1016/j.ocemod.2013.04.010, 2013. a
Rio, M.-H. and Etienne, H.: Copernicus in situ TAC, Global ocean delayed mode currents from drifting buoys, Product User Manual – PUM, Report (technical document (specification, manual)), https://doi.org/10.13155/41257, 2018. a, b, c, d
Rio, M.-H. and Hernandez, F.: High-frequency response of wind-driven currents measured by drifting buoys and altimetry over the world ocean, J. Geophys. Res.-Oceans, 108, 3283, https://doi.org/10.1029/2002JC001655, 2003. a
Rio, M.-H., Mulet, S., and Picot, N.: Beyond GOCE for the ocean circulation estimate: Synergetic use of altimetry, gravimetry, and in situ data provides new insight into geostrophic and Ekman currents, Geophys. Res. Lett., 41, 8918–8925, https://doi.org/10.1002/2014GL061773, 2014. a, b, c
Rudels, B.: Arctic Ocean circulation and variability – advection and external forcing encounter constraints and local processes, Ocean Sci., 8, 261–286, https://doi.org/10.5194/os-8-261-2012, 2012. a
Schaffer, J., Timmermann, R., Arndt, J. E., Kristensen, S. S., Mayer, C., Morlighem, M., and Steinhage, D.: A global, high-resolution data set of ice sheet topography, cavity geometry, and ocean bathymetry, Earth Syst. Sci. Data, 8, 543–557, https://doi.org/10.5194/essd-8-543-2016, 2016. a
Volkov, D. L. and Pujol, M.: Quality assessment of a satellite altimetry data product in the Nordic, Barents, and Kara seas, J. Geophys. Res.-Oceans, 117, C03025, https://doi.org/10.1029/2011JC007557, 2012. a, b
Wang, Q., Danilov, S., Sidorenko, D., Timmermann, R., Wekerle, C., Wang, X., Jung, T., and Schröter, J.: The Finite Element Sea Ice-Ocean Model (FESOM) v.1.4: formulation of an ocean general circulation model, Geosci. Model Dev., 7, 663–693, https://doi.org/10.5194/gmd-7-663-2014, 2014. a, b, c, d
Wekerle, C., Wang, Q., von Appen, W.-J., Danilov, S., Schourup-Kristensen, V., and Jung, T.: Eddy-Resolving Simulation of the Atlantic Water Circulation in the Fram Strait With Focus on the Seasonal Cycle, J. Geophys. Res.-Oceans, 122, 8385–8405, https://doi.org/10.1002/2017JC012974, 2017. a, b
- Abstract
- Introduction
- Data
- Method
- Datasets
- Comparison with external datasets
- Data availability
- Summary and conclusions
- Appendix A: Abbreviations and nomenclature of altimetric and FESOM height variables
- Appendix B: Derivation of finite elements in FESOM
- Author contributions
- Competing interests
- Acknowledgements
- Financial support
- Review statement
- References


