the Creative Commons Attribution 4.0 License.
the Creative Commons Attribution 4.0 License.
 | 22 Oct 2019
SM2RAIN–ASCAT (2007–2018): global daily satellite rainfall data from ASCAT soil moisture observations
Paolo Filippucci
Sebastian Hahn
Luca Ciabatta
Christian Massari
Stefania Camici
Lothar Schüller
Bojan Bojkov
Wolfgang Wagner
Long-term gridded precipitation products are crucial for several applications in hydrology, agriculture and climate sciences. Currently available precipitation products suffer from space and time inconsistency due to the non-uniform density of ground networks and the difficulties in merging multiple satellite sensors. The recent “bottom-up” approach that exploits satellite soil moisture observations for estimating rainfall through the SM2RAIN (Soil Moisture to Rain) algorithm is suited to build a consistent rainfall data record as a single polar orbiting satellite sensor is used.
Here we exploit the Advanced SCATterometer (ASCAT) on board three Meteorological Operational (MetOp) satellites, launched in 2006, 2012, and 2018, as part of the European Organisation for the Exploitation of Meteorological Satellites (EUMETSAT) Polar System programme. The continuity of the scatterometer sensor is ensured until the mid-2040s through the MetOp Second Generation Programme. Therefore, by applying the SM2RAIN algorithm to ASCAT soil moisture observations, a long-term rainfall data record will be obtained, starting in 2007 and lasting until the mid-2040s. The paper describes the recent improvements in data pre-processing, SM2RAIN algorithm formulation, and data post-processing for obtaining the SM2RAIN–ASCAT quasi-global (only over land) daily rainfall data record at a 12.5 km spatial sampling from 2007 to 2018. The quality of the SM2RAIN–ASCAT data record is assessed on a regional scale through comparison with high-quality ground networks in Europe, the United States, India, and Australia. Moreover, an assessment on a global scale is provided by using the triple-collocation (TC) technique allowing us also to compare these data with the latest, fifth-generation European Centre for Medium-Range Weather Forecasts (ECMWF) reanalysis (ERA5), the Early Run version of the Integrated Multi-Satellite Retrievals for Global Precipitation Measurement (IMERG), and the gauge-based Global Precipitation Climatology Centre (GPCC) products.
Results show that the SM2RAIN–ASCAT rainfall data record performs relatively well at both a regional and global scale, mainly in terms of root mean square error (RMSE) when compared to other products. Specifically, the SM2RAIN–ASCAT data record provides performance better than IMERG and GPCC in data-scarce regions of the world, such as Africa and South America. In these areas, we expect larger benefits in using SM2RAIN–ASCAT for hydrological and agricultural applications. The limitations of the SM2RAIN–ASCAT data record consist of the underestimation of peak rainfall events and the presence of spurious rainfall events due to high-frequency soil moisture fluctuations that might be corrected in the future with more advanced bias correction techniques.
The SM2RAIN–ASCAT data record is freely available at https://doi.org/10.5281/zenodo.3405563 (Brocca et al., 2019) (recently extended to the end of August 2019).
- Article
(5089 KB) - Full-text XML
- BibTeX
- EndNote


Rainfall is ranked the first among the Essential Climate Variables by the Global Climate Observing System (GCOS) as it represents the most important variable in many applications in the geosciences (Maggioni and Massari, 2018). Long-term rainfall records are essential for drought monitoring (e.g. Forootan et al., 2019), water resource management (e.g. Abera et al., 2017), and climate studies (e.g. Herold et al., 2016; Pendergrass and Knutti, 2018), while near-real-time rainfall data are needed for the mitigation of the impacts of natural disasters such as floods and landslides (e.g. Wang et al., 2017; Camici et al., 2018; Brunetti et al., 2018; Kirschbaum and Stanley, 2018). Additional applications in which near-real-time rainfall plays a crucial role are weather forecasting, agricultural planning, and vector-borne and waterborne disease monitoring (e.g. Rinaldo et al., 2012; Thaler et al., 2018).
Three different techniques can be used for estimating rainfall: ground measurements, meteorological modelling, and remote sensing. Ground measurements are based on rain gauges and meteorological radars (Lanza and Vuerich, 2009), but also new approaches such as microwave links are being developed (e.g. Overeem et al., 2011). These measurements guarantee high accuracy, but they suffer in many regions from limited spatial coverage (Kidd et al., 2017). Alternatively, meteorological models are used to estimate rainfall mainly in areas without reliable ground observations (Ebert et al., 2007), e.g. reanalysis. The uncertainties associated with these estimates can be large, mainly in areas where ground observations are scarce (Massari et al., 2017a). Therefore, to fill the gaps in the spatial coverage of ground measurements and to improve the estimates obtained by models, different remote-sensing techniques have been developed in the last 30 years (Hou et al., 2014). The standard methods for estimating rainfall from space are based on instantaneous measurements obtained from microwave radiometers, radars, and infrared sensors (Kidd and Levizzani, 2011). These methods are based on inversion techniques where the upwelling radiation (or backscattered signal for radars) is related to the surface precipitation rate, i.e. a “top-down” approach (Brocca et al., 2014).
The most recent and successful example of satellite precipitation estimates is represented by the Integrated Multi-Satellite Retrievals for Global Precipitation Measurement (GPM) (IMERG) of the GPM mission (Hou et al., 2014), which provide a high spatial (0.1∘) and temporal (30 min) resolution and quasi-global coverage (±60∘). To obtain such a resolution and coverage, the IMERG products use a constellation of polar and geostationary satellite sensors operating in the microwave and infrared bands. However, the use of multiple sensors has some problems including the inconsistency between rainfall estimates from different sensors (intercalibration problem), the difficulties in collecting observations from multiple space agencies (i.e. problem of delivering the products in near-real time), and the high costs for the operation and the maintenance of the overall constellation. Moreover, as the top-down approach requires the merging of instantaneous rainfall measurements from multiple sensors, the failure of one of them may imply a significant degradation in the accuracy of the accumulated rainfall estimate due to the high temporal variability of rainfall (Trenberth and Asrar, 2014).
In recent years, a new “bottom-up” approach has emerged that uses satellite soil moisture observations to infer, or to correct, rainfall over land (Brocca et al., 2013a; Crow et al., 2009; Pellarin et al., 2013; Wanders et al., 2015). The major difference between the bottom-up and top-down approaches is in the type of measurement, i.e. accumulated rainfall rates with the bottom-up method and instantaneous rainfall rates with the top-down method. This difference makes the two approaches highly complementary and their integration has already been successfully tested and demonstrated in several recent studies (e.g. Brocca et al., 2016; Ciabatta et al., 2017; Chiaravallotti et al., 2018; Massari et al., 2019). When accumulated rainfall estimates are needed (e.g. daily rainfall), the bottom-up approach has the advantage of requiring a much lower number of measurements and, hence, of satellite sensors. The limitations of the bottom-up approach are the possibility to estimate only terrestrial rainfall and its dependence on land characteristics (e.g. low accuracy for dense vegetation coverage and complex topography; Brocca et al., 2014).
The bottom-up approach has been applied over a range of scales: global (Crow et al., 2011; Brocca et al., 2014; Ciabatta et al., 2018), continental (Wanders et al., 2015; Brocca et al., 2016), and local (Massari et al., 2014; Brocca et al., 2015; Román-Cascón et al., 2017). Moreover, different satellite soil moisture products have been considered including the SMOS (Soil Moisture Ocean Salinity mission; Brocca et al., 2016), ASCAT (Advanced SCATterometer; Brocca et al., 2017), AMSR-E (Advanced Microwave Scanning Radiometer; Crow et al., 2009), and SMAP (Soil Moisture Active and Passive; Koster et al., 2016; Tarpanelli et al., 2017; Zhang et al., 2019). The first studies employing satellite rainfall estimates obtained through the bottom-up approach for hydrological and water resources applications have been recently published (e.g. Ciabatta et al., 2016; Abera et al., 2017; Brunetti et al., 2018; Camici et al., 2018). These studies have highlighted the large potential of this technique as a complementary and useful approach for estimating rainfall from space, and they have also shown its main limitations. Specifically, the temporal resolution and the accuracy of satellite soil moisture products play a fundamental role in determining the accuracy of the bottom-up rainfall estimates.
In this study, we describe the newly developed SM2RAIN–ASCAT (Soil Moisture to Rain) rainfall data record covering the period 2007–2018 and characterized by a spatial and temporal sampling of 12.5 km d−1. The new SM2RAIN–ASCAT data record is obtained from the application of the SM2RAIN algorithm (Brocca et al., 2014) to the ASCAT soil moisture data records H113 and H114 provided by the European Organisation for the Exploitation of Meteorological Satellites (EUMETSAT) Satellite Application Facility on Support to Operational Hydrology and Water Management (H SAF). It is the first SM2RAIN–ASCAT data record available at the same spatial resolution as the ASCAT soil moisture product (previous data records have been under-sampled at a 0.5 and 1∘ resolution). Moreover, we have included the latest improvements in the pre- and post-processing of soil moisture and rainfall data as well as of the SM2RAIN algorithm. The main differences with the SM2RAIN–CCI (Climate Change Initiative) rainfall data record (Ciabatta et al., 2018) are the input soil moisture product (the inputs of SM2RAIN–CCI are from the European Space Agency Climate Change Initiative Soil Moisture, ESA CCI soil moisture, product; Dorigo et al., 2017) and the time coverage (SM2RAIN–CCI spans the period 1998–2015). Technically, the use of the same satellite sensor in the SM2RAIN–ASCAT data record is preferable to ensure consistency between soil moisture estimates over time to which the SM2RAIN algorithm is highly sensitive.
The purpose of this study is twofold. As a first objective, we have applied SM2RAIN algorithm at 1009 uniformly distributed points (with a spacing of 1.5∘) in the United States, Italy, India, and Australia for testing different configurations of data pre- and post-processing and SM2RAIN model equation. This analysis has allowed us to select the best configuration that is implemented on a global scale for obtaining the SM2RAIN–ASCAT data record. The second objective is the assessment of the global scale SM2RAIN–ASCAT data record through the comparison with reference datasets and by exploiting the triple-collocation (TC) approach (Massari et al., 2017a). As reference datasets we have used high-quality local rain gauge networks from 2013 to 2017 in the United States, Italy, India, and Australia for the assessment at 1009 points and for the regional assessment. Three additional global datasets have been considered: the latest, fifth-generation reanalysis of the European Centre for Medium-Range Weather Forecasts (ECMWF), ERA5, the gauge-based Global Precipitation Climatology Centre (GPCC), and the GPM IMERG product (Early Run version). ERA5 has been used for the generation of the quasi-global SM2RAIN–ASCAT data record; GPCC and GPM IMERG have been considered for the TC analysis.
We underline that the paper goal is to present and describe the SM2RAIN–ASCAT quasi-global rainfall data record and to perform a comparison with state-of-the-art global rainfall products. We do not want to show a comprehensive assessment of the product. Indeed, we believe that researchers other than the product developers should perform the validation of the dataset. Even better, we stress the importance of performing the validation by using the datasets in hydrological or agricultural applications (e.g. flood prediction and agricultural water management).
Nine different datasets have been collected for this study, which are based on remote sensing, ground observations, and reanalysis. Refer to Table 1 for a summary of the datasets.
Table 1List of satellite, ground-based, and reanalysis products used in this study (the spatial and temporal sampling used in this study is reported).

The main input dataset for producing the SM2RAIN–ASCAT data record is the ASCAT soil moisture data record provided by the EUMETSAT H SAF (http://hsaf.meteoam.it/, last access: 11 February 2019). ASCAT, currently on board the MetOp-A (Meteorological Operational; launched in October 2006), MetOp-B (September 2012), and MetOp-C (November 2018) satellites, is a scatterometer operating on the C-band (5.255 GHz), and by using the TU Wien algorithm (Wagner et al., 2013), the H SAF provides a soil moisture product characterized by a 12.5 km spatial sampling. The temporal sampling varies as a function of latitude and the number of satellites: by using MetOp-A only a daily sampling is obtained; by using MetOp-A and MetOp-B two observations per day are available at mid-latitudes. Here we have used the H SAF–ASCAT soil moisture data record (using MetOp-A and MetOp-B) available through the product H113 (PUM, 2018) covering the period 2007–2017 and its extension product H114 for the year 2018.
Three datasets obtained from the latest reanalysis of the ECMWF, i.e. ERA5, have been used. The ERA5 reanalysis is characterized by a spatial resolution of ∼36 km and hourly temporal resolution. ERA5 is available from the Copernicus Climate Change service, and the datasets cover the period 1979 to present. We have extracted hourly observations for the period 2007–2018 for three variables: evaporation, soil temperature for the first layer (0–7 cm), and total rainfall (computed as the difference between total precipitation and snowfall). Evaporation data are used as an additional input into the SM2RAIN algorithm, and soil temperature data are used for masking periods with frozen soils. Total rainfall has been considered as a benchmark for the calibration of global SM2RAIN parameter values (see next section).
Ground-based rainfall datasets from regional networks have been also collected including the Climate Prediction Center (CPC) Unified Gauge-Based Analysis of Daily Precipitation in the United States, the gridded rainfall data provided by ∼3000 stations of the National Department of Civil Protection in Italy (Ciabatta et al., 2017), the India Meteorological Department (IMD, http://www.imd.gov.in/pages/services_hydromet.php, last access: 11 February 2019) rainfall observations in India, and the Australia Water Availability Project (AWAP, http://www.bom.gov.au/jsp/awap/rain/index.jsp, last access: 11 February 2019) gridded rainfall data in Australia. These datasets have been firstly used for the selection of the optimal configuration of the SM2RAIN implementation. For that, 1009 uniformly distributed points over the four regions have been selected. Secondly, the regional networks have been used for the assessment of the global SM2RAIN–ASCAT rainfall product at a regional scale.
The ERA5 and local rainfall datasets have been regridded over the ASCAT grid (12.5 km) through the nearest neighbouring method and resampled at a daily timescale as accumulated rainfall from 00:00 to 23:59 UTC. The ERA5 evaporation and soil temperature data are also regridded to the same grid and aggregated at a daily scale as accumulated and average values from 00:00 to 23:59 UTC, respectively.
For the global assessment of SM2RAIN–ASCAT, two additional rainfall datasets have been considered: the Global Precipitation Climatology Centre Full Data Daily Product (Schamm et al., 2015) and GPM IMERG Early Run product (Hou et al., 2014), hereinafter referred to as GPM-ER. Due to the availability of GPM-ER from April 2014, the global analysis has been carried out in the 4-year period from January 2014 to December 2018. Moreover, for the global inter-comparison all the datasets (SM2RAIN–ASCAT, ERA5, GPCC, and IMERG-ER) have been regridded at a 0.25∘ resolution by spatially averaging the pixels contained in each 0.25∘ cell for SM2RAIN–ASCAT and GPM-ER and by selecting the nearest pixel for ERA5 and GPCC.
In the following, the methodology used for obtaining the SM2RAIN–ASCAT data record is described. Specifically, three steps are carried out (see Fig. 1): (1) surface soil moisture data pre-processing, (2) employing the SM2RAIN algorithm, and (3) rainfall data post-processing. Different configurations for the data pre- and post-processing and for the SM2RAIN model equation are considered; the details are given in Table 2.

Figure 1Processing steps for obtaining the SM2RAIN–ASCAT global rainfall data record (2007–2018) from ASCAT surface soil moisture data: pre-processing, SM2RAIN algorithm, and post-processing. Each bullet represents a possible configuration that has been tested; the selected configuration is in a red, bold font.
Table 2Configurations used in the paper (SWI – soil water index, BCO – Brooks–Corey, VGEN – van Genuchten, MUA – Mualem–van Genuchten, SWI-Tvar – SWI with T varying with soil moisture, WAV – wavelet filtering, CDF – climatological correction with daily cumulative density function matching, and MON – climatological correction with monthly correction factors).

3.1 Soil moisture data pre-processing
The ASCAT surface soil moisture product is provided as relative soil moisture (between 0 and 1) at the overpass time of the satellite sensor (see Fig. A1 in the Appendix) for the mean daily revisit time of ASCAT. The period 2007–2012 only had MetOp-A data, while the period 2013–2018 had data from both MetOp-A and MetOp-B. For the application of the SM2RAIN algorithm, data should be equally spaced in time, and hence, we have linearly interpolated in time soil moisture observations every 24, 12 and 8 h. The interpolation may increase the risk of false rainfall events, but it is a required step to obtain accumulated rainfall over a fixed duration. In a preliminary test (not shown for brevity), we tested the three sampling frequencies with the baseline formulation for SM2RAIN (Eq. 6, see below). The best performance results were obtained with a 12 h sampling, particularly from 2013 to 2018, in which both MetOp-A and MetOp-B are available. Therefore, 12 h sampling has been used in the following analyses. The 24 h accumulated rainfall is obtained by summing the two 12 h accumulated rainfall datasets obtained for each day.
One of the major problems in using satellite soil moisture observations for rainfall estimation is related to the high-frequency fluctuations caused by measurement and retrieval errors. If positive, such fluctuations are interpreted erroneously as rainfall by the SM2RAIN algorithm. Therefore, satellite surface soil moisture data need to be filtered before being used as an input into SM2RAIN. In previous studies, the exponential filtering has been considered (Wagner et al., 1999). The exponential filter, also known as the soil water index (SWI), has been used for filtering surface soil moisture time series as a function of a single parameter, T, i.e. the characteristic time length. In this study, we have tested two additional filtering methods. The first one is an extension of the exponential filter in which the T parameter is assumed to be varying with soil moisture as proposed in Brocca et al. (2013b). Specifically, T decreases with increasing soil moisture through a 2-parameter power law. Therefore, the data are filtered more during dry conditions. The third approach that we have implemented is a discrete wavelet filter (similar to Massari et al., 2017b). The discrete wavelet filter cuts the higher frequencies of the signal, typically characterized by noises, over a threshold selected through the principle of Stein's unbiased risk at multiple levels. We have found the Daubechies wavelets to be the most appropriate functions because their shape and the shape of the soil moisture signal is similar. Therefore, we have implemented a Daubechies-based wavelet filter in which the filtering level is optimized.
For all the filtering approaches, the parameter values of the filters have been optimized point-by-point in order to reproduce the reference rainfall observations.
3.2 SM2RAIN algorithm and calibration
The SM2RAIN algorithm is based on the inversion of the soil water balance equation and allows to estimate the amount of water entering the soil by using soil moisture observations from in situ or satellite sensors as an input (e.g. Brocca et al., 2013a, 2014, 2015; Koster et al., 2016; Ciabatta et al., 2017; Massari et al., 2014). Specifically, the soil water balance equation can be described by the following equation (over non-irrigated areas):
where n (–) is the soil porosity, Z (mm) is the soil layer depth, S(t) (–) is the relative saturation of the soil or relative soil moisture, t (d) is the time, p(t) (mm d−1) is the rainfall rate, g(t) (mm d−1) is the drainage (deep percolation plus subsurface runoff) rate, sr(t) (mm d−1) is the surface runoff rate, and e(t) (mm d−1) is the actual evapotranspiration rate.
For estimating the rainfall rate, Eq. (1) is applied only during rainfall periods, and, hence, some of the components of the equation can be considered as negligible. For instance, the actual evapotranspiration rate during rainfall is quite low due to the presence of clouds and, hence, the absence of solar radiation. Similarly, the surface runoff rate, i.e. the water that does not infiltrate into the soil and flows at the surface to the watercourses, is much lower than the rainfall rate, mainly if Eq. (1) is applied at a coarse spatial resolution (20 km), i.e. with satellite soil moisture data. Indeed, most of the water becomes runoff flowing in the subsurface, and also the part that does not infiltrate, due to for instance impervious land cover or soil, may re-infiltrate downstream within a pixel at a 20 km scale. We have indirectly tested this hypothesis by counting the number of days the ASCAT soil moisture product is higher than the 99.5 percentile for 2 (or more) consecutive days in the period 2007–2018. We have indirectly tested this hypothesis by counting the number of days the ASCAT soil moisture product is higher than the 99.5 percentile for 2 (or more) consecutive days in the period 2007–2018. We have found that the number of consecutive days in which the soil is saturated is equal to 4 d (median value on a global scale) over 12 years, with 90 % of the land pixels with values lower than 12 d (i.e. 1 d yr−1). The occurrence of higher values is limited to very few areas in the tropical forests and over the Himalayas (see Fig. A2).
Following the indications obtained in Brocca et al. (2015), we have assumed that the surface runoff rate, sr(t), is negligible (i.e. Dunnian runoff), and we have rearranged Eq. (2) for estimating the rainfall rate.
In this study, we have considered different formulations for Eq. (2) by varying the drainage rate as
where Ks (mm d−1) is the saturated hydraulic conductivity, m (–) and λ (–) are exponents related to the pore size distribution index, and τ is the tortuosity index. Specifically, the three equations represent the hydraulic conductivity – soil moisture formulation by Brooks–Corey (Eq. 3a), van Genuchten (Eq. 3b), and Mualem–van Genuchten (Eq. 3c).
The actual evapotranspiration rate has been considered as an additional input, together with soil moisture, here obtained from the ECMWF reanalysis, ERA5.
where ETERA5(t) (mm d−1) is the actual evapotranspiration rate obtained from the ERA5 reanalysis and Kc (–) is a correction factor for taking into account potential bias in the ERA5 estimates.
Moreover, we have considered an additional formulation in which Z is a function of soil moisture taking into account the different penetration depth of satellite sensors as a function of wetness conditions.
where the c exponent determines the rate of decrease of the penetration depth with increasing soil moisture.
Accordingly, we have used different formulations for Eq. (2) that are compared with the baseline equation used in previous studies (e.g. Brocca et al., 2014).
In synthesis, we have investigated three different configurations (for a total of five options) for (1) selecting the best equation for the drainage rate (Eq. 3), (2) testing the possibility to include the evapotranspiration component (Eq. 4), and (3) testing the use of a variable penetration depth with soil moisture conditions (Eq. 5). Each new configuration has been compared with the baseline (Eq. 6) in order to select the best configuration for the SM2RAIN algorithm (see Fig. 1). For all configurations, negative rainfall values, that might occur during some dry-down cycles, have been set equal to zero.
SM2RAIN parameter values are calibrated point-by-point by using the reference rainfall as the target. As an objective function, we have used the minimization of the root mean square error (RMSE) between the SM2RAIN–ASCAT and reference rainfall.
3.3 Rainfall data post-processing
The use of satellite soil moisture observations for obtaining rainfall estimates is affected by errors in the input data and in the retrieval algorithm SM2RAIN. The correction of the overall bias in the climatology is a simple and effective approach for mitigating a part of such errors. Specifically, we refer here to a static correction procedure, which once calibrated for a time period can be applied in future periods and for operational real-time productions. We note that a climatological correction is performed in several satellite rainfall datasets delivered in near real time (e.g. GPM-ER). We have implemented two different approaches for climatological correction: (1) a cumulative density function (CDF) matching approach at a daily timescale and (2) a monthly correction approach. Specifically, the implemented CDF matching approach is a 5th-order polynomial correction as described in Brocca et al. (2011) for matching the CDF of estimated rainfall with respect to reference rainfall, in which the CDF values are computed over the whole calibration period at a daily timescale. The monthly correction approach computes the monthly ratios between the climatology of estimated and reference rainfall, i.e. 12 correction factors per pixel. Then, the SM2RAIN-estimated rainfall is multiplied for the monthly correction factors to obtain the climatologically corrected SM2RAIN-estimated rainfall.
3.4 Triple-collocation analysis
For the global assessment of satellite, reanalysis, and gauge-based rainfall products we have used the triple-collocation technique. TC can theoretically provide error and correlations of three products (a triplet) given that each of the three products is afflicted by mutually independent errors. Therefore, in principle, TC can be used for assessing the quality of satellite products without using ground observations (Massari et al., 2017a). In this study, we have implemented the same procedure as described in Massari et al. (2017a), i.e. by implementing an additive error model at a daily timescale, and we refer the reader to this study for the analytical details. In synthesis, by using the extended TC method firstly proposed by McColl et al. (2014), it is possible to estimate the temporal correlation, RTC, of each rainfall product in the triplets with the true values.
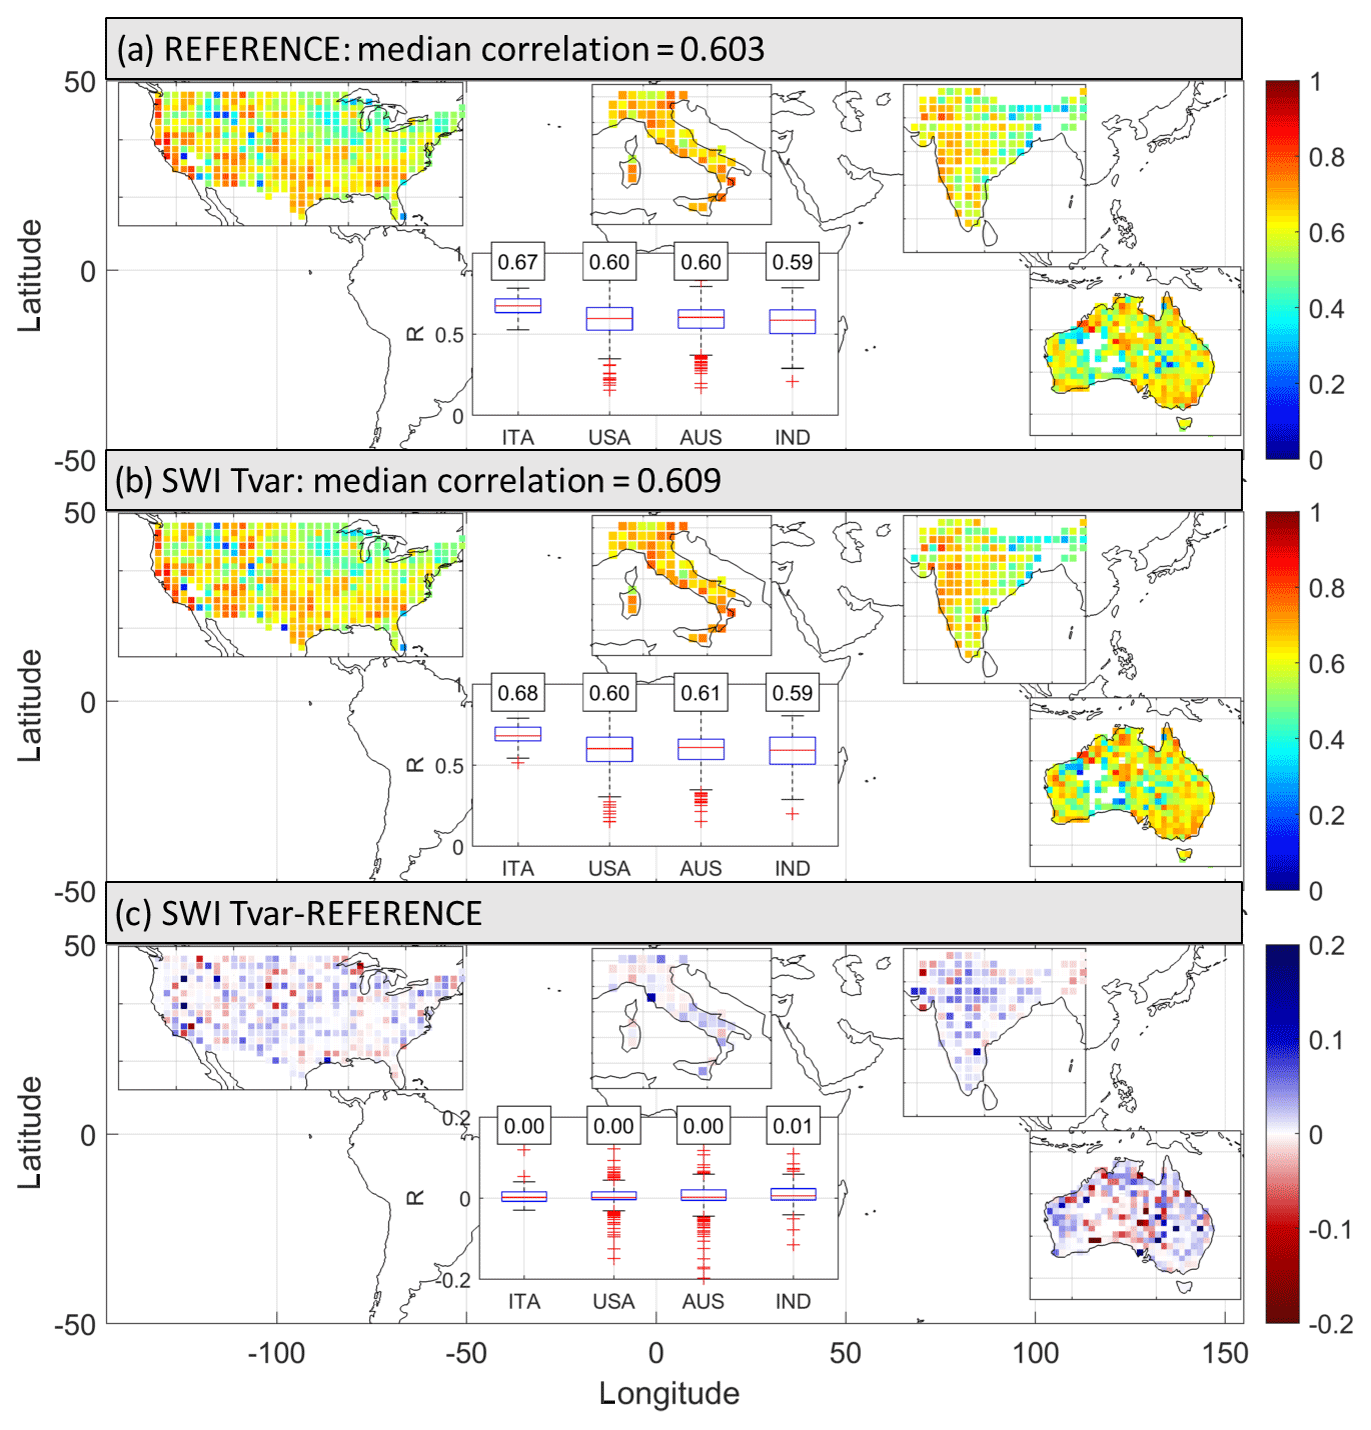
Figure 2Performance of two different configurations at 1009 points in terms of Pearson's correlation, R (–). (a) R map with reference configuration, (b) R map with soil water index (SWI) filtering with the variable T as a function of soil moisture, and (c) R map difference (b–a). The inner box plots show the R values (and R differences) split for different regions.
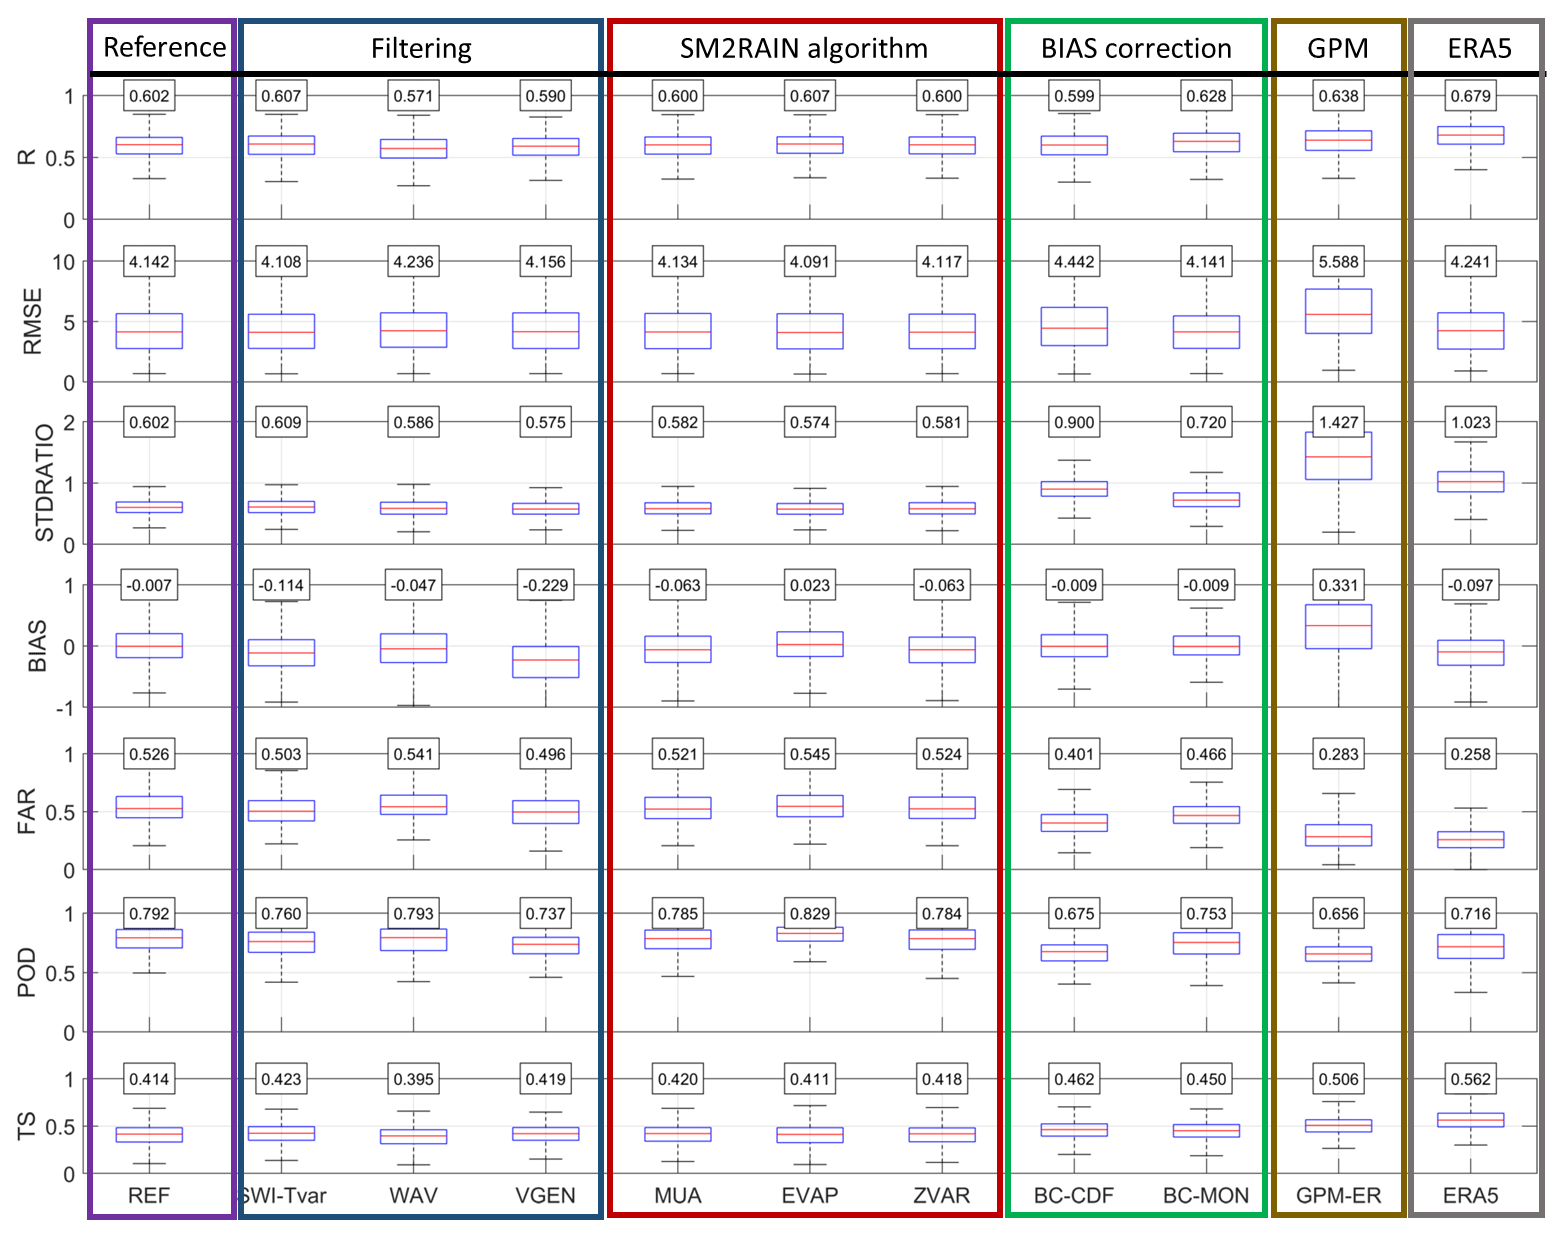
Figure 3Performance at 1009 points in terms of Pearson's correlation, R (–), root mean square error, RMSE (mm d−1), the variability ratio, STDRATIO (–), the mean error between estimated and reference rainfall, BIAS (mm d−1), the false alarm ratio, FAR (–), the probability of detection, POD (–), and the threat score, TS (–). For details about the different configurations see Table 2 (GPM-ER: GPM IMERG Early Run product).
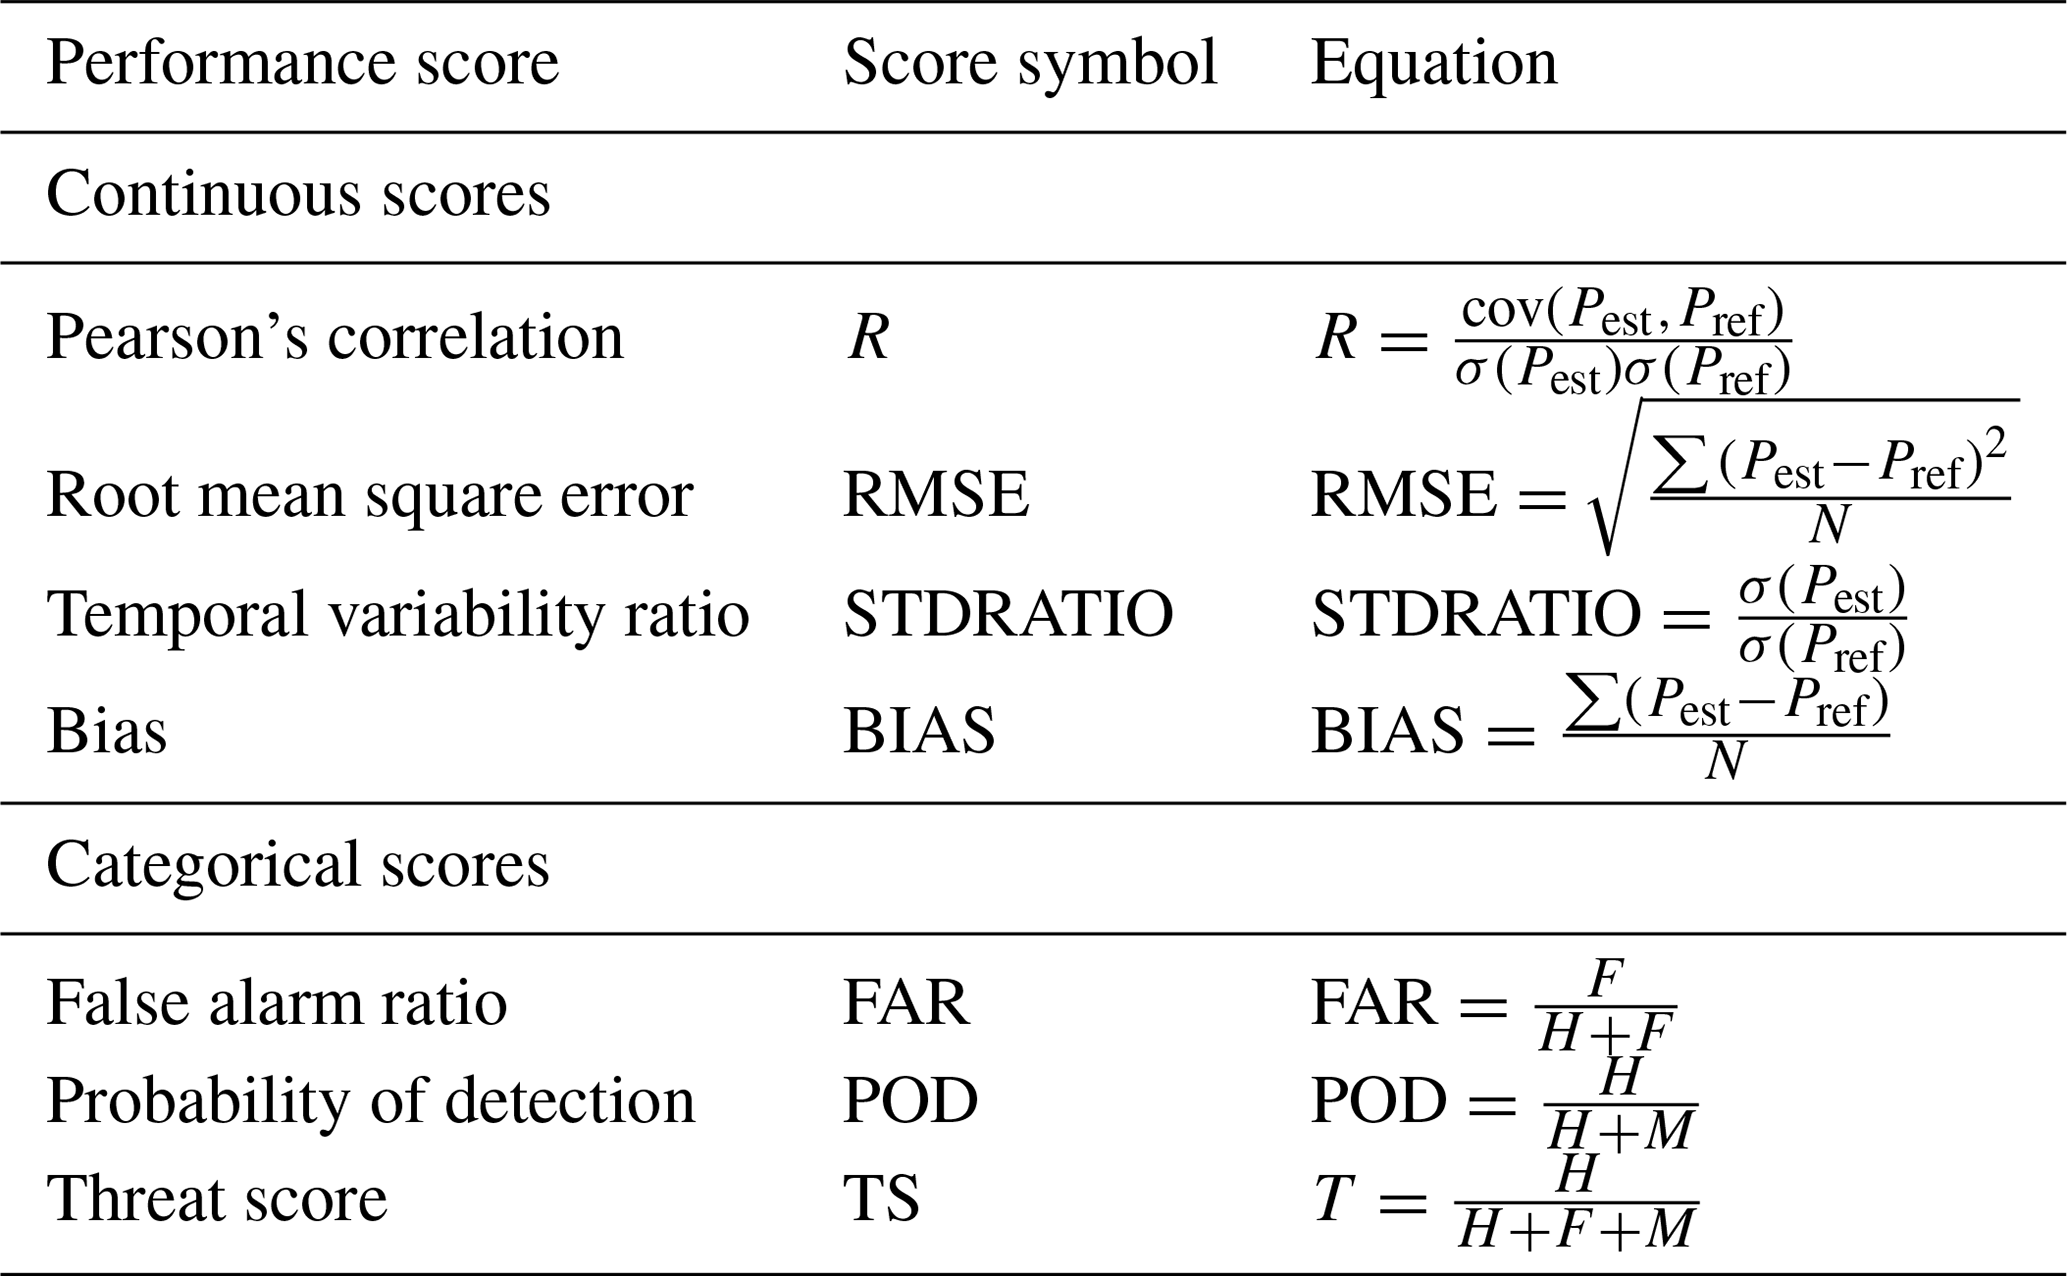
3.5 Performance scores
Several metrics have been used to assess the product performance during the validation period. As continuous scores we have computed the Pearson's correlation coefficient (R), the RMSE, the mean error between estimated and reference rainfall (BIAS), and the ratio of temporal variability of estimated and reference rainfall (STDRATIO). Continuous scores have been computed on a pixel-by-pixel basis by considering 1 d of accumulated rainfall. Moreover, three categorical scores, i.e. the probability of detection (POD), false alarm ratio (FAR), and threat score (TS), have been computed. POD is the fraction of correctly identified rainfall events (optimal value POD =1), FAR is the fraction of predicted events that are non-events (optimal value FAR =0), while TS provides a combination of the other two scores (optimal value TS =1). The categorical assessment is carried out by considering a rainfall threshold of 0.5 mm d−1 (instead of 0 mm d−1) in order to exclude spurious events that might be due to rainfall interpolation or regridding in the reference datasets. For a complete description of the performance scores, see Table A1 in the Appendix.
The results are split in three parts: (1) selection of the optimal configuration of SM2RAIN through the assessment at 1009 points, (2) generation of the global SM2RAIN–ASCAT rainfall data record, and (3) regional assessment of the SM2RAIN–ASCAT data with gauge-based rainfall datasets and global assessments through TC.
4.1 Selection of the best SM2RAIN processing configuration at 1009 points
As a first step we have collocated satellite soil moisture data from ASCAT soil moisture H113 and H114, ground-based rainfall observations, and actual evapotranspiration data from ERA5 in space and time at 1009 points. We have selected 1009 uniformly distributed points over a regular grid with a spacing of 1.5∘. Each point is considered representative of a box. The selection is carried out for reducing the computational time in running the different SM2RAIN configurations. The number of points for each region depends on the size of the region: 328 points in Australia, 163 in India, 55 in Italy, and 463 in the United States. Ground observations and GPM-ER and ERA5 data are regridded by spatial averaging measurements contained over each box. These datasets are freely available (https://doi.org/10.5281/zenodo.2580285, Brocca, 2019) to those interested in testing alternative approaches for rainfall estimation from ASCAT soil moisture data. Specifically, we have considered the periods 2013–2016 and 2013–2014 for the calibration and 2015–2016 for the validation; in the following series only the results in the validation period are shown. The ground-based high quality rainfall observations available for the four regions are used as reference data (ground truth) in this analysis. The reference configuration, REF, as used in previous SM2RAIN applications (e.g. Brocca et al., 2014), uses the SWI for data filtering, the SM2RAIN formulation as in Eq. (6), and no climatological correction. Results in the validation period are shown in Fig. 2a in terms of temporal R against reference data. As shown, the median R for all points is equal to 0.60, with better results in Italy (median R=0.67, see boxplots) and similar results in the other three regions (median R=0.60 and 0.59). These results are in line with previous studies (e.g. Ciabatta et al., 2017; Tarpanelli et al., 2017) carried out in Italy and India and highlight the potential of ASCAT soil moisture observations to provide daily rainfall estimates. Figure 3 (first column) shows the results for the different performance metrics; in the last two columns the results obtained with GPM-ER and ERA5 are shown for comparison. Very good statistics have been obtained in terms of RMSE and BIAS, but a tendency exists to underestimate the observed rainfall variability (median STDRATIO =0.60), and there is a medium-high probability of incorrectly estimating the false alarm statistic (median FAR =0.53). The other scores are similar to, or slightly lower than, those obtained through the GPM-ER and ERA5.
The first test has been dedicated to the filtering of soil moisture data by using three approaches: (1) SWI, i.e. the REF configuration, (2) SWI with T varying with soil moisture, SWI-Tvar, and (3) the discrete wavelet filtering, WAV. Figure 3 shows in the first three columns the summary of the performance scores highlighting that the SWI-Tvar configuration is performing the best, even though the differences with the REF configuration are small. Figure 2b shows the R map for the SWI-Tvar configuration, while in Fig. 2c the differences in R values with REF are displayed. Improved performance in terms of R is visible over most of the pixels except in central Australia.
The second test has been performed on the SM2RAIN equation by using different drainage functions (VGEN and MUA configurations), by adding the evapotranspiration component (EVAP) and considering the variability of the sensing depth, Z, with soil moisture (ZVAR). The VGEN, MUA, and ZVAR configurations are characterized by lower performance than REF (see Fig. 3, columns 4, 5, and 7), even though MUA and ZVAR incorporate an additional parameter to be calibrated (and, hence, better performance was expected). The addition of evapotranspiration brings a slight improvement with respect to REF (see Fig. 3, column 6), with results similar to SWI-Tvar. Larger improvements are obtained over areas in which evapotranspiration is more important, e.g. in the south-western United States and central western Australia. In India and Italy, the results are very similar to REF. However, EVAP configuration requires actual evapotranspiration data from ERA5 as an additional input, and such data might be not available for the implementation of the processing algorithm in an operational context.
The final test has been done by applying the daily CDF matching, BC-CDF, and monthly correction factors, BC-MON, for correcting the climatological bias in the SM2RAIN-derived rainfall estimates; results are shown in columns 8 and 9 of Fig. 3. For these two configurations, the improvements with respect to REF are evident but with different magnitude for the different scores. The BC-CDF significantly improves, while STDRATIO, TS, and FAR show a slight deterioration in R and RMSE. BC-MON shows the highest R values among all configurations with the larger improvements in India, Italy, and the United States. However, the improvement in terms of STDRATIO, TS, and FAR is less important than BC-CDF. Therefore, depending on which score is assumed to be more important, one of the two configurations can be selected. If compared with GPM-ER, BC-CDF and BC-MON configurations show similar results with larger positive differences in terms of RMSE, BIAS, STDRATIO, and POD; R values are slightly better for GPM-ER, which is also much better in terms of TS and FAR. Similar findings can be summarized in the comparison with ERA5, even though ERA5 is performing the best in terms of R, STDRATIO, FAR, and TS among all configurations.
Figure 4 shows the time series of rainfall averaged over the four regions as obtained from ground observations and from the BC-MON configuration. The agreement of spatially averaged rainfall with observations is high with R values greater than 0.83 and very low BIAS values. Moreover, regional-scale rainfall events are correctly reproduced both in terms of timing and magnitude.
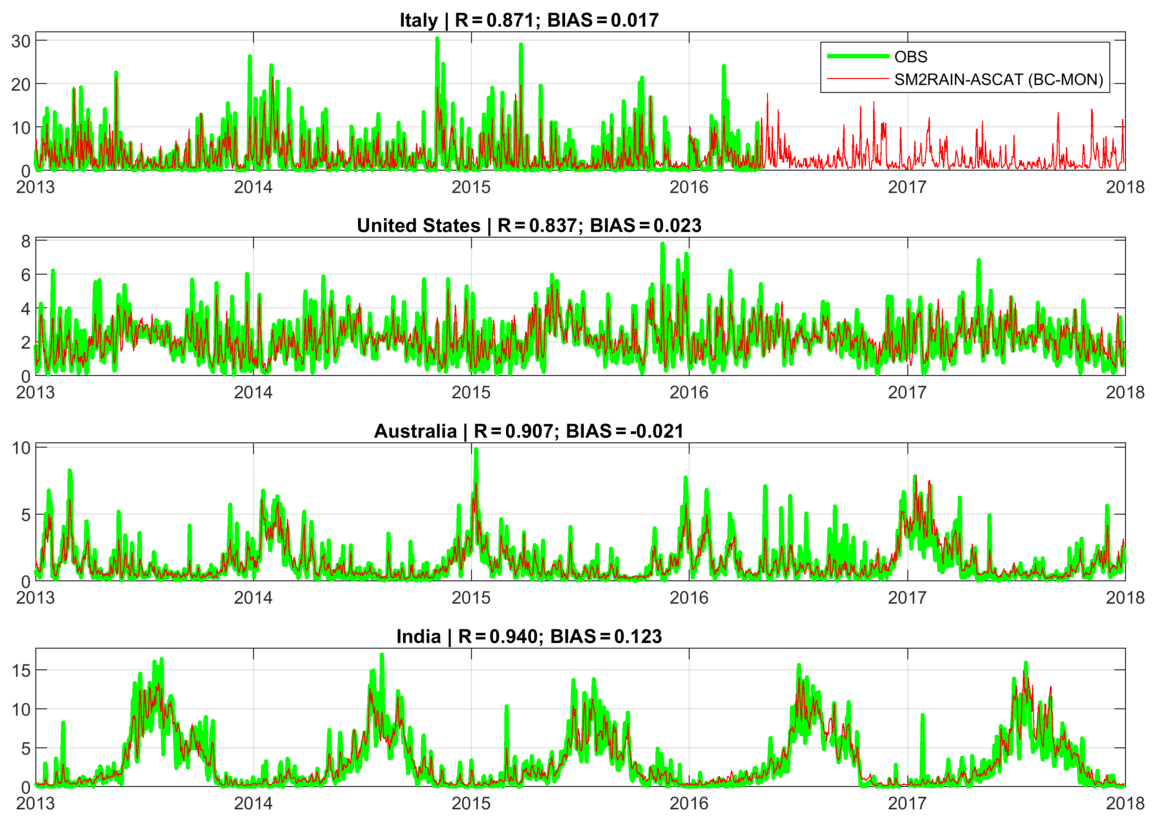
Figure 4Time series of mean areal rainfall for the four regions for observed data, OBS, and the SM2RAIN–ASCAT data record, BC-MON configuration (R (–): Pearson's correlation, BIAS (mm d−1): mean error).

Figure 5Pearson's correlation, R, and root mean square error, RMSE, map of the SM2RAIN–ASCAT data record compared with the ERA5 reanalysis dataset used as a benchmark (period 2007–2018). The analysis is carried out at a 1 d and 12.5 km temporal and spatial resolution. The map shows that the SM2RAIN–ASCAT data record is performing well in the western United States, Brazil, southern and western South America, southern Africa, the Sahel, southern central Eurasia, and Australia (green colours).
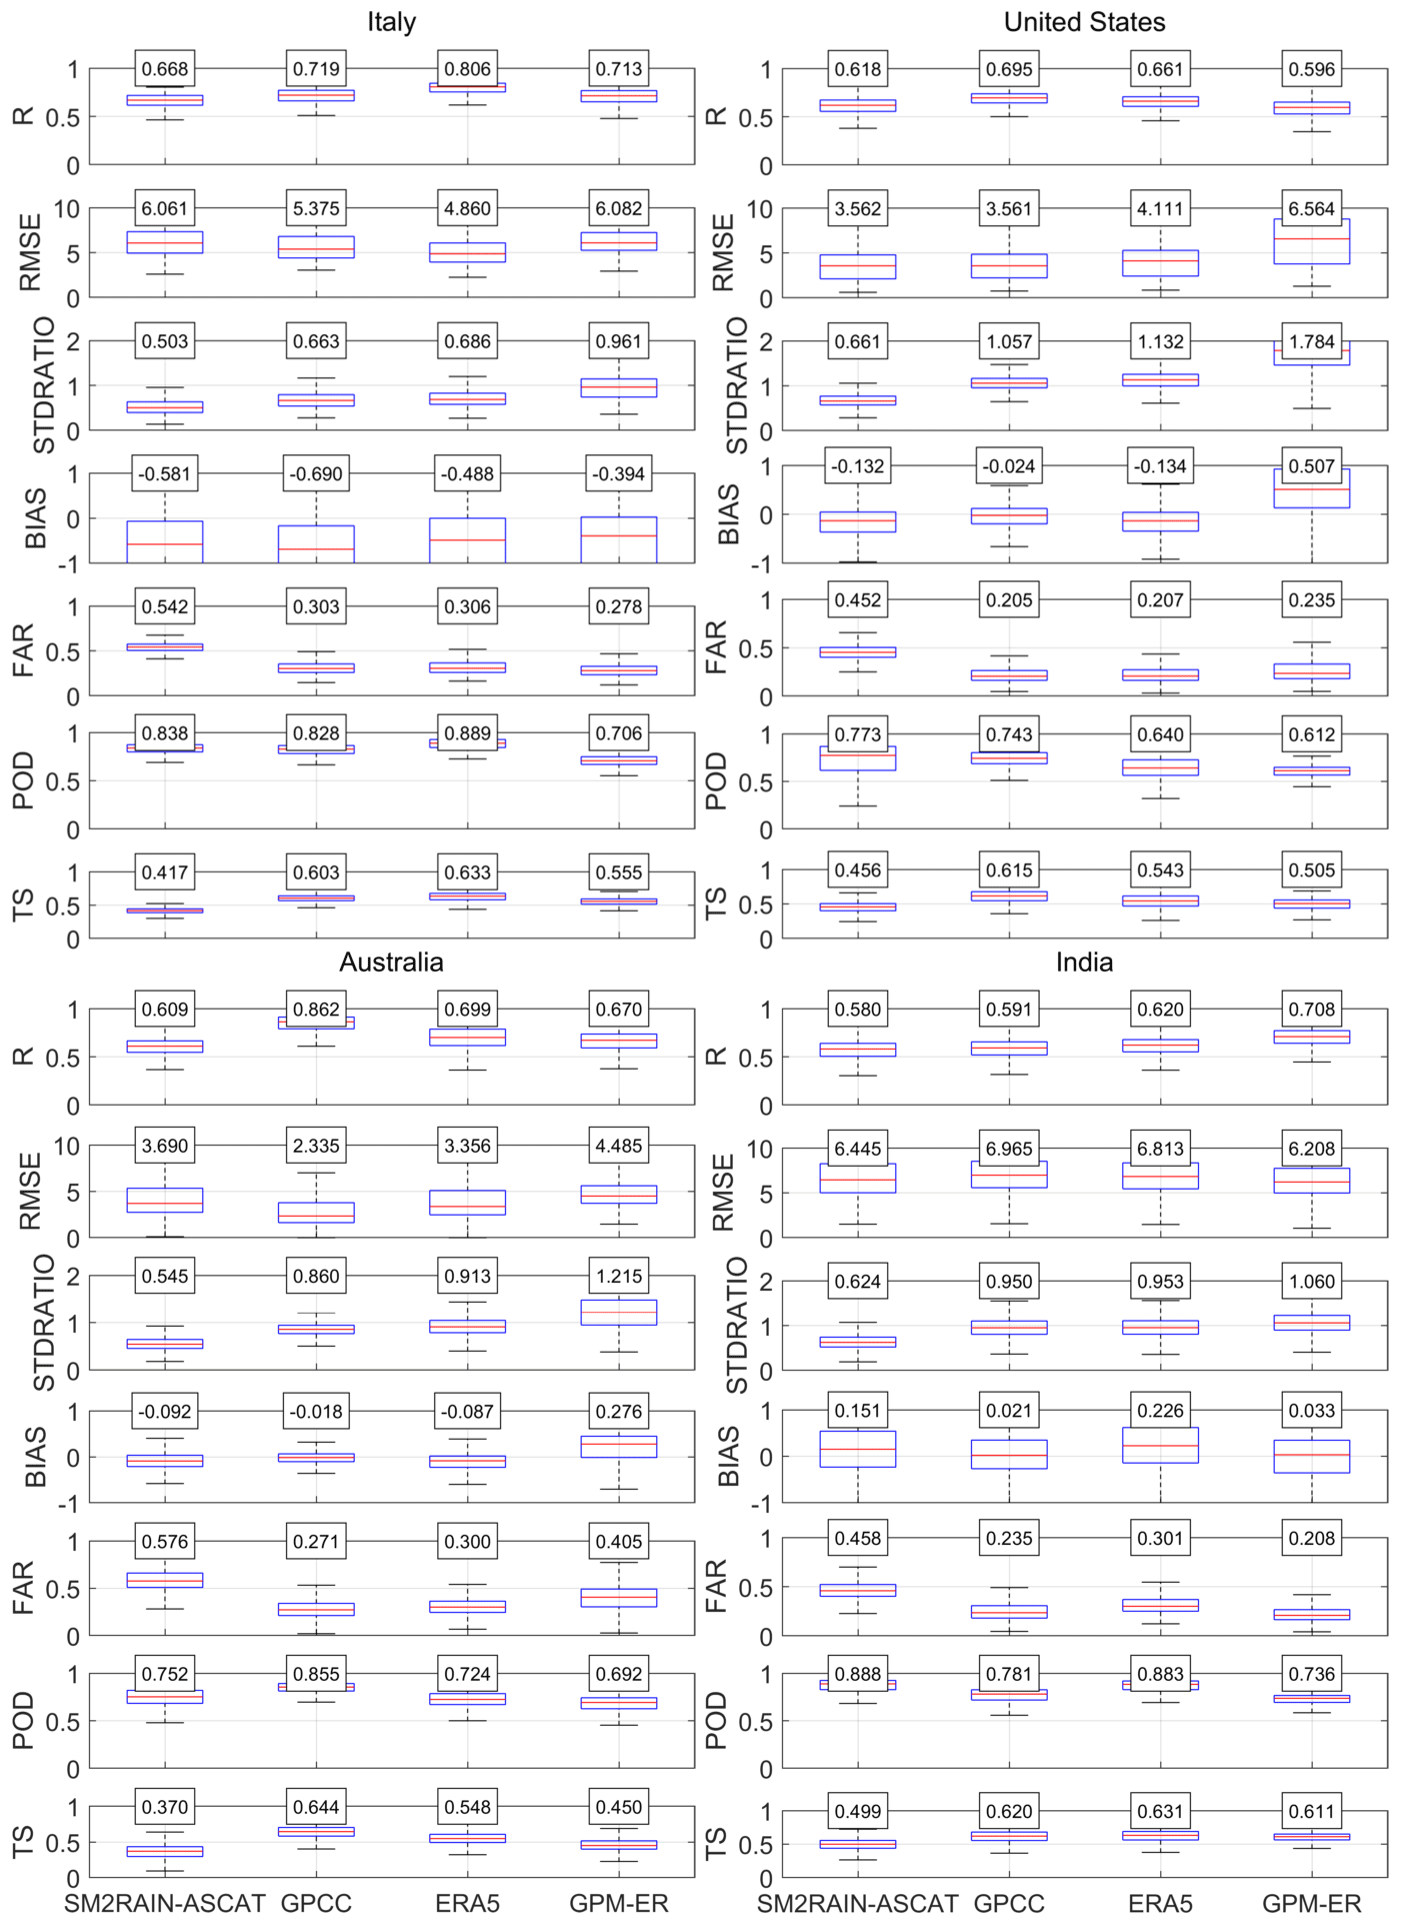
Figure 6Regional assessment of the SM2RAIN–ASCAT rainfall data record and comparison with GPCC, ERA5 and GPM-ER rainfall products. As a reference the high-quality ground-based datasets in Italy, the United States, India, and Australia are used. Results in terms of Pearson's correlation, R (–), root mean square error, RMSE (mm d−1), the variability ratio, STDRATIO (–), the mean error between estimated and reference rainfall, BIAS (mm d−1), the false alarm ratio, FAR (–), the probability of detection, POD (–), and the threat score, TS (–).
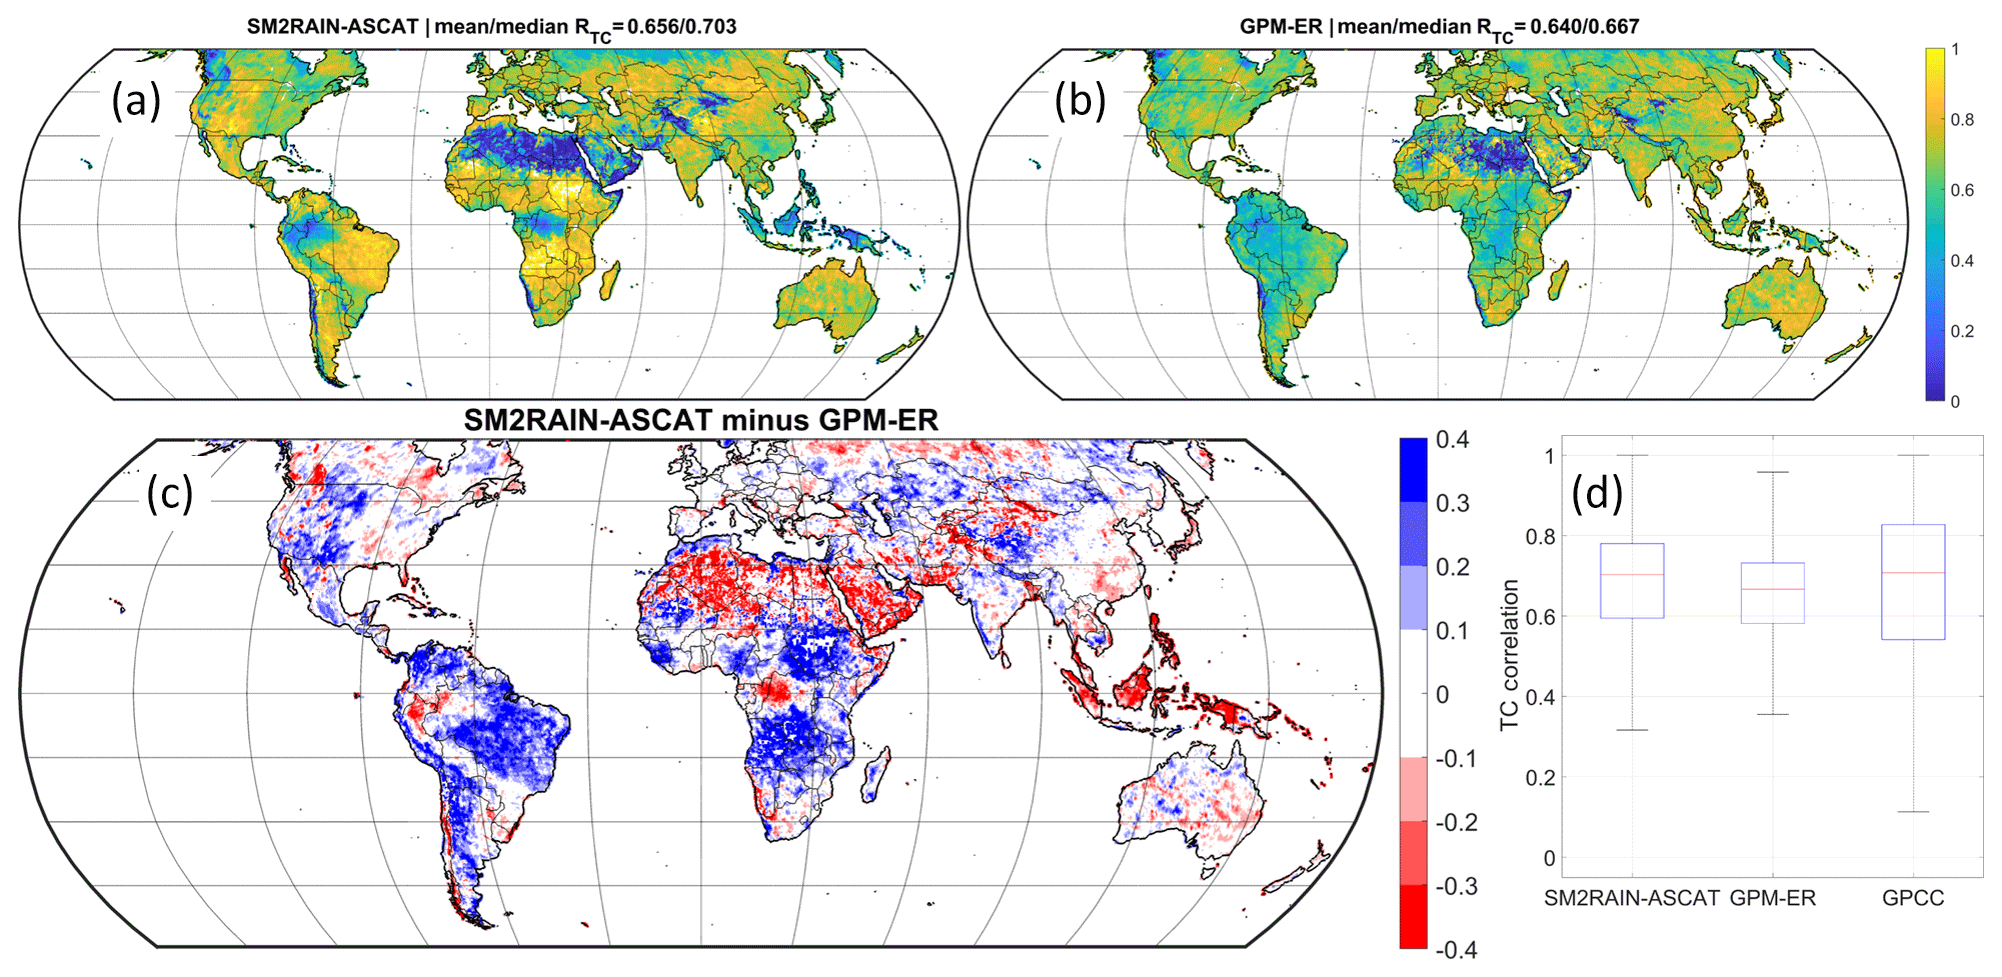
Figure 7Global triple-collocation, TC, results. (a) RTC map for SM2RAIN–ASCAT, (b) RTC map for GPM-ER, (c) differences between (a) and (b), i.e. blue pixels for areas in which SM2RAIN–ASCAT (GPM-ER) is performing better and red for those in which it is performing worse, and (d) box plot of RTC for SM2RAIN–ASCAT, GPM-ER, and GPCC. SM2RAIN–ASCAT is performing significantly better than GPM-ER in South America and Africa (excluding desert and tropical-forest areas), elsewhere the two satellite products perform similarly.
4.2 Generation of the SM2RAIN–ASCAT data record
Based on the tests summarized in the previous paragraph, we have selected the best configuration using the SWI-Tvar for filtering, Brooks–Corey function for losses, and monthly correction approach for climatological correction. The addition of an evapotranspiration component, even though it shows some improvements, has been not used in view of an operational implementation of the method. The monthly correction approach has been selected as R and RMSE scores have been considered more important based on previous investigations on the assessment of satellite rainfall products (e.g. Massari et al., 20171).
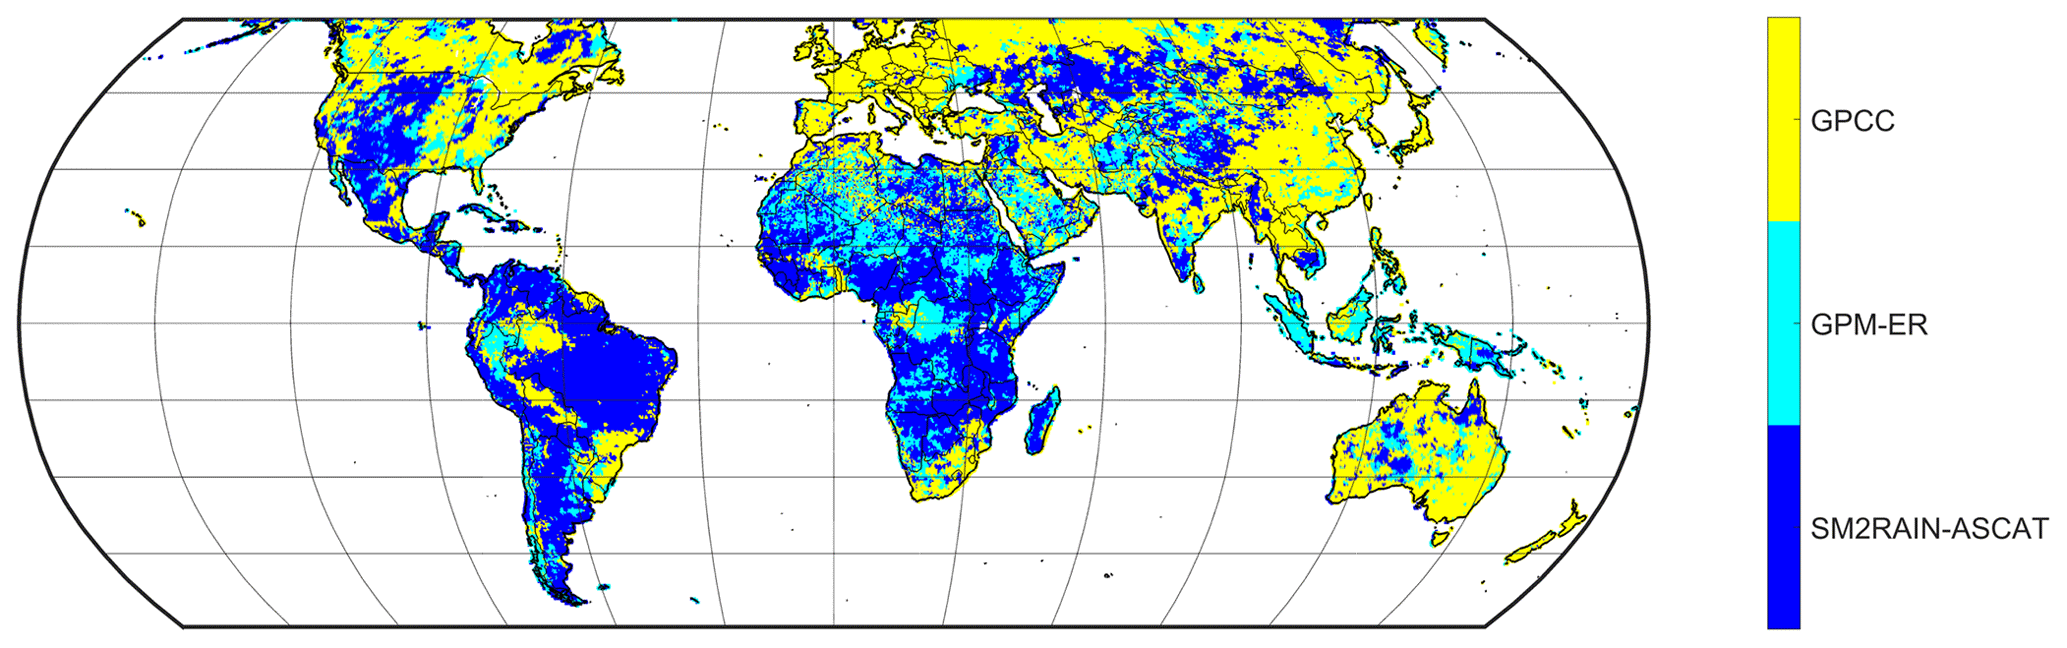
Figure 8Best-performing product based on the results of the triple-collocation data shown in Fig. 7. SM2RAIN–ASCAT is performing the best among the three products in Africa, South America, the central western United States, and central Asia, while GPCC is performing the best in the remaining parts of the Northern Hemisphere and in Australia. GPM-ER is the best product in tropical and equatorial regions.
The selected configuration has been applied on a global scale to 839 826 points over which ASCAT soil moisture observations are available. As a reference dataset for the calibration of the parameter values of the pre-processing (filtering) of SM2RAIN and of the post-processing, the ERA5 rainfall has been used mainly because of its higher spatial resolution compared to the GPCC (36 km versus 100 km). However, we have also tested the use of the two datasets for calibration at 20 000 randomly chosen points, which showed that the estimated rainfall in the two calibration tests is very similar. For instance, the median R between the two SM2RAIN–ASCAT data records is higher than 0.90 (not shown for brevity). This result clearly demonstrates that the selection of the reference dataset has a small influence on SM2RAIN-derived rainfall that is mostly driven from soil moisture temporal fluctuations. Additionally, considering the improved ASCAT coverage after 2013, the calibration has been split from 2007 to 2012 (MetOp-A) and from 2013 to 2018 (MetOp-A and MetOp-B). The dual calibration has solved the issue in terms of a long-term trend that has been found in previous applications of SM2RAIN to ASCAT soil moisture data (Beck et al., 2017). Finally, we have flagged rainfall observations in space and time when the data are supposed to be less reliable. In space (i.e. a fixed spatial mask), we have used the committed area mask developed for the ASCAT soil moisture product (i.e. the area in which the ASCAT soil moisture retrievals are expected to be good; PVR, 2017), a frozen probability mask, and a topographic complexity mask. In time (i.e. a temporally variable mask), we have considered the soil temperature data from ERA5 and flagged the observations with soil temperature values between 0 and 3 ∘C as temporarily frozen soil and below 3 ∘C as frozen soil. As many applications require continuous data, we have preferred to flag the data instead of removing them with an expected loss of accuracy.
The SM2RAIN–ASCAT data record so obtained has a spatial sampling of 12.5 km, a daily temporal resolution, and it covers the 12-year period 2007–2018. Figure 5 shows R and RMSE values between SM2RAIN–ASCAT and ERA5 in a single map. Therefore, Fig. 5 illustrates the consistency between SM2RAIN–ASCAT and ERA5, and it is not intended to assess the performance of the data record (even though we expect better accuracy in areas where the agreement is higher). Light green indicates very good agreement with high R and low RMSE values, colours from orange to red indicate low R and high RMSE values, and black indicates low RMSE with R values highlighting areas in which rainfall occurrence and variability is very low (e.g. the Sahara and high latitudes). The data record has been found to be in very good agreement with ERA5 (high R and low RMSE values) in the western United States, Brazil, southern and western South America, southern Africa, the Sahel, southern central Eurasia, and Australia. The areas in which SM2RAIN–ASCAT is characterized by lower consistency with ERA5 are those with dense vegetation (Amazon, Congo, and Indonesia), with complex topography (e.g. the Alps, Himalayas, and Andes), at high latitudes, and the Sahara and Arabian deserts. In these areas it is well-known that the ASCAT soil moisture product has limitations (e.g. Wagner et al., 2013), and generally the retrieval of soil moisture from remote sensing is more challenging. The median R and RMSE values are equal to 0.56 and 3.06 mm d−1, with slightly better scores in the period 2013–2018 (R=0.57, RMSE =2.95) thanks to the availability of ASCAT on both MetOp-A and MetOp-B.
4.3 Regional and global assessment of the SM2RAIN–ASCAT data record
By using all the pixels included in the four regions (Italy, the United States, India, and Australia), for a total of 29 843 points, the new SM2RAIN–ASCAT rainfall data record has been compared with reference rainfall observations in Fig. 6 by considering the whole period 2007–2018. Specifically, the box plots of different performance metrics (the same of Fig. 3) are shown and compared with the results obtained through the GPCC, ERA5, and GPM-ER. By focusing on the SM2RAIN–ASCAT data record performance over the different regions, it shows better performance in Italy (median R=0.67) and the United States (median R=0.62), almost comparable with the other datasets; while in Australia and India R values are lower (median R=0.61 and 0.59). In the selected regions, the best product is the GPCC (mainly in Australia) followed by ERA5, while the GPM-ER and SM2RAIN–ASCAT are performing similarly in terms of R. The better performance of the GPCC is expected (gauge-based dataset), and the same is also true for the very good performance of ERA5 in Italy and Australia thanks to the availability of ground observations for the reanalysis. We also highlight that different than SM2RAIN–ASCAT and the GPM-ER, the GPCC and ERA5 have a latency of weeks to months, and, hence, these products cannot be used for near-real-time applications. When considering the RMSE score, the results are quite different with respect to R. SM2RAIN–ASCAT is overall very good and is the best and second best product in the and United States and India, respectively. The ranking of the product is the GPCC, SM2RAIN–ASCAT, ERA5, and GPM-ER, with the latter showing high RMSE values in the United States and Australia. As shown in previous studies (Brocca et al., 2016; Ciabatta et al., 2017), the SM2RAIN approach is very good in obtaining low RMSE values thanks to its accuracy in the retrieval of accumulated rainfall. Moreover, the product accuracy is stable over time as it is not as strongly affected by the availability of satellite overpasses as in the top down approach. As shown also in Fig. 3, the SM2RAIN–ASCAT data record has limitations in reproducing the variability of rainfall (low STDRATIO) mainly due underestimation issues. Moreover, SM2RAIN–ASCAT FAR values are quite high highlighting the difficulties in removing the problem of high-frequency soil moisture fluctuations wrongly interpreted by SM2RAIN as rainfall events.
On a global scale, the TC approach has been implemented by using the triplet SM2RAIN–ASCAT, GPM-ER, and GPCC by considering the common period 2015–2018 and a daily timescale. In TC analysis we have purposely not considered ERA5 in order to avoid any dependency between the products. Theoretically, the extended TC approach provides the correlation, RTC, against the underlying “truth”. Figure 7a and b show the RTC maps for SM2RAIN–ASCAT and GPM-ER highlighting similar mean values (0.66 and 0.64 for SM2RAIN–ASCAT and GPM-ER, respectively). It should be underlined that the RTC values are higher than those obtained in comparison with ground observations as theoretically the metric does not contain the error in the reference (Massari et al., 2017a). The spatial pattern of the performance is quite different as demonstrated in Fig. 7c in which the differences between the two RTC maps is shown. Again, these results underline the strong complementarity between bottom-up and top-down approaches (e.g. Ciabatta et al., 2017; Chiaravallotti et al., 2018). As expected, SM2RAIN–ASCAT performs worse over desert areas, tropical forests, and complex mountainous regions. Differently, over plains and low-vegetated areas SM2RAIN–ASCAT performs better than GPM-ER, particularly in the Southern Hemisphere. Indeed, in Africa and South America SM2RAIN–ASCAT performs well (see also Fig. 7a) thanks to the capability of the bottom-up approach to estimate accumulated rainfall accurately with a limited number of satellite overpasses occurring in these areas, differently from the top-down approach used in GPM-ER.
The box plots of RTC shown in Fig. 7d indicate that, overall, GPCC performs similarly to the two satellite products with major differences in the spatial patterns of the performance. SM2RAIN–ASCAT performs the best among the three products in Africa, South America, the central western United States, and central Asia, while the GPCC performs the best in the remaining parts except the tropical region in which the GPM-ER performs very well (see Fig. 8). If we consider only the committed area of ASCAT (PVR, 2017), in which the soil moisture product is supposed to be reliable, the mean value of RTC is equal to 0.72, whereas in the masked area it is equal to 0.59.
The SM2RAIN–ASCAT data record is freely available at https://doi.org/10.5281/zenodo.3405563 (recently extended to the end of August 2019) (Brocca et al., 2019).
In this study, we have described the development of the new SM2RAIN–ASCAT rainfall data record highlighting the steps carried out for improving the retrieval algorithm and the pre- and post-processing of the data. The major novelties of the SM2RAIN–ASCAT rainfall data record developed here with respect to previous versions are (1) the application of SM2RAIN at full spatial resolution thus providing a gridded data record with a spatial sampling of 12.5 km, (2) improved sampling and filtering of ASCAT soil moisture data, (3) the application of monthly climatological correction, and (4) the improved calibration strategy.
The SM2RAIN–ASCAT data record has been preliminary assessed at regional (Figs. 4 and 6) and global (Figs. 5, 7, and 8) scales in terms of different performance metrics with a larger emphasis on the temporal correlation, R, and the root mean square error, RMSE. The overall performance is good, mainly in terms of RMSE, thanks to the capacity of SM2RAIN to accurately reproduce accumulated rainfall consistently over time. Importantly, SM2RAIN–ASCAT is found to perform even better than ground-based GPCC products over the Southern Hemisphere in Africa and South America, the central western United States, and central Asia. Limitations of SM2RAIN–ASCAT data record consist of (1) the underestimation of peak rainfall events, (2) the presence of spurious rainfall events due to high-frequency soil moisture fluctuations, (3) the estimation of liquid rainfall only (snowfall cannot be estimated), and (4) the possibility to estimate rainfall over land only.
In the near future, we are going to develop the near-real-time version of the SM2RAIN–ASCAT rainfall product that can be used as an input for applications such as flood prediction (similarly to Camici et al., 2018 and Massari et al., 2018), landslide prediction (Brunetti et al., 2018), and novel applications for agriculture and water resource management.
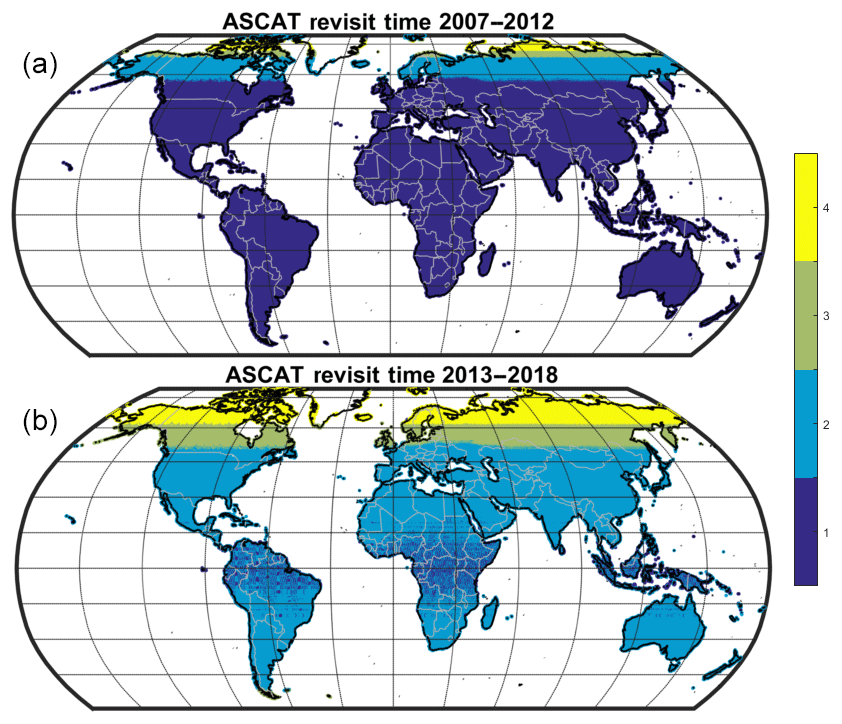
Figure A1Mean daily revisit time (d) of ASCAT soil moisture observations for the period 2007–2012 (only MetOp-A, a) and for the period 2013–2018 (MetOp-A and MetOp-B, b).
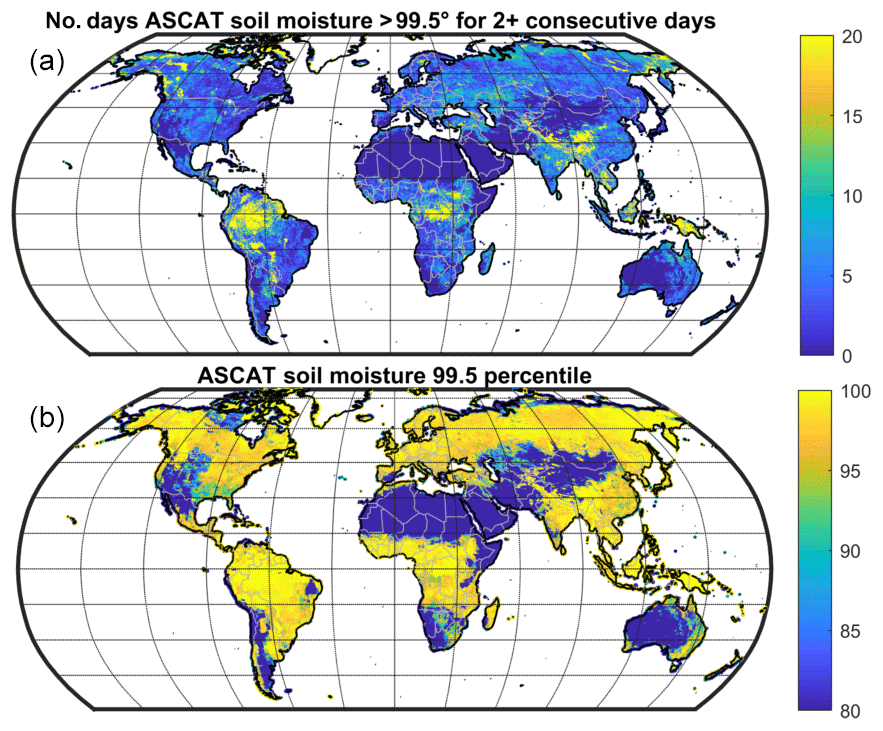
Figure A2Number of days in which ASCAT soil moisture observations are close to saturation (>99.5 percentile, a) for 2 (or more) consecutive days in the period 2007–2018. Please note that the upper value is set to 20 d as in most of the land areas the occurrence is very low (90 % of the land pixels have values lower than 12 d over 12 years). In the bottom panel the soil moisture values in the 99.5 percentile (in the period 2007–2018) are shown.
Table A1Equations used for the performance scores. For the continuous scores, Pref is the reference dataset (e.g. ground observations, ERA5), Pest is the estimated dataset (e.g. SM2RAIN–ASCAT, GPM-ER), cov is the covariance operator, σ is the standard deviation operator, ∑ is the summation operator, and N is the sample size. For the categorical scores, H is the number of successfully predicted events by a given rainfall product, F the number of non-events erroneously predicted to occur, and M is the number of actual events that are missed.
All authors contributed extensively to the work presented in this paper. LB conceived of and designed the paper, developed the SM2RAIN code, and performed some of the analysis. PF wrote most of the code and performed most of the computations. LC, CM, SC, SH, and WW contributed to the processing of the input–output datasets, the analysis and exploration of the data, and the preparation and discussion of the results. LS and BB contributed extensively to define the concept of the paper and to define the procedure to be implemented. All co-authors contributed to the editing of the manuscript and to the discussion and interpretation of the results.
The authors declare that they have no conflict of interest.
The authors gratefully acknowledge support from EUMETSAT through the Global SM2RAIN project (contract no. EUM/CO/17/4600001981/BBo) and the “Satellite Application Facility on Support to Operational Hydrology and Water Management (H SAF)” CDOP 3 (grant no. EUM/C/85/16/DOC/15).
This research has been supported by EUMETSAT (Global SM2RAIN project grant no. EUM/CO/17/4600001981/BBo and “Satellite Application Facility on Support to Operational Hydrology and Water Management (H SAF)” CDOP 3 grant no. EUM/C/85/16/DOC/15).
This paper was edited by Alexander Gelfan and reviewed by three anonymous referees.
Abera, W., Formetta, G., Brocca, L., and Rigon, R.: Modeling the water budget of the Upper Blue Nile basin using the JGrass-NewAge model system and satellite data, Hydrol. Earth Syst. Sci., 21, 3145–3165, https://doi.org/10.5194/hess-21-3145-2017, 2017.
Beck, H. E., Vergopolan, N., Pan, M., Levizzani, V., van Dijk, A. I. J. M., Weedon, G. P., Brocca, L., Pappenberger, F., Huffman, G. J., and Wood, E. F.: Global-scale evaluation of 22 precipitation datasets using gauge observations and hydrological modeling, Hydrol. Earth Syst. Sci., 21, 6201–6217, https://doi.org/10.5194/hess-21-6201-2017, 2017.
Brocca, L.: SM2RAIN test dataset with ASCAT satellite soil moisture (Version 1.0) [Data set], Zenodo, https://doi.org/10.5281/zenodo.2580285, 2019.
Brocca, L., Hasenauer, S., Lacava, T., Melone, F., Moramarco, T., Wagner, W., Dorigo, W., Matgen, P., Martínez-Fernández, J., Llorens, P., Latron, J., Martin, C., and Bittelli, M.: Soil moisture estimation through ASCAT and AMSR-E sensors: an intercomparison and validation study across Europe, Remote Sens. Environ., 115, 3390–3408, 2011.
Brocca, L., Melone, F., Moramarco, T., and Wagner, W.: A new method for rainfall estimation through soil moisture observations, Geophys. Res. Lett., 40, 853–858, 2013a.
Brocca, L., Melone, F., Moramarco, T., Wagner, W., and Albergel, C.: Scaling and filtering approaches for the use of satellite soil moisture observations, in: Remote Sensing of Energy Fluxes and Soil Moisture Content, edited by: Petropoulos, G. P., CRC Press 2013, chap. 17, 411–426, 2013b.
Brocca, L., Ciabatta, L., Massari, C., Moramarco, T., Hahn, S., Hasenauer, S., Kidd, R., Dorigo, W., Wagner, W., and Levizzani, V.: Soil as a natural rain gauge: estimating global rainfall from satellite soil moisture data, J. Geophys. Res., 119, 5128–5141, 2014.
Brocca, L., Massari, C., Ciabatta, L., Moramarco, T., Penna, D., Zuecco, G., Pianezzola, L., Borga, M., Matgen, P., and Martínez-Fernández, J.: Rainfall estimation from in situ soil moisture observations at several sites in Europe: an evaluation of SM2RAIN algorithm, J. Hydrol. Hydromech., 63, 201–209, 2015.
Brocca, L., Pellarin, T., Crow, W. T., Ciabatta, L., Massari, C., Ryu, D., Su, C.-H., Rudiger, C., and Kerr, Y.: Rainfall estimation by inverting SMOS soil moisture estimates: a comparison of different methods over Australia, J. Geophys. Res., 121, 12062–12079, 2016.
Brocca, L., Crow, W. T., Ciabatta, L., Massari, C., de Rosnay, P., Enenkel, M., Hahn, S., Amarnath, G., Camici, S., Tarpanelli, A., and Wagner, W.: A review of the applications of ASCAT soil moisture products, IEEE J. Sel. Top. Appl., 10, 2285–2306, 2017.
Brocca, L., Filippucci, P., Hahn, S., Ciabatta, L., Massari, C., Camici, S., Schüller, L., Bojkov, B., Wagner, W.: SM2RAIN-ASCAT (2007–August 2019): global daily satellite rainfall from ASCAT soil moisture (Version 1.1) [Data set], Zenodo, https://doi.org/10.5281/zenodo.3405563, 2019.
Brunetti, M. T., Melillo, M., Peruccacci, S., Ciabatta, L., and Brocca, L.: How far are we from the use of satellite data in landslide forecasting?, Remote Sens. Environ, 210, 65–75, https://doi.org/10.1016/j.rse.2018.03.016, 2018.
Camici, S., Ciabatta, L., Massari, C., and Brocca, L.: How reliable are satellite precipitation estimates for driving hydrological models: a verification study over the Mediterranean area, J. Hydrol., 563, 950–961, 2018.
Chiaravalloti, F., Brocca, L., Procopio, A., Massari, C., and Gabriele, S.: Assessment of GPM and SM2RAIN-ASCAT rainfall products over complex terrain in southern Italy, Atmos. Res., 206, 64–74, 2018.
Ciabatta, L., Brocca, L., Massari, C., Moramarco, T., Gabellani, S., Puca, S., and Wagner, W.: Rainfall-runoff modelling by using SM2RAIN-derived and state-of-the-art satellite rainfall products over Italy, Int. J. Appl. Earth Obs., 48, 163–173, 2016.
Ciabatta, L., Marra, A. C., Panegrossi, G., Casella, D., Sanò, P., Dietrich, S., Massari, C., and Brocca, L.: Daily precipitation estimation through different microwave sensors: verification study over Italy, J. Hydrol., 545, 436–450, 2017.
Ciabatta, L., Massari, C., Brocca, L., Gruber, A., Reimer, C., Hahn, S., Paulik, C., Dorigo, W., Kidd, R., and Wagner, W.: SM2RAIN-CCI: a new global long-term rainfall data set derived from ESA CCI soil moisture, Earth Syst. Sci. Data, 10, 267–280, https://doi.org/10.5194/essd-10-267-2018, 2018.
Crow, W. T., Huffman, G. F., Bindlish, R., and Jackson, T. J.: Improving satellite rainfall accumulation estimates using spaceborne soil moisture retrievals, J. Hydrometeorol., 10, 199–212, 2009.
Crow, W. T., van den Berg, M. J., Huffman, G. J., and Pellarin, T.: Correcting rainfall using satellite-based surface soil moisture retrievals: The Soil Moisture Analysis Rainfall Tool (SMART), Water Resour. Res., 47, W08521, https://doi.org/10.1029/2011WR010576, 2011.
Dorigo, W., Wagner, W., Albergel, C., Albrecht, F., Balsamo, G., Brocca, L., Chung, D., Ertl, M., Forkel, M., Gruber, A., Haas, D., Hamer, P., Hirschi, M., Ikonen, J., de Jeu, R., Kidd, R., Lahoz, W., Liu, Y. Y., Miralles, D., Mistelbauer, T., Nicolai-Shaw, N., Parinussa, R., Pratola, C., Reimer, C., van der Schalie, R., Seneviratne, S. I., Smolander, T., and Lecomte, P.: ESA CCI soil moisture for improved earth system understanding: state-of-the art and future directions, Remote Sens. Environ., 203, 185–215, 2017.
Ebert, E. E., Janowiak, J. E., and Kidd, C.: Comparison of near-real-time precipitation estimates from satellite observations and numerical models, B. Am. Meteorol. Soc., 88, 47–64, 2007.
Forootan, E., Khaki, M., Schumacher, M., Wulfmeyer, V., Mehrnegar, N., van Dijk, A. I. J. M., Brocca, L., Farzaneh, S., Akinluyi, F., Ramillien, G., Shum, C. K., Awange, J., and Mostafaie, A.: Understanding the global hydrological droughts of 2003–2016 and their relationships with teleconnections, Sci. Total Environ., 650, 2587–2604, 2019.
Herold, N., Alexander, L. V., Donat, M. G., Contractor, S., and Becker, A.: How much does it rain over land?, Geophys. Res. Lett., 43, 341–348, 2016.
Hou, A. Y., Kakar, R. K., Neeck, S., Azarbarzin, A. A., Kummerow, C. D., Kojima, M., Oki, R., Nakamura, K., and Iguchi, T.: The Global Precipitation Measurement (GPM) mission, B. Am. Meteorol. Soc., 95, 701–722, 2014.
Kidd, C. and Levizzani, V.: Status of satellite precipitation retrievals, Hydrol. Earth Syst. Sci., 15, 1109–1116, https://doi.org/10.5194/hess-15-1109-2011, 2011.
Kidd, C., Becker, A., Huffman, G. J., Muller, C. L., Joe, P., Skofronick-Jackson, G., and Kirschbaum, D. B.: So, how much of the Earth's surface is covered by rain gauges?, B. Am. Meteorol. Soc., 98, 69–78, 2017.
Kirschbaum, D. and Stanley, T.: Satellite-Based Assessment of Rainfall-Triggered Landslide Hazard for Situational Awareness, Earth's Future, 6, 505–523, 2018.
Koster, R. D., Brocca, L., Crow, W. T., Burgin, M. S., and De Lannoy, G. J. M.: Precipitation Estimation Using L-Band and C-Band Soil Moisture Retrievals, Water Resour. Res., 52, 7213–7225, 2016.
Lanza, L. G. and Vuerich, E.: The WMO Field Intercomparison of Rain Intensity Gauges, Atmos. Res., 94, 534–543, 2009.
Maggioni, V. and Massari, C.: On the performance of satellite precipitation products in riverine flood modeling: A review, J. Hydrol., 558, 214–224, 2018.
Massari, C., Brocca, L., Moramarco, T., Tramblay, Y., and Didon Lescot, J.-F.: Potential of soil moisture observations in flood modelling: estimating initial conditions and correcting rainfall, Adv. Water Resour., 74, 44–53, 2014.
Massari, C., Crow, W., and Brocca, L.: An assessment of the performance of global rainfall estimates without ground-based observations, Hydrol. Earth Syst. Sci., 21, 4347–4361, https://doi.org/10.5194/hess-21-4347-2017, 2017a.
Massari, C., Su, C.-H., Brocca, L., Sang, Y. F., Ciabatta, L., Ryu, D., and Wagner, W.: Near real time de-noising of satellite-based soil moisture retrievals: An intercomparison among three different techniques, Remote Sens. Environ., 198, 17–29, 2017b.
Massari, C., Maggioni, V., Barbetta, S., Brocca, L., Ciabatta, L., Camici, S., Moramarco, T., Coccia, G., and Todini, E.: Complementing near-real time satellite rainfall products with satellite soil moisture-derived rainfall through a Bayesian inversion approach, J. Hydrol., 573, 341–351, https://doi.org/10.1016/j.jhydrol.2019.03.038, 2019.
McColl, K. A., Vogelzang, J., Konings, A.G., Entekhabi, D., Piles, M., and Stoffelen, A.: Extended triple collocation: estimating errors and correlation coefficients with respect to an unknown target, Geophys. Res. Lett., 41, 6229–6236, 2014.
Overeem, A., Leijnse, H., and Uijlenhoet, R.: Measuring urban rainfall using microwave links from commercial cellular communication networks, Water Resour. Res., 47, 12, https://doi.org/10.1029/2010WR010350, 2011.
Pellarin, T., Louvet, S., Gruhier, C., Quantin, G., and Legout, C.: A simple and effective method for correcting soil moisture and precipitation estimates using AMSR-E measurements, Remote Sens. Environ., 136, 28–36, 2013.
Pendergrass, A. G. and Knutti, R.: The uneven nature of daily precipitation and its change, Geophys. Res. Lett., 45, 11980–11988, 2018.
Product User Manual (PUM): Soil Moisture Data Records, Metop ASCAT Soil Moisture Time Series, Tech. Rep. Doc. No: SAF/HSAF/CDOP3/PUM, version 0.7, 2018.
Product Validation Report (PVR)” Metop ASCAT Soil Moisture CDR products, Tech. Rep. Doc. No: SAF/HSAF/CDOP3/PVR, version 0.6, 2017.
Rinaldo, A., Bertuzzo, E., Mari, L., Righetto, L., Blokesch, M., Gatto, M., Casagrandi, R., Murray, M., Vesenbeckh, S. M., and Rodriguez-Iturbe, I.: Reassessment of the 2010–2011 Haiti cholera outbreak and rainfall-driven multiseason projections, P. Natl. Acad. Sci. USA, 109, 6602–6607, 2012.
Román-Cascón, C., Pellarin, T., Gibon, F., Brocca, L., Cosme, E., Crow, W., Fernández, D., Kerr, Y., and Massari, C.: Correcting satellite-based precipitation products through SMOS soil moisture data assimilation in two land-surface models of different complexity: API and SURFEX, Remote Sens. Environ., 200, 295–310, 2017.
Schamm, K., Ziese, M., Raykova, K., Becker, A., Finger, P., Meyer-Christoffer, A., and Schneider, U.: GPCC Full Data Daily Version 1.0 at 1.0∘: Daily Land-Surface Precipitation from Rain-Gauges built on GTS-based and Historic Data, https://doi.org/10.5676/DWD_GPCC/FD_D_V1_100, 2015.
Tarpanelli, A., Massari, C., Ciabatta, L., Filippucci, P., Amarnath, G., and Brocca, L.: Exploiting a constellation of satellite soil moisture sensors for accurate rainfall estimation, Adv. Water Resour., 108, 249–255, 2017.
Thaler, S., Brocca, L., Ciabatta, L., Eitzinger, J., Hahn, S., and Wagner, W.: Effects of different spatial precipitation input data on crop model outputs under a Central European climate, Atmosphere, 9, 290, https://doi.org/10.3390/atmos9080290, 2018.
Trenberth, K. E. and Asrar, G. R.: Challenges and opportunities in water cycle research: WCRP contributions, Surv. Geophys., 35, 515–532, 2014.
Wagner, W., Lemoine, G., and Rott, H.: A method for estimating soil moisture from ERS scatterometer and soil data, Remote Sens. Environ., 70, 191–207, 1999.
Wagner, W., Hahn, S., Kidd, R., Melzer, T., Bartalis, Z., Hasenauer, S., Figa, J., de Ros- nay, P., Jann, A., Schneider, S., Komma, J., Kubu, G., Brugger, K., Aubrecht, C., Zuger, J., Gangkofner, U., Kienberger, S., Brocca, L., Wang, Y., Bloeschl, G., Eitzinger, J., Steinnocher, K., Zeil, P., and Rubel, F.: The ASCAT soil moisture product: a review of its specifications, validation results, and emerging applications, Meteorol. Z., 22, 5–33, 2013.
Wanders, N., Pan, M., and Wood, E. F.: Correction of real-time satellite precipitation with multi-sensor satellite observations of land surface variables, Remote Sens. Environ., 160, 206–221, 2015.
Wang, Z., Zhong, R., Lai, C., and Chen, J.: Evaluation of the GPM IMERG satellite-based precipitation products and the hydrological utility, Atmos. Res., 196, 151–163, 2017.
Zhang, Z., Wang, D., Wang, G., Qiu, J., and Liao, W.: Use of SMAP soil moisture and fitting methods in improving GPM estimation in near real time, Remote Sens., 11, 368, https://doi.org/10.3390/rs11030368, 2019.