the Creative Commons Attribution 4.0 License.
the Creative Commons Attribution 4.0 License.
 | 23 Apr 2018
The WASCAL high-resolution regional climate simulation ensemble for West Africa: concept, dissemination and assessment
Dominikus Heinzeller
Diarra Dieng
Gerhard Smiatek
Christiana Olusegun
Cornelia Klein
Ilse Hamann
Seyni Salack
Jan Bliefernicht
Harald Kunstmann
Climate change and constant population growth pose severe challenges to 21st century rural Africa. Within the framework of the West African Science Service Center on Climate Change and Adapted Land Use (WASCAL), an ensemble of high-resolution regional climate change scenarios for the greater West African region is provided to support the development of effective adaptation and mitigation measures. This contribution presents the overall concept of the WASCAL regional climate simulations, as well as detailed information on the experimental design, and provides information on the format and dissemination of the available data. All data are made available to the public at the CERA long-term archive of the German Climate Computing Center (DKRZ) with a subset available at the PANGAEA Data Publisher for Earth & Environmental Science portal (https://doi.pangaea.de/10.1594/PANGAEA.880512). A brief assessment of the data are presented to provide guidance for future users.
Regional climate projections are generated at high (12 km) and intermediate (60 km) resolution using the Weather Research and Forecasting Model (WRF). The simulations cover the validation period 1980–2010 and the two future periods 2020–2050 and 2070–2100. A brief comparison to observations and two climate change scenarios from the Coordinated Regional Downscaling Experiment (CORDEX) initiative is presented to provide guidance on the data set to future users and to assess their climate change signal. Under the RCP4.5 (Representative Concentration Pathway 4.5) scenario, the results suggest an increase in temperature by 1.5 ∘C at the coast of Guinea and by up to 3 ∘C in the northern Sahel by the end of the 21st century, in line with existing climate projections for the region. They also project an increase in precipitation by up to 300 mm per year along the coast of Guinea, by up to 150 mm per year in the Soudano region adjacent in the north and almost no change in precipitation in the Sahel. This stands in contrast to existing regional climate projections, which predict increasingly drier conditions.
The high spatial and temporal resolution of the data, the extensive list of output variables, the large computational domain and the long time periods covered make this data set a unique resource for follow-up analyses and impact modelling studies over the greater West African region. The comprehensive documentation and standardisation of the data facilitate and encourage their use within and outside of the WASCAL community.
- Article
(8160 KB) - Full-text XML
- BibTeX
- EndNote


With climate change being one of the most severe challenges to rural Africa in the 21st century, West Africa is facing an urgent need to develop effective adaptation and mitigation measures to protect its constantly growing population (Neumann et al., 2007; Naab et al., 2012; Eguavoen, 2013; Kirtman et al., 2013; Niang et al., 2014). The West African Science Service Center on Climate Change and Adapted Land Use (WASCAL) is a large-scale research-focused program designed to help tackle this challenge and thereby enhance the resilience of human and environmental systems to climate change and increasing variability. It does so by strengthening the research infrastructure and capacity in West Africa related to climate change and by pooling the expertise of 10 West African countries and Germany1. Funded by the German Federal Ministry of Education and Research (BMBF), the research activities of WASCAL in Africa are coordinated by its Competence Center in Ouagadougou, Burkina Faso, supported by a Core Research Program in Germany under the leadership of the Center for Development Research (ZEF) at the University of Bonn. An integral part of the Core Research Program of WASCAL is the provisioning of a novel set of high-resolution regional climate projections for West Africa. In parallel, a meteorological observation network is set up in the region and significant efforts are made to compile a database of historical meteorological observations from various sources such as universities or meteorological and hydrological agencies across the WASCAL member countries.
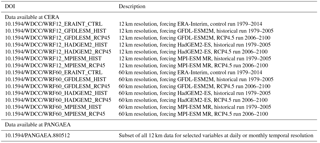
Table 1Available data at CERA (https://cera-www.dkrz.de/WDCC/ui/Project.jsp?acronym=WASCAL, last access: 14 April 2018) and PANGAEA. Note that the previous URL opens a search mask on the CERA database for all available data sets (ensemble members), while the links behind the individual DOIs preselect the corresponding ensemble member. On PANGAEA, a single DOI is assigned to the data from all ensemble members.
Regional climate simulations have gained a significant amount of interest over the last years. The limited resolution of global circulation models (GCMs; typically around 1∘ or 110 km) prohibits the resolution of local features such as topographic variation, coastlines, land use and mesoscale convection. Advances in computational power and in exploiting parallelism in numerical codes nowadays allow us to run regional climate models (RCMs) at resolutions of 10 km until 2100 (Bruyère, 2013). These RCMs can add significant value to global reanalyses and GCMs and in particular lead to an improved representation of the West African monsoon (WAM; see Sylla et al., 2013, and references therein). The dynamics of the WAM system are a consequence of complex interactions between dynamics, thermodynamics and surface conditions (Cook, 1999; Flaounas et al., 2012; Nicholson, 2013). In West Africa, where rainfall is limited to only few months per year except for the coastal regions, a correct representation of the WAM circulation and the associated onset and cessation of the rainy season are of utmost interest for farming management (Salack et al., 2016). In recent studies, Mounkaila et al. (2015) and Klein et al. (2015) showed that the ability of RCMs in simulating onset and cessation of the rainy season over West Africa strongly depends on how well the models reproduce the northward movement of the monsoon system and its associated features. Since RCMs are nested in a global solution, this tie to large-scale features can pose challenges for regional climate modelling studies (see, for example, Heinzeller et al., 2016). Uncertainties also rise from the sparse observational network and the considerable differences in the derived gridded observation products for the region, against which models are validated and calibrated (Sylla et al., 2013).
First high-resolution RCM studies over West Africa were conducted by Jung and Kunstmann (2007) using the mesoscale meteorological model MM5 (Grell et al., 1994) at 9 km resolution for two time slices, 1991–2000 and 2030–2039, over a comparably small region covering the Volta Basin. They showed an annual mean temperature increase of around 1.3 ∘C in the Volta region, significantly exceeding the interannual variability, and a mean annual change in precipitation from −20 to +50 %. While an individual model run can provide a plausible representation of the future under a given climate change scenario, it does not allow an estimate of the range of outcomes expected for the assessment of risks and opportunities (Buontempo et al., 2015). Further, large uncertainties and errors are associated with the result of each model run as a consequence of imperfect initial conditions, with the model being an imperfect abstraction of reality, and from numerical errors and artifacts accumulating in long-term simulations (for example, Laprise, 2003; Park et al., 2014).
Using an ensemble of climate simulations, these uncertainties can be addressed, and statistical estimates on projected future changes can be made at a considerable increase in computational costs. On a global scale, the Coupled Model Intercomparison Project Phase 5 (CMIP5) provides a framework for coordinated climate change experiments and contributed to the IPCC AR5 with a larger number of GCMs and future realisations (Taylor et al., 2012). For the region of West Africa, several regional ensemble modelling experiments were conducted in recent years (for example, Paeth et al., 2011). Within CORDEX (Giorgi et al., 2009), a large number of long-term climate projections were generated by combining different forcing data sets (i.e. GCMs) and RCMs. With a horizontal resolution of 50 km, these projections cover the entire West African continent and at least the time period 1980–2100. At shorter timescales, a 10-member ensemble of regional climate projections at a resolution of 25 km and for selected regions in West Africa is available from CORDEX (Nikulin et al., 2012). Spanning a significantly larger region, the RegCM4 model was used to downscale three different GCMs at the same horizontal resolution of 25 km (Sylla et al., 2015). A consistent finding from these experiments was that simulations at higher resolution can improve the representation of the annual cycle of precipitation and reduce the uncertainty in the response to global warming. These studies showed that an increased resolution allows for a more accurate representation of the coastline and topographic gradients and thus leads to a more realistic simulation along the Gulf of Guinea, among others.
The work presented here advances the regional downscaling efforts for the region through the generation of a high-resolution, ensemble regional climate simulation experiment for large areas of continental West Africa and extensive periods of the 21st century at a horizontal resolution of 12 km. Three GCMs are downscaled using the Weather Research and Forecasting Model (Skamarock et al., 2008) to narrow down uncertainties and provide estimates on the range of climate change impact on the region. A control run using reanalysis data as forcing is added to assess the RCM bias. The simulations provide a large set of output variables at very high temporal resolution for climate change analysis, impact modelling and convection-permitting downscaling experiments. The model data generated in this experiment are freely available at two different data portals.
In Sect. 2, we describe the design of our ensemble experiment and provide further details on the currently available data. Section 3 briefly illustrates the scientific value of these projections and assesses the validity of the chosen setup of this modelling experiment, while Sect. 4 provides details about the dissemination of the data. Section 1 is devoted to conclusions and an outlook on the future modelling experiments.
2.1 Ensemble experiment design
The WASCAL ensemble presented here consists of a combination of three GCMs with one RCM for the greenhouse gas emission scenario RCP4.5 (Representative Concentration Pathway 4.5; van Vuuren et al., 2011). The choice of RCP4.5 was made because of limited computational resources and is based on the fact that the differences between RCP4.5 and RCP8.5 become apparent only after 2040. The selected GCMs, on the other hand, cover the extremes in temperature and precipitation of the ensemble of GCM forcing data used in CORDEX . They also span a larger range in future conditions until about 2060 than the two scenarios RCP4.5 and RCP8.5 and are able to reproduce the dominant, large-scale atmospheric features over West Africa (Nikulin et al., 2013; Elguindi et al., 2014). Further, a control run using reanalysis data is included for model verification and future bias correction.
Dee et al. (2011)Stevens et al. (2013)Jones et al. (2011)Anon (2012)Skamarock et al. (2008)Table 2Reanalyses and global circulation models (earth system models) used as forcing data for the long-term regional climate simulations, and regional climate model used to conduct the ensemble experiment. The characteristics of the forcing models for Africa and their climate change signal (CCS) are taken from Elguindi et al. (2014); OBS denotes observations and MMM denotes the CMIP5 multi-model ensemble mean.
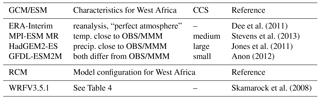
Table 2 summarises the forcing data sets and the limited area model employed in this ensemble experiment. The control run using reanalysis forcing data is conducted for the period 1979–2014. The historical runs are generated for the period 1979–2005 and extended by the RCP4.5 runs until 2010. This approach allows us to derive statistics for the climatological reference period 1980–2010, as defined by the World Meteorological Organization (2011). Future projections are calculated for the periods 2019–2050 and 2069–2100 to provide similar 30-year windows for the mid- and end of the 21st century. It should be noted that the three selected GCMs are based on different calendars, which makes model verification and comparison difficult on timescales shorter than 1 month: while the MPI-ESM-MR model (as well as ERA-Interim) employs a Gregorian calendar, the GFDL-ESM2M and HadGEM2-ES models are based on a 365-day (no-leap year) and a 360-day (12 × 30 days) calendar, respectively.
The generation of an ensemble of climate projections at a resolution of 12 km and for at least 90 years in total is a process over several years and requires the use of different high-performance computing (HPC) centres. To ensure consistency within each model run, the entire integration for a particular combination of GCM and RCM is conducted on the same system. Table 3 summarises the HPC systems used in this ensemble experiment.
Table 3High-performance computing systems used for the WASCAL high-resolution regional climate ensemble experiment. Control runs are conducted for the period 1979–2014, historical runs for the period 1979–2010 (for details, see text), and RCP4.5 projection runs for the periods 2019–2050 and 2069–2100.
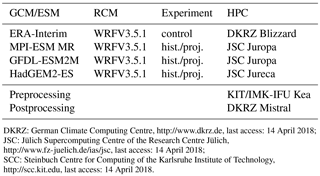
DKRZ: German Climate Computing Centre, http://www.dkrz.de, last access: 14 April 2018; JSC: Jülich Supercomputing Centre of the Research Centre Jülich, http://www.fz-juelich.de/ias/jsc, last access: 14 April 2018; SCC: Steinbuch Centre for Computing of the Karlsruhe Institute of Technology, http://scc.kit.edu, last access: 14 April 2018.
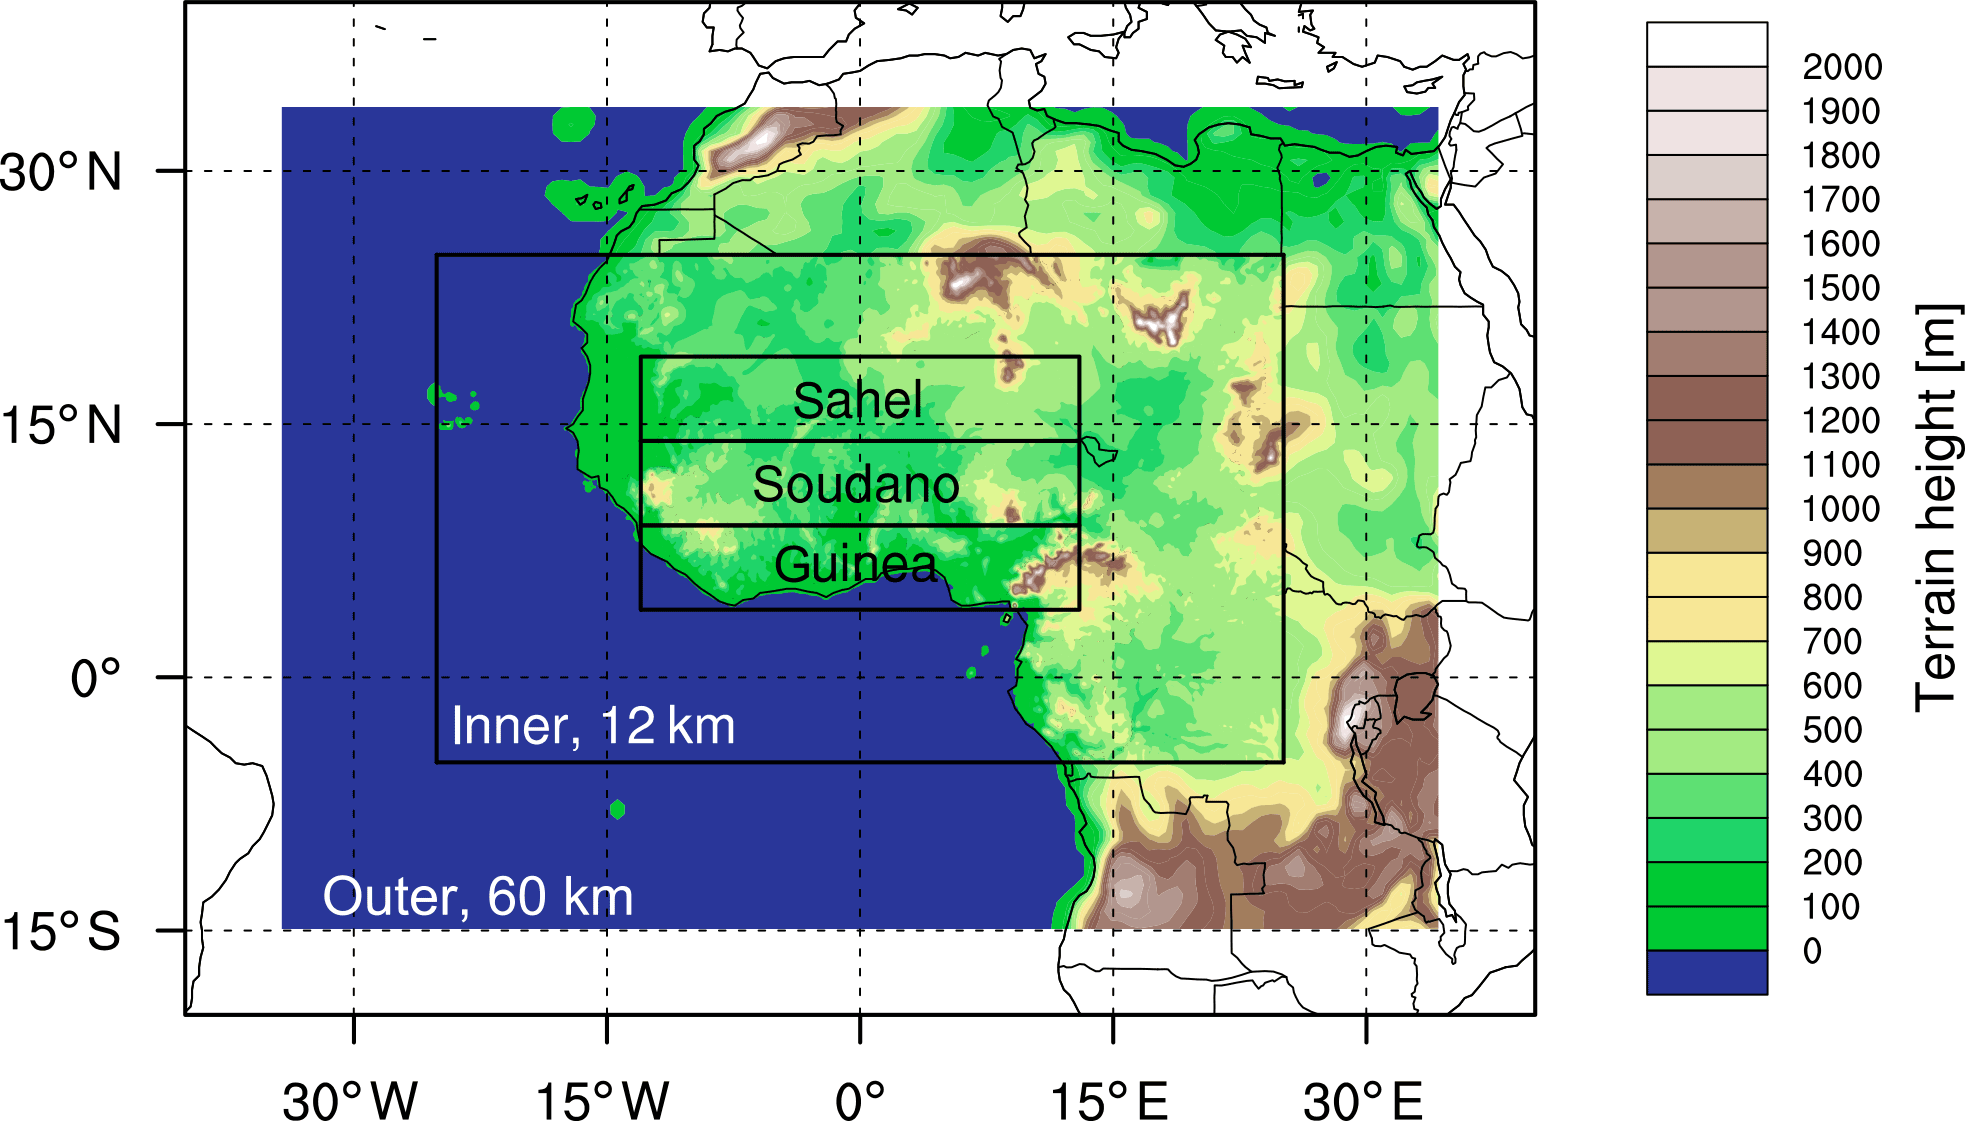
Figure 1Nested domain configuration with 60 and 12 km. Also shown are the three distinct regions used in the assessment.
2.2 WRF model configuration
In limited area modelling, the size of the computational domain can have a significant influence on the quality of the results (Leduc and Laprise, 2008). In a recent study, Browne and Sylla (2012) demonstrated that the ability of a RCM to spin up the regional- and large-scale patterns associated with the West African monsoon flow depends on a suitably large extent of the RCM domain. Figure 1 displays the nested domain configuration for the ensemble experiment, using an outer domain at 60 km resolution to downscale the coarse global forcing data sets and to provide boundary and initial conditions for the inner domain at 12 km horizontal resolution. The figure also defines three analysis regions, following a north–south gradient in increasing annual precipitation. Such a partitioning is commonly used in climate studies (e. g. Dieng et al., 2017, and references therein) and approximates the three dominant agro-climatological regions in West Africa. In addition to the domain configuration, a common standard for the model output was defined for all model runs to facilitate the use of the results. All data are provided in a commonly used binary format for climate data (netCDF CF-1.6) on a regular latitude–longitude grid for a predefined, extensive set of variables and pressure levels (see Sect. 4 for further details).
An inherent problem of limited area modelling is that supplying lateral boundary conditions to nested models can cause severe problems, up to the point where the RCM solution becomes inconsistent with the forcing data. This is problematic for long-term transient simulations associated with a large computational domain, where the solution is no longer an initial value but a boundary value problem (Davies, 1983; Warner et al., 1997; Harris and Durran, 2010; Park et al., 2014). The different approaches to address this issue that are discussed in the literature range from daily to weekly re-initialisation, sometimes even including soil conditions (Otte, 2008), to transient runs covering the entire period of interest (Giorgi et al., 2009; Dieng et al., 2017). In general, more frequent re-initialisation is suitable for studying individual weather events, whereas a longer re-initialisation is useful in climate applications. Here, we adopt an intermediate solution by conducting 11-year time-slice experiments, which allows for 1 year spin-up of the soil conditions each time. For instance, the ERA-Interim-driven control run, providing data for the period 1980–2014, consists of the four time-slice experiments 1979–1990, 1989–2000, 1999–2010 and 2009–2014. Together with a spectral nudging approach on the outer domain (Miguez-Macho et al., 2004; von Storch et al., 2000; Otte et al., 2012), this approach allows the WRF model to spin up and evolve the necessary fine-scale structures, embedded in the large-scale features of the forcing global model, without departing too far from the global conditions.
An optimal configuration of the WRF model is paramount to address key questions regarding the impact of climate change. For the West African region, this equates to an accurate representation of the West African monsoon features in the model. In several studies it was shown that the choice of physical parameterisations available in WRF can greatly influence the model's skills, mostly measured in near-surface temperature and precipitation accuracy (Noble et al., 2014; Klein et al., 2015). For this experiment, we employ WRFV3.5.1 in a configuration summarised in Table 4. This setup is based on the Klein et al. (2015) WRF parameter study of 27 combinations of microphysics, planetary boundary layer and cumulus schemes for two extreme years (dry and wet), forced by ERA-Interim reanalysis data. To account for the different characteristics and resolutions of reanalysis data and GCM data, we extended their study and tested their most promising configurations using MPI-ESM MR (close to the CMIP5 multi model mean; Nikulin et al., 2013) as forcing data. The resulting optimal setup of WRF used in the WASCAL high-resolution ensemble experiment is thus a compromise to obtain good performance for both ERA-Interim and MPI-ESM-MR forcing and also accounts for the higher resolution (12 km versus 24 km in Klein et al., 2015).
WRFV3.5.1 supports the Gregorian and 365-day calendar types, but not the 360-day calendar type employed by the HadGEM2-ES model. It was therefore necessary to add an implementation of the 360-day calendar to WRFV3.5.1. The 360-day calendar caused further complication to the preprocessing of the GCM data, since the grib standard does not support this calendar type. The standard geographic data sets for WPSV3.5.1, available from the WRF Users' website2 were used in this work. Of the available land use classifications, the MODIS+lakes data set at 30 resolution was chosen.
Table 4WRF model configuration for the two domains at 60 and 12 km resolution.
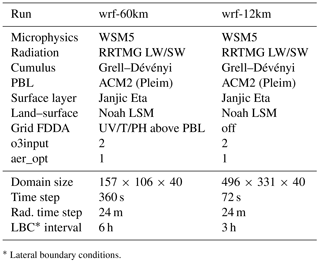
∗ Lateral boundary conditions.

Figure 2Annual cycle of near-surface temperature for the historical period 1980–2010 (a), the near future 2020–2050 (b), and the end of the 21st century 2070–2100 (c), averaged over all land area and for the different regions displayed in Fig. 1. WRF-R: ERA-Interim control run; WRF-M: MPI-ESM-MR historical run; WRF-H: HadGEM2-ES historical run; WRF-G: GFDL-ESM2M historical run; WRF-E: multi-model ensemble of WRF-M, WRF-H and WRF-E. The shaded areas encompass the entire spread of the 12 and 60 km members of the multi-model ensembles.
The forcing model data were obtained from different sources and in different formats. ERA-Interim reanalysis data were downloaded from the European Centre for Medium-Range Forecasting ECMWF MARS archive3, while MPI-ESM-MR data were obtained from DKRZ's CERA archive4, both in grib format. GFDL-ESM2M and HadGEM2-ES data were downloaded from the Earth System Grid Federation (ESGF)5 in netCDF format. This implied slightly different preprocessing steps for using the data as boundary conditions in WRF. For ERA-Interim and MPI-ESM MR, the standard preprocessing chain of WRF could be used, which consists of converting forcing model grib data to an intermediate format (“un-grib”) used by the WRF preprocessing system WPS, which in turn is interpolated horizontally and vertically. For GFDL-ESM2M and HadGEM2-ES data, we implemented a separate tool to convert the netCDF data directly into the WPS intermediate format (“un-netcdf”), thereby avoiding the problem of an unsupported 360-day calendar in the grib standard.
To generate model output in a standard format, the latest developments in the WRF model were employed and extended further: WRFV3.5.1 provides the capability to interpolate model-level data to pressure levels during the integration. This capability was extended to include additional variables (in particular hydrometeors). Further, climate diagnostics such as minimum and maximum daily temperatures are calculated using the climate diagnostics features of the model. While these interpolations require additional calculations during the integration that slow down the model integration, it was found that writing smaller amounts of data to disk (25 pressure levels instead of 40 model levels) overcompensated for this increase and led to a faster model integration. The WRF model output was further post-processed by a suite of parallelised Python utilities to calculate additional variables, add CMIP5/CORDEX variable attributes and provide the desired netCDF-CF compliance.
In this section, we present a qualitative overview of the different WRF model runs and provide guidance to future users of the data. It is also meant to assess the assumptions on the basis of which the ensemble experiment was designed, e.g. the characteristics of the different forcing models mentioned in the previous section. For an in-depth analysis of the WRF simulations and a thorough comparison with existing products from, for example, the CORDEX initiative, the reader is referred to future publications. An evaluation of 27 WRF configurations, including the one used in this experiment, can be found in Klein et al. (2015).
Figure 2 displays the annual cycle of mean near-surface temperatures for the historical reference period 1980–2010, the near future 2020–2050 and the end of the century 2070–2100. For the historical period, observations are obtained from the University of Delaware at 0.5∘ resolution (55 km, UDEL v3.01; Willmott and Matsuura, 2012). Also displayed are data from the AgMERRA climate forcing data sets for agricultural modelling at 0.25∘ resolution (27 km, AgMERRA; Rienecker et al., 2011). The WASCAL climate change projections are displayed at 60 and 12 km resolution for the different model runs WRF-R (forced by ERA-Interim), WRF-M (MPI-ESM MR), WRF-G (GFDL-ESM2M), WRF-H (HadGEM2-ES) and the WRF multi-model ensemble WRF-E, composed of the three GCM-driven runs WRF-M, WRF-G and WRF-H.
For the assessment in this section, all data were interpolated to the high-resolution grid of the WRF 12 km simulations. The lack of high-resolution observations for the West African region impose several limitations on the quality of gridded observational data sets and of reanalysis products, both of which require interpolation and/or satellite blending techniques. As such, any conclusions drawn from a comparison of model data at a substantially higher resolution than that of the observations should be treated with caution. This is in particular important when trying to assess the added value of the 12 km simulations, compared to the 60 km simulations with a resolution similar to the observations.
The AgMERRA data set matches closely with the observations in all regions and throughout the year. Averaged over the different areas and on a monthly timescale, the differences between the 60 and 12 km runs for the same forcing data set are small, compared to differences between model runs with the same resolution and different forcing data sets. The reanalysis run WRF-R agrees with the observations for most parts of the year, except for the height of the monsoon season (July–September), for which the observations show a dip in temperatures that is absent in the WRF-R run. For the Soudano area (see Fig. 1), the WRF-R run shows a larger positive bias than for the other regions. The multi-model ensemble WRF-E shows a cold bias of ∼ 2–4 ∘C for most parts of the year except during the monsoon season, where it matches the observed temperatures closely. The individual components of the ensemble are characterised by WRF-G being consistently colder than, WRF-H being close to, and WRF-M being consistently warmer than WRF-E. Among the three GCM-driven runs, WRF-M fits the observed temperatures best. With respect to future conditions, all model runs show increasing temperatures by 2.5–3 ∘C on average until the end of the century, with WRF-H exhibiting the strongest climate change signal (∼ 4 ∘C) and WRF-G the weakest (< 2 ∘C).
In a similar fashion, Fig. 3 displays the annual cycle of monthly precipitation. Again, AgMERRA fits the observations from UDEL closely. The difference between the 12 and 60 km WRF runs is larger for precipitation than it is for temperature, with a tendency to generate more precipitation in the higher-resolution runs than the lower-resolution runs. This is true for all cases except between July and October along the coast of Guinea. In this particular case, the high-resolution runs, and foremost the WRF-R run, show a distinct drop in precipitation that is absent in the lower-resolution runs and in the observations and reanalyses. All WRF runs tend to overestimate precipitation between February and June along the coast of Guinea and for entire continental West Africa (labelled as “land”) in general, with WRF-R showing the largest excess in precipitation and WRF-G matching the observations best. Among the three GCM-driven ensemble members, WRF-M tends to highest and WRF-G to lowest precipitation amounts, while WRF-H lies in between. Consequently, WRF-E overpredicts precipitation slightly along the coast of Guinea and matches the observations well in the Soudano and Sahel regions. With respect to future conditions, all WRF ensemble members show an increase in precipitation along the coast of Guinea and to some extent in the Soudano region, whereas almost no change can be detected for the Sahel. As for temperature, WRF-H shows the largest and WRF-G the smallest climate change signal.
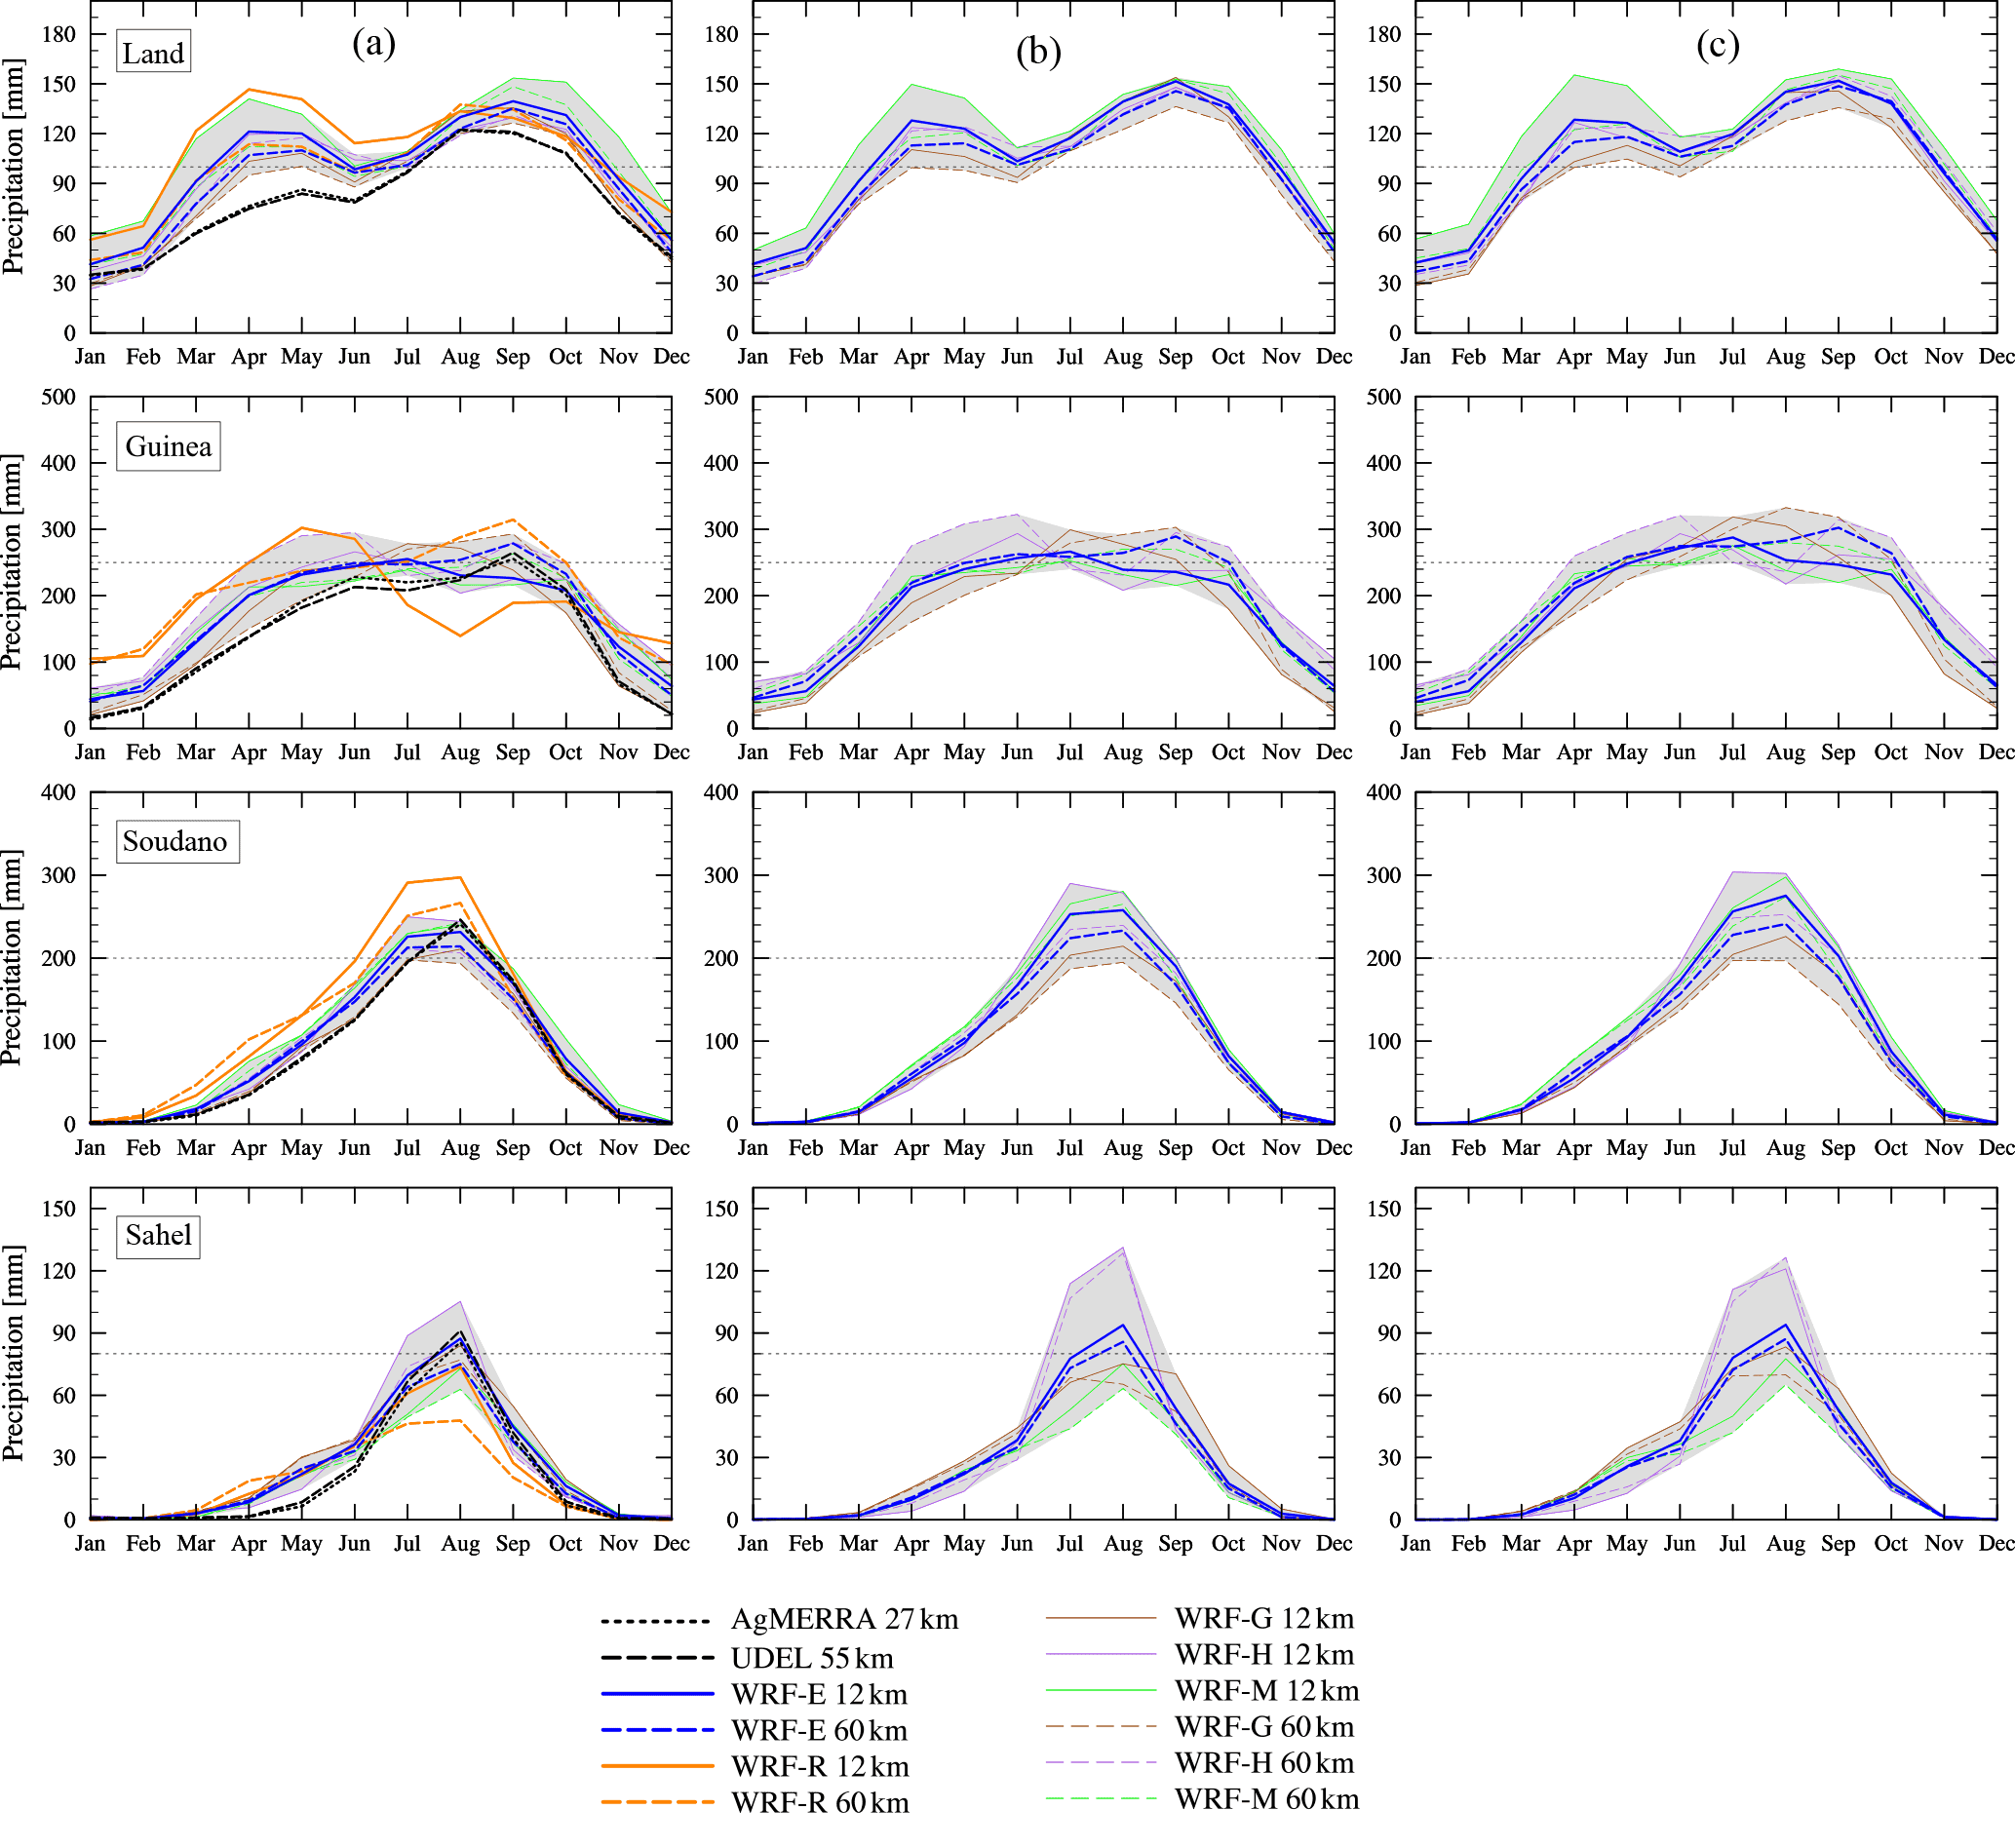
Figure 3Annual cycle of precipitation for the historical period 1980–2010 (a), the near future 2020–2050 (b), and the end of the 21st century 2070–2100 (c), averaged over all land area and for the different regions displayed in Fig. 1. WRF-R: ERA-Interim control run; WRF-M: MPI-ESM-MR historical run; WRF-H: HadGEM2-ES historical run; WRF-G: GFDL-ESM2M historical run; WRF-E: multi-model ensemble of WRF-M, WRF-H and WRF-E. The shaded areas encompass the entire spread of the 12 and 60 km members of the multi-model ensembles.
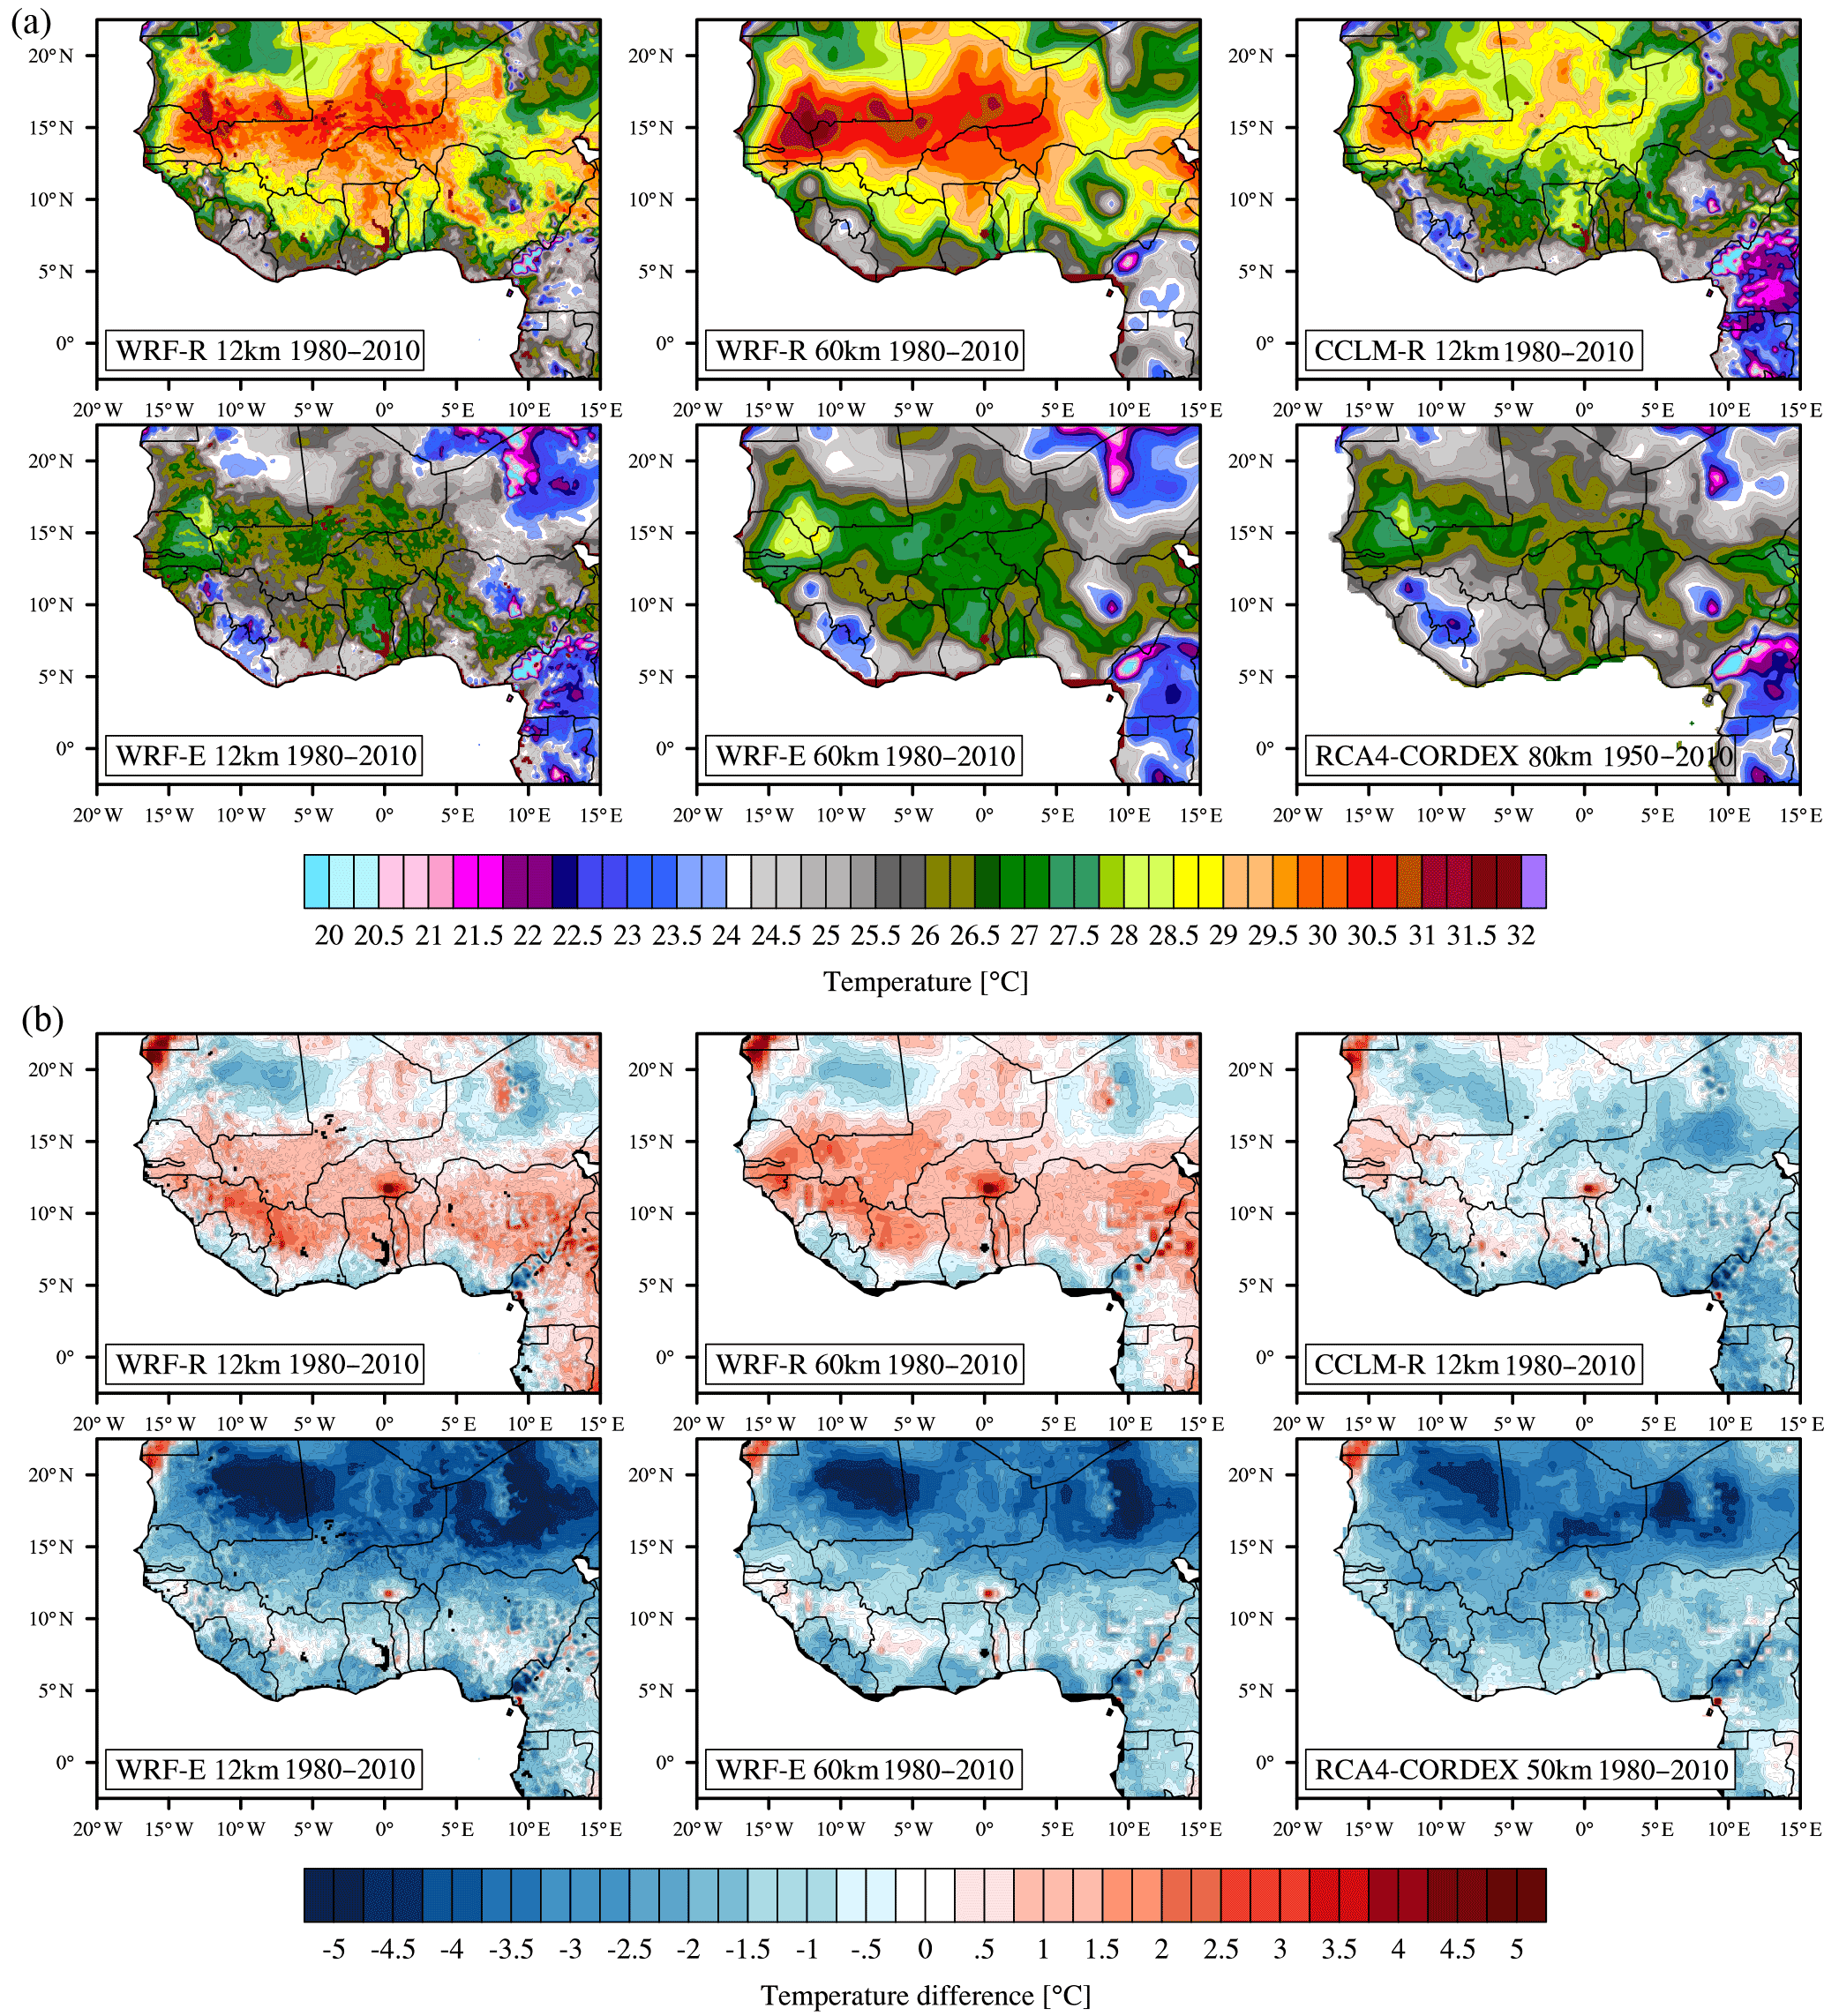
Figure 4Near-surface temperature averaged over the historical reference period 1980–2010 (a) and differences to AgMERRA reanalysis data (b) for the WRF control runs WRF-R, the WRF multi-model ensemble WRF-E, a CCLM control run CCLM-R and a two-member ensemble RCA4-CORDEX.
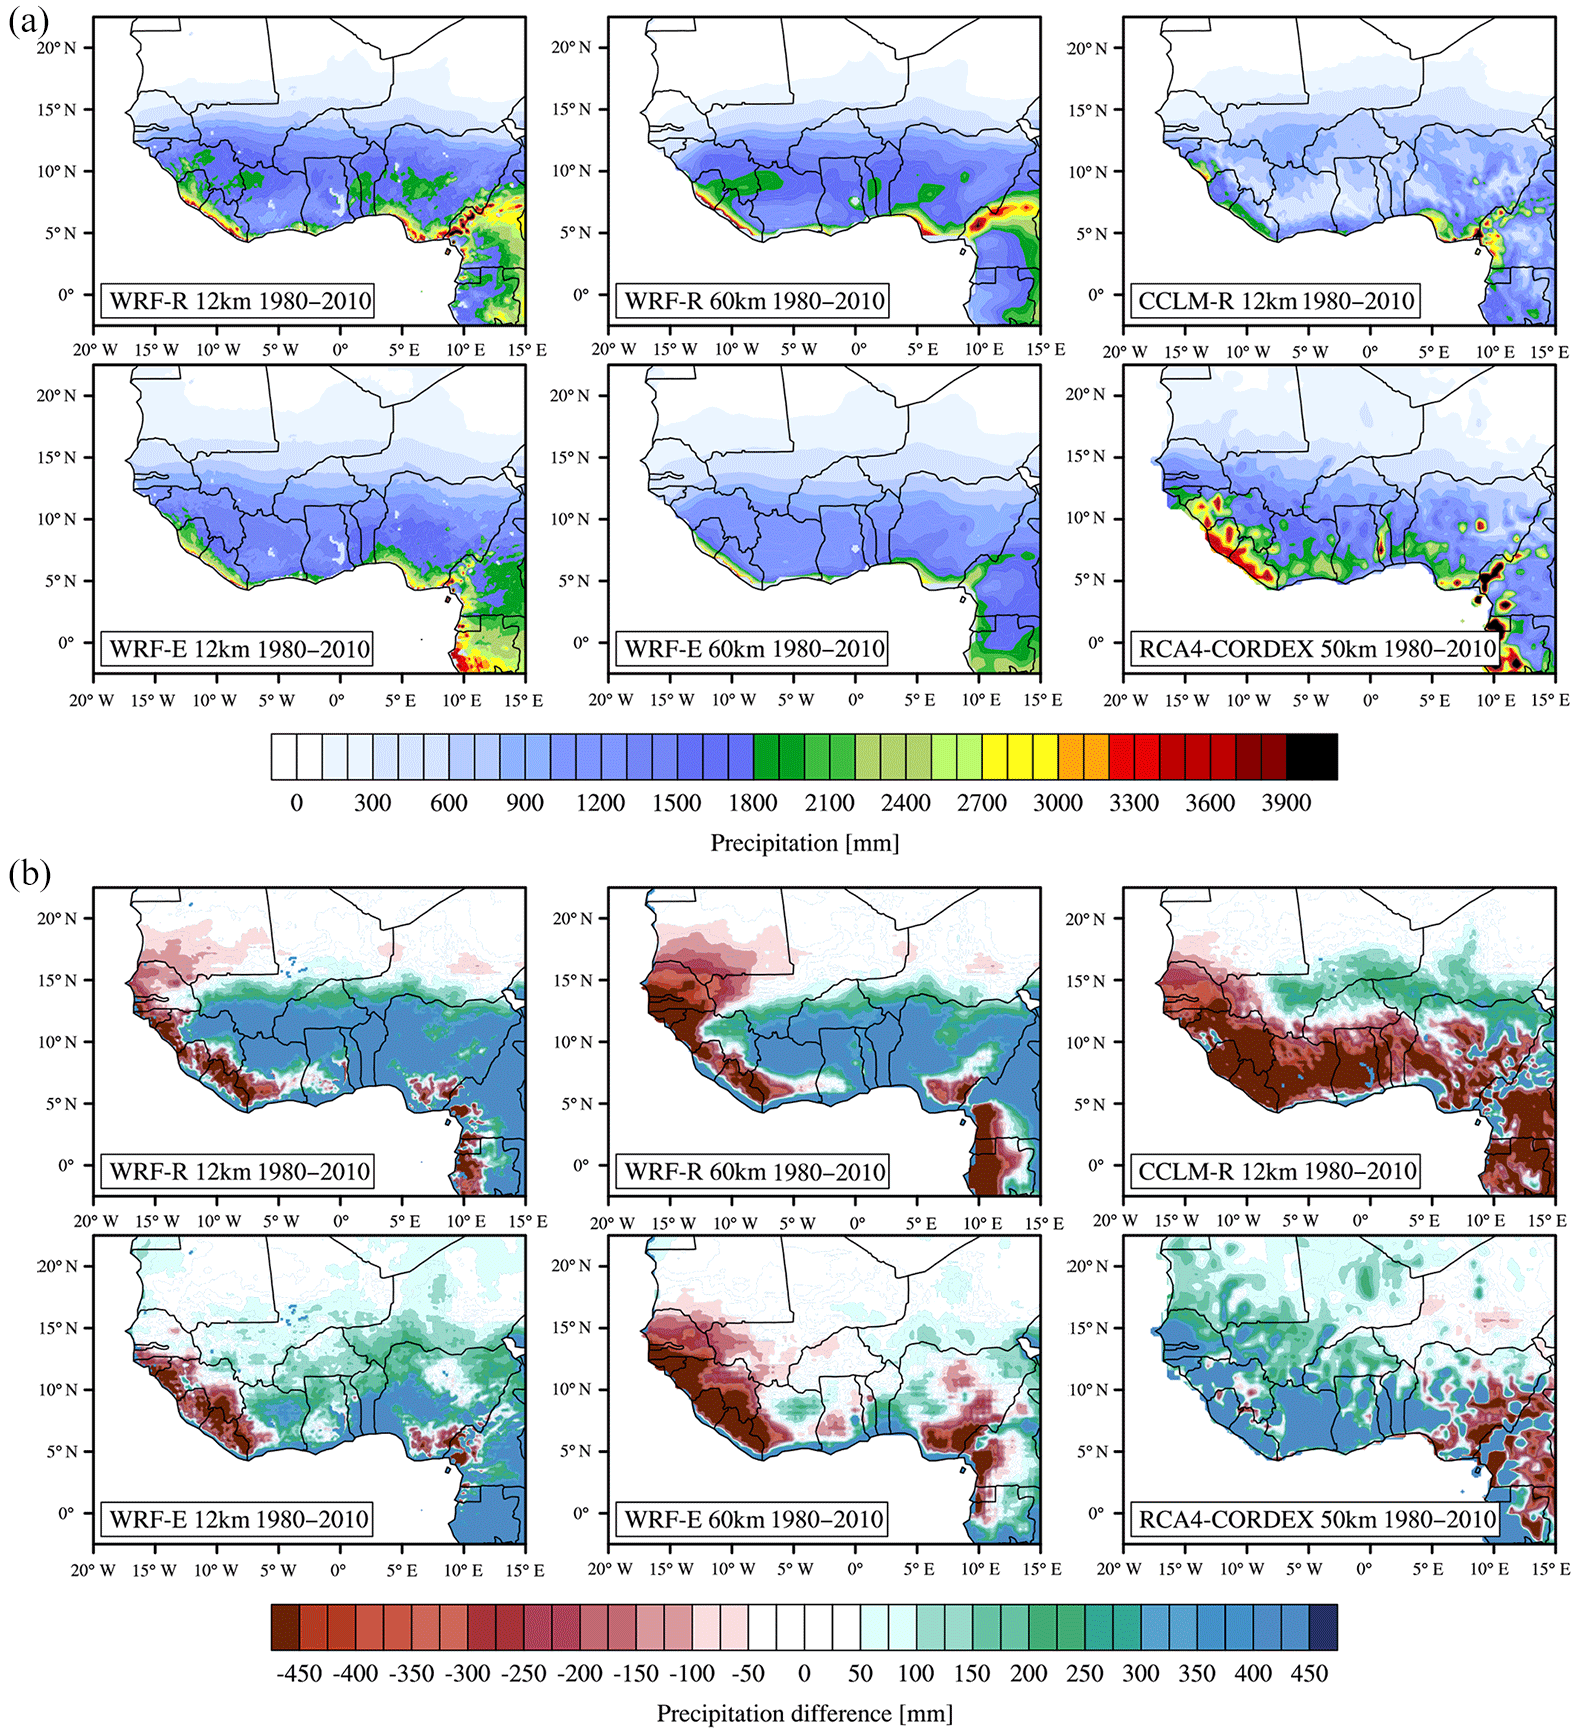
Figure 5Annual precipitation averaged over the historical reference period 1980–2010 (a) and differences to AgMERRA reanalysis data (b) for the WRF control runs WRF-R, the WRF multi-model ensemble WRF-E, a CCLM control run CCLM-R and a two-member ensemble RCA4-CORDEX.
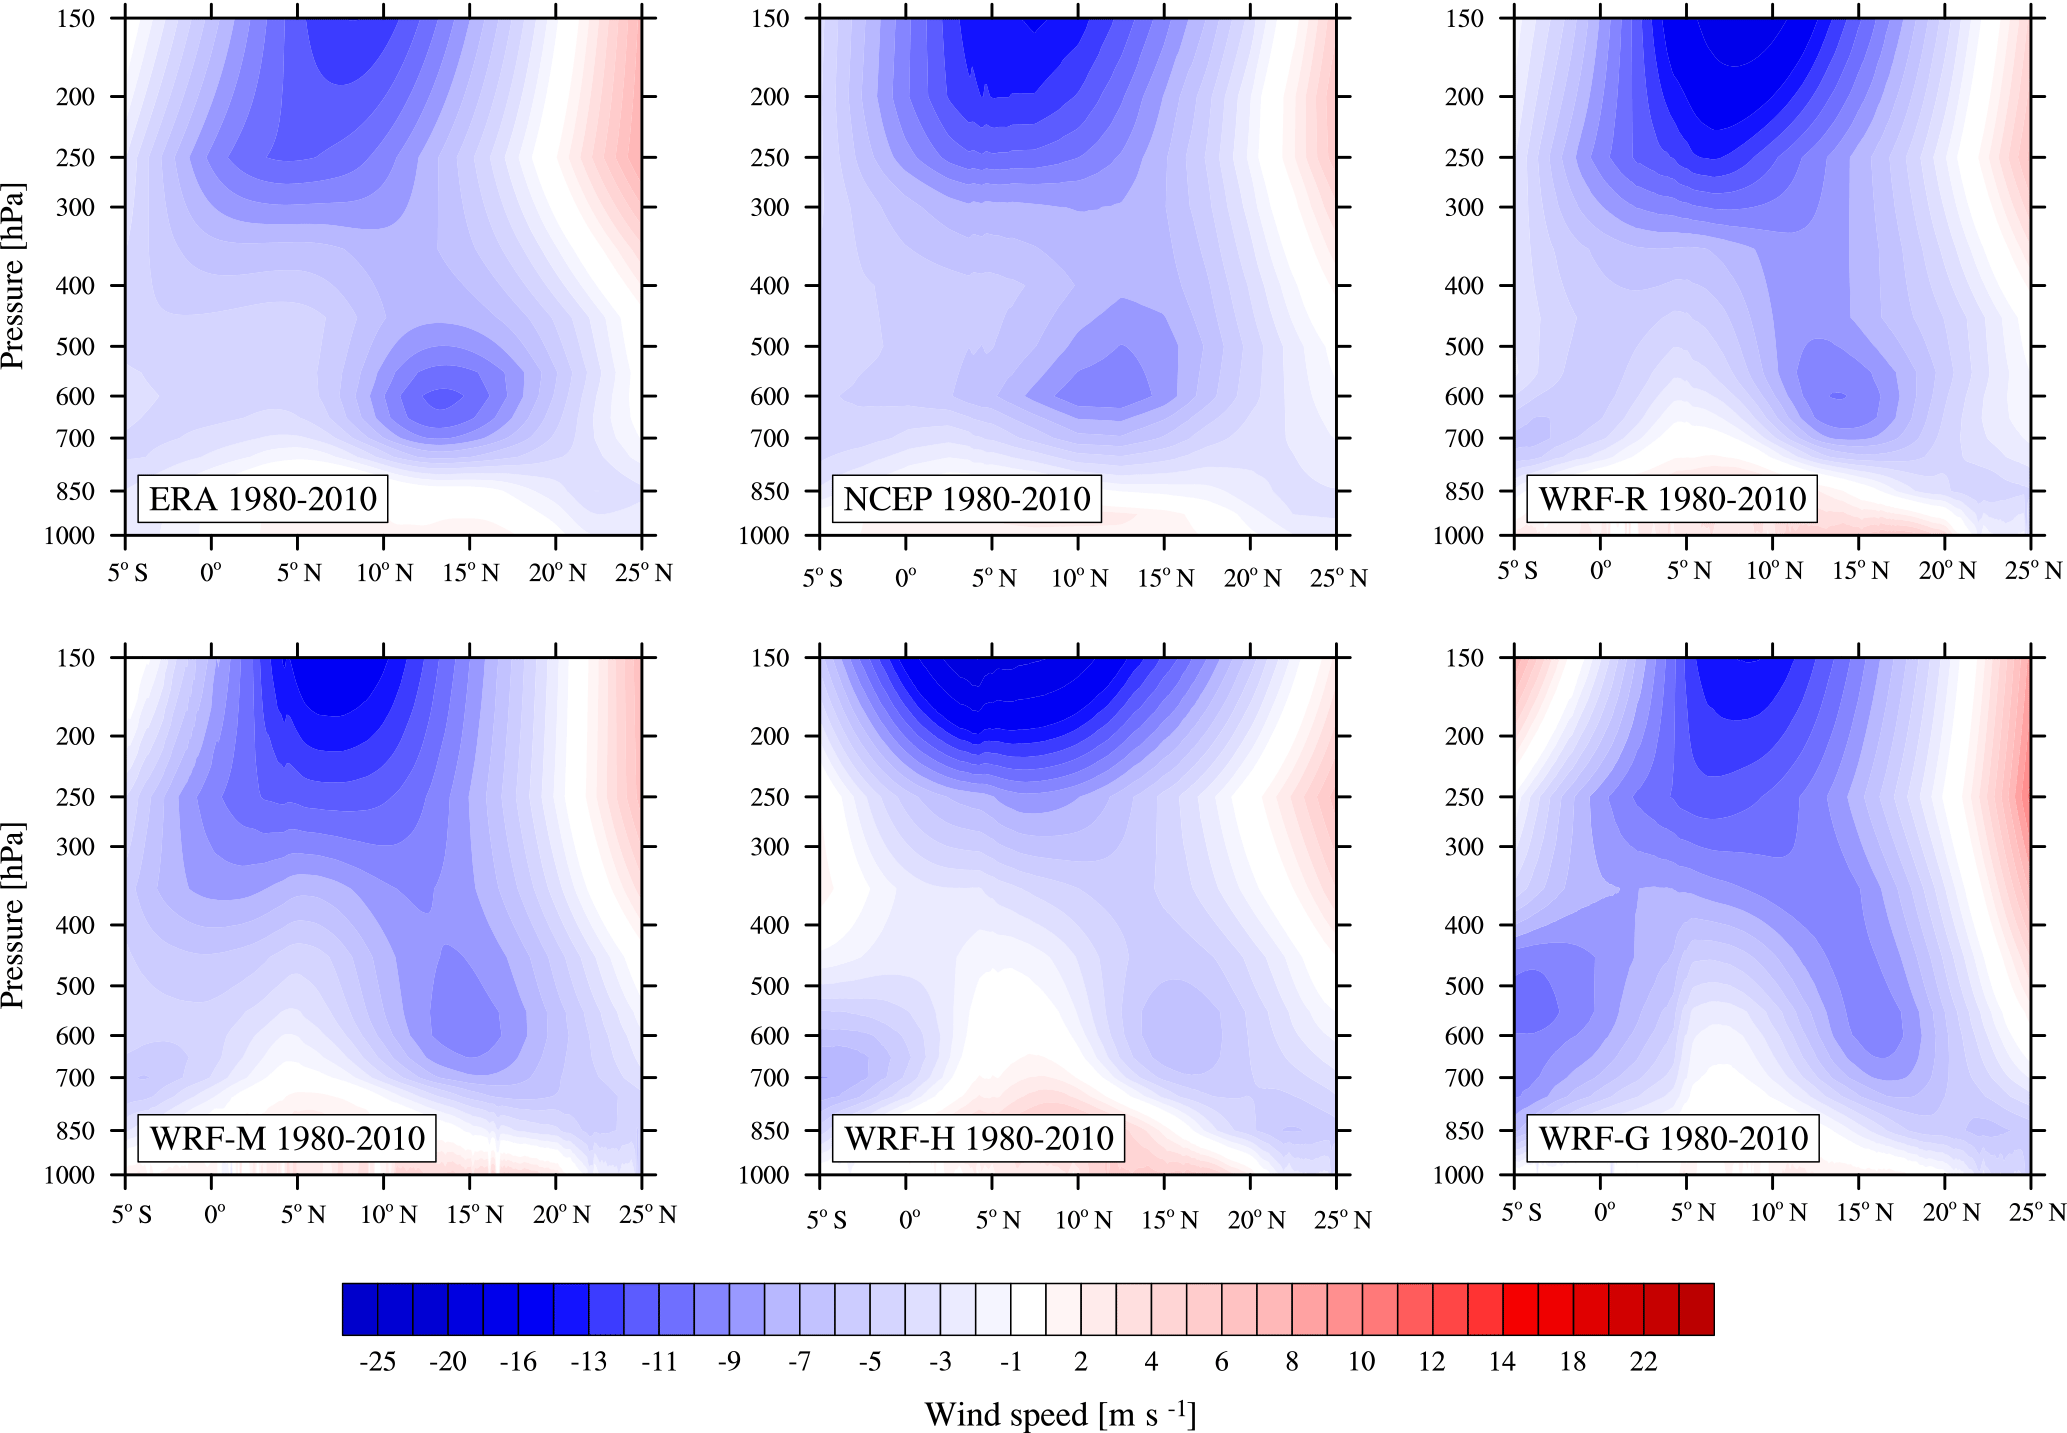
Figure 6Seasonal (June–July–August) mean zonal wind cross section, averaged between 25∘ E and 25∘ W for the historical period 1980–2010 for ERA-Interim and NCEP reanalysis data and the four 12 km WRF runs WRF-R, WRF-M, WRF-H and WRF-G.
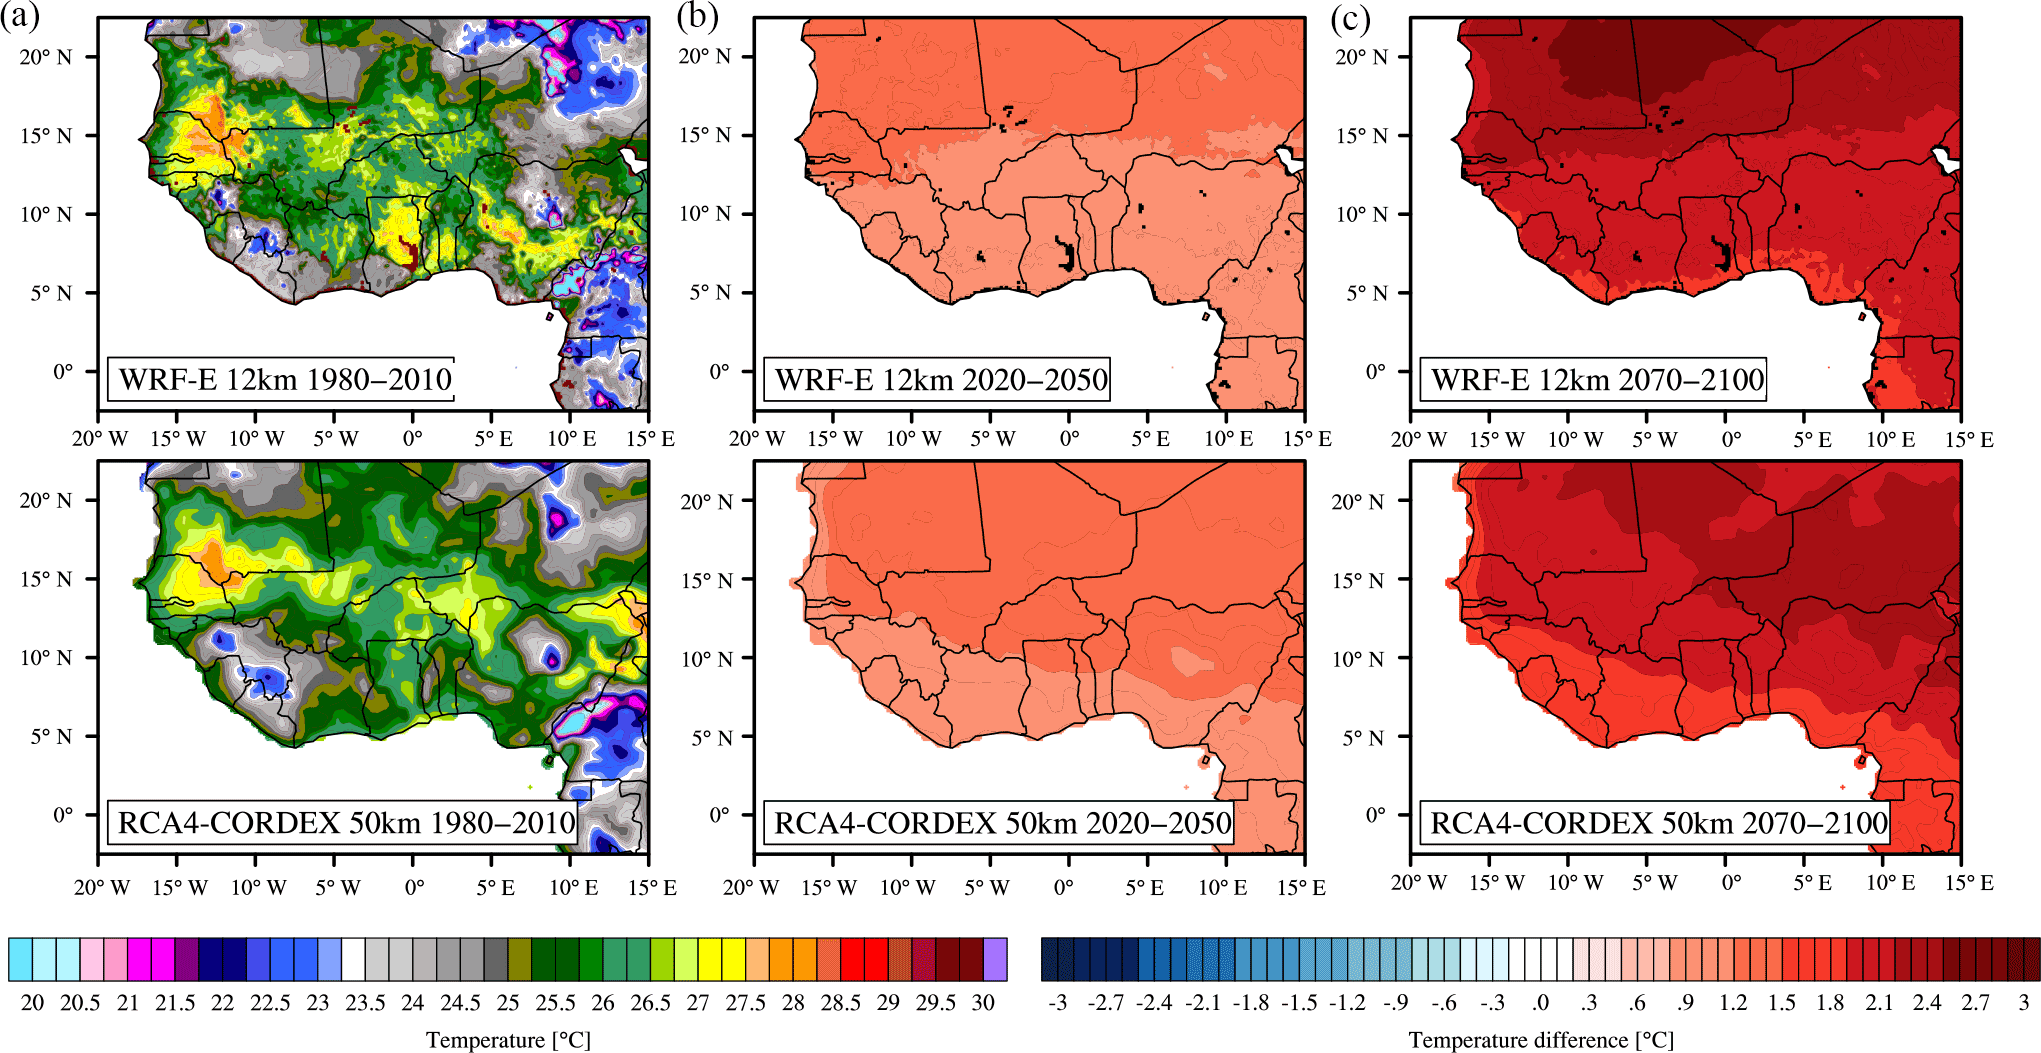
Figure 7Near-surface temperature averaged over the historical reference period 1980–2010 (a) and climate change signal for the near future 2020–2050 (b) and the end of the 21st century 2070–2100 (c) for the WRF multi-model ensemble WRF-E and a two-member ensemble RCA4-CORDEX.
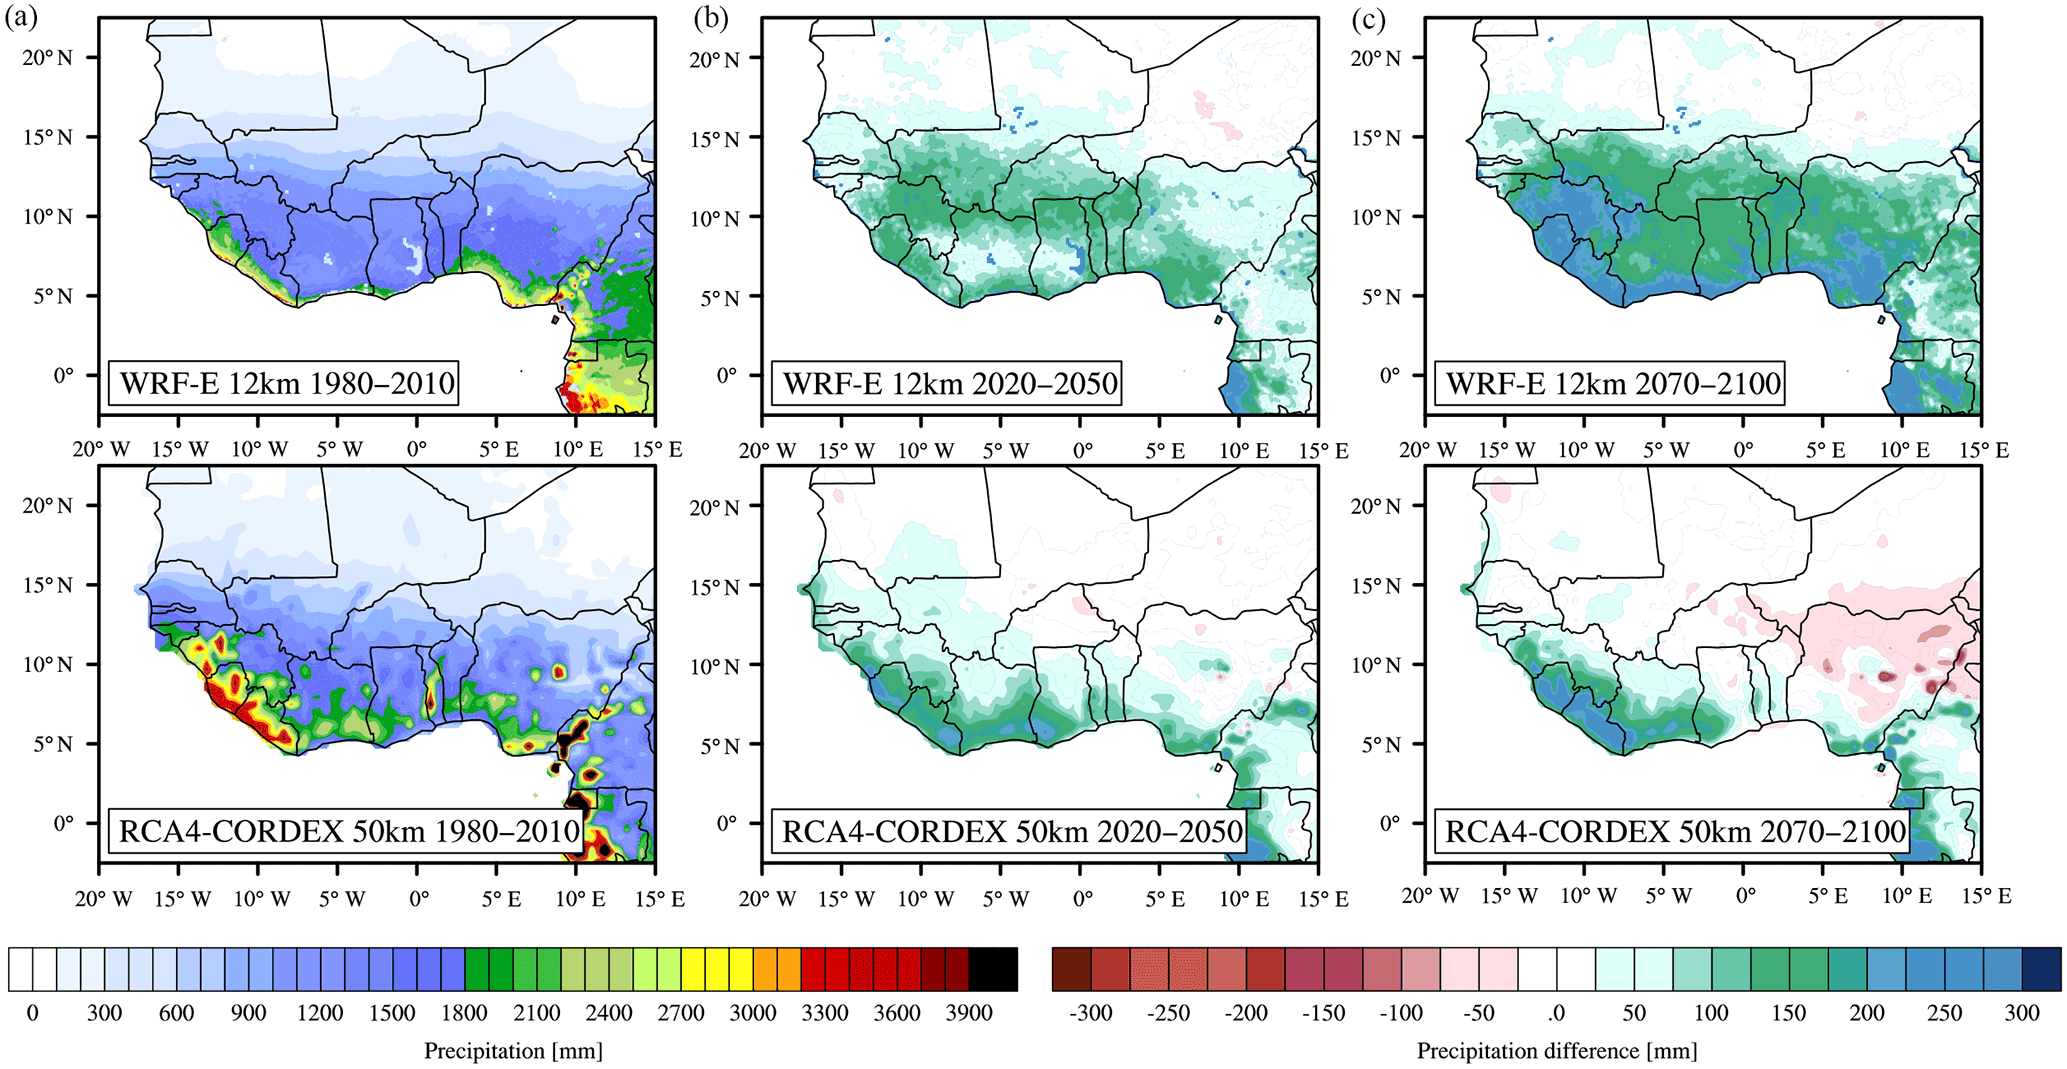
Figure 8Annual precipitation averaged over the historical reference period 1980–2010 (a) and climate change signal for the near future 2020–2050 (b) and the end of the 21st century 2070–2100 (c) for the WRF multi-model ensemble WRF-E and a two-member ensemble RCA4-CORDEX.
Figures 4 and 5 display spatial distributions of annual mean near-surface temperature and annual precipitation at 12 and 60 km resolution for the reanalysis runs WRF-R; the multi-model ensemble WRF-E; an additional high-resolution (12 km) reanalysis run with the CCLM regional climate model, obtained within the WASCAL programme (Dieng et al., 2017); and a two-member ensemble from CORDEX (Giorgi et al., 2009) at 50 km resolution. The two CORDEX simulations use the regional model RCA4 (Strandberg et al., 2014; Kupiainen et al., 2014) to downscale MPI-ESM LR and GFDL-ESM2M forcing data. These simulations were chosen because of their similar/identical forcing models. Also shown are differences of these data sets with respect to AgMERRA at 27 km resolution. To calculate these differences, all data sets were remapped to the 12 km grid of the high-resolution WRF simulations.
With respect to temperature, beyond the findings discussed above, the spatial plots reveal a distinct bipolar cold bias at approximately the location of the Saharan Heat Low (SHL; 20∘ N, 5∘ W) and 15∘ east of it. This feature is present in all WRF, CCLM and CORDEX runs. The spatial patterns of all WRF runs are similar and show relatively higher temperatures in the Soudano region, leading to a warm bias in WRF-R and nearly no bias in WRF-E over this region. The warm belt present in the WRF runs around 10∘ N is confined to west of the Meridian in the CCLM-R run and absent in the CORDEX runs.
For precipitation, the spatial plots shed further light on the zonal distribution of precipitation and the biases relative to AgMERRA. All WRF runs tend to a dry bias along the southwest coast of Guinea, Sierra Leone and Liberia, presumably related to the complex interplay of onshore winds, the coastline and the elevated topography of the Guinea Highlands. Further to the east, the WRF runs tend towards a wet bias, in particular the reanalysis run WRF-R. The CCLM-R run, on the contrary, displays a strong dry bias along the entire coastline and further inland, while the CORDEX runs exhibit a wet bias in most parts of the domain. North of 15∘ latitude, the WRF and CCLM runs fit observed precipitation well, while the CORDEX runs still show a wet bias.
The main dynamical large-scale features associated with the monsoon rainfall across West Africa are illustrated in Fig. 6. For the reference period 1980–2010, the figure displays the zonal wind profile during boreal summer (June–July–August) averaged between 25∘ W and 25∘ E for the two reanalysis data sets ERA-Interim (80 km horizontal resolution, 38 pressure levels) and NCEP/NCAR (275 km horizontal resolution, 17 pressure levels; Kalnay et al., 1996) and for the four 12 km WRF model runs WRF-R, WRF-M, WRF-H and WRF-G. In general, the reanalysis data and the WRF data show the expected stratified structure of the atmospheric circulation that place the monsoon flow (0–15∘ N) and the harmattan fluxes (20–25∘ N) below 850 hPa, the African easterly jet (AEJ, 13∘ N) at mid-levels around 600 hPa, and the tropical easterly jet (TEJ, 10∘ N) in the upper troposphere at 150 hPa. Notably, the WRF-R simulation using ERA-Interim forcing shows a stronger contrast (wind speeds between −20 and +10 m s−1) than the original ERA-Interim reanalysis data (wind speeds −14 to +10 m s−1). Among the GCM-driven WRF runs, WRF-M fits the expected large-scale pattern best, while WRF-H shows a weaker AEJ and WRF-G exhibits an additional jet feature at 5∘ S around 550 hPa. This is insofar interesting as WRF-G shows the strongest cold temperature bias among all WRF runs and at the same time reproduces the observed precipitation patterns and amounts best. The relation of these aspects will be studied in detail in future publications.
Figures 7 and 8 display spatial distributions of the climate change signal on temperature and precipitation for the WRF multi-model ensemble WRF-E and the RCA4 ensemble from CORDEX. With respect to temperature, the WRF ensemble shows a gradient in warming, running from south to north and ranging between 1.5 ∘C at the coast of Guinea to 3 ∘C in Mauritania and northern Mali. The CORDEX runs display a gradient running from southwest to northeast between 1.5 and 2.5 ∘C. For precipitation, the differences between the WASCAL WRF runs and the CORDEX RCA4 runs is more pronounced. This can be partly attributed to the fact that the CORDEX RCA4 ensemble used here lacks a HadGEM2-driven member, which, among the three WRF runs, shows the strongest climate change signal. The WRF ensemble shows a clearly wetter future for the coast of Guinea (up to 300 mm per year) and the Soudano region (up to 200 mm per year) and slightly higher amounts of precipitation in the Sahel region than at present. The CORDEX runs predict larger amounts of annual precipitation only along the southwestern coast of Guinea, a slight drying over Nigeria and no precipitation changes otherwise.
The data are provided in a netCDF CF-1.6-compliant format using netCDF4 compression. All data are interpolated to a regular latitude–longitude grid for a predefined, extensive set of variables and pressure levels. The data are organised in streams with different output intervals as a compromise between the requirements of follow-up studies and storage constraints. A surface stream bundles all variables at and below the surface at 3-hourly intervals, whereas pressure-level variables are provided every 6 h on 25 levels in a pressure stream. Climate diagnostics such as minimum/maximum temperatures are provided daily in a climate stream, and time-invariant information such as land cover and terrain height are collected in a static stream. The naming convention adopted here follows closely the CMIP5 and CORDEX conventions. All data are made available to the public via two different portals. The full data set, i.e. all variables at full temporal and spatial resolution, can be obtained from the CERA database at DKRZ (Heinzeller et al., 2017a, see also Table 1)6. A subset of the data at daily and monthly temporal resolution is also made available through the PANGAEA Data Publisher for Earth & Environmental Science portal (Heinzeller et al., 2017b, see also Table 1)7. The WASCAL climate simulation data are freely accessible to all users, albeit CERA requires a user registration. A full description of the available data and the file naming conventions is provided in Appendix A, alongside the data on CERA8 and on PANGAEA9. On PANGAEA, we also provide the modified versions of WRFV3.5.1 and WPSV3.5.1 used in this work for reference, as well as the configuration (namelists) for all experiments described here.
A novel set of high- and medium-resolution climate change simulations for the greater West African region is provided to the research community within the framework of WASCAL, which advances significantly beyond currently available data sets. The ensemble uses the Weather Research and Forecasting Model (WRF) to downscale three different global circulation models for three 30-year periods between 1980 and 2100, completed by a reanalysis-driven control run for the historical period 1980–2014. These data sets are made available freely through different data portals. A standardised and documented data structure, closely following the CMIP5 and CORDEX conventions, is adopted to foster easy and quick use of the data and effective collaboration. Apart from the higher spatial resolution (12 and 60 km) than existing regional climate change experiments (25–50 km; Giorgi et al., 2009; Sylla et al., 2016) or global simulations (100–200 km; Taylor et al., 2012), our data are provided at high temporal resolution (3-hourly, 6-hourly, daily) on 25 pressure levels and four subsurface levels. A large number of 76 output variables in total are available to enable a diversity of climate change analyses, impact modelling studies and further downscaling to convection-permitting resolutions.
It is important to note that the brief analysis presented here is performed on monthly and annual timescales, averaged over 30-year time slices, and compared to observations and reanalysis data at ∼ 30 km resolution. A detailed analysis of the data using observational data sets at high temporal and spatial resolution (where available), focussing on local-scale features, is beyond the scope of this contribution. The main characteristics of the WRF simulations can be summarised as follows: in general, our WRF setup tends to increase both temperature and precipitation amounts, compared to the original forcing data set. These positive biases, in combination with the characteristics (i.e. biases) of the forcing data sets (Table 2), lead to an overall positive bias of the ERA-Interim-driven WRF runs in temperature and precipitation. For the MPI-ESM-MR-driven WRF runs, they imply a good agreement with respect to temperature, alongside a positive bias in precipitation. Conversely, for the GFDL-ESM2M-driven WRF runs, they lead to a good agreement with respect to precipitation and a large negative bias in temperature. The HadGEM2-ES-driven WRF runs lie in between for both temperature and precipitation.
With respect to climate change, the WRF simulations project an increase in temperature between 1.5 and 3 ∘C, with higher values in the Sahel, in an overall agreement with existing global and regional climate projections (Giorgi et al., 2009; Taylor et al., 2012; Sylla et al., 2016). For precipitation, our simulations project an increase in precipitation between 150 and 300 mm per year all south of 15∘ N, in line with the majority of the CMIP5 models (for example, Lee and Wang, 2014). However, this stands in contrast to existing regional climate modelling studies, for example the findings of Sylla et al. (2016), who analysed the response of West African climate zones to anthropogenic climate change in the late 21st century. Based on ensemble data from CORDEX and their own higher-resolution RegCM4 experiments, they concluded that West Africa evolves towards increasingly torrid, arid and semi-arid conditions. These contradicting signals do highlight the large uncertainty in projected future rainfall, even on a continental scale.
The WRF simulations in this WASCAL high-resolution ensemble are conducted as a time-slice experiment over 10 years, preceded by an additional year for model spin-up. As discussed in Bruyère et al. (2016) and Lucas-Picher et al. (2008), the internal variability of regional models is generally small compared to the interannual variability in decadal simulations. On the other hand, it is less clear whether differences between individual 10-year periods are dominated by climate variability rather than climate change. We therefore advocate the utilisation of the entire 30-year periods, each consisting of three consecutive decadal simulations, for the present day (1980–2010), the near future (2030–2050) and the distant future (2070–2100). To do so, the spin-up period of 1 year for each of the decadal runs has to be neglected.
Despite its widespread use, classical limited area modelling as it is used in the regional downscaling experiments presented here suffers from several limitations such as numerical artefacts at domain and nest boundaries, diverging solutions between the regional model and the global forcing model and the inability to provide feedback from the regional to the forcing model, to name a few. Alternative modelling systems such as the global Model for Prediction Across Scales (MPAS; Skamarock et al., 2012) make use of innovative variable-resolution mesh geometries with smooth transitions between different areas of refinement and provide excellent scaling on modern high-performance computing systems. MPAS was tested recently, using uniform and variable-resolution meshes over the region of West Africa, and showed promising results (Heinzeller et al., 2016). For instance, the 60–12 km variable-resolution mesh used in their study (i.e. with a 60 km resolution globally and a 12 km resolution over the entire North African continent) shows a clear bipolar pattern of high temperatures in the locations where all of the regional climate simulations presented here exhibit a cold bias (Fig. 4 here versus Figs. 9 and 11 in Heinzeller et al., 2016). This could be related to an improved representation of large-scale patterns governing the West African climate in global models and requires further investigation.
Within the framework of WASCAL, additional high-resolution climate simulations are carried out, employing other regional climate models such as CCLM (Dieng et al., 2017) or focusing on specific areas such as the agriculturally important Volta Basin (Annor et al., 2017). Also, to improve the representation of the diurnal cycle of precipitation and of extreme precipitation events in the models, convection-permitting and coupled atmospheric–hydrological modelling experiments are pursued (Arnault et al., 2016; Klein et al., 2017; Naabil et al., 2017). The climate modelling efforts presented here are undertaken in parallel to the setup of a dense network of automatic weather stations in the region with the goal of assessing and reducing model uncertainties and biases. Together, the modelling and observational activities of WASCAL will enable researchers and stakeholders to develop effective climate change mitigation measures for West Africa with a higher level of confidence from local to continental scales.
The full description of the available data and the file naming conventions provided in this appendix are identical to the information contained in the WASCAL_WRF_README on CERA (https://cera-www.dkrz.de/WDCC/ui/Entry.jsp?acronym=WASCAL_WRF_README, last access: 14 April 2018.) and on PANGAEA (https://doi.pangaea.de/10013/epic.51574.d001, last access: 14 April 2018.).
A1 Description of variables
Table A1 summarises the list of output variables of the WASCAL climate simulations. The table includes all variables that are produced by the WRF model runs. Static variables are provided only once in the static output stream. For further information on the meaning and calculation of these fields, the user is referred to the WRF Users' Guide, in particular to Chapter 510. The variable types are “acc” (accumulated values), “coord” (coordinate variables), “const” (constant values), “min” (minimum over last output interval), “max” (maximum over last output interval) and “inst” (instantaneous values). The variables are classified into different streams with different output frequency (see Sect. A2 below).
Note 1. The climate output diagnostic variables contained in stream wrfclm are only available for the high-resolution (12 km) experiments, not for the low-resolution (60 km) experiments.
Note 2. The following time-slice experiments are missing the accumulated radiation budgets (rlds, rldt, rlus, rlut, rsds, rsdt, rsus, rsut; see Sect. A4 and A5 for details on the time slices and naming conventions): WRF12_MPIESM_HIST/{1979–1990, 1999–2006}, WRF12_MPIESM_RCP45/{2006–2010, 2039–2050, 2089–2100}.
A2 Description of streams
The output variables are classified into different output streams, which are described in Table A2. The streams have different output frequencies. Note that the stream classification does not appear in the directory structure or file names (see Sect. A4 below).
A3 Pressure levels for stream wrfprs
The native model output is interpolated to 25 pressure levels, see Table A3. Variables on pressure levels are set to missing values below ground.
A4 Description of files
The data are provided in compressed netCDF4 CF-1.6-compliant format. All data are combined into monthly output files, independent of the output frequency and size of the variables. The coarser 60 km runs provide the same data as the 12 km runs except for the climate output diagnostics (stream wrfclm is not present). A consistent filename convention is adopted and described in Table A4.
A5 Description of nesting strategy and time slices
The domain configuration is displayed and described in detail in the main text. The high-resolution runs (12 km) are carried out as a nested simulation, using the output of the coarser resolution (60 km) model runs as the forcing data set. The coarser model runs are forced by the different reanalysis and GCM data sets described above. An offline-nesting approach is adopted, which implies no feedback from the 12 km experiments to the 60 km experiments. Thus, the 60 km experiments can be considered as stand-alone experiments at a relatively coarse resolution.
The experiments are conducted as time-sliced runs of 11-year duration each, where the first year is considered as a spin-up period and should not be used in the analysis. The historical run 1999–2006 is carried over into the projection run 2006–2010 to be able to provide model data for the WMO reference period 1980–2010 by combining the three decadal time-slice experiments 1979–1990, 1989–2000 and 1999–2010 and neglecting the spin-up year for each of them. The available time slices are summarised in Table A5.
Table A1List of output variables of the WASCAL WRF climate simulations. The variable types are “acc” (accumulated values), “coord” (coordinate variables), “const” (constant values), “min” (minimum over last output interval), “max” (maximum over last output interval) and “inst” (instantaneous values).
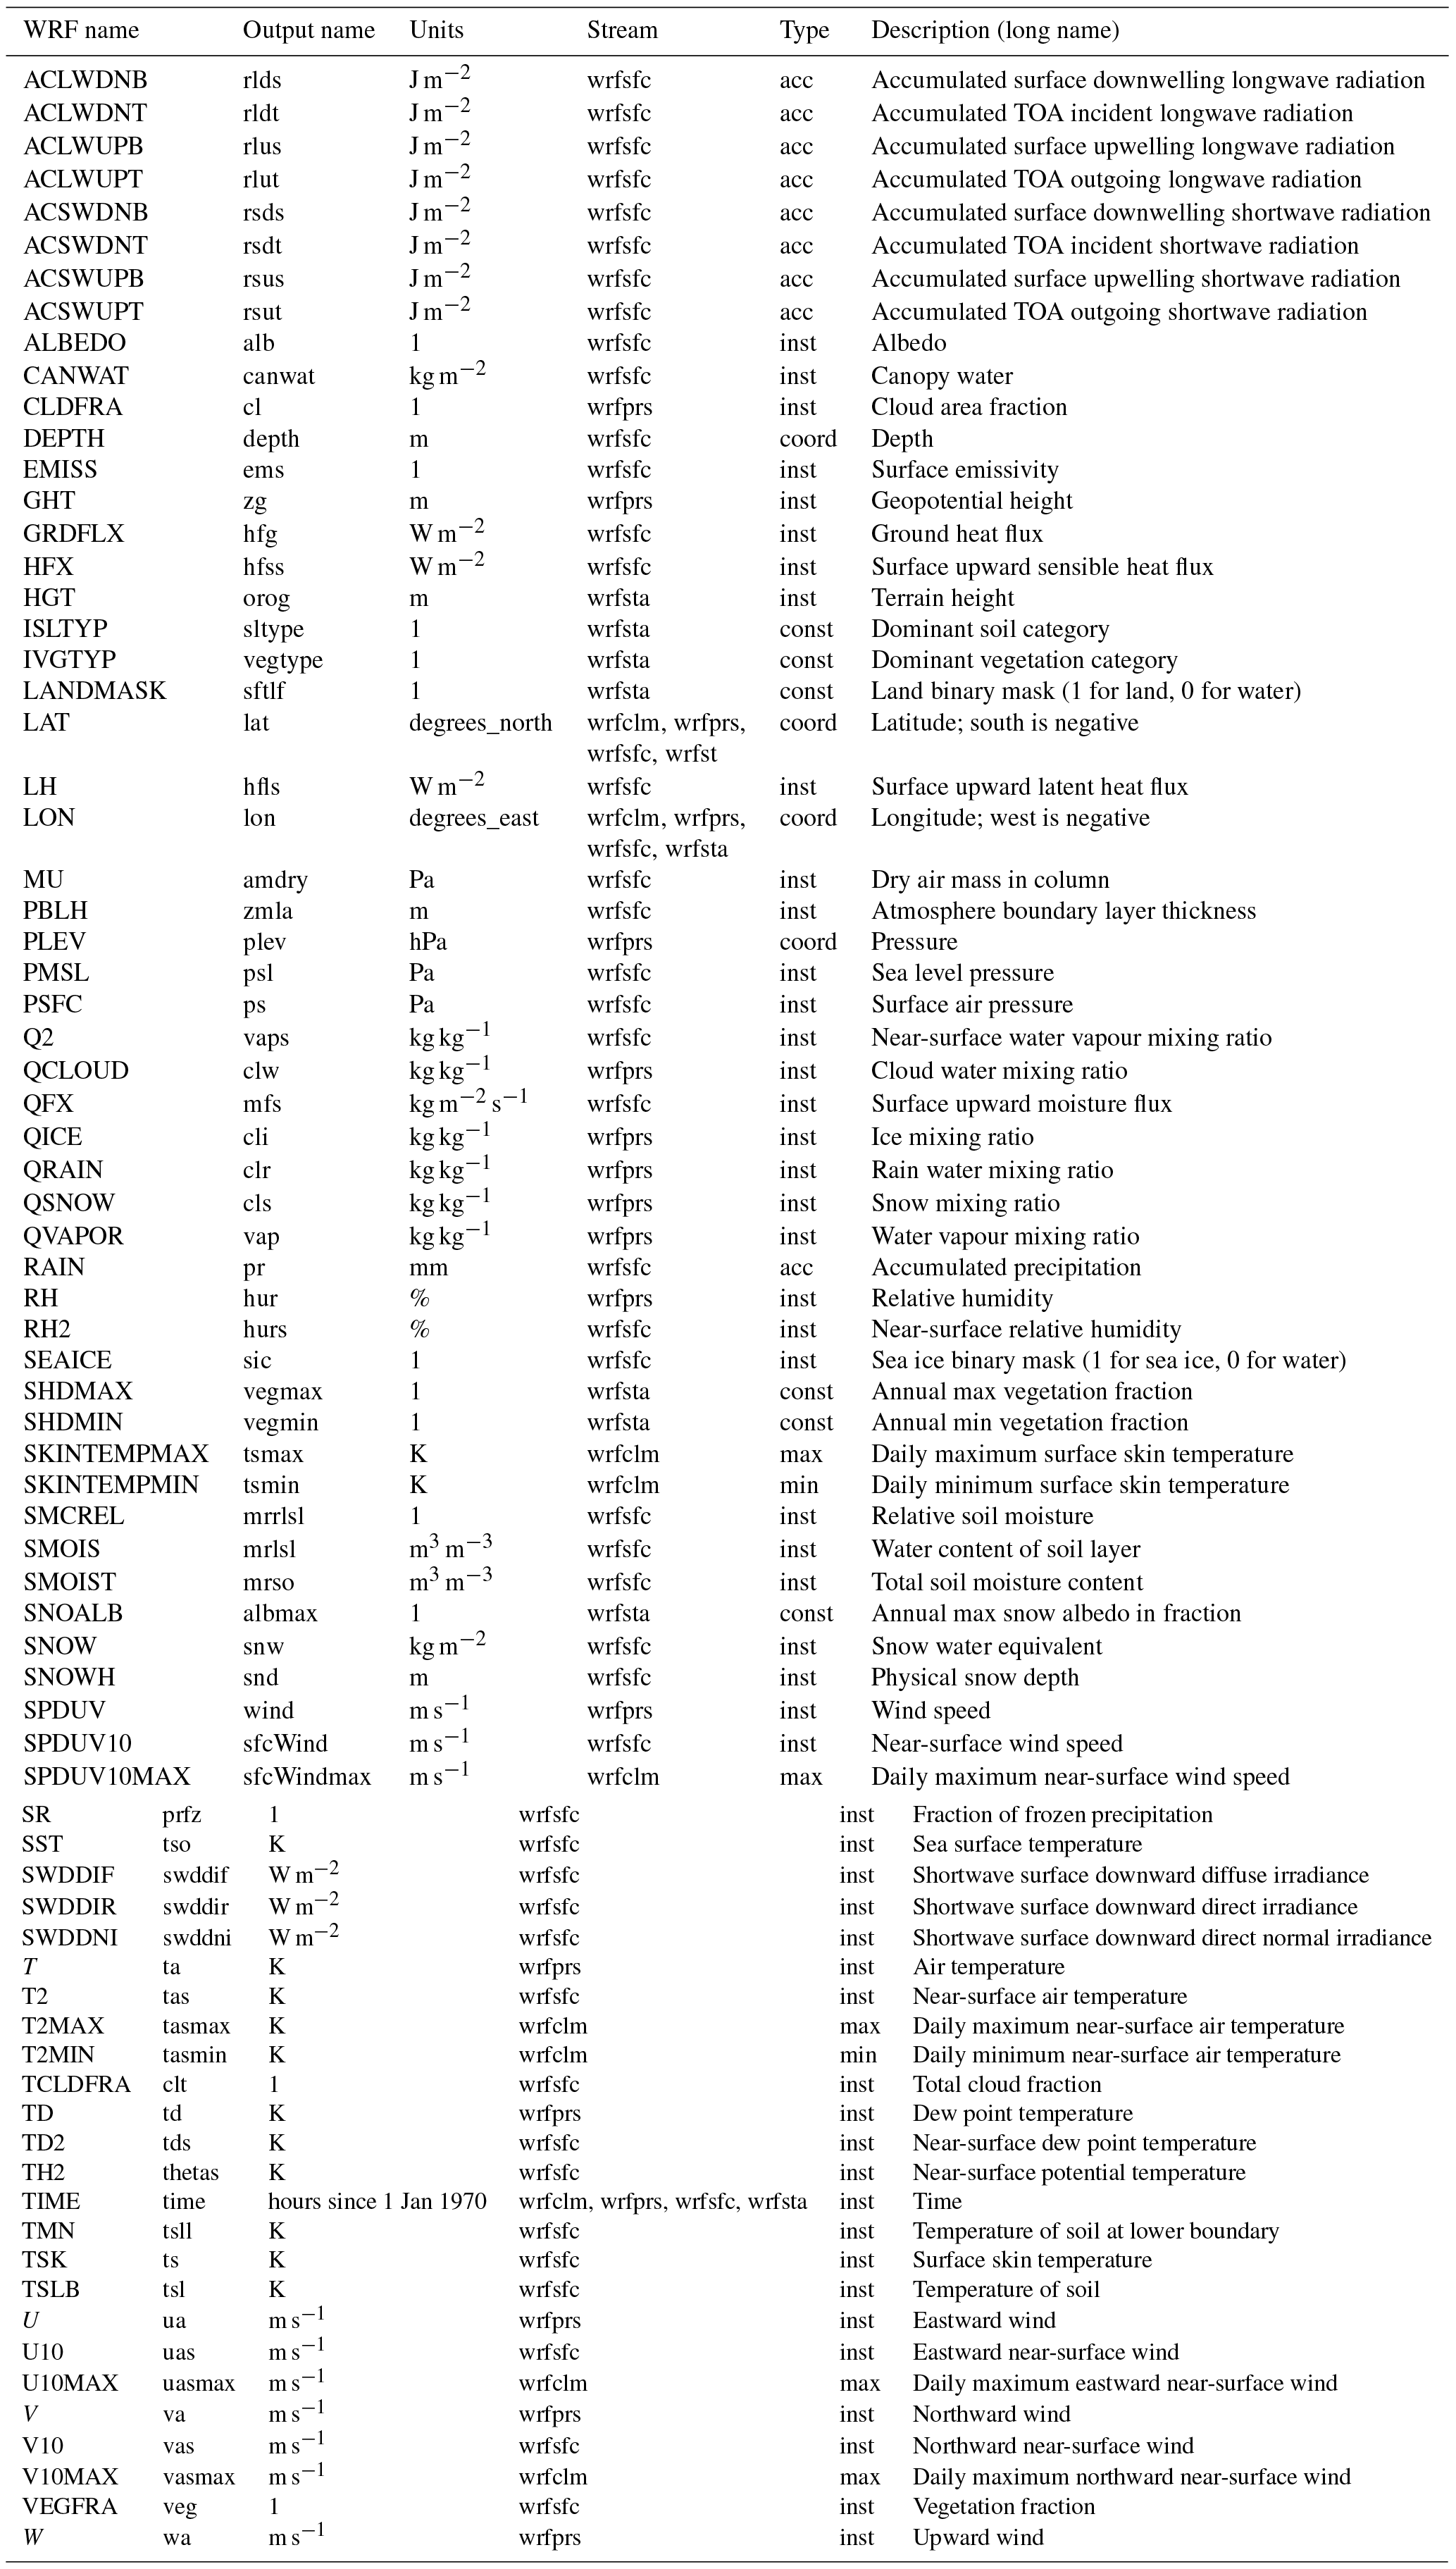
Table A2Description of streams into which the WASCAL WRF output variables are classified.
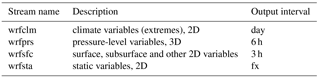
Table A3Pressure levels to which three-dimensional atmospheric variables are interpolated.

Table A4File naming convention for the WASCAL WRF ensemble. Here, {sr} denotes the spatial resolution in km, {forcing} the forcing model, {scenario} the scenario, {var} the variable, {yyyy}–{mm} the year and month, and {tr} the output interval (temporal resolution).
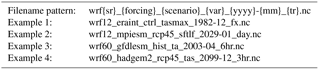
Table A5Description of time slices generated in the WASCAL WRF ensemble experiment, including spin-up period.
A6 Subset of data available at PANGAEA
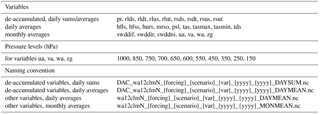
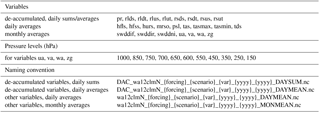
To facilitate the use of the WASCAL data for applications that do not require the full set of variables or the full temporal resolution of the data, a subset of the data set available at CERA is provided through the PANGAEA portal. This subset is derived from the data provided at CERA as follows:
-
Only data from the high-resolution 12 km runs are considered, not from the intermediate-resolution 60 km runs.
-
A subset of variables of potentially high interest are selected (see Table A6).
-
Accumulated data (rainfall; radiation budgets are de-accumulated into precipitation sums and radiation averages between two output time steps).
-
Data at high temporal resolution (3-hourly, 6-hourly) are aggregated to daily or monthly timescales.
-
Atmospheric variables on pressure levels are extracted for 11 out of the 25 available pressure levels (see Table A6).
-
Data are concatenated into 30-year periods 1980–2010 (control, historical), 2020–2050 (RCP4.5), 2070–2100 (RCP4.5), thereby neglecting the 1-year spin-up period for each of the time-slice experiments.
-
A slightly different file naming convention is adopted to reflect the above modifications of the data (see Table A6).
Note 1. The accumulated radiation budgets are missing for the runs using MPI-ESM as forcing data set (see also Sect. A1).
Note 2. For the periods 1980–2010, the historical runs 1999–2005 are completed by the (continuation) runs 2006–2010 from the RCP4.5 scenario, but the 30-year data sets are labelled as “historical”.
A7 Rights of use
The data are provided under the Creative Commons license 4.0. For details about the licensing model, see the following web page: https://creativecommons.org/licenses/by/4.0/, last access: 14 April 2018.
A8 Liability and warranty
-
The data are made available to the user without any warranty. The user is aware that the data have been obtained according to current state-of-the-art science and computational engineering.
-
The data producer must not be taken into any obligation to third parties on the basis of this agreement. Any liability of the data producer for damage of all kinds resulting from the provision and further processing of the data is ruled out.
-
The liability disclaimer stated under (1) and (2) does not apply insofar as the data producer has acted in gross negligence or with wilful intent.
The authors declare that they have no conflict of interest.
This work was funded by the German Federal Ministry of Education and Research
(BMBF) through the West African Science Service Center on Climate Change and
Adapted Land Use (WASCAL), and by the Bavarian State Ministry of Education,
Sciences and the Arts through a KONWIHR (Competence Network for Scientific
High-Performance Computing) project. We acknowledge that the results of this
research were achieved using computational resources at the German Climate
Computing Center (DKRZ) and the Research Centre Jülich. The authors
acknowledge the European Centre for Medium-Range Weather Forecasts (ECMWF)
for the dissemination of ERA-Interim, as well as the Global Modeling and
Assimilation Office (GMAO) for the dissemination of AgMERRA. Further, we
acknowledge the NOAA/OAR/ESRL Physical Sciences Division for providing UDEL air temperature and precipitation as
well as the NCEP reanalysis derived data, the Earth System Grid Federation
(ESGF) for providing CMIP5 model data from the GFDL-ESM2M and HadGEM2-ES
earth system models, and DKRZ for providing MPI-ESM-MR model data. We also
thank the DKRZ long-term archiving service CERA and the PANGAEA Data
Publisher for Earth & Environmental Science platform for providing the
necessary storage to disseminate the data generated in our ensemble
experiment. The authors are particularly grateful for the extensive and
valuable support from Heinke Hoeck and Peter Lenzen of DKRZ and Stefanie
Schumacher and Rainer Sieger of PANGEA with ingesting the data and generating
the necessary metadata for the data dissemination. We also thank the two anonymous referees for useful comments
and corrections that helped to improve this manuscript.
Edited by: David Carlson
Reviewed by: two anonymous referees
Annor, T., Lamptey, B., Wagner, S., Oguntunde, P., Arnault, J., Heinzeller, D., and Kunstmann, H.: High-resolution long-term WRF climate simulations over Volta Basin. Part 1: validation analysis for temperature and precipitation, Theor. Appl. Climatol., 1–21, https://doi.org/10.1007/s00704-017-2223-5, 2017. a
Anon, A.: GFDL's ESM2 Global Coupled Climate-Carbon Earth System Models. Part I: Physical Formulation and Baseline Simulation Characteristics, J. Climate, 25, 6646–6665, https://doi.org/10.1175/JCLI-D-11-00560.1, 2012. a
Arnault, J., Wagner, S., Rummler, T., Fersch, B., Bliefernicht, J., Andresen, S., and Kunstmann, H.: Role of runoff-infiltration partitioning and resolved overland flow on land-atmosphere feedbacks: A case-study with the WRF-Hydro coupled modeling system for West Africa, J. Hydrometeorol., 17, 1489–1516, https://doi.org/10.1175/JHM-D-15-0089.1, 2016. a
Browne, N. A. K. and Sylla, M. B.: Regional climate model sensitivity to domain size for the simulation of the West African summer monsoon rainfall, International Journal of Geophysics, 2012, 625831, https://doi.org/10.1155/2012/625831, 2012. a
Bruyère, C. L.: Regional Climate Research using WRF and MPAS: Overview and Future Development, 14th Annual WRF Workshop, Boulder, Colorado, USA, June 2013. a
Bruyère, C., Raktham, C., Done, J., Kreasuwun, J., Thongbai, J., and Promnopas, W.: Major weather regime changes over Southeast Asia in a near-term future scenario, Clim. Res., 72, 1–18, https://doi.org/10.3354/cr01442, 2016. a
Buontempo, C., Mathison, C., Jones, R., Williams, K., Wang, C., and McSweeney, C.: An ensemble climate projection for Africa, Clim. Dynam., 44, 2097–2118, https://doi.org/10.1007/s00382-014-2286-2, 2015. a
Cook, K. H.: Generation of the African easterly jet and its role in determining West African precipitation, J. Climate, 12, 1165–1184, https://doi.org/10.1175/1520-0442(1999)012<1165:GOTAEJ>2.0.CO;2, 1999. a
Davies, H. C.: Limitations of Some Common Lateral Boundary Schemes used in Regional NWP Models, Mon. Weather Rev., 111, 1002–1012, https://doi.org/10.1175/1520-0493(1983)111<1002:LOSCLB>2.0.CO;2, 1983. a
Dee, D. P., Uppala, S. M., Simmons, A. J., Berrisford, P., Poli, P., Kobayashi, S., Andrae, U., Balmaseda, M. A., Balsamo, G., Bauer, P., Bechtold, P., Beljaars, A. C. M., van de Berg, L., Bidlot, J., Bormann, N., Delsol, C., Dragani, R., Fuentes, M., Geer, A. J., Haimberger, L., Healy, S. B., Hersbach, H., Hólm, E. V., Isaksen, L., Kållberg, P., Köhler, M., Matricardi, M., Mcnally, A. P., Monge-Sanz, B. M., Morcrette, J. J., Park, B. K., Peubey, C., de Rosnay, P., Tavolato, C., Thépaut, J. N., and Vitart, F.: The ERA-Interim reanalysis: Configuration and performance of the data assimilation system, Q. J. Roy. Meteor. Soc., 137, 553–597, https://doi.org/10.1002/qj.828, 2011. a
Dieng, D., Smiatek, G., Bliefernicht, J., Heinzeller, D., Sarr, A., Gaye, A. T., and Kunstmann, H.: Evaluation of the COSMO-CLM high-resolution climate simulations over West Africa, J. Geophys. Res.-Atmos., 122, 1437–1455, https://doi.org/10.1002/2016JD025457, 2017. a, b, c, d
Eguavoen, I.: Climate change and trajectories of blame in northern ghana, Anthropol. Noteb., 19, 5–24, 2013. a
Elguindi, N., Giorgi, F., and Turuncoglu, U.: Assessment of CMIP5 global model simulations over the subset of CORDEX domains used in the Phase I CREMA, Climatic Change, 125, 7–21, https://doi.org/10.1007/s10584-013-0935-9, 2014. a, b
Flaounas, E., Janicot, S., Bastin, S., Roca, R., and Mohino, E.: The role of the Indian monsoon onset in the West African monsoon onset: Observations and AGCM nudged simulations, Clim. Dynam., 38, 965–983, https://doi.org/10.1007/s00382-011-1045-x, 2012. a
Giorgi, F., Jones, C., and Asrar, G. R.: Addressing climate information needs at the regional level: the CORDEX framework, WMO Bulletin, 58, 175–183, 2009. a, b, c, d, e
Grell, G. A., Dudhia, J., and Stauffer, D. R.: A description of the Fifth-generation Penn State/NCAR Mesoscale Model (MM5), NCAR Technical Note NCAR/TN-398+STR, 121 pp., https://doi.org/10.5065/D60Z716B, 1994. a
Harris, L. M. and Durran, D. R.: An Idealized Comparison of One-Way and Two-Way Grid Nesting, Mon. Weather Rev., 138, 2174–2187, https://doi.org/10.1175/2010MWR3080.1, 2010. a
Heinzeller, D., Duda, M. G., and Kunstmann, H.: Towards convection-resolving, global atmospheric simulations with the Model for Prediction Across Scales (MPAS) v3.1: an extreme scaling experiment, Geosci. Model Dev., 9, 77–110, https://doi.org/10.5194/gmd-9-77-2016, 2016. a, b, c
Heinzeller, D., Dieng, D., Smiatek, G., Olusegun, C., Klein, C., Hamann, I., Bliefernicht, B., and Kunstmann, H.: West African Science Service Centre on Climate Change and Adapted Land Use (WASCAL) High-Resolution Climate Simulation Data, https://doi.org/10.1594/WDCC/WRF60_GFDLESM_HIST, https://doi.org/10.1594/WDCC/WRF60_GFDLESM_RCP45, https://doi.org/10.1594/WDCC/WRF60_HADGEM2_RCP45, https://doi.org/10.1594/WDCC/WRF60_MPIESM_HIST, https://doi.org/10.1594/WDCC/WRF60_MPIESM_RCP45, https://doi.org/10.1594/WDCC/WRF60_ERAINT_CTRL, https://doi.org/10.1594/WDCC/WRF60_HADGEM2_HIST, https://doi.org/10.1594/WDCC/WRF12_ERAINT_CTRL, https://doi.org/10.1594/WDCC/WRF12_MPIESM_RCP45, https://doi.org/10.1594/WDCC/WRF12_GFDLESM_RCP45, https://doi.org/10.1594/WDCC/WRF12_HADGEM2_RCP45, https://doi.org/10.1594/WDCC/WRF12_GFDLESM_HIST, https://doi.org/10.1594/WDCC/WRF12_HADGEM2_HIST, https://doi.org/10.1594/WDCC/WRF12_MPIESM_HIST, https://cera-www.dkrz.de/WDCC/ui/Project.jsp?acronym=WASCAL (last access: 14 April 2018), 2017a. a
Heinzeller, D., Dieng, D., Smiatek, G., Olusegun, C., Klein, C., Hamann, I., Bliefernicht, B., and Kunstmann, H.: West African Science Service Centre on Climate Change and Adapted Land Use (WASCAL) high-resolution climate simulation data, links to subset of variables at daily and monthly temporal resolution in NetCDF format, PANGAEA, https://doi.org/10.1594/PANGAEA.880512, 2017b. a
Jones, C. D., Hughes, J. K., Bellouin, N., Hardiman, S. C., Jones, G. S., Knight, J., Liddicoat, S., O'Connor, F. M., Andres, R. J., Bell, C., Boo, K.-O., Bozzo, A., Butchart, N., Cadule, P., Corbin, K. D., Doutriaux-Boucher, M., Friedlingstein, P., Gornall, J., Gray, L., Halloran, P. R., Hurtt, G., Ingram, W. J., Lamarque, J.-F., Law, R. M., Meinshausen, M., Osprey, S., Palin, E. J., Parsons Chini, L., Raddatz, T., Sanderson, M. G., Sellar, A. A., Schurer, A., Valdes, P., Wood, N., Woodward, S., Yoshioka, M., and Zerroukat, M.: The HadGEM2-ES implementation of CMIP5 centennial simulations, Geosci. Model Dev., 4, 543–570, https://doi.org/10.5194/gmd-4-543-2011, 2011. a
Jung, G. and Kunstmann, H.: High-resolution regional climate modeling for the Volta region of West Africa, J. Geophys. Res., 112, 1–17, https://doi.org/10.1029/2006JD007951, 2007. a
Kalnay, E., Kanamitsu, M., Kistler, R., Collins, W., Deaven, D., Gandin, L., Iredell, M., Saha, S., White, G., Woollen, J., Zhu, Y., Chelliah, M., Ebisuzaki, W., Higgins, W., Janowiak, J., Mo, K. C., Ropelewski, C., Wang, J., Leetmaa, A., Reynolds, R., Jenne, R., and Joseph, D.: The NCEP/NCAR 40-Year Reanalysis Project, B. Am. Meteorol. Soc., 77, 437–472, https://doi.org/10.1175/1520-0477(1996)077<0437:TNYRP>2.0.CO;2, 1996. a
Kirtman, B., Power, S. B., Adedoyin, J. A., Boer, G. J., Bojariu, R., Camilloni, I., Doblas-Reyes, F. J., Fiore, A. M., Kimoto, M., Meehl, G. A., Prather, M., Sarr, A., Schär, C., Sutton, R., van Oldenborgh, G. J., Vecchi, G., and Wang, H.-J.: Near-term Climate Change: Projections and Predictability, in: Climate Change 2013: The Physical Science Basis. Contribution of Working Group I to the Fifth Assessment Report of the Intergovernmental Panel on Climate Change, edited by: Stocker, T., Chap. 11, 953–1028, https://doi.org/10.1017/CBO9781107415324.023, 2013. a
Klein, C., Heinzeller, D., Bliefernicht, J., and Kunstmann, H.: Variability of West African monsoon patterns generated by a WRF multi-physics ensemble, Clim. Dynam., 45, 2733–2755, https://doi.org/10.1007/s00382-015-2505-5, 2015. a, b, c, d, e
Klein, C., Bliefernicht, J., Heinzeller, D., Gessner, U., Klein, I., and Kunstmann, H.: Feedback of observed interannual vegetation change: a regional climate model analysis for the West African monsoon, Clim. Dynam., 48, 2837–2858, https://doi.org/10.1007/s00382-016-3237-x, 2017. a
Kupiainen, M., Jansson, C., Samuelsson, P., Jones, C., Willén, U., Hansson, U., Ullerstig, A., Wang, S., and Döscher, R.: Rossby Centre regional atmospheric model, RCA4, Rossby Center News Letter, available at: https://www.smhi.se/en/research/research-departments/climate-research-rossby-centre2-552/rossby-centre-regional-atmospheric-model-rca4-1.16562 (last access: 14 April 2018), 2014. a
Laprise, R.: Resolved Scales and Nonlinear Interactions in Limited-Area Models, J. Atmos. Sci., 60, 768–779, https://doi.org/10.1175/1520-0469(2003)060<0768:RSANII>2.0.CO;2, 2003. a
Leduc, M. and Laprise, R.: Regional climate model sensitivity to domain size, Clim. Dynam., 32, 833–854, https://doi.org/10.1007/s00382-008-0400-z, 2008. a
Lee, J. Y. and Wang, B.: Future change of global monsoon in the CMIP5, Clim. Dynam., 42, 101–119, https://doi.org/10.1007/s00382-012-1564-0, 2014. a
Lucas-Picher, P., Caya, D., Elía, R., and Laprise, R.: Investigation of regional climate models' internal variability with a ten-member ensemble of 10-year simulations over a large domain, Clim. Dynam., 31, 927–940, https://doi.org/10.1007/s00382-008-0384-8, 2008. a
Miguez-Macho, G., Stenchikov, G. L., and Robock, A.: Spectral nudging to eliminate the effects of domain position and geometry in regional climate model simulations, J. Geophys. Res., 109, D13104, https://doi.org/10.1029/2003JD004495, 2004. a
Mounkaila, M. S., Abiodun, B. J., and 'Bayo Omotosho, J.: Assessing the capability of CORDEX models in simulating onset of rainfall in West Africa, Theoretical and Applied Climatology, 119, 255–272, https://doi.org/10.1007/s00704-014-1104-4, 2015. a
Naab, J., Bationo, A., Wafula, B. M., Traore, P. S., Zougmore, R., Ouattara, M., Tabo, R., and Vlek, P. L. G.: African Perspectives on Climate Change and Agriculture: Impacts, Adaptation and Mitigation Potential, Handbook of Climate Change and Agroecosystems, 85–106, https://doi.org/10.1142/9781848169845_0006, 2012. a
Naabil, E., Lamptey, B. L., Arnault, J., Kunstmann, H., and Olufayo, A.: Water resources management using the WRF-Hydro modelling system: Case-study of the Tono dam in West Africa, Journal of Hydrology: Regional Studies, 12, 196–209, https://doi.org/10.1016/j.ejrh.2017.05.010, 2017. a
Neumann, R., Jung, G., Laux, P., and Kunstmann, H.: Climate trends of temperature, precipitation and river discharge in the Volta Basin of West Africa, International Journal of River Basin Management, 5, 17–30, https://doi.org/10.1080/15715124.2007.9635302, 2007. a
Niang, I., Ruppel, O., Abdrabo, M., Essel, A., Lennard, C., Padgham, J., and Urquhart, P.: Africa, in: Climate Change 2014: Impacts, Adaptation, and Vulnerability. Part B: Regional Aspects. Contribution of Working Group II to the Fifth Assessment Report of the Intergovernmental Panel on Climate Change, edited by: Barros, V., Field, C., Dokken, D., Mastrandrea, M., Mach, K., Bilir, T., Chatterjee, M., Ebi, K., Estrada, Y., Genova, R., Girma, B., Kissel, E., Levy, A., MacCracken, S., Mastrandrea, P., and White, L. L., Cambridge University Press, Chap. 22, 1199–1265, available at: https://www.ipcc.ch/pdf/assessment-report/ar5/wg2/WGIIAR5-Chap22_FINAL.pdf (last access: 14 April 2018), 2014. a
Nicholson, S. E.: The West African Sahel: A Review of Recent Studies on the Rainfall Regime and Its Interannual Variability, ISRN Meteorology, 2013, 453521, https://doi.org/10.1155/2013/453521, 2013. a
Nikulin, G., Jones, C., Giorgi, F., Asrar, G., Büchner, M., Cerezo-Mota, R., Christensen, O. B., Déqué, M., Fernandez, J., Hänsler, A., van Meijgaard, E., Samuelsson, P., Sylla, M. B., and Sushama, L.: Precipitation Climatology in an Ensemble of CORDEX-Africa Regional Climate Simulations, J. Climate, 25, 6057–6078, https://doi.org/10.1175/JCLI-D-11-00375.1, 2012. a
Nikulin, G., Jones, C., Kjellström, E., and Gbobaniyi, E.: The West African Monsoon simulated by global and regional climate models, EGU General Assembly, Vienna, Austria, 7–12 April 2013, EGU2013-4581, available at: http://meetingorganizer.copernicus.org/EGU2013/EGU2013-4581.pdf (last access: 14 April 2018), 2013. a, b
Noble, E., Druyan, L., and Fulakeza, M.: The sensitivity of WRF daily summertime simulations over West Africa to alternative parameterizations. Part I: african wave circulation, Mon. Weather Rev., 142, 1588–1608, https://doi.org/10.1175/MWR-D-13-00194.1, 2014. a
Otte, T. L.: The impact of nudging in the meteorological model for retrospective air quality simulations. Part I: Evaluation against national observation networks, J. Appl. Meteorol. Clim., 47, 1853–1867, https://doi.org/10.1175/2007JAMC1790.1, 2008. a
Otte, T. L., Nolte, C. G., Otte, M. J., and Bowden, J. H.: Does nudging squelch the extremes in regional climate modeling?, J. Climate, 25, 7046–7066, https://doi.org/10.1175/JCLI-D-12-00048.1, 2012. a
Paeth, H., Hall, N. M. J., Gaertner, M. A., Alonso, M. D., Moumouni, S., Polcher, J., Ruti, P. M., Fink, A. H., Gosset, M., Lebel, T., Gaye, A. T., Rowell, D. P., Moufouma-Okia, W., Jacob, D., Rockel, B., Giorgi, F., and Rummukainen, M.: Progress in regional downscaling of west African precipitation, Atmos. Sci. Lett., 12, 75–82, https://doi.org/10.1002/asl.306, 2011. a
Park, S.-H., Klemp, J. B., and Skamarock, W. C.: A Comparison of Mesh Refinement in the Global MPAS-A and WRF Models Using an Idealized Normal-Mode Baroclinic Wave Simulation, Mon. Weather Rev., 142, 3614–3634, 2014. a, b
Rienecker, M. M., Suarez, M. J., Gelaro, R., Todling, R., Bacmeister, J., Liu, E., Bosilovich, M. G., Schubert, S. D., Takacs, L., Kim, G. K., Bloom, S., Chen, J., Collins, D., Conaty, A., Da Silva, A., Gu, W., Joiner, J., Koster, R. D., Lucchesi, R., Molod, A., Owens, T., Pawson, S., Pegion, P., Redder, C. R., Reichle, R., Robertson, F. R., Ruddick, A. G., Sienkiewicz, M., and Woollen, J.: MERRA: NASA's modern-era retrospective analysis for research and applications, J. Climate, 24, 3624–3648, https://doi.org/10.1175/JCLI-D-11-00015.1, 2011. a
Salack, S., Klein, C., Giannini, A., Sarr, B., Worou, O. N., Belko, N., Bliefernicht, J., and Kunstman, H.: Global warming induced hybrid rainy seasons in the Sahel, Environ. Res. Lett., 11, 104008, https://doi.org/10.1088/1748-9326/11/10/104008, 2016. a
Skamarock, W., Klemp, J., Dudhia, J., Gill, D., Barker, D., Duda, M., Huang, X.-Y., Wang, W., and Powers, J.: A Description of the Advanced Research WRF Version 3, NCAR Technical Note NCAR/TN 475+STR, 125 pp., https://doi.org/10.5065/D6DZ069T, 2008. a, b
Skamarock, W. C., Klemp, J. B., Duda, M. G., Fowler, L. D., Park, S.-H., and Ringler, T. D.: A Multiscale Nonhydrostatic Atmospheric Model Using Centroidal Voronoi Tesselations and C-Grid Staggering, Mon. Weather Rev., 140, 3090–3105 https://doi.org/10.1175/MWR-D-11-00215.1, 2012. a
Stevens, B., Giorgetta, M., Esch, M., Mauritsen, T., Crueger, T., Rast, S., Salzmann, M., Schmidt, H., Bader, J., Block, K., Brokopf, R., Fast, I., Kinne, S., Kornblueh, L., Lohmann, U., Pincus, R., Reichler, T., and Roeckner, E.: Atmospheric component of the MPI-M earth system model: ECHAM6, J. Adv. Model. Earth Syst., 5, 146–172, https://doi.org/10.1002/jame.20015, 2013. a
Strandberg, G., Bärring, L., Hansson, U., Jansson, C., Jones, C., Kjellström, E., Kolax, M., Kupiainen, M., Nikulin, G., Samuelsson, P., Ullerstig, A., and Wang, S.: CORDEX scenarios for Europe from the Rossby Centre regional climate model RCA4, SMHI Report Meteorology and Climatology No. 116, 84 pp., 2014. a
Sylla, M. B., Giorgi, F., Coppola, E., and Mariotti, L.: Uncertainties in daily rainfall over Africa: Assessment of gridded observation products and evaluation of a regional climate model simulation, Int. J. Climatol., 33, 1805–1817, https://doi.org/10.1002/joc.3551, 2013. a, b
Sylla, M. B., Giorgi, F., Pal, J. S., Gibba, P., Kebe, I., and Nikiema, M.: Projected changes in the annual cycle of high-intensity precipitation events over West Africa for the late twenty-first century, J. Climate, 28, 6475–6488, https://doi.org/10.1175/JCLI-D-14-00854.1, 2015. a
Sylla, M. B., Elguindi, N., Giorgi, F., and Wisser, D.: Projected robust shift of climate zones over West Africa in response to anthropogenic climate change for the late 21st century, Climatic Change, 134, 241–253, https://doi.org/10.1007/s10584-015-1522-z, 2016. a, b, c
Taylor, K. E., Stouffer, R. J., and Meehl, G. A.: An overview of CMIP5 and the experiment design, B. Am. Meteorol. Soc., 93, 485–498, https://doi.org/10.1175/BAMS-D-11-00094.1, 2012. a, b, c
van Vuuren, D. P., Edmonds, J., Kainuma, M., Riahi, K., Thomson, A., Hibbard, K., Hurtt, G. C., Kram, T., Krey, V., Lamarque, J. F., Masui, T., Meinshausen, M., Nakicenovic, N., Smith, S. J., and Rose, S. K.: The representative concentration pathways: An overview, Climatic Change, 109, 5–31, https://doi.org/10.1007/s10584-011-0148-z, 2011. a
von Storch, H., Langenberg, H., and Feser, F.: A Spectral Nudging Technique for Dynamical Downscaling Purposes, Mon. Weather Rev., 128, 3664–3673, https://doi.org/10.1175/1520-0493(2000)128<3664:ASNTFD>2.0.CO;2, 2000. a
Warner, T. T., Peterson, R. A., and Treadon, R. E.: A Tutorial on Lateral Boundary Conditions as a Basic and Potentially Serious Limitation to Regional Numerical Weather Prediction, B. Am. Meteorol. Soc., 78, 2599–2617, https://doi.org/10.1175/1520-0477(1997)078<2599:ATOLBC>2.0.CO;2, 1997. a
Willmott, C. J. and Matsuura, K.: Terrestrial Air Temperature and Precipitation: Monthly and Annual Time Series (1900–2010), http://climate.geog.udel.edu/~climate/html_pages/README.ghcn_ts2.html (last access: 14 April 2018), 2012. a
World Meteorological Organization: Guide to Climatological Practices, 3rd Edn., available at: http://www.wmo.int/pages/prog/wcp/ccl/documents/WMO_100_en.pdf (last access: 14 April 2018), 2011. a
http://www.wascal.org, last access: 14 April 2018
http://www2.mmm.ucar.edu/wrf/users, last access: 14 April 2018.
http://apps.ecmwf.int/mars-catalogue, last access: 14 April 2018.
http://cera-www.dkrz.de, last access: 14 April 2018.
http://www.earthsystemgrid.org, last access: 14 April 2018.
http://www2.mmm.ucar.edu/wrf/users/docs/user_guide_V3/users_guide_chap5.htm, last access: 14 April 2018.