the Creative Commons Attribution 4.0 License.
the Creative Commons Attribution 4.0 License.
 | 09 Oct 2018
Spatially distributed water-balance and meteorological data from the rain–snow transition, southern Sierra Nevada, California
Erin Stacy
Mohammad Safeeq
Xiande Meng
Matthew Meadows
Carlos Oroza
Martha Conklin
Steven Glaser
Joseph Wagenbrenner
We strategically placed spatially distributed sensors to provide representative measures of changes in snowpack and subsurface water storage, plus the fluxes affecting these stores, in a set of nested headwater catchments. The high temporal frequency and distributed coverage make the resulting data appropriate for process studies of snow accumulation and melt, infiltration, evapotranspiration, catchment water balance, (bio)geochemistry, and other critical-zone processes. We present 8 years of hourly snow-depth, soil-moisture, and soil-temperature data, as well as 14 years of quarter-hourly streamflow and meteorological data that detail water-balance processes at Providence Creek, the upper part of which is at the current 50 % rain versus snow transition of the southern Sierra Nevada, California. Providence Creek is the long-term study cooperatively run by the Southern Sierra Critical Zone Observatory (SSCZO) and the USDA Forest Service Pacific Southwest Research Station's Kings River Experimental Watersheds (KREW). The 4.6 km2 montane Providence Creek catchment spans the current lower rain–snow transition elevation of 1500–2100 m. Two meteorological stations bracket the high and low elevations of the catchment, measuring air temperature, relative humidity, solar radiation, precipitation, wind speed and direction, and snow depth, and at the higher station, snow water equivalent. Paired flumes at three subcatchments and a V-notch weir at the integrating catchment measure quarter-hourly streamflow. Measurements of meteorological and streamflow data began in 2002. Between 2008 and 2010, 50 sensor nodes were added to measure distributed snow depth, air temperature, soil temperature, and soil moisture within the top 1 m below the surface. These sensor nodes were installed to capture the lateral differences of aspect and canopy coverage. Data are available at hourly and daily intervals by water year (1 October–30 September) in nonproprietary formats from online data repositories. Data for the Southern Sierra Critical Zone Observatory distributed snow and soil datasets are at https://doi.org/10.6071/Z7WC73. Kings River Experimental Watersheds meteorological data are available from https://doi.org/10.2737/RDS-2018-0028 and stream-discharge data are available from https://doi.org/10.2737/RDS-2017-0037.
- Article
(5790 KB) - Full-text XML
- BibTeX
- EndNote


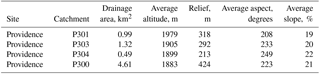
Table 1Characteristics of three subcatchments and the integrating P300 catchment (Adapted from Safeeq and Hunsaker, 2016).
Snowpack and subsurface water storage in the Sierra Nevada support ecosystem health and downstream water supply, along with recreational and aesthetic value, and other water-related services (SNEP, 1996). Two major challenges threatening these benefits are the effects of long-term forest-fire suppression and the effects of climate change. Overstocked montane coniferous forests, the result of a century of fire suppression in this region, are more prone to high-intensity wildfire and less resilient in the face of droughts (Westerling, 2016; Bales et al., 2018). Climate change will stress the balance between precipitation, subsurface water storage, and evapotranspiration, as precipitation shifts from snow to rain and atmospheric water demand increases through longer and warmer growing seasons (Bales et al., 2018). During the 2012–2015 California drought, Sierra Nevada forests experienced extensive mortality due in part to water stress and subsequent insect and fungal pathogens. This unprecedented drought , which had mean precipitation in the southern Sierra Nevada about 50 % of average and was about 1 ∘C warmer that during the previous decade, provides extraordinary opportunities to enumerate hydrologic mechanisms and drought response (Bales et al., 2018).
Thinning of overgrown forests can both lower the risk of high-intensity wildfire and lower forest drought stress (Stephens et al., 2012). Prior to 2002, there was little information on the hydrologic impacts of these treatments. The Kings River Experimental Watersheds (KREW) project began in part to answer these questions. Three subcatchments in Providence Creek, and a nearby one draining to Duff Creek, were assigned treatments, including mechanical thinning, prescribed burning, a combination of mechanical thinning and prescribed burning, and a control. Nearly 10 years of pretreatment data act as an additional control. At Providence, mechanical thinning was completed in 2011–2012, and prescribed burning occurred in 2015 and 2016.
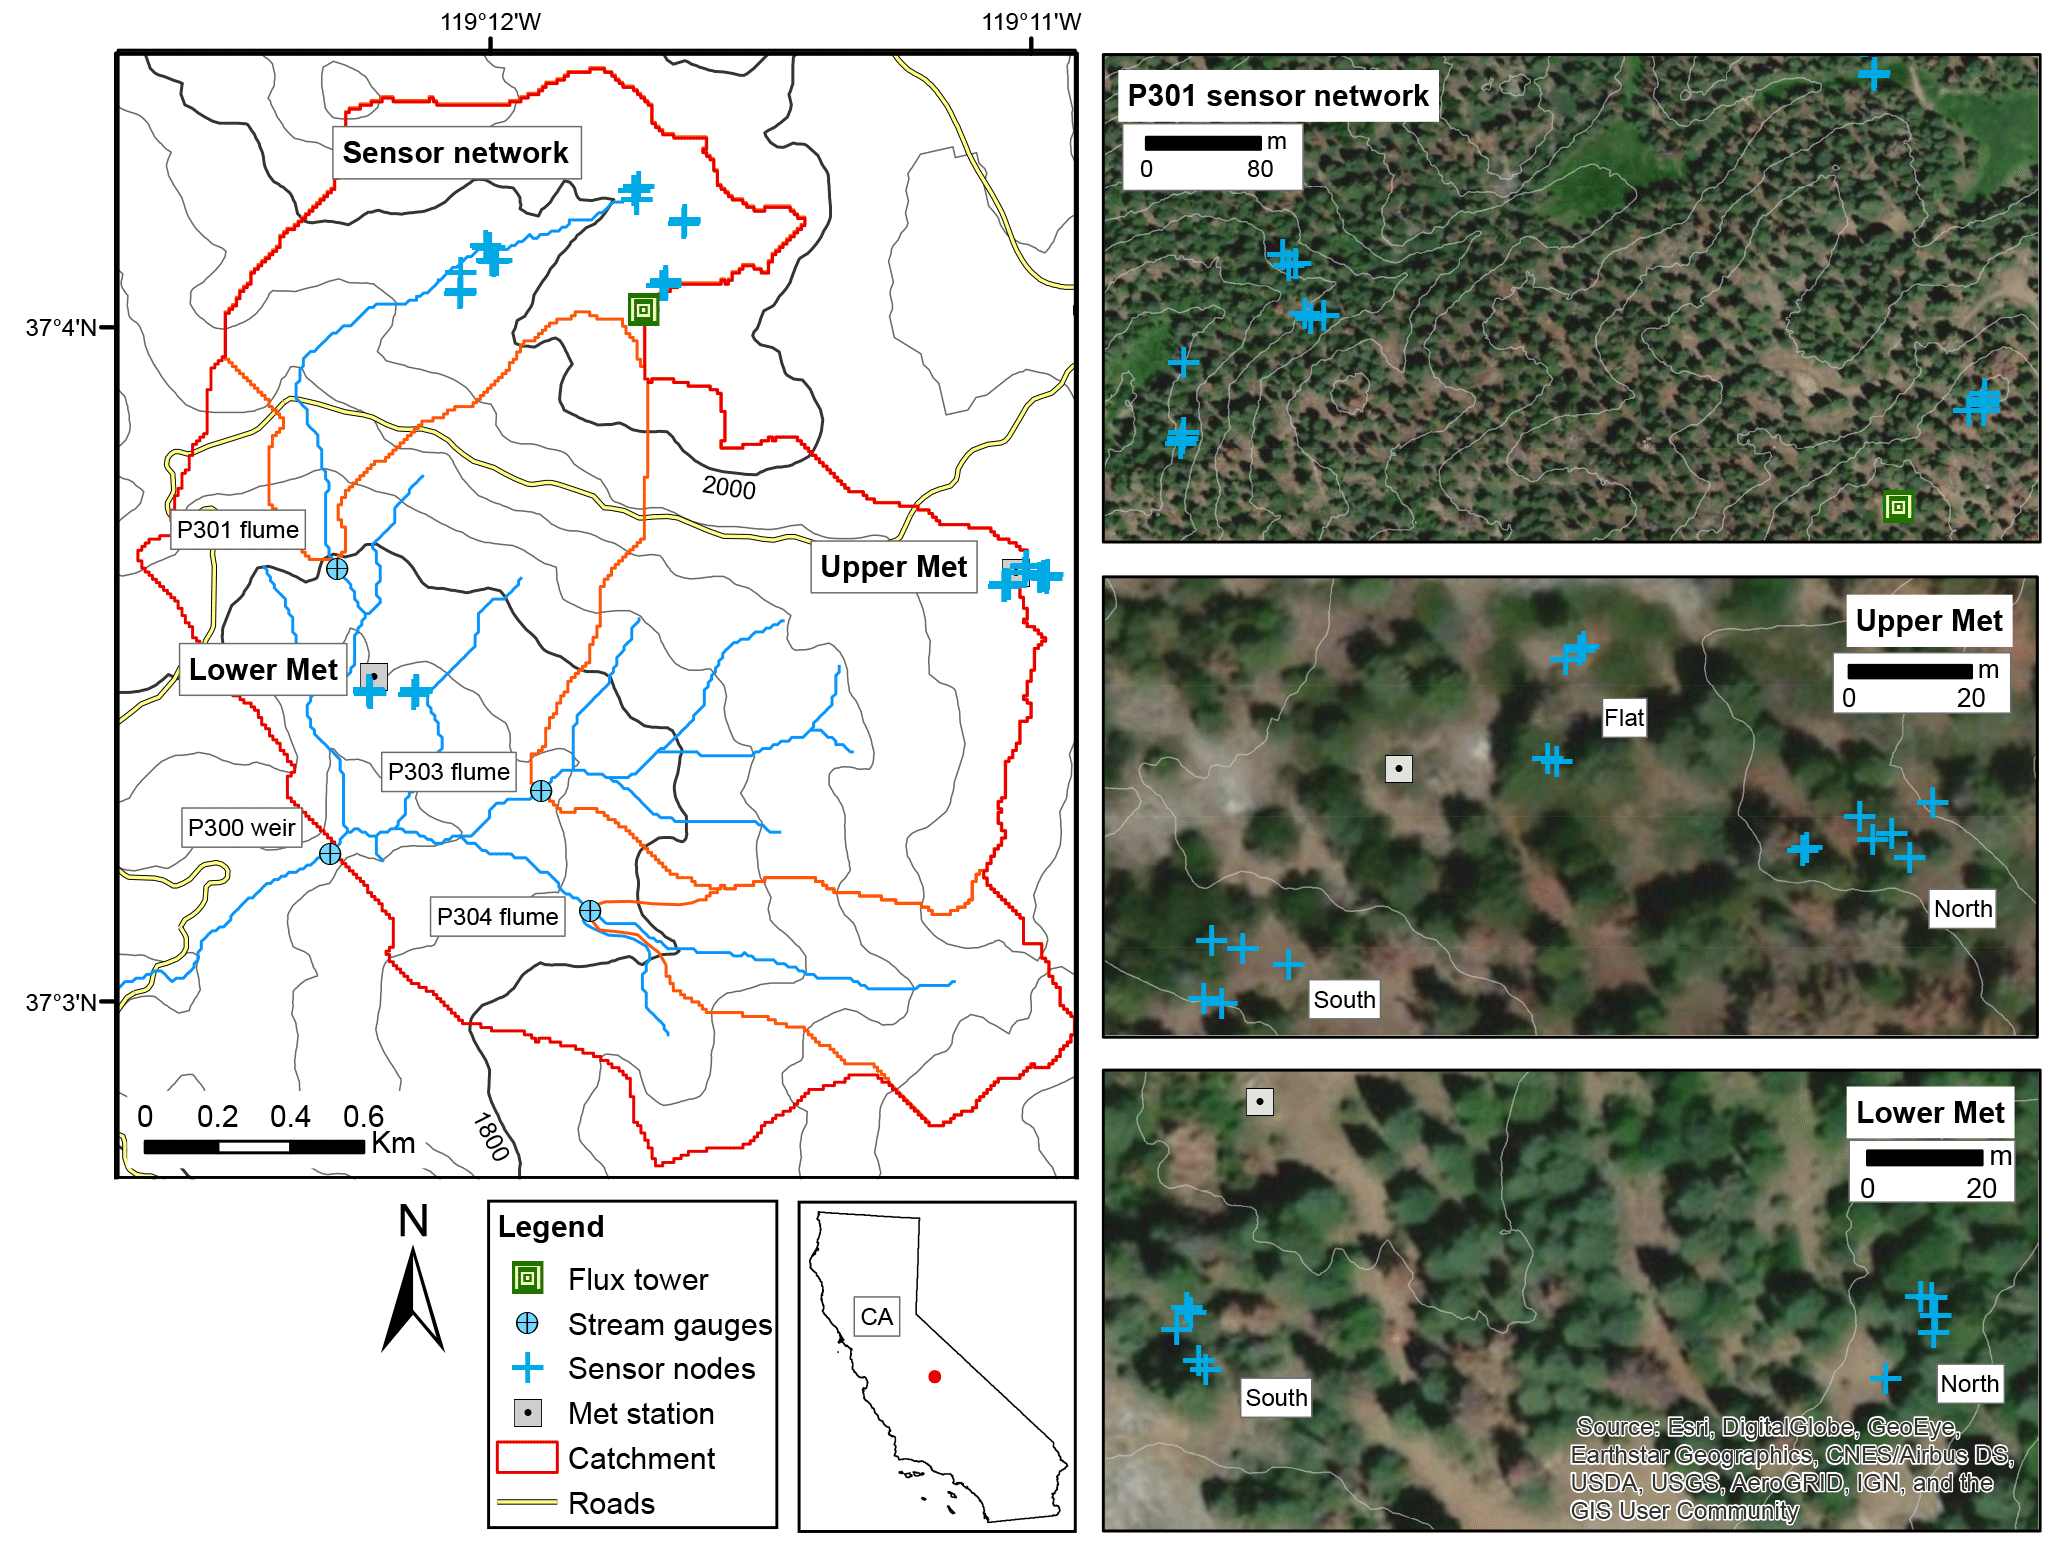
Figure 1Map of the Providence Creek catchment, showing locations of the meteorological stations, sensor nodes, and stream-gauging stations as well as streams and catchment boundaries. Inset images show instruments and satellite imagery for the meteorological stations and instrument clusters (snow depth, soil moisture, and air temperature) at the P301 network, Upper Met, and Lower Met on 9 July 2016; slope aspect of subsites (north, south, or flat) are indicated by notes on the image. (Topographic data: EDNA filled DEM grid, U.S. Geological Survey, 2003. Satellite data: ESRI world imagery base map compiled from DigitalGlobe and other sources.).
Another need for the water-balance measurements of snowpack and soil-moisture storage was the lack of information on the variability of these quantities across the landscape on sub-daily timescales. For example, historical records of snowpack at a few select locations, useful as a baseline index, only capture a fraction of the variation in snow depth and snow water equivalent across the mountains (Kerkez et al., 2012; Oroza, 2017). Those historical measurement approaches prove inadequate to support sound decision making in a populous, semi-arid state under a changing climate (Cantor et al., 2018). Distributed sensor nodes that are stratified by elevation, canopy coverage, and aspect can better describe temporal and spatial patterns in the water balance needed by a new generation of forecast tools (Zhang et al., 2017; Zheng et al., 2018). The Southern Sierra Critical Zone Observatory (SSCZO) began in 2007 to quantify these measurements through distributed sensor nodes that are thus stratified. The SSCZO is also a test bed for improving the design, communication and efficacy of spatial-measurement networks (Kerkez et al., 2012; Oroza et al., 2018).
We present hydrometeorological variables in the 14-year KREW dataset for streamflow, snow depth, snow density, air temperature, relative humidity, precipitation, and wind speed and direction. These serve as a basis for additional work in the catchments on sediment, soil and stream chemistry, vegetation composition, and the impacts of treatments. We also present hydrometeorological variables in an 8-year SSCZO dataset for snow depth, soil moisture and temperature, and air temperature and humidity distributed across the landscape.
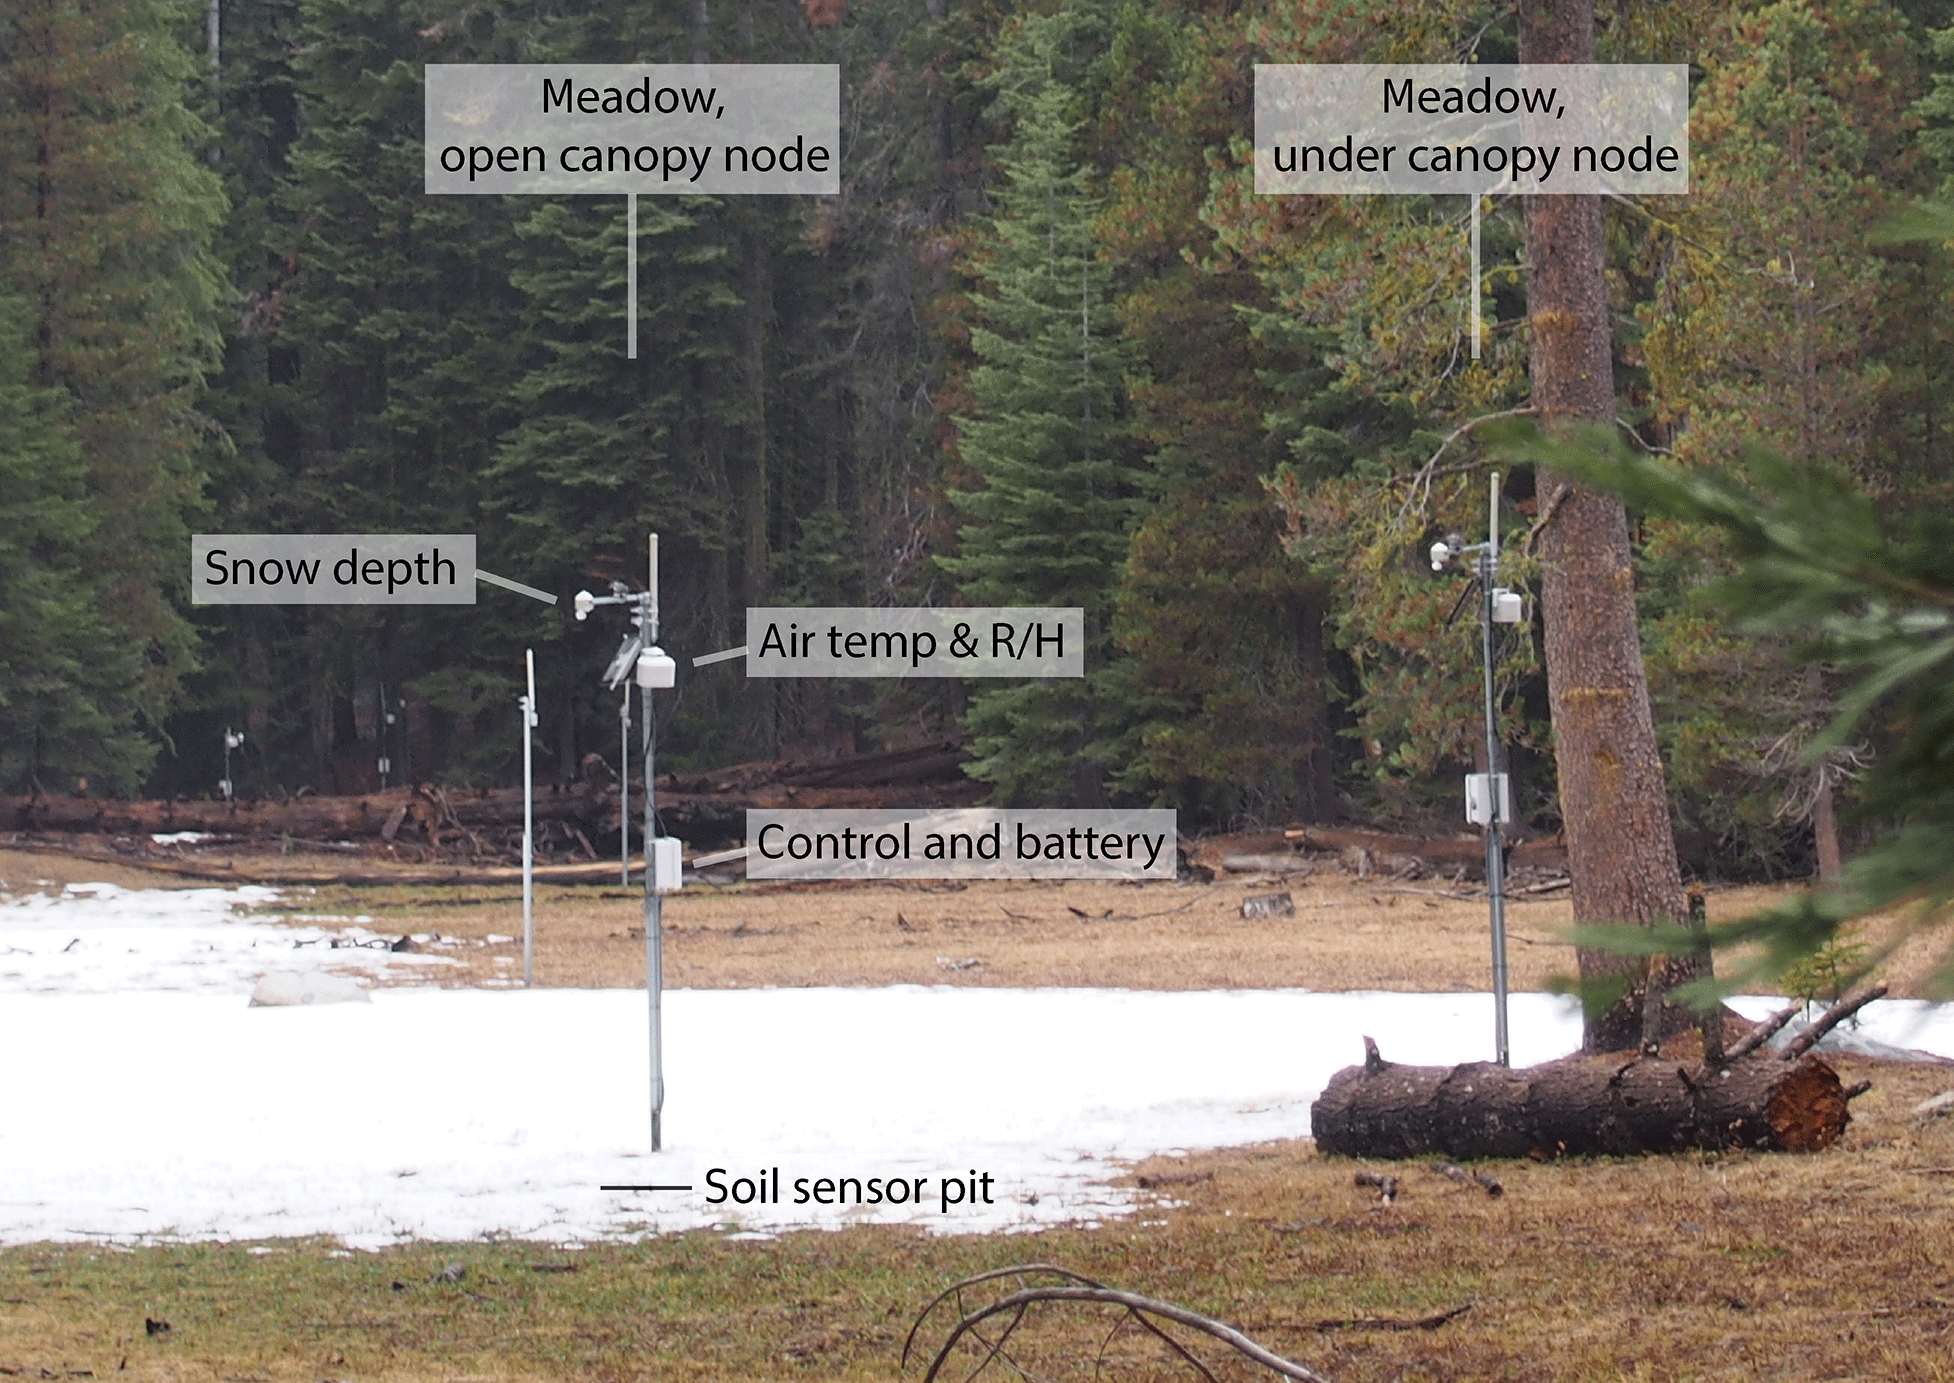
Figure 2An example of the distributed sensor nodes, with snow-depth and air-temperature and relative-humidity sensors visible. Snow-depth sensors are located above the soil sensor pits. These nodes are in the upper P301 meadow, looking northeast.
The Providence Creek catchment is one part of two larger studies. First, KREW established and maintains nested headwater catchments at Providence plus the snow-dominated Bull Creek catchments and a catchment in the adjacent Teakettle Experimental Forest, for assessing the impacts of forest-management treatments on headwater soils and catchment outputs (Hunsaker et al., 2012). Second, the SSCZO program established four focal measurement sites along an elevation transect extending over 400–2700 m elevation (Goulden et al., 2012), of which Providence is one site. Major SSCZO research questions focus on the links between climate, regolith properties, vegetation, biogeochemistry, hydrology, and the response of the mountain ecosystem and catchments to disturbance and climate change. Related studies include evaluation of the transect of eddy covariance and evapotranspiration (Goulden et al., 2012; Goulden and Bales 2014; Saksa et al., 2017; Bales et al., 2018), soil moisture (Oroza et al., 2018), hydrologic modeling (Tague and Peng, 2013; Bart et al., 2016; Son et al., 2016; Bart and Tague, 2017; Jepsen et al., 2016), biochemical studies (Liu et al., 2012; Carey et al., 2016; Aciego et al., 2017; Arvin et al., 2017; Hunsaker and Johnson, 2017), geophysical research (Hahm et al., 2014; Holbrook et al., 2014), and sediment composition (Stacy et al., 2015; McCorkle et al., 2016). Regolith water storage is further described in Klos et al. (2018). The high temporal frequency and distributed coverage make the resulting data appropriate for process studies of snow accumulation and melt, infiltration, evapotranspiration, catchment water balance, (bio)geochemistry, and other critical-zone processes.
The Providence Creek site is located approximately 40 miles northeast of Fresno, California, in the Sierra National Forest. The 4.6 km2 catchment (P300) has a predominantly southwest aspect, with a moderate slope (19–22 %) and elevations of 1700–2100 m (Table 1). Instruments are installed in three subcatchments (P301, P303, P304; Fig. 1). The site has a Mediterranean climate, with cool, wet winters and dry summers that last from approximately May through October. Precipitation falls as a mix of rain and snow, and precipitation transitions from majority rainfall to majority snow typically at about 2000 m in elevation (Bales et al., 2011; Safeeq and Hunsaker, 2016). The upper part of the Providence Creek site lies at about the 50 % rain versus snow elevation.
The catchments are underlain by Dinkey Creek granodiorite and Bald Mountain leucogranite (Bateman, 1992). Soil is dominated by the Shaver, Cagwin, and Gerle series (Johnson et al., 2010). Land cover includes small areas of exposed bedrock and meadows within the dominant mature mixed-conifer forest, which primarily consists of white fir (Abies concolor), sugar pine (Pinus lambertiana), ponderosa pine (Pinus ponderosa), Jeffrey pine (Pinus jeffreyi), incense cedar (Calocedrus decurrens), and California black oak (Quercus kelloggii; Dolanc and Hunsaker, 2017).
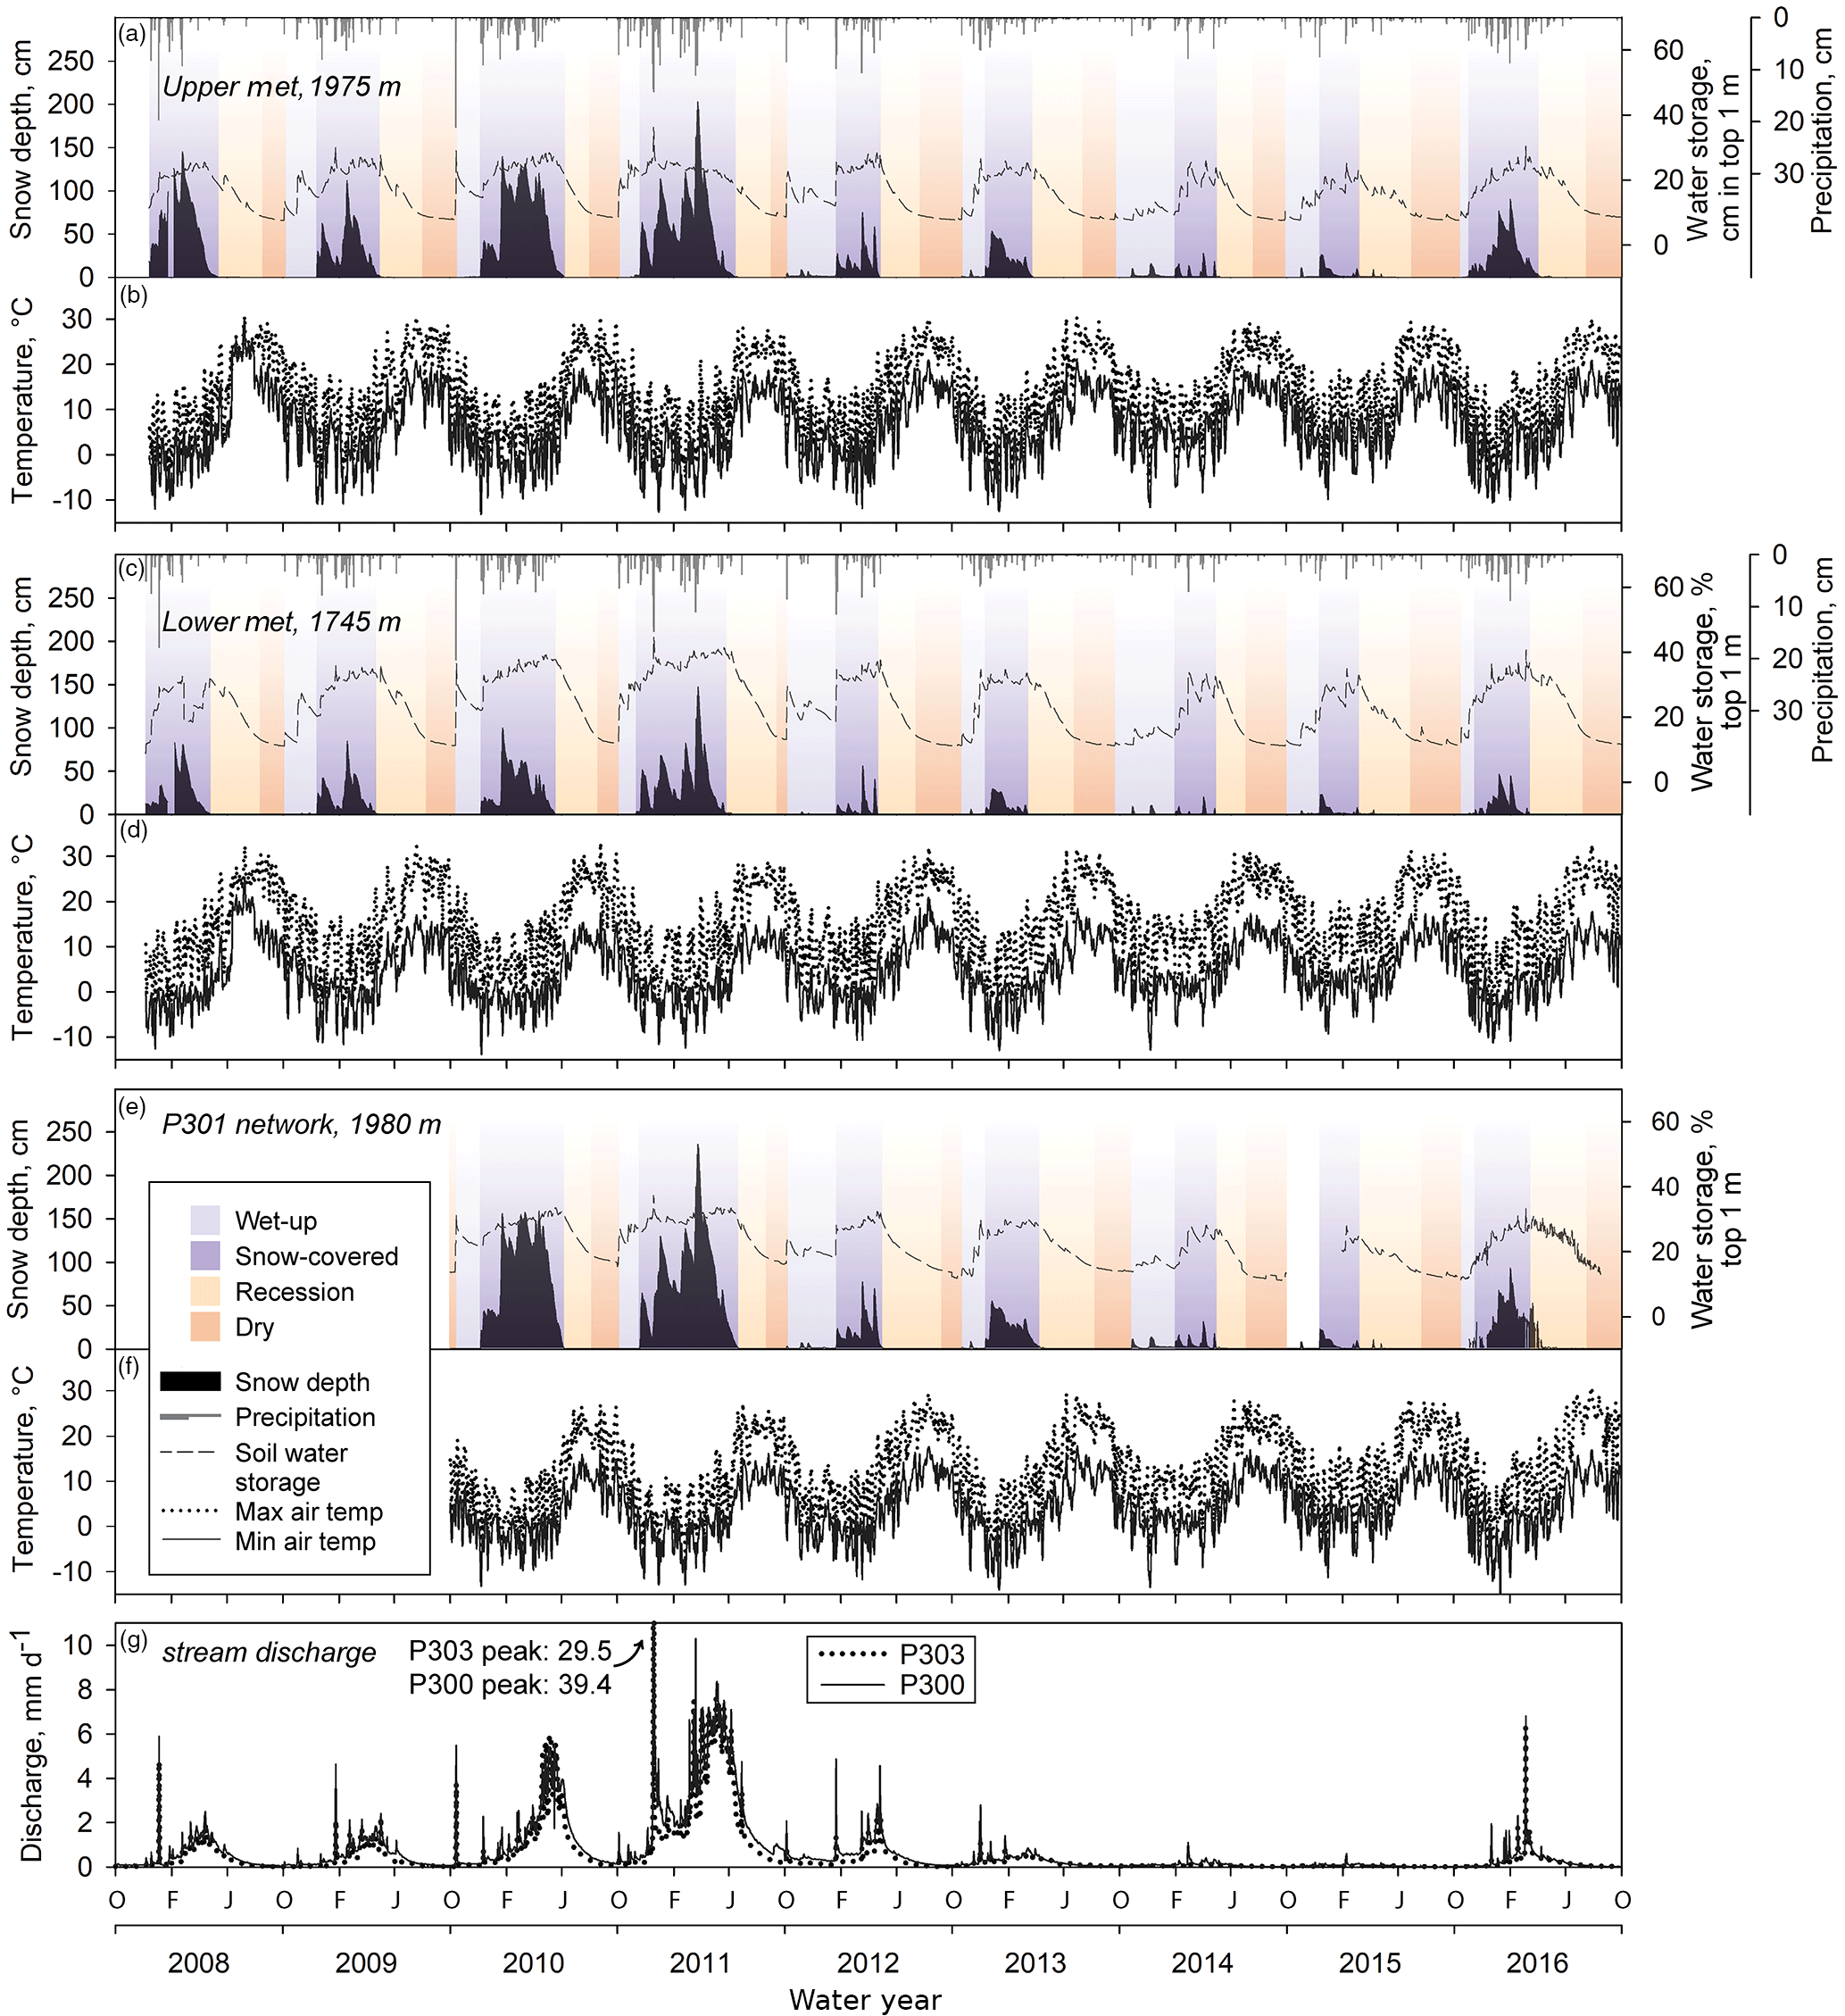
Figure 3Partial record of (a, c, e) precipitation (black bars), soil water storage integrated over 1 m depth (dashed lines), and snow depth (black shaded area), (b, d, f) maximum and minimum air temperature (dotted and solid lines) at the Upper and Lower Met stations and P301 sensor network, and (g) stream discharge at subcatchment P303 and the integrating P300 catchment. Background colors in (a, c, e) generally indicate wet-up, snow-coverage, soil-moisture recession, and dry periods. The 10 and 15 min data have been averaged to daily values shown here.
Meteorological stations were installed at 1975 m (Upper Met) and 1750 m (Lower Met) elevations in the Providence catchment in 2002–2003 (Table 3). Precipitation is measured with a Belfort 5-780 shielded weighing rain gauge (Belfort Instrument, Baltimore, MD, USA); the instrument is mounted 3 m above the ground. A Met One 013 wind-speed sensor and 023 wind-direction sensor (Met One, Grants Pass, OR, USA), a Vaisala HMP45C relative-humidity and air-temperature sensor (Vaisala Corporation, Helsinki, Finland), a Kipp & Zonen CM3 pyranometer (Kipp & Zonen B.V., Delft, the Netherlands), and a Judd acoustic depth sensor (Judd Communications LLC, Salt Lake City, UT, USA) are mounted on a 6 m tower at the site. Snow water equivalent is measured at the Upper Met with a WaterSaver 3 m snow pillow (Snowsaver, Commerce City, CO, USA) with a Sensotec pressure transducer (Honeywell Inc., Columbus, OH, USA) installed approximately 4 m to the north of the weather tower. Data are recorded at each station with a Campbell CR10x (Campbell Inc., Logan, UT, USA) at 15 min intervals.
Manual measurements for instrument verification were made at twice-monthly visits unless delayed by weather. Precipitation at the weighing gauge was verified against measurement records from the snow pillow and nearby weather stations (Table 2; further information about precipitation data assurance is in Safeeq and Hunsaker, 2016).
4.1 Upper and Lower Met
Snow depth, soil moisture, and soil temperature are measured at 27 sensor nodes around the Upper Met and Lower Met (Bales et al., 2011; Table 3). Distance to snow or soil surface is measured in the open, at the drip edge, and under canopies with an acoustic depth sensor (Judd Communications LLC, Salt Lake City, UT, USA). Global solar radiation is measured using a LI-COR PY-200 pyranometer (LI-COR Biosciences, Lincoln, NE, USA). Soil volumetric water content and soil temperature are measured using ECHO-TM sensors (METER Group, Pullman, WA, USA) at depths of 10, 30, 60, and 90 cm below the mineral-soil surface under each snow-depth sensor. Matric potential is measured at the same depths with an MPS-1 sensor (METER Group, Pullman, WA, USA). An integrated soil volumetric water content (θ) was calculated to evaluate variation across the environment. Values from soil volumetric water content sensors were used as representative values for the soil depth above and below each sensor. The distance between sensors was evenly divided. This is a greater volume than the estimated measurement volume of the ECHO-TM sensors (approximately 715 mL), but sensor depths were chosen to represent a range of depths while remaining cost-effective. If data from a sensor were missing, depths were adjusted accordingly, with the distance between sensors evenly divided.
Instrument nodes are sited in clusters at lower Providence south-facing (LowMetS) and north-facing (LowMetN), as well as at upper Providence south-facing (UpMetS), north-facing (UpMetN) and flat aspect (UpMetF). At each cluster, 5–7 sensor nodes were installed according to tree species and canopy coverage (drip edge, under canopy, open canopy) in 2008. Data storage and sensor control are conducted at each of the five sites with a Campbell Scientific CR1000 data logger and an AM16/32B multiplexer (Campbell Scientific, Inc., Logan, UT, USA). Data are recorded at 10 min intervals, with 30 min averages reported.
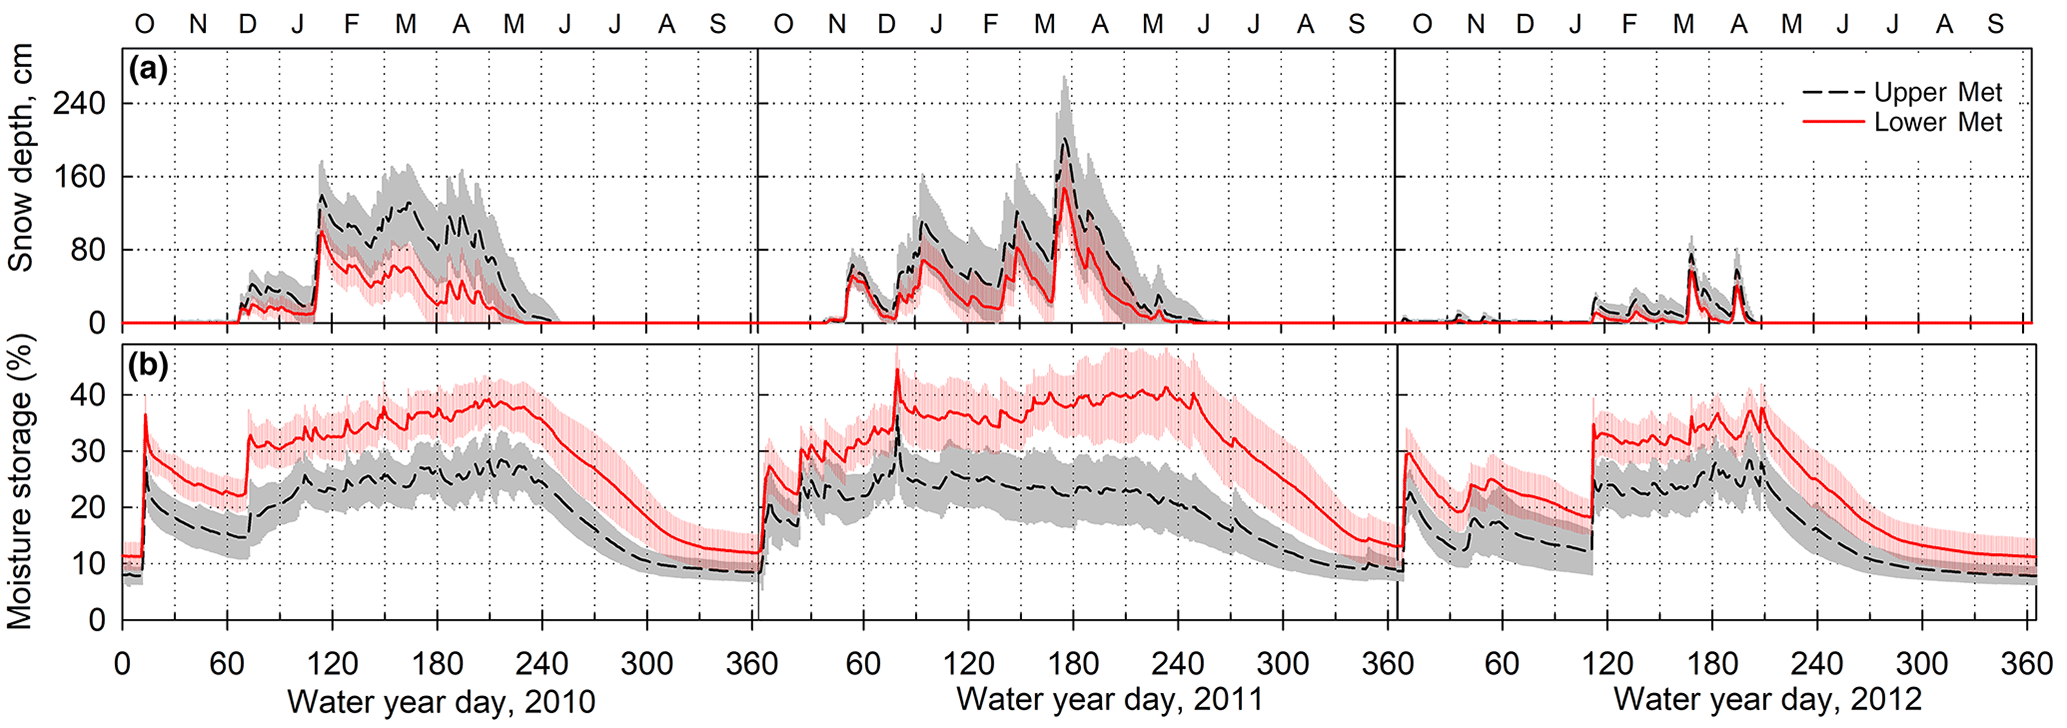
Figure 4Measures of (a) snow depth and (b) soil water content to 1 m depth at 27 measurement nodes at Upper and Lower Met sites. Lines represent site means and shading shows ±1 standard deviation. Compared to Fig. 3, this shorter period shows the variation across the landscape for snow depth and soil moisture. Daily values are shown here, calculated from 10 min interval sampling.

Figure 5Selected 30-day periods in water year 2011 show hourly patterns in discharge for periods dominated by (a) incoming precipitation during an early season storm at the Upper Met station (29 November–29 December), (b) snowmelt (18 April–18 May), and (c) a midsummer storm during the evapotranspiration-dominant period (27 June–27 July).
4.2 P301 sensor network
In summer 2009, 23 nodes in the P301 subcatchment were instrumented with sensors to measure snow depth, air temperature, and relative humidity, as well as soil moisture, temperature, and matric potential (Fig. 2; Table 3). The same sensors are used here as in the Upper and Lower Met clusters (Sect. 4.1). Air temperature and relative humidity are measured with a SHT15DV sensor (EME Systems, Berkeley, CA, USA). Nodes are sited to capture differences in aspect (north vs. south), meadow structure (open meadow, a narrow-meadow channel, transition to forest outside of meadow), and canopy coverage. Data are collected at individual nodes with Metronome Neomote data loggers (Metronome Systems LLC., Berkeley, CA, USA) with a custom sensor wiring board at 15 min intervals. These P301 sensor-network data are available beginning in WY 2010 (1 October 2009). This installation has been the test site for two generations of wireless networking (Kerkez et al., 2012; Oroza et al., 2016, 2018).
Stream-discharge monitoring began in 2004 at subcatchments P301, P303, and P304 and in 2006 at integrating catchment P300. Subcatchment discharge is quantified with one large (61 cm for P301 and P303; 30.5 cm for P304) and one small (7.6 cm) custom-made fiberglass Parshall flume designed by the FS hydrologist (Moore Sailboats, Watsonville, CA, USA) to capture the range of flows while a 120∘ V-notch weir is used at P300 (Safeeq and Hunsaker, 2016). An ISCO 730 air bubbler (Teledyne Isco, Lincoln, NE, USA) is the primary stage-measurement device. Backup stage measurements were initially obtained using either an AquaRod capacitance water-level sensor (Advanced Measurements and Controls, Inc., Camano Island, WA, USA) or a Telog pressure transducer (Trimble Water, Inc., Rochester, NY, USA). Levelogger Edge M5 pressure transducers (Solinst Inc., Georgetown, ON, Canada) were installed for backup stage measurement in water year 2011. A Barologger barometer (Solinst Inc., Georgetown, ON, Canada) records barometric pressure for atmospheric corrections to stage. Stage is measured at 15 min intervals and converted to flow using the standard rating curve supplied by the flume and weir manufacturers.
Table 2Nearby stations used for verification of the precipitation data at KREW Providence meteorological stations.
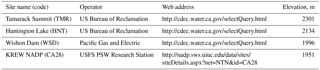
Table 3Measurement locations and explanation of site coding. Spatial files also available with data downloads.
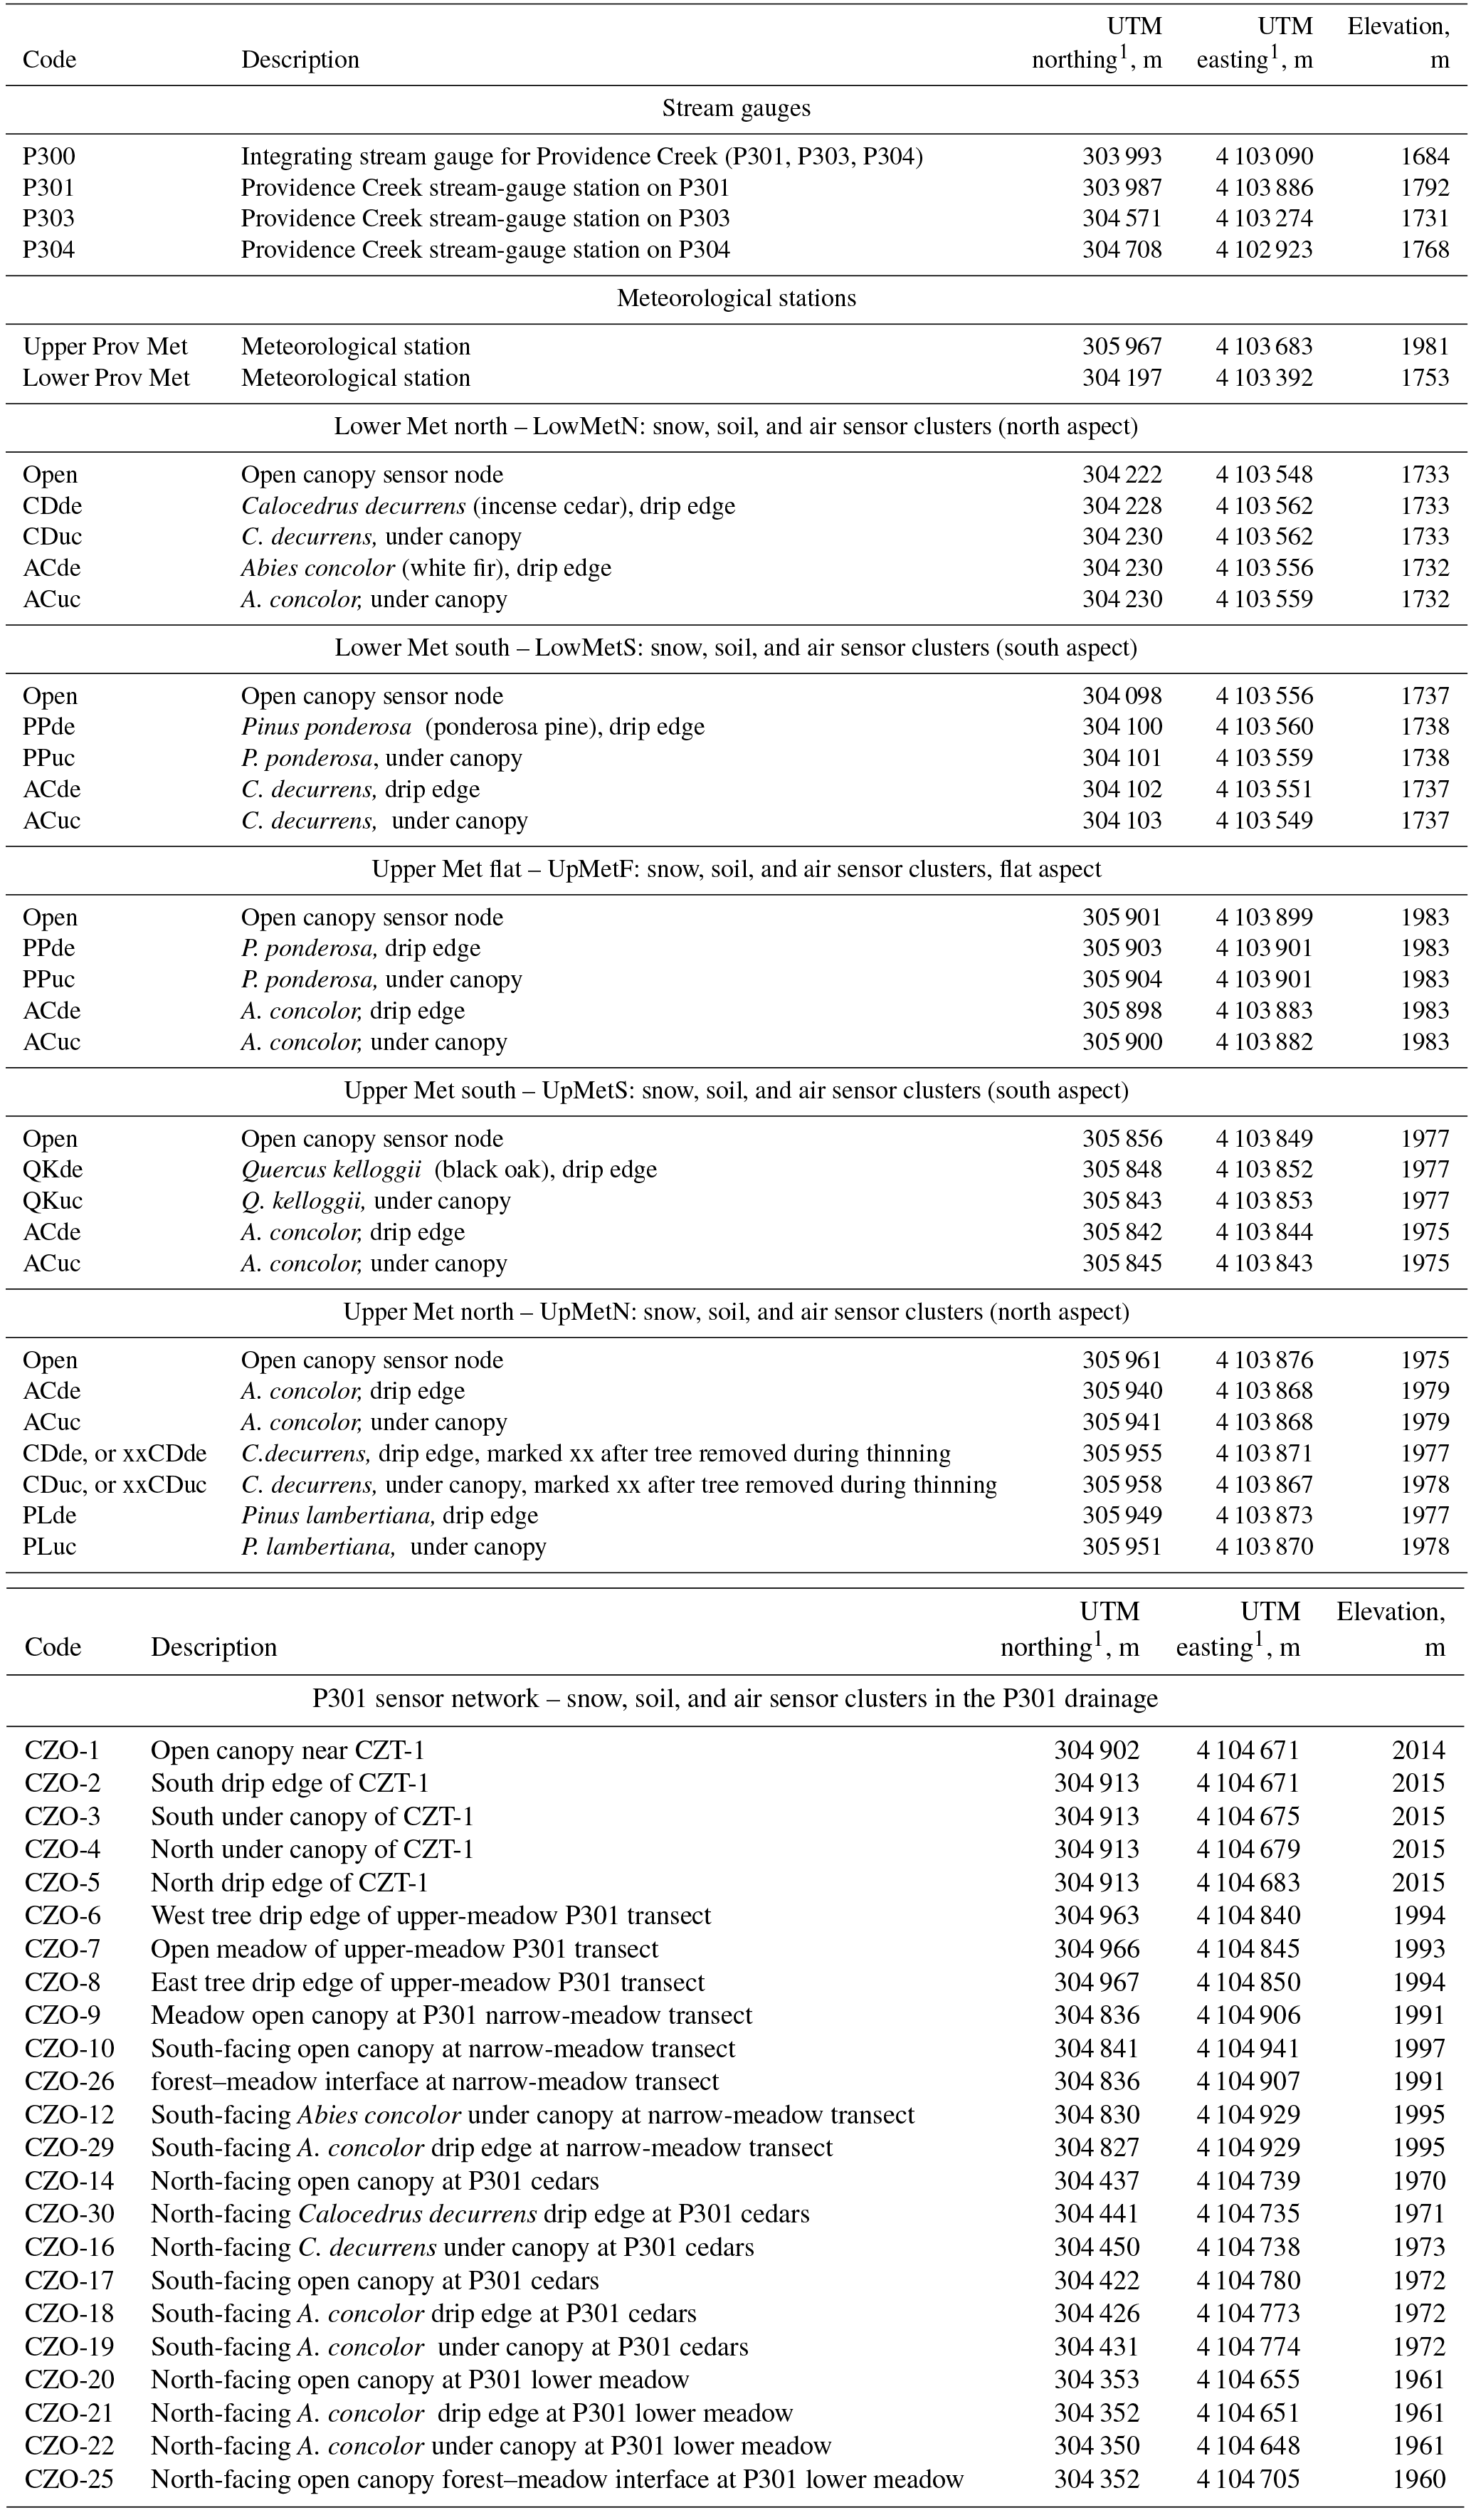
1 Geographic coordinates are in Universal Transverse Mercator (UTM) projection, North American 1983 Datum, Zone 11.
Upper and Lower Met stations receive similar amounts of precipitation but a greater percentage falls as rain at Lower Met. The elevation difference between Upper and Lower Met (225 m) leads to a deeper and more-persistent snowpack at Upper Met (Figs. 3a–d, 4a). Wet-up at the two sites occurs almost simultaneously, but soil moisture at Lower Met is higher and stays wetter longer due to finer soil texture (Figs. 3a, c, 4). Measurement nodes in the P301 meadow have higher soil moisture than most other points in the network, increasing variability (Fig. 3e).
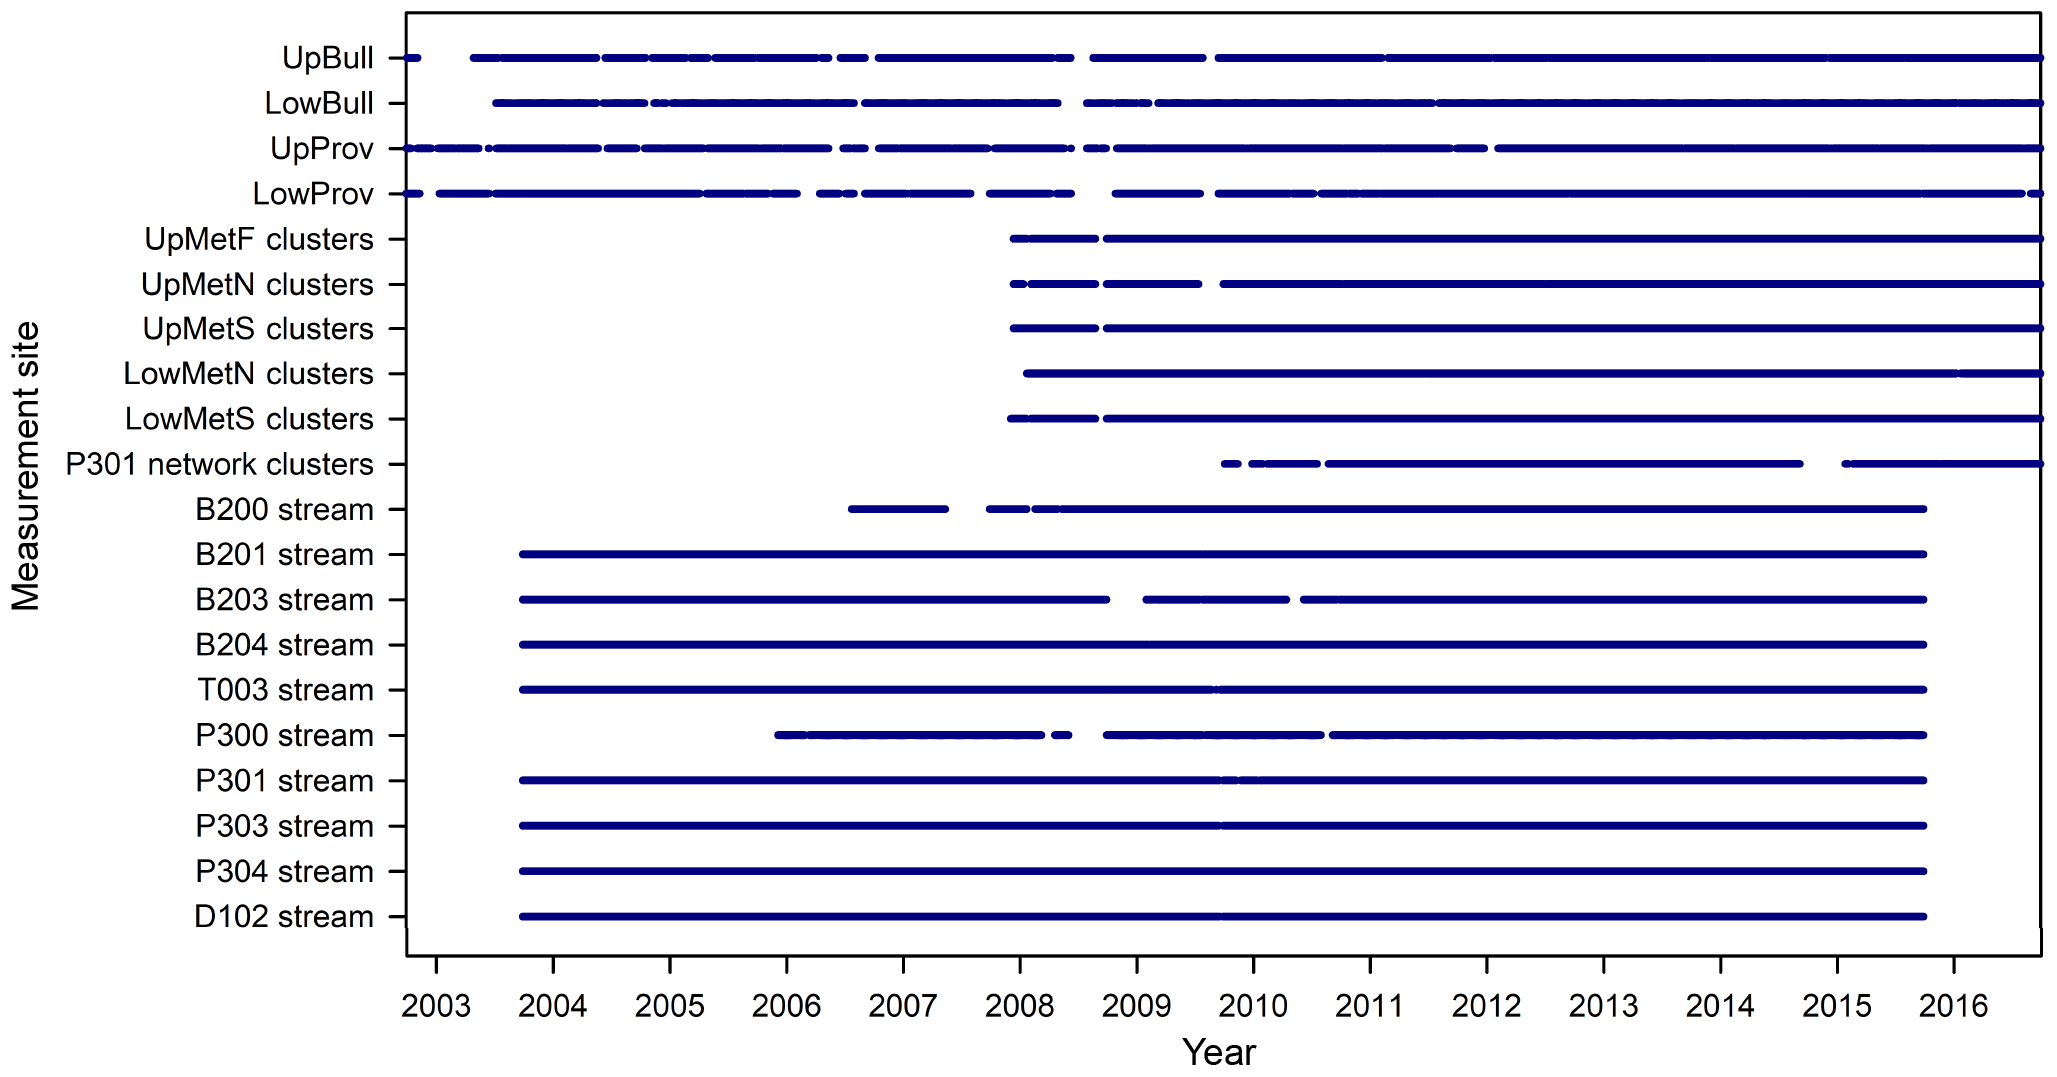
Figure 6Operating periods for the various measurement sites. Meteorological stations and stream sites show periods when measurements were gathered (compared to periods with estimated data). Operating periods for the distributed clusters are shown where the battery voltage exceeded 11.5 V. The data archive for stream discharge currently ends at the end of WY 2015; however, measurements are continuing and it will be updated in the future.
Stream discharge can peak early in the water year during large fall storms, such as in WY 2010 and 2011 (Fig. 3g). In WY 2011, peak instantaneous flows exceeded 60 mm d−1 in subcatchments P303 and P300 (Fig. 5a). While these storms may cause the highest instantaneous flows, the bulk of stream discharge occurs as a result of spring snowmelt (Fig. 5b). In extremely dry years such as WY 2014 or 2015, P300, P303, and P304 remained perennial, but P301 surface flow stopped. After 1 June (WY day 244), soil moisture dries to lows of 10–13 % (Figs. 3a, c, e, 4b) and stream discharge is dominated by daily evapotranspiration periods (Fig. 5c).
Operating periods for each measurement site were modulated by storm cover, battery life, sensor operation and other factors (Fig. 6). Meteorological data were processed to remove noise, assure data quality, and fill gaps using nearby rain gauges (Safeeq and Hunsaker, 2016). Missing meteorological and stream-discharge data are indicated as described in the metadata files. Filled or estimated values are also flagged in the data files. For the distributed sensor nodes, all levels of data, from raw through processed, were posted on our digital library at https://eng.ucmerced.edu/snsjho/ (last access: 27 September 2018); processing steps are archived there as well as described in the metadata files.
Raw files of sensor-network data are posted as level 0 data and are made publicly available shortly after collection from the field. Further QA/QC occurs on an annual basis. After level 0 data (raw data) have been calibrated, we check and eliminate the duplicate row(s) and insert the missing row(s) based on timestamp and time interval. Outliers are then removed by running an outlier filter based on the range of anticipated values, e.g., −30 to 50 ∘C for air temperature, 0 to 100 % for relative humidity, and 0 to 1.0 for volumetric water content of soil. Bad data points within a reasonable range of anticipated values were found and deleted by referring to field notes and comparing with the same measurement from the nearby sites. The product of this process is level 1 data. If level 1 data have gap(s), the first step is to compare correlation with nearby measurement points to find one site that has the best correlation (an R2 that is closest to 1.0). After identifying the most closely correlated point, a regression, typically linear regression, between these two sites is used to estimate values for the gap(s). Short gaps, or gaps in soil temperature, may be filled through linear interpolation. The time period for the correlation may vary based on the measurements and gaps. For example, it is very easy to find a good correlation (R2 greater than 0.95) for air temperature with a nearby site over an entire year period, but for snow depth, the snow accumulation period and depletion period require separate correlations to get the best estimate results. Soil temperature at different depths, especially at deeper depths, will not change significantly during winter, so linear interpolation can be used to fill the gaps for this period; the results are almost the same from correlation as from a regression. Multiple neighboring nodes may be selected if needed, and different neighboring nodes may be used to fill each measurement.
Gap-filled data files have a flag column (code column) following each measurement. The flag values indicate where the measurement value is either (1) from gap filling with linear interpolation; (2) from gap filling with correlation/regression; or empty, indicating the original sensor measurement. There are also data processing notes that have the following information: how many missing points in the measurement, how many missing points were filled by linear interpolation, how many missing points were filled by correlation/regression, what nearby site was used for the regression, start time and end time for the correlation period, and parameter values for the regressions. The parameter values (a, b, R, and R2) were used to calculate the estimate value with regression: estimate value =a × measurement from nearby site +b; r square is the correlation with the nearby site.
Meteorological, sensor-network, and stream-discharge data are available through online data repositories. Meteorological data are available from the Forest Service Research Data Archive repository (Hunsaker and Safeeq, 2018; https://doi.org/10.2737/RDS-2018-0028, last access: 17 August 2018). Distributed snow depth, air temperature, and soil moisture and temperature are available through the California Digital Library (see https://doi.org/10.6071/Z7WC73, last access: 31 August 2018). Metadata, including process notes, data headers, and data units, are available from the data repositories. Data in the Upper and Lower Met sensor clusters are coded and sorted by site and aspect; naming codes for all measurement points are presented in Table 3. Spatial data are available in an ESRI ArcMap geodatabase available for download. Stream-discharge data are available from the Forest Service Research Data Archive repository (Hunsaker and Safeeq, 2017; https://doi.org/10.2737/RDS-2017-0037, last access: 20 August 2018). Multiple lidar flights (opentopography.org and National Ecological Observatory Network, NEON) and hyperspectral data (NEON) sets are also available for the site.
An 8- to 14-year meteorological and hydrologic data record is presented for a set of nested catchments in the southern Sierra Nevada. Distributed snow depth and soil temperature and moisture combined with two meteorological stations and a long-term stream-discharge record provide a means of establishing natural variability as well as testing hydrologic process models in a productive montane forest.
RB, MC, and SG designed the sensor networks. MM, ES, XM, and CO installed and maintained the sensor networks and processed the sensor-network data. MS and JW were responsible for the meteorological stations and stream gauges. ES and RB prepared the manuscript, with contributions from all authors.
Steven Glaser is a co-founder and has intellectual property associated with Metronome Systems.
This article is part of the special issue “Hydrometeorological data from mountain and alpine research catchments”. It is not associated with a conference.
We thank the Sierra National Forest, and the staff and research teams of the
Southern Sierra Critical Zone Observatory and Kings River Experimental
Watersheds. This research was funded in part by the USDA Forest Service
Pacific Southwest Research Station; the National Fire Plan of the USDA
Forest Service; NSF EAR-0619947, EAR-0725097, EAR-1239521, and EAR-1331939;
and the University of California Merced.
Edited by: John Pomeroy
Reviewed by: three anonymous referees
Aciego, S. M., Riebe, C. S., Hart, S. C., Blakowski, M. A., Carey, C. J., Aarons, S. M., Dove, N. C., Botthoff, J. K., Sims, K. W., and Aronson, E. L.: Dust outpaces bedrock in nutrient supply to montane forest ecosystems, Nat. Commun., 8, 14800, https://doi.org/10.1038/ncomms14800, 2017.
Arvin, L. J., Riebe, C. S., Aciego, S. M., and Blakowski, M. A.: Global patterns of dust and bedrock nutrient supply to montane ecosystems, Sci. Adv., 3, eeao1588, https://doi.org/10.1126/sciadv.aao1588, 2017.
Bales, R. C., Hopmans, J., O'Geen, A. T., Meadows, M., Hartsough, P. C., Kirchner, P., Hunsaker, C. T., and Beaudette, D.: Soil moisture response to snowmelt and rainfall in a Sierra Nevada mixed-conifer forest, Vadose Zone J., 10, 786–799, https://doi.org/10.2136/vzj2011.0001, 2011.
Bales, R. C., Goulden, M. L., Hunsaker, C. T., Hartsough, P. C., O'Geen, A. T., Hopmans, J., and Safeeq, M.: Mechanisms controlling the impact of multi-year drought on mountain hydrology, Sci. Rep. 8, 690, https://doi.org/10.1038/s41598-017-19007-0, 2018.
Bart, R. L. and Tague, C.: The impact of wildfire on baseflow recession rates in California, Hydrol. Proc., 31, 1662–1673, https://doi.org/10.1002/hyp.11141, 2017.
Bart, R. L., Tague, C. L., and Moritz, M. A.: Effect of tree-to-shrub type conversion in lower montane forests of the Sierra Nevada (USA) on streamflow, PLOS ONE, 11, e0161805, https://doi.org/10.1371/journal.pone.0161805, 2016.
Bateman, P. C.: Plutonism in the central part of the Sierra Nevada batholith, California, U.S. Geol. Survey Professional Paper 1483, 1992.
Cantor, A., Kiparksy, M., Kennedy, R., Hubbard, S., Bales, R. Pecharroman, L. C., Guivetchi, K., McCready, C., and Darling, G.: Data for water decision making: Informing the implementation of California's open and transparent water data act through research and engagement, Center for Law, Energy & the Environment Publications, 56, available at: https://scholarship.law.berkeley.edu/cleepubs/56 (last access: 18 May 2018), 2018.
Carey, C. J., Hart, S. C., Aciego, S. M., Riebe, C. S., Blakowski, M. A., and Aronson, E. L.: Microbial community structure of subalpine snow in the Sierra Nevada, California, Arct. Antarct. Alp. Res., 48, 685–701, https://doi.org/10.1657/AAAR0015-062, 2016.
Dolanc, C. R. and Hunsaker, C. T.: The transition from riparian to upland forest plant communities on headwater streams in the southern Sierra Nevada, California, United States, J. Torrey Bot. Soc., 144, 280–295, https://doi.org/10.3159/TORREY-D-15-00073.1, 2017.
Goulden, M. L. and Bales, R. C.: Vulnerability of montane runoff to increased evapotranspiration with upslope vegetation distribution, Proc. Nat. Acad. Sci. USA, 111, 14071–14075, 2014.
Goulden, M. L., Anderson, R. G., Bales, R. C., Kelly, A. E., Meadows, M., and Winston, G. C.: Evapotranspiration along an elevation gradient in the Sierra Nevada, J. Geophys. Res., 117, G03036, https://doi.org/10.1029/2012JG002027, 2012.
Hahm, W. J., Riebe, C. S., Lukens, C. E., and Araki, S.: Bedrock composition regulates mountain ecosystems and landscape evolution, Proc. Nat. Acad. Sci. USA, 111, 3338–3343, https://doi.org/10.1073/pnas.1315667111, 2014.
Holbrook, W. S., Riebe, C. S., Elwaseif, M., Hayes, J. L., Harry, D. L., Basler-Reeder, K., Malazian, A., Dosseto, A., Hartsough, P. C., and Hopmans, J. W.: Geophysical constraints on deep weathering and water storage potential in the Southern Sierra Critical Zone Observatory, Earth Surf. Proc. Land., 39, 366–380, https://doi.org/10.1002/esp.3502, 2014.
Hunsaker, C. T. and Johnson, D.W.: Concentration-discharge relationships in headwater streams of the Sierra Nevada, California, Water Resour. Res., 53, 7869–7884, https://doi.org/10.1002/2016WR019693, 2017.
Hunsaker, C. T. and Safeeq, M.: Kings River Experimental Watersheds stream discharge, Fort Collins, CO, Forest Service Research Data Archive, https://doi.org/10.2737/RDS-2017-0037, 2017.
Hunsaker, C. T. and Safeeq, M.: Kings River Experimental Watersheds meteorology data. Fort Collins, CO, Forest Service Research Data Archive, https://doi.org/10.2737/RDS-2018-0028, 2018.
Hunsaker, C. T., Whitaker, T. W., and Bales, R. C.: Snowmelt runoff and water yield along elevation and temperature gradients in California's southern Sierra Nevada, J. Am. Water Res. Assoc., 1–12, 667–678, https://doi.org/10.1111/j.1752-1688.2012.00641.x, 2012.
Jepsen, S. M., Harmon, T. C., Meadows, M. W., and Hunsaker, C. T.: Hydrogeologic influence on changes in snowmelt runoff with climate warming: Numerical experiments on a mid-elevation catchment in the Sierra Nevada, USA, Hydrology, 533, 332–342, https://doi.org/10.1016/j.jhydrol.2015.12.010, 2016.
Johnson, D. W., Hunsaker, C. F., Glass, D. W., Rau, B. M., and Roath, B. A.: Carbon and nutrient contents in soils from the Kings River Experimental Watershed, Sierra Nevada Mountains, California, Geoderma, 160, 490–502, https://doi.org/10.1016/j.geoderma.2010.10.019, 2010.
Kerkez, B., Glaser, S. D., Bales, R. C., and Meadows, M. W.: Design and performance of a wireless sensor network for catchment-scale snow and soil moisture measurements, Water Resour. Res., 48, W09515, https://doi.org/10.1029/2011WR011214, 2012.
Klos, P. Z., Goulden, M. L., Riebe, C. S., Tague, C. L., O'Geen, A. T., Flinchum, B. A., Safeeq, M., Conklin, M. H., Hart, S. C., Berhe, A. A., Hartsough, P. C., Holbrook, W. S., and Bales, R. C.: Subsurface plant-accessible water in mountain ecosystems with a Mediterranean climate, WIREs Water, 5, e1277, https://doi.org/10.1002/wat2.1277, 2018.
Liu, F., Hunsaker, C. T., and Bales, R. C.: Controls of streamflow generation in small catchments across the snow-rain transition in the Southern Sierra Nevada, California, Hydrol. Process., 27, 1959, https://doi.org/10.1002/hyp.9304, 2012.
McCorkle, E. P., Berhe, A. A., Hunsaker, C. T., Johnson, D. W., McFarlane, K. J., Fogel, M. L., and Hart, S. C.: Tracing the source of soil organic matter eroded from temperate forest catchments using carbon and nitrogen isotopes, Geology, 445, 172–184, https://doi.org/10.1016/j.chemgeo.2016.04.025, 2016.
Oroza, C. A.: Repeater placement strategy for mesh networks in complex terrain. Chapter 3 in Design and optimization of wireless-sensor networks for real-time monitoring in the Sierra Nevada and Sacramento-San Joaquin Delta, UC Berkeley PhD Thesis, 2017.
Oroza, C. A., Zheng, Z., Glaser, S. D., Tulia, D., and Bales, R. C.: Optimizing embedded sensor network design for catchment-scale snow-depth estimation using LiDAR and machine learning, Water Resour. Res., 52, 8174–8189, https://doi.org/10.1002/2016WR018896, 2016.
Oroza, C. A., Bales, R. C., Stacy, E., Zheng, Z., and Glaser, S. D.: Long-term variability of soil moisture in the southern Sierra: measurement and prediction, Vadose Zone J., 17, 170178, https://doi.org/10.2136/vzj2017.10.0178, 2018.
Safeeq, M. and Hunsaker, C.: Characterizing runoff and water yield for headwater catchments in the southern Sierra Nevada, J. Am. Water Resour. Assoc., 52, 1327–1346, https://doi.org/10.1111/1752-1688.12457, 2016.
Saksa, P., Safeeq, M., and Dymond, S.: Recent Patterns in Climate, Vegetation, and Forest Water Use in California Montane Watersheds, Forests, 8, 278, https://doi.org/10.3390/f8080278, 2017.
SNEP: Sierra Nevada Ecosystem Project, Final Report to Congress, University of California Davis, Wildland Resources Center Report 36, 1996.
Son, K., Tague, C., and Hunsaker C.: Effects of model spatial resolution on ecohydrologic predictions and their sensitivity to inter-annual climate variability, Water, 8, 321, https://doi.org/10.3390/w8080321, 2016.
Stacy, E. M., Hart, S. C., Hunsaker, C. T., Johnson, D. W., and Berhe, A. A.: Soil carbon and nitrogen erosion in forested catchments: implications for erosion-induced terrestrial carbon sequestration, Biogeosciences, 12, 4861–4874, https://doi.org/10.5194/bg-12-4861-2015, 2015.
Stephens, S. L., McIver, J. D., Boerner, R. E. J., Fettig, C. J., Fontaine, J. B., Hartsough, B. R., Kennedy, P., and Schwilk, D. W.: The Effects of Forest Fuel-Reduction Treatments in the United States, BioScience, 62, 549–560, https://doi.org/10.1525/bio.2012.62.6.6, 2012.
Tague, C. and Peng, H.: The sensitivity of forest water use to the timing of precipitation and snowmelt recharge in the California Sierra: Implications for a warming climate, J. Geophys. Res.-Biogeosci., 118, 875–887, https://doi.org/10.1002/jgrg.20073, 2013.
Westerling, A. L. R.: Increasing western US forest wildfire activity: sensitivity to changes in the timing of spring, Phil. Trans. R. Soc. B., 371, 20150178, https://doi.org/10.1098/rstb.2015.0178, 2016.
Zhang, Z., Glaser, S. G., Bales, R. C., Conklin, M., Rice, R., and Marks, D. G.: Technical report: the design and evaluation of a basin-scale wireless sensor network for mountain hydrology, Water Resour. Res., 53, 4487–4498, https://doi.org/10.1002/2016WR019619, 2017.
Zheng, Z., Molotch, N. P., Oroza, C., Conklin, M., and Bales, R. C.: Spatial snow water equivalent estimation for mountainous areas using wireless-sensor networks and remote-sensing products, Remote Sens. Environ., 215, 44–56, https://doi.org/10.1016/j.rse.2018.05.029, 2018.