the Creative Commons Attribution 4.0 License.
the Creative Commons Attribution 4.0 License.
 | 01 Oct 2018
Hydrometeorological data from Baker Creek Research Watershed, Northwest Territories, Canada
Christopher Spence
Newell Hedstrom
It is uncommon to collect long-term coordinated hydrometeorological and hydrological data in northern circumpolar regions. However, such datasets can be very valuable for engineering design, improving environmental prediction tools or detecting change. This dataset documents physiographic, hydrometeorological and hydrological conditions in the Baker Creek Research Watershed from 2003 to 2016. Baker Creek drains water from 155 km2 of subarctic Canadian Shield terrain in Canada's Northwest Territories. half-hourly hydrometeorological data were collected each year, at least from April to October, from representative locations, including exposed Precambrian bedrock ridges, peatlands, open black spruce forest and lakes. Hydrometeorological data include radiation fluxes, rainfall, temperature, humidity, winds, barometric pressure and turbulent energy fluxes. Terrestrial sites were monitored for ground temperature and soil moisture. Spring maximum snowpack water equivalent, depth and density data are included. Daily streamflow data are available for a series of nested watersheds ranging in size from 9 to 128 km2. These data are unique in this remote region and provide scientific and engineering communities with an opportunity to advance understanding of geophysical processes and improve infrastructure resiliency. The data described here are available at: https://doi.org/10.20383/101.026.
- Article
(7477 KB) - Full-text XML
- BibTeX
- EndNote


The subarctic Canadian Shield is typified by a landscape dominated by exposed Precambrian bedrock, numerous lakes, open forest and wetlands. It is a large region, occupying 1.26 million km2 and 13 % of Canada. It extends from the Northwest Territories in the west and to the east through the Nunavut territory, the provinces of Saskatchewan, Manitoba, Québec, and Newfoundland and Labrador. By its sheer size, it represents an important region for Canada. It is rich in mineral deposits, including gold, diamonds, rare earth elements, nickel and copper. There are several active mines across the region, but there are also many abandoned mines that represent a significant environmental liability. Hydroelectric power generation is a significant economic activity. How the hydrometeorology of this region may or may not be changing has consequences beyond its borders. This includes, but is not limited to, implications of changes to the timing and magnitude of freshwater flux into the Arctic Ocean. The importance of freshwater content in the Arctic Ocean to its circulation (Carmack et al., 2016) may have cascading impacts on storm tracks to more southern latitudes (Vihma et al., 2016). The region produces an estimated 10 % of the freshwater yield that flows towards the Arctic Ocean (Prowse and Flegg, 2000), so changes here may not be inconsequential elsewhere.
The ability to make informed decisions about engineering design and make short- and long-term predictions about environmental conditions in this region can be hindered by a lack of data. The large areas and limited transportation infrastructure make intensive data collection expensive. There are no long-term climate stations in the region for which there are up-to-date precipitation data adequate for long-term change detection (Laudon et al., 2017). It is rare to have multiple gauges on streams that can provide data to help understand how water is transferred through watersheds and across landscapes. Such information is also important for developing and testing water and energy cycling algorithms used in both weather and climate models.
To help fill this gap, the Baker Creek Research Watershed was instituted in the early 2000s. The hydrometeorological data produced from activities in this watershed describe atmospheric conditions, soil climate and streamflow among a series of nested watersheds. These data constitute the only integrated hydrological and hydrometeorological small basin dataset in the western subarctic Canadian Shield. The data described here represent a valuable resource of hydrometeorological conditions that can be used for engineering design, improving environmental prediction tools or detecting change. While these data are not representative of the conditions in locations further afield in the subarctic Canadian Shield, they can be used to understand hydrological processes and inform an environmental model structure that can be used across the region. The cautious use of some of the data with longer periods of record could be used in change detection studies. As shown below, the period of record in 2005–2016 represents an almost complete wet–dry cycle useful for understanding extremes in the area. The years 2008 to 2011 were among the wettest on record compared to nearby long-term meteorological data. This was followed by a drought from 2012 and 2016. This drought was most severe in 2015 and was a major contributor to forest fires in 2014 that were the most extensive in 2 decades (Walker et al., 2018).
The Baker Creek Research Watershed is located in the subarctic Canadian Shield landscape of Canada's Northwest Territories near the city of Yellowknife. Baker Creek is a stream characterized by lakes connected by short channels that drains water from ∼165 km2 at its outlet into Great Slave Lake (Fig. 1). The observation focus is in the upper reaches of the stream, specifically that area of the watershed upstream of the Water Survey of Canada (WSC) hydrometric gauge Baker Creek at the outlet of Lower Martin Lake (07SB013), which has a topographic drainage area of 155 km2. There are 349 perennial lakes in the basin, with many being small, and the median and mean lake areas are 5400 and 88 800 m2, respectively. The basin is in the zone of discontinuous permafrost. Large changes in topography, vegetation, winter snow accumulation, local hydrology and surficial geology over short distances result in abrupt transitions from permafrost to non-permafrost conditions. Glaciolacustrine clays, outwash and organic deposits are typically underlain by permafrost, whereas bedrock and well-drained glaciofluvial sands are typically unfrozen (Morse et al., 2016). The thickness of organic soils or fine-grained materials derived from glaciolacustrine sediments, glaciofluvial sands or outwash range from less than 1 m to more than 10 m, depending on underlying bedrock topography. Well- and ground-thermistor string installations associated with this dataset rarely involve drilling greater than 10 m before encountering bedrock. An organic soil layer of about 0.25 m is ubiquitous over fine-grained soils. Any forest canopy that grows in these areas is typically quite open. Predominant vegetation includes black spruce (Picea mariana), jack pine (Pinus banksiana), paper birch (Betula papyrifera), Labrador tea (Ledum groenlandicum), moss (Sphagnum spp.) and lichen (Cladonia spp.).
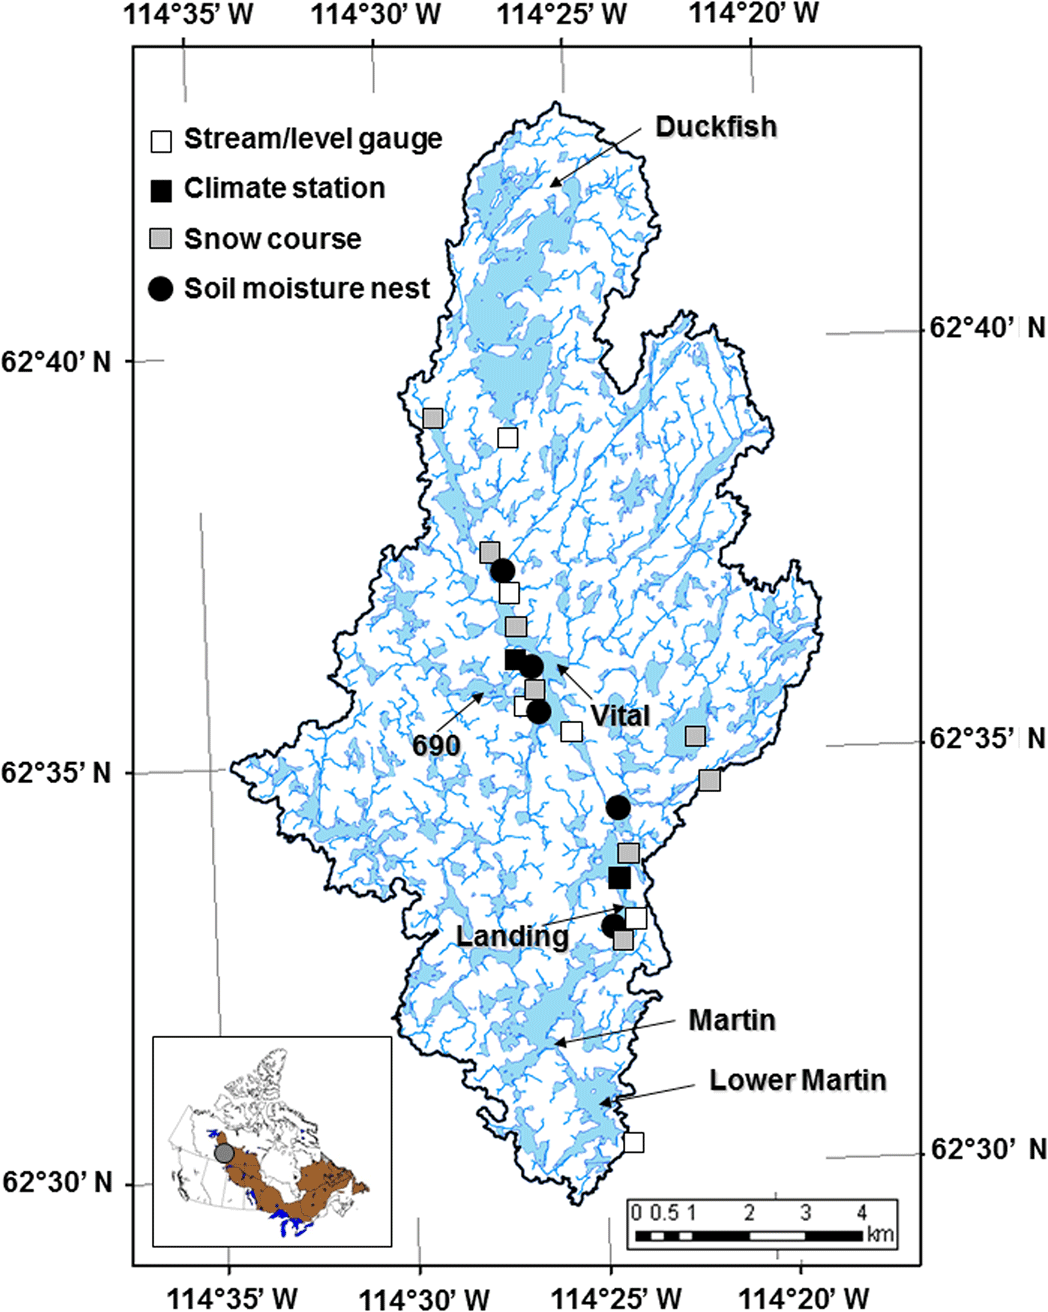
Figure 1The Baker Creek watershed illustrating the drainage network (derived from 1:50 000 scale National Topographic System maps) and observation sites. Lakes that are monitored are identified. The outlet of the watershed defined by the map is at Lower Martin Lake. The inset map of the Northwest Territories shows the Canadian Shield ecozones and Baker Creek's location in the grey circle.
Data from the nearby Meteorological Service of Canada (MSC) climate station Yellowknife A characterize a regional climate that has short cool summers (July daily average temperature of 17 ∘C) and long cold winters (January daily average temperature of −27 ∘C). Annual unadjusted precipitation averages at 289 mm, with 40 % of that falling as snow. Annual snow cover begins in October and lasts until the end of April and beginning of May (Spence et al., 2010). In most years, the largest input of water to the basin is during the spring freshet (Spence et al., 2011) and the hydrological regime of the basin is described best as subarctic nival. The average annual streamflow at the outlet of Lower Martin Lake is 0.24 m3 s−1 or 47 mm a−1, providing an annual runoff ratio of 0.17. This was calculated using published precipitation data that were unadjusted for undercatch, which implies that actual runoff ratios may be lower. The runoff regime exhibits remarkable variation for a basin with almost 350 lakes, with a standard deviation in annual streamflow of 0.18 m3 s−1 or 37 mm a−1 and annual runoff ratios that range from 0.005 (2015) to 0.34 (2001). A maximum daily streamflow of 8.7 m3 s−1 has been observed, but there are common prolonged periods of zero flow below the outlet of Lower Martin Lake.
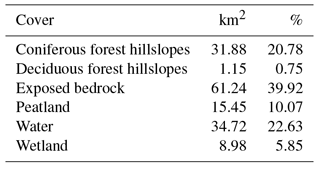
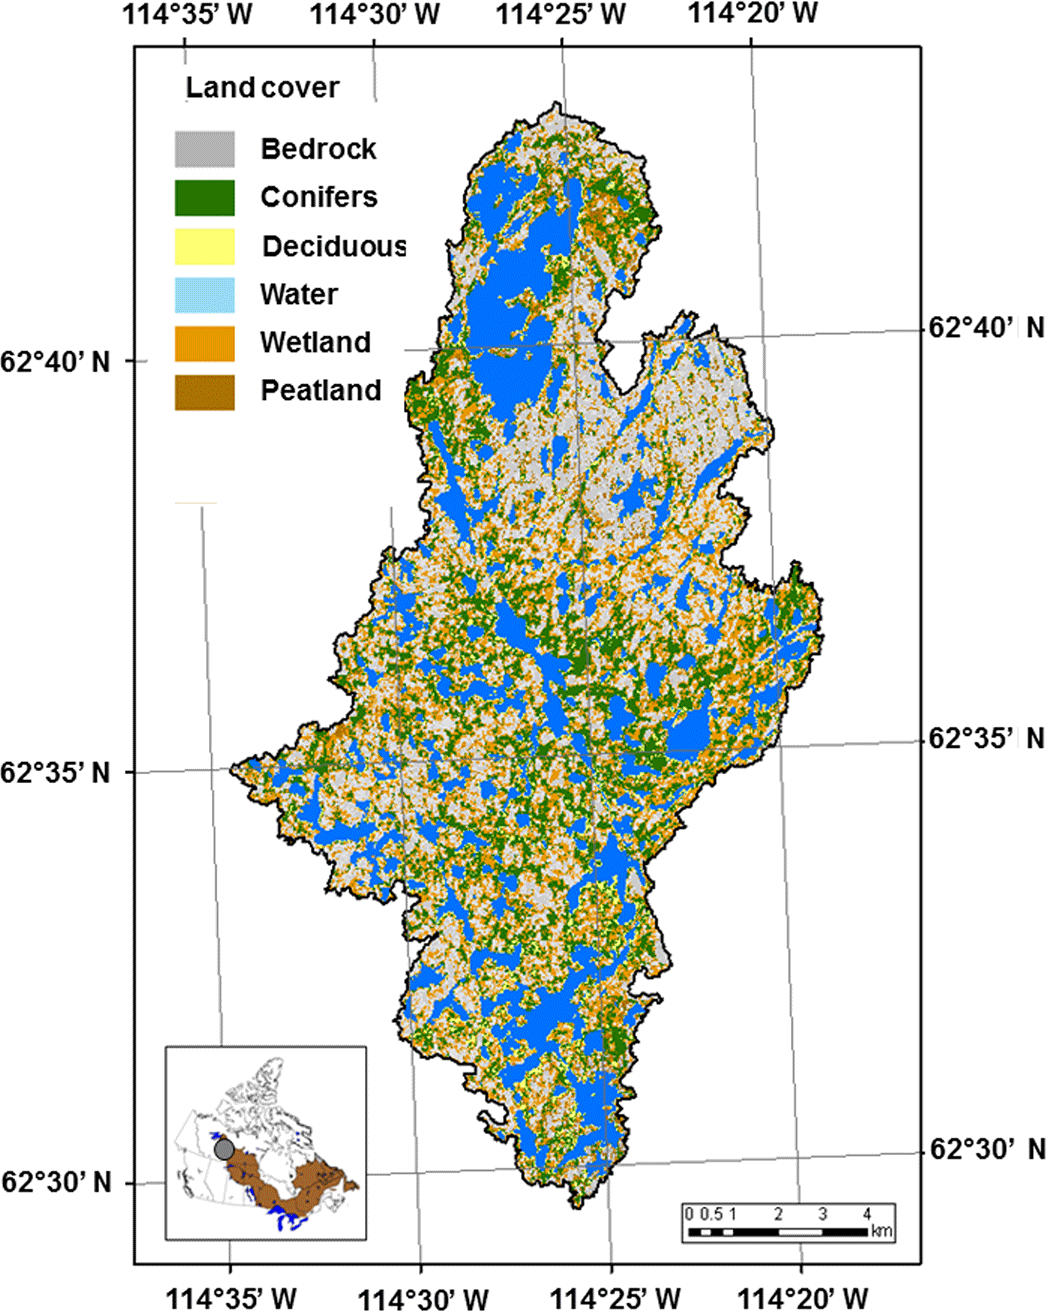
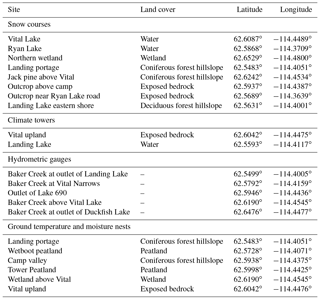
Physiographic data available for the Baker Creek Research Watershed include a satellite-derived land cover classification at a 10 m resolution (Fig. 2). Land cover was mapped using a maximum likelihood supervised classification of a composite image of two SPOT5 MS satellite images collected on 24 May 2008 and 20 June 2009. Four multispectral bands and the normalized difference vegetation index of both images were used as input information. Using two images, one prior to and one after leaf-out, assists in differentiating vegetation. Following classification, a mode-based filter with a 3 cell by 3 cell mask was passed over the image to filter out errors commonly experienced at edges due to mixed pixel signatures. The accuracy of the land cover classification was evaluated using a random sample of 314 points recorded during field surveys and marked with a handheld global positioning system (GPS) accurate to within ±8 m. The overall accuracy of the land cover map was 86 %, and the kappa coefficient was 0.82. Land cover was classified into six primary types (Table 1), of which exposed bedrock and lakes and ponds comprise 61 % (Phillips et al., 2011). Variation in soil properties among the different soil-covered land cover types is listed in Table 2. Soil samples were collected during a study summarized in Guan et al. (2010a, b) and properties calculated using the methods and equations found in Dingman (2015). Saturated hydraulic conductivity was measured in piezometers installed at representative locations and calculated with the Luthin approach (1966).
Table 1Land cover percentages from SPOT-5 classification exercise.
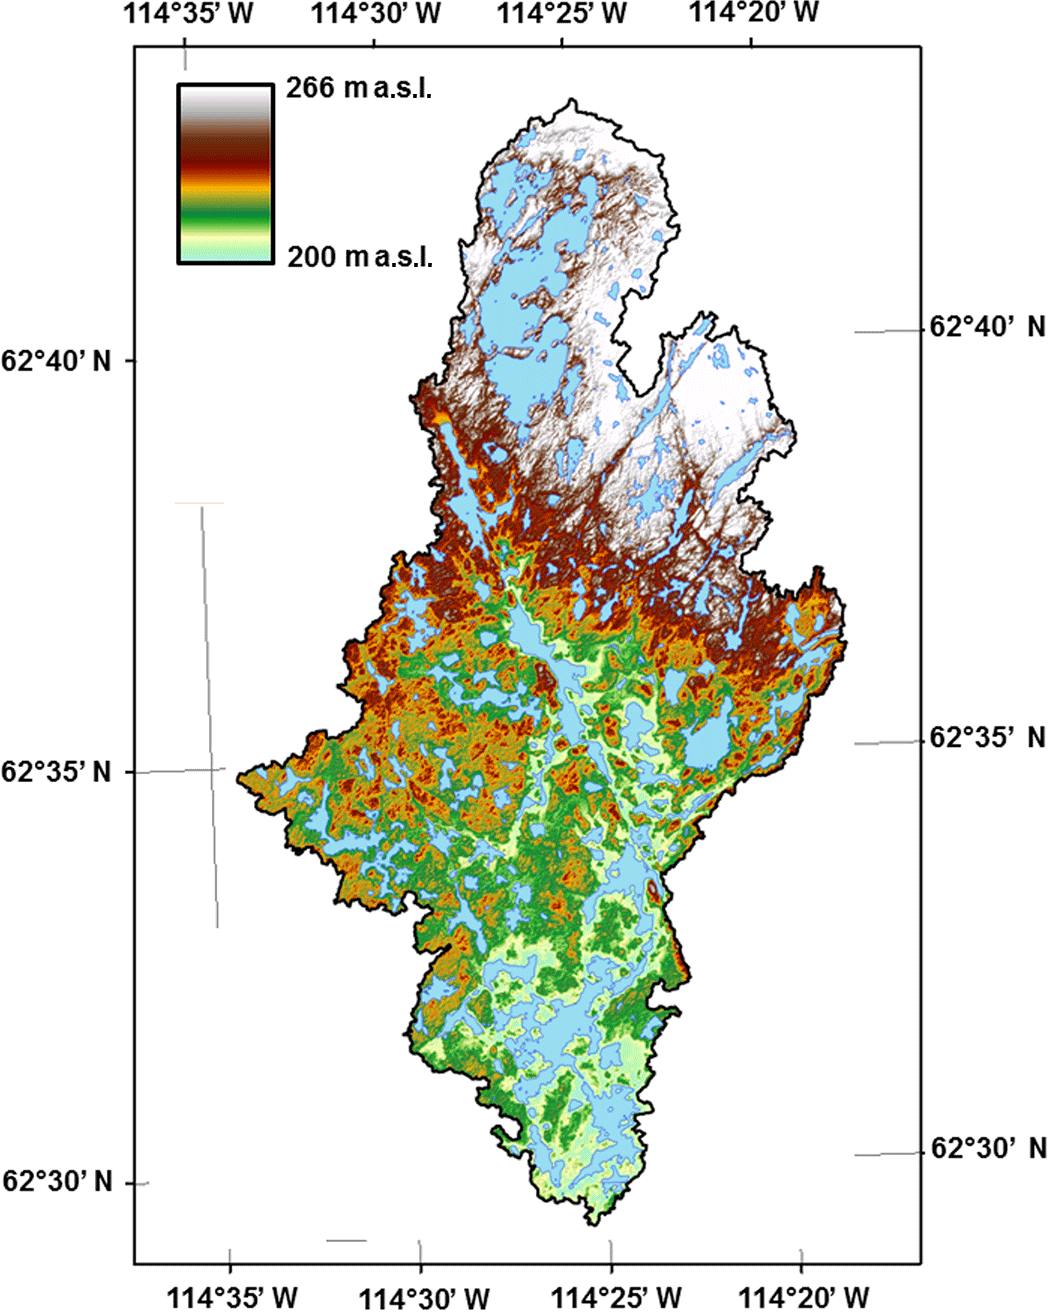
Elevation data (Fig. 3) were collected during a Light Detection and Ranging (LiDAR) survey on 21 August 2007. During the survey, 1 s interval GPS base-station data were collected from the Natural Resources Canada's Canadian Active Control Site GPS site in nearby Yellowknife. Laser-point positions were computed by differentially correcting all base-station data, integrating these with the airborne GPS and an inertial measurement unit (IMU) to differentially correct the airborne trajectory, calibrating survey data over known targets. Data post-processing included examining for mismatches between flight lines and isolating high and low laser-pulse returns that were well above the canopy or below the ground surface. Ground returns were classified from the point cloud within TerraScan assuming at least one ground point was within a 400 m2 area, the terrain angle was less than 88∘, the iteration angle was less than 6∘ and the iteration distance was less than 1.4 m to the plane. Datasets were adjusted to account for local geoidal undulation. Orthometric heights and geoid separation were determined using the HTv2.0 model (CGG2000 Scientific model + HRG01 Corrector Surface, allowing the direct transformation of NAD83 or International Terrestrial Reference Frame (ITRF) ellipsoidal heights to CGVD28 orthometric heights). Ground-only points were gridded to 1 m node spacing using 2nd power inverse distance to power functions within a 15 m search radius. This 1 m dataset was degraded to 10 m to align with the land cover data described above. Both the elevation and land cover datasets are projected to NAD1983 UTM Zone 11N (Spence et al., 2010).
Table 2Soil characteristics in each typical soil-covered landscape type present in the Baker Creek Research Watershed. K denotes hydraulic conductivity.
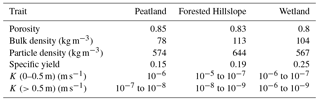
Table 3List of monitoring locations in the Baker Creek Research Watershed.
There are two long-term primary climate towers operating in the catchment (Table 3). These occupy locations above an exposed bedrock ridge and a lake (Figs. 1 and 4). As noted above, these two cover types represent the majority of the catchment area (61 %). They are also arguably the most difficult surfaces over which to estimate turbulent energy fluxes, so both stations are equipped with eddy covariance instrumentation. Meteorological variables measured at each tower include air temperature, relative humidity or vapour pressure, net radiation and its components, wind speed, barometric pressure, and rainfall. The tower specifications, including variables and units, sensor types and heights, and surface characteristics are summarized in Table 4. Radiometers (Kipp and Zonen NR-Lite and CNR-1s and Li-Cor LI-200SAs) are mounted to face south to reduce shadows on the sensors. Temperature and relative humidity sensors (Vaisala HMP45Cs) are deployed within 10 plate shields to mitigate the influence of wind and sunlight on measurements. Wind speed is measured with three-cup anemometers (Met One 013As) at both towers, while wind direction is measured with a wind vane (NRG) at Landing Lake. Surface-water temperature is measured with an infrared thermometer (Apogee SI-111) mounted four metres above the water and pointed towards the water. There is a Texas Instruments TE-525M tipping bucket rain gauge mounted at the top of the bedrock tower. This type of gauge is not designed to measure solid precipitation. Hence, the dataset includes only rainfall data and not precipitation data. The eddy covariance systems at both sites employ CSAT-3 sonic anemometers. Water vapour content is measured at the bedrock tower with a Li-Cor Li-7500 and at the lake with a Campbell Scientific KH-20. Both systems measure wind speed and water vapour content at 10 Hz and fluxes are calculated over a half-hour period. Corrections to the eddy covariance measurements include coordinate rotation (Kaimal and Finnigan, 1994), the Webb–Pearman–Leuning (WPL) adjustment (Webb et al., 1980), sonic path length, high frequency attenuation and sensor separation (Massman, 2000; Horst, 1997), and oxygen extinction (Blanken et al., 2011). Barometric pressure is measured with different sensors at each tower. At the bedrock tower, the Li-Cor Li-7500 from the eddy covariance system is used, and at the lake tower, an RM Young 612 is deployed. All meteorological data are observed every 5 s, and half-hourly averages (or totals) are logged on Campbell Scientific 23X or CR3000 data loggers. The dataset includes these half-hourly values. The period of record of the bedrock ridge tower extends from 2005 to 2016. The lake tower's period of record is from 2008 to 2016. There are numerous gaps in the data due to sensor malfunction, none of which were filled. The stations typically operate from early April to early October each year and are not operated through winter because data integrity cannot be guaranteed. This is primarily due to frost being allowed to collect on the towers because of infrequent site visits. This frost either prevents batteries from being charged or coats sensors that prevent accurate readings.
Table 4Sensor suites at the primary climate stations at the bedrock ridge and Landing Lake. Vegetation height is the maximum observed at the bedrock ridge, with displacement and roughness height calculated with equations found in Oke (1987). NA – not available
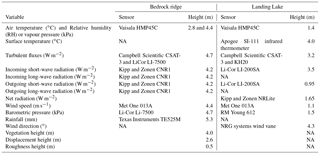
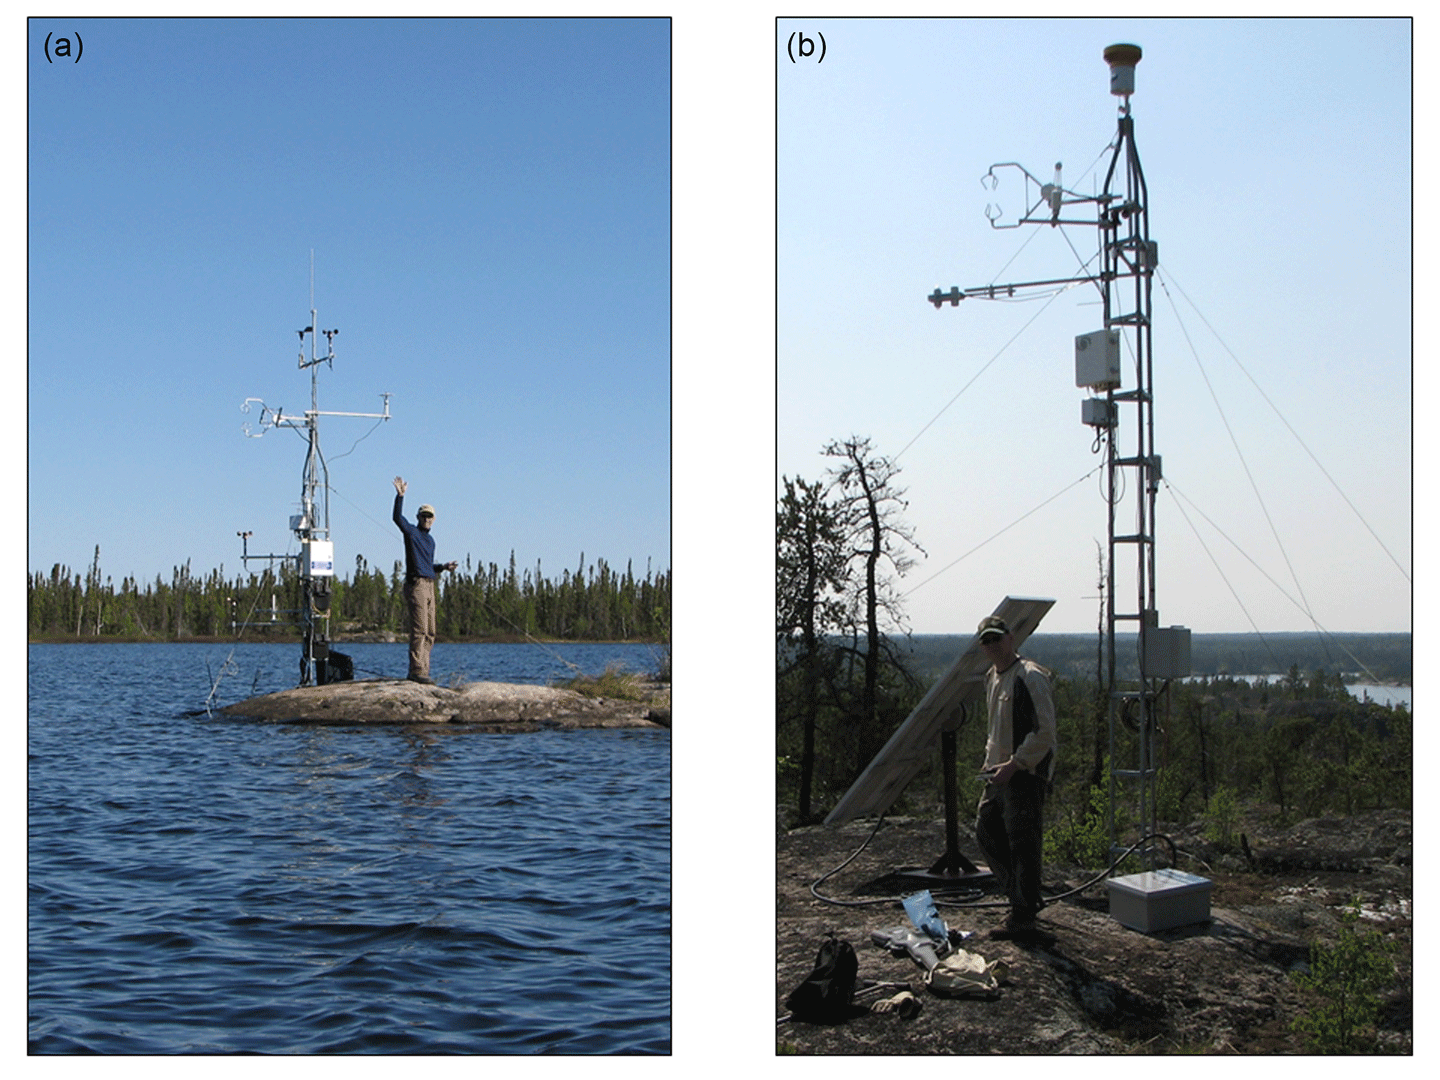
Figure 4Photos of (a) the climate tower at Landing Lake and (b) the climate tower on the bedrock ridge above Vital Lake.

Figure 5Monthly average radiation and energy fluxes at the bedrock ridge climate tower in 2005–2016. The radiation terms Q*, K↓, K↑, L↓ and L↑ are net radiation, downwelling short-wave radiation, upwelling short-wave radiation, downwelling long-wave radiation and upwelling long-wave radiation, respectively. The turbulent energy fluxes are sensible heat, Qh, and latent heat, Qe.
The strong seasonality of radiation and energy exchanges in this landscape are evident from the climate tower on the exposed bedrock outcrop near Vital Lake (Fig. 5). Incoming long-wave radiation remains relatively consistent month to month compared to incoming short-wave radiation, the latter peaking near 250 W m−2 in June and decreasing to <100 W m−2 by September. Net long-wave radiation is almost always negative from exposed bedrock surfaces during the snow-free season. short-wave albedos are typically low (0.12), except when snow is present (∼0.7). Net radiation rises from monthly averages of 75 W m−2 in April to 140 W m−2 in June and then steadily decreases to 50 W m−2 by September. Bowen ratios are high in this dry location, almost always exceeding unity, with monthly averages commonly near 3.0. Only during exceptionally wet autumn periods (2008) were monthly Bowen ratios less than 1. At the tower located on Landing Lake, the seasonal cycle begins with predominantly negative Bowen ratios at the end of winter, as sensible heat fluxes are directed to the snow- and ice-covered surface. Monthly average latent heat fluxes are always higher than sensible heat fluxes. Sensible heat increases relative to latent heat at the very end of the open-water season, as conditions get cool and damp (Fig. 6). Short-wave albedos of the lake surface stay high (0.5) until lake ice break-up in early to mid-June, after which they average 0.15.
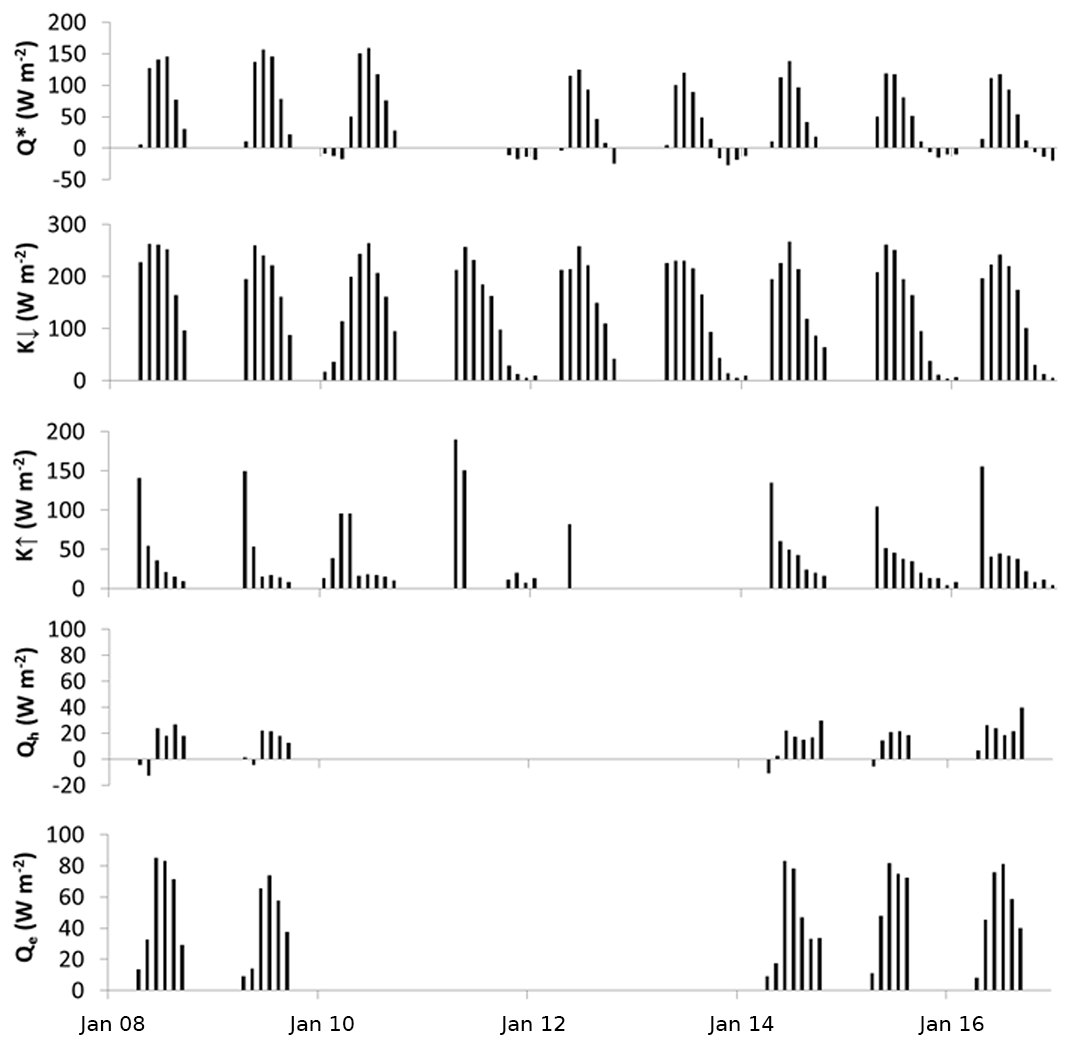
Figure 6Monthly average radiation and energy fluxes at the Landing Lake climate tower in 2008–2016. Nomenclature is identical to that in Fig. 5.
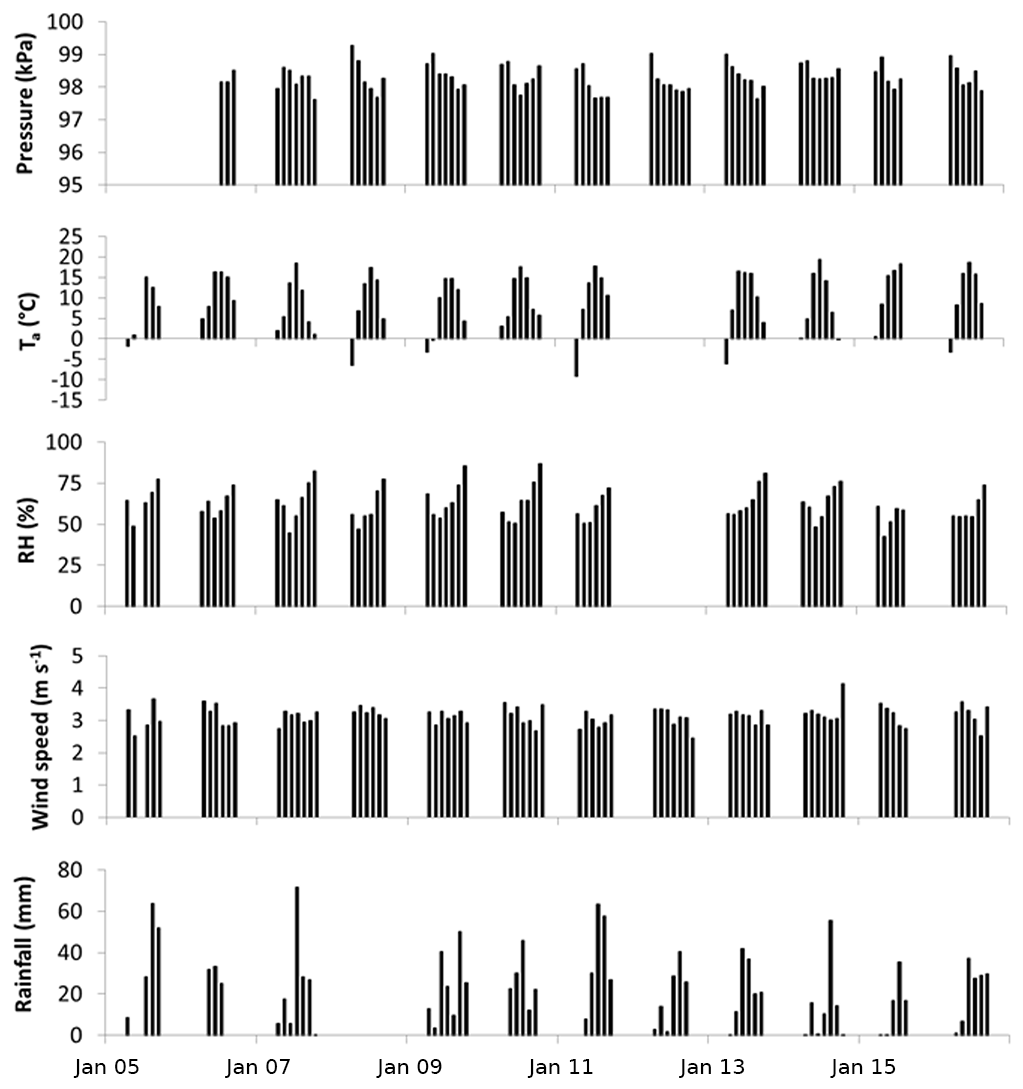
Figure 7Monthly average meteorological conditions at the bedrock ridge climate tower in 2005–2016. Ta refers to air temperature, RH denotes relative humidity, and pressure refers to barometric pressure.
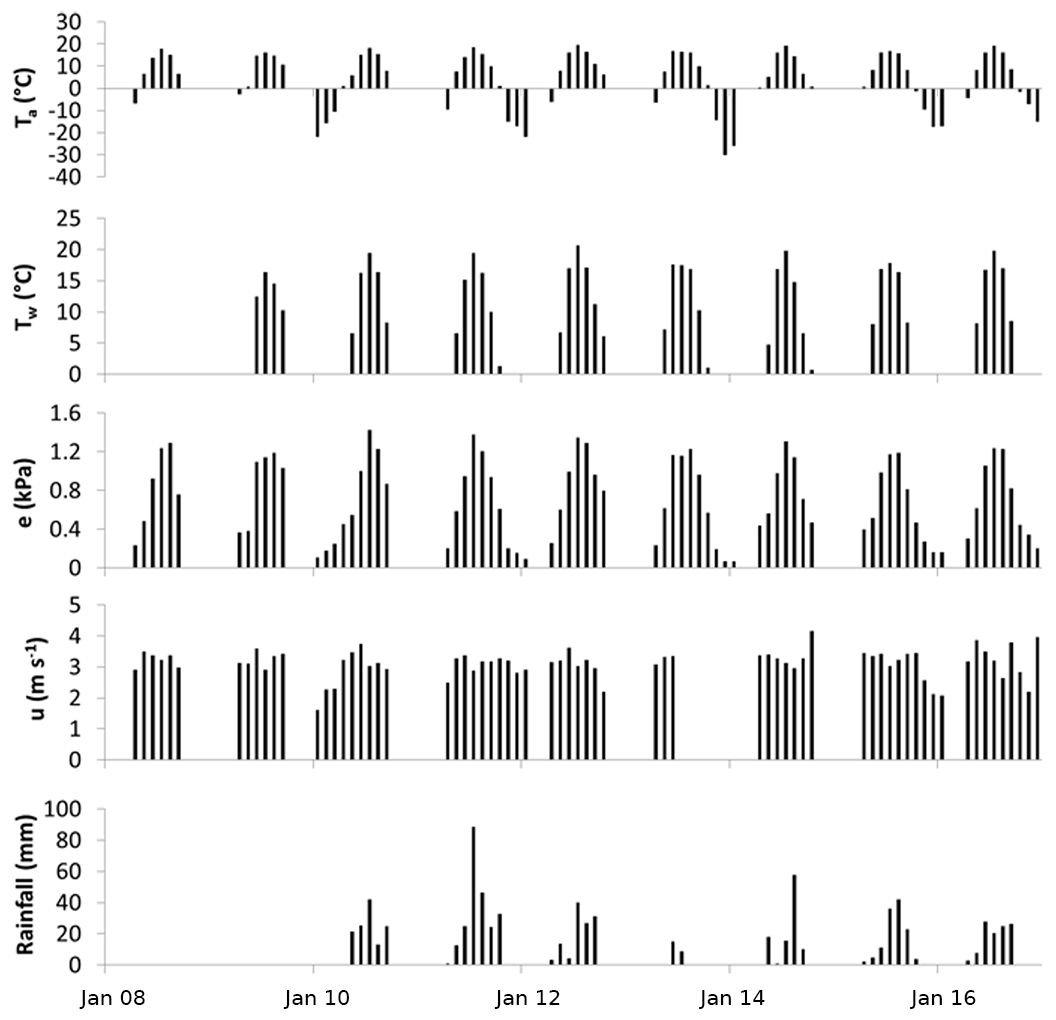
Figure 8Monthly average meteorological conditions over Landing Lake in 2008–2016. Ta and Tw denote air and surface-water temperature, respectively. Vapour pressure is e, and u is wind speed.
The meteorological data presented in Figs. 7 and 8 do not always fully demonstrate the strong annual cycles of temperature that occur in this region, but monthly average air temperatures usually rise above 0 ∘C in May, peak just below 20 ∘C in July, average 8 ∘C in September and drop below freezing again in October. Mean annual air temperature measured by the Meteorological Service of Canada at the nearby Yellowknife A station from 2005 to 2016 was −3.4∘. Relative humidity rises through the warm season, averaging 58 % and 74 % in July and September, respectively. Average wind speed for the period of record is 3 m s−1, with a maximum recorded half-hourly average of 12 m s−1. Wind speeds over 10 m s−1 occur less than one percent of the time. The period in 2005–2016 represents an almost complete wet–dry cycle. Data from Yellowknife A beginning in the 1940s provide excellent context for the data collected at Baker Creek, with an average April–September precipitation of 180 mm. The gauges in Baker Creek averaged a total of 147 mm over these months from 2005 to 2011, but this decreased by 27 % to 107 mm between 2012 and 2016. This drought was most severe in 2015, with only 70 mm of rainfall.
Each year since 2003 (except 2006), a land cover stratified spring maximum snow pack survey has been conducted within the Baker Creek basin at the locations listed in Table 3. These are typically done in 1 day within the first 2 weeks of April. Within each of the five land cover types described above – coniferous forest, deciduous forest, lakes, exposed bedrock and wetlands – there is at least one designated 25-point snow course (Fig. 9). Wetlands and peatlands are combined into one cover type for the purposes of the spring snow survey. At each course 25 depths are recorded at least 10 m apart using an aluminum rod marked every 1 cm. At each fifth depth measurement, a density measurement is taken using an ESC-30 snow corer. From these measurements, spring maximum snowpack depth (cm) and snow density (kg m−3) are estimated for each land cover type. The snow water equivalent (SWE) (mm) was calculated as the product of depth and density, with a conversion to change the units to millimetres. Spring snowpacks are rarely over 60 cm deep, and as Pomeroy and Gray (1995) suggest, these shallow snowpacks do not exhibit covariance between depth and density. A basin-wide average is calculated by pro-rating these estimates by land cover fractions provided in Table 1. The accuracy of such a snow survey is expected to be within 15 % (Pomeroy and Gray, 1995).

Figure 9The beginning of one of the exposed bedrock snow courses. Note the sparse jack pine individuals and exposed rock behind Ross Phillips.
Results indicate that the basin-wide spring maximum snow pack averaged 80±17 mm SWE in 2003–2016 (Fig. 10). Snow depths are shallow, reflecting the dry climate, averaging 38±8 cm. The deepest snowpacks are typically in the wetlands, perhaps as the shrubs that proliferate there experience less interception than the forest and better trap the snow (Sturm et al., 2001). The thinnest and most homogenous snowpack are over lakes, as these tend to be quite open and wind-blown (Rees et al., 2006; Derksen et al., 2006). The exposed bedrock almost always has the most variable snowpack, as the snow is transported from open areas into depressions across the uneven topographic surface (Fig. 9).

The nested hydrometric network in the Baker Creek basin (Table 3) includes one WSC gauge and five others operated by the Science and Technology Branch of Environment and Climate Change Canada. Baker Creek at the outlet of Lower Martin Lake (07SB013) has been operated by the WSC since 1983. These streamflow data are available from https://wateroffice.ec.gc.ca/search/historical e.html (last access: 20 June 2018). The outlet of Lower Martin Lake often remains open, and the stream cross section is bedrock and extremely stable. This results in a nearly complete (95 %) record of high-quality streamflow data that is a foundational component of research catchment operations.
The next oldest hydrometric gauge is at the outlet of Landing Lake (Fig. 1), which was installed in 2003 for the Mackenzie Global Energy and Water Cycle Experiment (GEWEX) Study (Woo, 2008). This was followed by Baker Creek at Vital Narrows in 2005, Baker Creek above Vital Lake and Moss Creek at the outlet of Lake 690 in 2008 and Baker Creek at the outlet of Duckfish Lake in 2009. These last three gauges were initially installed to support Canada's contribution to the International Polar Year. Permanent benchmarks were installed in 2017 that allow stages at all the gauges (save Baker Creek above Vital) to be referenced to elevations in metres above sea level. These benchmark locations are referenced to NAD83, but unlike the elevation dataset, they use orthometric heights in CGVD2013. Any future exercise that merges the water and topographic elevations must take this into account.
A combination of lower flows, beaver activity and icing-susceptible cross sections at these gauge sites higher in the basin make it more difficult to obtain continuous accurate stage measurements, stable rating curves and streamflow estimates. Of the non-WSC gauges, the Landing and Vital Narrows stations are meant to be capable of continuous stage measurements, while the others are seasonal, as stage recorders are removed in late fall to avoid the freezing of the transducers. This precludes many instances of known zero-flow periods from appearing in the record. The seasonal stage recorders at Baker Creek above Vital, at Duckfish Lake and at Moss Creek at the outlet of Lake 690 have recently been replaced with instrumentation capable of continuous stage measurements. These non-continuous records make it difficult to calculate and compare annual or multi-year basin yields, but the data are useful for hydrological model testing and process studies (Spence, 2006; Spence et al., 2010, 2014, 2018; Phillips et al., 2011).
The long WSC dataset from Baker Creek at the outlet of Lower Martin Lake provides context for the shorter records of the upstream gauges. The period beginning in 2003 was typically characterized by average to above average streamflow in the watershed, reflective of precipitation inputs (Figs. 7 and 10). The high rainfall was sometimes heavy enough to generate late warm-season runoff events (Spence et al., 2011, 2014) (e.g. 2008, 2011) that exceeded spring freshet events. These late fall and early winter events could not be captured at all gauges in all years because of icing conditions and are more evident at the Vital Narrows and Landing Lake gauges, which stay ice-free longer under high water conditions. The meteorological drought noted earlier (Fig. 7) that began in 2013 also manifested into a hydrological drought (Fig. 11). This effect is most pronounced at the highest gauge, Duckfish Lake, which has not experienced outflow since 2014 up until the time of writing (2018), as water levels remain below the lake outlet elevation. This kind of hydrologic disconnectivity is common across the watershed during dry conditions, and this can reduce streamflow so much that lake evaporation along the watercourse can prevent water from areas actively producing runoff from proceeding downstream (Spence, 2006; Spence et al., 2018). This was particularly evident in 2015 and 2016 with the differences in streamflow at the Vital Narrows, Landing Lake and Lower Martin gauges. During these types of periods, the sub-catchments of the Baker Creek watershed behave as individuals, rather than as part of a cohesive watershed.

Figure 11Daily streamflow (2003–2016) from the series of nested hydrometric gauges within the Baker Creek Research Watershed.
Shallow ground temperatures and soil moisture have been measured since 2007 at locations listed in Table 3. Decagon EM50 ECH20 data loggers with Decagon 5TM capacitance soil moisture and temperature sensors at the ground surface (i.e. 1 cm depth) and 25 cm depth are deployed at five locations throughout the basin. These sites represent the different typologies and topologies of areas with overburden; these are peat-filled bedrock depressions, forested hillslopes below bedrock ridges and wetlands between lakes (Table 2). These data have been used to estimate storage changes in these cover types across the basin, assuming that variability among such different land cover types is larger than that within the individual land cover types (Spence et al., 2010). Half-hourly data are typically available from April to December, capturing both the spring thaw and fall freeze-back (Fig. 12). The sensors have been prone to animal disturbance, so data completeness is uncommon. The sensors do not measure total water content, but total unfrozen water content, so values are unavailable through winter, and the soil moisture time series often captures an increase in unfrozen water during the spring thaw and a decrease during the freeze-back. This should not be interpreted as a change in storage but as a change in phase. The active layer depth varies among the sites, often shallowest (0.3 m) in wetlands and deepest in the peatlands (∼1.5 m) (Guan et al., 2010a). Soils near the surface often reach saturation during spring snowmelt but then quickly dry (Fig. 13). The dry climate means the elevation of the water table tends to follow the descent of the frost table in the drier hillslopes, with commensurate decreases in unsaturated soil moisture. Soil moisture at a depth in wetlands between lakes is much more stable than in the hillslopes, likely because of moisture distributed from runoff travelling through the wetland. Moisture distribution in these wetlands is known to be uneven (Spence et al., 2011), and edges of these wetlands may actually be better represented by measurements taken in forested hillslopes. The water table in peatlands is often near the surface, and the soil column is often near saturation through the entire warm season.
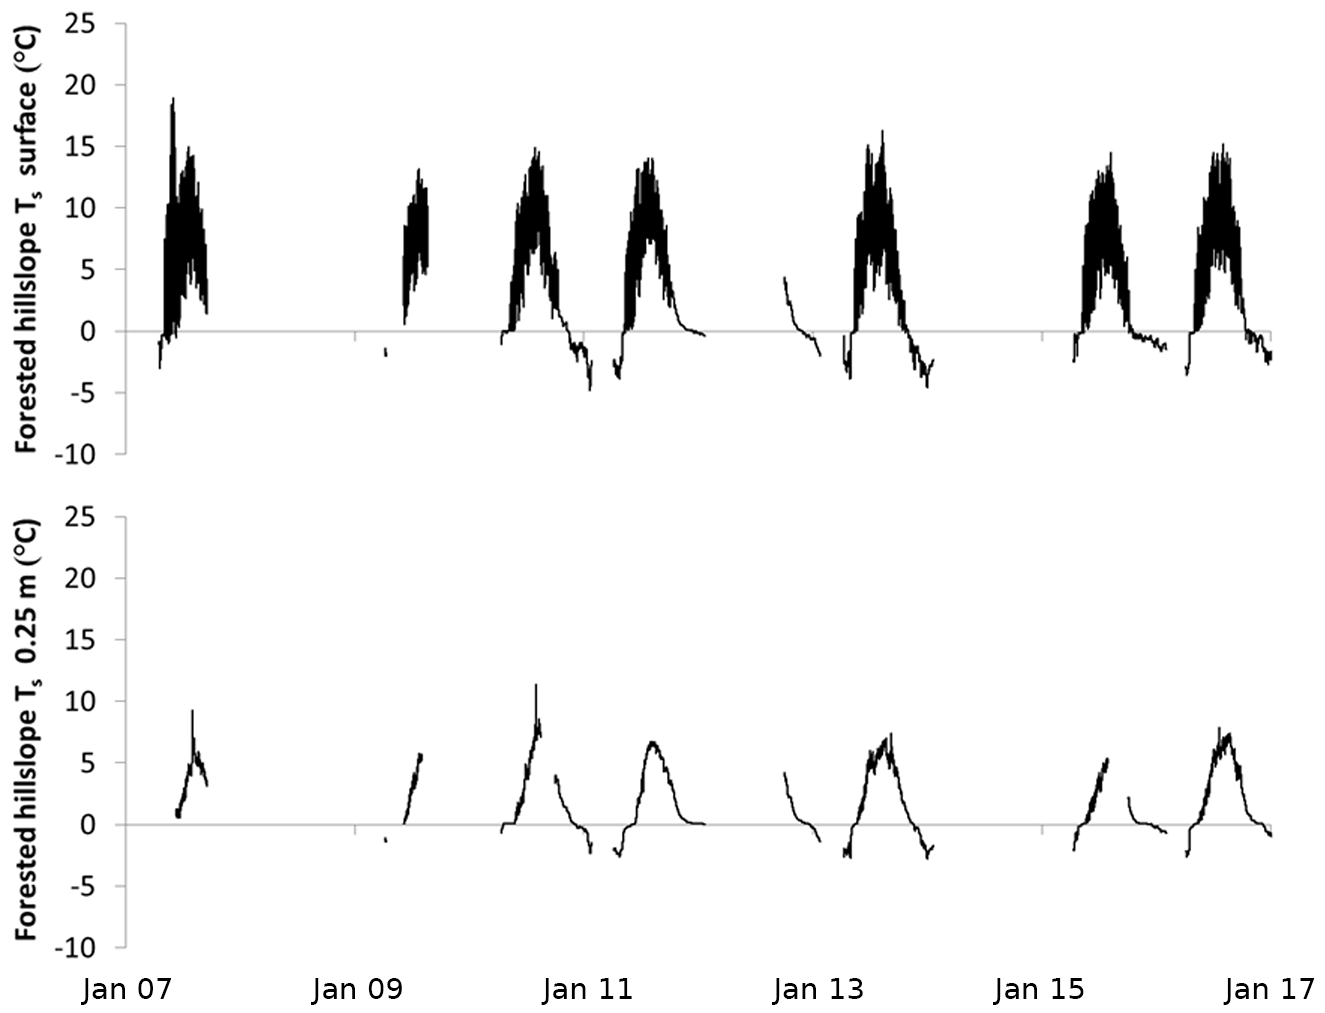
Figure 12Half-hourly surface and 0.25 m soil temperatures from one of the forested hillslope soil moisture nests from 2007 to 2016.
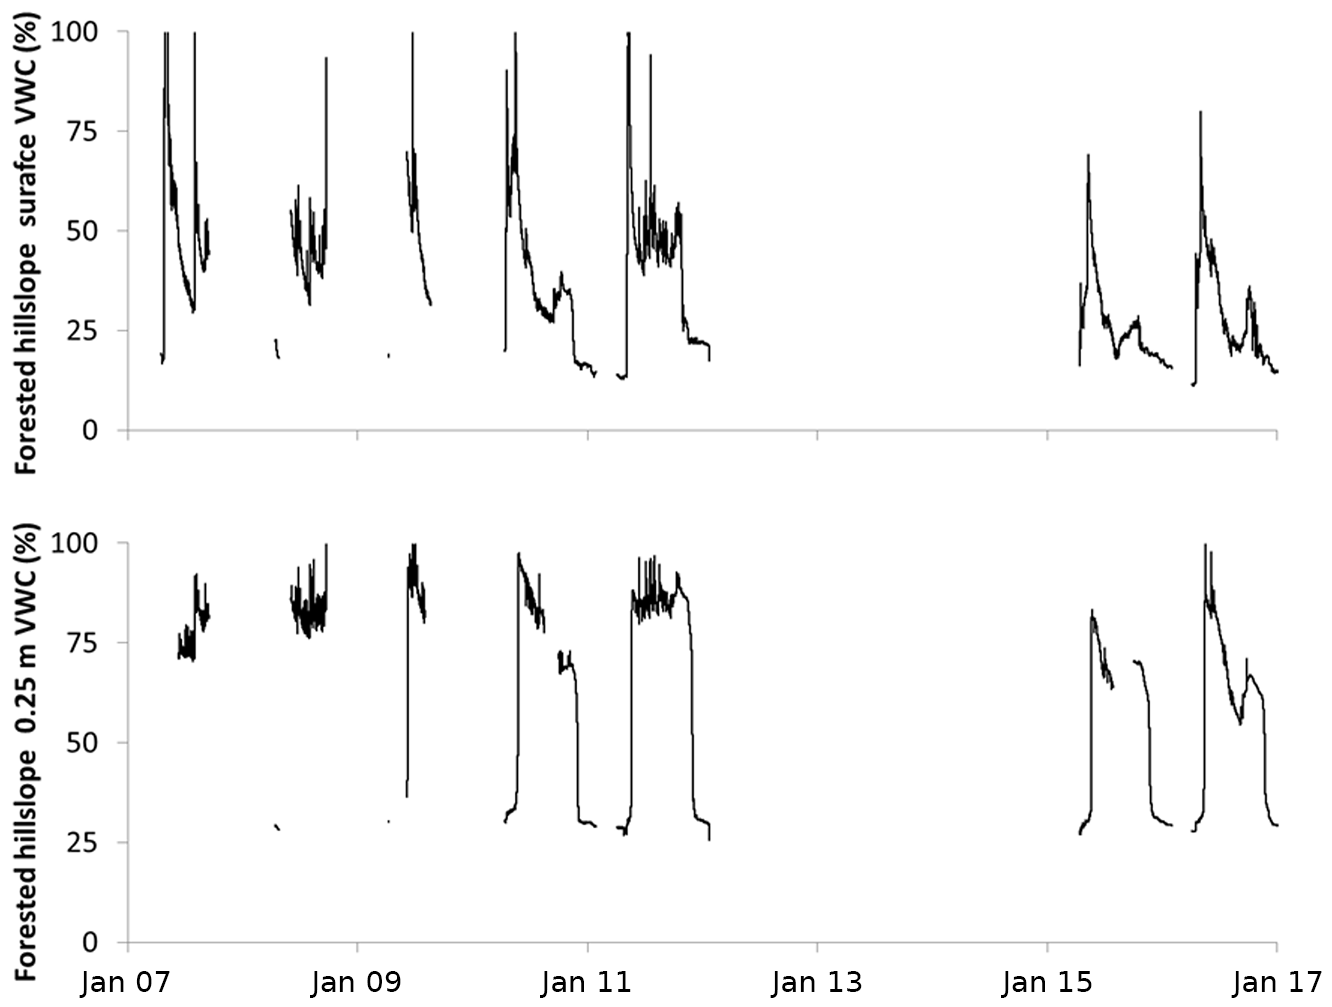
Figure 13Half-hourly soil surface and 0.25 m volumetric water content at the same forested hillslope soil moisture nest illustrated in Fig. 9.
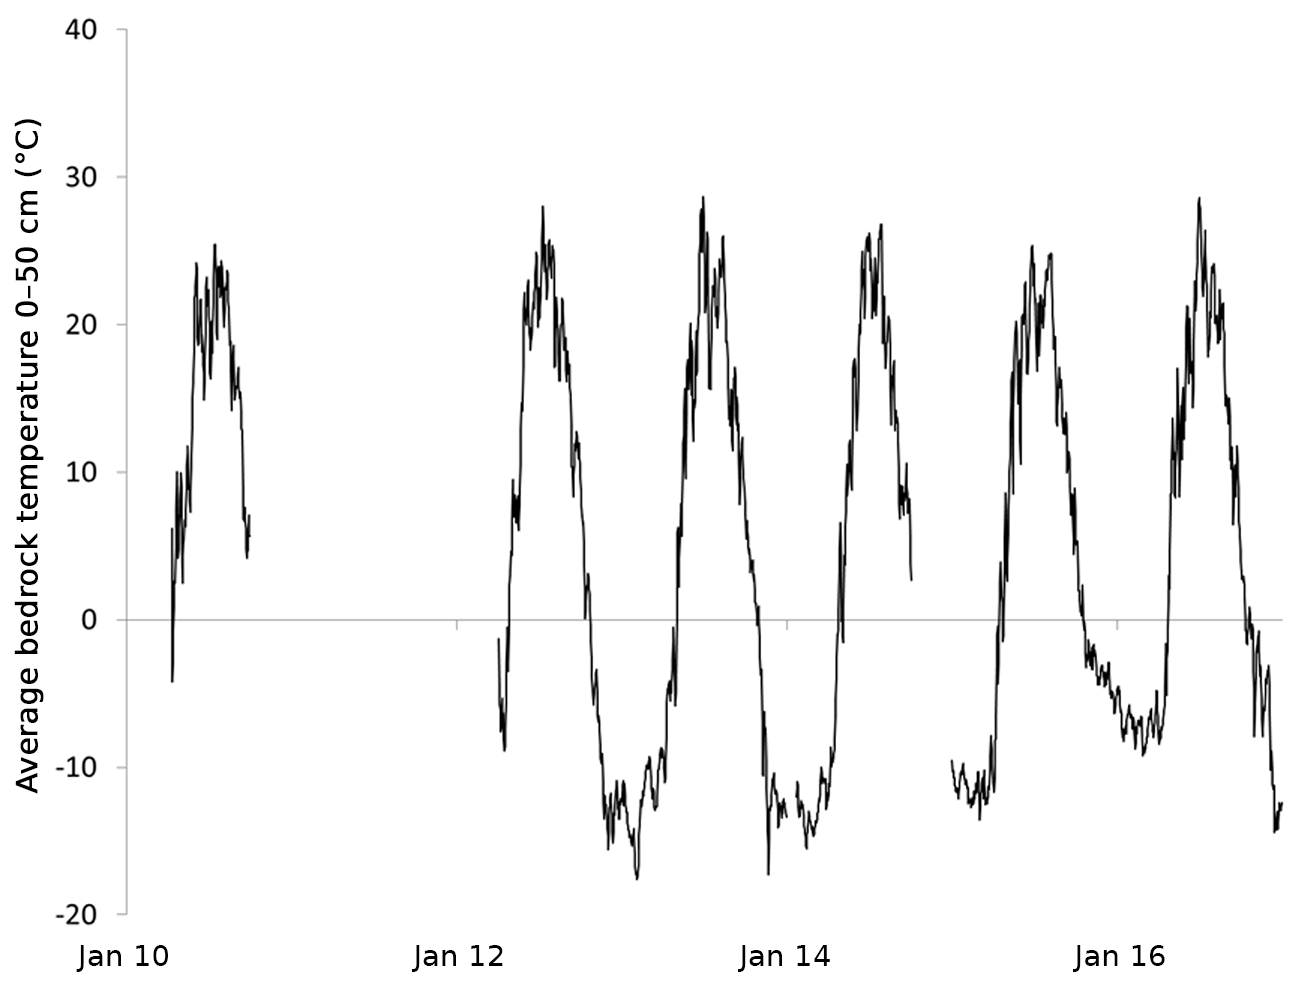
Figure 14Daily average 0–0.5 m bedrock temperatures near the exposed bedrock ridge climate tower in 2010–2016.
To calculate ground heat fluxes within the footprint of the bedrock ridge tower, a shallow 0.5 m borehole was drilled in 2007 and instrumented with HOBO pendant thermistors initially at the surface (20 cm, 30 cm, and 46 cm) and only from April to September each year. In 2010, the thermistors were changed to HOBO Pro v2 soil/water probes, and one at 10 cm was added. These sensors provide half-hourly data to an external logger that permits year-round measurements. The high thermal conductivity of the granite in this location results in much warmer ground temperatures than in areas of overburden. The temperature of the shallow bedrock often exceeds 25 ∘C in July, while unfrozen soil columns remain closer to 12 ∘C (Fig. 14). Conversely, in the middle of winter, these data imply that shallow depths in bedrock outcrops can be as cold as −17 ∘C, while soil columns do not get colder than −10 ∘C.
In partnership with Portage, Compute Canada, and the Canadian Association of Research Libraries, the University of Saskatchewan launched the Federated Research Data Repository (FRDR), which is a single online location from which research data can be shared, preserved, discovered, curated and cited. The data described here are available at: https://www.frdr.ca/repo/handle/doi:10.20383/101.026 (Spence and Hedstrom, 2018).
These data represent an effort to measure all components of the energy and water cycle in a catchment in the subarctic Canadian Shield landscape. The period of record for some components extends from 2003. The goal of making the data available to the research and applied hydrology communities is twofold. First, it is meant to support and inform water resource management decision-making. The record is an important source of baseline data that can be used to assess the effect of disturbance, such as fire or resource development. Second, these data are provided to allow others to also investigate hydrological processes, medium-term patterns and potential changes in this extensive landscape. Measurements have employed consistent methods to ensure comparability within the research catchment and perhaps eventually permit time series analysis. The data have proven fit for the purpose of supporting hydrological and hydrometeorological process research and this can ensure the proper interpretation of spatial and temporal patterns and causal attribution.
Both authors were involved in field work to collect the data discussed here, including processing, quality assurance and quality control. Both authors contributed to writing the manuscript.
The authors declare that they have no conflict of interest.
This article is part of the special issue “Water, ecosystem, cryosphere, and climate data from the interior of Western Canada and other cold regions”. It is not associated with a conference.
There have been several people over the years that have contributed to data
collection and deserve recognition. These include Shawne and Steve Kokelj,
Meg McCluskie, Stefan Goodman, Scott Dowler and Ryan Gregory from the
government of the Northwest Territories; May Guan, Ross Phillips, and Kirby
Ebel from the University of Saskatchewan; and Cuyler Onclin, Mark Russell
and Kerry Pippy from the Environment and Climate Change Canada Water Science and
Technology Directorate. The Yellowknife office of the Water Survey of Canada
has provided outstanding logistical support for the research catchment;
thank you to Jason Friesen, Bob Reid, Derek Forsbloom, Rick Klakowich and
Dale Ross. Chris Hopkinson and the Canadian Consortium for Lidar
Environmental Applications Research (C-CLEAR) collected the LiDAR
data.
Edited by: Chris DeBeer
Reviewed by: three anonymous referees
Blanken, P. D., Spence, C., Hedstrom, N., and Lenters, J. D.: Evaporation from Lake Superior: 1. Physical Controls and Processes, J. Great Lakes Res., 37, 707–716, 2011.
Carmack, E., Yamamoto-Kawai, M., Haine, T. W. N., Bacon, S., Bluhm, B. A., Lique, C., Melling, H., Polyakov, L. V., Staneo, F., Timmermans, M. L., and Williams, W. J.: Fresh water and its role in the Arctic Marine System: Sources, disposition, storage, export, and physical and biogeochemical consequences in the Arctic and global oceans, J. Geophys. Res.-Biogeo., 121, 675–171, https://doi.org/10.1002/2015JG003140, 2016.
Derksen, C., Strum, M., Liston, G. E., Holmgren, J., Huntington, H., Silis, A., and Solie, D.: Northwest Territories and Nunavut Snow Characteristics from a Subarctic Traverse: Implications for Passive Remote Sensing, J. Hydrometeorol., 10, 448–463, 2006.
Dingman, S. L.: Physical Hydrology, Waveland Press, Long Grove, 643 pp., 2015.
Guan, X. J., Spence, C., and Westbrook, C. J.: Shallow soil moisture – ground thaw interactions and controls – Part 2: Influences of water and energy fluxes, Hydrol. Earth Syst. Sci., 14, 1387-1400, https://doi.org/10.5194/hess-14-1387-2010, 2010a.
Guan, X. J., Westbrook, C. J., and Spence, C.: Shallow soil moisture – ground thaw interactions and controls – Part 1: Spatiotemporal patterns and correlations over a subarctic landscape, Hydrol. Earth Syst. Sci., 14, 1375–1386, https://doi.org/10.5194/hess-14-1375-2010, 2010b.
Horst, T. W.: A simple formula for attenuation of eddy fluxes measured with first order response scalar sensors, Bound.-Lay. Meteorol., 94, 517–520, 1997.
Kaimal, J. C. and Finnigan, J. J.: Atmospheric Boundary Layer Flows – Their Structure and Measurement, Oxford University Press, New York, 1994.
Laudon, H., Spence, C., Buttle, J., Carey, S. K., McDonnell, J. J., McNamara, J., Soulsby, C., and Tetzlaff, D.: Save Northern High-Latitude Catchments, Nat. Geosci., 10, 324–325, 2017.
Luthin, J. N.: Drainage Engineering, Wiley, New York, 1966.
Massman, W. J.: A simple method for estimating frequency response corrections for eddy covariance systems, Agr. Forest Meteorol., 104, 185–198, 2000.
Morse, P. D., Wolfe, S. A., Kokelj, S. V., and Gaanderse, A. J. R.: The occurrence and thermal disequilibrium state of permafrost in forest ecotopes of the Great Slave Region, Northwest Territories, Canada, Permafrost Periglac., 27, 145–162, 2016.
Oke, T. R.: Boundary Layer Climates, Routledge, New York, 435 pp., 1987.
Phillips, R. W., Spence, C., and Pomeroy, J. W.: Connectivity and Runoff Dynamics in Heterogeneous Basins, Hydrol. Process., 25, 3061–3075, 2011.
Pomeroy, J. W. and Gray, D. M.: Snowcover: Accumultaion, Relocation and Management, National Hydrology Research Institute Science Report #7, 144 pp., 1995.
Prowse, T. D. and Flegg, P. O.: The magnitude of river flow to the Arctic Ocean: dependence on contributing area, Hydrol. Process., 14, 3185–3188, 2000.
Rees, A., Derksen, C., English, M., Walker, A., and Duguay, C.: Uncertainty in snow mass retrievals from satellite passive microwave data in lake-rich high-latitude environments, Hydrol. Process., 20, 1019–1022, 2006.
Spence, C.: Hydrological processes and streamflow in a lake dominated water course, Hydrol. Process., 20, 3665–3681, 2006.
Spence, C. and Hedstrom, N.: Baker Creek Research Catchment Hydrometeorological and Hydrological Data, https://doi.org/10.20383/101.026, 2018.
Spence, C., Guan, X. J., Phillips, R. W., Hedstrom, N., Granger, R., and Reid, R.: Storage Dynamics and Streamflow in a Catchment with a Variable Contributing Area, Hydrol. Process., 24, 2209–2221, 2010.
Spence, C., Guan, X. J., and Phillips, R. W.: The Hydrological Functions of a Boreal Wetland, Wetlands, 31, 75–85, 2011.
Spence, C., Kokelj, S. A., Kokelj, S. V., and Hedstrom, N.: The Process of Winter Streamflow Generation in a Subarctic Precambrian Shield Catchment, Hydrol. Process., 28, 2179–2190, 2014.
Spence, C., Ali, G., Oswald, C. J., and Wellen, C.: An application of the T-TEL assessment method to evaluate connectivity in a lake-dominated watershed after drought, J. Am. Water Resour. As., in review, 2018.
Sturm, M., McFadden, J. P., Liston, G. E., Chapin, F. S., Racine, C. H., and Holmgren, J.: Snow-shrub interactions in arctic tundra: a hypothesis with climate implications, J. Climate, 14, 336–344, 2001.
Vihma, T., Screen, J., Tjernström, M., Newton, B., Zhang, X., Popova, V., Deser, C., Hollan, M., and Prowse, T. D.: The atmospheric role in the Arctic water cycle: A review on processes, past and future changes, and their impacts, J. Geophys. Res.-Biogeo., 121, 586–620, 2016.
Walker, X. J., Rogers, B. M., Baltzer, J. L., Cumming, S. G., Day, N. J., Goetz, S. J., Johnstone, J. F., Schuur, W. A. G., Turetsky, M. R., and Mack, M. C.: Cross-scale controls on carbon emissions from boreal forest megafires, Glob. Change Biol., 24, 4251–4265, https://doi.org/10.1111/gcb.14287, 2018.
Webb, E. K., Pearman, G. I., and Leuning, R.: Correction of flux measurements for density effects due to heat and water vapour transfer, Q. J. Roy. Meteor. Soc., 106, 85–100, 1980.
Woo, M. K.: Cold Region Atmospheric and Hydrologic Studies The Mackenzie GEWEX Study Experience, Volume 2: Hydrologic Processes, Springer, Berlin, 2008.