the Creative Commons Attribution 4.0 License.
the Creative Commons Attribution 4.0 License.
 | 09 Aug 2018
PRIMAP-crf: UNFCCC CRF data in IPCC 2006 categories
M. Louise Jeffery
Johannes Gütschow
Robert Gieseke
Ronja Gebel
All Annex I Parties to the United Nations Framework Convention on Climate Change (UNFCCC) are required to report domestic emissions on an annual basis in a “Common Reporting Format” (CRF). In 2015, the CRF data reporting was updated to follow the more recent 2006 guidelines from the IPCC and the structure of the reporting tables was modified accordingly. However, the hierarchical categorisation of data in the IPCC 2006 guidelines is not readily extracted from the reporting tables. In this paper, we present the PRIMAP-crf data as a re-constructed hierarchical dataset according to the IPCC 2006 guidelines. Furthermore, the data are organised in a series of tables containing all available countries and years for each individual gas and category reported. It is therefore readily usable for climate policy assessment, such as the quantification of emissions reduction targets.
In addition to single gases, the Kyoto basket of greenhouse gases (CO2, N2O, CH4, HFCs, PFCs, SF6, and NF3) is provided according to multiple global warming potentials. The dataset was produced using the PRIMAP emissions module. Key processing steps include extracting data from submitted CRF Excel spreadsheets, mapping CRF categories to IPCC 2006 categories, constructing missing categories from available data, and aggregating single gases to gas baskets. Finally, we describe key aspects of the data with relevance for climate policy: the contribution of NF3 to national totals, changes in data reported over subsequent years, and issues or difficulties encountered when processing currently available data. The processed data are available under an Open Data CC BY 4.0 license, and are available at https://doi.org/10.5880/pik.2018.001.
- Article
(1687 KB) - Full-text XML
-
Supplement
(113 KB) - BibTeX
- EndNote


Under the United Nations Framework Convention on Climate Change (UNFCCC), Annex I countries are required to report detailed GHG emissions inventories to the UNFCCC on an annual basis. All data are reported in the “Common Reporting Format” (CRF) Excel tables and accompanying National Inventory Reports (NIRs), which are made available on the UNFCCC website (UNFCCC, 2017c). Several parties (Croatia, Cyprus, the Czech Republic, Liechtenstein, Malta, Monaco, Slovakia, and Slovenia) were not originally listed in Annex I, but have subsequently been added through amendments to the convention. Most recently, Malta (United Nations, 2010) and Cyprus (United Nations, 2012a) requested to be included in Annex I after joining the European Union (EU) and adopting the EU-wide emissions reduction targets under the Doha amendments (United Nations, 2012b). In addition to those parties now listed in Annex I of the convention (UNFCCC, 1992), Kazakhstan is considered a member of Annex I for the purpose of the Kyoto Protocol (COP7 Decision FCCC/CP/2001/13/Add.4, section V.C.). Kazakhstan voluntarily elected to be considered as an Annex I Party for the Kyoto Protocol, and thereby has quantified emissions reduction targets and associated reporting obligations.
Prior to 2015, CRF data were reported following guidelines published by the IPCC in 1996 (IPCC, 1996b), which detail the methodologies that should be used to calculate the inventories. Since 2015, reporting has followed revised IPCC guidelines published in 2006 (IPCC, 2006). The methodologies to calculate emissions are primarily based on combining activity levels and emissions factors. For example, how many cows does a country have (activity), and what are the typical methane emissions per cow (emissions factor)? For each source, multiple methods of calculation are possible with increasing complexity from tier 1 to tier 3. In general, tier 1 methods use a basic calculation and default emissions factors, tier 2 incorporates country-specific emissions factors, and tier 3 may include advanced modelling approaches alongside country-specific emissions factors. Tier 3 approaches are generally considered more accurate but may require more information and are more difficult to calculate.
In addition to revisions in methodology and emissions factors, the IPCC 2006 guidelines (IPCC, 2006) and supplementary methods arising from the Kyoto Protocol (IPCC, 2013) updated the range of activities and gases covered, and the hierarchical categorisation of the data. Major changes included (1) combining categories 2 (Industrial Processes) and 3 (Solvent and Other Product Use) with the new category Industrial Processes and Product Use (IPPU) and (2) combining the Agriculture and Land-Use, Land-Use Change, and Forestry (LULUCF) categories into one Agriculture, Forestry, and Other Land-Use (AFOLU) category.
Although the more up-to-date methodological guidelines are now followed, the CRF reporting tables still closely resemble the structure of the previous version. For example, Agriculture and LULUCF emissions are still reported separately and top-level tables of fugitive emissions from fuels still reflect IPCC 1996 categories. The legacy effect is primarily a result of the negotiating process.
A consistent and complete hierarchical dataset according to the 2006 guidelines and categories allows (1) checks on data consistency to be made, and (2) comparison with other datasets. For these reasons, we have extracted and processed all reported CRF data and re-organised them into the IPCC 2006 categorisation (Fig. 1). Furthermore, we make the data available in an easily used, machine readable, comma-separated values (CSV) file with aggregate gas baskets according to multiple global warming potentials (GWPs). Each table contains data for all countries and years available, allowing for time series analysis and comparison between countries. The data described and presented in this paper are those published in 2017 and available for download by 15 December 2017. CRF data are published annually in April and, where possible, those new data will be published in the same format and following the methods presented here.
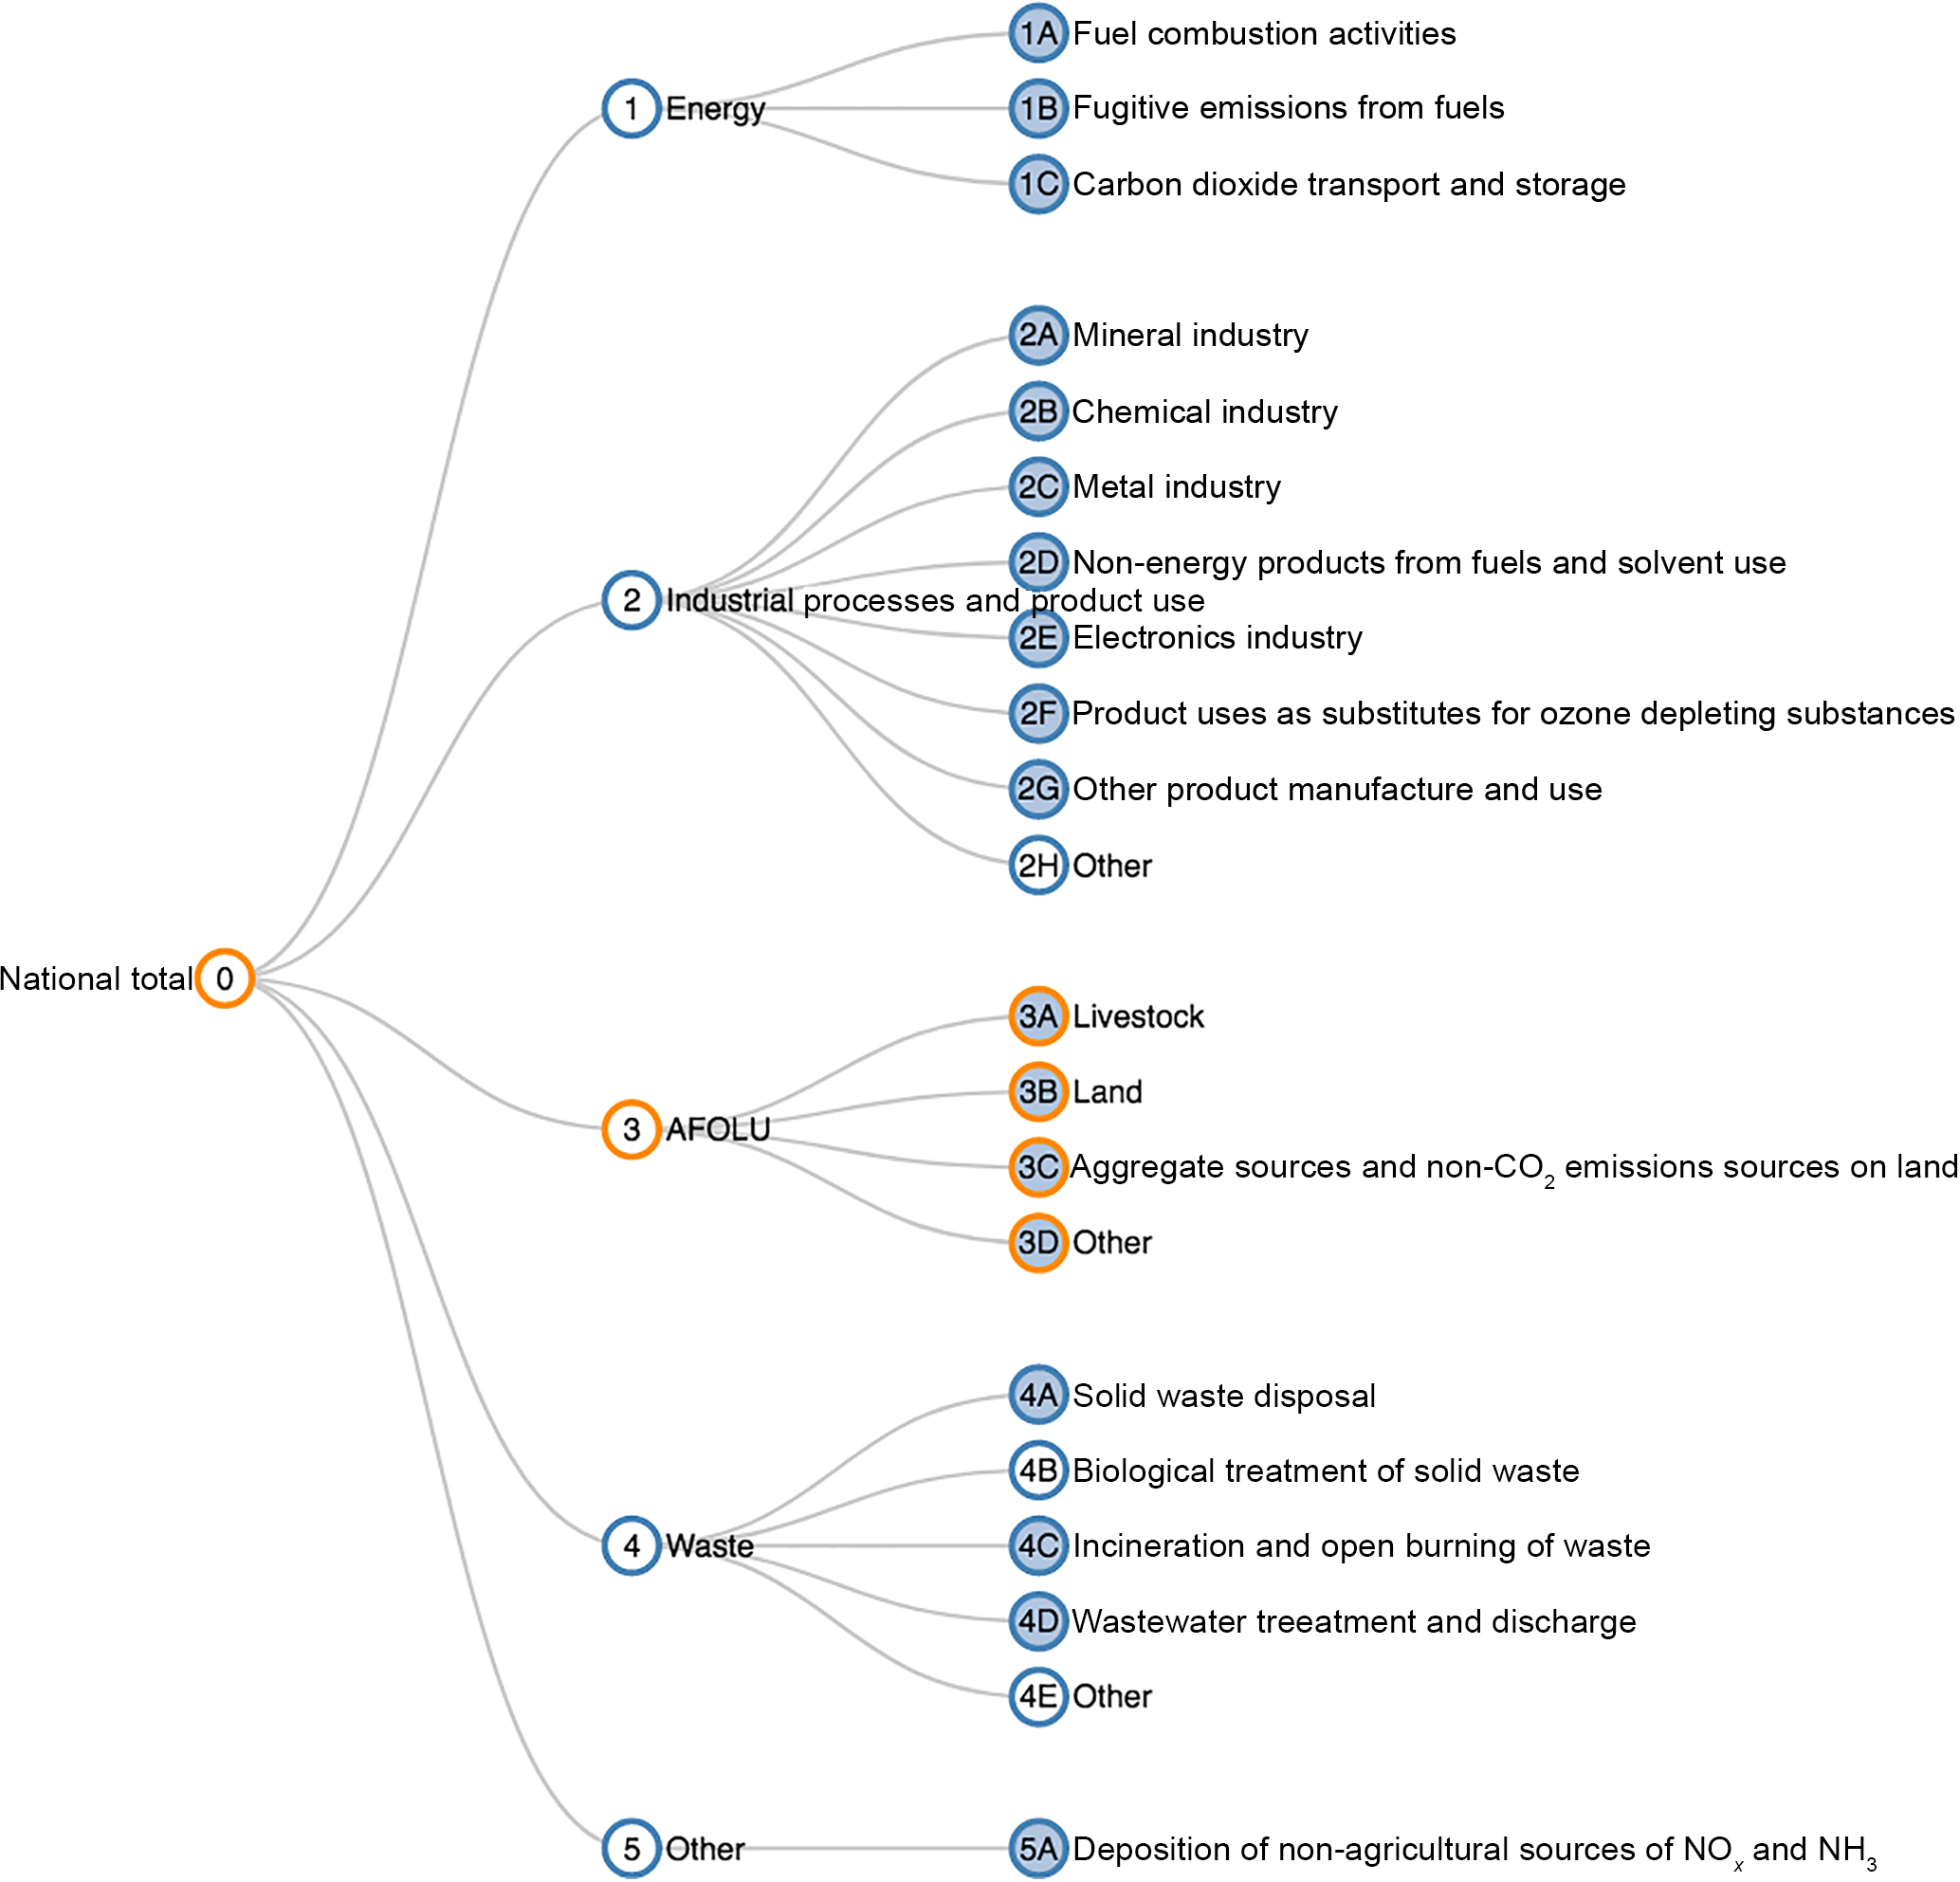
Figure 1Top three levels of the IPCC 2006 categorisation. Filled circles indicate that further sub-categories exist. Orange circles indicate that the category is generated by aggregation of sub-categories in PRIMAP-crf. A fully expandable and explorable version of this graphic is available at https://www.pik-potsdam.de/paris-reality-check/primap-crf/ (last access: 5 July 2018).
2.1 General approach
Annual CRF data for all reporting countries are available from the UNFCCC website (UNFCCC, 2017c). The CRF data for each country consist of one file for every inventory year, currently at least 26 per country (1990 to 2015 in data released in 2017), with some countries reporting additional years to include their Kyoto Protocol base years (1986–1989). Each file contains detailed data for separate categories and summary tables as required by UNFCCC decisions (UNFCCC, 2017a).
To prepare the PRIMAP-crf dataset, the necessary data are read, processed, and prepared using the PRIMAP emissions module (Nabel et al., 2011). The PRIMAP emissions module is a The Mathworks Inc. (2017) based tool with a custom database structure (“PRIMAPDB”) that can handle conversion of GHG emissions data with different units and GWPs. Each table in the database consists of a country–year matrix and is defined in terms of an entity (e.g. CO2), category (e.g. IPC1 Energy, where “IPC” indicates the categorisation system), class (e.g. TOTAL), type (e.g. NET), scenario (e.g. HISTORY), and source (e.g. CRF2017).
Data in the individual spreadsheets are first mapped to the PRIMAPDB table structure according to a specifications file. As the data are not reported directly against the IPCC 2006 categorisation, we define a set of categories that are specific to the CRF data and are later used to build the IPCC 2006 categories from sub-categories. Categories in the PRIMAP emissions module but outside the main IPCC 2006 categorisation are denoted as “M” categories in the emissions module and in this paper (e.g. M0EL is “national total excluding LULUCF”). Not all data available in the CRF tables are read in to the PRIMAP database. The level of detail is determined based on two criteria: (1) data that are useful for policy assessment, or (2) data that are required to build complete categories from the bottom up. Upon read-in to the PRIMAPDB, data from individual CRF tables are aggregated across countries and years to give tables for individual gases, categories, class, and type.
After raw data are read in, the full IPCC 2006 category hierarchy is constructed by addition of sub-categories. Any directly read data from higher sub-categories are not replaced at this stage; rather, the addition of sub-categories is used to fill in any gaps where data are not directly reported.
Next, “gas baskets” are generated by summing across gases to generate tables with all HFCs (hydrofluorocarbons), PFCs (perfluorocarbons), F-gases (HFCs, PFCs, SF6, and NF3), or Kyoto-GHG (CO2, N2O, CH4, HFCs, PFCs, SF6, and NF3). Each gas basket is created from individual gases according to four different sets of GWPs – Second Assessment Report (SAR), Fourth Assessment Report (AR4), Fifth Assessment Report (AR5), and AR5 with carbon-cycle feedbacks (AR5CCF) (IPCC, 1996a, 2007, 2014). Some gas species are included in later IPCC reports but not in earlier ones. Those gases for which a GWP estimate was not available at the time of publication of a particular report are assigned a GWP according to the next report in which a GWP estimate was given (see the Supplement for GWPs used in PRIMAP-crf).
Finally, the data are checked and verified for consistency and accuracy against the original data. First, we verify that the data are internally consistent in that each category in the hierarchy is equal to the sum of its sub-categories. This check is performed across all gases and countries individually, and both for categories that were generated in post-processing and those that were directly read in. For example, we verify that category 3, created as the sum of its sub-categories, is also equal to the sum of the directly read Agriculture (MAG) and LULUCF (MLULUCF) categories. If the discrepancy between different category levels exceeds 0.01 % for any country or year, those data are flagged and checked. Where possible, discrepancies are fixed and, where not, we note them in the results section below. Second, a manual check is performed against the raw tables and national inventory reports, particularly for the top-level categories (e.g. IPC0). Third, we compare top-level categories with data downloaded directly from the UNFCCC data portal (UNFCCC, 2017b). Fourth, data for main categories and gases are plotted against data from previous years to check for major changes. The source of any major differences between data in different years is verified to ensure that it is a real change in the raw data and not an error in the read-in process.
2.2 AFOLU
The most challenging part of the IPCC 2006 hierarchy to construct from CRF data is AFOLU category (3). This is because AFOLU data are still reported in two entirely separate sections (CRF Table 3. Agriculture and Table 4. LULUCF), but the IPCC 2006 categorisation integrates emissions from some Agriculture and LULUCF sources into the same categories.
Categories 3A and 3B are exclusively Agriculture and LULUCF respectively, but category 3C combines data from both sectors (Fig. 2). To construct the category 3C sub-categories, multiple PRIMAP “M” categories were created and data read in at their most detailed level to these categories. A full description of the mapping from CRF data to PRIMAP-crf categories can be found in the Supplement.
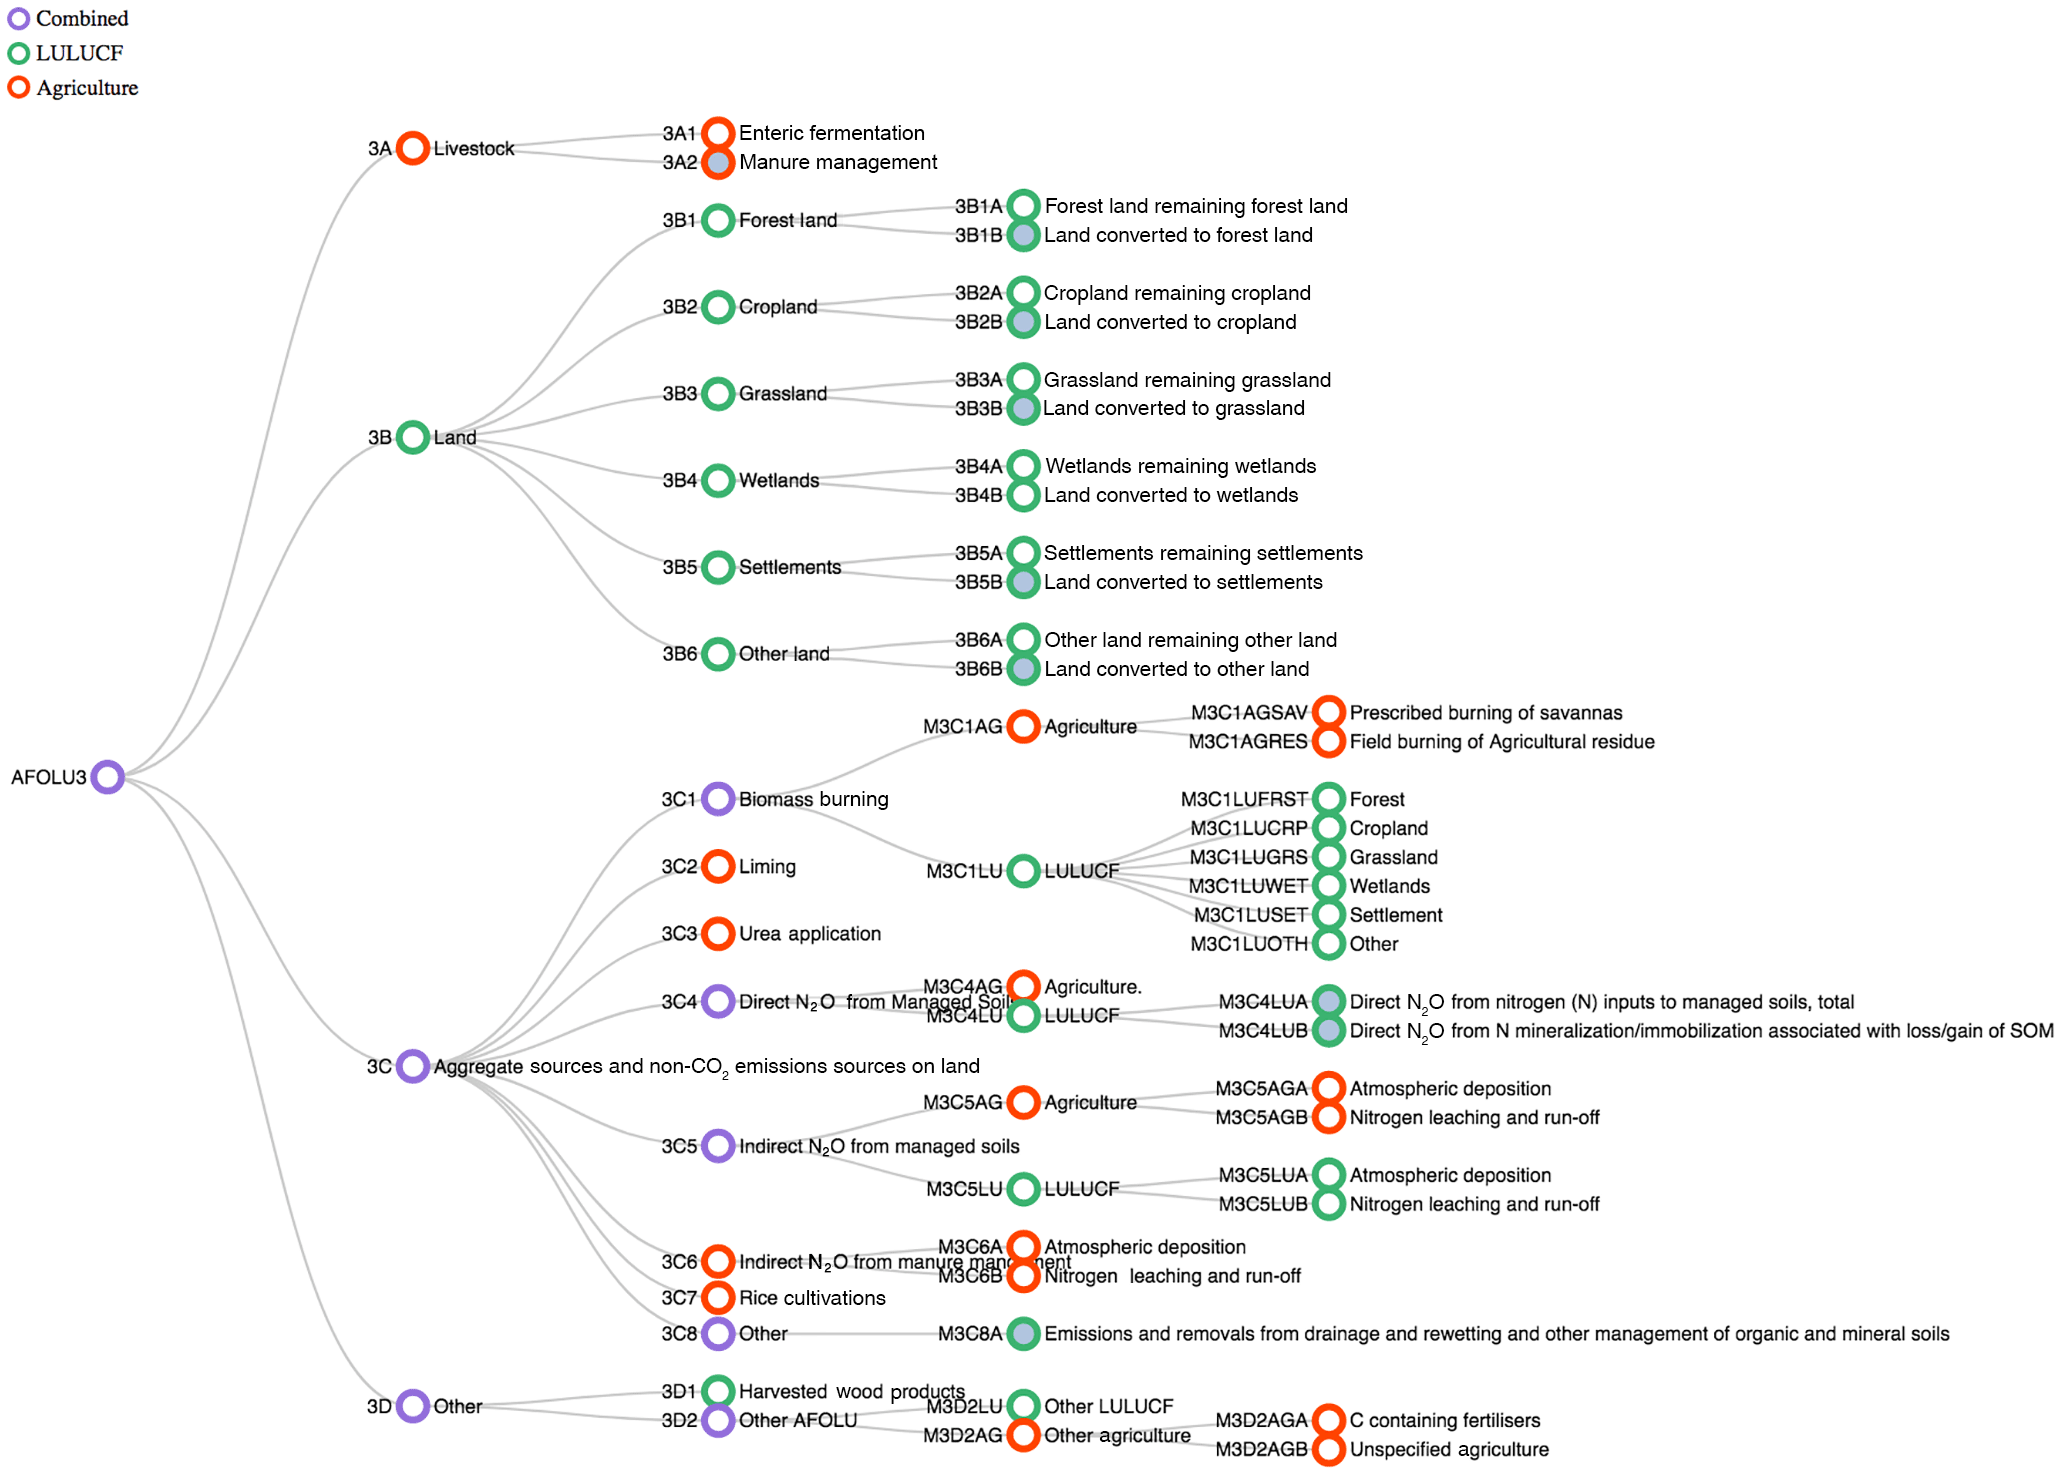
Figure 2AFOLU categorisation. Agriculture only (red) and LULUCF only (green) categories are aggregated to give combined categories (purple). Some of the data that are provided as Agriculture or LULUCF only do not map directly to an IPCC 2006 category. Additional PRIMAP “M” categories are therefore created for these data and integrated into the hierarchy. Filled circles indicate categories for which further sub-categories are available in the full dataset. An interactive version of this figure is available at https://www.pik-potsdam.de/paris-reality-check/primap-crf/ (last access: 5 July 2018).
2.3 Bunkers and multi-lateral operations
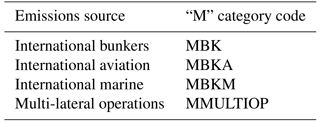
Emissions from international aviation and marine bunkers, and multi-lateral operations, are included in the IPCC 2006 categorisation and are reported to the UNFCCC. However, emissions from these sectors are not included in the national totals for reporting or accounting purposes under the UNFCCC and are therefore also excluded in the PRIMAP-crf hierarchy and national totals. Instead, data for these sectors are provided in separate “M” categories (Table 1). Only France, Slovenia, Sweden, and Ukraine currently report emissions from multi-lateral operations.
Table 1PRIMAP-crf category codes for emissions from international bunkers and multi-lateral operations. These codes are used in the data repository.
3.1 National totals
The PRIMAP-crf dataset is intended for multiple uses. Two key examples include (1) comparison of national total emissions between parties (Fig. 3) and (2) analysis of the share of emissions from each major category within the national total (Fig. 4). In Fig. 4 we also show the additional emissions from international bunkers and how these compare to national totals.
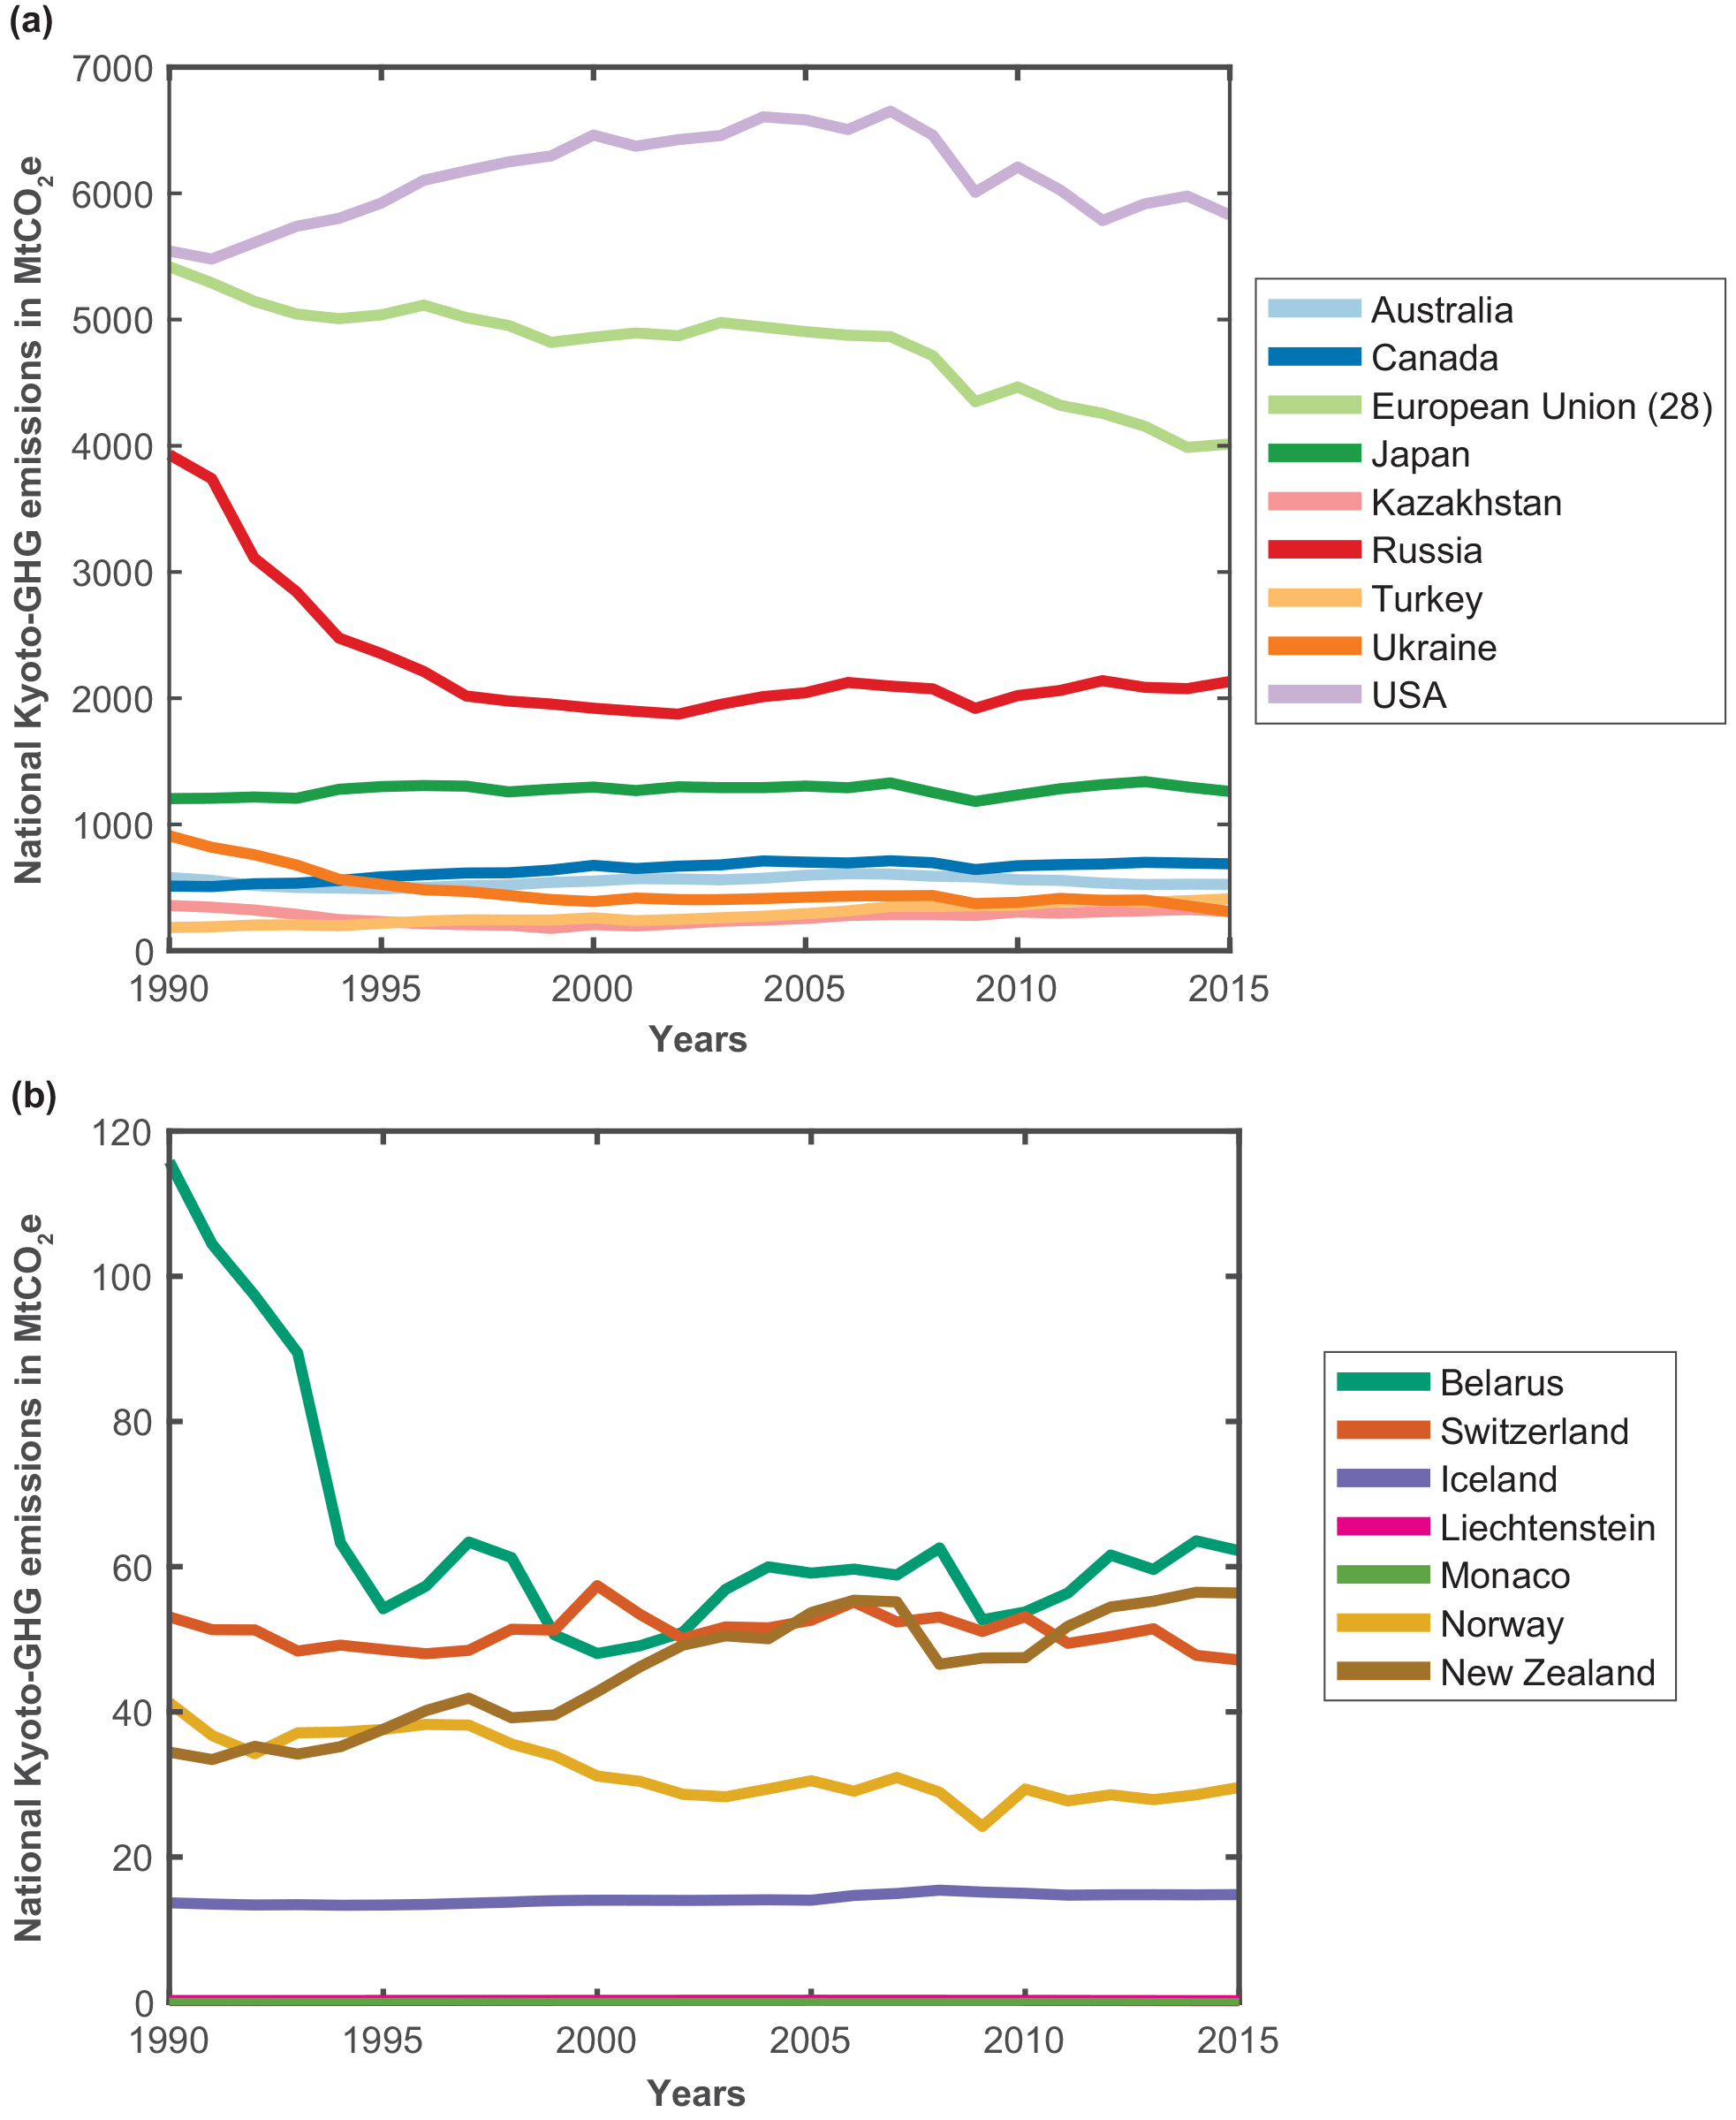
Figure 3Time series of national total emissions (including LULUCF) as reported in CRF tables for larger emitters (a) and smaller emitters (b).
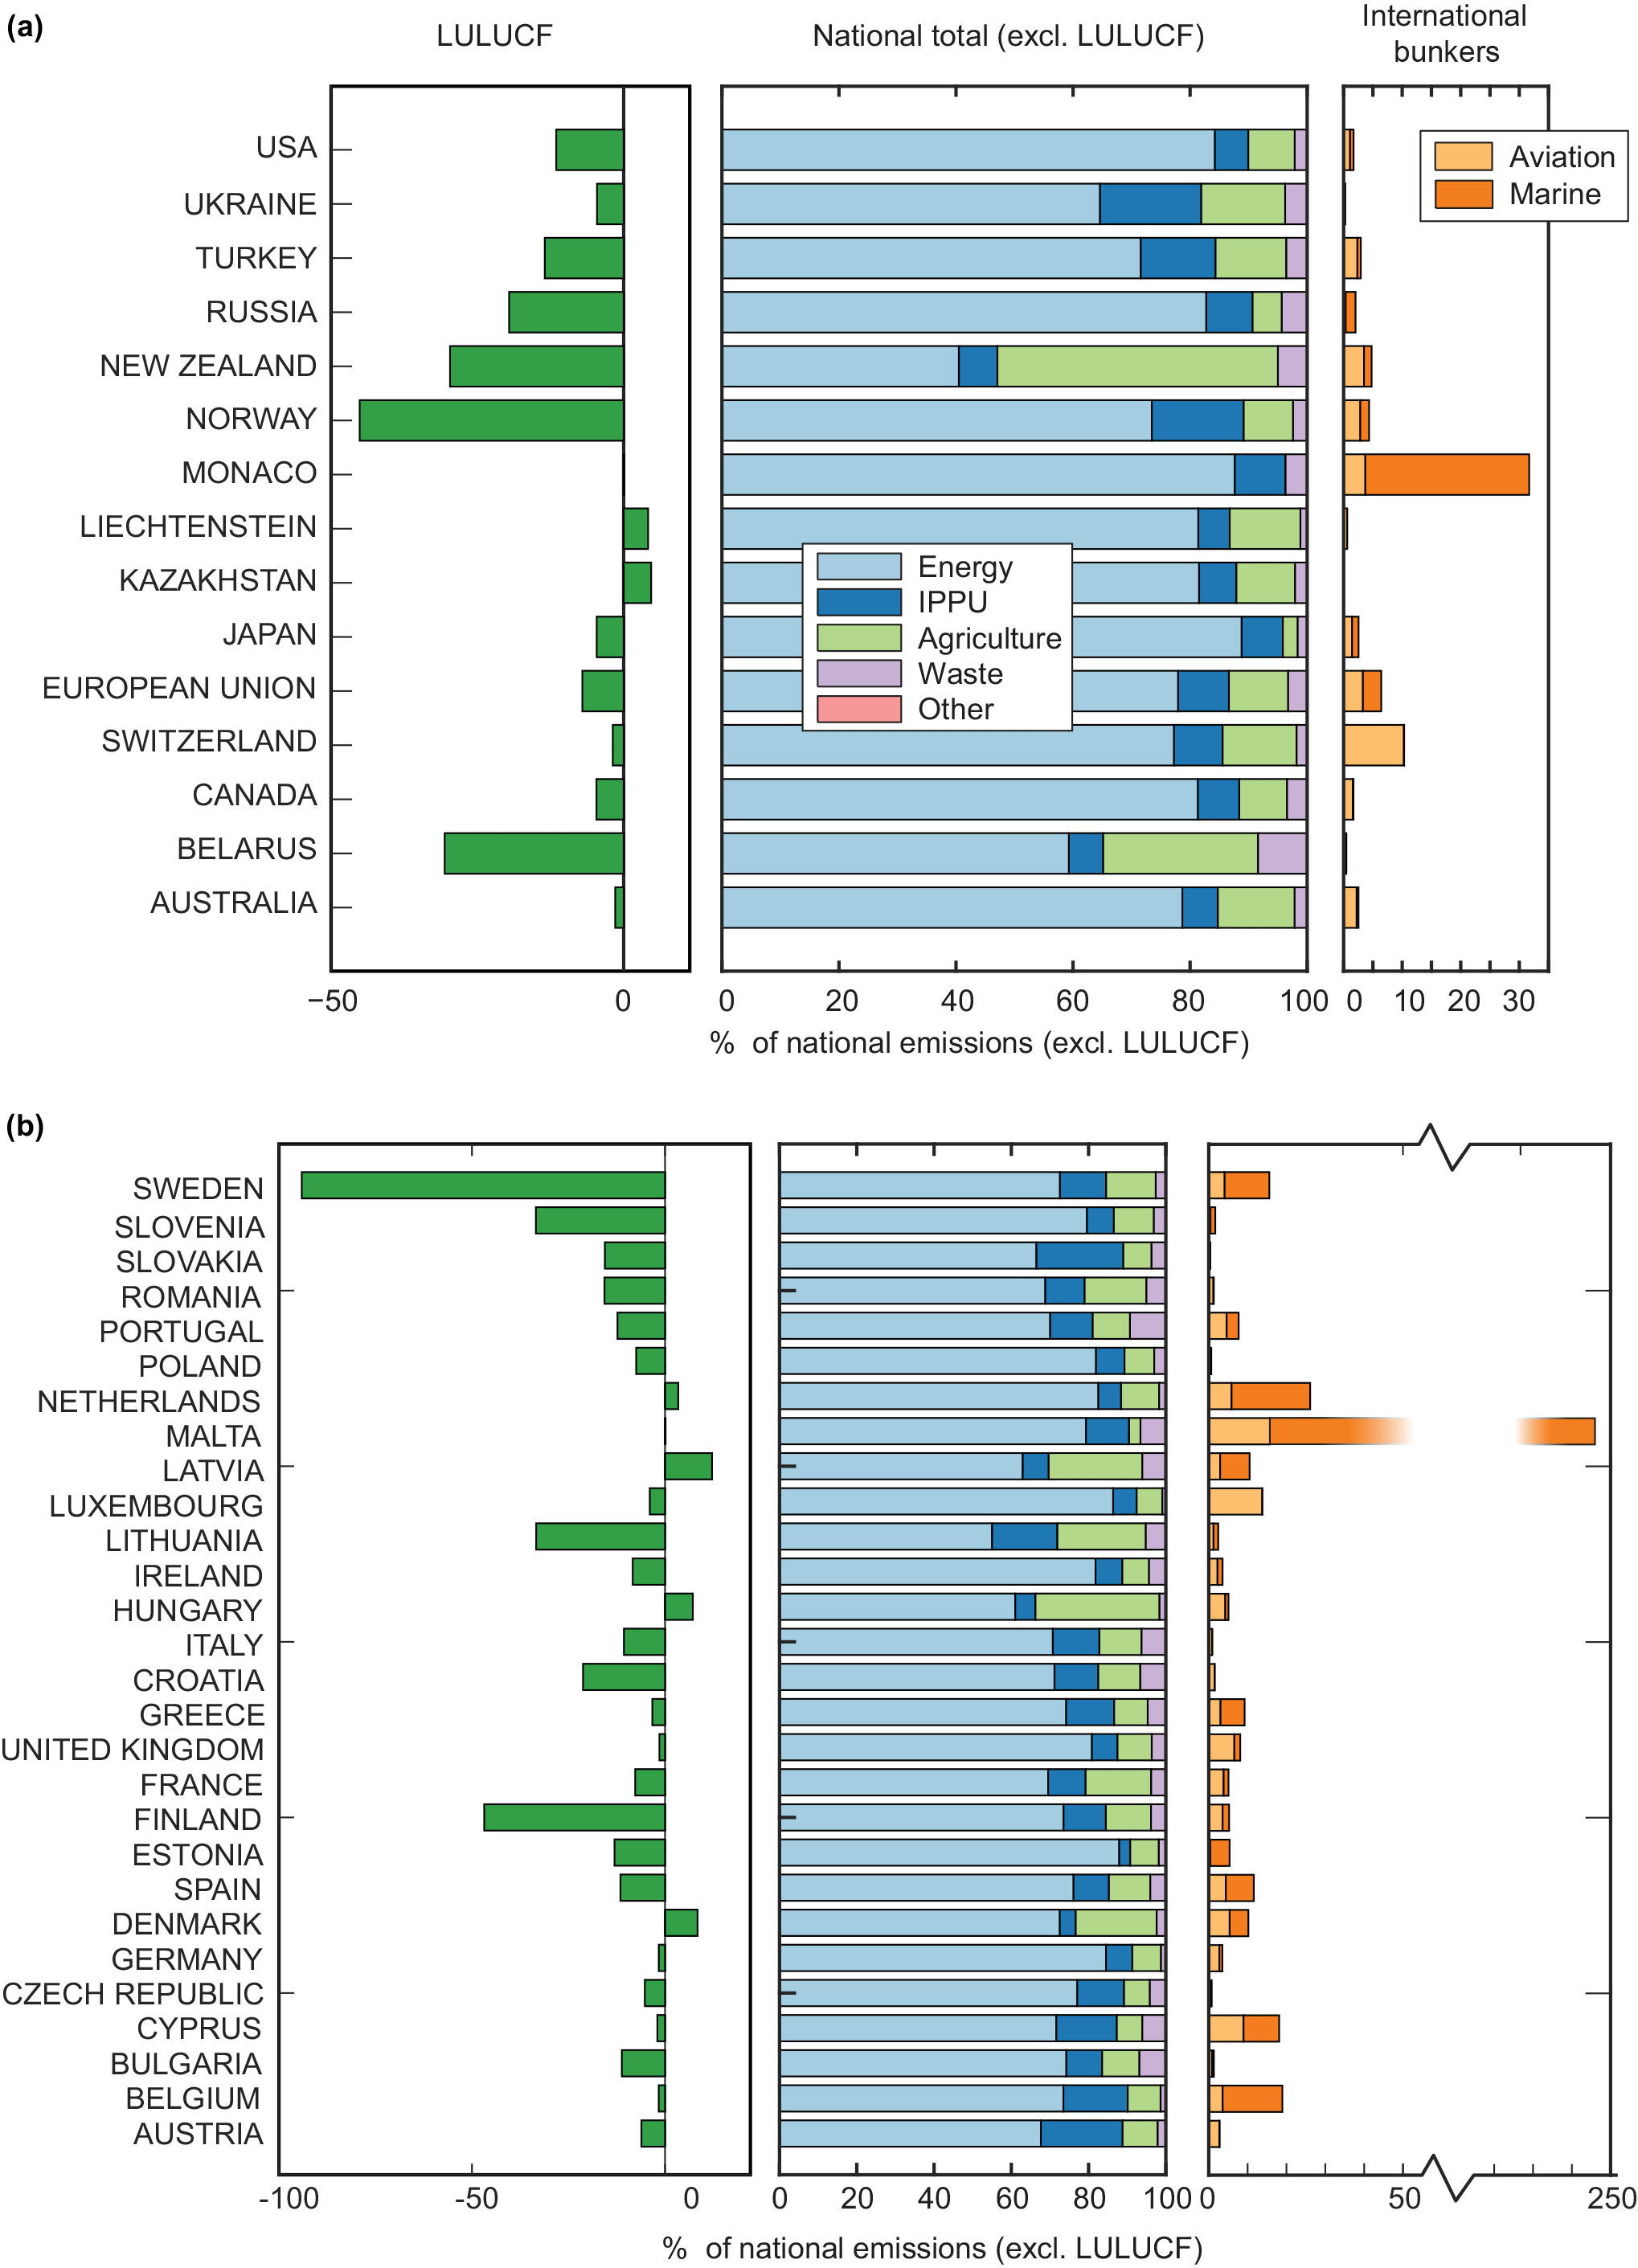
Figure 4Shares of sectors in the national total emissions, excluding LULUCF and international bunkers. For comparison, reported emissions from LULUCF are shown as a % of national total (green, LHS) and reported emissions for international bunkers (orange, RHS). (a) Annex I countries and Kazakhstan, with the European Union presented as a group. (b) Same as (a) but for individual EU countries. Note the break in scale for international bunker emissions from Malta.
3.2 Changes in reported data through time
Annual updates to the data reported by countries in their national inventories do not only extend the time series, but also include updates to previous data years according to revisions in source data, updates in methodologies, and updates in reporting guidelines. The extent to which the reported data change varies by sector; energy emissions have a low uncertainty compared to LULUCF emissions and accordingly do not undergo such significant annual modifications.
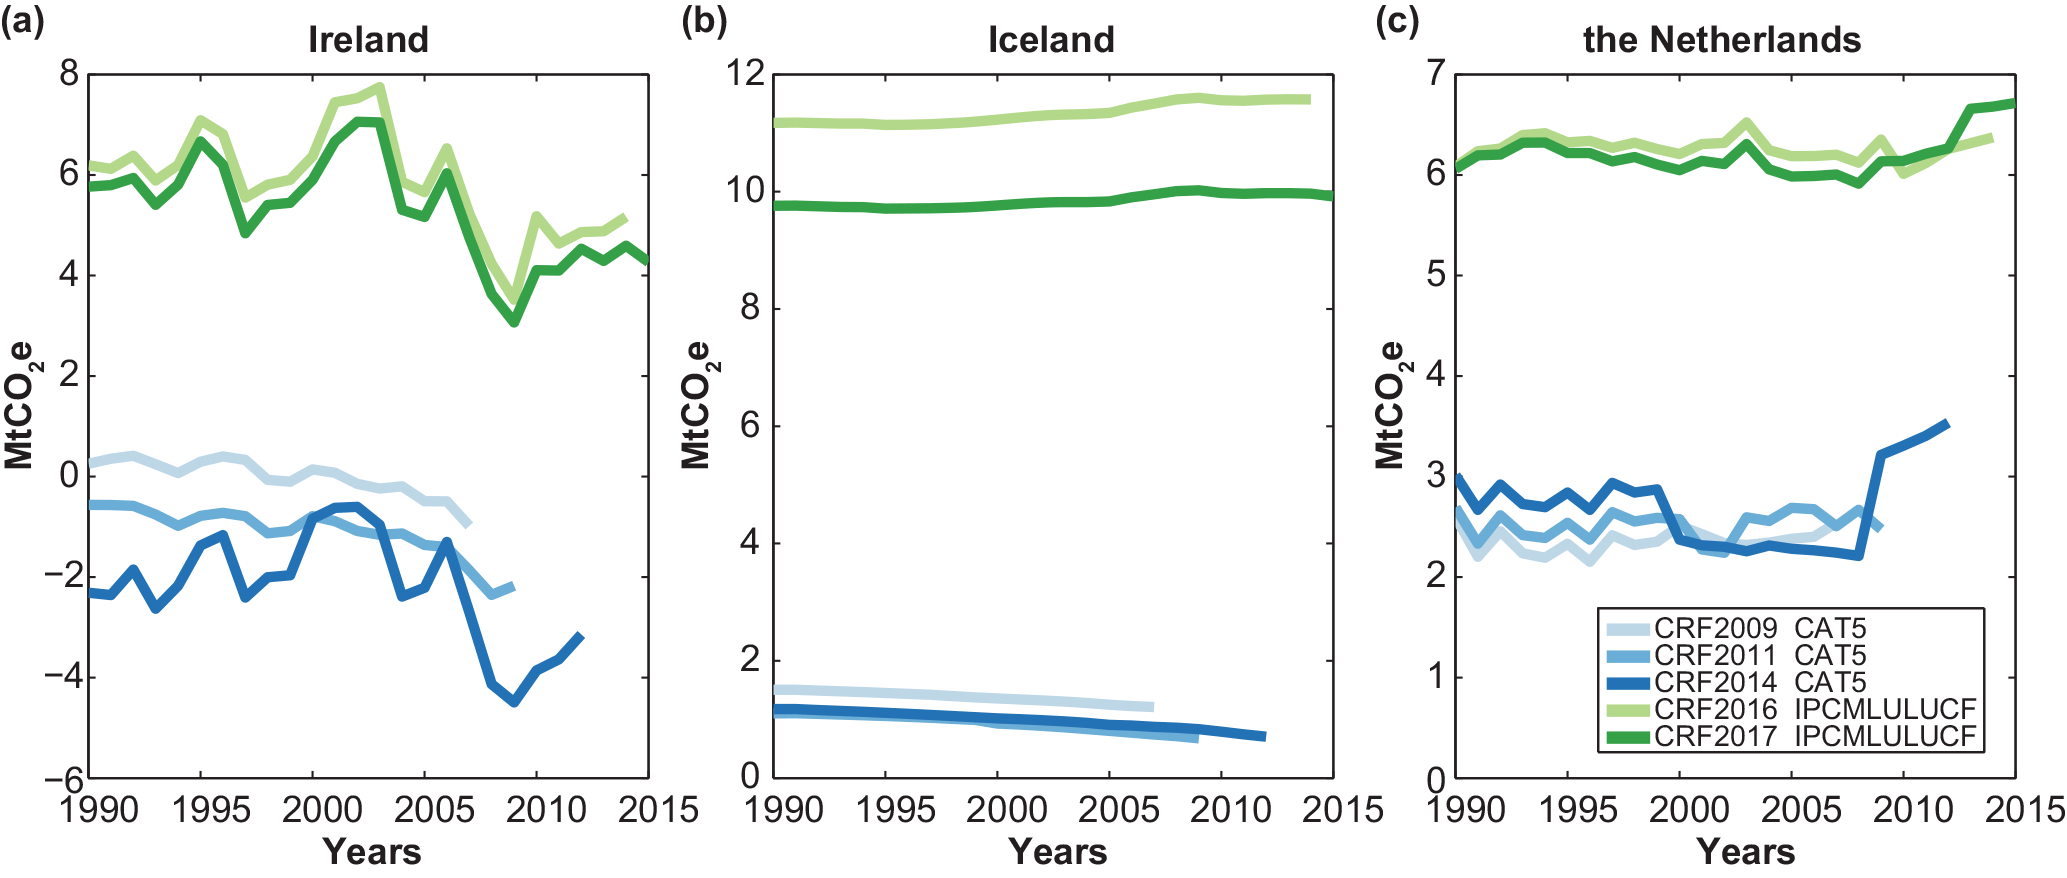
Figure 5Impact of new reporting guidelines (used from 2015 onwards) on reported Kyoto-GHG emissions in the LULUCF sector from (a) Ireland, (b) Iceland, and (c) the Netherlands. Due to historic reporting conventions, Kyoto-GHG emissions in this figure are calculated using GWPs from the IPCC SAR (IPCC, 1996a).
We do not identify the reason for all updates to historic time series, but isolate significant changes related to the transition to new reporting guidelines. We find that the 1990 to 2015 reported national total emissions (excluding LULUCF) for Monaco, Croatia, Hungary, and Cyprus all dropped significantly (>5 % on average over 1990–2012) between the 2014 and 2017 releases, and that Russia and Malta's reported emissions increased by >5 % on average over 1990–2012. Average reported total emissions (excluding LULUCF) for Australia, Bulgaria, France, Lithuania, Portugal, and Kazakhstan all changed by 3–5 % over the same period between the 2014 and 2017 versions.
In the LULUCF sector, we identify three countries for which the new guidelines introduced substantially different overall emissions levels – Iceland, Ireland, and the Netherlands (Fig. 5). Updates to emissions factors for drained organic soils and methods for accounting for emissions associated with peat extraction result in much higher reported LULUCF emissions from Iceland and Ireland. LULUCF emissions from the Netherlands are also significantly higher, but the increases are distributed across several land-use categories and are not so readily attributable to a single source. The new guidelines also introduced significant changes to the LULUCF time series from many other countries.
3.3 Data issues
The current format of the CRF data allows for some flexibility in reporting for countries. As a result, it was not possible to obtain data for all categories for all reporting countries. In addition, the detailed checks revealed some issues in the raw data where data reported in one table were not consistent with data reported in another table. Here we briefly describe those issues and how they impact the final dataset. We first describe structural issues with the data tables and then some country-specific inconsistencies in the reported data. For three of the country-specific inconsistencies, we provide additional data in the supporting information.
Reported country data undergo mandatory review under the UNFCCC by an Expert Review Team according to the Guidelines for review under Article 8 of the Kyoto Protocol (most recently updated in Decision 13/CP.20). Expert review reports are made available on the UNFCCC website (UNFCCC, 2016). Many of the country-specific issues identified here may be picked up in the UNFCCC Expert Review process and corrected in future updates of the CRF data. If so, future updates of PRIMAP-crf will also incorporate these corrections.
3.3.1 Table construction
Fugitive emissions from solid fuels
Some sub-categories of emissions from category 1B1A “Coal mining and handling” are not explicitly and separately reported in the current CRF tables and therefore could not be included as separate categories in PRIMAP-crf. These sub-categories are 1B1B “Uncontrolled Combustion, and Burning Coal Dumps” and 1B1A14 “Flaring of drained CH4 or Conversion of CH4 to CO2”.
Category 1B1A is reported in Table 1.B.1 of the CRF tables, which includes lines for “1.B.1.b. Solid fuel transformation” and “1.B.1.c. Other (please specify)”. Additional information indicates that fugitive emissions from coke and charcoal production may be included in the 1.B.1.b line, and that the “Other” category may be used for “reporting any other solid fuel related activities resulting in fugitive emissions, such as emissions from waste piles”. If emissions from either IPCC 2006 category 1B1B or 1B1A14 are calculated and reported in either of these lines, then they are included in the national totals (category 0) but cannot be reported explicitly as separate categories in the PRIMAP-crf data.
A further issue with the CRF tables for category 1B1 is that two countries (Australia and United Kingdom) report N2O emissions from category 1B1 in the summary tables (e.g. Tables 1s2 and 10s4), but it is not possible to include the details on N2O emissions from this category in Table 1.B.1, which only has columns for CO2 and CH4. Because the CRF data for category 1B1 are read from Table 1.B.1 and not the summary tables, a discrepancy occurs when comparing the category 1B total for N2O with sub-categories 1B1, 1B2, and 1B3 for Australia and the United Kingdom. The sub-totals are up to 0.2 % too low for the United Kingdom, and 0.9 % too low for Australia due to the missing category 1B1 data.
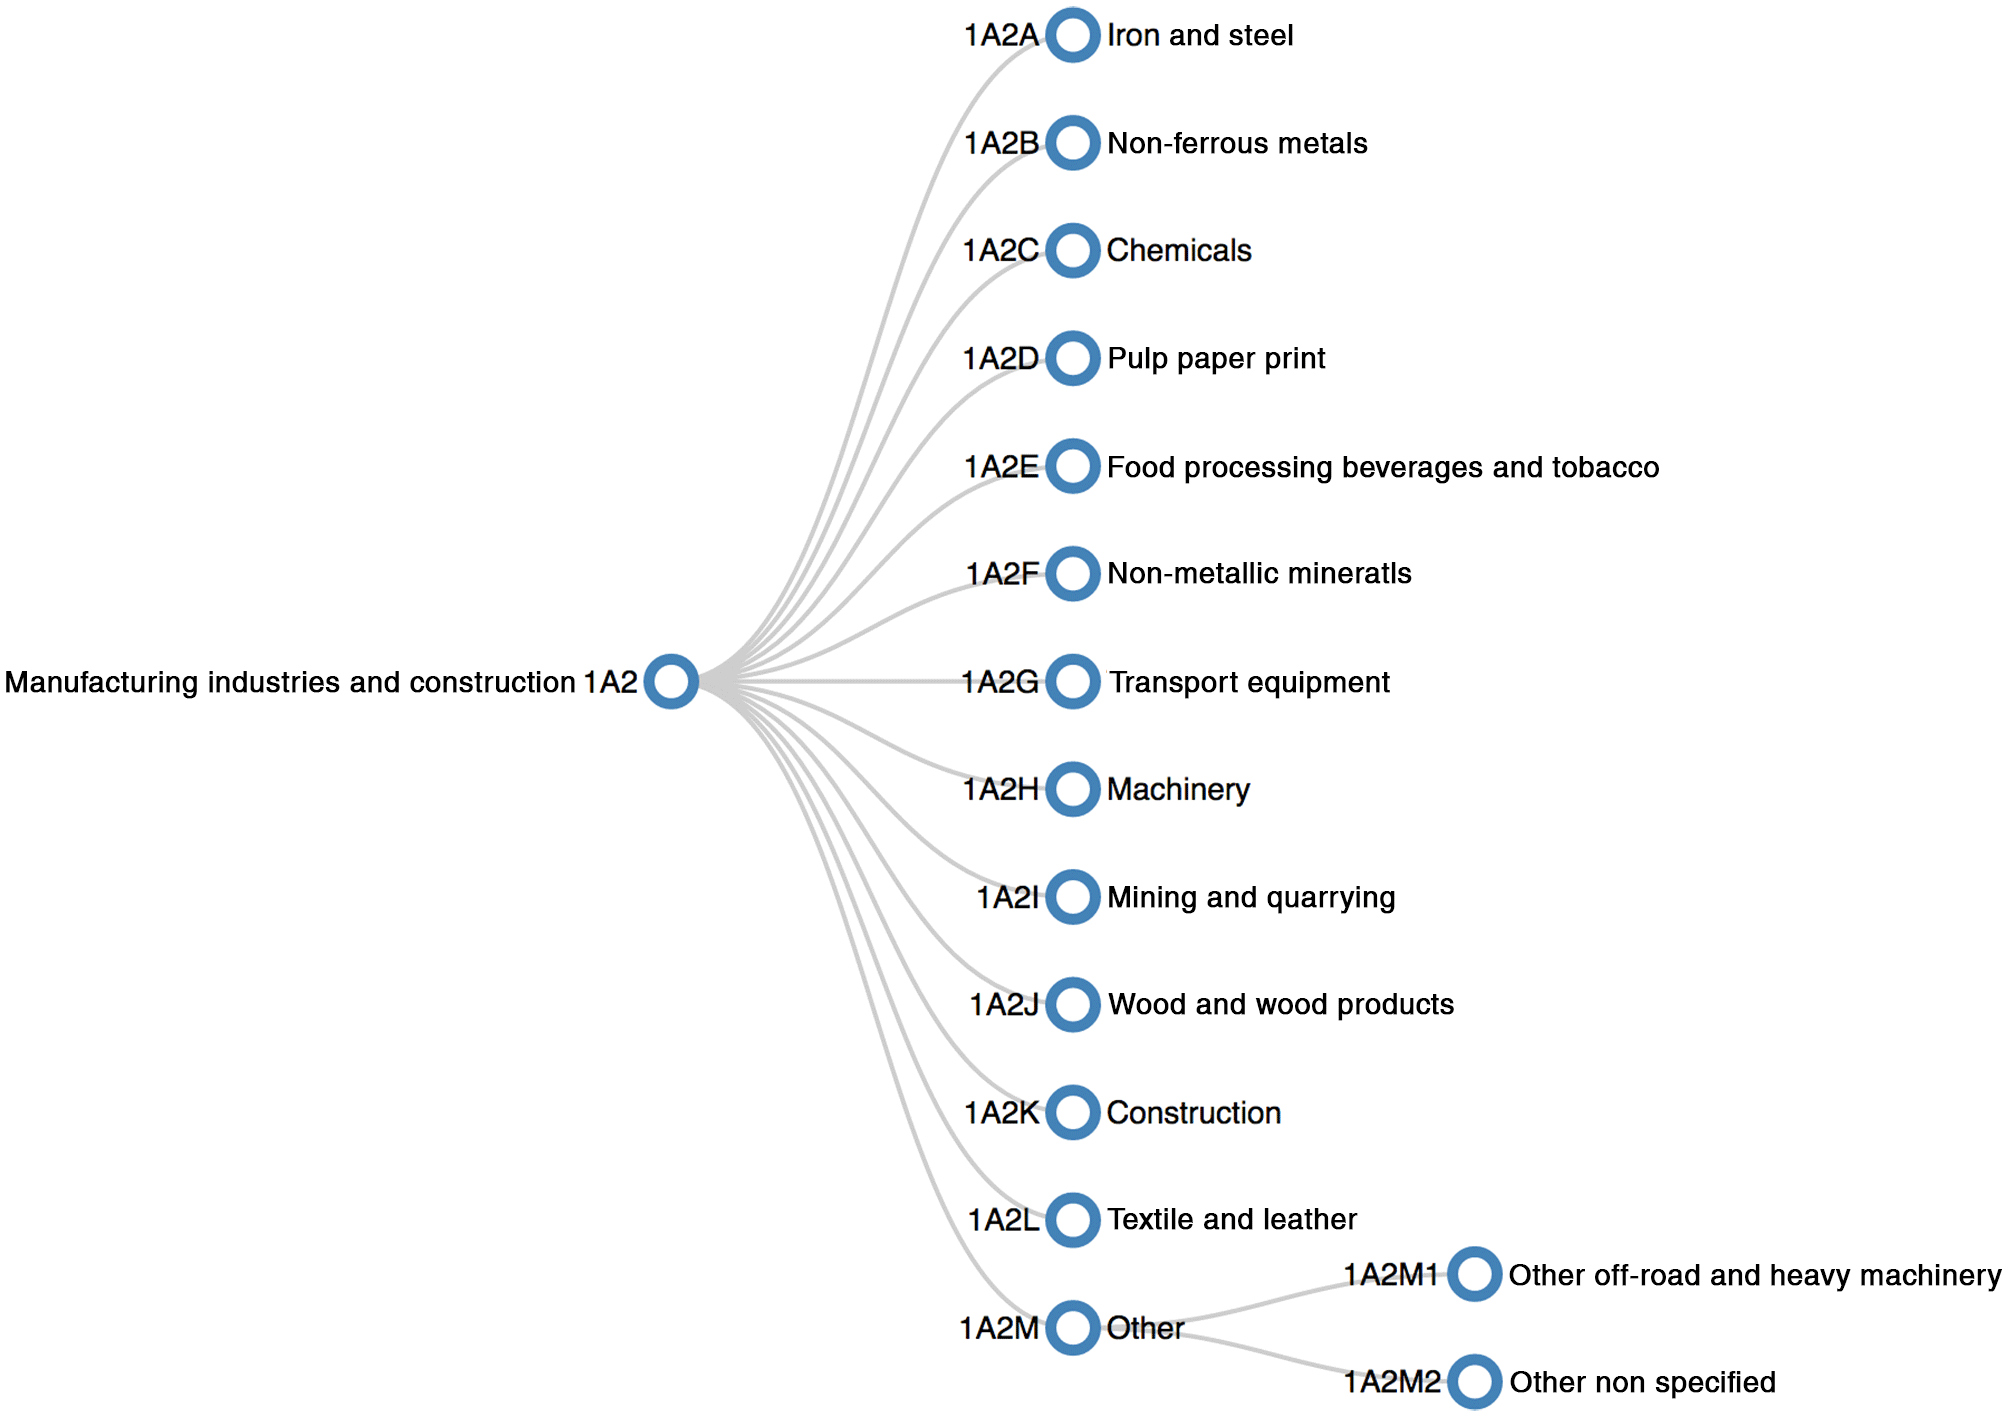
Figure 6Full category 1A2 sub-categories. For some countries, only sub-categories 1A2A to 1A2F are reported as sub-categories and categories 1A2G to 1A2M are reported together as “other”. PRIMAP-crf contains the detailed categories where available.
IPC1A2 sub-categories for N2O, CH4, and CO2
It is not mandatory to report all sub-categories of category 1A2 (fuel combustion for manufacturing industries and construction) explicitly in CRF tables. Sub-categories of 1A2 are reported in CRF Table 1.A(a)s2 with explicit lines for 1A2A through 1A2F (Fig. 6) and optional reporting under “Other” for categories 1A2G through 1A2M. Bulgaria, Germany, Estonia, France, Ireland, Italy, and Japan do not fully report these additional sub-categories and the sum of their 1A2 sub-categories in PRIMAP-crf is therefore not equal to the category 1A2 total. However, for category 1A2 and higher levels in the hierarchy, the data are complete and correct.
3.3.2 Country-specific
Some data issues are not structural issues with the CRF table set-up, but result from the way in which individual countries report the data. Here we describe inconsistencies found for individual countries during the read-in and testing process.
Germany
Germany does not report CH4 emissions from drainage and rewetting of soils on settlement land in Table 4(II) or in Table 4. The data are listed as “IE” (Included Elsewhere), but it is not apparent where. The documentation notes suggest that they are included in table or category 4E. However, CRF Table 4.E is for CO2 only, so it cannot be reported there. As a result, the PRIMAP-crf tests that compare category 3 and category 3 sub-categories with the directly read-in LULUCF data fail for Germany.
Germany also failed tests that check whether the national totals of HFCs, PFCs, and F-gases are equal to the sum of the main sub-categories, in this case just category 2. The tests only fail for the final year (2015) and for AR4 GWPs. This indicates a discrepancy in the original data. Inspection of Table 10s5 shows that the value reported for 2015 for the HFC and PFC baskets is approximately 1000 times higher than that reported in 2014, suggesting a unit error in reporting. We expect this error to be corrected in future submissions. The spurious data points are corrected in post-processing and are not present in the PRIMAP-crf source.
Kazakhstan
In the raw Excel file (dated 17 November 2017) for 1993, the CO2 emissions factor for gas/diesel oil for domestic navigation is too high by a factor of 106, resulting in emissions for category 1A3D2 that are too high by the same magnitude for that year. In the PRIMAP-crf dataset we manually replace this data point and use the corrected data to recalculate the higher-level categories. The emissions factor was corrected from 74.1×10⁶ to 74.1 (t TJ−1), resulting in 40.502 kt CO2 for category 1A3D2 from Kazakhstan in 1993, which fits with the full time series. This correction is applied to all affected higher-level categories and gas baskets in the final PRIMAP-crf dataset.
Lithuania
N2O emissions in category 3 (AFOLU) for Lithuania do not equal the sum of reported emissions under Agriculture and LULUCF. This discrepancy occurs because total category 3 emissions are calculated from the sum of sub-categories (Fig. 2) and N2O data are not completely reported in LULUCF sub-categories for Lithuania. The issue occurs with sub-category 3C4 (Other Land), which is partially reported in CRF Table 4(III) and read in under PRIMAP category M3C4LUBOTH. However, the total N2O LULUCF emissions from Other Land reported in summary Table 4 are higher than those reported in Table 4(III). Table 4 is also not internally consistent and it is not clear from the CRF tables what the source of the additional emissions is.
As a result, the PRIMAP-crf data fail tests for N2O that compare category 3 with LULUCF. The LULUCF and national total (category 0) values are correct. The error propagates to the Kyoto-GHG basket, which includes N2O.
Luxembourg
N2O emissions data for category 3 (AFOLU) are also incorrect for Luxembourg for similar reasons to Lithuania. Data are reported under “Other Land” in CRF Table 4 that is not reported in any other table, including Table 4(III) where it would be expected. As the data are not read in to a sub-category, the resulting aggregated category 3 is not consistent with the directly read-in LULUCF category. As with Lithuania, category 3 is incorrect, but the LULUCF and national total categories are correct. The error propagates to the Kyoto-GHG basket for category 3, which includes N2O.
Norway
Norway fails a test for N2O emissions that compares the directly read-in LULUCF total to the sum of its components. The error averaged over all years is 0.017 %. The source of the discrepancy is unclear, but CRF Table 4 is internally inconsistent, suggesting some missing data in sub-categories. Because the error is small, tests on higher-level categories and aggregate gas baskets are all passed.
Sweden
For the year 2015, Sweden reports fugitive emissions from oil production in Table 1.B.2, item 1.B.2.a.Oil. However, for CH4 and CO2, no data are reported in the subsectors. For N2O, no data are reported at all in Table 1.B.2, but data are reported in Table 1s2, item “2. Oil and natural gas and other emissions from energy production”.
A further problem in Sweden's CRF reporting is an inconsistency between tables. In Table 1.s.2, item “c. Other (as specified in Table 1.B.1)” N2O emissions are reported. However, Table 1.B.1 does not allow reporting of N2O emissions and thus the sum obtained from Tables 1.B.1 and 1.B.2 does not coincide with the data read from Table 1.s.2.
In category 2 (Industrial processes and product use), 0.36 kt of methane emissions are reported for 2015, while the data available for subsectors only sum to 0.01 kt. There are discrepancies in subcategories: category 2B10 (chemical industry – other) has no data reported for CH4 in Tables 2(I)s1 and 2(I).A-Hs1, but a subcategory (other inorganic chemical products) contains data. But probably most important is that nothing is reported in Table 2(I).A-Hs1, item “2.H.1 Pulp and paper”, where the majority of CH4 emissions for category 2 were reported for 2014.
Consequently, CRF data for Sweden fail tests that compare category 1.B to its subcategories for CO2, CH4, N2O, and the Kyoto-GHG basket, as well as tests that compare category 2 to its subcategories for CH4. The errors propagate to the Kyoto-GHG basket.
3.4 NF3
For the second period of the Kyoto Protocol (2013–2020), NF3 emissions must be reported and accounted for in all historical data. Emissions of NF3 are primarily from the chemical and electronics industries (CRF Tables 2(I)s1 and 2(I)s2). Despite its relatively high 100-year GWP of 16 100 (Myhre et al., 2013), the share of emissions from NF3 is low; the average annual contribution of NF3 to total Kyoto-GHG (AR4 GWPs) since 1990 ranges between 0.000032 % for Canada and 0.053 % for Japan (only 13 countries report NF3 emissions). Japan and the USA are the two major emitters of this gas, but NF3 emissions from Japan reduced by more than half between 2013 and 2015.
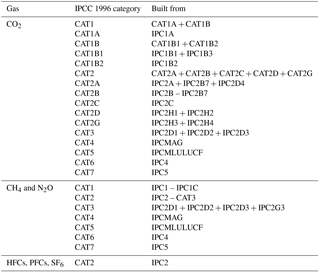
Table 2Creation of IPCC 1996 categories from IPCC 2006 categories and additional items from the CRF tables. “CAT” is used to indicate IPCC 1996 categories, and “IPC” is used for IPCC 2006 categories, both here and in the PRIMAP emissions module.
3.5 Indirect N2O and CO2 emissions
Another addition for the second commitment period of the Kyoto Protocol is that countries may now also report indirect N2O and CO2 emissions from additional sectors, whereas previously only indirect N2O from agriculture was explicitly listed in the reporting tables. Indirect emissions are greenhouse gases that result from secondary chemical reactions of precursor substances. Indirect CO2 emissions are the result of oxidation of carbon-containing non-CO2 gases, such as CH4, CO, and non-methane volatile organic compounds (NMVOC). Indirect N2O emissions have two primary sources: (1) volatilisation and subsequent atmospheric deposition of NH3 and NOx, and (2) leaching and runoff of added N to water systems, such as from the use of nitrogen fertilisers in agriculture (IPCC, 2006).
The UNFCCC COP Decision 24/CP.19 states that “29. In addition, Annex I Parties should provide information on the following precursor gases: carbon monoxide (CO), nitrogen oxides (NOx) and non-methane volatile organic compounds (NMVOCs), as well as sulphur oxides (SOx). Annex I Parties may report indirect CO2 from the atmospheric oxidation of CH4, CO and NMVOCs. Annex I Parties may report as a memo item indirect N2O emissions from other than the Agriculture and LULUCF sources. These estimates of indirect N2O should not be included in national totals. For Parties that decide to report indirect CO2 the national totals shall be presented with and without indirect CO2” (UNFCCC, 2017a).
Indirect N2O emissions from the AFOLU sector are therefore included in the national totals (category 0), but indirect emissions from other sectors are not. In PRIMAP-crf, category 0 “national total” also excludes indirect CO2 emissions. In PRIMAP-crf, national totals including indirect CO2 are included as category M0INDRCT, and separate indirect N2O and CO2 emissions are contained as categories M0N2OIND and M0CO2IND respectively.
As reporting of indirect emissions is optional, data are not available for all reporting countries. Countries currently reporting indirect N2O emissions from non-AFOLU sectors are Belarus, Bulgaria, the Czech Republic, Denmark, Finland, Italy, Norway, Romania, Sweden, Switzerland, and the United Kingdom. Countries currently reporting indirect CO2 emissions are Canada, the Czech Republic, Denmark, Finland, Japan, Latvia, the Netherlands, Portugal, and Switzerland.
Note that it is necessary to distinguish between different usages of the term “indirect emissions”. The indirect emissions referred to here are emissions resulting from subsequent reactions of GHG precursors. However, businesses, industry, and the IPCC also use indirect emissions to refer to emissions that result from the activities of that entity but that are not under their direct control (GHG Protocol, 2017). For example, a business may include the emissions associated with heating its offices as indirect emissions.
The 1996 categories are still useful for comparison and combination with older data sources. We therefore created a mapping of higher-level 2006 categories to 1996 categories to enable the use of the PRIMAP-crf dataset in such cases, especially for the forthcoming v1.2 of the PRIMAP-hist historical time-series dataset (Gütschow et al., 2016). As the new CRF tables are very similar to the old IPCC 1996 CRF tables, building the 1996 categories can be achieved by reading a few additional items from the tables. Table 2 shows which IPCC 2006 categories are used to create each IPCC 1996 category. Some additional items from the CRF tables are needed and read into “M” categories. The categorical detail is selected according to those required for the PRIMAP-hist dataset (Gütschow et al., 2016). Consequently, we create the main categories (1–7) for all gases and additionally the subcategories of categories 1 and 2 for CO2. National totals under the two sets of guidelines differ for two primary reasons: (1) the IPCC 1996 guidelines do not include all sources covered by the 2006 guidelines. At the level of detail we employ for the conversion, this only affects the carbon capture and storage (CCS) related emissions reported in the new category 1C, which are not included in 1996 categories. (2) For the creation of IPCC 1996 categories 1 and 2 we need detailed subcategories which are not reported in full detail by all countries. In other cases, emissions are not reported consistently across the different tables. This means that sometimes we cannot perfectly create the IPCC 1996 categories. Both effects are very small.
In the PRIMAP emissions module and in the published PRIMAP-crf data, we distinguish between the two sets of guidelines using separate sets of category codes. Data following the hierarchy of the IPCC 2006 guidelines have category codes prefixed with “IPC”, and data following the 1996 categories have category codes with the prefix “CAT”.
The dataset is available from the GFZ Data Services under https://doi.org/10.5880/PIK.2018.001 (Jeffery et al., 2018). When using this dataset, or one of its updates, please cite this paper and the precise version of the dataset used. Please also consider citing the original UNFCCC source (UNFCCC, 2017c) when using this dataset. The data presented in this paper were released in 2017 and include all data revisions until 15 December 2017.
New versions of the UNFCCC CRF data are released annually with an additional year of data. Some countries also submit revised versions of their data through the year. Where possible, the PRIMAP-crf data will be updated accordingly and a revised dataset released.
Data releases with an additional year of data are indicated in the naming of the data – the year of data publication is indicated by the dataset name, e.g. PRIMAP-crf 2017-v1 data include data first released by countries in 2017. Inclusion of subsequent data revisions from the same year are indicated by the version number; for example, PRIMAP-crf 2017-v2 includes all CRF2017 data published by 1 June 2018.
We provide a processed dataset of the CRF data reported to the UNFCCC in an easily used format (PRIMAP-crf) and accompanied by a detailed description of its derivation. Two key facets of the processed data are that (1) data for all reporting countries and years are readily accessed for a given gas and category, and (2) the data are categorised in a consistent hierarchy according to the IPCC 2006 guidelines. In addition, we also provide data in top-level categories under the IPCC 1996 categorisation.
PRIMAP-crf data (Jeffery et al., 2018) are provided under an open CC BY 4.0 licence and can be accessed at https://doi.org/10.5880/pik.2018.00. The data are provided in a machine-readable format (CSV) for bulk download. As such they can be used easily and flexibly and are not tied to any specific software or operating system.
Some structural issues with the current table format have been identified and country-specific issues with reported data have been highlighted.
The following items can be found in the Supplement to this paper.
PRIMAP-crf-IPCC2006-category-codes.csv. A full documentation of the IPCC category codes used in PRIMAP and their meaning. Also include the PRIMAP “M” categories used for reading CRF data and building categories.
PRIMAP-crf_2018v1.0_categories.json. This JSON file shows which CRF table was used to build each category in the IPCC 2006 hierarchy. This file also provides the basis for Fig. 1.
CRF_tables_key_ IPCC2006.xls and CRF_tables_key_ IPCC2006.csv. Similar to above, this file outlines the mapping from CRF tables to IPCC 2006 categories for the PRIMAP-crf source. The two files are identical except that the Excel version is formatted for easy reading; the CSV is unformatted.
PRIMAP-crf_figure_codes_ and_data. This folder contains the data (JSON) and code (HTML) underlying Figs. 1 and 2 of the main paper. Opening the HTML code in your browser (Firefox recommended) should enable you to explore the full hierarchy. An Internet connection is required to retrieve the D3 library.
PRIMAP_EMMOD_GWPs.xls and PRIMAP_EMMOD_GWPs.csv. These two files contain the 100-year global warming potentials of individual gases used to generate the greenhouse gas baskets in the PRIMAP-crf dataset. The Excel file contains additional information about which IPCC Report each GWP value was derived in for those gases that were not included in the earlier reports.
PRIMAP-crf-data-discrepancy-details.csv. This file contains additional data on the reported N2O and CH4 emissions for sub-categories of the LULUCF sector for Luxembourg, Liechtenstein, and Germany. Here we demonstrate the inconsistency between available sub-category data and the higher-level LULUCF category. The absolute and % differences are also provided.
The supplement related to this article is available online at: https://doi.org/10.5194/essd-10-1427-2018-supplement.
LJ wrote the manuscript with contributions from JG and RobG. LJ, JG, and RonG processed and prepared the dataset. LJ and JG maintain the PRIMAP emissions module.
The authors declare that they have no conflict of interest.
The authors acknowledge and appreciate funding by the German Federal Ministry for the Environment, Nature Conservation and Nuclear Safety (11_II_093_Global_A_SIDS_and_LDCs, 16_II_148_Global_A_Impact). We wish to thank previous members of the PRIMAP emissions module group – Claudine Chen, Malte Meinshausen, and Julia Nabel – for their development of the PRIMAP emissions module and processing earlier versions of the CRF data.
The development of this dataset and the paper made use of several open source
software tools; we acknowledge and thank the developers of colorbrewer2.org
and MacDown. The tree diagram figures were constructed based on D3 code by
Mike Bostock.
Edited by: David
Carlson
Reviewed by: four anonymous referees
GHG Protocol: Greenhouse Gas Protocol: Calculating Tools FAQs, available at: http://ghgprotocol.org/calculationg-tools-faq\#directindirect, last access: 27 September 2017
Gütschow, J., Jeffery, M. L., Gieseke, R., Gebel, R., Stevens, D., Krapp, M., and Rocha, M.: The PRIMAP-hist national historical emissions time series, Earth Syst. Sci. Data, 8, 571–603, https://doi.org/10.5194/essd-8-571-2016, 2016.
IPCC: Climate Change 1995: The Science of Climate Change. Contribution of Working Group I to the Second Assessment Report of the Intergovernmental Panel on Climate Change, edited by: Houghton, J. T., Meira Filho, L. G., Callander, B. A., Harris, N., Kattenberg, A., and Maskell, K., Cambridge University Press, Great Britain, 1996a.
IPCC: Revised 1996 IPCC Guidelines for National Greenhouse Gas Inventories (Revised Guidelines), edited by: Houghton, J. T., Meira Filho, L. G., Lim, B., Treanton, K., Mamaty, I., Bonduki, Y., Griggs, D. J., and Callender, B. A., IPCC/OECD/IEA, UK Meteorological Office, Bracknell, available at: http://www.ipcc-nggip.iges.or.jp/public/gl/invs1.html (last access: 27 September 2017), 1996b.
IPCC: 2006 IPCC Guidelines for National Greenhouse Gas Inventories, Prepared by the National Greenhouse Gas Inventories Programme, edited by: Eggleston, H. S., Buendia, L., Miwa, K., Ngara, T., and Tanabe, K., IGES, Japan, 2006.
IPCC: Climate Change 2007 – Mitigation of Climate Change: Working Group III contribution to the Fourth Assessment Report of the IPCC, Cambridge University Press, 2007.
IPCC: Revised Supplementary Methods and Good Practice Guidance Arising from the Kyoto Protocol, edited by: Hiraishi, T., Krug, T., Tanabe, K., Srivastava, N., Baasansuren, J., Fukuda, M., and Troxler, T. G., IPCC, Switzerland, available at: http://www.ipcc-nggip.iges.or.jp/public/kpsg/index.html (last access: 27 September 2017), 2013.
IPCC: Climate Change 2014: Synthesis Report, Contribution of Working Groups I, II and III to the Fifth Assessment Report of the Intergovernmental Panel on Climate Change, IPCC, Geneva, Switzerland, 2014.
Jeffery, M. L., Gütschow, J., Gieseke, R., and Gebel, R.: PRIMAP-crf: UNFCCC CRF data in IPCC categories v1.0, GFZ Data Services, https://doi.org/10.5880/pik.2018.001, 2018.
Myhre, G., Shindell, D., Bréon, F.-M., Collins, W., Fuglestvedt, J., Huang, J., Koch, D., Lamarque, J.-F., Lee, D., Mendoza, B., Nakajima, T., Robock, A., Stephens, G., Takemura, T., and Zhang, H.: Anthropogenic and Natural Radiative Forcing, in Climate Change 2013: The Physical Science Basis. Contribution of Working Group I to the Fifth Assessment Report of the Intergovernmental Panel on Climate Change, edited by: Stocker, T. F., Qin, D., Plattner, G.-K., Tignor, M., Allen, S. K., Boschung, J., Nauels, A., Xia, Y., Bex, V., and Midgley, P. M., Cambridge University Press, Cambridge, United Kingdom and New York, NY, USA, 659–740, 2013.
Nabel, J. E. M. S., Rogelj, J., Chen, C. M., Markmann, K., Gutzmann, D. J. H., and Meinshausen, M.: Decision Support for International Climate Policy – The PRIMAP Emission Module, Environ. Modell Softw., 26, 1419–1433, https://doi.org/10.1016/j.envsoft.2011.08.004, 2011.
The Mathworks Inc.: MATLAB, The Mathworks, Inc., Natick, Massachusetts, United States, 2017.
UNFCCC: United Nations Framework Convention on Climate Change, available at: https://unfccc.int/files/essential_background/background_publications_htmlpdf/application/pdf/conveng.pdf (last access: 19 June 2018), 1992.
UNFCCC: Inventory Review Reports 2016, available at: http://unfccc.int/national_reports/annex_i_ghg_inventories/inventory_ review_reports/items/9916.php (last access: 26 September 2017), 2016.
UNFCCC: FCCC/CP/2013/10/Add.3, Decision 24/CP.19 Revision of the UNFCCC reporting guidelines on annual inventories for Parties included in Annex I to the Convention (Annex I, Section II.G, Para. 29), available at: http://unfccc.int/resource/docs/2013/cop19/eng/10a03.pdf, last access: 27 September 2017a.
UNFCCC: Greenhouse Gas Inventory Data – Detailed data by Party, available at: http://di.unfccc.int/detailed_data_by_party, last access: 15 June 2017b.
UNFCCC: National Inventory Submissions 2017, available at: http://unfccc.int/national_reports/annex_i_ghg_ inventories/national_inventories_submissions/items/10116.php, last access: 27 September 2017c.
United Nations: C.N.237.2010.TREATIES-2 ADOPTION OF AMENDMENT TO ANNEX I TO THE CONVENTION IN ACCORDANCE WITH ARTICLE 16 (3) OF THE CONVENTION, available at: https://treaties.un.org/doc/Publication/CN/2010/CN.237.2010-Eng.pdf (last access: 19 June 2018), 2010.
United Nations: C.N.355.2012.TREATIES-XXVII.7 ADOPTION OF AMENDMENTS TO ANNEX I TO THE CONVENTION, available at: https://treaties.un.org/doc/Publication/CN/2012/CN.355.2012-Eng.pdf (last access: 19 June 2018), 2012a.
United Nations: C.N.718.2012.TREATIES-XXVII.7.c DOHA AMENDMENT TO THE KYOTO PROTOCOL DOHA, 8 DECEMBER 2012 ADOPTION OF AMENDMENT TO THE PROTOCOL, available at: https://treaties.un.org/doc/Treaties/2012/12/20121217 11-40 AM/CN.718.2012.pdf (last access: 19 June 2018), 2012b.
basketsof gases using global warming equivalency metrics from IPCC reports.